Using CryptoViz
43 |CryptoViz is a tool that allows you to visualize the orderbook for all the cryptocurrencies traded on the Poloniex exchange.
44 | 45 |What am I looking at?
46 |CryptoViz provides you a Depth-of-Market (DOM) view into the market. It allows you to see where buy and sell orders lie, how large they are, and when they get removed/filled. This enables you to clearly see things such as buy and sell walls, large orders sweeping the book, and support/resistance levels where large amounts of volume are traded.
47 | 48 |The Limit Orderbook
49 |A core concept of modern financial exchanges is the limit order book. It contains pending buy and sell orders from all market participants. Orders that provide the best price (buyers willing to pay the most and sellers willing to take the least) are said to be at the "top" of the book. It's these orders that are filled first by market trades.
50 | 51 |CryptoViz allows you to see deep into the book and provides a dynamic view of where traders are willing to enter and exit the market. It shows how these regions shift and change over time as well as highlights market events such as large block buys and sells. This data can give you insights into the way other market participants are interacting with the market.
52 | 53 |Price Bands
54 |The price bands are the horizontal lines spanning the visualization. Each band is a collection of the total amount of orders between two different price levels. They are scaled in color according to how much volume is on the book at that level. To see what prices a band contains, hover over it with your mouse and look in the top right of the visualization.
55 |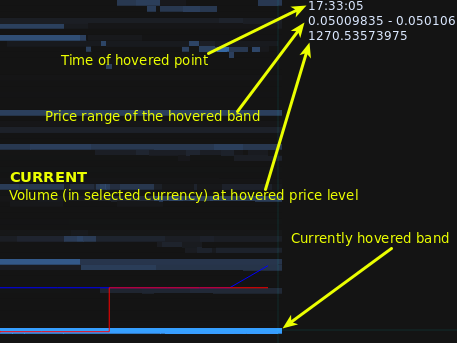
Trade Lines and Indicators
58 |The red and blue lines and circles indicate trades that took place. Red means that an existing buy order was filled and blue means that an existing sell order was filled. The size of the circle corresponds to the amount of volume that was traded. The lines connect trades of the same type, showing how the price people trade at changes over time.
59 |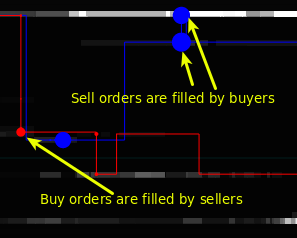
Zooming
62 |By default, the visualization zooms to an optimal level to show the most critical price levels. To zoom in on a certain area, simply drag and select a rectangle on the visualization. This will zoom into the selected region. Click the "Reset Zoom" button to restore the view to default.
63 | 64 |Interpreting the Data
65 |Using this tool, it's possible to draw conclusions about the behaviour of other traders in the market. There are certain patterns that identify different trading actions and can give you clues about what the market may do in the future.
66 | 67 |Buy/Sell Walls
68 |When large blocks of buy or sell orders are grouped together at a price level, they can often act as support or resistance that the price bounces off of. If the price approaches one of these walls and there is insufficient momentum to break through it, the price often drifts back in the direction it came from. However, if there is sufficient momentum to fill the orders that make up the wall, it is common for prices to continue to move on through to new levels. As shown in the image below, large buy orders are filled which break the walls and drive the price lower.
69 |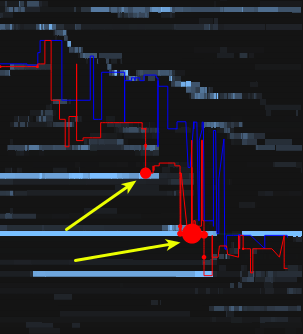
Descending/Ascending Price Levels
72 |When traders (or trading robots) compete with each other to have the best price for their orders and so be filled first, it's common to see areas where the spread grows smaller as orders are cancelled and re-entered at a better price to undercut other traders. This can be an indicator of a desire for traders to enter or exit the market and influence the price in the process.
73 |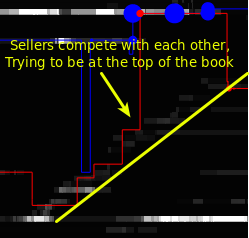
It's important to keep in mind that all of these patterns can be invalidated by one large set of orders. These aren't as much indicators as they are hints at the mood of the market participants. Although they can be useful in determining market sentiment, careful consideration should be taken before trading using them.
76 | 77 |Disclaimer
78 |This tool is not designed to be a trading strategy or to provide any trading advice or recommendations. Due to the nature of cryptocurrencies and trading in general, markets are very volatile and difficult to predict. No data displayed by the visualization, written on this page, or relayed in any other manner through this tool should be construed as trading advice. CryptoViz and CryptoViz's creators do not guarantee the accuracy, timeliness, or precision of the data it displays. We provide no warranty, make no promises, and only want to provide a tool you may find useful in understanding the cryptocurrency markets better. If you have any questions about these terms or the tool, please contact me at me@ameo.link.
79 | 80 |All data used in this visualization comes from the Poloniex exchange. We do not make use of any data not publicly provided on the Poloniex website and do not claim to provide any advantage not available elsewhere. I'd like to express a big thank-you to them for making their data freely available for things like this tool.
81 |