├── Breakpoints.gif
├── CHANGELOG.md
├── LogPoints.gif
├── README.md
├── Setup and config Edited.gif
├── inlinevars.png
└── walkthrough
├── PROGRAMNAME.PNG
├── app-icon.png
├── applid.PNG
├── breakpoints.PNG
├── connection.PNG
├── fetchextended.PNG
├── launchjson.PNG
├── password.PNG
├── split.PNG
└── startdebug.PNG
/Breakpoints.gif:
--------------------------------------------------------------------------------
https://raw.githubusercontent.com/BroadcomMFD/debugger-for-mainframe/5a584aed31d77f353eec4fa5878398184c1a0d82/Breakpoints.gif
--------------------------------------------------------------------------------
/CHANGELOG.md:
--------------------------------------------------------------------------------
1 | # Debugger for Mainframe Changelog
2 |
3 | All notable changes to the Debugger for Mainframe extension are documented in this file.
4 |
5 | ## [1.13.0] 2025-05-16
6 |
7 | #### Added
8 | - Support for passphrases and case-sensitive passwords
9 | - Support for Single Sign-On using a Zowe Explorer profile
10 | - Option to store security certificate in the native OS certificate store
11 | - Configuration snippets for the InterTest basic demo sessions
12 |
13 | #### Changed
14 | - Batch link queue now runs in the background until a session becomes available
15 | - New PTFs added to prerequisites
16 | - Readme update
17 |
18 | #### Fixed
19 | - Disabling breakpoints
20 | - Fetch Extended Sources now works for attach configurations
21 |
22 | ## [1.12.0] 2024-12-17
23 |
24 | #### Added
25 | - Symbolic selection list provided in case of Symbolic mismatch.
26 | - Fetch Extended Sources provides list of available Symbolics for the program.
27 |
28 | #### Changed
29 | - Readme update
30 |
31 | #### Fixed
32 | - Miscellaneous bug fixes
33 |
34 | ## [1.11.1] 2024-09-16
35 |
36 | #### Changed
37 | - InterTest PTF LU14606 added to prerequisites
38 |
39 | #### Fixed
40 | - Attach Configuration for batch using wrong flag for Symbolics.
41 | - Watch variable with Java version newer than 11.
42 | - Resume debugging doesn't stop on breakpoint in the sub program for attach configuration.
43 |
44 | ## [1.11.0] 2024-08-27
45 |
46 | #### Added
47 | - Inline variables view
48 | - Support for dynamic debugging sessions for batch programs
49 | - Composite debugging, includes 'List composites' command in command palette
50 | - Autokeep variables (COBOL only), represented in Local variables group
51 | - CICS Defined Variables (COBOL only)
52 |
53 | #### Changed
54 | - InterTest PTFs LU13684 and LU14009 added to prerequisites
55 | - Variables tree organised into Global, Local, CICS-Defined and Assembly General Purpose groups.
56 | - Execution counts displayed left from source
57 | - Readme update
58 |
59 | #### Fixed
60 | - Miscellaneous bug fixes
61 |
62 | ## [1.10.0] 2024-05-02
63 |
64 | #### Added
65 | - Dynamic Symbolic Support
66 | - Set variable value in hexadecimal format
67 | - Variable filtering
68 | - Link to the Zowe Explorer jobs tree on running a batch debug session
69 |
70 | #### Changed
71 | - Readme update
72 |
73 | #### Fixed
74 | - Miscellaneous bug fixes
75 |
76 | ## [1.9.2] 2024-04-12
77 |
78 | #### Fixed
79 | - Set variable value in High-Level Assembler
80 |
81 | ## [1.9.1] 2024-04-10
82 |
83 | #### Fixed
84 | - Update FD and linkage storage defined variables values
85 |
86 | ## [1.9.0] 2023-12-01
87 |
88 | #### Added
89 | - Option to connect to InterTest via the API Mediation Layer
90 | - Support for table variables
91 | - Support for data breakpoints
92 |
93 | #### Changed
94 | - Launch.json parameters `interTestHost` and `interTestPort` changed to `host` and `port`
95 | - Readme update
96 |
97 | ## [1.8.1] 2023-06-29
98 |
99 | #### Changed
100 | - Readme update
101 | - IMS fields accept wildcard character '*'
102 | - Fetch extended sources not allowed for 'attach' configurations
103 |
104 | #### Fixed
105 | - IMS transaction connection with wrong transaction name
106 | - Attach session with automatic breakpoint on first line
107 | - Expected breakpoint behavior on attach session
108 |
109 | ## [1.8.0] 2023-06-05
110 |
111 | #### Added
112 | - Batch Link support
113 | - Batch attach debug configuration
114 | - Support for the Suspend feature on Batch sessions
115 | - Full support for the Step into and Step out functions
116 | - DB2 stored procedure and IMS DC application support
117 | - Basic batch demo walkthrough
118 |
119 | #### Changed
120 | - Readme update
121 |
122 | ## [1.7.0] 2023-01-13
123 |
124 | #### Added
125 | - High-Level Assembler Language support
126 | - Full support for conditional breakpoints (validator currently not supported on VS Code version 1.74)
127 | - Support for label breakpoints in Assembler code
128 | - Getting Started with CICS Debugging walkthrough
129 |
130 | #### Changed
131 | - Variable enhancements
132 | - Readme update
133 |
134 | ## [1.6.1] 2022-10-26
135 |
136 | #### Changed
137 | - Readme update
138 |
139 | #### Fixed
140 | - Issue with insufficient websocket buffer
141 | - Compatibility with extensions which contribute languages
142 |
143 | ## [1.6.0] 2022-06-30
144 |
145 | #### Added
146 | - Execution counts feature
147 |
148 | #### Changed
149 | - Readme update
150 |
151 | ## [1.5.4] 2022-06-07
152 |
153 | #### Fixed
154 | - Issue when using multiple PROTSYMs
155 | - Notify user when unsupported debug action is used
156 |
157 | ## [1.5.3] 2022-05-17
158 |
159 | #### Changed
160 | - Readme update
161 |
162 | ## [1.5.2] 2022-05-16
163 |
164 | #### Changed
165 | - Readme update
166 |
167 | #### Fixed
168 | - Support for Java 17
169 | - Minor bugfixes
170 |
171 | ## [1.5.1] 2021-09-17
172 |
173 | #### Fixed
174 | - Breakpoints in COBOL programs now work in other environments.
175 |
176 | ## [1.5.0] 2021-04-08
177 |
178 | #### Added
179 | - Statement trace and call trace features
180 |
181 | #### Changed
182 | - Readme update
183 |
184 | ## [1.4.0] 2020-12-18
185 |
186 | #### Added
187 | - Paragraph breakpoints feature
188 | - Support for multiple-user sessions in CICS
189 |
190 | #### Changed
191 | - Readme update
192 |
193 | ## [1.3.1] 2020-11-04
194 |
195 | #### Changed
196 | - Changelog update
197 |
198 | ## [1.3.0] 2020-10-22
199 |
200 | #### Added
201 | - Support for debugging nested programs within programs
202 | - Support for the variable watch functionality
203 |
204 | #### Changed
205 | - Variables are now read by package instead of individually
206 | - Readme update
207 |
208 | ## [1.2.0] 2020-08-20
209 |
210 | #### Added
211 | - Support for Batch debugging using CA InterTest Batch
212 | - Conversion of JCL to be used for Batch debugging
213 | - Support for non-UTF8 charsets
214 | - Holistic logging
215 |
216 | #### Fixed
217 | - Dropdown list to choose a configuration no longer displays the same configuration twice.
218 |
219 | #### Changed
220 | - Readme update
221 |
222 | ## [1.1.0] - 2020-04-20
223 |
224 | #### Added
225 | - Support for conditional breakpoints
226 | - Support for logpoints
227 | - Support for hitcounts
228 |
229 | #### Fixed
230 | - Fixed several minor issues
231 |
232 | #### Changed
233 | - The "type" parameter in launch.json now requires the value "intertest-cics". When upgrading to this version of Debugger for Mainframe from an older version, ensure that you update the "type" parameter in your launch.json files.
234 | - Readme update
235 |
236 | ## [1.0.2] - 2020-02-14
237 |
238 | - Support same name variables
239 | - Fix debugging with lowercase username
240 | - Fix lowercase username failed fetch
241 |
242 | ## [1.0.1] - 2020-01-24
243 |
244 | - Minor readme and package.json changes
245 |
246 | ## [1.0.0] - 2019-12-10
247 |
248 | - Initial release
249 |
--------------------------------------------------------------------------------
/LogPoints.gif:
--------------------------------------------------------------------------------
https://raw.githubusercontent.com/BroadcomMFD/debugger-for-mainframe/5a584aed31d77f353eec4fa5878398184c1a0d82/LogPoints.gif
--------------------------------------------------------------------------------
/README.md:
--------------------------------------------------------------------------------
1 |
6 |
7 | # Debugger for Mainframe
8 |
9 | Debugger for Mainframe provides a debugging interface for [InterTest™ for CICS](https://www.broadcom.com/products/mainframe/devops-app-development/testing-quality/intertest-cics) and [InterTest™ Batch](https://www.broadcom.com/products/mainframe/testing-and-quality/intertest-batch). This extension provides a modern debugging experience for CICS and Batch programs written in COBOL and High-Level Assembler Language (HLASM).
10 |
11 | Debugger for Mainframe is part of [Code4z](https://techdocs.broadcom.com/code4z), an all-round VS Code extension package that offers a modern experience for mainframe application developers, including tools for language support, data editing, testing, and source code management. For an interactive overview of Code4z, see the [Code4z Developer Cockpit](https://mainframe.broadcom.com/code4z-developer-cockpit).
12 |
13 | - [Prerequisites](#prerequisites)
14 | - [Set Up Secure Connection](#set-up-secure-connection)
15 | - [Getting Started](#getting-started)
16 | - [Debugging](#debugging)
17 | - [Breakpoints](#breakpoints)
18 | - [Variables](#variables)
19 | - [Call Trace and Statement Trace](#call-trace-and-statement-trace)
20 | - [Integrate with Zowe Explorer](#integrate-with-zowe-explorer)
21 | - [Troubleshooting](#troubleshooting)
22 | - [Report Issues](#report-issues)
23 | - [Technical Assistance and Support for Debugger for Mainframe](#technical-assistance-and-support-for-debugger-for-mainframe)
24 | - [Privacy Notice](#privacy-notice)
25 |
26 | ## Prerequisites
27 |
28 | Before you use Debugger for Mainframe, ensure that your site and workstation meet the following requirements:
29 |
30 | ### Server
31 | - InterTest for CICS and/or InterTest Batch, incremental release 11.0.07 or higher.
32 | - Acquire and install Level Set PTF 11.0.02 (LU15115) and PTFs LU14897, LU15349, LU15858, LU15993, LU15994, LU15995, LU15996 and LU16858. We recommend that you remain current on maintenance for InterTest.
33 | - Configure the Testing Tools Server.
34 | - To use Debugger for Mainframe to debug CICS programs, configure CICS IRC and one of TCP or CAICCI.
35 | - To connect to Debugger for Mainframe via the Zowe API Mediation Layer, integrate your Testing Tools Server instance with Zowe API ML.
36 |
37 | For information on PTF releases, the Testing Tools Server and API Mediation Layer, see the [InterTest documentation](http://techdocs.broadcom.com/itsd). To browse PTFs, see [Broadcom Support](https://ftpdocs.broadcom.com/WebInterface/phpdocs/0/MSPSaccount/COMPAT/AllProducts.HTML).
38 |
39 | ### Client
40 | - Visual Studio Code version 1.67.0 and above, or Github Codespaces.
41 | - Java version 8.0 or higher with the PATH variable correctly configured.
42 |
43 | ## Set Up Secure Connection
44 | You can use Debugger for Mainframe over a secure connection if your Testing Tools Server instance is configured for a secure connection.
45 |
46 | To use Debugger for Mainframe over a secure connection, obtain the server certificate for your Testing Tools Server instance and import it to a certificate store. You can use a Java trust store or a trust store in your operating system.
47 |
48 | ### Import Server Certificate to Java Trust Store
49 |
50 | We recommend that you import the certificate to the store of the JRE under which the Debugger for Mainframe DA client is running on your local machine. You can use the command line or a UI tool.
51 |
52 | #### Import Certificate using Command Line
53 |
54 | Enter the following command: `sudo keytool -import -alias hostname -file hostname.cer -storetype JKS -keystore cacerts`
55 |
56 | #### Import Certificate on a Linux Subsystem
57 |
58 | 1. To verify that Java is installed, run the command `java -version`.
59 | 2. Locate your subsystem's java installation.
60 | 3. Go to **/lib/security** to find **cacerts**.
61 | 4. Run the following command to import the certificate: `sudo keytool -import -alias hostname -file hostname.cer -storetype JKS -keystore cacerts`
62 |
63 | #### Import Certificate using a UI Tool
64 |
65 | 1. In your preferred UI, locate and open **cacerts**.
66 | 2. Import the certificate to cacerts.
67 | 3. Name the certificate with an appropriate alias to ensure it is easily identified.
68 | 4. Save your changes.
69 |
70 | ### Specify Location of Certificate in OS Trust Store
71 |
72 | You can also import the certificate to a certificate store in your operating system and specify the location in the extension settings.
73 |
74 | 1. Select **File** - **Preferences** - **Settings**.
75 | The Settings menu opens.
76 | 2. Open the **Extensions** submenu and locate **Debugger for Mainframe**.
77 | 3. Do one of the following:
78 | * On Windows, change **Native Certificate Store for Windows** to **Windows-ROOT**.
79 | * On Mac OS, fill out the following fields:
80 | * **Native Certificate Store for Mac OS > Trust Store Type**
81 | * Specifies the certificate store type.
82 | * Example: keychainStore.
83 | * **Native Certificate Store for Mac OS > Trust Store**
84 | * Specifies the path to the certificate store.
85 | * Example: /Library/Keychains/System.keychain
86 |
87 | ### Verify Security Configuration
88 |
89 | After you have imported your certificate, run a test debug session with **"interTestSecure": true** in your launch.json file. If the session fails, ensure that you imported the correct certificate to the correct JRE trust store and try again.
90 |
91 | You have configured Debugger for Mainframe to use a secure connection to InterTest.
92 |
93 | ## Getting Started
94 |
95 | Debugger for Mainframe includes two VS Code walkthroughs which guide you through the basic COBOL demo sessions which are shipped with InterTest for CICS and InterTest Batch. To access the walkthroughs, select **Welcome** from the **Help** menu, click **More...** under **Walkthroughs**, and select either **Basic CICS Demo Session** or **Basic Batch Demo Session**.
96 |
97 | For full instructions on how to run the debugging demo sessions, see the [Code4z documentation](https://techdocs.broadcom.com/code4z).
98 |
99 | ### Run Your First Debug Session
100 |
101 | To start debugging programs in your IDE, you first create a `launch.json` file within your workspace.
102 |
103 | 1. Select the Explorer icon in your IDE and open a folder.
104 | - The workspace opens.
105 |
106 | 2. Select the Bug icon to open **Debug view**.
107 |
108 | 3. In the sidebar, click **create a launch.json file**.
109 | A list of configurations displays.
110 |
111 | 4. Select either **Debugger for Mainframe: INTERTEST™ FOR CICS** or **Debugger for Mainframe: INTERTEST™ BATCH**
112 |
113 | 5. Fill in the necessary fields as described in the **[Add Configuration](#add-configuration)** section below.
114 |
115 | 6. Run the debug session as described in the **[Run a Debug Session](#run-a-debug-session)** section below.
116 |
117 | ## Debugging
118 |
119 | To debug CICS and Batch programs with Debugger for Mainframe you open the workspace in your IDE and configure your connection to InterTest using the file `launch.json`.
120 |
121 | Debugged files are temporarily saved in the workspace within the ```/.c4z/.extsrcs``` folder.
122 |
123 | To debug Batch programs, you also convert the JCL of your program into a new file which is used for debugging.
124 |
125 | 
126 |
127 | ### Add Configuration
128 |
129 | The `launch.json` file contains configurations for debugging different types of programs. The configurations supported by Debugger for Mainframe are:
130 | * **Debugger for Mainframe: INTERTEST™ FOR CICS**
131 | Basic configuration for CICS programs.
132 | * **Debugger for Mainframe: INTERTEST™ BATCH**
133 | Basic configuration for Batch programs.
134 | * **Debugger for Mainframe: INTERTEST™ BATCH - Attach**
135 | Configuration to attach Batch programs to the Batch Link Queue.
136 |
137 | When you create a `launch.json` file for the first time, a configuration is added. Click the **Add configuration** button in the configuration drop-down list to add further configurations.
138 |
139 | #### Basic CICS Configuration
140 |
141 | To add a basic configuration to debug a CICS application, add a **Debugger for Mainframe: INTERTEST™ FOR CICS** configuration and populate the following fields:
142 |
143 | - **"type":** (string)
144 | - Specify "intertest-cics".
145 | - **"request":** (string)
146 | - Specify "launch".
147 | - **"name":** (string)
148 | - Specifies the name of the debugging session.
149 | - **"programName"**: (array)
150 | - Specifies the name of the program that you want to debug using this configuration. To debug a program along with other programs called within it, specify all program names you want to debug in this field.
151 | - To debug a program that is part of a composite module, use the format MODULE_PROGRAM. To debug all programs in a composite module, specify MODULE_.
152 | - **Tip**: To see the list of all programs in a composite module, add the module to this field, and run the pallet command **List Composites**. The list of programs displays in the Output Panel.
153 | - Specify an array with either one value or up to 30 values separated by commas.
154 | - **"host"**: (string)
155 | - Specifies the host address of your Testing Tools Server instance or Zowe API Mediation Layer Gateway. Do not include this field if you use the Zowe API ML Single Sign-On feature.
156 | - **"port"**: (integer)
157 | - Specifies the port number of your Testing Tools Server instance or Zowe API Mediation Layer Gateway. Do not include this field if you use the Zowe API ML Single Sign-On feature.
158 | - **"interTestUserName"**: (string)
159 | - Specifies your mainframe username. Do not include this field if you use the Zowe API ML Single Sign-On feature.
160 | - **"apimlProfile"**: (string)
161 | - Specifies the name of a Zowe Explorer profile that contains mainframe credentials and the host and port of your Zowe API Mediation Layer Gateway. Specify this field to use the Zowe API ML Single Sign-On feature.
162 | - **"path"**: (string)
163 | - (API Mediation Layer only) Specifies your Zowe API Mediation Layer Service ID. Do not include this field if you connect through a Testing Tools Server instance.
164 | - **"interTestSecure"**: (boolean)
165 | - Specify "true" to use a secure connection to the InterTest server or "false" to use a non-secure connection.
166 | Ensure that you complete the steps in the **[Set Up Secure Connection](#set-up-secure-connection)** section if you want to use a secure connection.
167 | - **"cicsApplId"**: (string)
168 | - Specifies the CICS Application ID (cicsApplID) of your CICS region.
169 | - **"cicsUserId"**: (string)
170 | - (Optional) Specify a CICS user logon ID to debug a CICS program or transaction as it executes for that specific ID. You cannot modify this value during an active debugging session.
171 | - **"interTestCharset"**: (string)
172 | - (Optional) Specifies the Testing Tools Server Charset for Listings. Specify this field only if your Testing Tools Server instance is configured to use a client code page other than UTF-8.
173 | - **"paragraphBreakpoints"**: (boolean)
174 | - (Optional) Specify "true" to have the debugging session stop automatically at each new paragraph or label. For more information, see [Paragraph Breakpoints](#paragraph-breakpoints).
175 | - **"callTrace"**: (boolean)
176 | - (Optional) Specify "false" to disable the call trace feature. The feature is enabled by default. For more information, see [Call Trace and Statement Trace](#call-trace-and-statement-trace).
177 | - **"statementTrace"**: (boolean)
178 | - (Optional) Specify "false" to disable the statement trace feature. The feature is enabled by default. For more information, see [Call Trace and Statement Trace](#call-trace-and-statement-trace).
179 | - **Note**: If you disable this parameter, the "step out" and "step over" functions of the debug toolbar are also disabled.
180 | - **"variableOrder"**: (string)
181 | - (Optional) Specify "alphabetical" to sort the variables that are defined in your program in alphabetical order in the variables view. Specify "definition" to sort the variables in the order of their definition in the program. The default setting is "definition".
182 |
183 | #### Basic Batch Configuration
184 |
185 | To add a basic configuration to debug a batch application, add a **Debugger for Mainframe: INTERTEST™ BATCH** configuration and populate the following fields:
186 |
187 | - **"type":** (string)
188 | - Specify "intertest-batch".
189 | - **"request":** (string)
190 | - Specify "launch".
191 | - **"name":** (string)
192 | - Specifies the name of the debugging session.
193 | - **"programName"**: (array)
194 | - Specifies the name of the program that you want to debug using this configuration. To debug a program along with other programs called within it, specify all program names you want to debug in this field.
195 | - Specify an array with either one value or up to 30 values separated by commas.
196 | - **"protsym"**: (array)
197 | - Specify an array with up to 8 PROTSYM DSNs separated by commas.
198 | - **DSS**: (string)
199 | - (Optional) Specify the PROTSYM which is designated to receive dynamic symbolic data from Endevor. For more information, see **[Dynamic Symbolic Support](#dynamic-symbolic-support)**.
200 | - **Note**: The DSS PROTSYM counts towards the maximum of 8 PROTSYMs per configuration. If you specify this parameter, the maximum allowed number of PROTSYMs in the **"protsym"** array is reduced to 7.
201 | - **"host"**: (string)
202 | - Specifies the host address of your Testing Tools Server instance or Zowe API Mediation Layer Gateway. Do not include this field if you use the Zowe API ML Single Sign-On feature.
203 | - **"port"**: (integer)
204 | - Specifies the port number of your Testing Tools Server instance or Zowe API Mediation Layer Gateway. Do not include this field if you use the Zowe API ML Single Sign-On feature.
205 | - **"interTestUserName"**: (string)
206 | - Specifies your mainframe username. Do not include this field if you use the Zowe API ML Single Sign-On feature.
207 | - **"apimlProfile"**: (string)
208 | - Specifies the name of a Zowe Explorer profile that contains mainframe credentials and the host and port of your Zowe API Mediation Layer Gateway. Specify this field to use the Zowe API ML Single Sign-On feature.
209 | - **"path"**: (string)
210 | - (API Mediation Layer only) Specifies your Zowe API Mediation Layer Service ID. Do not include this field if you connect through a Testing Tools Server instance.
211 | - **"interTestSecure"**: (boolean)
212 | - Specify "true" to use a secure connection to the InterTest server or "false" to use a non-secure connection.
213 | Ensure that you complete the steps in the **[Set Up a Secure Connection](#set-up-secure-connection)** section if you want to use a secure connection.
214 | - **"originalJCL"**: (JSON)
215 | - (Optional) Specify this parameter if you want Debugger for Mainframe to convert the JCL of your program for debugging.
216 | This is a JSON element containing the following fields:
217 | - **"inDSN"**: (string)
218 | - Specifies the DSN and member name of the JCL containing the program that you want to debug.
219 | - **"stepName"**: (string)
220 | - Specifies the step name of the program that you want to debug.
221 | - **"procLibs"**: (array)
222 | - (Optional) Specify an array with any number of DSNs containing procedure libraries. Specify this field if your JCL requires a procedure library to be converted.
223 | - **"convertedJCL"**: (string)
224 | - Specifies the DSN and member name where you want to store your converted JCL. Specify the full name of a partitioned data set and a member in the format DSN(MEMBER). Debugger for Mainframe creates or overwrites this member when you convert the JCL.
225 | - **"symbols"**: (JSON)
226 | - (Optional) Specify values for any number of variables in the converted JCL. Use the format `"PARAM": "VALUE"` and separate each entry by commas within this JSON element.
227 | - The value on the right side of each entry can use input variables. For more information, see the [VS Code documentation](https://code.visualstudio.com/docs/editor/variables-reference#_input-variables).
228 | - **"interTestCharset"**: (string)
229 | - (Optional) Specifies the Testing Tools Server Charset for Listings. Specify this field only if your Testing Tools Server instance is configured to use a client code page other than UTF-8.
230 | - **"paragraphBreakpoints"**: (boolean)
231 | - (Optional) Specify "true" to have the debugging session stop automatically at each new paragraph or label. For more information, see [Paragraph Breakpoints](#paragraph-breakpoints).
232 | - **"statementTrace"**: (boolean)
233 | - (Optional) Specify "false" to disable the statement trace feature. The feature is enabled by default. For more information, see [Call Trace and Statement Trace](#call-trace-and-statement-trace).
234 | - **"executionCounts"**: (boolean)
235 | - (Optional) Specify "true" to enable the execution counts feature. The feature is disabled by default. For more information, see [Execution Counts](#execution-counts).
236 | - **"variableOrder"**: (string)
237 | - (Optional) Specify "alphabetical" to sort the variables that are defined in your program in alphabetical order in the variables view. Specify "definition" to sort the variables in the order of their definition in the program. The default setting is "definition".
238 | - **"zoweProfileName"**: (string)
239 | - (Optional) Specify the name of a Zowe profile to enable job status messages when you run your debugging session.
240 |
241 | #### Enable the Batch Link Queue
242 |
243 | Enable the Batch Link Queue to add the Suspend and Attach functionalities to your Batch debugging experience. These functionalities allow you to suspend and later resume a debugging session, for example:
244 |
245 | * To run two debugging sessions simultaneously and switch between them.
246 | * To start a debugging session on InterTest Batch and resume it on Debugger for Mainframe.
247 |
248 | To enable the Batch Link Queue, add a **Debugger for Mainframe: INTERTEST™ FOR BATCH - Attach** configuration to your existing `launch.json` file, which must already contain at least one `intertest-batch` configuration. Populate the following fields:
249 |
250 | - **"type":** (string)
251 | - Specify "intertest-batch".
252 | - **"request":** (string)
253 | - Specify "attach".
254 | - **"name":** (string)
255 | - Specifies the name of the debugging session.
256 | - **"programName"**: (array)
257 | - (Optional) Specifies the name of the program that you want to debug using this configuration. To debug a program along with other programs called within it, specify all program names you want to debug in this field.
258 | - Specify an array with either one value or up to 30 values separated by commas.
259 | - **"protsym"**: (array)
260 | - (Optional) Specify an array with up to 8 PROTSYM DSNs separated by commas.
261 | - **DSS**: (string)
262 | - (Optional) Specify the PROTSYM which is designated to receive dynamic symbolic data from Endevor. For more information, see **[Dynamic Symbolic Support](#dynamic-symbolic-support)**.
263 | - **Note**: The DSS PROTSYM counts towards the maximum of 8 PROTSYMs per configuration. If you specify this parameter, the maximum allowed number of PROTSYMs in the **"protsym"** array is reduced to 7.
264 | - **"host"**: (string)
265 | - Specifies the host address of your Testing Tools Server instance or Zowe API Mediation Layer Gateway. Do not include this field if you use the Zowe API ML Single Sign-On feature.
266 | - **"port"**: (integer)
267 | - Specifies the port number of your Testing Tools Server instance or Zowe API Mediation Layer Gateway. Do not include this field if you use the Zowe API ML Single Sign-On feature.
268 | - **"interTestUserName"**: (string)
269 | - Specifies your mainframe username. Do not include this field if you use the Zowe API ML Single Sign-On feature.
270 | - **"apimlProfile"**: (string)
271 | - Specifies the name of a Zowe Explorer profile that contains mainframe credentials and the host and port of your Zowe API Mediation Layer Gateway. Specify this field to use the Zowe API ML Single Sign-On feature.
272 | - **"path"**: (string)
273 | - (API Mediation Layer only) Specifies your Zowe API Mediation Layer Service ID. Do not include this field if you connect through a Testing Tools Server instance.
274 | - **"interTestSecure"**: (boolean)
275 | - Specify "true" to use a secure connection to the InterTest server or "false" to use a non-secure connection.
276 | Ensure that you complete the steps in the **[Set Up a Secure Connection](#set-up-secure-connection)** section if you want to use a secure connection.
277 | - **"interTestCharset"**: (string)
278 | - (Optional) Specifies the Testing Tools Server Charset for Listings. Specify this field only if your Testing Tools Server instance is configured to use a client code page other than UTF-8.
279 | - **"paragraphBreakpoints"**: (boolean)
280 | - (Optional) Specify "true" to have the debugging session stop automatically at each new paragraph or label. For more information, see [Paragraph Breakpoints](#paragraph-breakpoints).
281 | - **"statementTrace"**: (boolean)
282 | - (Optional) Specify "false" to disable the statement trace feature. The feature is enabled by default. For more information, see [Call Trace and Statement Trace](#call-trace-and-statement-trace).
283 | - **"executionCounts"**: (boolean)
284 | - (Optional) Specify "true" to enable the execution counts feature. The feature is disabled by default. For more information, see [Execution Counts](#execution-counts).
285 | - **"variableOrder"**: (string)
286 | - (Optional) Specify "alphabetical" to sort the variables that are defined in your program in alphabetical order in the variables view. Specify "definition" to sort the variables in the order of their definition in the program. The default setting is "definition".
287 |
288 | ### Dynamic Symbolic Support
289 |
290 | If you have integrated InterTest with Endevor on the backend, you can activate the dynamic symbolic support feature to dynamically load symbolic data into a PROTSYM. To enable dynamic symbolic support, specify a PROTSYM in the **"DSS"** parameter of a batch `launch` or `attach` configuration. This PROTSYM is searched along with the other PROTSYMs that you specify in the **"protsym"** array.
291 |
292 | For more information about dynamic symbolic support, see the [InterTest and SymDump documentation](https://techdocs.broadcom.com/itsd).
293 |
294 | ### Run a Debug Session
295 |
296 | After you define your configuration in `launch.json`, you can run your debug session in the debugging interface.
297 |
298 | 1. Open the **Run and Debug** panel.
299 |
300 | 2. (Batch only, optional) To convert your JCL, press **F1** to open the command pallet and run the command **Batch: Convert JCL**. Complete this step when debugging a program for the first time, or if your program changed since the last debug session.
301 |
302 | 3. Press **F1** to open the command pallet and run the command **Fetch Extended Sources**.
303 |
304 | 4. If you have more than one Debugger for Mainframe configuration defined in `launch.json`, a list of available configurations displays. Select the name of the configuration that you want to use to fetch your source.
305 |
306 | 5. If more than one listing is found in the CICS regions or PROTSYMs specified in your configuration, or if no exact matching listing is found, a list of listings displays. Select the listing that you want to load.
307 |
308 | 6. Enter your mainframe password if prompted.
309 | - The expanded source is displayed.
310 |
311 | 7. Set breakpoints and logpoints as required. You can set breakpoints and logpoints before you start the debugging process or as the process is running.
312 |
313 | - For more information, see **[Breakpoints](#breakpoints)**
314 |
315 | 8. Click the play icon in the top left of the interface to start the debugging process.
316 |
317 | 9. (CICS only) Run your program in your CICS region.
318 |
319 | You have successfully initiated a debugging session.
320 |
321 | - Once the session is running, the debugging session stops at each breakpoint, or if an abend occurs.
322 | - You can use the **Continue**, **Step over**, **Step into** and **Step out** functions of the IDE Debug Toolbar. The **Restart** function is not supported.
323 | - To use the **Step over** and **Step out** functions during a CICS session, ensure that you enable statement trace in your `launch.json` file.
324 | - Use the **Stop** button to terminate the debugging session. If you have a Batch Link Queue (`attach`) configuration in your `launch.json` file, you can use the drop-down arrow to switch between the **Stop** and the **Suspend** buttons. Use the **Suspend** button to temporarily terminate a debug session and add it to the Batch Link Queue, from which you can resume it later.
325 | - If you specified a Zowe profile name in the `zoweProfileName` field of `launch.json`, a message with a batch job ID appears when the session completes. Click the job ID to open information about the job in Zowe Explorer.
326 |
327 | ### Run a Debug Session From the Batch Link Queue
328 |
329 | To run a debug session from the Batch Link Queue, ensure that you have an `attach` configuration in your `launch.json` file (see [Enable the Batch Link Queue](#enable-the-batch-link-queue) for more information.)
330 |
331 | 1. Select an `attach` configuration from the list of configurations on the Run and Debug panel.
332 | 2. Enter your mainframe password if prompted.
333 | The batch link queue opens.
334 | 3. Select the session that you want to resume from the drop-down list
335 | The listing is downloaded and the debugging session starts.
336 |
337 | When you run a debug session using an `attach` configuration, the **Suspend** button is shown by default in the Debug Toolbar. Use the drop-down arrow to switch to the **Stop** button.
338 |
339 | When you suspend a debug session, breakpoints that you define in Visual Studio Code are saved with the session. If you load a debug session from the Batch Link Queue that has breakpoints saved, these breakpoints override ones that are defined locally on the same lines.
340 |
341 | ### Manage the Batch Link Schedule Table
342 |
343 | You can use Debugger for Mainframe to manage the Batch Link Schedule Table, which enables you to debug DB2 Stored Procedures and IMS DC applications.
344 |
345 | To manage your Batch Link Scheduling Table, ensure that you have a batch `launch` or `attach` configuration that contains a server address and username, either directly or in a Zowe Explorer profile specified in the `apimlProfile` parameter. You can leave the `programName` and `protsym` fields in this configuration at their default values.
346 |
347 | #### Schedule a Db2 Stored Procedure or IMS DC Application
348 |
349 | To debug a Db2 stored procedure or an IMS DC application, you add the appropriate criteria to the Batch Link Schedule Table, from which you can later run it from the Batch Link Queue using an `attach` configuration.
350 |
351 | 1. Open the F1 menu and select **Batch: Show Scheduling Table**.
352 | 2. Select your batch configuration.
353 | 3. Enter your mainframe password if prompted.
354 | The Batch Link Scheduling Table displays.
355 | 4. Select **Add a new schedule entry**.
356 | 5. Select either **DB2** or **IMS**.
357 | 6. (Optional) Specify a name for your job and press enter.
358 | 7. Specify your program name and press enter.
359 | 8. (IMS only, optional) Specify an IMS transaction ID for the schedule entry and press enter. If you leave this prompt blank, all transactions are processed. This field can be wildcarded and cannot contain more than eight characters.
360 | 9. (IMS only, optional) Specify an IMS user ID for the schedule entry and press enter. This field can be wildcarded and cannot contain more than eight characters.
361 | The **Is this a one-time entry?** prompt displays.
362 | 10. Select **Yes** or **No**. If you select **Yes**, the session is deleted from the Batch Link Schedule Table after it is attached to the Batch Link Queue.
363 | The stored procedure is scheduled. To view it in the Batch Link Scheduling Table, repeat steps 1 to 3 above.
364 |
365 | #### Delete a Batch Link Scheduling Table Entry
366 |
367 | 1. Open the F1 menu and select **Batch: Show Scheduling Table**
368 | 2. Select your batch configuration.
369 | 3. Enter your mainframe password if prompted.
370 | The Batch Link Scheduling Table displays.
371 | 4. Select the delete icon next to the procedure that you want to delete.
372 | 5. When prompted select **Yes** to confirm the deletion.
373 | The entry is deleted.
374 |
375 | ## Breakpoints
376 |
377 | Debugger for Mainframe supports several different kinds of breakpoints that you can use to monitor your debugging sessions.
378 |
379 | ### Conditional and Unconditional Breakpoints
380 |
381 | Breakpoints can be unconditional or conditional. Unconditional breakpoints always stop the process at the specified point until they are removed.
382 |
383 | Conditional breakpoints contain specified scenarios which trigger the breakpoint. You can only use one conditional breakpoint per line. Conditional breakpoints are formatted as follows:
384 |
385 | - The left value specifies a variable or a keyword.
386 | - The operator specifies one of the following values: **=, <, >, <=, >=, !=**. Place a space before and after the operator.
387 | - The right value specifies a variable, a keyword, a constant, or a literal.
388 |
389 | Supported keywords: **R0, R1, R2, R3, R4, R5, R6, R7, R8, R9, R10, R11, R12, R13, R14, R15, CMAR, CSA, CURR, CWA, CWK, DSA, ITBE, LCL, MXR, MXS, OPFL, PREV, TAL, TGT, TIOA, TWA**
390 |
391 | Supported constants: **LOW-VALUES, HIGH-VALUES, ZEROES, SPACES**
392 |
393 | Supported literals:
394 | - **C** specifies a string of any type of character. Example: C'ASDF'
395 | - **P** specifies a positive or negative number. Example: P'-1548'
396 | - **H** specifies a hexadecimal value which is four characters long. Example: H'A2DF'
397 | - **F** specifies a hexadecimal value which is eight characters long. Example: F'A86FE567'
398 | - **X** specifies a hexadecimal value of any length. Example: X'A0DF27'
399 |
400 | ### Data Breakpoints
401 |
402 | Data breakpoints are attached to variables and cause the program to stop when the value of the attached variable changes. To set a data breakpoint, right-click a variable in the Variable Tree View and select **Break on Value Change**.
403 |
404 | When you set a data breakpoint in Debugger for Mainframe, a variable-change breakpoint is set on the same variable on the server side. When you set a variable-change breakpoint in InterTest, a data breakpoint is set in Debugger for Mainframe when you load the program listing.
405 |
406 | - **Note:** Due to a known issue, data breakpoints that are set as variable-change breakpoints on InterTest do not show up in the Variables Tree View.
407 |
408 | Data breakpoints are valid for one debug session only and must be reset after each use.
409 |
410 | ### Paragraph Breakpoints
411 |
412 | Set the `launch.json` parameter **paragraphBreakpoints** to "true" to trigger a breakpoint at the beginning of every new paragraph in COBOL code, and every label in Assembler code. For more information, see [Add Configuration](#add-configuration).
413 |
414 | You can also turn this feature on and off in the debugger console by submitting the commands `/AT LABEL` and `/LABEL OFF`.
415 |
416 | ### Logpoints
417 |
418 | 
419 |
420 | Logpoints mark a particular part of the code, however unlike breakpoints, they do not break or stop the program. Logpoints can highlight an issue within a program while it is running, without causing the program to terminate.
421 |
422 | Logpoints can contain text and variables from the code. Enclose the variables in curly brackets without any spaces, as follows:
423 |
424 | ‘text {variableName} text’
425 |
426 | The text in the logpoint can be used for detailed observations about the behaviour of the code. The message output from the logpoints is displayed in the debug console.
427 |
428 | Logpoints are especially useful as:
429 | - They allow analysis of how the program behaves after this point, and whether the identified issue affects the program and how.
430 | - They allow live analysis while users continue to use functionaility, minimizing costly downtime.
431 | - Logpoints can be added on an ad-hoc basis, with no need to pre-plan, so debugging can be done flexibly according to resource availability.
432 | - Logpoint notes are separate from source code, and require minimal clean-up after debugging is completed.
433 |
434 | ### Execution Counts
435 |
436 | Debugger for Mainframe includes an execution count feature which states how many times each line of code is run between each breakpoint or abend in your debugging session. The execution count feature is only supported for Batch programs.
437 |
438 | The execution count feature is disabled by default. It can be enabled in `launch.json` before you begin your debug session. For more information, see [Add Configuration](#add-configuration).
439 |
440 | To enable or disable the execution count feature during your debug session, use the debug console commands `/counts on` and `/counts off`. After you submit the `/counts on` command, perform an action which progresses the debugging session to display the execution count.
441 |
442 | The execution count variable is stored on the mainframe and is only reset when you perform an action which progresses the debugging session. It is not reset by the `/counts off` command or by closing Visual Studio Code.
443 |
444 | ## Variables
445 |
446 | Use the VS Code variables tree view to view and edit the value of variables during your debugging session. As well as the regular VS Code functionality, Debugger for Mainframe also enables you to edit the hexadecimal value of a variable, and view variables inline.
447 |
448 | ### Variables Tree View
449 |
450 | Variables in the tree view are sorted under the following categories:
451 |
452 | * **Global**
453 | * Shows the last known value of all variables in the program.
454 | * **Local**
455 | * (COBOL only) Shows the value of all variables on the currently selected line when the debugging session is paused.
456 | * **CICS Defined Variables**
457 | * (COBOL only, CICS only) Shows the value of all variables defined in the CICS region where your debug session is running.
458 | * **General Purpose Registers**
459 | * (Assembler only) Shows the content of all 16 General Purpose Registers.
460 |
461 | #### Filter Variables
462 |
463 | To find a variable in the variables tree view, click the **Filter** icon and type a search string in the text box at the top of the interface. The search returns all variables which contain the provided string. To clear an active filter, click the **Filter** icon.
464 |
465 | The filter searches variable names under the **Global** and **CICS Defined Variables** headings only.
466 |
467 | #### Edit the Hexadecimal Value of a Variable
468 |
469 | To edit the hexadecimal value of a variable, do the following:
470 |
471 | 1. Locate the variable in the variables view.
472 | 2. Right-click the variable and select **Set Value**.
473 | 3. Enter the hexadecimal value in the format 0xvalue and press enter.
474 |
475 | You can hover over a variable with an invalid format in the edit window to view the hexadecimal value.
476 |
477 | ### Inline Variables View
478 |
479 | Enable inline variables view to see the values of all variables on the highlighted line of code inline.
480 |
481 | 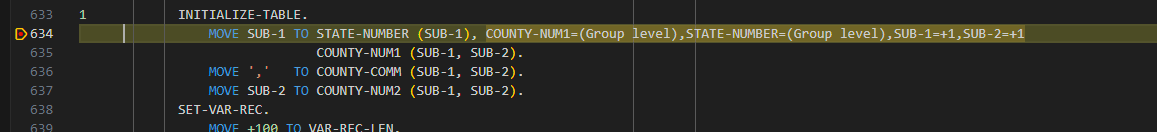
482 |
483 | To enable and disable inline variables view, use the following commands in the debug console:
484 |
485 | * `/inline on`, `/inline off`
486 | - Enables and disables inline variables view.
487 |
488 | ## Call Trace and Statement Trace
489 |
490 | Debugger for Mainframe includes tracing features which send information about statements and programs to the left-hand sidebar of your IDE. There are two tracing features, call trace (for CICS programs only) and statement trace (for CICS and Batch programs).
491 |
492 | Call trace displays information about calls from program to program, displaying the logical flow between listings. You can view this information in the **Call Stack View** in the left-hand sidebar of your IDE.
493 |
494 | Statement trace displays information about the statements that you pass during your debug session. You can view this information in the **Statement Trace View** in the left-hand sidebar of your IDE.
495 |
496 | You can click on an entry in the Call Stack or Statement Trace View to move the cursor to the relevant line of the source code file.
497 |
498 | Records displayed in both views contain the following information:
499 |
500 | * Name of the program
501 | * Number of the last statement processed
502 | * Text of the last statement processed
503 |
504 | The call trace and statement trace features are enabled by default. They can be disabled in `launch.json` before you begin your debug session. For more information, see [Add Configuration](#add-configuration).
505 |
506 | To disable or enable the tracing features during your debug session, use the following commands in the debug console:
507 |
508 | * `/trace on`, `/trace off`
509 | - Enables and disables statement trace.
510 | * `/calltrace on`, `/calltrace off`
511 | - Enables and disables call trace.
512 |
513 | ## Integrate with Zowe Explorer
514 |
515 | You can integrate Debugger for Mainframe with [Zowe Explorer](https://docs.zowe.org/stable/getting-started/user-roadmap-zowe-explorer) and set up a Zowe profile to enable the Single Sign-On feature of Zowe API ML, access mainframe data sets, and track the status of JCL jobs in connection with your debugging sessions. You can also use Zowe Explorer to submit JCL or to edit your converted JCL before running batch debugging sessions.
516 |
517 | To enable job status messages, the **zoweProfileName** parameter must be specified in your configuration file (see the **[Add Configuration](#add-configuration)** section).
518 |
519 | Zowe Explorer is available as part of the Code4z package.
520 |
521 |  522 |
523 | ## Troubleshooting
524 |
525 | ### Known Limitations
526 |
527 | - Conditional breakpoints validator does not work on VS Code version 1.74.
528 | - We currently only support one user on an active debugging session at one time. If multiple users join the same session from the Batch Link Queue, it might affect performance and cause other unwanted issues.
529 | - COBOL table variables defined with the OCCURS X TIMES keyword can only be updated from the variables view, not from the editor.
530 |
531 | ### Enable Troubleshooting Log
532 | To generate a troubleshooting log, add the following parameters to your `launch.json` file:
533 |
534 | - **"logLevel"**:
535 | - Specifies the amount of information reported to the log. Specify one of the following values:
536 | - "SEVERE"
537 | - "WARNING"
538 | - "INFO"
539 | - "CONFIG"
540 | - "FINE"
541 | - "FINER"
542 | - "FINEST"
543 | These values are ordered from returning the least information ("SEVERE"; errors only) to the most information ("FINEST"; all details).
544 | - **"logOutput"**:
545 | - Specifies where the log is displayed. Specify one of the following values:
546 | - "console"
547 | - Displays the troubleshooting log on the IDE console.
548 | - "file"
549 | - Stores the troubleshooting log in a file in the `/.c4z` folder in your workspace.
550 |
551 | ## Report Issues
552 |
553 | How can we improve Debugger for Mainframe? [Let us know on our Git repository](https://github.com/BroadcomMFD/debugger-for-mainframe/issues).
554 |
555 | ## Technical Assistance and Support for Debugger for Mainframe
556 |
557 | The Debugger for Mainframe extension is made available to customers on the Visual Studio Code Marketplace in accordance with the terms and conditions contained in the provided End-User License Agreement (EULA).
558 |
559 | If you are on active support for InterTest, you get technical assistance and support in accordance with the terms, guidelines, details, and parameters that are located within the Broadcom [Working with Support](https://support.broadcom.com/external/content/release-announcements/CA-Support-Policies/6933) guide.
560 |
561 | This support generally includes:
562 |
563 | * Telephone and online access to technical support
564 | * Ability to submit new incidents 24x7x365
565 | * 24x7x365 continuous support for Severity 1 incidents
566 | * 24x7x365 access to Broadcom Support
567 | * Interactive remote diagnostic support
568 | * Technical support cases must be submitted to Broadcom in accordance with guidance provided in “Working with Support”.
569 |
570 | Note: To receive technical assistance and support, you must remain compliant with “Working with Support”, be current on all applicable licensing and maintenance requirements, and maintain an environment in which all computer hardware, operating systems, and third party software associated with the affected Broadcom software are on the releases and version levels from the manufacturer that Broadcom designates as compatible with the software. Changes you elect to make to your operating environment could detrimentally affect the performance of Broadcom software and Broadcom shall not be responsible for these effects or any resulting degradation in performance of the Broadcom software. Severity 1 cases must be opened via telephone and elevations of lower severity incidents to Severity 1 status must be requested via telephone.
571 |
572 | ## Privacy Notice
573 | The extensions for Visual Studio Code developed by Broadcom Inc., including its corporate affiliates and subsidiaries, ("Broadcom") are provided free of charge, but in order to better understand and meet its users’ needs, Broadcom may collect, use, analyze and retain anonymous users’ metadata and interaction data, (collectively, “Usage Data”) and aggregate such Usage Data with similar Usage Data of other Broadcom customers. Please find more detailed information in License and Service Terms & Repository.
574 |
575 | This data collection uses built-in Microsoft VS Code Telemetry, which can be disabled, at your sole discretion, if you do not want to send Usage Data.
576 |
577 | The current release of Debugger for Mainframe collects anonymous data for the following events:
578 | - Activation of this VS Code extension
579 | - Conversion of batch JCL for debugging
580 | - Batch scheduling table operations
581 | - Batch link queue operations
582 | - Fetch extended sources
583 | - DAP requests and responses
584 | - Setting variables
585 | - Errors
586 |
587 | Each such event is logged with the following information:
588 | - Event time
589 | - Operating system and version
590 | - Country or region
591 | - Anonymous user and session ID
592 | - Version numbers of Microsoft VS Code and Debugger for Mainframe
593 |
--------------------------------------------------------------------------------
/Setup and config Edited.gif:
--------------------------------------------------------------------------------
https://raw.githubusercontent.com/BroadcomMFD/debugger-for-mainframe/5a584aed31d77f353eec4fa5878398184c1a0d82/Setup and config Edited.gif
--------------------------------------------------------------------------------
/inlinevars.png:
--------------------------------------------------------------------------------
https://raw.githubusercontent.com/BroadcomMFD/debugger-for-mainframe/5a584aed31d77f353eec4fa5878398184c1a0d82/inlinevars.png
--------------------------------------------------------------------------------
/walkthrough/PROGRAMNAME.PNG:
--------------------------------------------------------------------------------
https://raw.githubusercontent.com/BroadcomMFD/debugger-for-mainframe/5a584aed31d77f353eec4fa5878398184c1a0d82/walkthrough/PROGRAMNAME.PNG
--------------------------------------------------------------------------------
/walkthrough/app-icon.png:
--------------------------------------------------------------------------------
https://raw.githubusercontent.com/BroadcomMFD/debugger-for-mainframe/5a584aed31d77f353eec4fa5878398184c1a0d82/walkthrough/app-icon.png
--------------------------------------------------------------------------------
/walkthrough/applid.PNG:
--------------------------------------------------------------------------------
https://raw.githubusercontent.com/BroadcomMFD/debugger-for-mainframe/5a584aed31d77f353eec4fa5878398184c1a0d82/walkthrough/applid.PNG
--------------------------------------------------------------------------------
/walkthrough/breakpoints.PNG:
--------------------------------------------------------------------------------
https://raw.githubusercontent.com/BroadcomMFD/debugger-for-mainframe/5a584aed31d77f353eec4fa5878398184c1a0d82/walkthrough/breakpoints.PNG
--------------------------------------------------------------------------------
/walkthrough/connection.PNG:
--------------------------------------------------------------------------------
https://raw.githubusercontent.com/BroadcomMFD/debugger-for-mainframe/5a584aed31d77f353eec4fa5878398184c1a0d82/walkthrough/connection.PNG
--------------------------------------------------------------------------------
/walkthrough/fetchextended.PNG:
--------------------------------------------------------------------------------
https://raw.githubusercontent.com/BroadcomMFD/debugger-for-mainframe/5a584aed31d77f353eec4fa5878398184c1a0d82/walkthrough/fetchextended.PNG
--------------------------------------------------------------------------------
/walkthrough/launchjson.PNG:
--------------------------------------------------------------------------------
https://raw.githubusercontent.com/BroadcomMFD/debugger-for-mainframe/5a584aed31d77f353eec4fa5878398184c1a0d82/walkthrough/launchjson.PNG
--------------------------------------------------------------------------------
/walkthrough/password.PNG:
--------------------------------------------------------------------------------
https://raw.githubusercontent.com/BroadcomMFD/debugger-for-mainframe/5a584aed31d77f353eec4fa5878398184c1a0d82/walkthrough/password.PNG
--------------------------------------------------------------------------------
/walkthrough/split.PNG:
--------------------------------------------------------------------------------
https://raw.githubusercontent.com/BroadcomMFD/debugger-for-mainframe/5a584aed31d77f353eec4fa5878398184c1a0d82/walkthrough/split.PNG
--------------------------------------------------------------------------------
/walkthrough/startdebug.PNG:
--------------------------------------------------------------------------------
https://raw.githubusercontent.com/BroadcomMFD/debugger-for-mainframe/5a584aed31d77f353eec4fa5878398184c1a0d82/walkthrough/startdebug.PNG
--------------------------------------------------------------------------------
522 |
523 | ## Troubleshooting
524 |
525 | ### Known Limitations
526 |
527 | - Conditional breakpoints validator does not work on VS Code version 1.74.
528 | - We currently only support one user on an active debugging session at one time. If multiple users join the same session from the Batch Link Queue, it might affect performance and cause other unwanted issues.
529 | - COBOL table variables defined with the OCCURS X TIMES keyword can only be updated from the variables view, not from the editor.
530 |
531 | ### Enable Troubleshooting Log
532 | To generate a troubleshooting log, add the following parameters to your `launch.json` file:
533 |
534 | - **"logLevel"**:
535 | - Specifies the amount of information reported to the log. Specify one of the following values:
536 | - "SEVERE"
537 | - "WARNING"
538 | - "INFO"
539 | - "CONFIG"
540 | - "FINE"
541 | - "FINER"
542 | - "FINEST"
543 | These values are ordered from returning the least information ("SEVERE"; errors only) to the most information ("FINEST"; all details).
544 | - **"logOutput"**:
545 | - Specifies where the log is displayed. Specify one of the following values:
546 | - "console"
547 | - Displays the troubleshooting log on the IDE console.
548 | - "file"
549 | - Stores the troubleshooting log in a file in the `/.c4z` folder in your workspace.
550 |
551 | ## Report Issues
552 |
553 | How can we improve Debugger for Mainframe? [Let us know on our Git repository](https://github.com/BroadcomMFD/debugger-for-mainframe/issues).
554 |
555 | ## Technical Assistance and Support for Debugger for Mainframe
556 |
557 | The Debugger for Mainframe extension is made available to customers on the Visual Studio Code Marketplace in accordance with the terms and conditions contained in the provided End-User License Agreement (EULA).
558 |
559 | If you are on active support for InterTest, you get technical assistance and support in accordance with the terms, guidelines, details, and parameters that are located within the Broadcom [Working with Support](https://support.broadcom.com/external/content/release-announcements/CA-Support-Policies/6933) guide.
560 |
561 | This support generally includes:
562 |
563 | * Telephone and online access to technical support
564 | * Ability to submit new incidents 24x7x365
565 | * 24x7x365 continuous support for Severity 1 incidents
566 | * 24x7x365 access to Broadcom Support
567 | * Interactive remote diagnostic support
568 | * Technical support cases must be submitted to Broadcom in accordance with guidance provided in “Working with Support”.
569 |
570 | Note: To receive technical assistance and support, you must remain compliant with “Working with Support”, be current on all applicable licensing and maintenance requirements, and maintain an environment in which all computer hardware, operating systems, and third party software associated with the affected Broadcom software are on the releases and version levels from the manufacturer that Broadcom designates as compatible with the software. Changes you elect to make to your operating environment could detrimentally affect the performance of Broadcom software and Broadcom shall not be responsible for these effects or any resulting degradation in performance of the Broadcom software. Severity 1 cases must be opened via telephone and elevations of lower severity incidents to Severity 1 status must be requested via telephone.
571 |
572 | ## Privacy Notice
573 | The extensions for Visual Studio Code developed by Broadcom Inc., including its corporate affiliates and subsidiaries, ("Broadcom") are provided free of charge, but in order to better understand and meet its users’ needs, Broadcom may collect, use, analyze and retain anonymous users’ metadata and interaction data, (collectively, “Usage Data”) and aggregate such Usage Data with similar Usage Data of other Broadcom customers. Please find more detailed information in License and Service Terms & Repository.
574 |
575 | This data collection uses built-in Microsoft VS Code Telemetry, which can be disabled, at your sole discretion, if you do not want to send Usage Data.
576 |
577 | The current release of Debugger for Mainframe collects anonymous data for the following events:
578 | - Activation of this VS Code extension
579 | - Conversion of batch JCL for debugging
580 | - Batch scheduling table operations
581 | - Batch link queue operations
582 | - Fetch extended sources
583 | - DAP requests and responses
584 | - Setting variables
585 | - Errors
586 |
587 | Each such event is logged with the following information:
588 | - Event time
589 | - Operating system and version
590 | - Country or region
591 | - Anonymous user and session ID
592 | - Version numbers of Microsoft VS Code and Debugger for Mainframe
593 |
--------------------------------------------------------------------------------
/Setup and config Edited.gif:
--------------------------------------------------------------------------------
https://raw.githubusercontent.com/BroadcomMFD/debugger-for-mainframe/5a584aed31d77f353eec4fa5878398184c1a0d82/Setup and config Edited.gif
--------------------------------------------------------------------------------
/inlinevars.png:
--------------------------------------------------------------------------------
https://raw.githubusercontent.com/BroadcomMFD/debugger-for-mainframe/5a584aed31d77f353eec4fa5878398184c1a0d82/inlinevars.png
--------------------------------------------------------------------------------
/walkthrough/PROGRAMNAME.PNG:
--------------------------------------------------------------------------------
https://raw.githubusercontent.com/BroadcomMFD/debugger-for-mainframe/5a584aed31d77f353eec4fa5878398184c1a0d82/walkthrough/PROGRAMNAME.PNG
--------------------------------------------------------------------------------
/walkthrough/app-icon.png:
--------------------------------------------------------------------------------
https://raw.githubusercontent.com/BroadcomMFD/debugger-for-mainframe/5a584aed31d77f353eec4fa5878398184c1a0d82/walkthrough/app-icon.png
--------------------------------------------------------------------------------
/walkthrough/applid.PNG:
--------------------------------------------------------------------------------
https://raw.githubusercontent.com/BroadcomMFD/debugger-for-mainframe/5a584aed31d77f353eec4fa5878398184c1a0d82/walkthrough/applid.PNG
--------------------------------------------------------------------------------
/walkthrough/breakpoints.PNG:
--------------------------------------------------------------------------------
https://raw.githubusercontent.com/BroadcomMFD/debugger-for-mainframe/5a584aed31d77f353eec4fa5878398184c1a0d82/walkthrough/breakpoints.PNG
--------------------------------------------------------------------------------
/walkthrough/connection.PNG:
--------------------------------------------------------------------------------
https://raw.githubusercontent.com/BroadcomMFD/debugger-for-mainframe/5a584aed31d77f353eec4fa5878398184c1a0d82/walkthrough/connection.PNG
--------------------------------------------------------------------------------
/walkthrough/fetchextended.PNG:
--------------------------------------------------------------------------------
https://raw.githubusercontent.com/BroadcomMFD/debugger-for-mainframe/5a584aed31d77f353eec4fa5878398184c1a0d82/walkthrough/fetchextended.PNG
--------------------------------------------------------------------------------
/walkthrough/launchjson.PNG:
--------------------------------------------------------------------------------
https://raw.githubusercontent.com/BroadcomMFD/debugger-for-mainframe/5a584aed31d77f353eec4fa5878398184c1a0d82/walkthrough/launchjson.PNG
--------------------------------------------------------------------------------
/walkthrough/password.PNG:
--------------------------------------------------------------------------------
https://raw.githubusercontent.com/BroadcomMFD/debugger-for-mainframe/5a584aed31d77f353eec4fa5878398184c1a0d82/walkthrough/password.PNG
--------------------------------------------------------------------------------
/walkthrough/split.PNG:
--------------------------------------------------------------------------------
https://raw.githubusercontent.com/BroadcomMFD/debugger-for-mainframe/5a584aed31d77f353eec4fa5878398184c1a0d82/walkthrough/split.PNG
--------------------------------------------------------------------------------
/walkthrough/startdebug.PNG:
--------------------------------------------------------------------------------
https://raw.githubusercontent.com/BroadcomMFD/debugger-for-mainframe/5a584aed31d77f353eec4fa5878398184c1a0d82/walkthrough/startdebug.PNG
--------------------------------------------------------------------------------