├── .github
└── workflows
│ └── ci_pipeline.yml
├── .gitignore
├── .pre-commit-config.yaml
├── LICENSE.txt
├── Makefile
├── README.md
├── README_ru.md
├── examples
├── calculate_adjacency_matrix.ipynb
├── calculate_provision.ipynb
├── coverage_zones.ipynb
├── examples_data
│ ├── buildings.parquet
│ ├── matrix_time.parquet
│ ├── services.parquet
│ └── trees.parquet
├── isochrone_generator.ipynb
├── noise_simulation.ipynb
├── point_clusterization.ipynb
└── visibility_analysis.ipynb
├── pyproject.toml
└── src
├── objectnat
├── __init__.py
├── _api.py
├── _config.py
├── _version.py
└── methods
│ ├── __init__.py
│ ├── coverage_zones
│ ├── __init__.py
│ ├── graph_coverage.py
│ ├── radius_voronoi_coverage.py
│ └── stepped_coverage.py
│ ├── isochrones
│ ├── __init__.py
│ ├── isochrone_utils.py
│ └── isochrones.py
│ ├── noise
│ ├── __init__.py
│ ├── noise_exceptions.py
│ ├── noise_init_data.py
│ ├── noise_reduce.py
│ └── noise_sim.py
│ ├── point_clustering
│ ├── __init__.py
│ └── cluster_points_in_polygons.py
│ ├── provision
│ ├── __init__.py
│ ├── provision.py
│ ├── provision_exceptions.py
│ └── provision_model.py
│ ├── utils
│ ├── __init__.py
│ ├── geom_utils.py
│ ├── graph_utils.py
│ └── math_utils.py
│ └── visibility
│ ├── __init__.py
│ └── visibility_analysis.py
└── tests
├── __init__.py
├── conftest.py
├── test_clusterization.py
├── test_coverage_zones.py
├── test_isochrones.py
├── test_noise_simulation.py
├── test_provision.py
└── test_visibility.py
/.github/workflows/ci_pipeline.yml:
--------------------------------------------------------------------------------
1 | name: CI Pipeline
2 |
3 | on:
4 | push:
5 | branches:
6 | - master
7 | - dev
8 | pull_request:
9 | branches:
10 | - master
11 | - dev
12 |
13 | permissions:
14 | contents: write
15 |
16 | jobs:
17 | check-version:
18 | runs-on: ubuntu-latest
19 |
20 | steps:
21 | - name: Checkout repository
22 | uses: actions/checkout@v3
23 |
24 | - name: Set up Python
25 | uses: actions/setup-python@v4
26 | with:
27 | python-version: "3.10"
28 |
29 | - name: Install dependencies
30 | run: |
31 | pip install toml
32 |
33 | - name: Extract version from pyproject.toml
34 | id: pyproject-version
35 | run: |
36 | PYPROJECT_VERSION=$(python -c "import toml; print(toml.load('pyproject.toml')['tool']['poetry']['version'])")
37 | echo "Version in pyproject.toml: $PYPROJECT_VERSION"
38 | echo "pyproject_version=$PYPROJECT_VERSION" >> $GITHUB_OUTPUT
39 |
40 | - name: Extract version from _version.py
41 | id: version-py
42 | run: |
43 | VERSION_PY=$(grep -oP 'VERSION = "\K[^"]+' src/objectnat/_version.py)
44 | echo "Version in _version.py: $VERSION_PY"
45 | echo "version_py=$VERSION_PY" >> $GITHUB_OUTPUT
46 |
47 | - name: Compare versions
48 | run: |
49 | if [ "${{ steps.pyproject-version.outputs.pyproject_version }}" != "${{ steps.version-py.outputs.version_py }}" ]; then
50 | echo "Versions do not match!"
51 | echo "pyproject.toml: ${{ steps.pyproject-version.outputs.pyproject_version }}"
52 | echo "_version.py: ${{ steps.version-py.outputs.version_py }}"
53 | exit 1
54 | else
55 | echo "Versions match!"
56 | fi
57 |
58 | check-formatting:
59 | runs-on: ubuntu-latest
60 |
61 | steps:
62 | - name: Checkout repository
63 | uses: actions/checkout@v3
64 |
65 | - name: Set up Python
66 | uses: actions/setup-python@v4
67 | with:
68 | python-version: "3.10"
69 |
70 | - name: Install Poetry
71 | run: pip install poetry
72 |
73 | - name: Install dependencies
74 | run: poetry install
75 |
76 | - name: Run pylint
77 | run: |
78 | poetry run pylint src --exit-zero > pylint-report.txt
79 |
80 | - name: Upload pylint report
81 | uses: actions/upload-artifact@v4
82 | with:
83 | name: pylint-report
84 | path: pylint-report.txt
85 |
86 | - name: Run isort
87 | run: |
88 | poetry run isort --check-only src
89 |
90 | - name: Run black
91 | run: |
92 | poetry run black --check src
93 |
94 | test:
95 | runs-on: ubuntu-latest
96 | needs: [check-version, check-formatting]
97 |
98 | steps:
99 | - name: Checkout repository
100 | uses: actions/checkout@v3
101 |
102 | - name: Set up Python
103 | uses: actions/setup-python@v4
104 | with:
105 | python-version: "3.10"
106 |
107 | - name: Install Poetry
108 | run: pip install poetry
109 |
110 | - name: Install dependencies
111 | run: poetry install
112 |
113 | - name: Run tests with coverage
114 | run: |
115 | poetry run pytest src/tests --cov=objectnat --cov-report=xml
116 |
117 | - name: Upload coverage report
118 | uses: actions/upload-artifact@v4.6.1
119 | with:
120 | name: coverage-report
121 | path: coverage.xml
122 |
123 | - name: Upload coverage to Codecov
124 | uses: codecov/codecov-action@v3
125 | with:
126 | token: ${{ secrets.CODECOV_TOKEN }}
127 | file: coverage.xml
128 | slug: DDonnyy/ObjectNat
129 |
130 | - name: Commit and push test images to assets branch
131 | run: |
132 | git config --global user.name "github-actions"
133 | git config --global user.email "github-actions@github.com"
134 |
135 | if git ls-remote --exit-code --heads origin assets; then
136 | git fetch origin assets
137 | git checkout assets
138 | else
139 | git checkout --orphan assets
140 | git reset --hard
141 | fi
142 | rm -f ./*.png || echo "No old PNGs to remove"
143 | git rm -f ./*.png || echo "No old PNGs to remove from Git"
144 | cp -r src/tests/test_output/*.png . || echo "No images to copy"
145 | git add ./*.png
146 | git commit -m "Update stepped coverage zone test images" || echo "No changes to commit"
147 | git push --force origin assets
148 | env:
149 | GITHUB_TOKEN: ${{ secrets.GITHUB_TOKEN }}
150 |
--------------------------------------------------------------------------------
/.gitignore:
--------------------------------------------------------------------------------
1 | cache
2 | /dist
3 | /dev
4 | /.idea
5 | /.venv
6 | /.vscode
7 | /poetry.lock
8 | __pycache__
9 | /.ipynb_checkpoints
10 |
--------------------------------------------------------------------------------
/.pre-commit-config.yaml:
--------------------------------------------------------------------------------
1 | repos:
2 | - repo: https://github.com/psf/black
3 | rev: 25.1.0
4 | hooks:
5 | - id: black
6 | language_version: python3.10
7 |
8 | - repo: https://github.com/pycqa/isort
9 | rev: 6.0.1
10 | hooks:
11 | - id: isort
--------------------------------------------------------------------------------
/LICENSE.txt:
--------------------------------------------------------------------------------
1 | BSD 3-Clause License
2 |
3 | Copyright (c) 2023, iduprojects
4 |
5 | Redistribution and use in source and binary forms, with or without
6 | modification, are permitted provided that the following conditions are met:
7 |
8 | 1. Redistributions of source code must retain the above copyright notice, this
9 | list of conditions and the following disclaimer.
10 |
11 | 2. Redistributions in binary form must reproduce the above copyright notice,
12 | this list of conditions and the following disclaimer in the documentation
13 | and/or other materials provided with the distribution.
14 |
15 | 3. Neither the name of the copyright holder nor the names of its
16 | contributors may be used to endorse or promote products derived from
17 | this software without specific prior written permission.
18 |
19 | THIS SOFTWARE IS PROVIDED BY THE COPYRIGHT HOLDERS AND CONTRIBUTORS "AS IS"
20 | AND ANY EXPRESS OR IMPLIED WARRANTIES, INCLUDING, BUT NOT LIMITED TO, THE
21 | IMPLIED WARRANTIES OF MERCHANTABILITY AND FITNESS FOR A PARTICULAR PURPOSE ARE
22 | DISCLAIMED. IN NO EVENT SHALL THE COPYRIGHT HOLDER OR CONTRIBUTORS BE LIABLE
23 | FOR ANY DIRECT, INDIRECT, INCIDENTAL, SPECIAL, EXEMPLARY, OR CONSEQUENTIAL
24 | DAMAGES (INCLUDING, BUT NOT LIMITED TO, PROCUREMENT OF SUBSTITUTE GOODS OR
25 | SERVICES; LOSS OF USE, DATA, OR PROFITS; OR BUSINESS INTERRUPTION) HOWEVER
26 | CAUSED AND ON ANY THEORY OF LIABILITY, WHETHER IN CONTRACT, STRICT LIABILITY,
27 | OR TORT (INCLUDING NEGLIGENCE OR OTHERWISE) ARISING IN ANY WAY OUT OF THE USE
28 | OF THIS SOFTWARE, EVEN IF ADVISED OF THE POSSIBILITY OF SUCH DAMAGE.
29 |
--------------------------------------------------------------------------------
/Makefile:
--------------------------------------------------------------------------------
1 | CODE := src
2 |
3 | build-and-publish: clean build publish
4 |
5 | lint:
6 | poetry run pylint $(CODE)
7 |
8 | format:
9 | poetry run isort $(CODE)
10 | poetry run black $(CODE)
11 |
12 | install:
13 | pip install .
14 |
15 | install-dev:
16 | poetry install --with dev
17 |
18 | install-dev-pip:
19 | pip install -e . --config-settings editable_mode=strict
20 |
21 | clean:
22 | rm -rf ./dist
23 |
24 | build:
25 | poetry build
26 |
27 | publish:
28 | poetry publish
29 |
30 | update:
31 | poetry update
32 |
33 | install-from-build:
34 | python -m wheel install dist/graph_lib-*.whl
35 |
--------------------------------------------------------------------------------
/README.md:
--------------------------------------------------------------------------------
1 | # ObjectNat
2 |
3 | [](https://github.com/psf/black)
4 | [](https://pypi.org/project/objectnat/)
5 | [](https://github.com/DDonnyy/ObjecNat/actions/workflows/ci_pipeline.yml)
6 | [](https://codecov.io/gh/DDonnyy/ObjectNat)
7 | [](https://opensource.org/licenses/MIT)
8 |
9 | - [РИДМИ (Russian)](README_ru.md)
10 |
11 |  12 |
12 |
13 |
14 | #### **ObjectNat** is an open-source library created for geospatial analysis created by **IDU team**
15 |
16 | ## Features and how to use
17 |
18 | 1. **[Isochrones and Transport Accessibility](./examples/isochrone_generator.ipynb)** — Isochrones represent areas reachable from a starting point within a given time limit along a transport network. This function enables analysis of transport accessibility using pedestrian, automobile, public transport graphs, or their combination.
19 |
20 | The library offers multiple isochrone generation methods:
21 | - **Baseline isochrones**: show a single area reachable within a specified time.
22 | - **Stepped isochrones**: show accessibility ranges divided into time intervals (e.g., 5, 10, 15 minutes).
23 |
24 |
25 |  26 |
26 |  27 |
27 |  28 |
28 |
29 |
30 |  31 |
31 | 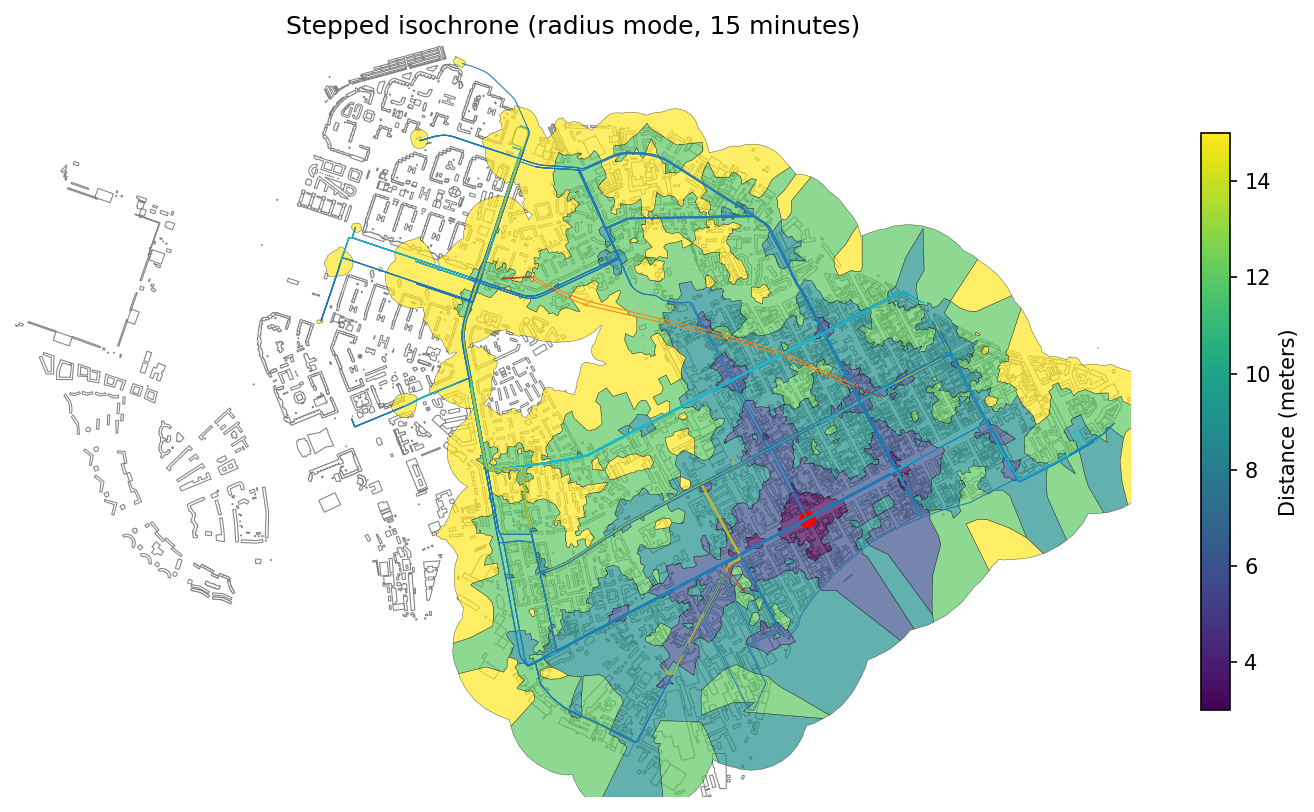 32 |
32 | 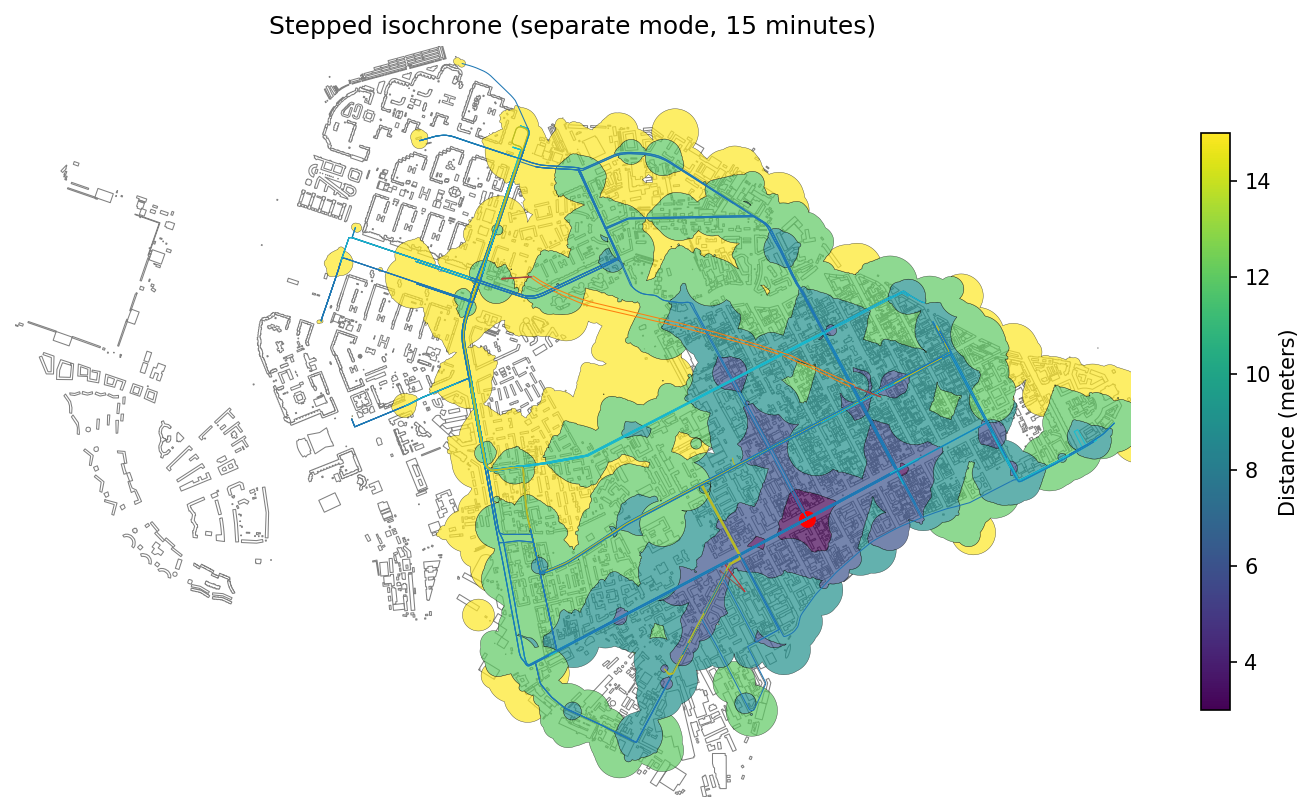 33 |
33 |
34 |
35 | 2. **[Coverage Zones](./examples/coverage_zones.ipynb)** — Function for generating **coverage zones** from a set of source points using a transport network. It calculates the area each point can reach based on **travel time** or **distance**, then builds polygons via **Voronoi diagrams** and clips them to a custom boundary if provided.
36 |
37 |
38 | 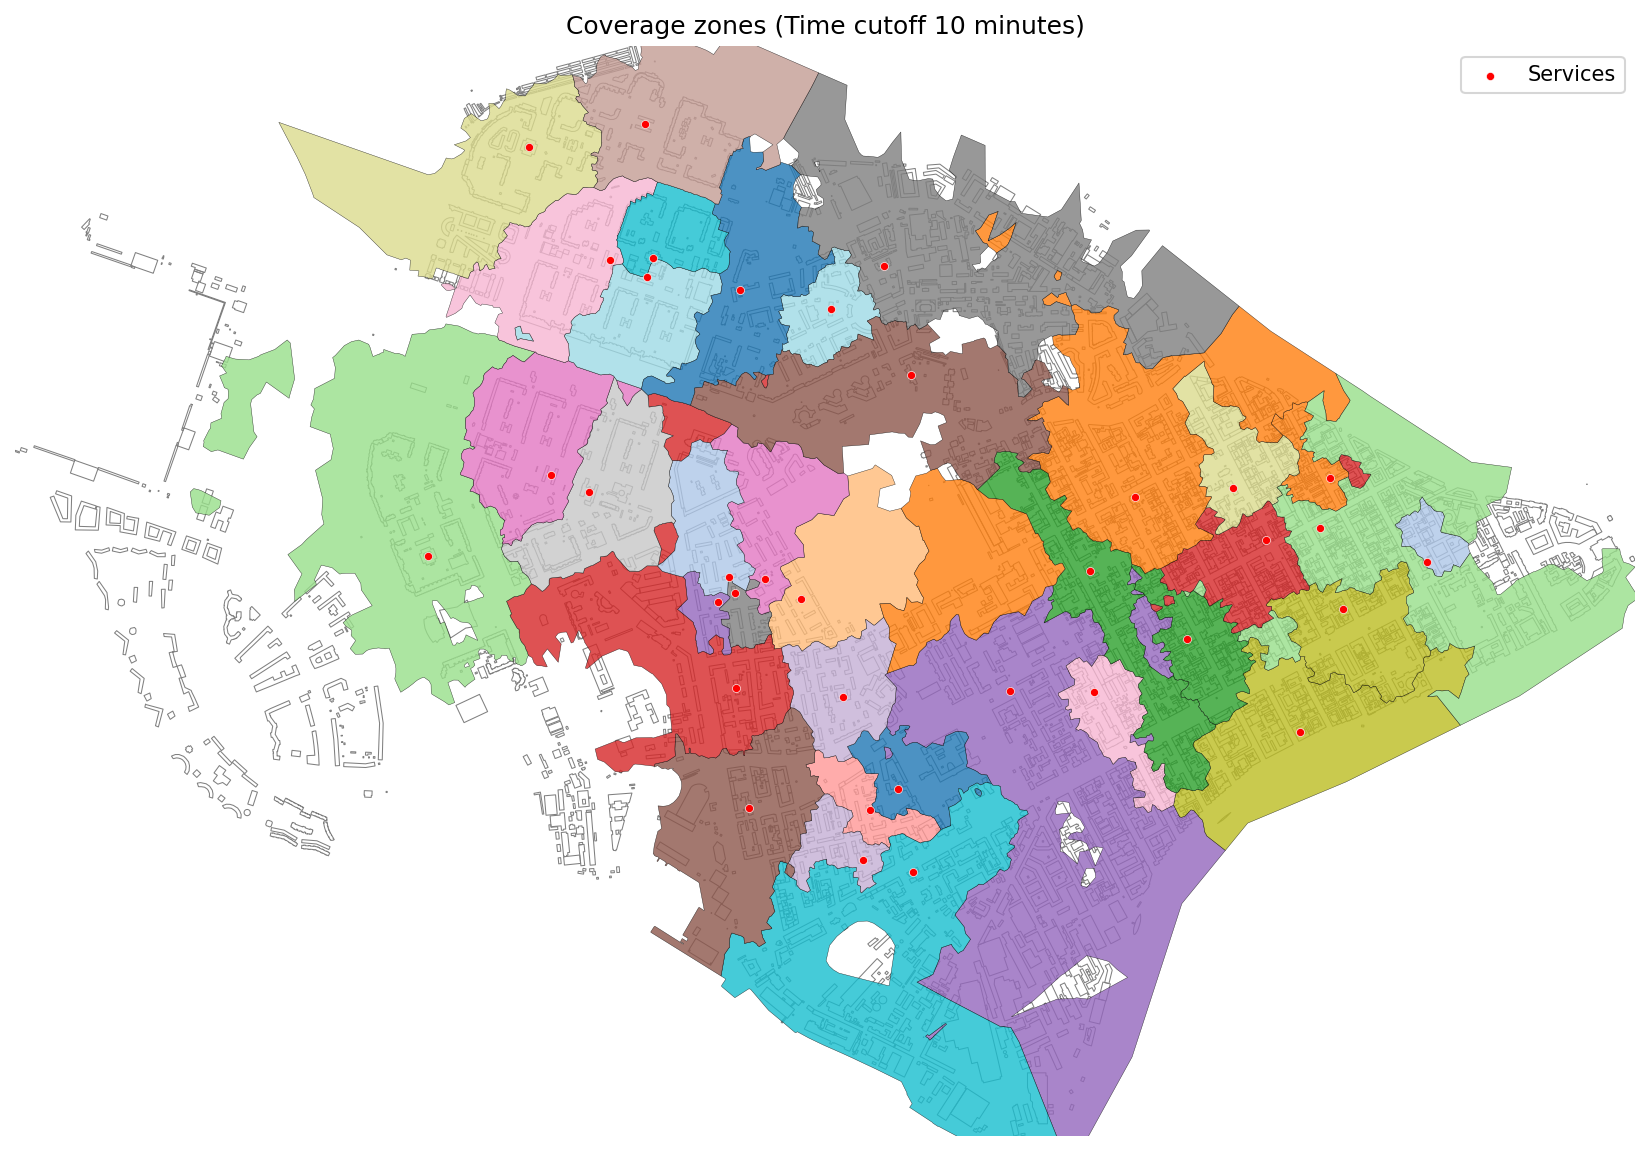 39 |
39 | 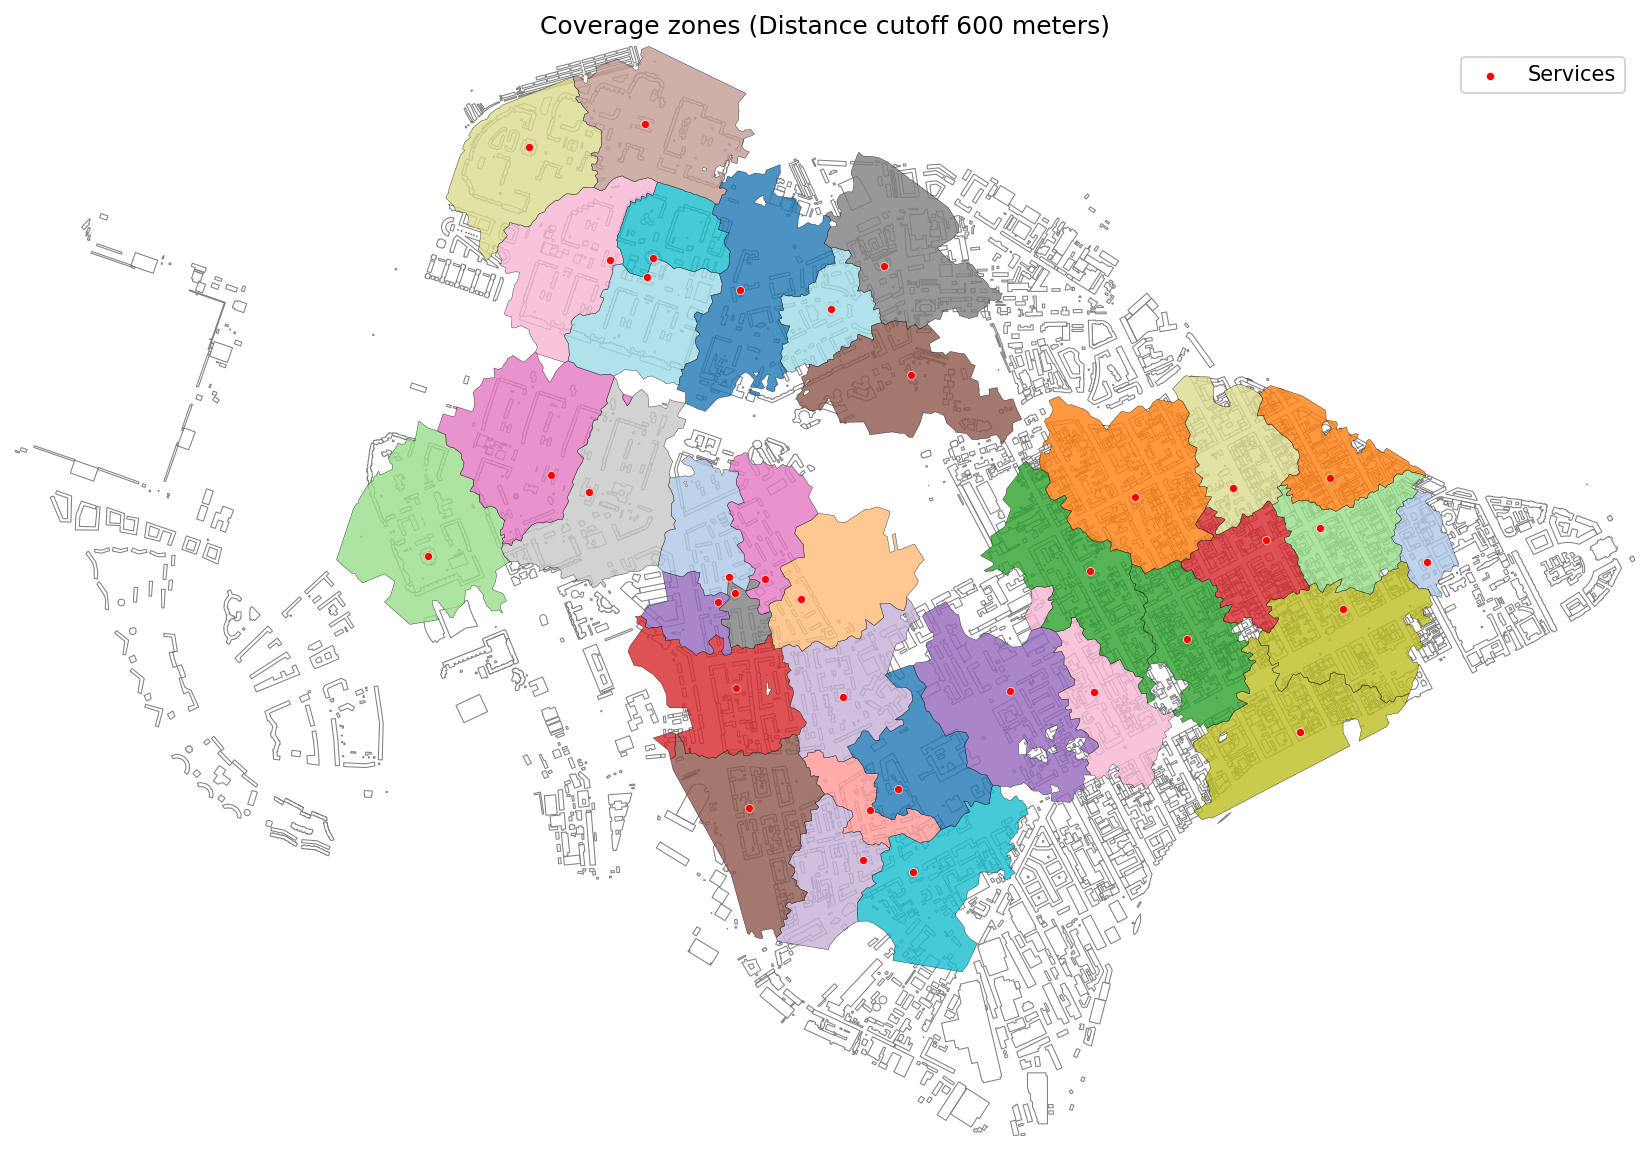 40 |
40 | 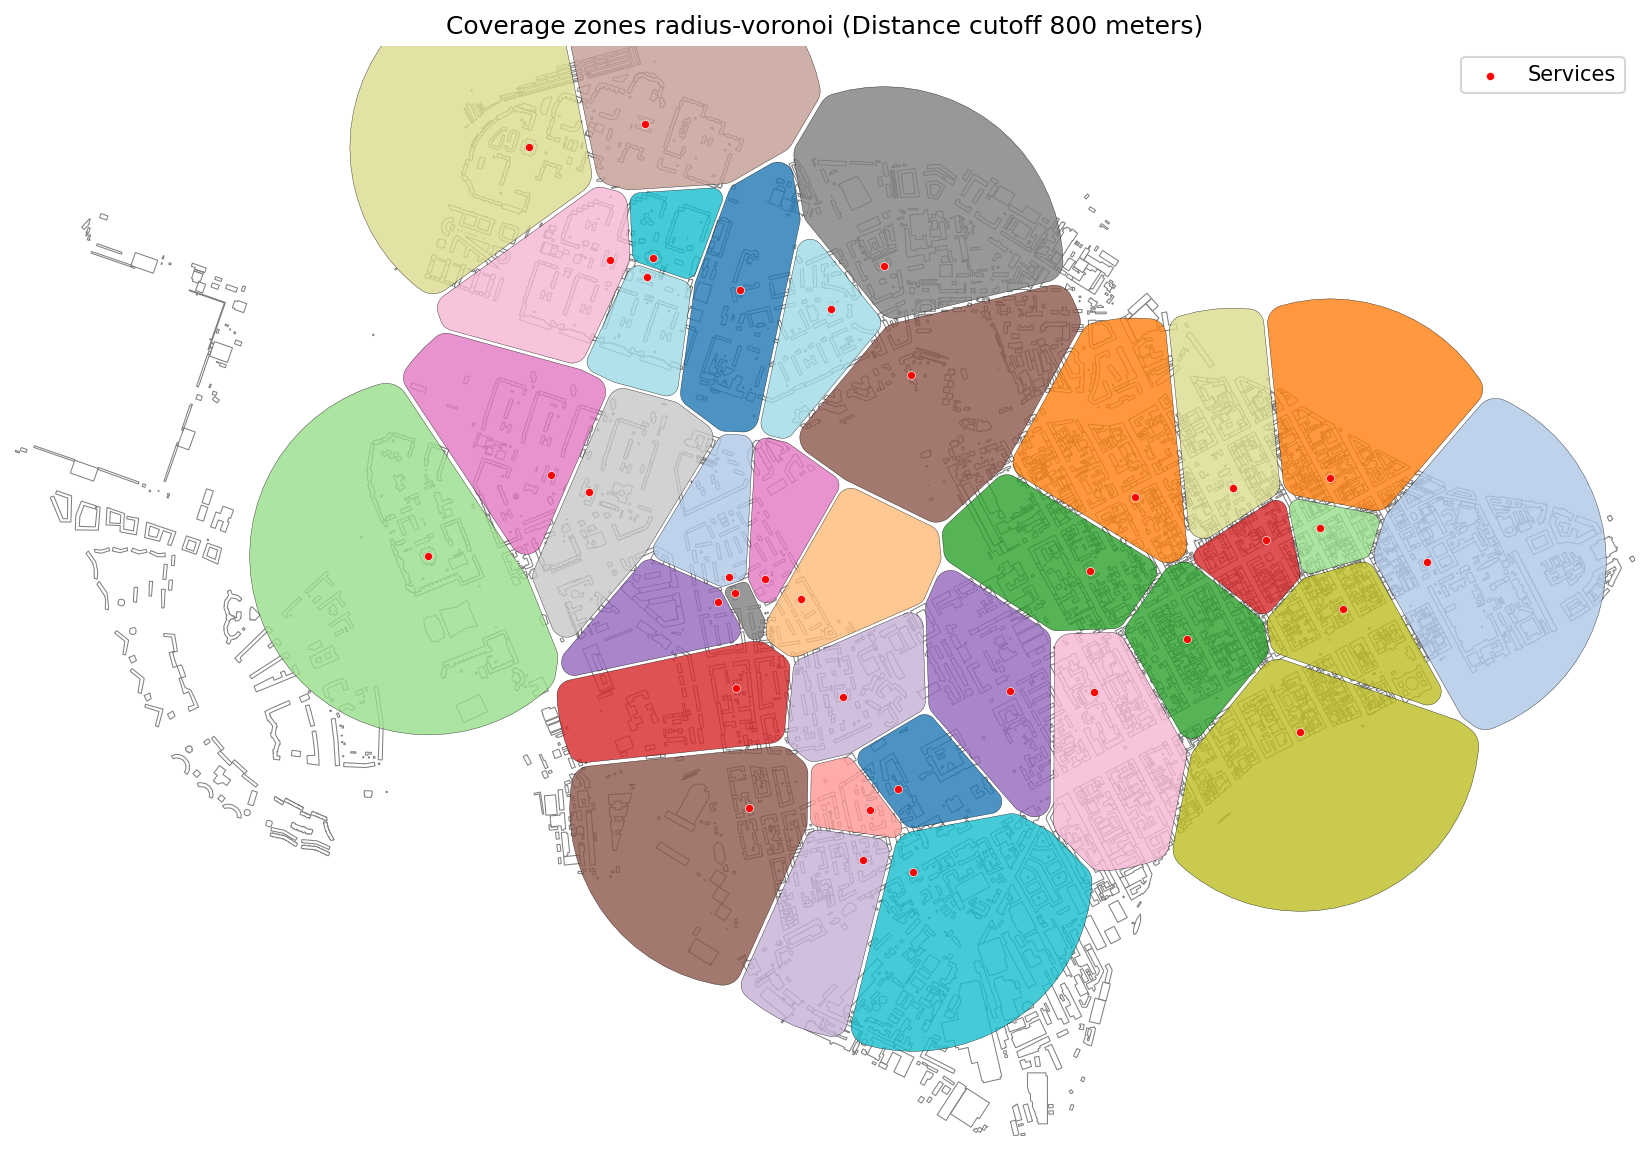 41 |
41 |
42 |
43 | 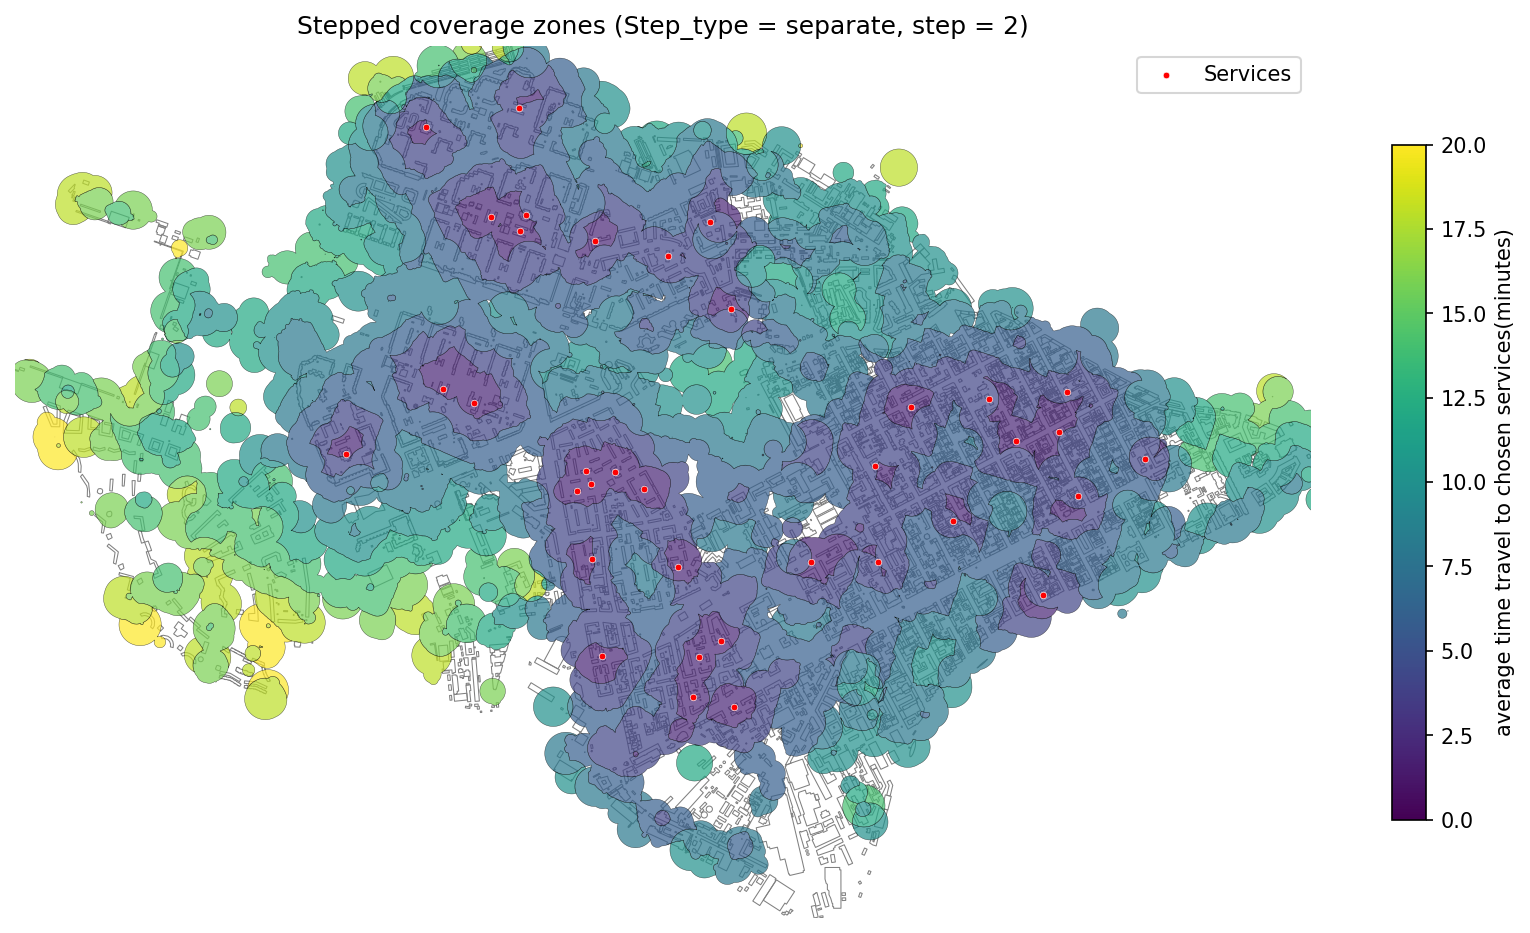 44 |
44 | 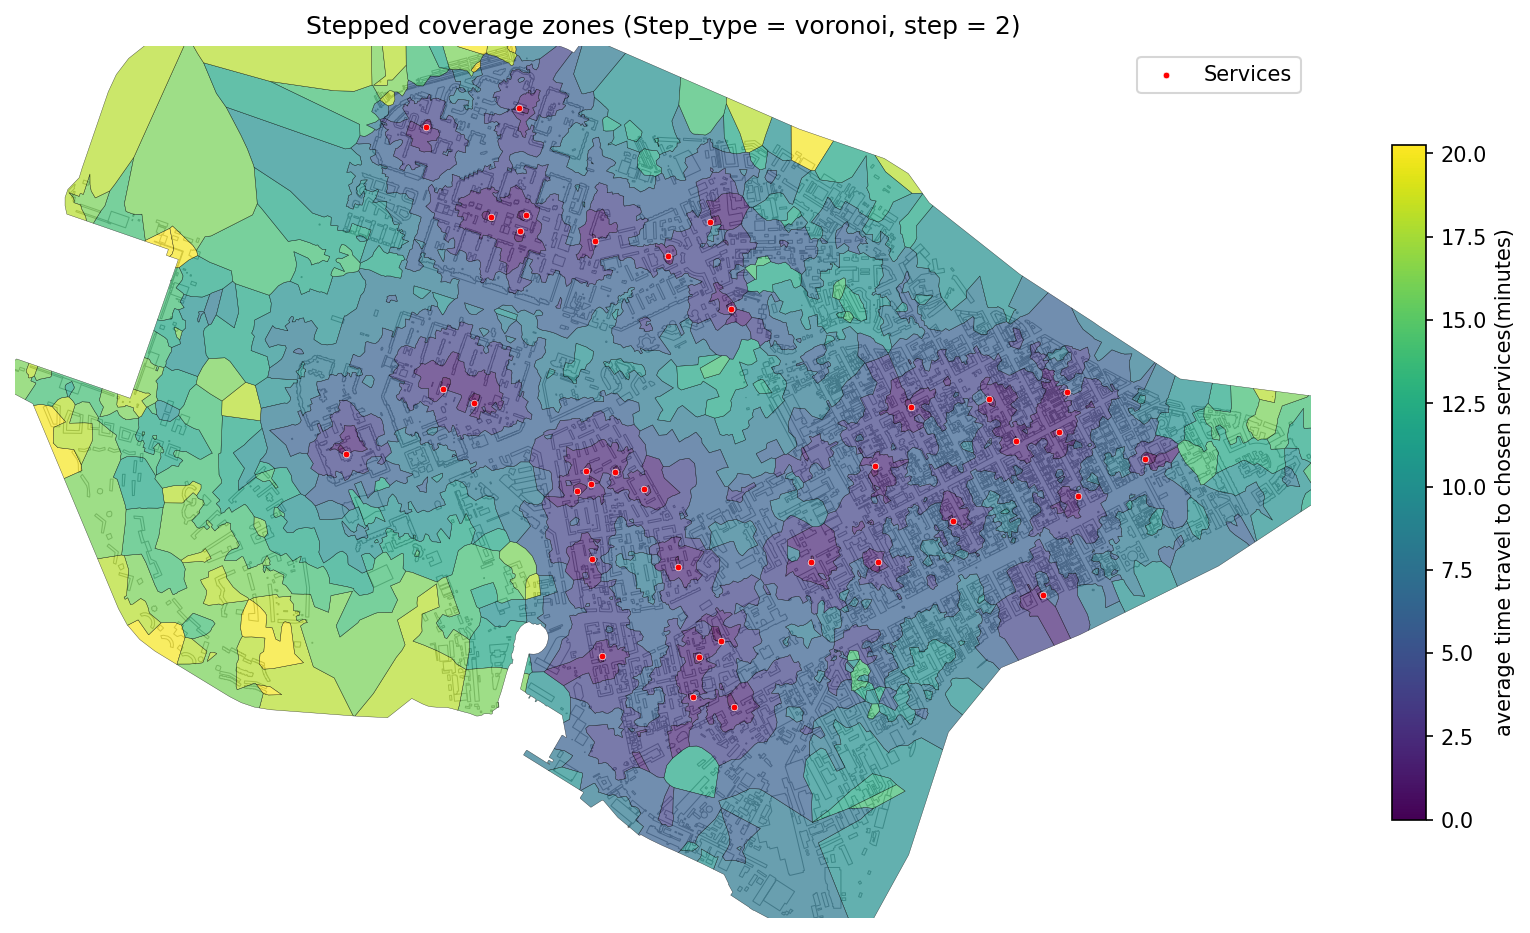 45 |
45 |
46 |
47 | 3. **[Service Provision Analysis](./examples/calculate_provision.ipynb)** — Function for evaluating the provision of residential buildings and their population with services (e.g., schools, clinics)
48 | that have limited **capacity** and a defined **accessibility threshold** (in minutes or distance). The function models **demand-supply balance**, estimating how well services meet the needs of nearby buildings within the allowed time.
49 |
50 | The library also supports:
51 | - **Recalculation** of existing provision results using a new time threshold.
52 | - **Clipping** of provision results to a custom analysis area (e.g., administrative boundaries).
53 |
54 |
55 | 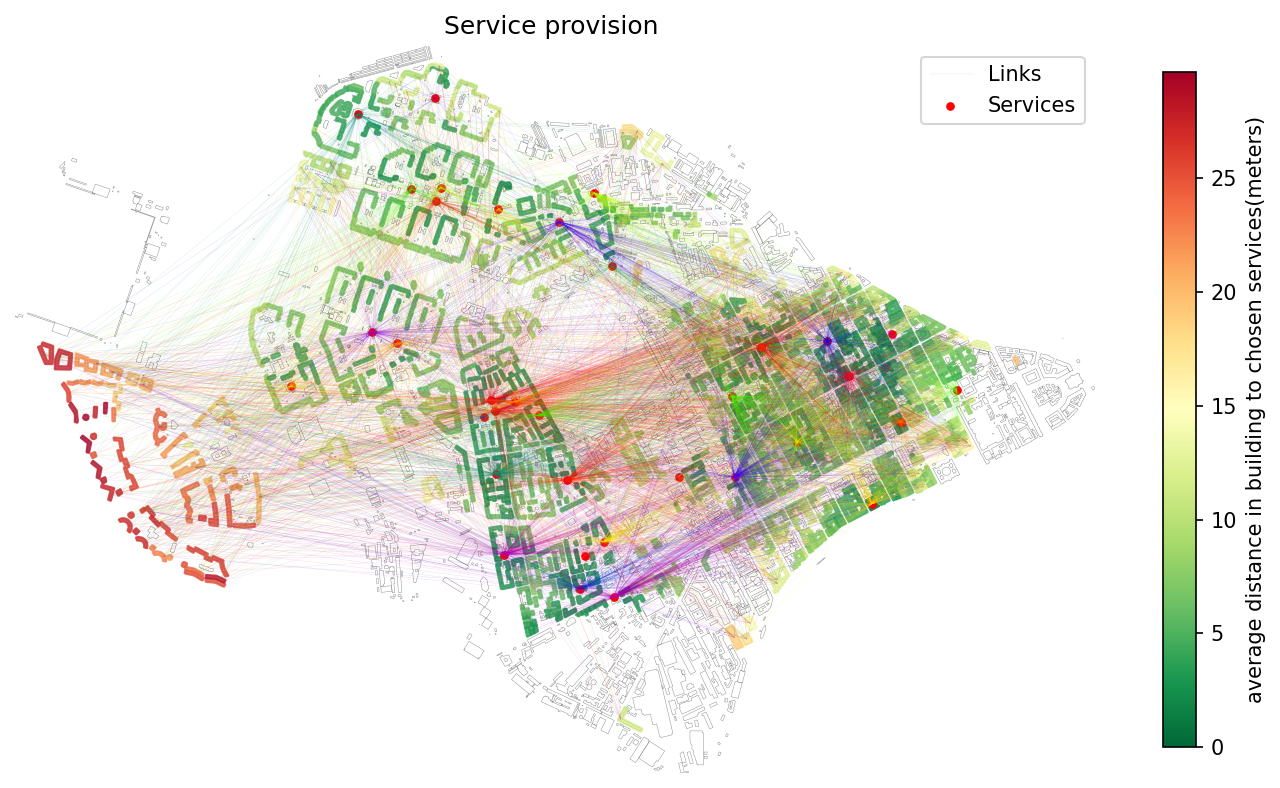 56 |
56 | 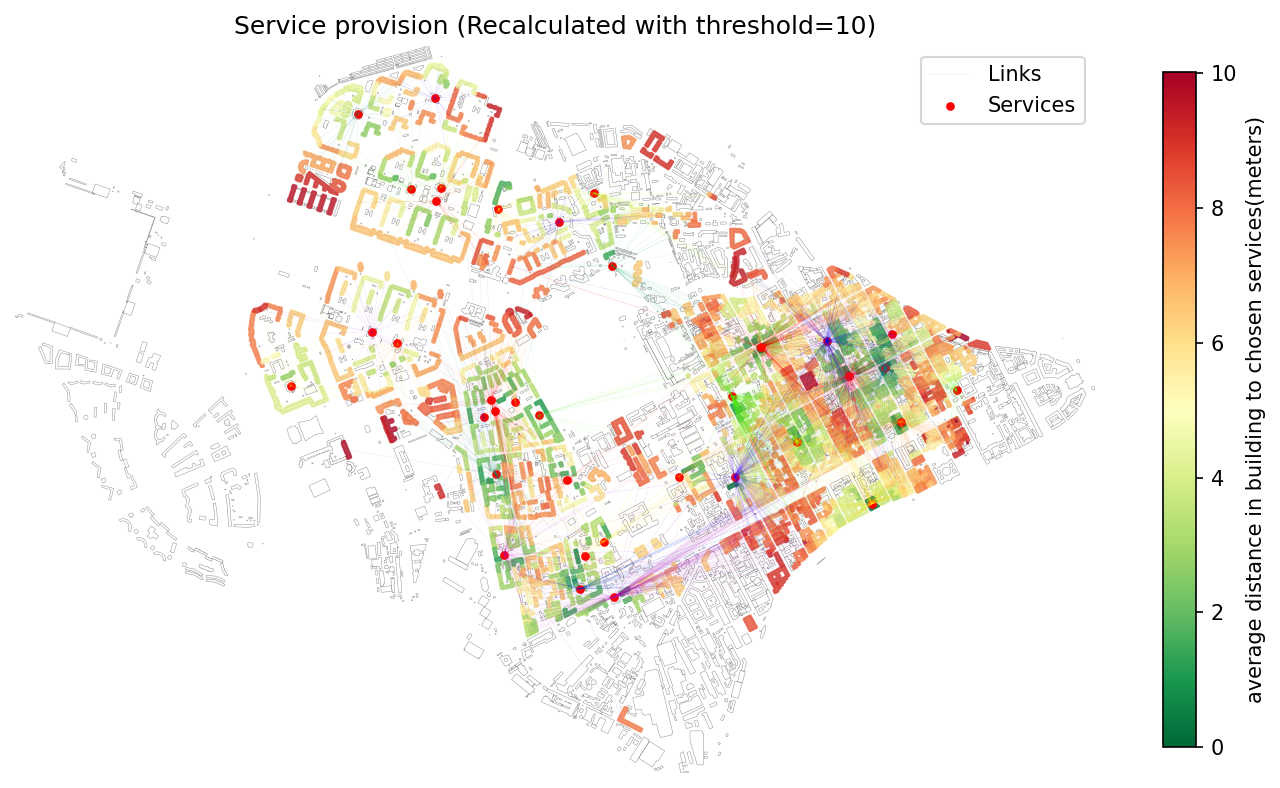 57 |
57 | 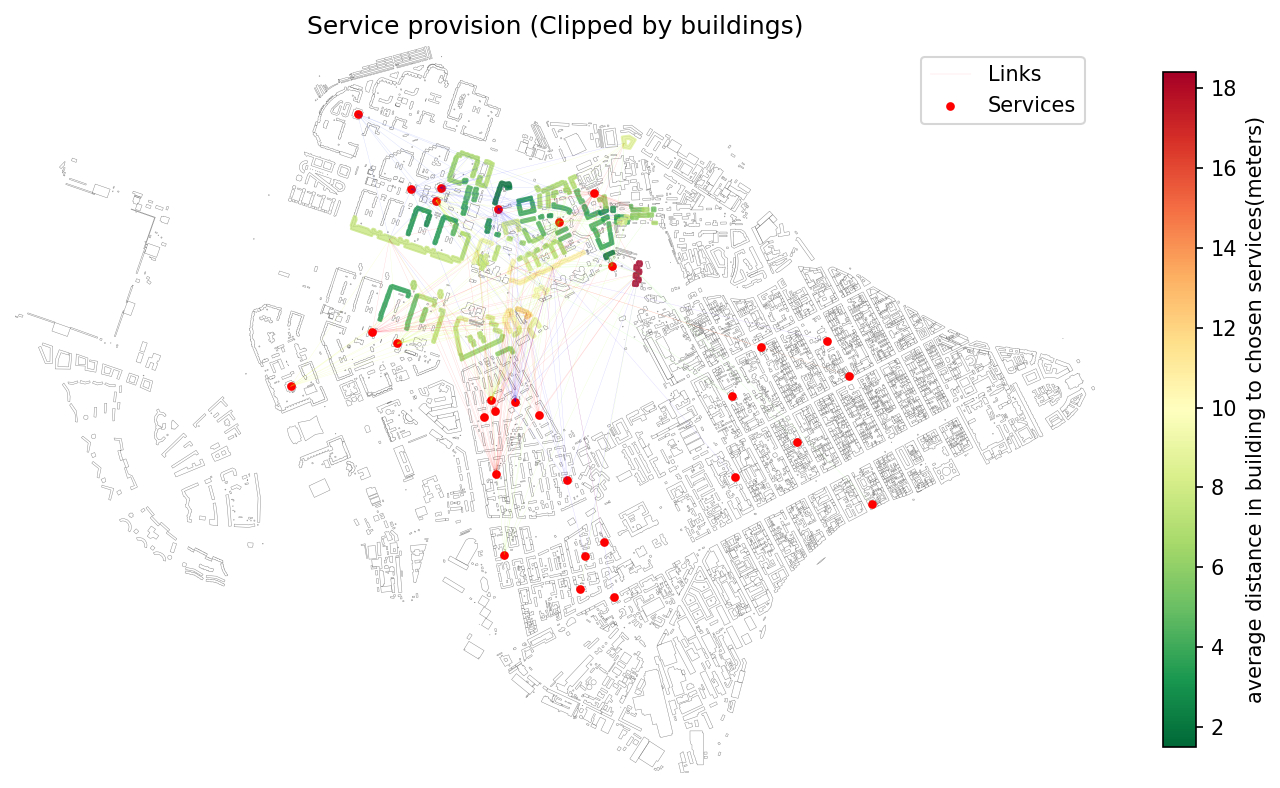 58 |
58 |
59 |
60 | 4. **[Visibility Analysis](./examples/visibility_analysis.ipynb)** — Function for estimating visibility from a given point or multiple points to nearby buildings within a certain distance.
61 | This can be used to assess visual accessibility in urban environments.
62 | The library also includes a **catchment area calculator** for large-scale visibility analysis based on a dense grid of observer points (recommended: ~1000 points spaced 10–20 meters apart).
63 | Points can be generated using a road network and distributed along edges.
64 |
65 | The module includes:
66 | - A **fast approximate method** for large datasets.
67 | - A **accurate method** for detailed local analysis.
68 |
69 |
70 | 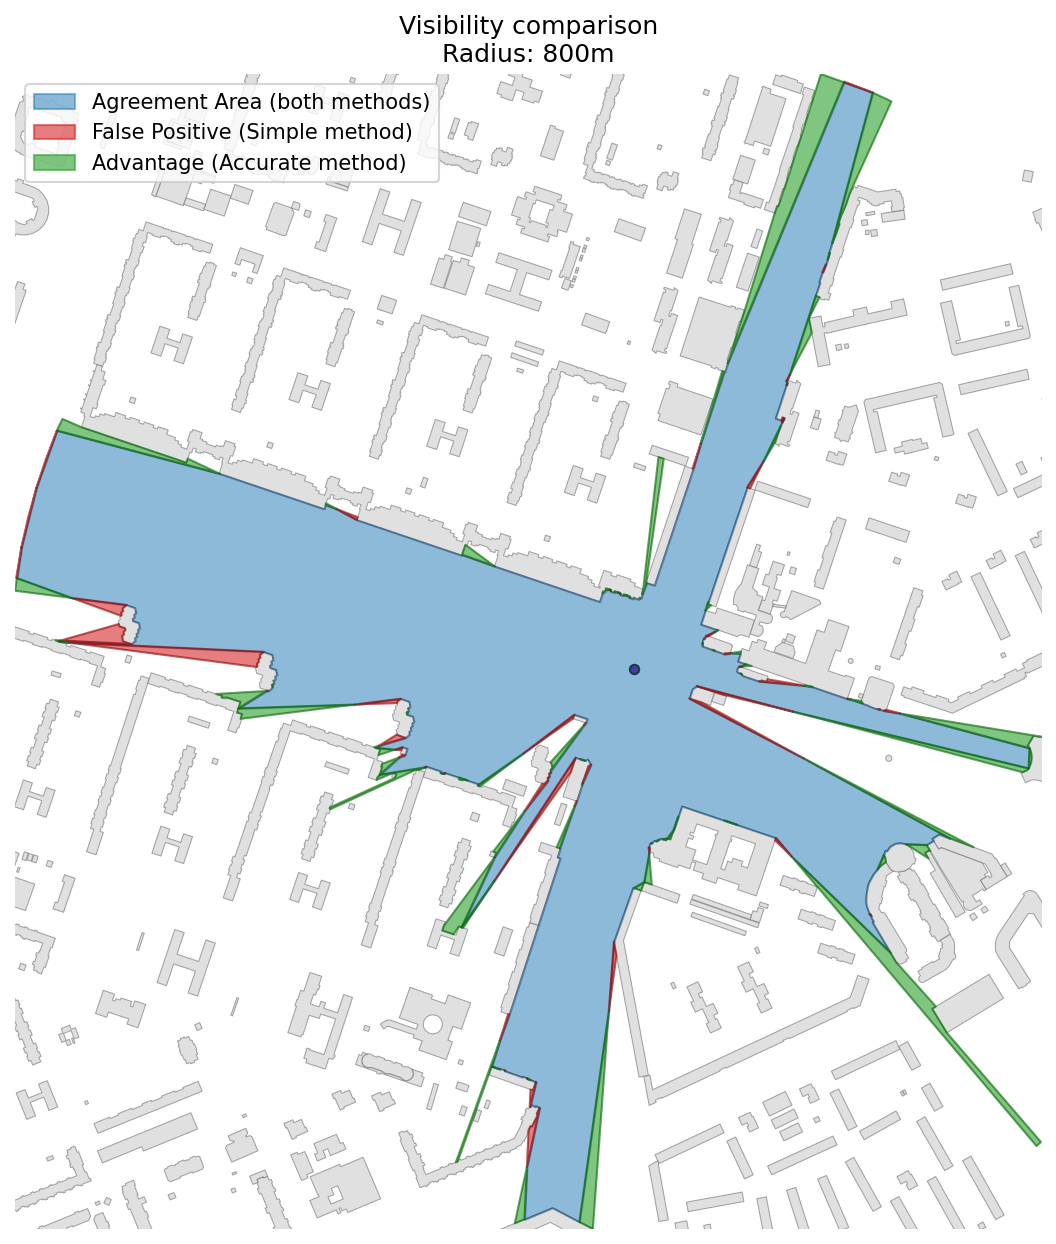 71 |
71 |  72 |
72 |
73 |
74 | 5. **[Noise Simulation](./examples/noise_simulation.ipynb)** — Simulates noise propagation from a set of source points, taking into account **obstacles**, **vegetation**, and **environmental factors**.
75 |
76 | 🔗 **[See detailed explanation in the Wiki](https://github.com/DDonnyy/ObjectNat/wiki/Noise-simulation)**
77 |
78 |
79 | 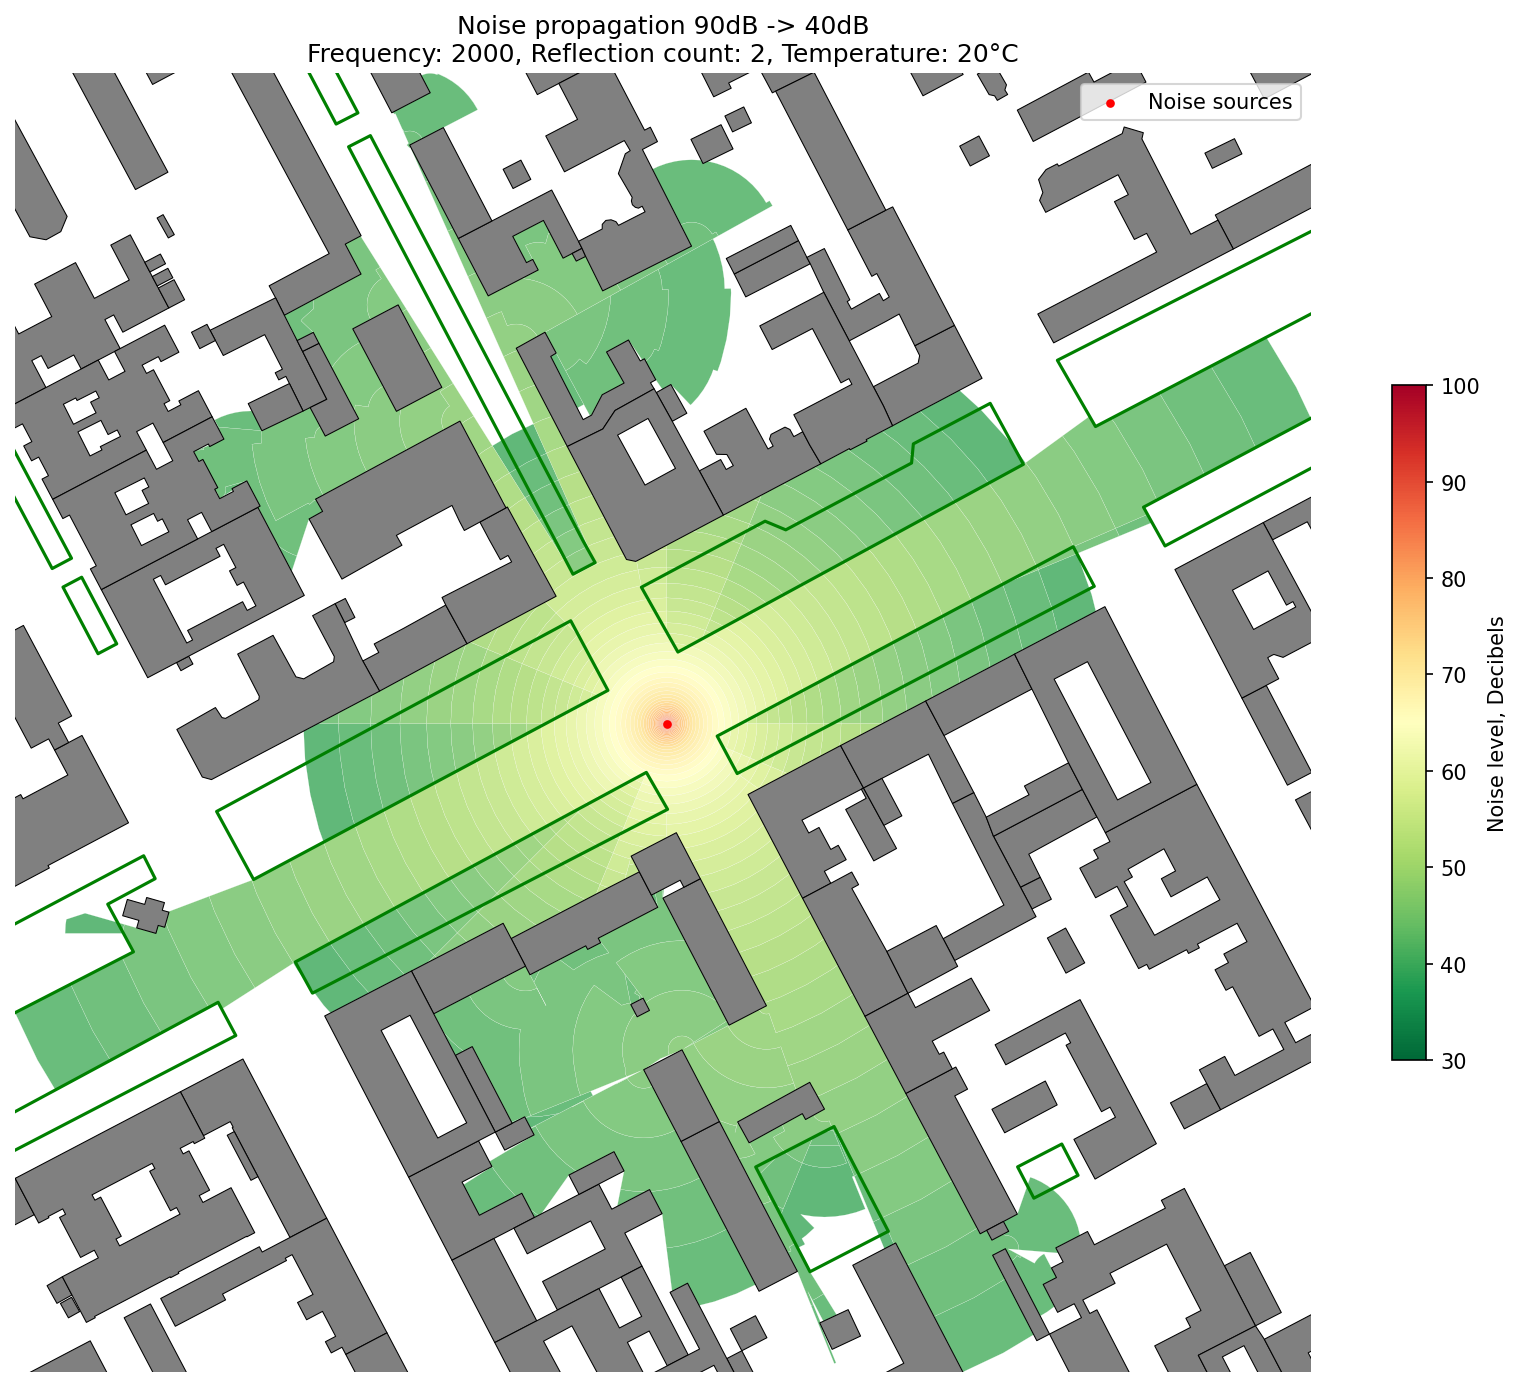 80 |
80 |
81 |
82 |
83 | 6. **[Point Clusterization](./examples/point_clusterization.ipynb)** — Function to generate **cluster polygons** from a set of input points based on:
84 | - Minimum **distance** between points.
85 | - Minimum **number of points** per cluster.
86 |
87 | Additionally, the function can calculate the **relative ratio** of different service types within each cluster, enabling spatial analysis of service composition.
88 |
89 |
90 | 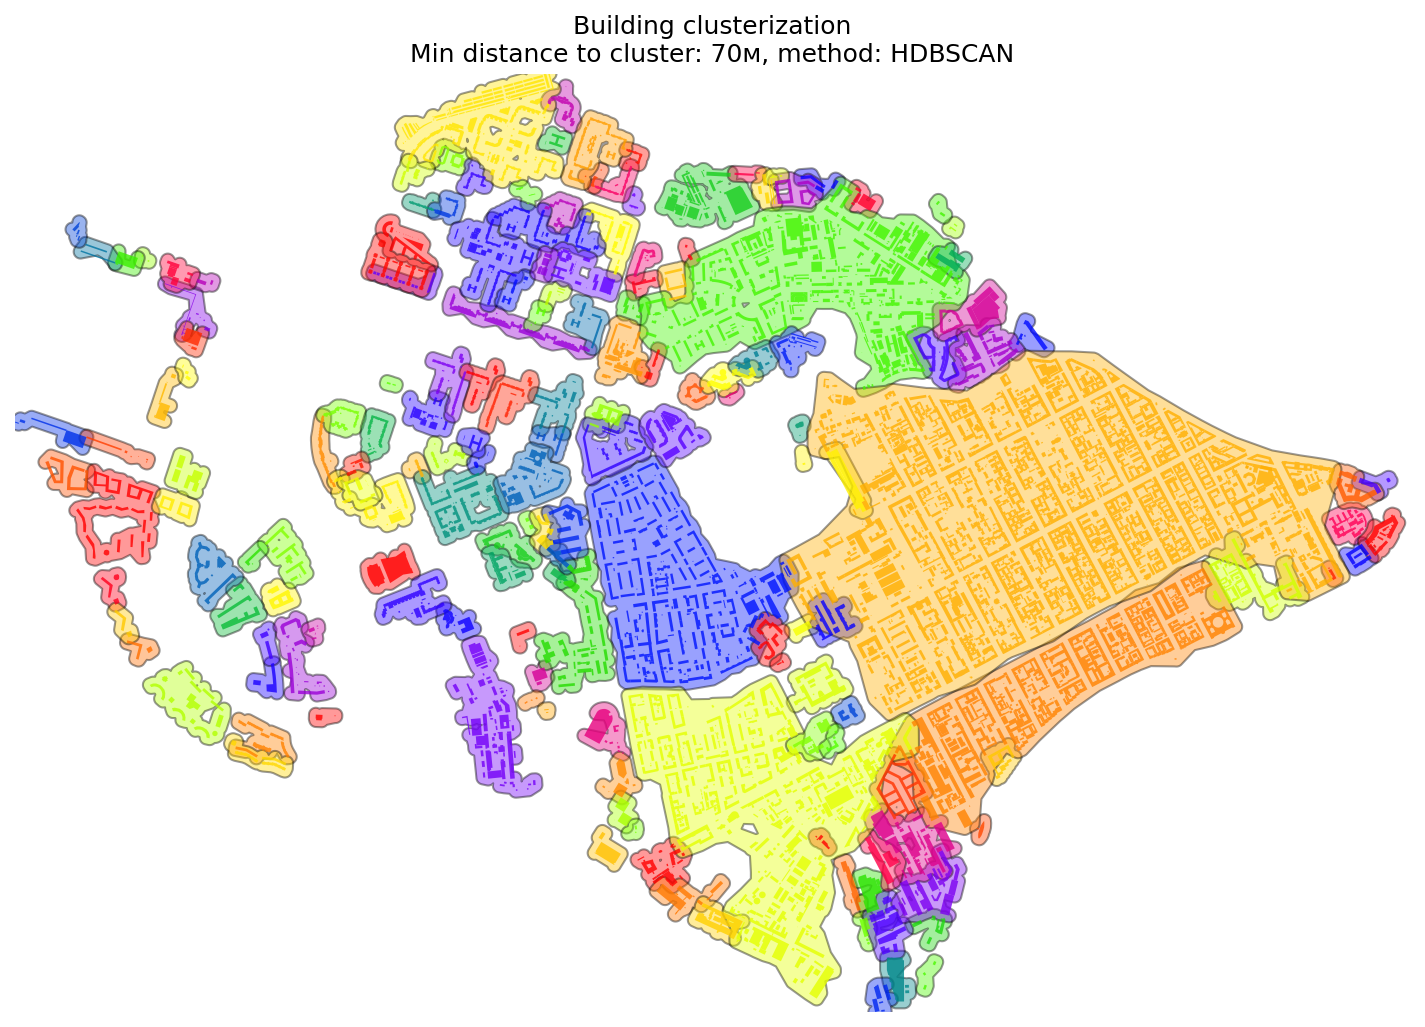 91 |
91 |
92 |
93 | ## City graphs
94 |
95 | To ensure optimal performance of ObjectNat's geospatial analysis functions, it's recommended to utilize urban graphs sourced from the [IduEdu](https://github.com/DDonnyy/IduEdu) library.
96 | **IduEdu** is an open-source Python library designed for the creation and manipulation of complex city networks derived from OpenStreetMap data.
97 |
98 | **IduEdu** can be installed with ``pip``:
99 | ```
100 | pip install IduEdu
101 | ```
102 | ## Installation
103 |
104 | **ObjectNat** can be installed with ``pip``:
105 |
106 | ```
107 | pip install ObjectNat
108 | ```
109 | ### Configuration changes
110 |
111 | ```python
112 | from objectnat import config
113 |
114 | config.change_logger_lvl('INFO') # To mute all debug msgs
115 | config.set_enable_tqdm(False) # To mute all tqdm's progress bars
116 | ```
117 | ## Contacts
118 |
119 | - [NCCR](https://actcognitive.org/) - National Center for Cognitive Research
120 | - [IDU](https://idu.itmo.ru/) - Institute of Design and Urban Studies
121 | - [Natalya Chichkova](https://t.me/nancy_nat) - project manager
122 | - [Danila Oleynikov (Donny)](https://t.me/ddonny_dd) - lead software engineer
123 |
124 | ## Publications
125 |
--------------------------------------------------------------------------------
/README_ru.md:
--------------------------------------------------------------------------------
1 | # ObjectNat
2 |
3 | [](https://github.com/psf/black)
4 | [](https://pypi.org/project/objectnat/)
5 | [](https://github.com/DDonnyy/ObjecNat/actions/workflows/ci_pipeline.yml)
6 | [](https://codecov.io/gh/DDonnyy/ObjectNat)
7 | [](https://opensource.org/licenses/MIT)
8 |
9 |
10 |
11 |
12 |
13 | #### **ObjectNat** — это библиотека с открытым исходным кодом, разработанная командой **IDU** для пространственного анализа.
14 |
15 | ## Функции и как использовать
16 |
17 | 1. **[Изохроны и транспортная доступность](./examples/isochrone_generator.ipynb)** — Изохроны представляют собой области,
18 | достижимые из исходной точки за заданное время по транспортной сети.
19 | Эта функция позволяет анализировать транспортную доступность с использованием графов пешеходного, автомобильного,
20 | общественного транспорта или их комбинации.
21 |
22 | Библиотека поддерживает несколько методов построения изохрон:
23 | - **Базовые изохроны**: отображают одну зону, достижимую за заданное время.
24 | - **Шаговые изохроны**: делят зону доступности на интервалы времени (например, 3, 5, 10 минут).
25 |
26 |
27 |
28 |
29 |
30 |
31 |
32 |
33 |
34 |
35 |
36 |
37 | 2. **[Зоны покрытия](./examples/graph_coverage.ipynb)** — Функция генерации **зон покрытия** от набора исходных точек
38 | с использованием транспортной сети. Вычисляет область, достижимую из каждой точки по **времени в пути** или **дистанции**,
39 | затем строит полигоны с помощью **диаграмм Вороного** и обрезает их по заданной границе, если она указана.
40 |
41 |
42 |
43 |
44 |
45 |
46 |
47 |
48 |
49 |
50 |
51 | 3. **[Анализ обеспеченности сервисами](./examples/calculate_provision.ipynb)** — Функция оценки обеспеченности жилых зданий
52 | и их населения услугами (например, школы, поликлиники), которые имеют ограниченную **вместимость**
53 | и заданный **порог доступности** (в минутах или метрах). Функция моделирует **баланс спроса и предложения**,
54 | оценивая, насколько хорошо услуги удовлетворяют потребности близлежащих зданий в пределах допустимого времени.
55 |
56 | Библиотека также поддерживает:
57 | - **Перерасчёт** текущих результатов при изменении порога времени.
58 | - **Обрезку** результатов анализа по заданной зоне (например, границе района).
59 |
60 |
61 |
62 |
63 |
64 |
65 |
66 | 4. **[Анализ видимости](./examples/visibility_analysis.ipynb)** — Функция оценки видимости от заданной точки или множества
67 | точек до близлежащих зданий в пределах заданного радиуса. Применяется для оценки визуальной доступности в городской среде.
68 | Также реализован модуль для расчёта **зоны охвата** по видимости с использованием плотной сетки наблюдателей (рекомендуется ~1000 точек с шагом 10–20 метров).
69 | Точки можно сгенерировать по транспортной сети и распределить по её рёбрам.
70 |
71 | Модуль включает:
72 | - **Быстрый приближённый метод** для больших объёмов данных.
73 | - **Точный метод** для локального детального анализа.
74 |
75 |
76 |
77 |
78 |
79 |
80 | 5. **[Моделирование шума](./examples/noise_simulation.ipynb)** — Симуляция распространения шума от источников с учётом **препятствий**,
81 | **растительности** и **факторов окружающей среды**.
82 |
83 | 🔗 **[Подробное описание в Wiki](https://github.com/DDonnyy/ObjectNat/wiki/Симуляция-шумового-распространения)**
84 |
85 |
86 |
87 |
88 |
89 | 6. **[Кластеризация точек](./examples/point_clusterization.ipynb)** — Функция построения **кластерных полигонов** по множеству точек на основе:
90 | - Минимального **расстояния** между точками.
91 | - Минимального **числа точек** в кластере.
92 |
93 | Также функция может рассчитывать **соотношение типов услуг** в каждом кластере для пространственного анализа состава услуг.
94 |
95 |
96 |
97 |
98 |
99 | ## Городские графы
100 |
101 | Для достижения оптимальной производительности функций пространственного анализа ObjectNat рекомендуется использовать городские графы,
102 | полученные с помощью библиотеки [IduEdu](https://github.com/DDonnyy/IduEdu).
103 | **IduEdu** — это библиотека на Python с открытым исходным кодом, предназначенная для построения и обработки
104 | сложных городских сетей на основе данных OpenStreetMap.
105 |
106 | **IduEdu** можно установить с помощью ``pip``:
107 | ```
108 | pip install IduEdu
109 | ```
110 |
111 | ## Установка
112 |
113 | **ObjectNat** можно установить с помощью ``pip``:
114 |
115 | ```
116 | pip install ObjectNat
117 | ```
118 |
119 | ### Изменения конфигурации
120 |
121 | ```python
122 | from objectnat import config
123 |
124 | config.change_logger_lvl('INFO') # Чтобы отключить отладочные сообщения
125 | config.set_enable_tqdm(False) # Чтобы отключить прогресс-бары tqdm
126 | ```
127 |
128 | ## Контакты
129 |
130 | - [НЦКР](https://actcognitive.org/) — Национальный центр когнитивных разработок
131 | - [ИДУ](https://idu.itmo.ru/) — Институт дизайна и урбанистики
132 | - [Наталья Чичкова](https://t.me/nancy_nat) — менеджер проекта
133 | - [Данила Олейников (Donny)](https://t.me/ddonny_dd) — ведущий инженер-разработчик
134 |
135 | ## Публикации
136 |
--------------------------------------------------------------------------------
/examples/calculate_adjacency_matrix.ipynb:
--------------------------------------------------------------------------------
1 | {
2 | "cells": [
3 | {
4 | "metadata": {},
5 | "cell_type": "markdown",
6 | "source": [
7 | "## Building-to-Service Travel Time Matrix with Intermodal Graph\n",
8 | "This notebook demonstrates how to compute a time-based adjacency matrix between two GeoDataFrames\n",
9 | "(e.g., buildings and services) using a multimodal transport graph.\n",
10 | "\n",
11 | "The method utilizes the `IduEdu` library to:\n",
12 | "- Construct a multimodal graph (e.g., walk + public transport)\n",
13 | "- Calculate travel time-based adjacency matrix from one GeoDataFrame to another\n",
14 | "\n",
15 | "This matrix can be used in `ObjectNat` for further service provision analysis."
16 | ],
17 | "id": "9ca78071b77f245e"
18 | },
19 | {
20 | "metadata": {},
21 | "cell_type": "code",
22 | "source": [
23 | "# %%\n",
24 | "# Install required packages (uncomment if needed)\n",
25 | "# !pip install iduedu pyarrow"
26 | ],
27 | "id": "a3fd404cc3b83edd",
28 | "outputs": [],
29 | "execution_count": null
30 | },
31 | {
32 | "metadata": {},
33 | "cell_type": "code",
34 | "source": [
35 | "# Import necessary libraries\n",
36 | "from iduedu import get_intermodal_graph, get_adj_matrix_gdf_to_gdf\n",
37 | "import geopandas as gpd\n",
38 | "import pandas as pd\n",
39 | "from shapely.ops import unary_union"
40 | ],
41 | "id": "9a3e15f423bedc31",
42 | "outputs": [],
43 | "execution_count": null
44 | },
45 | {
46 | "metadata": {},
47 | "cell_type": "markdown",
48 | "source": [
49 | "### 1. Load Input Geospatial Data\n",
50 | "Load the GeoDataFrames of buildings (origins) and services (destinations).\n"
51 | ],
52 | "id": "68af599b21a7895d"
53 | },
54 | {
55 | "metadata": {},
56 | "cell_type": "code",
57 | "source": [
58 | "# Read building and service datasets\n",
59 | "buildings = gpd.read_parquet('examples_data/buildings.parquet')\n",
60 | "services = gpd.read_parquet('examples_data/services.parquet')"
61 | ],
62 | "id": "ecaca9093632eb44",
63 | "outputs": [],
64 | "execution_count": null
65 | },
66 | {
67 | "metadata": {},
68 | "cell_type": "markdown",
69 | "source": [
70 | "### 2. Create Coverage Polygon for Graph Download\n",
71 | "Compute a polygon that encompasses both datasets to define the spatial extent for graph download.\n",
72 | "This is done by computing a convex hull over all geometries and buffering it slightly.\n"
73 | ],
74 | "id": "5146507282cd8082"
75 | },
76 | {
77 | "metadata": {},
78 | "cell_type": "code",
79 | "source": [
80 | "polygon = unary_union(\n",
81 | " buildings.to_crs(4326).geometry.to_list() + services.to_crs(4326).geometry.to_list()\n",
82 | ").convex_hull.buffer(0.001)"
83 | ],
84 | "id": "74e684470ea483a1",
85 | "outputs": [],
86 | "execution_count": null
87 | },
88 | {
89 | "metadata": {},
90 | "cell_type": "markdown",
91 | "source": [
92 | "### 3. Download and Clip Intermodal Graph\n",
93 | "Download the intermodal (multi-modal) network graph using the defined polygon.\n",
94 | "This includes walking paths and public transport networks."
95 | ],
96 | "id": "b6b58fffdd714d38"
97 | },
98 | {
99 | "metadata": {},
100 | "cell_type": "code",
101 | "source": [
102 | "# Load multimodal graph clipped to polygon\n",
103 | "G_intermodal = get_intermodal_graph(polygon=polygon, clip_by_bounds=True)"
104 | ],
105 | "id": "1e643d3fdc052876",
106 | "outputs": [],
107 | "execution_count": null
108 | },
109 | {
110 | "metadata": {},
111 | "cell_type": "markdown",
112 | "source": [
113 | "### 4. Compute Adjacency Matrix (Travel Time)\n",
114 | "Calculate a travel-time-based adjacency matrix from buildings to services.\n",
115 | "\n",
116 | "Parameters:\n",
117 | "- `weight`: edge attribute used for cost (e.g., \"time_min\")\n",
118 | "- `threshold`: maximum allowed travel time (in minutes)"
119 | ],
120 | "id": "812757b2e10fe745"
121 | },
122 | {
123 | "metadata": {},
124 | "cell_type": "code",
125 | "source": [
126 | "# Compute travel time matrix (in minutes)\n",
127 | "matrix: pd.DataFrame = get_adj_matrix_gdf_to_gdf(\n",
128 | " gdf_from=buildings,\n",
129 | " gdf_to=services,\n",
130 | " nx_graph=G_intermodal,\n",
131 | " weight=\"time_min\",\n",
132 | " threshold=45\n",
133 | ")"
134 | ],
135 | "id": "f763ed1656707714",
136 | "outputs": [],
137 | "execution_count": null
138 | },
139 | {
140 | "metadata": {},
141 | "cell_type": "markdown",
142 | "source": [
143 | "### 5. Save Adjacency Matrix\n",
144 | "Export the result for further processing, e.g., with `ObjectNat`'s service provision tools."
145 | ],
146 | "id": "8c56b37f6c2f508f"
147 | },
148 | {
149 | "cell_type": "code",
150 | "source": [
151 | "# Save matrix to Parquet format\n",
152 | "matrix.to_parquet('examples_data/matrix_time.parquet')"
153 | ],
154 | "metadata": {},
155 | "id": "371f4607ed8ec9c9",
156 | "outputs": [],
157 | "execution_count": null
158 | }
159 | ],
160 | "metadata": {
161 | "kernelspec": {
162 | "display_name": "Python 3",
163 | "language": "python",
164 | "name": "python3"
165 | },
166 | "language_info": {
167 | "codemirror_mode": {
168 | "name": "ipython",
169 | "version": 2
170 | },
171 | "file_extension": ".py",
172 | "mimetype": "text/x-python",
173 | "name": "python",
174 | "nbconvert_exporter": "python",
175 | "pygments_lexer": "ipython2",
176 | "version": "2.7.6"
177 | }
178 | },
179 | "nbformat": 4,
180 | "nbformat_minor": 5
181 | }
182 |
--------------------------------------------------------------------------------
/examples/calculate_provision.ipynb:
--------------------------------------------------------------------------------
1 | {
2 | "cells": [
3 | {
4 | "metadata": {},
5 | "cell_type": "markdown",
6 | "source": [
7 | "## Service Provision Analysis\n",
8 | "This notebook demonstrates how to analyze service accessibility from buildings using precomputed distances:\n",
9 | "- Compute basic service provision\n",
10 | "- Adjust provision thresholds\n",
11 | "- Clip provision to specific subareas"
12 | ],
13 | "id": "8412dc445f8b77de"
14 | },
15 | {
16 | "metadata": {},
17 | "cell_type": "code",
18 | "source": [
19 | "# Import necessary libraries\n",
20 | "from objectnat import get_service_provision, recalculate_links, clip_provision\n",
21 | "import geopandas as gpd\n",
22 | "import pandas as pd"
23 | ],
24 | "id": "8bd677b0f6ad1c1",
25 | "outputs": [],
26 | "execution_count": null
27 | },
28 | {
29 | "metadata": {},
30 | "cell_type": "markdown",
31 | "source": [
32 | "### 1. Load Input Data\n",
33 | "Load buildings, services, and an adjacency matrix of distances or travel times between them. All layers are reprojected to UTM (EPSG:32636) for consistency.\n"
34 | ],
35 | "id": "133bb319e2fd5ec3"
36 | },
37 | {
38 | "metadata": {},
39 | "cell_type": "code",
40 | "source": [
41 | "# Load datasets\n",
42 | "buildings = gpd.read_parquet(\"examples_data/buildings.parquet\")\n",
43 | "services = gpd.read_parquet(\"examples_data/services.parquet\")\n",
44 | "adjacency_matrix = pd.read_parquet(\"examples_data/matrix_time.parquet\")"
45 | ],
46 | "id": "4f2059500cec3f8b",
47 | "outputs": [],
48 | "execution_count": null
49 | },
50 | {
51 | "metadata": {},
52 | "cell_type": "markdown",
53 | "source": [
54 | "### 2. Compute Initial Service Provision\n",
55 | "Compute how well buildings are served by nearby services using the `get_service_provision()` function.\n",
56 | "The `threshold` parameter defines the maximum distance or time for service availability."
57 | ],
58 | "id": "3072fc796157aab5"
59 | },
60 | {
61 | "metadata": {},
62 | "cell_type": "code",
63 | "source": [
64 | "# Compute service provision using a threshold of 10 (e.g., minutes)\n",
65 | "buildings_prov, services_prov, links_prov = get_service_provision(\n",
66 | " buildings=buildings,\n",
67 | " services=services,\n",
68 | " adjacency_matrix=adjacency_matrix,\n",
69 | " threshold=10\n",
70 | ")\n",
71 | "# This returns updated buildings, services, and links GeoDataFrames with provision status and metrics."
72 | ],
73 | "id": "5495c4c389c1d17",
74 | "outputs": [],
75 | "execution_count": null
76 | },
77 | {
78 | "metadata": {},
79 | "cell_type": "markdown",
80 | "source": [
81 | "### 3. Visualize Service Provision\n",
82 | "Use an interactive map to inspect which buildings are well-served and which are underserved.\n"
83 | ],
84 | "id": "f267ccc667dea286"
85 | },
86 | {
87 | "metadata": {},
88 | "cell_type": "code",
89 | "source": [
90 | "# Visualize provision by average distance to services\n",
91 | "m = buildings_prov.reset_index().explore(column=\"avg_dist\", cmap=\"RdYlGn_r\", tiles=\"CartoDB positron\")\n",
92 | "\n",
93 | "# Overlay service locations (in red)\n",
94 | "services_prov.explore(m=m, color=\"red\")\n",
95 | "\n",
96 | "# Uncomment to show service links (color-coded by service index)\n",
97 | "# links_prov.explore(m=m, column='service_index', cmap='prism', style_kwds={'opacity': 0.5})"
98 | ],
99 | "id": "dbdacc6bef92bc83",
100 | "outputs": [],
101 | "execution_count": null
102 | },
103 | {
104 | "metadata": {},
105 | "cell_type": "markdown",
106 | "source": [
107 | "### 4. Recalculate Provision with New Threshold\n",
108 | "Update the service provision based on a new threshold (e.g., longer acceptable walking or travel time).\n"
109 | ],
110 | "id": "9f941a72e57af722"
111 | },
112 | {
113 | "metadata": {},
114 | "cell_type": "code",
115 | "source": [
116 | "# Determine color scaling from original results\n",
117 | "vmax = buildings_prov['avg_dist'].max()\n",
118 | "\n",
119 | "# Recompute provision using a threshold of 15\n",
120 | "buildings_prov2, services_prov2, links_prov2 = recalculate_links(\n",
121 | " buildings_prov,\n",
122 | " services_prov,\n",
123 | " links_prov,\n",
124 | " new_max_dist=15\n",
125 | ")\n",
126 | "\n",
127 | "# Visualize updated provision with consistent color scale\n",
128 | "m2 = buildings_prov2.reset_index().explore(column=\"avg_dist\", cmap=\"RdYlGn_r\", tiles=\"CartoDB positron\", vmax=vmax)\n",
129 | "\n",
130 | "services_prov2.explore(m=m2, color=\"red\")\n",
131 | "# Uncomment to show service links (color-coded by service index)\n",
132 | "# links_prov2.explore(m=m2, column='service_index', cmap='prism', style_kwds={'opacity': 0.5})"
133 | ],
134 | "id": "ddeb3b14e59993",
135 | "outputs": [],
136 | "execution_count": null
137 | },
138 | {
139 | "metadata": {},
140 | "cell_type": "markdown",
141 | "source": [
142 | "### 5. Clip Provision to a Subarea\n",
143 | "Limit the analysis to a specific geographic region using any interested area.\n"
144 | ],
145 | "id": "4d8eaec54833393"
146 | },
147 | {
148 | "metadata": {},
149 | "cell_type": "code",
150 | "source": [
151 | "# Select a few buildings and buffer them to define a clipping area\n",
152 | "clip_area = buildings.iloc[500:503].copy()\n",
153 | "clip_area[\"geometry\"] = clip_area.geometry.buffer(500)\n",
154 | "\n",
155 | "# Clip provision to selected subarea\n",
156 | "buildings_prov_clipped, services_prov_clipped, links_prov_clipped = clip_provision(\n",
157 | " buildings_prov2,\n",
158 | " services_prov2,\n",
159 | " links_prov2,\n",
160 | " selection_zone=clip_area\n",
161 | ")\n",
162 | "\n",
163 | "# Visualize the clipped results\n",
164 | "m3 = buildings_prov_clipped.reset_index().explore(column=\"avg_dist\", cmap=\"RdYlGn_r\", tiles=\"CartoDB positron\",\n",
165 | " vmax=vmax)\n",
166 | "\n",
167 | "\n",
168 | "services_prov_clipped.explore(m=m3, color=\"red\")\n",
169 | "# Uncomment to show service links (color-coded by service index)\n",
170 | "# links_prov_clipped.explore(m=m3, column='service_index', cmap='prism', style_kwds={'opacity': 0.5})"
171 | ],
172 | "id": "950866ceb91eb982",
173 | "outputs": [],
174 | "execution_count": null
175 | }
176 | ],
177 | "metadata": {
178 | "kernelspec": {
179 | "display_name": "Python 3",
180 | "language": "python",
181 | "name": "python3"
182 | },
183 | "language_info": {
184 | "codemirror_mode": {
185 | "name": "ipython",
186 | "version": 2
187 | },
188 | "file_extension": ".py",
189 | "mimetype": "text/x-python",
190 | "name": "python",
191 | "nbconvert_exporter": "python",
192 | "pygments_lexer": "ipython2",
193 | "version": "2.7.6"
194 | }
195 | },
196 | "nbformat": 4,
197 | "nbformat_minor": 5
198 | }
199 |
--------------------------------------------------------------------------------
/examples/coverage_zones.ipynb:
--------------------------------------------------------------------------------
1 | {
2 | "cells": [
3 | {
4 | "metadata": {},
5 | "cell_type": "markdown",
6 | "source": [
7 | "## Graph Coverage Analysis for Service Points\n",
8 | "\n",
9 | "This notebook demonstrates how to calculate coverage zones from service points through a multimodal transportation network using Dijkstra's algorithm and Voronoi diagrams."
10 | ],
11 | "id": "4dc8b5b9755684aa"
12 | },
13 | {
14 | "metadata": {},
15 | "cell_type": "code",
16 | "source": [
17 | "# Install required packages (uncomment if needed)\n",
18 | "# !pip install iduedu pyarrow objectnat"
19 | ],
20 | "id": "db56d2861ab407be",
21 | "outputs": [],
22 | "execution_count": null
23 | },
24 | {
25 | "metadata": {},
26 | "cell_type": "code",
27 | "source": [
28 | "# Import dependencies\n",
29 | "from iduedu import get_intermodal_graph, get_boundary\n",
30 | "import geopandas as gpd\n",
31 | "from objectnat import get_graph_coverage,get_stepped_graph_coverage,get_radius_coverage"
32 | ],
33 | "id": "d568e9b461c6086a",
34 | "outputs": [],
35 | "execution_count": null
36 | },
37 | {
38 | "metadata": {},
39 | "cell_type": "markdown",
40 | "source": [
41 | "### 1. Load Transportation Network\n",
42 | "First, we retrieve the multimodal graph (roads, public transport, etc.) for a specified region using its OSM ID."
43 | ],
44 | "id": "5084078ebb6beef2"
45 | },
46 | {
47 | "cell_type": "code",
48 | "id": "initial_id",
49 | "metadata": {
50 | "collapsed": true
51 | },
52 | "source": [
53 | "# Get city boundary and transportation network\n",
54 | "poly = get_boundary(osm_id=1114252) # Example OSM ID for a city\n",
55 | "G_intermodal = get_intermodal_graph(polygon=poly, clip_by_bounds=True)"
56 | ],
57 | "outputs": [],
58 | "execution_count": null
59 | },
60 | {
61 | "metadata": {},
62 | "cell_type": "markdown",
63 | "source": [
64 | "### 2. Load Service Points\n",
65 | "These represent locations (e.g., healthcare facilities, schools) for which we want to calculate coverage zones."
66 | ],
67 | "id": "18c5a199616284b0"
68 | },
69 | {
70 | "metadata": {},
71 | "cell_type": "code",
72 | "source": [
73 | "# Load service points (replace with your actual data path)\n",
74 | "services = gpd.read_parquet('examples_data/services.parquet')"
75 | ],
76 | "id": "dc4ae5fbd2374af4",
77 | "outputs": [],
78 | "execution_count": null
79 | },
80 | {
81 | "metadata": {},
82 | "cell_type": "markdown",
83 | "source": [
84 | "### 3. Calculate Coverage by Distance\n",
85 | "Creates service areas based on maximum travel distance (800 meters in this example)."
86 | ],
87 | "id": "9e3ebbd07107a149"
88 | },
89 | {
90 | "metadata": {},
91 | "cell_type": "code",
92 | "source": [
93 | "# Calculate coverage zones by distance (800m cutoff)\n",
94 | "result_length = get_graph_coverage(\n",
95 | " gdf_to=services,\n",
96 | " nx_graph=G_intermodal,\n",
97 | " weight_type=\"length_meter\",\n",
98 | " weight_value_cutoff=800\n",
99 | ")\n",
100 | "\n",
101 | "# Visualize results\n",
102 | "result_length.explore(column='name', tiles='CartoDB Positron')"
103 | ],
104 | "id": "239ae7c0ed8604a1",
105 | "outputs": [],
106 | "execution_count": null
107 | },
108 | {
109 | "metadata": {},
110 | "cell_type": "markdown",
111 | "source": [
112 | "### 4. Calculate Coverage by Travel Time\n",
113 | "Creates service areas based on maximum travel time (10 minutes in this example), clipped to the city boundary."
114 | ],
115 | "id": "5f8d6888bdbf4716"
116 | },
117 | {
118 | "metadata": {},
119 | "cell_type": "code",
120 | "source": [
121 | "# Prepare zone boundary\n",
122 | "zone = gpd.GeoDataFrame(geometry=[poly], crs=4326)\n",
123 | "\n",
124 | "# Calculate coverage zones by time (10min cutoff)\n",
125 | "result_time = get_graph_coverage(\n",
126 | " gdf_to=services,\n",
127 | " nx_graph=G_intermodal,\n",
128 | " weight_type=\"time_min\",\n",
129 | " weight_value_cutoff=10,\n",
130 | " zone=zone\n",
131 | ")\n",
132 | "# Visualize results\n",
133 | "result_time.explore(column='name', tiles='CartoDB Positron')"
134 | ],
135 | "id": "3fe99dad99d0c066",
136 | "outputs": [],
137 | "execution_count": null
138 | },
139 | {
140 | "metadata": {},
141 | "cell_type": "markdown",
142 | "source": [
143 | "### Key Parameters Explained:\n",
144 | "- `weight_type`: \n",
145 | " - `\"length_meter\"` for distance-based coverage\n",
146 | " - `\"time_min\"` for time-based coverage\n",
147 | "- `weight_value_cutoff`: Maximum travel distance/time threshold\n",
148 | "- `zone` (optional): Boundary polygon to clip results"
149 | ],
150 | "id": "ac980132a47eb200"
151 | },
152 | {
153 | "metadata": {},
154 | "cell_type": "markdown",
155 | "source": [
156 | "### 5. Calculate stepped Coverage by Travel Time\n",
157 | "This method divides the total travel time threshold into steps (e.g. every 2 minutes), creating incremental zones.\n",
158 | "Useful for visualizing service accessibility gradients.\n",
159 | "\n",
160 | "You can choose the visualization method:\n",
161 | "- `\"voronoi\"`: polygons based on proximity to reachable network nodes\n",
162 | "- `\"separate\"`: independent buffer zones for each interval\n"
163 | ],
164 | "id": "f6965db2be4d9e73"
165 | },
166 | {
167 | "metadata": {},
168 | "cell_type": "code",
169 | "source": [
170 | "stepped_cov_voronoi = get_stepped_graph_coverage(\n",
171 | " gdf_to=services,\n",
172 | " nx_graph=G_intermodal,\n",
173 | " weight_type=\"time_min\",\n",
174 | " step_type='voronoi',\n",
175 | " weight_value_cutoff=15,\n",
176 | " step=2,\n",
177 | " zone=zone\n",
178 | ")\n",
179 | "# Visualize stepped coverage\n",
180 | "stepped_cov_voronoi.explore(column='dist', tiles='CartoDB Positron')"
181 | ],
182 | "id": "4f8d216ed2c9b472",
183 | "outputs": [],
184 | "execution_count": null
185 | },
186 | {
187 | "metadata": {},
188 | "cell_type": "code",
189 | "source": [
190 | "stepped_cov_voronoi = get_stepped_graph_coverage(\n",
191 | " gdf_to=services,\n",
192 | " nx_graph=G_intermodal,\n",
193 | " weight_type=\"time_min\",\n",
194 | " step_type='separate',\n",
195 | " weight_value_cutoff=15,\n",
196 | " step=2,\n",
197 | ")\n",
198 | "# Visualize stepped coverage\n",
199 | "stepped_cov_voronoi.explore(column='dist', tiles='CartoDB Positron',vmin=0)"
200 | ],
201 | "id": "208ee93a136558ac",
202 | "outputs": [],
203 | "execution_count": null
204 | },
205 | {
206 | "metadata": {},
207 | "cell_type": "markdown",
208 | "source": [
209 | "### 6. Calculate Radius-Based Coverage\n",
210 | "If a transport network is unavailable or unnecessary, use simple circular buffers around service points.\n",
211 | "\n",
212 | "This method creates geometric buffers with specified radius (e.g., 500 meters)."
213 | ],
214 | "id": "53ecdf19492c5b74"
215 | },
216 | {
217 | "metadata": {},
218 | "cell_type": "code",
219 | "source": [
220 | "radius_cov = get_radius_coverage(gdf_from=services, radius=500)\n",
221 | "# Visualize radius coverage\n",
222 | "radius_cov.explore(column='name', tiles='CartoDB Positron')"
223 | ],
224 | "id": "2908f41d0603713f",
225 | "outputs": [],
226 | "execution_count": null
227 | }
228 | ],
229 | "metadata": {
230 | "kernelspec": {
231 | "display_name": "Python 3",
232 | "language": "python",
233 | "name": "python3"
234 | },
235 | "language_info": {
236 | "codemirror_mode": {
237 | "name": "ipython",
238 | "version": 2
239 | },
240 | "file_extension": ".py",
241 | "mimetype": "text/x-python",
242 | "name": "python",
243 | "nbconvert_exporter": "python",
244 | "pygments_lexer": "ipython2",
245 | "version": "2.7.6"
246 | }
247 | },
248 | "nbformat": 4,
249 | "nbformat_minor": 5
250 | }
251 |
--------------------------------------------------------------------------------
/examples/examples_data/buildings.parquet:
--------------------------------------------------------------------------------
https://raw.githubusercontent.com/DDonnyy/ObjectNat/3c29a7b7c0ea5c944fe2f98c368fcfc99b51bf96/examples/examples_data/buildings.parquet
--------------------------------------------------------------------------------
/examples/examples_data/matrix_time.parquet:
--------------------------------------------------------------------------------
https://raw.githubusercontent.com/DDonnyy/ObjectNat/3c29a7b7c0ea5c944fe2f98c368fcfc99b51bf96/examples/examples_data/matrix_time.parquet
--------------------------------------------------------------------------------
/examples/examples_data/services.parquet:
--------------------------------------------------------------------------------
https://raw.githubusercontent.com/DDonnyy/ObjectNat/3c29a7b7c0ea5c944fe2f98c368fcfc99b51bf96/examples/examples_data/services.parquet
--------------------------------------------------------------------------------
/examples/examples_data/trees.parquet:
--------------------------------------------------------------------------------
https://raw.githubusercontent.com/DDonnyy/ObjectNat/3c29a7b7c0ea5c944fe2f98c368fcfc99b51bf96/examples/examples_data/trees.parquet
--------------------------------------------------------------------------------
/examples/isochrone_generator.ipynb:
--------------------------------------------------------------------------------
1 | {
2 | "cells": [
3 | {
4 | "metadata": {},
5 | "cell_type": "markdown",
6 | "source": [
7 | "## Isochrone Analysis from Points of Interest\n",
8 | "This notebook demonstrates how to generate accessibility isochrones from single or multiple points using different methods:\n",
9 | "- Simple `radius` and `ways` isochrones\n",
10 | "- Stepped isochrones with customizable intervals"
11 | ],
12 | "id": "fa4563c984470740"
13 | },
14 | {
15 | "metadata": {},
16 | "cell_type": "code",
17 | "source": [
18 | "# Install required packages (uncomment if needed)\n",
19 | "# !pip install objectnat iduedu"
20 | ],
21 | "id": "9e7d002c63864de6",
22 | "outputs": [],
23 | "execution_count": null
24 | },
25 | {
26 | "metadata": {},
27 | "cell_type": "code",
28 | "source": [
29 | "# Import necessary libraries\n",
30 | "from iduedu import get_intermodal_graph, get_boundary\n",
31 | "import geopandas as gpd\n",
32 | "from shapely import Point\n",
33 | "from objectnat import get_accessibility_isochrones, get_accessibility_isochrone_stepped"
34 | ],
35 | "id": "ebe2025fab286b4e",
36 | "outputs": [],
37 | "execution_count": null
38 | },
39 | {
40 | "metadata": {},
41 | "cell_type": "markdown",
42 | "source": [
43 | "### 1. Load Intermodal Graph\n",
44 | "Load a multimodal transportation graph (roads, public transport, etc.) for a specific region using its OSM ID."
45 | ],
46 | "id": "494425a561aa50ec"
47 | },
48 | {
49 | "cell_type": "code",
50 | "source": [
51 | "# Load boundary and graph for a specific region using OSM ID 1114252.\n",
52 | "poly = get_boundary(osm_id=1114252)\n",
53 | "G_intermodal = get_intermodal_graph(polygon=poly, clip_by_bounds=True)"
54 | ],
55 | "metadata": {
56 | "collapsed": false
57 | },
58 | "id": "df20dec8ac67c8da",
59 | "outputs": [],
60 | "execution_count": null
61 | },
62 | {
63 | "metadata": {},
64 | "cell_type": "markdown",
65 | "source": [
66 | "### 2. Create Points of Interest\n",
67 | "Define one or more source points from which isochrones will be generated."
68 | ],
69 | "id": "917bf19ff192faac"
70 | },
71 | {
72 | "metadata": {},
73 | "cell_type": "code",
74 | "source": [
75 | "# Define a single point of interest\n",
76 | "point = gpd.GeoDataFrame(geometry=[Point(30.27060176, 59.93546846)], crs=4326)"
77 | ],
78 | "id": "f6045b6fa1bc7c37",
79 | "outputs": [],
80 | "execution_count": null
81 | },
82 | {
83 | "metadata": {},
84 | "cell_type": "markdown",
85 | "source": [
86 | "### 3. Generate Radius Isochrones\n",
87 | "Create circular isochrones using a travel time threshold (e.g. 10 minutes)."
88 | ],
89 | "id": "7127732b199acab6"
90 | },
91 | {
92 | "metadata": {},
93 | "cell_type": "code",
94 | "source": [
95 | "isochrones_radius, stops_r, routes_r = get_accessibility_isochrones(\n",
96 | " isochrone_type='radius',\n",
97 | " points=point,\n",
98 | " weight_type=\"time_min\",\n",
99 | " weight_value=10,\n",
100 | " nx_graph=G_intermodal\n",
101 | ")\n",
102 | "\n",
103 | "# Visualize\n",
104 | "m = isochrones_radius.explore(tiles='CartoDB Positron')\n",
105 | "stops_r.explore(m=m)\n",
106 | "routes_r.explore(m=m, column='type')"
107 | ],
108 | "id": "f71a6d15e3dc7eed",
109 | "outputs": [],
110 | "execution_count": null
111 | },
112 | {
113 | "metadata": {},
114 | "cell_type": "markdown",
115 | "source": [
116 | "### 4. Generate Ways Isochrones\n",
117 | "Create road network-based polygons representing reachable areas within a time or distance threshold."
118 | ],
119 | "id": "1e9a3026b7537291"
120 | },
121 | {
122 | "metadata": {},
123 | "cell_type": "code",
124 | "source": [
125 | "isochrones_ways, stops_w, routes_w = get_accessibility_isochrones(\n",
126 | " isochrone_type='ways',\n",
127 | " points=point,\n",
128 | " weight_type=\"time_min\",\n",
129 | " weight_value=10,\n",
130 | " nx_graph=G_intermodal\n",
131 | ")\n",
132 | "\n",
133 | "# Visualize\n",
134 | "m = isochrones_ways.explore(tiles='CartoDB Positron')\n",
135 | "stops_w.explore(m=m)\n",
136 | "routes_w.explore(m=m, column='type')"
137 | ],
138 | "id": "b4bd257c0bafea8a",
139 | "outputs": [],
140 | "execution_count": null
141 | },
142 | {
143 | "metadata": {},
144 | "cell_type": "markdown",
145 | "source": [
146 | "### 5. Compare Isochrone Types\n",
147 | "Overlay both types of isochrones to compare coverage."
148 | ],
149 | "id": "38499d16fdc1991e"
150 | },
151 | {
152 | "metadata": {},
153 | "cell_type": "code",
154 | "source": [
155 | "m = isochrones_radius.explore(tiles='CartoDB Positron', color='blue', name='Radius')\n",
156 | "isochrones_ways.explore(m=m, color='red', name='Ways')"
157 | ],
158 | "id": "3565f5290601d78b",
159 | "outputs": [],
160 | "execution_count": null
161 | },
162 | {
163 | "metadata": {},
164 | "cell_type": "markdown",
165 | "source": [
166 | "### 6. Generate Stepped Isochrones (Radius)\n",
167 | "Create concentric buffer zones with stepped intervals (e.g. every 3 minutes).\n"
168 | ],
169 | "id": "739b0d17e9be6e02"
170 | },
171 | {
172 | "metadata": {},
173 | "cell_type": "code",
174 | "source": [
175 | "stepped_radius, stops_s1, routes_s1 = get_accessibility_isochrone_stepped(\n",
176 | " isochrone_type='radius',\n",
177 | " point=point,\n",
178 | " weight_type=\"time_min\",\n",
179 | " weight_value=15,\n",
180 | " nx_graph=G_intermodal,\n",
181 | " step=3\n",
182 | ")\n",
183 | "\n",
184 | "stepped_radius.explore(tiles='CartoDB Positron', column='dist')\n"
185 | ],
186 | "id": "8e0792ac42ed50d4",
187 | "outputs": [],
188 | "execution_count": null
189 | },
190 | {
191 | "metadata": {},
192 | "cell_type": "markdown",
193 | "source": [
194 | "### 7. Generate Stepped Isochrones (Ways)\n",
195 | "Create layered polygons in the road network with custom intervals (e.g. every 3 minutes).\n"
196 | ],
197 | "id": "5320bc04bdc43135"
198 | },
199 | {
200 | "metadata": {},
201 | "cell_type": "code",
202 | "source": [
203 | "stepped_ways, stops_s2, routes_s2 = get_accessibility_isochrone_stepped(\n",
204 | " isochrone_type='ways',\n",
205 | " point=point,\n",
206 | " weight_type=\"time_min\",\n",
207 | " weight_value=15,\n",
208 | " nx_graph=G_intermodal,\n",
209 | " step=3\n",
210 | ")\n",
211 | "stepped_ways.explore(tiles='CartoDB Positron', column='dist')"
212 | ],
213 | "id": "adb0b77046b2301e",
214 | "outputs": [],
215 | "execution_count": null
216 | },
217 | {
218 | "metadata": {},
219 | "cell_type": "markdown",
220 | "source": [
221 | "### 8. Generate Stepped Isochrones (Separate)\n",
222 | "Create distinct buffer rings for each interval."
223 | ],
224 | "id": "350e096ecc82ec2f"
225 | },
226 | {
227 | "metadata": {},
228 | "cell_type": "code",
229 | "source": [
230 | "stepped_separate, stops_s3, routes_s3 = get_accessibility_isochrone_stepped(\n",
231 | " isochrone_type='separate',\n",
232 | " point=point,\n",
233 | " weight_type=\"time_min\",\n",
234 | " weight_value=10,\n",
235 | " nx_graph=G_intermodal,\n",
236 | " step=2\n",
237 | ")\n",
238 | "\n",
239 | "stepped_separate.explore(tiles='CartoDB Positron', column='dist')"
240 | ],
241 | "id": "ae3cd6bd7384375e",
242 | "outputs": [],
243 | "execution_count": null
244 | },
245 | {
246 | "metadata": {},
247 | "cell_type": "markdown",
248 | "source": [
249 | "### Key Parameter Summary:\n",
250 | "- `isochrone_type`: `'radius'`, `'ways'`, or `'separate'`\n",
251 | "- `weight_type`: `'time_min'` (minutes) or `'length_meter'` (meters)\n",
252 | "- `weight_value`: total cutoff (e.g. 10 minutes)\n",
253 | "- `step`: interval size for stepped isochrones (optional)\n",
254 | "- Additional: `buffer_factor`, `road_buffer_size`"
255 | ],
256 | "id": "5881fcd1fe589d48"
257 | },
258 | {
259 | "metadata": {},
260 | "cell_type": "markdown",
261 | "source": "## Animation for stepped isochrones:",
262 | "id": "dbdc88b0d14ec294"
263 | },
264 | {
265 | "metadata": {},
266 | "cell_type": "code",
267 | "source": [
268 | "from objectnat.methods.utils.graph_utils import graph_to_gdf\n",
269 | "import matplotlib.pyplot as plt\n",
270 | "from matplotlib.animation import FuncAnimation\n",
271 | "from shapely import Point\n",
272 | "import geopandas as gpd\n",
273 | "from objectnat import get_accessibility_isochrone_stepped\n",
274 | "\n",
275 | "edges = graph_to_gdf(G_intermodal, nodes=False)\n",
276 | "point = gpd.GeoDataFrame(geometry=[Point(30.27060176, 59.93546846)], crs=4326).to_crs(edges.crs)\n",
277 | "bbox = gpd.GeoDataFrame(geometry=[poly], crs=4326).to_crs(edges.crs)\n",
278 | "\n",
279 | "type_colors = {\n",
280 | " 'walk': '#a3a3a3',\n",
281 | " 'bus': '#1f77b4',\n",
282 | " 'trolleybus': '#2ca02c',\n",
283 | " 'tram': '#ff7f0e',\n",
284 | " 'subway': '#9467bd',\n",
285 | " 'boarding': '#8c564b'\n",
286 | "}\n",
287 | "\n",
288 | "edges['color'] = edges['type'].map(type_colors)\n",
289 | "\n",
290 | "steps = [0.1, 0.5, 1, 2, 3, 4, 5]\n",
291 | "\n",
292 | "fig, ax = plt.subplots(figsize=(10, 8), dpi=150)\n",
293 | "plt.subplots_adjust(left=0.05, right=0.95, top=0.95, bottom=0.05)\n",
294 | "\n",
295 | "edges_plot = edges.plot(ax=ax, color=edges['color'], alpha=0.5, linewidth=0.1, legend=True)\n",
296 | "bbox.boundary.plot(ax=ax, color='black', linestyle='--', linewidth=1)\n",
297 | "point.plot(ax=ax, color='red', markersize=50)\n",
298 | "ax.set_axis_off()\n",
299 | "\n",
300 | "\n",
301 | "def update(step):\n",
302 | " for coll in ax.collections:\n",
303 | " if coll.get_label() == 'isochrone':\n",
304 | " coll.remove()\n",
305 | "\n",
306 | " result = get_accessibility_isochrone_stepped(\n",
307 | " isochrone_type='separate',\n",
308 | " point=point,\n",
309 | " weight_type=\"time_min\",\n",
310 | " weight_value=15,\n",
311 | " nx_graph=G_intermodal,\n",
312 | " step=step\n",
313 | " )\n",
314 | " result.plot(ax=ax, alpha=1, label='isochrone', column='dist', legend=False)\n",
315 | " ax.set_title(f'Isochrone with step = {step} minutes')\n",
316 | "\n",
317 | "\n",
318 | "ani = FuncAnimation(\n",
319 | " fig,\n",
320 | " update,\n",
321 | " frames=steps,\n",
322 | " repeat=True,\n",
323 | " interval=2000\n",
324 | ")\n",
325 | "\n",
326 | "ani.save('isochrone_animation.gif', writer='pillow', fps=1)"
327 | ],
328 | "id": "ac24793342e314e1",
329 | "outputs": [],
330 | "execution_count": null
331 | }
332 | ],
333 | "metadata": {
334 | "kernelspec": {
335 | "display_name": "Python 3",
336 | "language": "python",
337 | "name": "python3"
338 | },
339 | "language_info": {
340 | "codemirror_mode": {
341 | "name": "ipython",
342 | "version": 2
343 | },
344 | "file_extension": ".py",
345 | "mimetype": "text/x-python",
346 | "name": "python",
347 | "nbconvert_exporter": "python",
348 | "pygments_lexer": "ipython2",
349 | "version": "2.7.6"
350 | }
351 | },
352 | "nbformat": 4,
353 | "nbformat_minor": 5
354 | }
355 |
--------------------------------------------------------------------------------
/examples/noise_simulation.ipynb:
--------------------------------------------------------------------------------
1 | {
2 | "cells": [
3 | {
4 | "metadata": {},
5 | "cell_type": "markdown",
6 | "source": [
7 | "## Noise Propagation Simulation\n",
8 | "This section demonstrates how to simulate the propagation of noise in an urban environment using a point source,\n",
9 | "obstacles (e.g., buildings), and optional vegetation (e.g., trees). The `simulate_noise` function models the \n",
10 | "attenuation of noise based on geometry, absorption, reflections, and environmental parameters.\n"
11 | ],
12 | "id": "dcd797a362c7bfcc"
13 | },
14 | {
15 | "metadata": {},
16 | "cell_type": "code",
17 | "source": [
18 | "# Import necessary libraries\n",
19 | "import geopandas as gpd\n",
20 | "from shapely.geometry import Point\n",
21 | "from objectnat import simulate_noise"
22 | ],
23 | "id": "c9d41c96e9e29d25",
24 | "outputs": [],
25 | "execution_count": null
26 | },
27 | {
28 | "metadata": {},
29 | "cell_type": "markdown",
30 | "source": "### 1. Define Noise Source\n",
31 | "id": "d17c9f5c9d0a1e32"
32 | },
33 | {
34 | "metadata": {},
35 | "cell_type": "code",
36 | "source": [
37 | "# Define the starting point(s) of the noise source, and their parameters \n",
38 | "\n",
39 | "start_p = gpd.GeoDataFrame(data=[[90, 2000], [80, 200]],\n",
40 | " geometry=[Point(30.27060176, 59.93546846), Point(30.27213917, 59.93575345)],\n",
41 | " columns=['source_noise_db', 'geometric_mean_freq_hz'], crs=4326)"
42 | ],
43 | "id": "26de7874d08a9edc",
44 | "outputs": [],
45 | "execution_count": null
46 | },
47 | {
48 | "metadata": {},
49 | "cell_type": "markdown",
50 | "source": [
51 | "### 2. Load Obstacle and Tree Data\n",
52 | "Load obstacle (building) and tree layers from local files, and project them to the same CRS used for simulation.\n"
53 | ],
54 | "id": "2b92b561b2fc0613"
55 | },
56 | {
57 | "metadata": {},
58 | "cell_type": "code",
59 | "source": [
60 | "# Load obstacle geometries (e.g., buildings)\n",
61 | "obstacles = gpd.read_parquet('examples_data/buildings.parquet')\n",
62 | "\n",
63 | "# Load vegetation geometries (e.g., trees)\n",
64 | "trees = gpd.read_parquet('examples_data/trees.parquet')"
65 | ],
66 | "id": "2d28aed860ee113f",
67 | "outputs": [],
68 | "execution_count": null
69 | },
70 | {
71 | "metadata": {},
72 | "cell_type": "markdown",
73 | "source": [
74 | "### 3. Run Noise Simulation\n",
75 | "Simulate the propagation of noise using a point source with specified parameters. The simulation accounts for:\n",
76 | "- Obstacles and their absorption\n",
77 | "- Tree-based scattering\n",
78 | "- Environmental factors like air temperature\n",
79 | "- Sound reflection and attenuation with distance\n"
80 | ],
81 | "id": "cee8754172564e3d"
82 | },
83 | {
84 | "metadata": {},
85 | "cell_type": "code",
86 | "source": [
87 | "# Run the simulation\n",
88 | "noise = simulate_noise(\n",
89 | " source_points=start_p,\n",
90 | " obstacles=obstacles,\n",
91 | " # Alternatively use these args if not specified per-point\n",
92 | " # source_noise_db=90, # Initial noise level in decibels\n",
93 | " # geometric_mean_freq_hz=2000, # Frequency of the noise signal\n",
94 | " standart_absorb_ratio=0.05, # Default absorption coefficient for obstacles\n",
95 | " trees=trees, # Vegetation data\n",
96 | " tree_resolution=4, # Resolution of vegetation scattering\n",
97 | " air_temperature=20, # Air temperature in °C\n",
98 | " target_noise_db=40, # Simulation stops at this minimum noise level\n",
99 | " db_sim_step=1, # Step size in decibel for simulation granularity\n",
100 | " reflection_n=2, # Number of allowed reflections\n",
101 | " dead_area_r=5 # Radius of reflection-free dead zones (in meters)\n",
102 | ")\n"
103 | ],
104 | "id": "39e652ae619945c0",
105 | "outputs": [],
106 | "execution_count": null
107 | },
108 | {
109 | "metadata": {},
110 | "cell_type": "markdown",
111 | "source": [
112 | "### 4. Visualize the Result\n",
113 | "Visualize the noise propagation result on a map using a color scale that reflects noise levels (in dB).\n"
114 | ],
115 | "id": "7b5484096b6d206d"
116 | },
117 | {
118 | "metadata": {},
119 | "cell_type": "code",
120 | "source": [
121 | "# Visualize the result using the 'plasma' colormap and a fixed lower bound\n",
122 | "noise.explore(column='noise_level', cmap='plasma', vmin=40)"
123 | ],
124 | "id": "b747a45d091122cd",
125 | "outputs": [],
126 | "execution_count": null
127 | },
128 | {
129 | "metadata": {},
130 | "cell_type": "markdown",
131 | "source": "### Section for GIF creation",
132 | "id": "31cb77ec9dc93fc3"
133 | },
134 | {
135 | "metadata": {},
136 | "cell_type": "code",
137 | "outputs": [],
138 | "execution_count": null,
139 | "source": [
140 | "import matplotlib.pyplot as plt\n",
141 | "import matplotlib.animation as animation\n",
142 | "\n",
143 | "import numpy as np\n",
144 | "from matplotlib import cm\n",
145 | "\n",
146 | "\n",
147 | "def create_noise_animation(gdf_noise, gdf_obstacles, start_p, buffer_p, gdf_trees=None,\n",
148 | " output_file=\"noise_animation.gif\"):\n",
149 | " if gdf_trees is None:\n",
150 | " gdf_trees = gpd.GeoDataFrame()\n",
151 | "\n",
152 | " bounds = start_p.unary_union.buffer(buffer_p).bounds\n",
153 | " minx, miny, maxx, maxy = bounds\n",
154 | " vmin = gdf_noise['noise_level'].min()\n",
155 | " vmax = gdf_noise['noise_level'].max()\n",
156 | " cmap = cm.plasma\n",
157 | "\n",
158 | " fig, ax = plt.subplots(figsize=(10, 10))\n",
159 | " plt.subplots_adjust(left=0.05, right=0.95, top=0.95, bottom=0.05)\n",
160 | "\n",
161 | " def update_frame(frame):\n",
162 | " ax.clear()\n",
163 | " ax.set_xlim(minx, maxx)\n",
164 | " ax.set_ylim(miny, maxy)\n",
165 | "\n",
166 | " gdf_trees.plot(ax=ax, edgecolor='green', facecolor='none', linewidth=3)\n",
167 | " gdf_obstacles.plot(ax=ax, facecolor='gray')\n",
168 | "\n",
169 | " gdf_noise[gdf_noise['noise_level'] > frame].plot(ax=ax, column='noise_level', cmap=cmap, alpha=0.8, vmin=vmin,\n",
170 | " vmax=vmax)\n",
171 | " gdf_noise[gdf_noise['noise_level'] == frame].plot(ax=ax, column='noise_level', cmap=cmap, alpha=1, vmin=vmin,\n",
172 | " vmax=vmax)\n",
173 | " gdf_noise[gdf_noise['noise_level'] == frame - 1].plot(ax=ax, column='noise_level', cmap=cmap, alpha=0.5,\n",
174 | " vmin=vmin, vmax=vmax)\n",
175 | " gdf_noise[gdf_noise['noise_level'] < frame - 1].plot(ax=ax, column='noise_level', cmap=cmap, alpha=0.3,\n",
176 | " vmin=vmin, vmax=vmax)\n",
177 | "\n",
178 | " ax.set_title(f\"Noise Level: {frame} dB\", fontsize=20)\n",
179 | " ax.set_axis_off()\n",
180 | "\n",
181 | " frames = np.arange(gdf_noise['noise_level'].max(), gdf_noise['noise_level'].min() - 1, -1)\n",
182 | " ani = animation.FuncAnimation(fig, update_frame, frames=frames, repeat=False)\n",
183 | " ani.save(output_file, writer='imagemagick', fps=15)\n",
184 | "\n",
185 | " plt.close()\n",
186 | "\n",
187 | "\n",
188 | "# Call the function to create the noise animation, using the noise, obstacles, and trees data\n",
189 | "# Fill in the buffer_p parameter close to the value specified in the logs when running the simulation.\n",
190 | "create_noise_animation(noise, obstacles, start_p, 350, trees)\n"
191 | ],
192 | "id": "8266509e1bd32c7"
193 | }
194 | ],
195 | "metadata": {
196 | "kernelspec": {
197 | "display_name": "Python 3",
198 | "language": "python",
199 | "name": "python3"
200 | },
201 | "language_info": {
202 | "codemirror_mode": {
203 | "name": "ipython",
204 | "version": 2
205 | },
206 | "file_extension": ".py",
207 | "mimetype": "text/x-python",
208 | "name": "python",
209 | "nbconvert_exporter": "python",
210 | "pygments_lexer": "ipython2",
211 | "version": "2.7.6"
212 | }
213 | },
214 | "nbformat": 4,
215 | "nbformat_minor": 5
216 | }
217 |
--------------------------------------------------------------------------------
/examples/point_clusterization.ipynb:
--------------------------------------------------------------------------------
1 | {
2 | "cells": [
3 | {
4 | "metadata": {},
5 | "cell_type": "markdown",
6 | "source": [
7 | "## Spatial Clustering of GeoDataFrame into Polygons\n",
8 | "This example demonstrates how to cluster spatial point data (e.g., buildings or services) into polygons using density-based algorithms:\n",
9 | "- DBSCAN or HDBSCAN methods\n",
10 | "- Parameters for minimum distance and minimum points per cluster"
11 | ],
12 | "id": "cf34b03e60843e6a"
13 | },
14 | {
15 | "metadata": {},
16 | "cell_type": "code",
17 | "source": [
18 | "# Import necessary libraries\n",
19 | "from objectnat import get_clusters_polygon\n",
20 | "import geopandas as gpd"
21 | ],
22 | "id": "1a1dbf25992ecf52",
23 | "outputs": [],
24 | "execution_count": null
25 | },
26 | {
27 | "metadata": {},
28 | "cell_type": "markdown",
29 | "source": [
30 | "### 1. Load Point Dataset\n",
31 | "Load a set of points (e.g., buildings) for spatial clustering.\n"
32 | ],
33 | "id": "fb6c09592d642382"
34 | },
35 | {
36 | "metadata": {},
37 | "cell_type": "code",
38 | "source": [
39 | "# Load building data\n",
40 | "buildings = gpd.read_parquet('examples_data/buildings.parquet')"
41 | ],
42 | "id": "a4e1407403d83325",
43 | "outputs": [],
44 | "execution_count": null
45 | },
46 | {
47 | "metadata": {},
48 | "cell_type": "markdown",
49 | "source": [
50 | " ### 2. Perform Clustering and Create Cluster Polygons\n",
51 | " Use the `get_clusters_polygon()` function to cluster points into groups based on spatial proximity.\n",
52 | " \n",
53 | " Parameters:\n",
54 | " - `min_dist`: maximum distance between neighboring points (e.g., 20 meters)\n",
55 | " - `min_point`: minimum number of points to form a cluster (e.g., 10)\n",
56 | " - `method`: clustering algorithm ('DBSCAN' or 'HDBSCAN')"
57 | ],
58 | "id": "9149bdc20488bbe5"
59 | },
60 | {
61 | "metadata": {},
62 | "cell_type": "code",
63 | "source": [
64 | "# Apply clustering with DBSCAN\n",
65 | "clusters, buildings_clustered = get_clusters_polygon(\n",
66 | " points=buildings,\n",
67 | " min_dist=70,\n",
68 | " min_point=2,\n",
69 | " method='DBSCAN'\n",
70 | ")\n",
71 | "# Show cluster polygons\n",
72 | "m = clusters.explore()\n",
73 | "\n",
74 | "# Optional: show clustered buildings colored by cluster ID\n",
75 | "# buildings_clustered.explore(m=m, column='cluster', categorical=True)\n",
76 | "m"
77 | ],
78 | "id": "f990273f2f2e26c",
79 | "outputs": [],
80 | "execution_count": null
81 | }
82 | ],
83 | "metadata": {
84 | "kernelspec": {
85 | "display_name": "Python 3",
86 | "language": "python",
87 | "name": "python3"
88 | },
89 | "language_info": {
90 | "codemirror_mode": {
91 | "name": "ipython",
92 | "version": 2
93 | },
94 | "file_extension": ".py",
95 | "mimetype": "text/x-python",
96 | "name": "python",
97 | "nbconvert_exporter": "python",
98 | "pygments_lexer": "ipython2",
99 | "version": "2.7.6"
100 | }
101 | },
102 | "nbformat": 4,
103 | "nbformat_minor": 5
104 | }
105 |
--------------------------------------------------------------------------------
/examples/visibility_analysis.ipynb:
--------------------------------------------------------------------------------
1 | {
2 | "cells": [
3 | {
4 | "metadata": {},
5 | "cell_type": "markdown",
6 | "source": [
7 | "## Line-of-Sight Visibility Analysis\n",
8 | "This notebook demonstrates how to compute visible areas from a viewpoint or multiple points using:\n",
9 | "- Fast approximate visibility (suitable for quick overviews)\n",
10 | "- Accurate visibility analysis (respecting occlusions)\n",
11 | "- Parallelized visibility from multiple locations"
12 | ],
13 | "id": "f4c531a4c9e094ec"
14 | },
15 | {
16 | "metadata": {},
17 | "cell_type": "code",
18 | "source": [
19 | "# Import necessary libraries\n",
20 | "from objectnat import get_visibility, get_visibility_accurate, get_visibilities_from_points\n",
21 | "import geopandas as gpd\n",
22 | "from shapely.geometry import Point"
23 | ],
24 | "id": "7b840bc7edf14b2c",
25 | "outputs": [],
26 | "execution_count": null
27 | },
28 | {
29 | "metadata": {},
30 | "cell_type": "markdown",
31 | "source": [
32 | "### 1. Load Obstacle Data\n",
33 | "Load a building layer representing line-of-sight obstacles. This dataset is used to compute occlusions in the urban environment.\n"
34 | ],
35 | "id": "1afa4218134b2c84"
36 | },
37 | {
38 | "metadata": {},
39 | "cell_type": "code",
40 | "source": [
41 | "# Load buildings as obstacles\n",
42 | "obstacles = gpd.read_parquet('examples_data/buildings.parquet')"
43 | ],
44 | "id": "588dc80a1b941474",
45 | "outputs": [],
46 | "execution_count": null
47 | },
48 | {
49 | "metadata": {},
50 | "cell_type": "markdown",
51 | "source": [
52 | "### 2. Define Viewpoint\n",
53 | "Specify the observation point from which visibility will be computed. Coordinates must match the CRS of the obstacles dataset.\n"
54 | ],
55 | "id": "c7d345277339355a"
56 | },
57 | {
58 | "metadata": {},
59 | "cell_type": "code",
60 | "source": [
61 | "# Define a single viewpoint in WGS 84\n",
62 | "point_from = gpd.GeoDataFrame(geometry=[Point(30.2312112, 59.9482336)], crs=4326)"
63 | ],
64 | "id": "784128c4f7c5fe89",
65 | "outputs": [],
66 | "execution_count": null
67 | },
68 | {
69 | "metadata": {},
70 | "cell_type": "markdown",
71 | "source": [
72 | "### 3. Fast Visibility Calculation\n",
73 | "Compute visibility using a fast, approximate method. This is suitable for real-time feedback or exploratory analysis.\n",
74 | "**Note:** May produce artifacts (e.g., visibility behind walls).\n"
75 | ],
76 | "id": "a8026dc4e3dfba19"
77 | },
78 | {
79 | "metadata": {},
80 | "cell_type": "code",
81 | "source": [
82 | "# Fast visibility (less accurate)\n",
83 | "result_fast = get_visibility(point_from, obstacles, view_distance=500)\n",
84 | "# Computes visibility polygon from the viewpoint with a 500-meter radius using low-resolution simulation."
85 | ],
86 | "id": "8797859dfe469ace",
87 | "outputs": [],
88 | "execution_count": null
89 | },
90 | {
91 | "metadata": {},
92 | "cell_type": "markdown",
93 | "source": [
94 | "### 4. Accurate Visibility Calculation\n",
95 | "Use the more precise `get_visibility_accurate()` function, which simulates occlusion and limited sightlines.\n",
96 | "This method is slower but produces more reliable results.\n"
97 | ],
98 | "id": "ebc68021e8caed4f"
99 | },
100 | {
101 | "metadata": {},
102 | "cell_type": "code",
103 | "source": [
104 | "# Accurate visibility (includes occlusion and bottleneck modeling)\n",
105 | "result_accurate = get_visibility_accurate(point_from, obstacles, view_distance=500)\n",
106 | "# Simulates realistic visibility by tracing around buildings and respecting occlusions."
107 | ],
108 | "id": "4c08935e3e1bf3ca",
109 | "outputs": [],
110 | "execution_count": null
111 | },
112 | {
113 | "metadata": {},
114 | "cell_type": "markdown",
115 | "source": [
116 | "### 5. Visualization\n",
117 | "Visualize obstacles and both visibility methods on an interactive map using GeoPandas.\n"
118 | ],
119 | "id": "e1fdf25b75fbe716"
120 | },
121 | {
122 | "metadata": {},
123 | "cell_type": "code",
124 | "source": [
125 | "# Accurate visibility polygon in green\n",
126 | "m = result_accurate.explore( color='Green', tiles='CartoDB positron')\n",
127 | "# Add buildings\n",
128 | "obstacles.explore(m=m,color='lightgray')\n",
129 | "# Add fast visibility polygon in red\n",
130 | "result_fast.explore(m=m, color='red')\n",
131 | "# Add viewpoint in purple\n",
132 | "point_from.explore(m=m, color='purple')"
133 | ],
134 | "id": "26c72acea424b17",
135 | "outputs": [],
136 | "execution_count": null
137 | },
138 | {
139 | "metadata": {},
140 | "cell_type": "markdown",
141 | "source": [
142 | "### 6. Visibility from Multiple Viewpoints (Parallelized)\n",
143 | "For batch visibility simulation, use `get_visibilities_from_points()` with multiple locations.\n",
144 | "The computation is performed in parallel using multiprocessing."
145 | ],
146 | "id": "e1b243c10ab80704"
147 | },
148 | {
149 | "metadata": {},
150 | "cell_type": "code",
151 | "source": [
152 | "from objectnat import get_visibilities_from_points\n",
153 | "\n",
154 | "obstacles = gpd.read_parquet('examples_data/buildings.parquet')\n",
155 | "points = gpd.GeoDataFrame(\n",
156 | " geometry=[Point(30.27060176, 59.93546846), Point(30.29586657, 59.94410918), Point(30.2312112, 59.9482336)],\n",
157 | " crs=4326)\n",
158 | "\n",
159 | "local_crs = obstacles.estimate_utm_crs()\n",
160 | "obstacles.to_crs(local_crs, inplace=True)\n",
161 | "points.to_crs(local_crs, inplace=True)\n",
162 | "\n",
163 | "result = get_visibilities_from_points(points, obstacles, 500)\n",
164 | "# Calculating visibility from each point in the 'points' GeoDataFrame with a view distance of 500 units.\n",
165 | "# This method uses multiprocessing for better performance when dealing with multiple points.\n",
166 | "\n",
167 | "gpd.GeoDataFrame(geometry=result, crs=local_crs).explore()"
168 | ],
169 | "id": "82bab1238ec83288",
170 | "outputs": [],
171 | "execution_count": null
172 | },
173 | {
174 | "metadata": {},
175 | "cell_type": "markdown",
176 | "source": [
177 | "## Calculate visibility catchment area (multiproseccing)"
178 | ],
179 | "id": "f9aff770aa8f63bb"
180 | },
181 | {
182 | "cell_type": "code",
183 | "id": "initial_id",
184 | "metadata": {
185 | "collapsed": true
186 | },
187 | "source": [
188 | "\n",
189 | "import pandas as pd\n",
190 | "import geopandas as gpd\n",
191 | "from objectnat import calculate_visibility_catchment_area\n",
192 | "\n",
193 | "# Load data for buildings, points, woods, and bridges\n",
194 | "builds = gpd.read_file('builds.geojson').to_crs(32636)\n",
195 | "points = gpd.read_file('distributed_points.geojson').to_crs(32636)\n",
196 | "woods = gpd.read_file('woods.geojson').to_crs(32636)\n",
197 | "bridges = gpd.read_file('bridges.geojson').to_crs(32636)\n",
198 | "\n",
199 | "view_dist = 1000\n",
200 | "# Setting the visibility distance (catchment radius) to 1000 units.\n",
201 | "\n",
202 | "obstacles = gpd.GeoDataFrame(pd.concat([builds, woods, bridges], ignore_index=True), geometry='geometry',\n",
203 | " crs=32636)\n",
204 | "# Combining the GeoDataFrames for buildings, woods, and bridges into a single GeoDataFrame that serves as obstacles \n",
205 | "# to be considered in the visibility calculation.\n",
206 | "\n",
207 | "res = calculate_visibility_catchment_area(points, obstacles, view_dist)\n",
208 | "# Calculating the visibility catchment area for the given points, considering the obstacles and the view distance.\n",
209 | "# The result is a GeoDataFrame containing the catchment areas."
210 | ],
211 | "outputs": [],
212 | "execution_count": null
213 | },
214 | {
215 | "metadata": {},
216 | "cell_type": "code",
217 | "source": [
218 | "res.explore(\n",
219 | " column=\"factor_normalized\",\n",
220 | " categorical=False,\n",
221 | " cmap=\"plasma\",\n",
222 | " legend=True,\n",
223 | ")\n",
224 | "# Visualizing the catchment areas on an interactive map, using the 'factor_normalized' column to color the areas\n",
225 | "# with a 'plasma' colormap. A legend is displayed to show the range of values."
226 | ],
227 | "id": "4485c645267fa0ea",
228 | "outputs": [],
229 | "execution_count": null
230 | }
231 | ],
232 | "metadata": {
233 | "kernelspec": {
234 | "display_name": "Python 3",
235 | "language": "python",
236 | "name": "python3"
237 | },
238 | "language_info": {
239 | "codemirror_mode": {
240 | "name": "ipython",
241 | "version": 2
242 | },
243 | "file_extension": ".py",
244 | "mimetype": "text/x-python",
245 | "name": "python",
246 | "nbconvert_exporter": "python",
247 | "pygments_lexer": "ipython2",
248 | "version": "2.7.6"
249 | }
250 | },
251 | "nbformat": 4,
252 | "nbformat_minor": 5
253 | }
254 |
--------------------------------------------------------------------------------
/pyproject.toml:
--------------------------------------------------------------------------------
1 | [tool.poetry]
2 | name = "ObjectNat"
3 | version = "1.1.0"
4 | description = "ObjectNat is an open-source library created for geospatial analysis created by IDU team"
5 | license = "BSD-3-Clause"
6 | authors = ["DDonnyy <63115678+DDonnyy@users.noreply.github.com>"]
7 | readme = "README.md"
8 |
9 | packages = [{ include = "objectnat", from = "src" }]
10 |
11 | [tool.poetry.dependencies]
12 | python = ">=3.10,<3.13"
13 | numpy = "^2.1.3"
14 | pandas = "^2.2.0"
15 | geopandas = "^1.0.1"
16 | tqdm = "^4.66.2"
17 | pandarallel = "^1.6.5"
18 | networkx = "^3.4.2"
19 | scikit-learn = "^1.4.0"
20 | loguru = "^0.7.3"
21 |
22 |
23 | [tool.poetry.group.dev.dependencies]
24 | iduedu = "^0.5.0"
25 | pyarrow = "^19.0.1"
26 | black = "^24.2.0"
27 | pylint = "^3.0.3"
28 | isort = "^5.13.2"
29 | jupyter = "^1.0.0"
30 | pytest = "^8.3.5"
31 | pytest-cov = "^6.0.0"
32 | pre-commit = "^4.2.0"
33 | folium = "^0.19.5"
34 | matplotlib = "^3.10.1"
35 | mapclassify = "^2.8.1"
36 |
37 | [build-system]
38 | requires = ["poetry-core"]
39 | build-backend = "poetry.core.masonry.api"
40 |
41 | [tool.black]
42 | line-length = 120
43 | target-version = ['py310']
44 |
45 | [tool.pylint.format]
46 | max-line-length = 120
47 | expected-line-ending-format = "LF"
48 | max-locals = 20
49 | extension-pkg-allow-list = ["networkit"]
50 | disable = [
51 | "duplicate-code",
52 | "too-many-positional-arguments",
53 | "missing-module-docstring",
54 | "missing-function-docstring",
55 | "too-many-locals",
56 | "too-many-branches",
57 | "too-many-statements",
58 | "too-many-arguments",
59 | "cyclic-import"
60 | ]
61 |
62 | [tool.isort]
63 | multi_line_output = 3
64 | include_trailing_comma = true
65 | force_grid_wrap = 0
66 | use_parentheses = true
67 | ensure_newline_before_comments = true
68 | line_length = 120
69 | split_on_trailing_comma = true
70 | skip = ["__init__.py"]
--------------------------------------------------------------------------------
/src/objectnat/__init__.py:
--------------------------------------------------------------------------------
1 | """
2 | ObjectNat
3 | ========
4 |
5 |
6 | ObjectNat is an open-source library created for geospatial analysis created by IDU team.
7 |
8 | Homepage https://github.com/DDonnyy/ObjectNat.
9 | """
10 |
11 | from ._config import config
12 | from ._api import *
13 | from ._version import VERSION as __version__
14 |
--------------------------------------------------------------------------------
/src/objectnat/_api.py:
--------------------------------------------------------------------------------
1 | # pylint: disable=unused-import,wildcard-import,unused-wildcard-import
2 |
3 | from .methods.coverage_zones import get_graph_coverage, get_radius_coverage, get_stepped_graph_coverage
4 | from .methods.isochrones import get_accessibility_isochrone_stepped, get_accessibility_isochrones
5 | from .methods.noise import simulate_noise
6 | from .methods.point_clustering import get_clusters_polygon
7 | from .methods.provision import clip_provision, get_service_provision, recalculate_links
8 | from .methods.visibility import (
9 | calculate_visibility_catchment_area,
10 | get_visibilities_from_points,
11 | get_visibility,
12 | get_visibility_accurate,
13 | )
14 |
--------------------------------------------------------------------------------
/src/objectnat/_config.py:
--------------------------------------------------------------------------------
1 | import sys
2 | from typing import Literal
3 |
4 | from loguru import logger
5 |
6 |
7 | class Config:
8 | """
9 | A configuration class to manage global settings for the application, such as Overpass API URL,
10 | timeouts, and logging options.
11 |
12 | Attributes
13 | ----------
14 | enable_tqdm_bar : bool
15 | Enables or disables progress bars (via tqdm). Defaults to True.
16 | logger : Logger
17 | Logging instance to handle application logging.
18 |
19 | Methods
20 | -------
21 | change_logger_lvl(lvl: Literal["TRACE", "DEBUG", "INFO", "WARN", "ERROR"])
22 | Changes the logging level to the specified value.
23 | set_enable_tqdm(enable: bool)
24 | Enables or disables progress bars in the application.
25 | """
26 |
27 | def __init__(
28 | self,
29 | enable_tqdm_bar=True,
30 | ):
31 | self.enable_tqdm_bar = enable_tqdm_bar
32 | self.logger = logger
33 | self.pandarallel_use_file_system = False
34 |
35 | def change_logger_lvl(self, lvl: Literal["TRACE", "DEBUG", "INFO", "WARN", "ERROR"]):
36 | self.logger.remove()
37 | self.logger.add(sys.stderr, level=lvl)
38 |
39 | def set_enable_tqdm(self, enable: bool):
40 | self.enable_tqdm_bar = enable
41 |
42 | def set_pandarallel_use_file_system(self, enable: bool):
43 | self.pandarallel_use_file_system = enable
44 |
45 |
46 | config = Config()
47 | config.change_logger_lvl("INFO")
48 |
--------------------------------------------------------------------------------
/src/objectnat/_version.py:
--------------------------------------------------------------------------------
1 | VERSION = "1.1.0"
2 |
--------------------------------------------------------------------------------
/src/objectnat/methods/__init__.py:
--------------------------------------------------------------------------------
https://raw.githubusercontent.com/DDonnyy/ObjectNat/3c29a7b7c0ea5c944fe2f98c368fcfc99b51bf96/src/objectnat/methods/__init__.py
--------------------------------------------------------------------------------
/src/objectnat/methods/coverage_zones/__init__.py:
--------------------------------------------------------------------------------
1 | from .graph_coverage import get_graph_coverage
2 | from .radius_voronoi_coverage import get_radius_coverage
3 | from .stepped_coverage import get_stepped_graph_coverage
4 |
--------------------------------------------------------------------------------
/src/objectnat/methods/coverage_zones/graph_coverage.py:
--------------------------------------------------------------------------------
1 | from typing import Literal
2 |
3 | import geopandas as gpd
4 | import networkx as nx
5 | import pandas as pd
6 | from pyproj.exceptions import CRSError
7 | from shapely import Point, concave_hull
8 |
9 | from objectnat.methods.utils.graph_utils import get_closest_nodes_from_gdf, reverse_graph
10 |
11 |
12 | def get_graph_coverage(
13 | gdf_to: gpd.GeoDataFrame,
14 | nx_graph: nx.Graph,
15 | weight_type: Literal["time_min", "length_meter"],
16 | weight_value_cutoff: float = None,
17 | zone: gpd.GeoDataFrame = None,
18 | ):
19 | """
20 | Calculate coverage zones from source points through a graph network using Dijkstra's algorithm
21 | and Voronoi diagrams.
22 |
23 | The function works by:
24 | 1. Finding nearest graph nodes for each input point
25 | 2. Calculating all reachable nodes within cutoff distance using Dijkstra
26 | 3. Creating Voronoi polygons around graph nodes
27 | 4. Combining reachability information with Voronoi cells
28 | 5. Clipping results to specified zone boundary
29 |
30 | Parameters
31 | ----------
32 | gdf_to : gpd.GeoDataFrame
33 | Source points to which coverage is calculated.
34 | nx_graph : nx.Graph
35 | NetworkX graph representing the transportation network.
36 | weight_type : Literal["time_min", "length_meter"]
37 | Edge attribute to use as weight for path calculations.
38 | weight_value_cutoff : float, optional
39 | Maximum weight value for path calculations (e.g., max travel time/distance).
40 | zone : gpd.GeoDataFrame, optional
41 | Boundary polygon to clip the resulting coverage zones. If None, concave hull of reachable nodes will be used.
42 |
43 | Returns
44 | -------
45 | gpd.GeoDataFrame
46 | GeoDataFrame with coverage zones polygons, each associated with its source point, returns in the same CRS as
47 | original gdf_from.
48 |
49 | Notes
50 | -----
51 | - The graph must have a valid CRS attribute in its graph properties
52 | - MultiGraph/MultiDiGraph inputs will be converted to simple Graph/DiGraph
53 |
54 | Examples
55 | --------
56 | >>> from iduedu import get_intermodal_graph # pip install iduedu to get OSM city network graph
57 | >>> points = gpd.read_file('points.geojson')
58 | >>> graph = get_intermodal_graph(osm_id=1114252)
59 | >>> coverage = get_graph_coverage(points, graph, "time_min", 15)
60 | """
61 | original_crs = gdf_to.crs
62 | try:
63 | local_crs = nx_graph.graph["crs"]
64 | except KeyError as exc:
65 | raise ValueError("Graph does not have crs attribute") from exc
66 |
67 | try:
68 | points = gdf_to.copy()
69 | points.to_crs(local_crs, inplace=True)
70 | except CRSError as e:
71 | raise CRSError(f"Graph crs ({local_crs}) has invalid format.") from e
72 |
73 | nx_graph, reversed_graph = reverse_graph(nx_graph, weight_type)
74 |
75 | points.geometry = points.representative_point()
76 |
77 | _, nearest_nodes = get_closest_nodes_from_gdf(points, nx_graph)
78 |
79 | points["nearest_node"] = nearest_nodes
80 |
81 | nearest_paths = nx.multi_source_dijkstra_path(
82 | reversed_graph, nearest_nodes, weight=weight_type, cutoff=weight_value_cutoff
83 | )
84 | reachable_nodes = list(nearest_paths.keys())
85 | graph_points = pd.DataFrame(
86 | data=[{"node": node, "geometry": Point(data["x"], data["y"])} for node, data in nx_graph.nodes(data=True)]
87 | ).set_index("node")
88 | nearest_nodes = pd.DataFrame(
89 | data=[path[0] for path in nearest_paths.values()], index=reachable_nodes, columns=["node_to"]
90 | )
91 | graph_nodes_gdf = gpd.GeoDataFrame(
92 | graph_points.merge(nearest_nodes, left_index=True, right_index=True, how="left"),
93 | geometry="geometry",
94 | crs=local_crs,
95 | )
96 | graph_nodes_gdf["node_to"] = graph_nodes_gdf["node_to"].fillna("non_reachable")
97 | voronois = gpd.GeoDataFrame(geometry=graph_nodes_gdf.voronoi_polygons(), crs=local_crs)
98 | graph_nodes_gdf = graph_nodes_gdf[graph_nodes_gdf["node_to"] != "non_reachable"]
99 | zone_coverages = voronois.sjoin(graph_nodes_gdf).dissolve(by="node_to").reset_index().drop(columns=["node"])
100 | zone_coverages = zone_coverages.merge(
101 | points.drop(columns="geometry"), left_on="node_to", right_on="nearest_node", how="inner"
102 | ).reset_index(drop=True)
103 | zone_coverages.drop(columns=["node_to", "nearest_node"], inplace=True)
104 | if zone is None:
105 | zone = concave_hull(graph_nodes_gdf[~graph_nodes_gdf["node_to"].isna()].union_all(), ratio=0.5)
106 | else:
107 | zone = zone.to_crs(local_crs)
108 | return zone_coverages.clip(zone).to_crs(original_crs)
109 |
--------------------------------------------------------------------------------
/src/objectnat/methods/coverage_zones/radius_voronoi_coverage.py:
--------------------------------------------------------------------------------
1 | import geopandas as gpd
2 | import numpy as np
3 |
4 |
5 | def get_radius_coverage(gdf_from: gpd.GeoDataFrame, radius: float, resolution: int = 32):
6 | """
7 | Calculate radius-based coverage zones using Voronoi polygons.
8 |
9 | Parameters
10 | ----------
11 | gdf_from : gpd.GeoDataFrame
12 | Source points for which coverage zones are calculated.
13 | radius : float
14 | Maximum coverage radius in meters.
15 | resolution : int, optional
16 | Number of segments used to approximate quarter-circle in buffer (default=32).
17 |
18 | Returns
19 | -------
20 | gpd.GeoDataFrame
21 | GeoDataFrame with smoothed coverage zone polygons in the same CRS as original gdf_from.
22 |
23 | Notes
24 | -----
25 | - Automatically converts to local UTM CRS for accurate distance measurements
26 | - Final zones are slightly contracted then expanded for smoothing effect
27 |
28 | Examples
29 | --------
30 | >>> facilities = gpd.read_file('healthcare.shp')
31 | >>> coverage = get_radius_coverage(facilities, radius=500)
32 | """
33 | original_crs = gdf_from.crs
34 | local_crs = gdf_from.estimate_utm_crs()
35 | gdf_from = gdf_from.to_crs(local_crs)
36 | bounds = gdf_from.buffer(radius).union_all()
37 | coverage_polys = gpd.GeoDataFrame(geometry=gdf_from.voronoi_polygons().clip(bounds, keep_geom_type=True))
38 | coverage_polys = coverage_polys.sjoin(gdf_from)
39 | coverage_polys["area"] = coverage_polys.area
40 | coverage_polys["buffer"] = np.pow(coverage_polys["area"], 1 / 3)
41 | coverage_polys.geometry = coverage_polys.buffer(-coverage_polys["buffer"], resolution=1, join_style="mitre").buffer(
42 | coverage_polys["buffer"] * 0.9, resolution=resolution
43 | )
44 | coverage_polys.drop(columns=["buffer", "area"], inplace=True)
45 | return coverage_polys.to_crs(original_crs)
46 |
--------------------------------------------------------------------------------
/src/objectnat/methods/coverage_zones/stepped_coverage.py:
--------------------------------------------------------------------------------
1 | from typing import Literal
2 |
3 | import geopandas as gpd
4 | import networkx as nx
5 | import numpy as np
6 | import pandas as pd
7 | from pyproj.exceptions import CRSError
8 | from shapely import Point, concave_hull
9 |
10 | from objectnat.methods.isochrones.isochrone_utils import create_separated_dist_polygons
11 | from objectnat.methods.utils.graph_utils import get_closest_nodes_from_gdf, reverse_graph
12 |
13 |
14 | def get_stepped_graph_coverage(
15 | gdf_to: gpd.GeoDataFrame,
16 | nx_graph: nx.Graph,
17 | weight_type: Literal["time_min", "length_meter"],
18 | step_type: Literal["voronoi", "separate"],
19 | weight_value_cutoff: float = None,
20 | zone: gpd.GeoDataFrame = None,
21 | step: float = None,
22 | ):
23 | """
24 | Calculate stepped coverage zones from source points through a graph network using Dijkstra's algorithm
25 | and Voronoi-based or buffer-based isochrone steps.
26 |
27 | This function combines graph-based accessibility with stepped isochrone logic. It:
28 | 1. Finds nearest graph nodes for each input point
29 | 2. Computes reachability for increasing weights (e.g. time or distance) in defined steps
30 | 3. Generates Voronoi-based or separate buffer zones around network nodes
31 | 4. Aggregates zones into stepped coverage layers
32 | 5. Optionally clips results to a boundary zone
33 |
34 | Parameters
35 | ----------
36 | gdf_to : gpd.GeoDataFrame
37 | Source points from which stepped coverage is calculated.
38 | nx_graph : nx.Graph
39 | NetworkX graph representing the transportation network.
40 | weight_type : Literal["time_min", "length_meter"]
41 | Type of edge weight to use for path calculation:
42 | - "time_min": Edge travel time in minutes
43 | - "length_meter": Edge length in meters
44 | step_type : Literal["voronoi", "separate"]
45 | Method for generating stepped zones:
46 | - "voronoi": Stepped zones based on Voronoi polygons around graph nodes
47 | - "separate": Independent buffer zones per step
48 | weight_value_cutoff : float, optional
49 | Maximum weight value (e.g., max travel time or distance) to limit the coverage extent.
50 | zone : gpd.GeoDataFrame, optional
51 | Optional boundary polygon to clip resulting stepped zones. If None, concave hull of reachable area is used.
52 | step : float, optional
53 | Step interval for coverage zone construction. Defaults to:
54 | - 100 meters for distance-based weight
55 | - 1 minute for time-based weight
56 |
57 | Returns
58 | -------
59 | gpd.GeoDataFrame
60 | GeoDataFrame with polygons representing stepped coverage zones for each input point, annotated by step range.
61 |
62 | Notes
63 | -----
64 | - Input graph must have a valid CRS defined.
65 | - MultiGraph or MultiDiGraph inputs will be simplified.
66 | - Designed for accessibility and spatial equity analyses over multimodal networks.
67 |
68 | Examples
69 | --------
70 | >>> from iduedu import get_intermodal_graph
71 | >>> points = gpd.read_file('destinations.geojson')
72 | >>> graph = get_intermodal_graph(osm_id=1114252)
73 | >>> stepped_coverage = get_stepped_graph_coverage(
74 | ... points, graph, "time_min", step_type="voronoi", weight_value_cutoff=30, step=5
75 | ... )
76 | >>> # Using buffer-style zones
77 | >>> stepped_separate = get_stepped_graph_coverage(
78 | ... points, graph, "length_meter", step_type="separate", weight_value_cutoff=1000, step=200
79 | ... )
80 | """
81 | if step is None:
82 | if weight_type == "length_meter":
83 | step = 100
84 | else:
85 | step = 1
86 | original_crs = gdf_to.crs
87 | try:
88 | local_crs = nx_graph.graph["crs"]
89 | except KeyError as exc:
90 | raise ValueError("Graph does not have crs attribute") from exc
91 |
92 | try:
93 | points = gdf_to.copy()
94 | points.to_crs(local_crs, inplace=True)
95 | except CRSError as e:
96 | raise CRSError(f"Graph crs ({local_crs}) has invalid format.") from e
97 |
98 | nx_graph, reversed_graph = reverse_graph(nx_graph, weight_type)
99 |
100 | points.geometry = points.representative_point()
101 |
102 | distances, nearest_nodes = get_closest_nodes_from_gdf(points, nx_graph)
103 |
104 | points["nearest_node"] = nearest_nodes
105 | points["distance"] = distances
106 |
107 | dist = nx.multi_source_dijkstra_path_length(
108 | reversed_graph, nearest_nodes, weight=weight_type, cutoff=weight_value_cutoff
109 | )
110 |
111 | graph_points = pd.DataFrame(
112 | data=[{"node": node, "geometry": Point(data["x"], data["y"])} for node, data in nx_graph.nodes(data=True)]
113 | )
114 |
115 | nearest_nodes = pd.DataFrame.from_dict(dist, orient="index", columns=["dist"]).reset_index()
116 |
117 | graph_nodes_gdf = gpd.GeoDataFrame(
118 | graph_points.merge(nearest_nodes, left_on="node", right_on="index", how="left").reset_index(drop=True),
119 | geometry="geometry",
120 | crs=local_crs,
121 | )
122 | graph_nodes_gdf.drop(columns=["index", "node"], inplace=True)
123 | if weight_value_cutoff is None:
124 | weight_value_cutoff = max(nearest_nodes["dist"])
125 | if step_type == "voronoi":
126 | graph_nodes_gdf["dist"] = np.minimum(np.ceil(graph_nodes_gdf["dist"] / step) * step, weight_value_cutoff)
127 | voronois = gpd.GeoDataFrame(geometry=graph_nodes_gdf.voronoi_polygons(), crs=local_crs)
128 | zone_coverages = voronois.sjoin(graph_nodes_gdf).dissolve(by="dist", as_index=False, dropna=False)
129 | zone_coverages = zone_coverages[["dist", "geometry"]].explode(ignore_index=True)
130 | if zone is None:
131 | zone = concave_hull(graph_nodes_gdf[~graph_nodes_gdf["node_to"].isna()].union_all(), ratio=0.5)
132 | else:
133 | zone = zone.to_crs(local_crs)
134 | zone_coverages = zone_coverages.clip(zone).to_crs(original_crs)
135 | else: # step_type == 'separate':
136 | speed = 83.33 # TODO HARDCODED WALK SPEED
137 | weight_value = weight_value_cutoff
138 | zone_coverages = create_separated_dist_polygons(graph_nodes_gdf, weight_value, weight_type, step, speed)
139 | if zone is not None:
140 | zone = zone.to_crs(local_crs)
141 | zone_coverages = zone_coverages.clip(zone).to_crs(original_crs)
142 | return zone_coverages
143 |
--------------------------------------------------------------------------------
/src/objectnat/methods/isochrones/__init__.py:
--------------------------------------------------------------------------------
1 | from .isochrones import get_accessibility_isochrones, get_accessibility_isochrone_stepped
2 |
--------------------------------------------------------------------------------
/src/objectnat/methods/isochrones/isochrone_utils.py:
--------------------------------------------------------------------------------
1 | from typing import Literal
2 |
3 | import geopandas as gpd
4 | import networkx as nx
5 | import numpy as np
6 | import pandas as pd
7 | from pyproj.exceptions import CRSError
8 | from shapely.ops import polygonize
9 |
10 | from objectnat import config
11 | from objectnat.methods.utils.geom_utils import polygons_to_multilinestring
12 | from objectnat.methods.utils.graph_utils import get_closest_nodes_from_gdf, remove_weakly_connected_nodes
13 |
14 | logger = config.logger
15 |
16 |
17 | def _validate_inputs(
18 | points: gpd.GeoDataFrame, weight_value: float, weight_type: Literal["time_min", "length_meter"], nx_graph: nx.Graph
19 | ) -> tuple[str, str]:
20 | """Validate common inputs for accessibility functions."""
21 | if weight_value <= 0:
22 | raise ValueError("Weight value must be greater than 0")
23 | if weight_type not in ["time_min", "length_meter"]:
24 | raise UserWarning("Weight type should be either 'time_min' or 'length_meter'")
25 |
26 | try:
27 | local_crs = nx_graph.graph["crs"]
28 | except KeyError as exc:
29 | raise ValueError("Graph does not have crs attribute") from exc
30 | try:
31 | graph_type = nx_graph.graph["type"]
32 | except KeyError as exc:
33 | raise ValueError("Graph does not have type attribute") from exc
34 |
35 | try:
36 | points.to_crs(local_crs, inplace=True)
37 | except CRSError as e:
38 | raise CRSError(f"Graph crs ({local_crs}) has invalid format.") from e
39 |
40 | return local_crs, graph_type
41 |
42 |
43 | def _prepare_graph_and_nodes(
44 | points: gpd.GeoDataFrame, nx_graph: nx.Graph, graph_type: str, weight_type: str, weight_value: float
45 | ) -> tuple[nx.Graph, gpd.GeoDataFrame, pd.DataFrame, float]:
46 | """Prepare graph and calculate nearest nodes with distances."""
47 | nx_graph = remove_weakly_connected_nodes(nx_graph)
48 | distances, nearest_nodes = get_closest_nodes_from_gdf(points, nx_graph)
49 | points["nearest_node"] = nearest_nodes
50 |
51 | dist_nearest = pd.DataFrame(data=distances, index=nearest_nodes, columns=["dist"]).drop_duplicates()
52 |
53 | # Calculate speed adjustment if needed
54 | speed = 0
55 | if graph_type in ["walk", "intermodal"] and weight_type == "time_min":
56 | try:
57 | speed = nx_graph.graph["walk_speed"]
58 | except KeyError:
59 | logger.warning("There is no walk_speed in graph, set to the default speed - 83.33 m/min")
60 | speed = 83.33
61 | dist_nearest = dist_nearest / speed
62 | elif weight_type == "time_min":
63 | speed = 20 * 1000 / 60
64 | dist_nearest = dist_nearest / speed
65 |
66 | if (dist_nearest > weight_value).all().all():
67 | raise RuntimeError(
68 | "The point(s) lie further from the graph than weight_value, it's impossible to "
69 | "construct isochrones. Check the coordinates of the point(s)/their projection"
70 | )
71 |
72 | return nx_graph, points, dist_nearest, speed
73 |
74 |
75 | def _process_pt_data(
76 | nodes: gpd.GeoDataFrame, edges: gpd.GeoDataFrame, graph_type: str
77 | ) -> tuple[gpd.GeoDataFrame, gpd.GeoDataFrame] | tuple[None, None]:
78 | """Process public transport data if available."""
79 | if "type" in nodes.columns and "platform" in nodes["type"].unique():
80 | pt_nodes = nodes[(nodes["type"] != "platform") & (~nodes["type"].isna())]
81 | if graph_type == "intermodal":
82 | edges = edges[~edges["type"].isin(["walk", "boarding"])]
83 | pt_nodes = pt_nodes[["type", "route", "geometry"]]
84 | edges = edges[["type", "route", "geometry"]]
85 | return pt_nodes, edges
86 | return None, None
87 |
88 |
89 | def _calculate_distance_matrix(
90 | nx_graph: nx.Graph,
91 | nearest_nodes: np.ndarray,
92 | weight_type: str,
93 | weight_value: float,
94 | dist_nearest: pd.DataFrame,
95 | ) -> tuple[pd.DataFrame, nx.Graph]:
96 | """Calculate distance matrix from nearest nodes."""
97 |
98 | data = {}
99 | for source in nearest_nodes:
100 | dist = nx.single_source_dijkstra_path_length(nx_graph, source, weight=weight_type, cutoff=weight_value)
101 | data.update({source: dist})
102 |
103 | dist_matrix = pd.DataFrame.from_dict(data, orient="index")
104 | dist_matrix = dist_matrix.add(dist_nearest.dist, axis=0)
105 | dist_matrix = dist_matrix.mask(dist_matrix > weight_value, np.nan)
106 | dist_matrix.dropna(how="all", inplace=True)
107 | dist_matrix.dropna(how="all", axis=1, inplace=True)
108 |
109 | subgraph = nx_graph.subgraph(dist_matrix.columns.to_list())
110 |
111 | return dist_matrix, subgraph
112 |
113 |
114 | def _create_isochrones_gdf(
115 | points: gpd.GeoDataFrame,
116 | results: list,
117 | dist_matrix: pd.DataFrame,
118 | local_crs: str,
119 | weight_type: str,
120 | weight_value: float,
121 | ) -> gpd.GeoDataFrame:
122 | """Create final isochrones GeoDataFrame."""
123 | isochrones = gpd.GeoDataFrame(geometry=results, index=dist_matrix.index, crs=local_crs)
124 | isochrones = (
125 | points.drop(columns="geometry")
126 | .merge(isochrones, left_on="nearest_node", right_index=True, how="left")
127 | .drop(columns="nearest_node")
128 | )
129 | isochrones = gpd.GeoDataFrame(isochrones, geometry="geometry", crs=local_crs)
130 | isochrones["weight_type"] = weight_type
131 | isochrones["weight_value"] = weight_value
132 | return isochrones
133 |
134 |
135 | def create_separated_dist_polygons(
136 | points: gpd.GeoDataFrame, weight_value, weight_type, step, speed
137 | ) -> gpd.GeoDataFrame:
138 | points["dist"] = points["dist"].clip(lower=0.1)
139 | steps = np.arange(0, weight_value + step, step)
140 | if steps[-1] > weight_value:
141 | steps[-1] = weight_value # Ensure last step doesn't exceed weight_value
142 | for i in range(len(steps) - 1):
143 | min_dist = steps[i]
144 | max_dist = steps[i + 1]
145 | nodes_in_step = points["dist"].between(min_dist, max_dist, inclusive="left")
146 | nodes_in_step = nodes_in_step[nodes_in_step].index
147 | if not nodes_in_step.empty:
148 | buffer_size = (max_dist - points.loc[nodes_in_step, "dist"]) * 0.7
149 | if weight_type == "time_min":
150 | buffer_size = buffer_size * speed
151 | points.loc[nodes_in_step, "buffer_size"] = buffer_size
152 | points.geometry = points.geometry.buffer(points["buffer_size"])
153 | points["dist"] = np.minimum(np.ceil(points["dist"] / step) * step, weight_value)
154 | points = points.dissolve(by="dist", as_index=False)
155 | polygons = gpd.GeoDataFrame(
156 | geometry=list(polygonize(points.geometry.apply(polygons_to_multilinestring).union_all())),
157 | crs=points.crs,
158 | )
159 | polygons_points = polygons.copy()
160 | polygons_points.geometry = polygons.representative_point()
161 | stepped_polygons = polygons_points.sjoin(points, predicate="within").reset_index()
162 | stepped_polygons = stepped_polygons.groupby("index").agg({"dist": "mean"})
163 | stepped_polygons["dist"] = np.minimum(np.floor(stepped_polygons["dist"] / step) * step, weight_value)
164 | stepped_polygons["geometry"] = polygons
165 | stepped_polygons = gpd.GeoDataFrame(stepped_polygons, geometry="geometry", crs=points.crs).reset_index(drop=True)
166 | stepped_polygons = stepped_polygons.dissolve(by="dist", as_index=False).explode(ignore_index=True)
167 | return stepped_polygons
168 |
--------------------------------------------------------------------------------
/src/objectnat/methods/isochrones/isochrones.py:
--------------------------------------------------------------------------------
1 | from typing import Literal
2 |
3 | import geopandas as gpd
4 | import networkx as nx
5 | import numpy as np
6 |
7 | from objectnat import config
8 | from objectnat.methods.isochrones.isochrone_utils import (
9 | _calculate_distance_matrix,
10 | _create_isochrones_gdf,
11 | _prepare_graph_and_nodes,
12 | _process_pt_data,
13 | _validate_inputs,
14 | create_separated_dist_polygons,
15 | )
16 | from objectnat.methods.utils.geom_utils import remove_inner_geom
17 | from objectnat.methods.utils.graph_utils import graph_to_gdf
18 |
19 | logger = config.logger
20 |
21 |
22 | def get_accessibility_isochrone_stepped(
23 | isochrone_type: Literal["radius", "ways", "separate"],
24 | point: gpd.GeoDataFrame,
25 | weight_value: float,
26 | weight_type: Literal["time_min", "length_meter"],
27 | nx_graph: nx.Graph,
28 | step: float = None,
29 | **kwargs,
30 | ) -> tuple[gpd.GeoDataFrame, gpd.GeoDataFrame | None, gpd.GeoDataFrame | None]:
31 | """
32 | Calculate stepped accessibility isochrones for a single point with specified intervals.
33 |
34 | Parameters
35 | ----------
36 | isochrone_type : Literal["radius", "ways", "separate"]
37 | Visualization method for stepped isochrones:
38 | - "radius": Voronoi-based in circular buffers
39 | - "ways": Voronoi-based in road network polygons
40 | - "separate": Circular buffers for each step
41 | point : gpd.GeoDataFrame
42 | Single source point for isochrone calculation (uses first geometry if multiple provided).
43 | weight_value : float
44 | Maximum travel time (minutes) or distance (meters) threshold.
45 | weight_type : Literal["time_min", "length_meter"]
46 | Type of weight calculation:
47 | - "time_min": Time-based in minutes
48 | - "length_meter": Distance-based in meters
49 | nx_graph : nx.Graph
50 | NetworkX graph representing the transportation network.
51 | step : float, optional
52 | Interval between isochrone steps. Defaults to:
53 | - 100 meters for distance-based
54 | - 1 minute for time-based
55 | **kwargs
56 | Additional buffer parameters:
57 | - buffer_factor: Size multiplier for buffers (default: 0.7)
58 | - road_buffer_size: Buffer size for road edges in meters (default: 5)
59 |
60 | Returns
61 | -------
62 | tuple[gpd.GeoDataFrame, gpd.GeoDataFrame | None, gpd.GeoDataFrame | None]
63 | Tuple containing:
64 | - stepped_isochrones: GeoDataFrame with stepped polygons and distance/time attributes
65 | - pt_stops: Public transport stops within isochrones (if available)
66 | - pt_routes: Public transport routes within isochrones (if available)
67 |
68 | Examples
69 | --------
70 | >>> from iduedu import get_intermodal_graph # pip install iduedu to get OSM city network graph
71 | >>> graph = get_intermodal_graph(polygon=my_territory_polygon)
72 | >>> point = gpd.GeoDataFrame(geometry=[Point(30.33, 59.95)], crs=4326)
73 | >>> # Stepped radius isochrones with 5-minute intervals
74 | >>> radius_stepped, stops, _ = get_accessibility_isochrone_stepped(
75 | ... "radius", point, 30, "time_min", graph, step=5
76 | ... )
77 | >>> # Stepped road isochrones with 200m intervals
78 | >>> ways_stepped, _, routes = get_accessibility_isochrone_stepped(
79 | ... "ways", point, 1000, "length_meter", graph, step=200
80 | ... )
81 | >>> # Voronoi-based stepped isochrones
82 | >>> separate_stepped, stops, _ = get_accessibility_isochrone_stepped(
83 | ... "separate", point, 15, "time_min", graph
84 | ... )
85 | """
86 | buffer_params = {
87 | "buffer_factor": 0.7,
88 | "road_buffer_size": 5,
89 | }
90 |
91 | buffer_params.update(kwargs)
92 | original_crs = point.crs
93 | point = point.copy()
94 | if len(point) > 1:
95 | logger.warning(
96 | f"This method processes only single point. The GeoDataFrame contains {len(point)} points - "
97 | "only the first geometry will be used for isochrone calculation. "
98 | )
99 | point = point.iloc[[0]]
100 |
101 | local_crs, graph_type = _validate_inputs(point, weight_value, weight_type, nx_graph)
102 |
103 | if step is None:
104 | if weight_type == "length_meter":
105 | step = 100
106 | else:
107 | step = 1
108 | nx_graph, points, dist_nearest, speed = _prepare_graph_and_nodes(
109 | point, nx_graph, graph_type, weight_type, weight_value
110 | )
111 |
112 | dist_matrix, subgraph = _calculate_distance_matrix(
113 | nx_graph, points["nearest_node"].values, weight_type, weight_value, dist_nearest
114 | )
115 |
116 | logger.info("Building isochrones geometry...")
117 | nodes, edges = graph_to_gdf(subgraph)
118 | nodes.loc[dist_matrix.columns, "dist"] = dist_matrix.iloc[0]
119 |
120 | if isochrone_type == "separate":
121 | stepped_iso = create_separated_dist_polygons(nodes, weight_value, weight_type, step, speed)
122 | else:
123 | if isochrone_type == "radius":
124 | isochrone_geoms = _build_radius_isochrones(
125 | dist_matrix, weight_value, weight_type, speed, nodes, buffer_params["buffer_factor"]
126 | )
127 | else: # isochrone_type == 'ways':
128 | if graph_type in ["intermodal", "walk"]:
129 | isochrone_edges = edges[edges["type"] == "walk"]
130 | else:
131 | isochrone_edges = edges.copy()
132 | all_isochrones_edges = isochrone_edges.buffer(buffer_params["road_buffer_size"], resolution=1).union_all()
133 | all_isochrones_edges = gpd.GeoDataFrame(geometry=[all_isochrones_edges], crs=local_crs)
134 | isochrone_geoms = _build_ways_isochrones(
135 | dist_matrix=dist_matrix,
136 | weight_value=weight_value,
137 | weight_type=weight_type,
138 | speed=speed,
139 | nodes=nodes,
140 | all_isochrones_edges=all_isochrones_edges,
141 | buffer_factor=buffer_params["buffer_factor"],
142 | )
143 | nodes = nodes.clip(isochrone_geoms[0], keep_geom_type=True)
144 | nodes["dist"] = np.minimum(np.ceil(nodes["dist"] / step) * step, weight_value)
145 | voronois = gpd.GeoDataFrame(geometry=nodes.voronoi_polygons(), crs=local_crs)
146 | stepped_iso = (
147 | voronois.sjoin(nodes[["dist", "geometry"]]).dissolve(by="dist", as_index=False).drop(columns="index_right")
148 | )
149 | stepped_iso = stepped_iso.clip(isochrone_geoms[0], keep_geom_type=True)
150 |
151 | pt_nodes, pt_edges = _process_pt_data(nodes, edges, graph_type)
152 | if pt_nodes is not None:
153 | pt_nodes.to_crs(original_crs, inplace=True)
154 | if pt_edges is not None:
155 | pt_edges.to_crs(original_crs, inplace=True)
156 | return stepped_iso.to_crs(original_crs), pt_nodes, pt_edges
157 |
158 |
159 | def get_accessibility_isochrones(
160 | isochrone_type: Literal["radius", "ways"],
161 | points: gpd.GeoDataFrame,
162 | weight_value: float,
163 | weight_type: Literal["time_min", "length_meter"],
164 | nx_graph: nx.Graph,
165 | **kwargs,
166 | ) -> tuple[gpd.GeoDataFrame, gpd.GeoDataFrame | None, gpd.GeoDataFrame | None]:
167 | """
168 | Calculate accessibility isochrones from input points based on the provided city graph.
169 |
170 | Supports two types of isochrones:
171 | - 'radius': Circular buffer-based isochrones
172 | - 'ways': Road network-based isochrones
173 |
174 | Parameters
175 | ----------
176 | isochrone_type : Literal["radius", "ways"]
177 | Type of isochrone to calculate:
178 | - "radius": Creates circular buffers around reachable nodes
179 | - "ways": Creates polygons based on reachable road network
180 | points : gpd.GeoDataFrame
181 | GeoDataFrame containing source points for isochrone calculation.
182 | weight_value : float
183 | Maximum travel time (minutes) or distance (meters) threshold.
184 | weight_type : Literal["time_min", "length_meter"]
185 | Type of weight calculation:
186 | - "time_min": Time-based accessibility in minutes
187 | - "length_meter": Distance-based accessibility in meters
188 | nx_graph : nx.Graph
189 | NetworkX graph representing the transportation network.
190 | Must contain CRS and speed attributes for time calculations.
191 | **kwargs
192 | Additional buffer parameters:
193 | - buffer_factor: Size multiplier for buffers (default: 0.7)
194 | - road_buffer_size: Buffer size for road edges in meters (default: 5)
195 |
196 | Returns
197 | -------
198 | tuple[gpd.GeoDataFrame, gpd.GeoDataFrame | None, gpd.GeoDataFrame | None]
199 | Tuple containing:
200 | - isochrones: GeoDataFrame with calculated isochrone polygons
201 | - pt_stops: Public transport stops within isochrones (if available)
202 | - pt_routes: Public transport routes within isochrones (if available)
203 |
204 | Examples
205 | --------
206 | >>> from iduedu import get_intermodal_graph # pip install iduedu to get OSM city network graph
207 | >>> graph = get_intermodal_graph(polygon=my_territory_polygon)
208 | >>> points = gpd.GeoDataFrame(geometry=[Point(30.33, 59.95)], crs=4326)
209 | >>> # Radius isochrones
210 | >>> radius_iso, stops, routes = get_accessibility_isochrones(
211 | ... "radius", points, 15, "time_min", graph, buffer_factor=0.8
212 | ... )
213 | >>> # Road network isochrones
214 | >>> ways_iso, stops, routes = get_accessibility_isochrones(
215 | ... "ways", points, 1000, "length_meter", graph, road_buffer_size=7
216 | ... )
217 | """
218 |
219 | buffer_params = {
220 | "buffer_factor": 0.7,
221 | "road_buffer_size": 5,
222 | }
223 | original_crs = points.crs
224 | buffer_params.update(kwargs)
225 |
226 | points = points.copy()
227 | local_crs, graph_type = _validate_inputs(points, weight_value, weight_type, nx_graph)
228 |
229 | nx_graph, points, dist_nearest, speed = _prepare_graph_and_nodes(
230 | points, nx_graph, graph_type, weight_type, weight_value
231 | )
232 |
233 | weight_cutoff = (
234 | weight_value + (100 if weight_type == "length_meter" else 1) if isochrone_type == "ways" else weight_value
235 | )
236 |
237 | dist_matrix, subgraph = _calculate_distance_matrix(
238 | nx_graph, points["nearest_node"].values, weight_type, weight_cutoff, dist_nearest
239 | )
240 |
241 | logger.info("Building isochrones geometry...")
242 | nodes, edges = graph_to_gdf(subgraph)
243 | if isochrone_type == "radius":
244 | isochrone_geoms = _build_radius_isochrones(
245 | dist_matrix, weight_value, weight_type, speed, nodes, buffer_params["buffer_factor"]
246 | )
247 | else: # isochrone_type == 'ways':
248 | if graph_type in ["intermodal", "walk"]:
249 | isochrone_edges = edges[edges["type"] == "walk"]
250 | else:
251 | isochrone_edges = edges.copy()
252 | all_isochrones_edges = isochrone_edges.buffer(buffer_params["road_buffer_size"], resolution=1).union_all()
253 | all_isochrones_edges = gpd.GeoDataFrame(geometry=[all_isochrones_edges], crs=local_crs)
254 | isochrone_geoms = _build_ways_isochrones(
255 | dist_matrix=dist_matrix,
256 | weight_value=weight_value,
257 | weight_type=weight_type,
258 | speed=speed,
259 | nodes=nodes,
260 | all_isochrones_edges=all_isochrones_edges,
261 | buffer_factor=buffer_params["buffer_factor"],
262 | )
263 | isochrones = _create_isochrones_gdf(points, isochrone_geoms, dist_matrix, local_crs, weight_type, weight_value)
264 | pt_nodes, pt_edges = _process_pt_data(nodes, edges, graph_type)
265 | if pt_nodes is not None:
266 | pt_nodes.to_crs(original_crs, inplace=True)
267 | if pt_edges is not None:
268 | pt_edges.to_crs(original_crs, inplace=True)
269 | return isochrones.to_crs(original_crs), pt_nodes, pt_edges
270 |
271 |
272 | def _build_radius_isochrones(dist_matrix, weight_value, weight_type, speed, nodes, buffer_factor):
273 | results = []
274 | for source in dist_matrix.index:
275 | buffers = (weight_value - dist_matrix.loc[source]) * buffer_factor
276 | if weight_type == "time_min":
277 | buffers = buffers * speed
278 | buffers = nodes.merge(buffers, left_index=True, right_index=True)
279 | buffers.geometry = buffers.geometry.buffer(buffers[source], resolution=8)
280 | results.append(buffers.union_all())
281 | return results
282 |
283 |
284 | def _build_ways_isochrones(dist_matrix, weight_value, weight_type, speed, nodes, all_isochrones_edges, buffer_factor):
285 | results = []
286 | for source in dist_matrix.index:
287 | reachable_nodes = dist_matrix.loc[source]
288 | reachable_nodes = reachable_nodes[reachable_nodes <= weight_value]
289 | reachable_nodes = (weight_value - reachable_nodes) * buffer_factor
290 | if weight_type == "time_min":
291 | reachable_nodes = reachable_nodes * speed
292 | reachable_nodes = nodes.merge(reachable_nodes, left_index=True, right_index=True)
293 | clip_zone = reachable_nodes.buffer(reachable_nodes[source], resolution=4).union_all()
294 |
295 | isochrone_edges = all_isochrones_edges.clip(clip_zone, keep_geom_type=True).explode(ignore_index=True)
296 | geom_to_keep = isochrone_edges.sjoin(reachable_nodes, how="inner").index.unique()
297 | isochrone = remove_inner_geom(isochrone_edges.loc[geom_to_keep].union_all())
298 | results.append(isochrone)
299 | return results
300 |
--------------------------------------------------------------------------------
/src/objectnat/methods/noise/__init__.py:
--------------------------------------------------------------------------------
1 | from .noise_sim import simulate_noise
2 | from .noise_reduce import dist_to_target_db, green_noise_reduce_db
3 | from .noise_exceptions import InvalidStepError
4 |
--------------------------------------------------------------------------------
/src/objectnat/methods/noise/noise_exceptions.py:
--------------------------------------------------------------------------------
1 | class InvalidStepError(ValueError):
2 | def __init__(self, source_noise_db, target_noise_db, db_sim_step, div_, *args):
3 | if args:
4 | self.message = args[0]
5 | else:
6 | self.message = (
7 | f"The difference between `source_noise_db`({source_noise_db}) and `target_noise_db`({target_noise_db})"
8 | f" is not divisible by the step size ({db_sim_step}, remainder = {div_})"
9 | )
10 |
11 | def __str__(self):
12 | if self.message:
13 | return self.message
14 | return "The difference between `source_noise_db` and `target_noise_db` is not divisible by the step size"
15 |
--------------------------------------------------------------------------------
/src/objectnat/methods/noise/noise_init_data.py:
--------------------------------------------------------------------------------
1 | import pandas as pd
2 |
3 | data = {
4 | 30: {63: 0, 125: 0.0002, 250: 0.0009, 500: 0.003, 1000: 0.0075, 2000: 0.014, 4000: 0.025, 8000: 0.064},
5 | 20: {63: 0, 125: 0.0003, 250: 0.0011, 500: 0.0028, 1000: 0.0052, 2000: 0.0096, 4000: 0.025, 8000: 0.083},
6 | 10: {63: 0, 125: 0.0004, 250: 0.001, 500: 0.002, 1000: 0.0039, 2000: 0.01, 4000: 0.035, 8000: 0.125},
7 | 0: {63: 0, 125: 0.0004, 250: 0.0008, 500: 0.0017, 1000: 0.0049, 2000: 0.017, 4000: 0.058, 8000: 0.156},
8 | }
9 |
10 | air_resist_ratio = pd.DataFrame(data)
11 |
--------------------------------------------------------------------------------
/src/objectnat/methods/noise/noise_reduce.py:
--------------------------------------------------------------------------------
1 | import numpy as np
2 | from scipy.optimize import fsolve
3 |
4 | from objectnat import config
5 |
6 | from .noise_init_data import air_resist_ratio
7 |
8 | logger = config.logger
9 |
10 |
11 | def get_air_resist_ratio(temp, freq, check_temp_freq=False):
12 | if check_temp_freq:
13 | if temp > max(air_resist_ratio.columns) or temp < min(air_resist_ratio.columns):
14 | logger.warning(
15 | f"The specified temperature of {temp}°C is outside the tabulated data range. "
16 | f"The air resistance coefficient for these values may be inaccurate. "
17 | f"Recommended temperature range: {min(air_resist_ratio.columns)}°C "
18 | f"to {max(air_resist_ratio.columns)}°C."
19 | )
20 |
21 | if freq > max(air_resist_ratio.index) or freq < min(air_resist_ratio.index):
22 | logger.warning(
23 | f"The specified geometric mean frequency of {freq} Hz is outside the tabulated data range."
24 | f" The air resistance coefficient for these values may be inaccurate."
25 | f" Recommended frequency range: {min(air_resist_ratio.index)} Hz to {max(air_resist_ratio.index)} Hz."
26 | )
27 |
28 | def get_nearest_values(array, value):
29 | sorted_array = sorted(array)
30 | if value in sorted_array:
31 | return [value]
32 | if value > max(sorted_array):
33 | return [sorted_array[-1]]
34 | if value < min(sorted_array):
35 | return [sorted_array[0]]
36 |
37 | for i, val in enumerate(sorted_array):
38 | if value < val:
39 | return sorted_array[max(i - 1, 0)], sorted_array[i]
40 | return sorted_array[-2], sorted_array[-1]
41 |
42 | nearest_temp = get_nearest_values(air_resist_ratio.columns, temp)
43 | nearest_freq = get_nearest_values(air_resist_ratio.index, freq)
44 |
45 | if len(nearest_temp) == 1 and len(nearest_freq) == 1:
46 | return air_resist_ratio.loc[nearest_freq[0], nearest_temp[0]]
47 |
48 | if len(nearest_temp) == 2 and len(nearest_freq) == 2:
49 | freq1, freq2 = nearest_freq
50 | temp1, temp2 = nearest_temp
51 |
52 | coef_temp1_freq1 = air_resist_ratio.loc[freq1, temp1]
53 | coef_temp1_freq2 = air_resist_ratio.loc[freq2, temp1]
54 | coef_temp2_freq1 = air_resist_ratio.loc[freq1, temp2]
55 | coef_temp2_freq2 = air_resist_ratio.loc[freq2, temp2]
56 |
57 | weight_temp1 = (temp2 - temp) / (temp2 - temp1)
58 | weight_temp2 = (temp - temp1) / (temp2 - temp1)
59 | weight_freq1 = (freq2 - freq) / (freq2 - freq1)
60 | weight_freq2 = (freq - freq1) / (freq2 - freq1)
61 |
62 | coef_freq1 = coef_temp1_freq1 * weight_temp1 + coef_temp2_freq1 * weight_temp2
63 | coef_freq2 = coef_temp1_freq2 * weight_temp1 + coef_temp2_freq2 * weight_temp2
64 |
65 | final_coef = coef_freq1 * weight_freq1 + coef_freq2 * weight_freq2
66 |
67 | return final_coef
68 |
69 | if len(nearest_temp) == 2 and len(nearest_freq) == 1:
70 | temp1, temp2 = nearest_temp
71 | freq1 = nearest_freq[0]
72 |
73 | coef_temp1 = air_resist_ratio.loc[freq1, temp1]
74 | coef_temp2 = air_resist_ratio.loc[freq1, temp2]
75 |
76 | weight_temp1 = (temp2 - temp) / (temp2 - temp1)
77 | weight_temp2 = (temp - temp1) / (temp2 - temp1)
78 |
79 | return coef_temp1 * weight_temp1 + coef_temp2 * weight_temp2
80 |
81 | if len(nearest_temp) == 1 and len(nearest_freq) == 2:
82 | temp1 = nearest_temp[0]
83 | freq1, freq2 = nearest_freq
84 |
85 | coef_freq1 = air_resist_ratio.loc[freq1, temp1]
86 | coef_freq2 = air_resist_ratio.loc[freq2, temp1]
87 |
88 | weight_freq1 = (freq2 - freq) / (freq2 - freq1)
89 | weight_freq2 = (freq - freq1) / (freq2 - freq1)
90 |
91 | return coef_freq1 * weight_freq1 + coef_freq2 * weight_freq2
92 |
93 |
94 | def dist_to_target_db(
95 | init_noise_db, target_noise_db, geometric_mean_freq_hz, air_temperature, return_desc=False, check_temp_freq=False
96 | ) -> float | str:
97 | """
98 | Calculates the distance required for a sound wave to decay from an initial noise level to a target noise level,
99 | based on the geometric mean frequency of the sound and the air temperature. Optionally, can return a description
100 | of the sound propagation behavior.
101 |
102 | Args:
103 | init_noise_db (float): The initial noise level of the source in decibels (dB). This is the starting sound
104 | intensity.
105 | target_noise_db (float): The target noise level in decibels (dB), representing the level to which the sound
106 | decays over distance.
107 | geometric_mean_freq_hz (float): The geometric mean frequency of the sound (in Hz). This frequency influences
108 | the attenuation of sound over distance. Higher frequencies decay faster than lower ones.
109 | air_temperature (float): The temperature of the air in degrees Celsius. This influences the air's resistance
110 | to sound propagation.
111 | return_desc (bool, optional): If set to `True`, the function will return a description of the sound decay
112 | process instead of the calculated distance.
113 | check_temp_freq (bool, optional): If `True`, the function will check whether the temperature and frequency
114 | are within valid ranges.
115 |
116 | Returns:
117 | float or str: If `return_desc` is `False`, the function returns the distance (in meters) over which the sound
118 | decays from `init_noise_db` to `target_noise_db`. If `return_desc` is `True`, a descriptive string is returned
119 | explaining the calculation and the conditions.
120 | """
121 |
122 | def equation(r):
123 | return l - l_ist + 20 * np.log10(r) + k * r
124 |
125 | l_ist = init_noise_db
126 | l = target_noise_db
127 | k = get_air_resist_ratio(air_temperature, geometric_mean_freq_hz, check_temp_freq)
128 | initial_guess = 1
129 | r_solution = fsolve(equation, initial_guess)
130 | if return_desc:
131 | string = (
132 | f"Noise level of {init_noise_db} dB "
133 | f"with a geometric mean frequency of {geometric_mean_freq_hz} Hz "
134 | f"at an air temperature of {air_temperature}°C decays to {target_noise_db} dB "
135 | f"over a distance of {r_solution[0]} meters. Air resistance coefficient: {k}."
136 | )
137 | return string
138 | return r_solution[0]
139 |
140 |
141 | def green_noise_reduce_db(geometric_mean_freq_hz, r_tree) -> float:
142 | """
143 | Calculates the amount of noise reduction (in dB) provided by vegetation of a given thickness at a specified
144 | geometric mean frequency. The function models the reduction based on the interaction of the sound with trees or
145 | vegetation.
146 |
147 | Args:
148 | geometric_mean_freq_hz (float): The geometric mean frequency of the sound (in Hz).
149 | r_tree (float): The thickness or density of the vegetation (in meters).
150 |
151 | Returns:
152 | float: The noise reduction (in dB) achieved by the vegetation. This value indicates how much quieter the sound
153 | will be after passing through or interacting with the vegetation of the specified thickness.
154 | """
155 | return round(0.08 * r_tree * ((geometric_mean_freq_hz ** (1 / 3)) / 8), 1)
156 |
--------------------------------------------------------------------------------
/src/objectnat/methods/point_clustering/__init__.py:
--------------------------------------------------------------------------------
1 | from .cluster_points_in_polygons import get_clusters_polygon
2 |
--------------------------------------------------------------------------------
/src/objectnat/methods/point_clustering/cluster_points_in_polygons.py:
--------------------------------------------------------------------------------
1 | from typing import Literal
2 |
3 | import geopandas as gpd
4 | import pandas as pd
5 | from sklearn.cluster import DBSCAN, HDBSCAN
6 |
7 | from objectnat import config
8 |
9 | logger = config.logger
10 |
11 |
12 | def _get_cluster(services_select, min_dist, min_point, method):
13 | services_coords = pd.DataFrame(
14 | {"x": services_select.geometry.representative_point().x, "y": services_select.geometry.representative_point().y}
15 | )
16 | if method == "DBSCAN":
17 | db = DBSCAN(eps=min_dist, min_samples=min_point).fit(services_coords.to_numpy())
18 | else:
19 | db = HDBSCAN(min_cluster_size=min_point, cluster_selection_epsilon=min_dist).fit(services_coords.to_numpy())
20 | services_select["cluster"] = db.labels_
21 | return services_select
22 |
23 |
24 | def _get_service_ratio(loc, service_code_column):
25 | all_services = loc.shape[0]
26 | loc[service_code_column] = loc[service_code_column].astype(str)
27 | services_count = loc.groupby(service_code_column).size()
28 | return (services_count / all_services).round(2)
29 |
30 |
31 | def get_clusters_polygon(
32 | points: gpd.GeoDataFrame,
33 | min_dist: float | int = 100,
34 | min_point: int = 5,
35 | method: Literal["DBSCAN", "HDBSCAN"] = "HDBSCAN",
36 | service_code_column: str = "service_code",
37 | ) -> tuple[gpd.GeoDataFrame, gpd.GeoDataFrame]:
38 | """
39 | Generate cluster polygons for given points based on a specified minimum distance and minimum points per cluster.
40 | Optionally, calculate the relative ratio between types of points within the clusters.
41 |
42 | Parameters
43 | ----------
44 | points : gpd.GeoDataFrame
45 | GeoDataFrame containing the points to be clustered.
46 | Must include a 'service_code' column for service ratio calculations.
47 | min_dist : float | int, optional
48 | Minimum distance between points to be considered part of the same cluster. Defaults to 100.
49 | min_point : int, optional
50 | Minimum number of points required to form a cluster. Defaults to 5.
51 | method : Literal["DBSCAN", "HDBSCAN"], optional
52 | The clustering method to use. Must be either "DBSCAN" or "HDBSCAN". Defaults to "HDBSCAN".
53 | service_code_column : str, optional
54 | Column, containing service type for relative ratio in clasterized polygons. Defaults to "service_code".
55 | Returns
56 | -------
57 | tuple[gpd.GeoDataFrame, gpd.GeoDataFrame]
58 | A tuple containing the clustered polygons GeoDataFrame and the original points GeoDataFrame with cluster labels.
59 | """
60 | if method not in ["DBSCAN", "HDBSCAN"]:
61 | raise ValueError("Method must be either 'DBSCAN' or 'HDBSCAN'")
62 | original_crs = points.crs
63 | local_crs = points.estimate_utm_crs()
64 | points = points.to_crs(local_crs)
65 | services_select = _get_cluster(points, min_dist, min_point, method)
66 |
67 | if service_code_column not in points.columns:
68 | logger.warning(
69 | f"No {service_code_column} column in provided GeoDataFrame, cluster polygons will be without relative ratio"
70 | )
71 | points[service_code_column] = service_code_column
72 |
73 | points_normal = services_select[services_select["cluster"] != -1].copy()
74 | points_outlier = services_select[services_select["cluster"] == -1].copy()
75 |
76 | if len(points_normal) > 0:
77 | cluster_service = points_normal.groupby("cluster", group_keys=True).apply(
78 | _get_service_ratio, service_code_column=service_code_column
79 | )
80 | if isinstance(cluster_service, pd.Series):
81 | cluster_service = cluster_service.unstack(level=1, fill_value=0)
82 |
83 | polygons_normal = points_normal.dissolve("cluster").concave_hull(ratio=0.1, allow_holes=True)
84 | df_clusters_normal = pd.concat([cluster_service, polygons_normal.rename("geometry")], axis=1)
85 | cluster_normal = df_clusters_normal.index.max()
86 | points_normal["outlier"] = False
87 | df_clusters_normal["outlier"] = False
88 | else:
89 | df_clusters_normal = None
90 | cluster_normal = 0
91 |
92 | if len(points_outlier) > 0:
93 | clusters_outlier = cluster_normal + 1
94 | new_clusters = list(range(clusters_outlier, clusters_outlier + len(points_outlier)))
95 | points_outlier.loc[:, "cluster"] = new_clusters
96 |
97 | cluster_service = points_outlier.groupby("cluster", group_keys=True).apply(
98 | _get_service_ratio, service_code_column=service_code_column
99 | )
100 | if isinstance(cluster_service, pd.Series):
101 | cluster_service = cluster_service.unstack(level=1, fill_value=0)
102 |
103 | df_clusters_outlier = cluster_service.join(points_outlier.set_index("cluster")["geometry"])
104 | points_outlier["outlier"] = True
105 | df_clusters_outlier["outlier"] = True
106 | else:
107 | points_outlier = None
108 | df_clusters_outlier = None
109 |
110 | df_clusters = pd.concat([df_clusters_normal, df_clusters_outlier]).fillna(0).set_geometry("geometry")
111 | df_clusters["geometry"] = df_clusters["geometry"].buffer(min_dist / 2)
112 | df_clusters = df_clusters.reset_index().rename(columns={"index": "cluster"})
113 |
114 | points = pd.concat([points_normal, points_outlier])
115 |
116 | return df_clusters.to_crs(original_crs), points.to_crs(original_crs)
117 |
--------------------------------------------------------------------------------
/src/objectnat/methods/provision/__init__.py:
--------------------------------------------------------------------------------
1 | from .provision import clip_provision, get_service_provision, recalculate_links
2 |
--------------------------------------------------------------------------------
/src/objectnat/methods/provision/provision.py:
--------------------------------------------------------------------------------
1 | from typing import Tuple
2 |
3 | import geopandas as gpd
4 | import numpy as np
5 | import pandas as pd
6 |
7 | from objectnat import config
8 |
9 | from .provision_model import Provision
10 |
11 | logger = config.logger
12 |
13 |
14 | def get_service_provision(
15 | buildings: gpd.GeoDataFrame,
16 | adjacency_matrix: pd.DataFrame,
17 | services: gpd.GeoDataFrame,
18 | threshold: int,
19 | buildings_demand_column: str = "demand",
20 | services_capacity_column: str = "capacity",
21 | ) -> Tuple[gpd.GeoDataFrame, gpd.GeoDataFrame, gpd.GeoDataFrame]:
22 | """Calculate load from buildings with demands on the given services using the distances matrix between them.
23 |
24 | Args:
25 | services (gpd.GeoDataFrame): GeoDataFrame of services
26 | adjacency_matrix (pd.DataFrame): DataFrame representing the adjacency matrix
27 | buildings (gpd.GeoDataFrame): GeoDataFrame of demanded buildings
28 | threshold (int): Threshold value
29 | buildings_demand_column (str): column name of buildings demands
30 | services_capacity_column (str): column name of services capacity
31 | Returns:
32 | Tuple[gpd.GeoDataFrame, gpd.GeoDataFrame, gpd.GeoDataFrame]: Tuple of GeoDataFrames representing provision
33 | buildings, provision services, and provision links
34 | """
35 | buildings = buildings.copy()
36 | services = services.copy()
37 | adjacency_matrix = adjacency_matrix.copy()
38 | buildings["demand"] = buildings[buildings_demand_column]
39 | services["capacity"] = services[services_capacity_column]
40 |
41 | provision_buildings, provision_services, provision_links = Provision(
42 | services=services,
43 | demanded_buildings=buildings,
44 | adjacency_matrix=adjacency_matrix,
45 | threshold=threshold,
46 | ).run()
47 | return provision_buildings, provision_services, provision_links
48 |
49 |
50 | def clip_provision(
51 | buildings: gpd.GeoDataFrame, services: gpd.GeoDataFrame, links: gpd.GeoDataFrame, selection_zone: gpd.GeoDataFrame
52 | ) -> Tuple[gpd.GeoDataFrame, gpd.GeoDataFrame, gpd.GeoDataFrame]:
53 |
54 | assert selection_zone.crs == buildings.crs == services.crs == links.crs, (
55 | f"CRS mismatch: buildings_crs:{buildings.crs}, "
56 | f"links_crs:{links.crs} , "
57 | f"services_crs:{services.crs}, "
58 | f"selection_zone_crs:{selection_zone.crs}"
59 | )
60 | buildings = buildings.copy()
61 | links = links.copy()
62 | services = services.copy()
63 |
64 | s = buildings.intersects(selection_zone.union_all())
65 | buildings = buildings.loc[s[s].index]
66 | links = links[links["building_index"].isin(buildings.index.tolist())]
67 | services_to_keep = set(links["service_index"].tolist())
68 | services.drop(list(set(services.index.tolist()) - services_to_keep), inplace=True)
69 | return buildings, services, links
70 |
71 |
72 | def recalculate_links(
73 | buildings: gpd.GeoDataFrame, services: gpd.GeoDataFrame, links: gpd.GeoDataFrame, new_max_dist: float
74 | ) -> tuple[gpd.GeoDataFrame, gpd.GeoDataFrame, gpd.GeoDataFrame]:
75 | buildings = buildings.copy()
76 | services = services.copy()
77 | links = links.copy()
78 |
79 | links_to_recalculate = links[links["distance"] > new_max_dist]
80 | if len(links_to_recalculate) == 0:
81 | logger.warning("To clip distance exceeds max links distance, returning full provision")
82 | return buildings, services, links
83 |
84 | links_to_keep = links[links["distance"] <= new_max_dist]
85 | free_demand = links_to_recalculate.groupby("building_index").agg({"demand": list, "distance": list})
86 | free_demand["distance"] = free_demand.apply(
87 | lambda x: sum((x1 * x2) for x1, x2 in zip(x.demand, x.distance)), axis=1
88 | )
89 | free_demand["demand"] = free_demand["demand"].apply(sum)
90 | free_demand = free_demand.reindex(buildings.index, fill_value=0)
91 | new_sum_time = (buildings["supplied_demands_within"] + buildings["supplied_demands_without"]) * buildings[
92 | "avg_dist"
93 | ] - free_demand["distance"]
94 |
95 | buildings["demand_left"] = buildings["demand_left"] + free_demand["demand"]
96 | buildings["supplied_demands_without"] = buildings["supplied_demands_without"] - free_demand["demand"]
97 | buildings["avg_dist"] = new_sum_time / (
98 | buildings["supplied_demands_without"] + buildings["supplied_demands_within"]
99 | )
100 | buildings["avg_dist"] = buildings.apply(
101 | lambda x: np.nan if (x["demand"] == x["demand_left"]) else round(x["avg_dist"], 2), axis=1
102 | )
103 |
104 | free_capacity = links_to_recalculate.groupby("service_index").agg({"demand": "sum"})
105 | free_capacity = free_capacity.reindex(services.index, fill_value=0)
106 | services["capacity_left"] = services["capacity_left"] + free_capacity["demand"]
107 | services["carried_capacity_without"] = services["carried_capacity_without"] - free_capacity["demand"]
108 | services["service_load"] = services["service_load"] - free_capacity["demand"]
109 |
110 | return buildings, services, links_to_keep
111 |
--------------------------------------------------------------------------------
/src/objectnat/methods/provision/provision_exceptions.py:
--------------------------------------------------------------------------------
1 | class CapacityKeyError(KeyError):
2 | def __init__(self, *args):
3 | if args:
4 | self.message = args[0]
5 | else:
6 | self.message = None
7 |
8 | def __str__(self):
9 | if self.message:
10 | return f"CapacityKeyError, {self.message} "
11 |
12 | return (
13 | "Column 'capacity' was not found in provided 'services' GeoDataFrame. This attribute "
14 | "corresponds to the total capacity for each service."
15 | )
16 |
17 |
18 | class CapacityValueError(ValueError):
19 | def __init__(self, *args):
20 | if args:
21 | self.message = args[0]
22 | else:
23 | self.message = None
24 |
25 | def __str__(self):
26 | if self.message:
27 | return f"CapacityValueError, {self.message} "
28 |
29 | return "Column 'capacity' in 'services' GeoDataFrame has no valid value."
30 |
31 |
32 | class DemandKeyError(KeyError):
33 | def __init__(self, *args):
34 | if args:
35 | self.message = args[0]
36 | else:
37 | self.message = None
38 |
39 | def __str__(self):
40 | if self.message:
41 | return f"DemandKeyError, {self.message} "
42 |
43 | return (
44 | "The column 'demand' was not found in the provided 'demanded_buildings' GeoDataFrame. "
45 | "This attribute corresponds to the number of demands for the selected service in each building."
46 | )
47 |
48 |
49 | class DemandValueError(ValueError):
50 | def __init__(self, *args):
51 | if args:
52 | self.message = args[0]
53 | else:
54 | self.message = None
55 |
56 | def __str__(self):
57 | if self.message:
58 | return f"DemandValueError, {self.message} "
59 | return "Column 'demand' in 'demanded_buildings' GeoDataFrame has no valid value."
60 |
--------------------------------------------------------------------------------
/src/objectnat/methods/provision/provision_model.py:
--------------------------------------------------------------------------------
1 | # pylint: disable=singleton-comparison
2 | from typing import Tuple
3 |
4 | import geopandas as gpd
5 | import numpy as np
6 | import pandas as pd
7 | from pandarallel import pandarallel
8 | from shapely import LineString
9 |
10 | from objectnat import config
11 |
12 | from .provision_exceptions import CapacityKeyError, DemandKeyError
13 |
14 | logger = config.logger
15 |
16 |
17 | class Provision:
18 | """
19 | Represents the logic for city provision calculations using a gravity or linear model.
20 |
21 | Args:
22 | services (gpd.GeoDataFrame): GeoDataFrame representing the services available in the city.
23 | demanded_buildings (gpd.GeoDataFrame): GeoDataFrame representing the buildings with demands for services.
24 | adjacency_matrix (pd.DataFrame): DataFrame representing the adjacency matrix between buildings.
25 | threshold (int): Threshold value for the provision calculations.
26 |
27 | Returns:
28 | Provision: The CityProvision object.
29 |
30 | Raises: KeyError: If the 'demand' column is missing in the provided 'demanded_buildings' GeoDataFrame,
31 | or if the 'capacity' column is missing in the provided 'services' GeoDataFrame. ValueError: If the 'capacity'
32 | column in 'services' or 'demand' column 'demanded_buildings' GeoDataFrame has no valid value.
33 | """
34 |
35 | destination_matrix = None
36 |
37 | def __init__(
38 | self,
39 | services: gpd.GeoDataFrame,
40 | demanded_buildings: gpd.GeoDataFrame,
41 | adjacency_matrix: pd.DataFrame,
42 | threshold: int,
43 | ):
44 | self.services = self.ensure_services(services.copy())
45 | self.demanded_buildings = self.ensure_buildings(demanded_buildings.copy())
46 | self.adjacency_matrix = self.delete_useless_matrix_rows_columns(
47 | adjacency_matrix.copy(), demanded_buildings, services
48 | ).copy()
49 | self.threshold = threshold
50 | self.services.to_crs(self.demanded_buildings.crs, inplace=True)
51 | pandarallel.initialize(progress_bar=False, verbose=0, use_memory_fs=config.pandarallel_use_file_system)
52 |
53 | @staticmethod
54 | def ensure_buildings(v: gpd.GeoDataFrame) -> gpd.GeoDataFrame:
55 | if "demand" not in v.columns:
56 | raise DemandKeyError
57 | v["demand_left"] = v["demand"]
58 | return v
59 |
60 | @staticmethod
61 | def ensure_services(v: gpd.GeoDataFrame) -> gpd.GeoDataFrame:
62 | if "capacity" not in v.columns:
63 | raise CapacityKeyError
64 | v["capacity_left"] = v["capacity"]
65 | return v
66 |
67 | @staticmethod
68 | def delete_useless_matrix_rows_columns(adjacency_matrix, demanded_buildings, services):
69 | adjacency_matrix.index = adjacency_matrix.index.astype(int)
70 |
71 | builds_indexes = set(demanded_buildings.index.astype(int).tolist())
72 | rows = set(adjacency_matrix.index.astype(int).tolist())
73 | dif = rows ^ builds_indexes
74 | adjacency_matrix.drop(index=(list(dif)), axis=0, inplace=True)
75 |
76 | service_indexes = set(services.index.astype(int).tolist())
77 | columns = set(adjacency_matrix.columns.astype(int).tolist())
78 | dif = columns ^ service_indexes
79 | adjacency_matrix.drop(columns=(list(dif)), axis=0, inplace=True)
80 | return adjacency_matrix.transpose()
81 |
82 | def run(self) -> Tuple[gpd.GeoDataFrame, gpd.GeoDataFrame, gpd.GeoDataFrame]:
83 |
84 | def apply_function_based_on_size(df, func, axis, threshold=100):
85 | if len(df) > threshold:
86 | return df.parallel_apply(func, axis=axis)
87 | return df.apply(func, axis=axis)
88 |
89 | def calculate_flows_y(loc):
90 | import numpy as np # pylint: disable=redefined-outer-name,reimported,import-outside-toplevel
91 | import pandas as pd # pylint: disable=redefined-outer-name,reimported,import-outside-toplevel
92 |
93 | c = services_table.loc[loc.name]["capacity_left"]
94 | p = 1 / loc / loc
95 | p = p / p.sum()
96 | threshold = p.quantile(best_houses)
97 | p = p[p >= threshold]
98 | p = p / p.sum()
99 | if p.sum() == 0:
100 | return loc
101 | rng = np.random.default_rng(seed=0)
102 | r = pd.Series(0, p.index)
103 | choice = np.unique(rng.choice(p.index, int(c), p=p.values), return_counts=True)
104 | choice = r.add(pd.Series(choice[1], choice[0]), fill_value=0)
105 |
106 | return choice
107 |
108 | def balance_flows_to_demands(loc):
109 | import numpy as np # pylint: disable=redefined-outer-name,reimported,import-outside-toplevel
110 | import pandas as pd # pylint: disable=redefined-outer-name,reimported,import-outside-toplevel
111 |
112 | d = houses_table.loc[loc.name]["demand_left"]
113 | loc = loc[loc > 0]
114 | if loc.sum() > 0:
115 | p = loc / loc.sum()
116 | rng = np.random.default_rng(seed=0)
117 | r = pd.Series(0, p.index)
118 | choice = np.unique(rng.choice(p.index, int(d), p=p.values), return_counts=True)
119 | choice = r.add(pd.Series(choice[1], choice[0]), fill_value=0)
120 | choice = pd.Series(
121 | data=np.minimum(loc.sort_index().values, choice.sort_index().values),
122 | index=loc.sort_index().index,
123 | )
124 | return choice
125 | return loc
126 |
127 | logger.debug(
128 | f"Calculating provision from {len(self.services)} services to {len(self.demanded_buildings)} buildings."
129 | )
130 |
131 | distance_matrix = self.adjacency_matrix
132 | destination_matrix = pd.DataFrame(
133 | 0,
134 | index=distance_matrix.index,
135 | columns=distance_matrix.columns,
136 | dtype=int,
137 | )
138 | distance_matrix = distance_matrix.where(distance_matrix <= self.threshold * 3, np.inf)
139 |
140 | houses_table = self.demanded_buildings[["demand", "demand_left"]].copy()
141 | services_table = self.services[["capacity", "capacity_left"]].copy()
142 | distance_matrix = distance_matrix.drop(
143 | index=services_table[services_table["capacity_left"] == 0].index.values,
144 | columns=houses_table[houses_table["demand_left"] == 0].index.values,
145 | errors="ignore",
146 | )
147 | distance_matrix = distance_matrix.loc[~(distance_matrix == np.inf).all(axis=1)]
148 | distance_matrix = distance_matrix.loc[:, ~(distance_matrix == np.inf).all(axis=0)]
149 |
150 | distance_matrix = distance_matrix + 1
151 | selection_range = (self.threshold + 1) / 2
152 | best_houses = 0.9
153 | while len(distance_matrix.columns) > 0 and len(distance_matrix.index) > 0:
154 | objects_n = sum(distance_matrix.shape)
155 | logger.debug(
156 | f"Matrix shape: {distance_matrix.shape},"
157 | f" Total objects: {objects_n},"
158 | f" Selection range: {selection_range},"
159 | f" Best houses: {best_houses}"
160 | )
161 |
162 | temp_destination_matrix = apply_function_based_on_size(
163 | distance_matrix, lambda x: calculate_flows_y(x[x <= selection_range]), 1
164 | )
165 |
166 | temp_destination_matrix = temp_destination_matrix.fillna(0)
167 | temp_destination_matrix = apply_function_based_on_size(temp_destination_matrix, balance_flows_to_demands, 0)
168 | temp_destination_matrix = temp_destination_matrix.fillna(0)
169 | temp_destination_matrix_aligned = temp_destination_matrix.reindex(
170 | index=destination_matrix.index, columns=destination_matrix.columns, fill_value=0
171 | )
172 | del temp_destination_matrix
173 | destination_matrix_np = destination_matrix.to_numpy()
174 | temp_destination_matrix_np = temp_destination_matrix_aligned.to_numpy()
175 | del temp_destination_matrix_aligned
176 | destination_matrix = pd.DataFrame(
177 | destination_matrix_np + temp_destination_matrix_np,
178 | index=destination_matrix.index,
179 | columns=destination_matrix.columns,
180 | )
181 | del destination_matrix_np, temp_destination_matrix_np
182 | axis_1 = destination_matrix.sum(axis=1).astype(int)
183 | axis_0 = destination_matrix.sum(axis=0).astype(int)
184 |
185 | services_table["capacity_left"] = services_table["capacity"].subtract(axis_1, fill_value=0)
186 | houses_table["demand_left"] = houses_table["demand"].subtract(axis_0, fill_value=0)
187 | del axis_1, axis_0
188 | distance_matrix = distance_matrix.drop(
189 | index=services_table[services_table["capacity_left"] == 0].index.values,
190 | columns=houses_table[houses_table["demand_left"] == 0].index.values,
191 | errors="ignore",
192 | )
193 | distance_matrix = distance_matrix.loc[~(distance_matrix == np.inf).all(axis=1)]
194 | distance_matrix = distance_matrix.loc[:, ~(distance_matrix == np.inf).all(axis=0)]
195 |
196 | selection_range *= 1.5
197 | if best_houses <= 0.1:
198 | best_houses = 0
199 | else:
200 | objects_n_new = sum(distance_matrix.shape)
201 | best_houses = objects_n_new / (objects_n / best_houses)
202 |
203 | logger.debug("Done!")
204 | del distance_matrix, houses_table, services_table
205 | self.destination_matrix = destination_matrix
206 |
207 | _additional_options(
208 | self.demanded_buildings,
209 | self.services,
210 | self.adjacency_matrix,
211 | self.destination_matrix,
212 | self.threshold,
213 | )
214 |
215 | return (
216 | self.demanded_buildings,
217 | self.services,
218 | _calc_links(
219 | self.destination_matrix,
220 | self.services,
221 | self.demanded_buildings,
222 | self.adjacency_matrix,
223 | ),
224 | )
225 |
226 |
227 | def _calc_links(
228 | destination_matrix: pd.DataFrame,
229 | services: gpd.GeoDataFrame,
230 | buildings: gpd.GeoDataFrame,
231 | distance_matrix: pd.DataFrame,
232 | ):
233 | buildings_ = buildings.copy()
234 | services_ = services.copy()
235 | buildings_.geometry = buildings_.representative_point()
236 | services_.geometry = services_.representative_point()
237 |
238 | def subfunc(loc):
239 | try:
240 | return [
241 | {
242 | "building_index": int(k),
243 | "demand": int(v),
244 | "service_index": int(loc.name),
245 | }
246 | for k, v in loc.to_dict().items()
247 | ]
248 | except:
249 | return np.NaN
250 |
251 | def subfunc_geom(loc):
252 | return LineString(
253 | (
254 | buildings_.geometry[loc["building_index"]],
255 | services_.geometry[loc["service_index"]],
256 | )
257 | )
258 |
259 | flat_matrix = destination_matrix.transpose().apply(lambda x: subfunc(x[x > 0]), result_type="reduce")
260 |
261 | distribution_links = gpd.GeoDataFrame(data=[item for sublist in list(flat_matrix) for item in sublist])
262 | if distribution_links.empty:
263 | logger.warning(
264 | "Unable to create distribution links - no demand could be matched with service locations. "
265 | "This is likely because either: "
266 | "1) The demand column in buildings contains zero values, or "
267 | "2) The capacity column in services contains zero values, or "
268 | "3) There are no service locations within the maximum allowed distance"
269 | )
270 | return distribution_links
271 | distribution_links["distance"] = distribution_links.apply(
272 | lambda x: distance_matrix.loc[x["service_index"]][x["building_index"]],
273 | axis=1,
274 | result_type="reduce",
275 | )
276 |
277 | sel = distribution_links["building_index"].isin(buildings_.index.values) & distribution_links["service_index"].isin(
278 | services_.index.values
279 | )
280 | sel = distribution_links.loc[sel[sel].index.values]
281 | distribution_links = distribution_links.set_geometry(sel.apply(subfunc_geom, axis=1)).set_crs(buildings_.crs)
282 | distribution_links["distance"] = distribution_links["distance"].astype(float).round(2)
283 | return distribution_links
284 |
285 |
286 | def _additional_options(
287 | buildings,
288 | services,
289 | matrix,
290 | destination_matrix,
291 | normative_distance,
292 | ):
293 | buildings["avg_dist"] = 0
294 | buildings["supplied_demands_within"] = 0
295 | buildings["supplied_demands_without"] = 0
296 | services["carried_capacity_within"] = 0
297 | services["carried_capacity_without"] = 0
298 | for _, loc in destination_matrix.iterrows():
299 | distances_all = matrix.loc[loc.name]
300 | distances = distances_all[distances_all <= normative_distance]
301 | s = matrix.loc[loc.name] <= normative_distance
302 | within = loc[s]
303 | without = loc[~s]
304 | within = within[within > 0]
305 | without = without[without > 0]
306 | buildings["avg_dist"] = (
307 | buildings["avg_dist"]
308 | .add(distances.multiply(within, fill_value=0), fill_value=0)
309 | .add(distances_all.multiply(without, fill_value=0), fill_value=0)
310 | )
311 | buildings["demand_left"] = buildings["demand_left"].sub(within.add(without, fill_value=0), fill_value=0)
312 | buildings["supplied_demands_within"] = buildings["supplied_demands_within"].add(within, fill_value=0)
313 | buildings["supplied_demands_without"] = buildings["supplied_demands_without"].add(without, fill_value=0)
314 |
315 | services.at[loc.name, "capacity_left"] = (
316 | services.at[loc.name, "capacity_left"] - within.add(without, fill_value=0).sum()
317 | )
318 | services.at[loc.name, "carried_capacity_within"] = (
319 | services.at[loc.name, "carried_capacity_within"] + within.sum()
320 | )
321 | services.at[loc.name, "carried_capacity_without"] = (
322 | services.at[loc.name, "carried_capacity_without"] + without.sum()
323 | )
324 | buildings["min_dist"] = matrix.min(axis=0).replace(np.inf, None)
325 | buildings["avg_dist"] = (buildings["avg_dist"] / (buildings["demand"] - buildings["demand_left"])).astype(
326 | np.float32
327 | )
328 | buildings["avg_dist"] = buildings.apply(
329 | lambda x: np.nan if (x["demand"] == x["demand_left"]) else round(x["avg_dist"], 2), axis=1
330 | )
331 | buildings["provision_value"] = (buildings["supplied_demands_within"] / buildings["demand"]).astype(float).round(2)
332 | services["service_load"] = (services["capacity"] - services["capacity_left"]).astype(np.uint16)
333 | buildings["supplied_demands_within"] = buildings["supplied_demands_within"].astype(np.uint16)
334 | buildings["supplied_demands_without"] = buildings["supplied_demands_without"].astype(np.uint16)
335 | services["carried_capacity_within"] = services["carried_capacity_within"].astype(np.uint16)
336 | services["carried_capacity_without"] = services["carried_capacity_without"].astype(np.uint16)
337 | logger.debug("Done adding additional options")
338 |
--------------------------------------------------------------------------------
/src/objectnat/methods/utils/__init__.py:
--------------------------------------------------------------------------------
https://raw.githubusercontent.com/DDonnyy/ObjectNat/3c29a7b7c0ea5c944fe2f98c368fcfc99b51bf96/src/objectnat/methods/utils/__init__.py
--------------------------------------------------------------------------------
/src/objectnat/methods/utils/geom_utils.py:
--------------------------------------------------------------------------------
1 | import math
2 |
3 | import geopandas as gpd
4 | from shapely import LineString, MultiPolygon, Point, Polygon
5 | from shapely.ops import polygonize, unary_union
6 |
7 | from objectnat import config
8 |
9 | logger = config.logger
10 |
11 |
12 | def polygons_to_multilinestring(geom: Polygon | MultiPolygon):
13 | # pylint: disable-next=redefined-outer-name,reimported,import-outside-toplevel
14 | from shapely import LineString, MultiLineString, MultiPolygon
15 |
16 | def convert_polygon(polygon: Polygon):
17 | lines = []
18 | exterior = LineString(polygon.exterior.coords)
19 | lines.append(exterior)
20 | interior = [LineString(p.coords) for p in polygon.interiors]
21 | lines = lines + interior
22 | return lines
23 |
24 | def convert_multipolygon(polygon: MultiPolygon):
25 | return MultiLineString(sum([convert_polygon(p) for p in polygon.geoms], []))
26 |
27 | if geom.geom_type == "Polygon":
28 | return MultiLineString(convert_polygon(geom))
29 | return convert_multipolygon(geom)
30 |
31 |
32 | def explode_linestring(geometry: LineString) -> list[LineString]:
33 | """A function to return all segments of a linestring as a list of linestrings"""
34 | coords_ext = geometry.coords # Create a list of all line node coordinates
35 | result = [LineString(part) for part in zip(coords_ext, coords_ext[1:])]
36 | return result
37 |
38 |
39 | def point_side_of_line(line: LineString, point: Point) -> int:
40 | """A positive indicates the left-hand side a negative indicates the right-hand side"""
41 | x1, y1 = line.coords[0]
42 | x2, y2 = line.coords[-1]
43 | x, y = point.coords[0]
44 | cross_product = (x2 - x1) * (y - y1) - (y2 - y1) * (x - x1)
45 | if cross_product > 0:
46 | return 1
47 | return -1
48 |
49 |
50 | def get_point_from_a_thorough_b(a: Point, b: Point, dist):
51 | """
52 | Func to get Point from point a thorough point b on dist
53 | """
54 | direction = math.atan2(b.y - a.y, b.x - a.x)
55 | c_x = a.x + dist * math.cos(direction)
56 | c_y = a.y + dist * math.sin(direction)
57 | return Point(c_x, c_y)
58 |
59 |
60 | def gdf_to_circle_zones_from_point(
61 | gdf: gpd.GeoDataFrame, point_from: Point, zone_radius, resolution=4, explode_multigeom=True
62 | ) -> gpd.GeoDataFrame:
63 | """n_segments = 4*resolution,e.g. if resolution = 4 that means there will be 16 segments"""
64 | crs = gdf.crs
65 | buffer = point_from.buffer(zone_radius, resolution=resolution)
66 | gdf_unary = gdf.clip(buffer, keep_geom_type=True).union_all()
67 | gdf_geometry = (
68 | gpd.GeoDataFrame(geometry=[gdf_unary], crs=crs)
69 | .explode(index_parts=True)
70 | .geometry.apply(polygons_to_multilinestring)
71 | .union_all()
72 | )
73 | zones_lines = [LineString([Point(coords1), Point(point_from)]) for coords1 in buffer.exterior.coords[:-1]]
74 | if explode_multigeom:
75 | return (
76 | gpd.GeoDataFrame(geometry=list(polygonize(unary_union([gdf_geometry] + zones_lines))), crs=crs)
77 | .clip(gdf_unary, keep_geom_type=True)
78 | .explode(index_parts=False)
79 | )
80 | return gpd.GeoDataFrame(geometry=list(polygonize(unary_union([gdf_geometry] + zones_lines))), crs=crs).clip(
81 | gdf_unary, keep_geom_type=True
82 | )
83 |
84 |
85 | def remove_inner_geom(polygon: Polygon | MultiPolygon):
86 | """function to get rid of inner polygons"""
87 | if isinstance(polygon, Polygon):
88 | return Polygon(polygon.exterior.coords)
89 | if isinstance(polygon, MultiPolygon):
90 | polys = []
91 | for poly in polygon.geoms:
92 | polys.append(Polygon(poly.exterior.coords))
93 | return MultiPolygon(polys)
94 | else:
95 | return Polygon()
96 |
97 |
98 | def combine_geometry(gdf: gpd.GeoDataFrame) -> gpd.GeoDataFrame:
99 | """
100 | Combine geometry of intersecting layers into a single GeoDataFrame.
101 | Parameters
102 | ----------
103 | gdf: gpd.GeoDataFrame
104 | A GeoPandas GeoDataFrame
105 |
106 | Returns
107 | -------
108 | gpd.GeoDataFrame
109 | The combined GeoDataFrame with aggregated in lists columns.
110 |
111 | Examples
112 | --------
113 | >>> gdf = gpd.read_file('path_to_your_file.geojson')
114 | >>> result = combine_geometry(gdf)
115 | """
116 |
117 | crs = gdf.crs
118 |
119 | enclosures = gpd.GeoDataFrame(
120 | geometry=list(polygonize(gdf["geometry"].apply(polygons_to_multilinestring).union_all())), crs=crs
121 | )
122 | enclosures_points = enclosures.copy()
123 | enclosures_points.geometry = enclosures.representative_point()
124 | joined = gpd.sjoin(enclosures_points, gdf, how="inner", predicate="within").reset_index()
125 | cols = joined.columns.tolist()
126 | cols.remove("geometry")
127 | joined = joined.groupby("index").agg({column: list for column in cols})
128 | joined["geometry"] = enclosures
129 | joined = gpd.GeoDataFrame(joined, geometry="geometry", crs=crs)
130 | return joined
131 |
--------------------------------------------------------------------------------
/src/objectnat/methods/utils/graph_utils.py:
--------------------------------------------------------------------------------
1 | import geopandas as gpd
2 | import networkx as nx
3 | import numpy as np
4 | import pandas as pd
5 | from loguru import logger
6 | from scipy.spatial import KDTree
7 | from shapely import LineString
8 | from shapely.geometry.point import Point
9 |
10 |
11 | def _edges_to_gdf(graph: nx.Graph, crs) -> gpd.GeoDataFrame:
12 | """
13 | Converts nx graph to gpd.GeoDataFrame as edges.
14 | """
15 | graph_df = pd.DataFrame(list(graph.edges(data=True)), columns=["u", "v", "data"])
16 | edge_data_expanded = pd.json_normalize(graph_df["data"])
17 | graph_df = pd.concat([graph_df.drop(columns=["data"]), edge_data_expanded], axis=1)
18 | graph_df = gpd.GeoDataFrame(graph_df, geometry="geometry", crs=crs).set_index(["u", "v"])
19 | graph_df["geometry"] = graph_df["geometry"].fillna(LineString())
20 | return graph_df
21 |
22 |
23 | def _nodes_to_gdf(graph: nx.Graph, crs: int) -> gpd.GeoDataFrame:
24 | """
25 | Converts nx graph to gpd.GeoDataFrame as nodes.
26 | """
27 |
28 | ind, data = zip(*graph.nodes(data=True))
29 | node_geoms = (Point(d["x"], d["y"]) for d in data)
30 | gdf_nodes = gpd.GeoDataFrame(data, index=ind, crs=crs, geometry=list(node_geoms))
31 |
32 | return gdf_nodes
33 |
34 |
35 | def _restore_edges_geom(nodes_gdf, edges_gdf) -> gpd.GeoDataFrame:
36 | edges_wout_geom = edges_gdf[edges_gdf["geometry"].is_empty].reset_index()
37 | edges_wout_geom["geometry"] = [
38 | LineString((s, e))
39 | for s, e in zip(
40 | nodes_gdf.loc[edges_wout_geom["u"], "geometry"], nodes_gdf.loc[edges_wout_geom["v"], "geometry"]
41 | )
42 | ]
43 | edges_wout_geom.set_index(["u", "v"], inplace=True)
44 | edges_gdf.update(edges_wout_geom)
45 | return edges_gdf
46 |
47 |
48 | def graph_to_gdf(
49 | graph: nx.MultiDiGraph | nx.Graph | nx.DiGraph, edges: bool = True, nodes: bool = True, restore_edge_geom=False
50 | ) -> gpd.GeoDataFrame | tuple[gpd.GeoDataFrame, gpd.GeoDataFrame]:
51 | """
52 | Converts nx graph to gpd.GeoDataFrame as edges.
53 |
54 | Parameters
55 | ----------
56 | graph : nx.MultiDiGraph
57 | The graph to convert.
58 | edges: bool, default to True
59 | Keep edges in GoeDataFrame.
60 | nodes: bool, default to True
61 | Keep nodes in GoeDataFrame.
62 | restore_edge_geom: bool, default to False
63 | if True, will try to restore edge geometry from nodes.
64 | Returns
65 | -------
66 | gpd.GeoDataFrame | tuple[gpd.GeoDataFrame, gpd.GeoDataFrame]
67 | Graph representation in GeoDataFrame format, either nodes or nodes,or tuple of them nodes,edges.
68 | """
69 | try:
70 | crs = graph.graph["crs"]
71 | except KeyError as exc:
72 | raise ValueError("Graph does not have crs attribute") from exc
73 | if not edges and not nodes:
74 | raise AttributeError("Neither edges or nodes were selected")
75 | if nodes and not edges:
76 | nodes_gdf = _nodes_to_gdf(graph, crs)
77 | return nodes_gdf
78 | if not nodes and edges:
79 | edges_gdf = _edges_to_gdf(graph, crs)
80 | if restore_edge_geom:
81 | nodes_gdf = _nodes_to_gdf(graph, crs)
82 | edges_gdf = _restore_edges_geom(nodes_gdf, edges_gdf)
83 | return edges_gdf
84 |
85 | nodes_gdf = _nodes_to_gdf(graph, crs)
86 | edges_gdf = _edges_to_gdf(graph, crs)
87 | if restore_edge_geom:
88 | edges_gdf = _restore_edges_geom(nodes_gdf, edges_gdf)
89 | return nodes_gdf, edges_gdf
90 |
91 |
92 | def get_closest_nodes_from_gdf(gdf: gpd.GeoDataFrame, nx_graph: nx.Graph) -> tuple:
93 | """
94 | Finds the closest graph nodes to the geometries in a GeoDataFrame.
95 |
96 | Parameters
97 | ----------
98 | gdf : gpd.GeoDataFrame
99 | GeoDataFrame with geometries for which the nearest graph nodes will be found.
100 | nx_graph : nx.Graph
101 | A NetworkX graph where nodes have 'x' and 'y' attributes (coordinates).
102 |
103 | Returns
104 | -------
105 | tuple
106 | A tuple of (distances, nearest_nodes), where:
107 | - distances: List of distances from each geometry to the nearest node.
108 | - nearest_nodes: List of node IDs closest to each geometry in the input GeoDataFrame.
109 |
110 | Raises
111 | ------
112 | ValueError
113 | If any node in the graph is missing 'x' or 'y' attributes.
114 | """
115 | nodes_with_data = list(nx_graph.nodes(data=True))
116 | try:
117 | coordinates = np.array([(data["x"], data["y"]) for node, data in nodes_with_data])
118 | except KeyError as e:
119 | raise ValueError("Graph does not have coordinates attribute") from e
120 | tree = KDTree(coordinates)
121 | target_coord = [(p.x, p.y) for p in gdf.representative_point()]
122 | distances, indices = tree.query(target_coord)
123 | nearest_nodes = [nodes_with_data[idx][0] for idx in indices]
124 | return distances, nearest_nodes
125 |
126 |
127 | def remove_weakly_connected_nodes(graph: nx.DiGraph) -> nx.DiGraph:
128 | """
129 | Removes all nodes that are not part of the largest strongly connected component in the graph.
130 |
131 | Parameters
132 | ----------
133 | graph : nx.DiGraph
134 | A directed NetworkX graph.
135 |
136 | Returns
137 | -------
138 | nx.DiGraph
139 | A new graph with only the largest strongly connected component retained.
140 |
141 | Notes
142 | -----
143 | - Also logs a warning if multiple weakly connected components are detected.
144 | - Logs the number of nodes removed and size of the remaining component.
145 | """
146 | graph = graph.copy()
147 |
148 | weakly_connected_components = list(nx.weakly_connected_components(graph))
149 | if len(weakly_connected_components) > 1:
150 | logger.warning(
151 | f"Found {len(weakly_connected_components)} disconnected subgraphs in the network. "
152 | f"These are isolated groups of nodes with no connections between them. "
153 | f"Size of components: {[len(c) for c in weakly_connected_components]}"
154 | )
155 |
156 | all_scc = sorted(nx.strongly_connected_components(graph), key=len)
157 | nodes_to_del = set().union(*all_scc[:-1])
158 |
159 | if nodes_to_del:
160 | logger.warning(
161 | f"Removing {len(nodes_to_del)} nodes that form {len(all_scc) - 1} trap components. "
162 | f"These are groups where you can enter but can't exit (or vice versa). "
163 | f"Keeping the largest strongly connected component ({len(all_scc[-1])} nodes)."
164 | )
165 | graph.remove_nodes_from(nodes_to_del)
166 |
167 | return graph
168 |
169 |
170 | def reverse_graph(nx_graph: nx.Graph, weight: str) -> tuple[nx.Graph, nx.DiGraph]:
171 | """
172 | Generate a reversed version of a directed or weighted graph.
173 |
174 | If the input graph is undirected, the original graph is returned as-is.
175 | For directed graphs, the function returns a new graph with all edge directions reversed,
176 | preserving the specified edge weight.
177 |
178 | Parameters
179 | ----------
180 | nx_graph : nx.Graph
181 | Input NetworkX graph (can be directed or undirected).
182 | weight : str
183 | Name of the edge attribute to use as weight in graph conversion.
184 |
185 | Returns
186 | -------
187 | tuple[nx.Graph, nx.DiGraph]
188 | A tuple containing:
189 | - normalized_graph: Original graph with relabeled nodes (if needed)
190 | - reversed_graph: Directed graph with reversed edges and preserved weights
191 | """
192 |
193 | if nx_graph.is_multigraph():
194 | nx_graph = nx.DiGraph(nx_graph) if nx_graph.is_directed() else nx.Graph(nx_graph)
195 | if not nx_graph.is_multigraph() and not nx_graph.is_directed():
196 | return nx_graph, nx_graph
197 |
198 | nx_graph = remove_weakly_connected_nodes(nx_graph)
199 |
200 | mapping = {old_label: new_label for new_label, old_label in enumerate(nx_graph.nodes())}
201 | nx_graph = nx.relabel_nodes(nx_graph, mapping)
202 |
203 | sparse_matrix = nx.to_scipy_sparse_array(nx_graph, weight=weight)
204 | transposed_matrix = sparse_matrix.transpose()
205 | reversed_graph = nx.from_scipy_sparse_array(transposed_matrix, edge_attribute=weight, create_using=type(nx_graph))
206 | return nx_graph, reversed_graph
207 |
--------------------------------------------------------------------------------
/src/objectnat/methods/utils/math_utils.py:
--------------------------------------------------------------------------------
1 | import numpy as np
2 |
3 |
4 | def min_max_normalization(data, new_min=0, new_max=1):
5 | """
6 | Min-max normalization for a given array of data.
7 |
8 | Parameters
9 | ----------
10 | data: numpy.ndarray
11 | Input data to be normalized.
12 | new_min: float, optional
13 | New minimum value for normalization. Defaults to 0.
14 | new_max: float, optional
15 | New maximum value for normalization. Defaults to 1.
16 |
17 | Returns
18 | -------
19 | numpy.ndarray
20 | Normalized data.
21 |
22 | Examples
23 | --------
24 | >>> import numpy as np
25 | >>> data = np.array([1, 2, 3, 4, 5])
26 | >>> normalized_data = min_max_normalization(data, new_min=0, new_max=1)
27 | """
28 |
29 | min_value = np.min(data)
30 | max_value = np.max(data)
31 | normalized_data = (data - min_value) / (max_value - min_value) * (new_max - new_min) + new_min
32 | return normalized_data
33 |
--------------------------------------------------------------------------------
/src/objectnat/methods/visibility/__init__.py:
--------------------------------------------------------------------------------
1 | from .visibility_analysis import (
2 | calculate_visibility_catchment_area,
3 | get_visibilities_from_points,
4 | get_visibility,
5 | get_visibility_accurate,
6 | )
7 |
--------------------------------------------------------------------------------
/src/tests/__init__.py:
--------------------------------------------------------------------------------
https://raw.githubusercontent.com/DDonnyy/ObjectNat/3c29a7b7c0ea5c944fe2f98c368fcfc99b51bf96/src/tests/__init__.py
--------------------------------------------------------------------------------
/src/tests/conftest.py:
--------------------------------------------------------------------------------
1 | import os
2 | import pickle
3 |
4 | import geopandas as gpd
5 | import pandas as pd
6 | import pytest
7 | from iduedu import config, get_boundary, get_intermodal_graph
8 | from shapely import Point
9 |
10 | logger = config.logger
11 |
12 | path_to_data = os.path.join(os.path.dirname(os.path.abspath(__file__)), "../../examples/examples_data/")
13 | output_dir = os.path.join(os.path.dirname(__file__), "test_output")
14 | cache_dir = os.path.join(os.path.dirname(__file__), "test_cache")
15 | os.makedirs(cache_dir, exist_ok=True)
16 | os.makedirs(output_dir, exist_ok=True)
17 |
18 |
19 | @pytest.fixture(scope="session")
20 | def buildings_data():
21 | data_path = os.path.join(path_to_data, "buildings.parquet")
22 | if not os.path.exists(data_path):
23 | raise FileNotFoundError(f"Файл {data_path} не найден!")
24 | buildings_data = gpd.read_parquet(data_path)
25 | buildings_data.index = buildings_data.index.astype(int)
26 | return buildings_data
27 |
28 |
29 | @pytest.fixture(scope="session")
30 | def services_data():
31 | data_path = os.path.join(path_to_data, "services.parquet")
32 | if not os.path.exists(data_path):
33 | raise FileNotFoundError(f"Файл {data_path} не найден!")
34 | services_data = gpd.read_parquet(data_path)
35 | services_data.index = services_data.index.astype(int)
36 | return services_data
37 |
38 |
39 | @pytest.fixture(scope="session")
40 | def matrix_time_data():
41 | data_path = os.path.join(path_to_data, "matrix_time.parquet")
42 | if not os.path.exists(data_path):
43 | raise FileNotFoundError(f"Файл {data_path} не найден!")
44 | matrix_time_data = pd.read_parquet(data_path)
45 | matrix_time_data.index = matrix_time_data.index.astype(int)
46 | matrix_time_data.columns = matrix_time_data.columns.astype(int)
47 | return matrix_time_data
48 |
49 |
50 | @pytest.fixture(scope="session")
51 | def trees_data():
52 | data_path = os.path.join(path_to_data, "trees.parquet")
53 | if not os.path.exists(data_path):
54 | raise FileNotFoundError(f"Файл {data_path} не найден!")
55 | return gpd.read_parquet(data_path)
56 |
57 |
58 | @pytest.fixture(scope="session")
59 | def boundary_osm_1114252():
60 | return get_boundary(osm_id=1114252)
61 |
62 |
63 | @pytest.fixture(scope="session")
64 | def intermodal_osm_1114252(boundary_osm_1114252):
65 | cache_file = os.path.join(cache_dir, "intermodal_graph_1114252.pickle")
66 | if os.path.exists(cache_file):
67 | try:
68 | with open(cache_file, "rb") as f:
69 | logger.info(f"Loading cached graph from {cache_file}")
70 | return pickle.load(f)
71 | except (pickle.PickleError, EOFError) as e:
72 | logger.warning(f"Failed to load cached graph: {e}. Regenerating...")
73 | os.remove(cache_file)
74 | logger.info("Generating new intermodal graph")
75 | graph = get_intermodal_graph(polygon=boundary_osm_1114252, clip_by_bounds=True)
76 | try:
77 | with open(cache_file, "wb") as f:
78 | logger.info(f"Saving graph to cache: {cache_file}")
79 | pickle.dump(graph, f, protocol=pickle.HIGHEST_PROTOCOL)
80 | except IOError as e:
81 | logger.error(f"Failed to cache graph: {e}")
82 | return graph
83 |
84 |
85 | @pytest.fixture(scope="session")
86 | def gdf_1point():
87 | return gpd.GeoDataFrame(geometry=[Point(30.27060176, 59.93546846)], crs=4326)
88 |
89 |
90 | @pytest.fixture(scope="session")
91 | def gdf_3points():
92 | points = [Point(30.27060176, 59.93546846), Point(30.29586657, 59.94410918), Point(30.2312112, 59.9482336)]
93 | return gpd.GeoDataFrame(geometry=points, crs=4326)
94 |
--------------------------------------------------------------------------------
/src/tests/test_clusterization.py:
--------------------------------------------------------------------------------
1 | import os
2 |
3 | from matplotlib import pyplot as plt
4 |
5 | from objectnat import get_clusters_polygon
6 | from tests.conftest import output_dir
7 |
8 |
9 | def test_and_visualize_clusters(buildings_data):
10 | min_dist = 70
11 | min_points = 2
12 | buildings_data = buildings_data.to_crs(4326)
13 | clusters, buildings_clustered = get_clusters_polygon(buildings_data, min_dist=min_dist, min_point=min_points)
14 |
15 | assert clusters.crs == buildings_data.crs
16 | assert buildings_clustered.crs == buildings_data.crs
17 |
18 | clusters = clusters[~clusters["outlier"]]
19 | buildings_clustered = buildings_clustered[~buildings_clustered["outlier"]]
20 |
21 | fig, ax = plt.subplots(figsize=(12, 10))
22 |
23 | local_crs = buildings_data.estimate_utm_crs()
24 | buildings_data = buildings_data.to_crs(local_crs)
25 | clusters.to_crs(local_crs, inplace=True)
26 | buildings_clustered.to_crs(local_crs, inplace=True)
27 |
28 | minx, miny, maxx, maxy = buildings_data.total_bounds
29 | ax.set_xlim(minx, maxx)
30 | ax.set_ylim(miny, maxy)
31 |
32 | clusters.plot(ax=ax, column="cluster", cmap="prism", alpha=0.4, edgecolor="black", linewidth=1, categorical=True)
33 |
34 | buildings_clustered.plot(
35 | ax=ax,
36 | column="cluster",
37 | cmap="prism",
38 | categorical=True,
39 | markersize=20,
40 | alpha=0.8,
41 | )
42 |
43 | ax.set_title(f"Building clusterization\n" f"Min distance to cluster: {min_dist}м, method: HDBSCAN")
44 | ax.set_axis_off()
45 | os.makedirs(output_dir, exist_ok=True)
46 | output_path = os.path.join(output_dir, "building_clusters.png")
47 | plt.savefig(output_path, bbox_inches="tight", dpi=150)
48 | plt.close()
49 |
--------------------------------------------------------------------------------
/src/tests/test_coverage_zones.py:
--------------------------------------------------------------------------------
1 | import os
2 |
3 | import geopandas as gpd
4 | import pytest
5 | from matplotlib import pyplot as plt
6 | from pyproj.exceptions import CRSError
7 |
8 | from objectnat import get_graph_coverage, get_radius_coverage, get_stepped_graph_coverage
9 | from tests.conftest import output_dir
10 |
11 |
12 | def test_stepped_time_min_voronoi(services_data, buildings_data, intermodal_osm_1114252, boundary_osm_1114252):
13 | zone = gpd.GeoDataFrame(geometry=[boundary_osm_1114252], crs=4326)
14 | step_type = "voronoi"
15 | step = 2
16 | result = get_stepped_graph_coverage(
17 | gdf_to=services_data,
18 | nx_graph=intermodal_osm_1114252,
19 | step_type=step_type,
20 | weight_type="time_min",
21 | zone=zone,
22 | step=step,
23 | )
24 | assert isinstance(result, gpd.GeoDataFrame)
25 | visualize_stepped_coverage_zones(
26 | result,
27 | buildings_data,
28 | services_data,
29 | title_suffix=f"(Step_type = {step_type}, step = {step})",
30 | filename_suffix=step_type,
31 | )
32 |
33 |
34 | def test_stepped_time_min_separate(services_data, buildings_data, intermodal_osm_1114252):
35 | step_type = "separate"
36 | step = 2
37 | result = get_stepped_graph_coverage(
38 | gdf_to=services_data,
39 | nx_graph=intermodal_osm_1114252,
40 | step_type=step_type,
41 | weight_type="time_min",
42 | step=step,
43 | )
44 | assert isinstance(result, gpd.GeoDataFrame)
45 | visualize_stepped_coverage_zones(
46 | result,
47 | buildings_data,
48 | services_data,
49 | title_suffix=f"(Step_type = {step_type}, step = {step})",
50 | filename_suffix=step_type,
51 | )
52 |
53 |
54 | def test_graph_time_min(services_data, buildings_data, intermodal_osm_1114252, boundary_osm_1114252):
55 | zone = gpd.GeoDataFrame(geometry=[boundary_osm_1114252], crs=4326)
56 | weight = 10
57 | result = get_graph_coverage(
58 | gdf_to=services_data,
59 | nx_graph=intermodal_osm_1114252,
60 | weight_type="time_min",
61 | weight_value_cutoff=weight,
62 | zone=zone,
63 | )
64 | assert isinstance(result, gpd.GeoDataFrame)
65 | assert len(result) == len(services_data)
66 |
67 | visualize_coverage_zones(
68 | result,
69 | buildings_data,
70 | services_data,
71 | title_suffix=f"(Time cutoff {weight} minutes)",
72 | filename_suffix="time_10min",
73 | )
74 |
75 |
76 | def test_graph_length_meter(services_data, buildings_data, intermodal_osm_1114252):
77 | weight = 600
78 | result = get_graph_coverage(
79 | gdf_to=services_data, nx_graph=intermodal_osm_1114252, weight_type="length_meter", weight_value_cutoff=weight
80 | )
81 | assert isinstance(result, gpd.GeoDataFrame)
82 | assert len(result) == len(services_data)
83 |
84 | visualize_coverage_zones(
85 | result,
86 | buildings_data,
87 | services_data,
88 | title_suffix=f"(Distance cutoff {weight} meters)",
89 | filename_suffix="distance_600m",
90 | )
91 |
92 |
93 | def test_graph_same_crs(services_data, intermodal_osm_1114252):
94 | services_data = services_data.to_crs(3857)
95 | result = get_graph_coverage(
96 | gdf_to=services_data, nx_graph=intermodal_osm_1114252, weight_type="length_meter", weight_value_cutoff=600
97 | )
98 | assert isinstance(result, gpd.GeoDataFrame)
99 | assert len(result) == len(services_data)
100 | assert result.crs == services_data.crs
101 |
102 |
103 | def test_wrong_graph_crs(services_data, intermodal_osm_1114252):
104 | wrong_graph = intermodal_osm_1114252.copy()
105 | wrong_graph.graph["crs"] = "Wrong CRS"
106 | with pytest.raises(CRSError) as _:
107 | _ = get_graph_coverage(
108 | gdf_to=services_data, nx_graph=wrong_graph, weight_type="length_meter", weight_value_cutoff=600
109 | )
110 | wrong_graph.graph = {}
111 | with pytest.raises(ValueError) as _:
112 | _ = get_graph_coverage(
113 | gdf_to=services_data, nx_graph=wrong_graph, weight_type="length_meter", weight_value_cutoff=600
114 | )
115 |
116 |
117 | def test_radius_coverage(services_data, buildings_data):
118 | services_data = services_data.to_crs(4326)
119 | weight = 800
120 | result = get_radius_coverage(services_data, radius=weight)
121 | assert isinstance(result, gpd.GeoDataFrame)
122 | assert len(result) == len(services_data)
123 | assert result.crs == services_data.crs
124 | visualize_coverage_zones(
125 | result,
126 | buildings_data,
127 | services_data,
128 | title_suffix=f"radius-voronoi (Distance cutoff {weight} meters)",
129 | filename_suffix="radius_distance_800m",
130 | )
131 |
132 |
133 | def visualize_coverage_zones(coverage_gdf, buildings_data, services_data, title_suffix="", filename_suffix=""):
134 | local_crs = buildings_data.estimate_utm_crs()
135 | fig, ax = plt.subplots(figsize=(12, 10))
136 | plt.subplots_adjust(left=0.05, right=0.95, top=0.95, bottom=0.05)
137 | coverage_gdf = coverage_gdf.to_crs(local_crs)
138 |
139 | buildings_data = buildings_data.to_crs(local_crs)
140 | services_data = services_data.to_crs(local_crs)
141 |
142 | minx, miny, maxx, maxy = buildings_data.total_bounds
143 | ax.set_xlim(minx, maxx)
144 | ax.set_ylim(miny, maxy)
145 |
146 | buildings_data.plot(ax=ax, edgecolor="gray", facecolor="none", linewidth=0.5)
147 | coverage_gdf.plot(
148 | ax=ax,
149 | column="name",
150 | cmap="tab20",
151 | legend=True,
152 | alpha=0.8,
153 | edgecolor="black",
154 | linewidth=0.2,
155 | label="Coverage zones",
156 | )
157 | services_data.plot(ax=ax, color="red", markersize=15, edgecolor="white", linewidth=0.3, label="Services")
158 | ax.set_title(f"Coverage zones {title_suffix}")
159 | ax.legend()
160 | ax.set_axis_off()
161 |
162 | output_path = os.path.join(output_dir, f"coverage_zones_{filename_suffix}.png")
163 | plt.savefig(output_path, bbox_inches="tight", dpi=150)
164 | plt.close()
165 |
166 | return output_path
167 |
168 |
169 | def visualize_stepped_coverage_zones(coverage_gdf, buildings_data, services_data, title_suffix="", filename_suffix=""):
170 | local_crs = buildings_data.estimate_utm_crs()
171 | fig, ax = plt.subplots(figsize=(12, 10))
172 | plt.subplots_adjust(left=0.05, right=0.95, top=0.95, bottom=0.05)
173 |
174 | coverage_gdf = coverage_gdf.to_crs(local_crs)
175 | buildings_data = buildings_data.to_crs(local_crs)
176 | services_data = services_data.to_crs(local_crs)
177 |
178 | minx, miny, maxx, maxy = buildings_data.total_bounds
179 | ax.set_xlim(minx, maxx)
180 | ax.set_ylim(miny, maxy)
181 |
182 | buildings_data.plot(ax=ax, edgecolor="gray", facecolor="none", linewidth=0.5)
183 | coverage_gdf.plot(
184 | ax=ax,
185 | column="dist",
186 | cmap="viridis",
187 | alpha=0.7,
188 | edgecolor="black",
189 | linewidth=0.2,
190 | legend=True,
191 | vmin=0,
192 | legend_kwds={"label": "average time travel to chosen services(minutes)", "shrink": 0.5},
193 | )
194 | services_data.plot(ax=ax, color="red", markersize=10, edgecolor="white", linewidth=0.3, label="Services")
195 | ax.set_title(f"Stepped coverage zones {title_suffix}")
196 | ax.legend()
197 | ax.set_axis_off()
198 |
199 | output_path = os.path.join(output_dir, f"stepped_coverage_zones_{filename_suffix}.png")
200 | plt.savefig(output_path, bbox_inches="tight", dpi=150)
201 | plt.close()
202 |
203 | return output_path
204 |
--------------------------------------------------------------------------------
/src/tests/test_isochrones.py:
--------------------------------------------------------------------------------
1 | import os
2 |
3 | import pytest
4 | from matplotlib import pyplot as plt
5 | from pyproj.exceptions import CRSError
6 |
7 | from objectnat import get_accessibility_isochrone_stepped, get_accessibility_isochrones
8 | from tests.conftest import output_dir
9 |
10 |
11 | def test_1point_isochrone_radius(intermodal_osm_1114252, gdf_1point, buildings_data):
12 | weight_value = 15
13 | isochrones, stops, routes = get_accessibility_isochrones(
14 | isochrone_type="radius",
15 | points=gdf_1point,
16 | weight_value=weight_value,
17 | weight_type="time_min",
18 | nx_graph=intermodal_osm_1114252,
19 | )
20 | assert isochrones is not None
21 | assert len(isochrones) == 1
22 | visualize_isochrones(
23 | isochrones,
24 | gdf_1point,
25 | routes,
26 | buildings_data,
27 | title_suffix=f"(radius mode, {weight_value} minutes)",
28 | filename_suffix=f"radius_{weight_value}_min",
29 | )
30 |
31 |
32 | def test_1point_isochrone_ways(intermodal_osm_1114252, gdf_1point, buildings_data):
33 | gdf_1point = gdf_1point.to_crs(4326)
34 | weight_value = 15
35 | isochrones, stops, routes = get_accessibility_isochrones(
36 | isochrone_type="ways",
37 | points=gdf_1point,
38 | weight_value=weight_value,
39 | weight_type="time_min",
40 | nx_graph=intermodal_osm_1114252,
41 | )
42 | assert isochrones is not None
43 | assert len(isochrones) == 1
44 | assert isochrones.crs == gdf_1point.crs
45 | assert stops.crs == gdf_1point.crs
46 | assert routes.crs == gdf_1point.crs
47 | visualize_isochrones(
48 | isochrones,
49 | gdf_1point,
50 | routes,
51 | buildings_data,
52 | title_suffix=f"(ways mode, {weight_value} minutes)",
53 | filename_suffix=f"ways_{weight_value}_min",
54 | )
55 |
56 |
57 | def test_3point_isochrone_radius(intermodal_osm_1114252, gdf_3points, buildings_data):
58 | weight_value = 8
59 | isochrones, stops, routes = get_accessibility_isochrones(
60 | isochrone_type="radius",
61 | points=gdf_3points,
62 | weight_value=weight_value,
63 | weight_type="time_min",
64 | nx_graph=intermodal_osm_1114252,
65 | )
66 | assert isochrones is not None
67 | assert len(isochrones) == 3
68 | visualize_isochrones(
69 | isochrones,
70 | gdf_3points,
71 | routes,
72 | buildings_data,
73 | title_suffix=f"(3 points radius mode, {weight_value} minutes)",
74 | filename_suffix=f"3points_radius_{weight_value}_min",
75 | )
76 |
77 |
78 | def test_3point_isochrone_ways(intermodal_osm_1114252, gdf_3points):
79 | isochrones, stops, routes = get_accessibility_isochrones(
80 | isochrone_type="ways",
81 | points=gdf_3points,
82 | weight_value=5,
83 | weight_type="time_min",
84 | nx_graph=intermodal_osm_1114252,
85 | )
86 | assert isochrones is not None
87 | assert len(isochrones) == 3
88 |
89 |
90 | def test_wrong_graph_crs(intermodal_osm_1114252, gdf_1point):
91 | wrong_graph = intermodal_osm_1114252.copy()
92 | wrong_graph.graph["crs"] = "Wrong CRS"
93 | with pytest.raises(CRSError) as _:
94 | _ = get_accessibility_isochrones(
95 | isochrone_type="ways",
96 | points=gdf_1point,
97 | weight_value=15,
98 | weight_type="time_min",
99 | nx_graph=wrong_graph,
100 | )
101 | wrong_graph.graph = {}
102 | with pytest.raises(ValueError) as _:
103 | _ = get_accessibility_isochrones(
104 | isochrone_type="ways",
105 | points=gdf_1point,
106 | weight_value=15,
107 | weight_type="time_min",
108 | nx_graph=wrong_graph,
109 | )
110 |
111 |
112 | def test_isochrone_stepped_radius(intermodal_osm_1114252, gdf_1point, buildings_data):
113 | weight_value = 15
114 | stepped_iso, stops, routes = get_accessibility_isochrone_stepped(
115 | isochrone_type="radius",
116 | point=gdf_1point,
117 | weight_value=15,
118 | weight_type="time_min",
119 | nx_graph=intermodal_osm_1114252,
120 | step=3,
121 | )
122 | assert stepped_iso is not None
123 | assert len(stepped_iso) == 5
124 |
125 | visualize_stepped_isochrones(
126 | stepped_iso,
127 | gdf_1point,
128 | routes,
129 | buildings_data,
130 | title_suffix=f"(radius mode, {weight_value} minutes)",
131 | filename_suffix=f"radius_{weight_value}_min",
132 | )
133 |
134 |
135 | def test_isochrone_stepped_ways(intermodal_osm_1114252, gdf_1point, buildings_data):
136 | weight_value = 15
137 | stepped_iso, stops, routes = get_accessibility_isochrone_stepped(
138 | isochrone_type="ways",
139 | point=gdf_1point,
140 | weight_value=15,
141 | weight_type="time_min",
142 | nx_graph=intermodal_osm_1114252,
143 | step=3,
144 | )
145 | assert stepped_iso is not None
146 | assert len(stepped_iso) == 5
147 |
148 | visualize_stepped_isochrones(
149 | stepped_iso,
150 | gdf_1point,
151 | routes,
152 | buildings_data,
153 | title_suffix=f"(ways mode, {weight_value} minutes)",
154 | filename_suffix=f"ways_{weight_value}_min",
155 | )
156 |
157 |
158 | def test_isochrone_stepped_separate(intermodal_osm_1114252, gdf_1point, buildings_data):
159 | weight_value = 15
160 | stepped_iso, stops, routes = get_accessibility_isochrone_stepped(
161 | isochrone_type="separate",
162 | point=gdf_1point,
163 | weight_value=15,
164 | weight_type="time_min",
165 | nx_graph=intermodal_osm_1114252,
166 | step=3,
167 | )
168 | assert stepped_iso is not None
169 | visualize_stepped_isochrones(
170 | stepped_iso,
171 | gdf_1point,
172 | routes,
173 | buildings_data,
174 | title_suffix=f"(separate mode, {weight_value} minutes)",
175 | filename_suffix=f"separate_{weight_value}_min",
176 | )
177 |
178 |
179 | def test_multipoint_in_stepped(intermodal_osm_1114252, gdf_3points):
180 | stepped_iso, stops, routes = get_accessibility_isochrone_stepped(
181 | isochrone_type="radius",
182 | point=gdf_3points,
183 | weight_value=15,
184 | weight_type="time_min",
185 | nx_graph=intermodal_osm_1114252,
186 | step=3,
187 | )
188 | assert stepped_iso is not None
189 | assert len(stepped_iso) == 5
190 |
191 |
192 | def visualize_isochrones(isochrones, point_from, routes, buildings_data, title_suffix="", filename_suffix=""):
193 | local_crs = buildings_data.estimate_utm_crs()
194 |
195 | fig, ax = plt.subplots(figsize=(10, 10))
196 | plt.subplots_adjust(left=0.05, right=0.95, top=0.95, bottom=0.05)
197 |
198 | isochrones = isochrones.to_crs(local_crs)
199 | buildings_data = buildings_data.to_crs(local_crs)
200 | routes = routes.to_crs(local_crs)
201 | point_from = point_from.to_crs(local_crs)
202 |
203 | minx, miny, maxx, maxy = buildings_data.total_bounds
204 | ax.set_xlim(minx, maxx)
205 | ax.set_ylim(miny, maxy)
206 |
207 | buildings_data.plot(ax=ax, edgecolor="gray", facecolor="none", linewidth=0.5)
208 | isochrones.reset_index().plot(
209 | ax=ax,
210 | alpha=0.8,
211 | column="index",
212 | cmap="tab20", # Светло-голубая заливка
213 | # edgecolor="#2166ac",
214 | linewidth=0.8,
215 | categorical=True,
216 | label="Isochrones",
217 | )
218 | routes.plot(ax=ax, column="type", linewidth=0.5, label="Public transport routes")
219 | point_from.plot(ax=ax, color="red", markersize=50, label="Start point")
220 | ax.set_title(f"Isochrone {title_suffix}")
221 | ax.legend()
222 | ax.set_axis_off()
223 |
224 | output_path = os.path.join(output_dir, f"isochrone_{filename_suffix}.png")
225 | plt.savefig(output_path, bbox_inches="tight", dpi=150)
226 | plt.close()
227 |
228 |
229 | def visualize_stepped_isochrones(
230 | stepped_isochrones, point_from, routes, buildings_data, title_suffix="", filename_suffix=""
231 | ):
232 |
233 | local_crs = buildings_data.estimate_utm_crs()
234 |
235 | stepped_isochrones = stepped_isochrones.to_crs(local_crs)
236 | buildings_data = buildings_data.to_crs(local_crs)
237 | routes = routes.to_crs(local_crs)
238 | point_from = point_from.to_crs(local_crs)
239 |
240 | fig, ax = plt.subplots(figsize=(12, 10))
241 |
242 | minx, miny, maxx, maxy = buildings_data.total_bounds
243 | ax.set_xlim(minx, maxx)
244 | ax.set_ylim(miny, maxy)
245 |
246 | buildings_data.plot(ax=ax, edgecolor="gray", facecolor="none", linewidth=0.5)
247 |
248 | stepped_isochrones.plot(
249 | ax=ax,
250 | column="dist",
251 | cmap="viridis",
252 | alpha=0.7,
253 | edgecolor="black",
254 | linewidth=0.2,
255 | legend=True,
256 | legend_kwds={"label": "Distance (meters)", "shrink": 0.5},
257 | label="Stepped isochrone",
258 | )
259 | routes.plot(ax=ax, column="type", linewidth=0.5, label="Public transport routes")
260 | point_from.plot(ax=ax, color="red", markersize=50, label="Start point")
261 |
262 | ax.set_title(f"Stepped isochrone {title_suffix}")
263 | ax.set_axis_off()
264 |
265 | output_path = os.path.join(output_dir, f"stepped_isochrone_{filename_suffix}.png")
266 | plt.savefig(output_path, bbox_inches="tight", dpi=150)
267 | plt.close()
268 |
--------------------------------------------------------------------------------
/src/tests/test_noise_simulation.py:
--------------------------------------------------------------------------------
1 | import os
2 |
3 | import geopandas as gpd
4 | import pytest
5 | from matplotlib import pyplot as plt
6 | from shapely import Point
7 |
8 | from objectnat import config, simulate_noise
9 | from objectnat.methods.noise import InvalidStepError
10 | from objectnat.methods.noise.noise_reduce import get_air_resist_ratio
11 | from tests.conftest import output_dir
12 |
13 | logger = config.logger
14 |
15 |
16 | def test_basic_functionality(gdf_1point, buildings_data, trees_data):
17 | gdf_1point = gdf_1point.to_crs(4326)
18 | source_noise_db = 90
19 | target_noise_db = 40
20 | reflection_n = 3
21 | geometric_mean_freq_hz = 2000
22 | result = simulate_noise(
23 | source_points=gdf_1point,
24 | obstacles=buildings_data,
25 | source_noise_db=source_noise_db,
26 | geometric_mean_freq_hz=2000,
27 | standart_absorb_ratio=0.05,
28 | trees=trees_data,
29 | tree_resolution=4,
30 | air_temperature=20,
31 | target_noise_db=target_noise_db,
32 | db_sim_step=1,
33 | reflection_n=reflection_n,
34 | dead_area_r=5,
35 | )
36 |
37 | assert isinstance(result, gpd.GeoDataFrame)
38 | assert not result.empty
39 | assert "geometry" in result.columns
40 | assert "noise_level" in result.columns
41 | assert result["noise_level"].max() <= source_noise_db
42 | assert result["noise_level"].min() >= target_noise_db
43 | assert result.crs == gdf_1point.crs
44 |
45 | plot_simulation_result(
46 | result_gdf=result,
47 | source_points=gdf_1point,
48 | buildings=buildings_data,
49 | trees=trees_data,
50 | source_db_range=(source_noise_db, target_noise_db),
51 | reflection_n=reflection_n,
52 | frequency_desc=geometric_mean_freq_hz,
53 | output_filename="noise_simulation_1point",
54 | )
55 |
56 |
57 | def test_multiple_sources(buildings_data, trees_data):
58 | p1 = Point(30.27060176, 59.93546846)
59 | p2 = Point(30.27303864, 59.9362777)
60 | p3 = Point(30.26804078, 59.93474246)
61 | gdf = gpd.GeoDataFrame(
62 | {
63 | "source_noise_db": [85, 90, 95],
64 | "geometric_mean_freq_hz": [500, 1000, 2000],
65 | "geometry": [p1, p2, p3],
66 | },
67 | crs=4326,
68 | )
69 |
70 | target_noise_db = 50
71 | reflection_n = 1
72 | result = simulate_noise(
73 | source_points=gdf,
74 | obstacles=buildings_data,
75 | standart_absorb_ratio=0.05,
76 | trees=trees_data,
77 | tree_resolution=1,
78 | air_temperature=20,
79 | target_noise_db=target_noise_db,
80 | db_sim_step=1,
81 | reflection_n=reflection_n,
82 | dead_area_r=5,
83 | )
84 |
85 | assert isinstance(result, gpd.GeoDataFrame)
86 | assert not result.empty
87 | assert "geometry" in result.columns
88 | assert "noise_level" in result.columns
89 | assert result["noise_level"].max() <= gdf["source_noise_db"].max()
90 | assert result["noise_level"].min() >= 40
91 | assert result.crs == gdf.crs
92 |
93 | plot_simulation_result(
94 | result_gdf=result,
95 | source_points=gdf,
96 | buildings=buildings_data,
97 | trees=trees_data,
98 | source_db_range=(gdf["source_noise_db"].max(), target_noise_db),
99 | reflection_n=reflection_n,
100 | frequency_desc="Mixed",
101 | output_filename="noise_simulation_3points",
102 | )
103 |
104 |
105 | def test_wrong_step(gdf_1point, buildings_data):
106 | gdf_1point = gdf_1point.to_crs(4326)
107 | with pytest.raises(InvalidStepError) as _:
108 | _ = simulate_noise(
109 | source_points=gdf_1point,
110 | obstacles=buildings_data,
111 | source_noise_db=90,
112 | geometric_mean_freq_hz=2000,
113 | db_sim_step=4,
114 | )
115 |
116 |
117 | def test_wrong_db_value(gdf_1point, buildings_data):
118 | gdf_1point = gdf_1point.to_crs(4326)
119 | with pytest.raises(ValueError) as _:
120 | _ = simulate_noise(
121 | source_points=gdf_1point,
122 | obstacles=buildings_data,
123 | source_noise_db=350,
124 | geometric_mean_freq_hz=2000,
125 | db_sim_step=4,
126 | )
127 |
128 |
129 | def test_out_of_range_values(gdf_1point, buildings_data):
130 | out_of_range_hz = 10
131 | out_of_range_temperature = 40
132 | in_middle_hz = 1500
133 | in_middle_temperature = 15
134 | res = get_air_resist_ratio(out_of_range_temperature, out_of_range_hz, True)
135 | logger.info(f"Out of range result: {res}")
136 | res = get_air_resist_ratio(in_middle_temperature, in_middle_hz, True)
137 | logger.info(f"Between values result: {res}")
138 | res = get_air_resist_ratio(in_middle_temperature, 2000, True)
139 | logger.info(f"Between values result: {res}")
140 | res = get_air_resist_ratio(10, in_middle_hz, True)
141 | logger.info(f"Between values result: {res}")
142 |
143 |
144 | def plot_simulation_result(
145 | result_gdf,
146 | source_points,
147 | buildings,
148 | trees,
149 | source_db_range,
150 | reflection_n,
151 | frequency_desc,
152 | output_filename,
153 | ):
154 |
155 | source_db, target_db = source_db_range
156 | local_crs = result_gdf.estimate_utm_crs()
157 | fig, ax = plt.subplots(figsize=(12, 10))
158 | plt.subplots_adjust(left=0.05, right=0.95, top=0.95, bottom=0.05)
159 |
160 | minx, miny, maxx, maxy = result_gdf.to_crs(local_crs).total_bounds
161 | ax.set_xlim(minx, maxx)
162 | ax.set_ylim(miny, maxy)
163 |
164 | result_gdf.to_crs(local_crs).plot(
165 | ax=ax,
166 | column="noise_level",
167 | cmap="plasma",
168 | legend=True,
169 | alpha=0.8,
170 | edgecolor="white",
171 | linewidth=0.1,
172 | vmin=target_db,
173 | vmax=source_db,
174 | legend_kwds={"label": "Noise level, Decibels", "shrink": 0.5},
175 | )
176 |
177 | buildings.to_crs(local_crs).plot(ax=ax, facecolor="gray", edgecolor="black", linewidth=0.5, label="Buildings")
178 | trees.to_crs(local_crs).plot(ax=ax, edgecolor="green", facecolor="none", linewidth=1.5, label="Trees")
179 | source_points.to_crs(local_crs).plot(ax=ax, color="red", markersize=10, label="Noise sources")
180 |
181 | ax.set_title(
182 | f"Noise propagation {source_db}dB -> {target_db}dB\n"
183 | f"Frequency: {frequency_desc}, Reflection count: {reflection_n}, Temperature: 20°C"
184 | )
185 | ax.legend()
186 | ax.set_axis_off()
187 |
188 | os.makedirs(output_dir, exist_ok=True)
189 | output_path = os.path.join(output_dir, output_filename)
190 | plt.savefig(output_path, bbox_inches="tight", dpi=150)
191 | plt.close()
192 |
--------------------------------------------------------------------------------
/src/tests/test_provision.py:
--------------------------------------------------------------------------------
1 | import os
2 |
3 | import numpy as np
4 | import pytest
5 | from matplotlib import pyplot as plt
6 |
7 | from objectnat import clip_provision, get_service_provision, recalculate_links
8 | from tests.conftest import output_dir
9 |
10 |
11 | @pytest.fixture(scope="module")
12 | def basic_provision(buildings_data, services_data, matrix_time_data):
13 | build_prov, services_prov, links_prov = get_service_provision(
14 | buildings=buildings_data, services=services_data, adjacency_matrix=matrix_time_data, threshold=10
15 | )
16 |
17 | return build_prov, services_prov, links_prov
18 |
19 |
20 | def test_no_demand(buildings_data, services_data, matrix_time_data):
21 | buildings_data = buildings_data.copy()
22 | buildings_data["demand"] = 0
23 | build_prov, services_prov, links_prov = get_service_provision(
24 | buildings=buildings_data, services=services_data, adjacency_matrix=matrix_time_data, threshold=10
25 | )
26 | assert links_prov.empty
27 |
28 |
29 | def test_no_capacity(buildings_data, services_data, matrix_time_data):
30 | services_data = services_data.copy()
31 | services_data["capacity"] = 0
32 | build_prov, services_prov, links_prov = get_service_provision(
33 | buildings=buildings_data, services=services_data, adjacency_matrix=matrix_time_data, threshold=10
34 | )
35 | assert links_prov.empty
36 |
37 |
38 | def test_get_service_provision(basic_provision, buildings_data):
39 | build_prov, services_prov, links_prov = basic_provision
40 |
41 | assert build_prov is not None
42 | assert services_prov is not None
43 | assert links_prov is not None
44 |
45 | assert np.isin(["service_load", "capacity_left"], services_prov.columns).all()
46 | assert np.isin(["min_dist", "avg_dist", "provision_value"], build_prov.columns).all()
47 | assert np.isin(["distance", "demand"], links_prov.columns).all()
48 |
49 | assert not build_prov.empty
50 | assert not services_prov.empty
51 | assert not links_prov.empty
52 |
53 | visualize_provision(buildings_data, build_prov, services_prov, links_prov, filename_suffix="initial")
54 |
55 |
56 | def test_recalculate_links(basic_provision, buildings_data):
57 | build_prov, services_prov, links_prov = basic_provision
58 | threshold = 10
59 | build_prov2, services_prov2, links_prov2 = recalculate_links(build_prov, services_prov, links_prov, threshold)
60 |
61 | assert len(build_prov) == len(build_prov2)
62 | assert len(services_prov) == len(services_prov2)
63 | assert (links_prov2["distance"] <= 15).all()
64 |
65 | visualize_provision(
66 | buildings_data,
67 | build_prov2,
68 | services_prov2,
69 | links_prov2,
70 | title_suffix=f"(Recalculated with threshold={threshold})",
71 | filename_suffix="recalculated",
72 | )
73 |
74 |
75 | def test_clip_links(basic_provision, buildings_data):
76 | build_prov, services_prov, links_prov = basic_provision
77 |
78 | to_clip_gdf = build_prov.iloc[:20].copy()
79 | to_clip_gdf["geometry"] = to_clip_gdf["geometry"].buffer(500)
80 |
81 | build_prov_clipped, services_prov_clipped, links_prov_clipped = clip_provision(
82 | build_prov, services_prov, links_prov, to_clip_gdf
83 | )
84 |
85 | assert build_prov_clipped is not None
86 | assert services_prov_clipped is not None
87 | assert links_prov_clipped is not None
88 |
89 | visualize_provision(
90 | buildings_data,
91 | build_prov_clipped,
92 | services_prov_clipped,
93 | links_prov_clipped,
94 | title_suffix="(Clipped by buildings)",
95 | filename_suffix="clipped",
96 | )
97 |
98 |
99 | def visualize_provision(initial_buildings, build_prov, services_prov, links_prov, title_suffix="", filename_suffix=""):
100 | local_crs = initial_buildings.estimate_utm_crs()
101 | fig, ax = plt.subplots(figsize=(10, 10))
102 | plt.subplots_adjust(left=0.05, right=0.95, top=0.95, bottom=0.05)
103 |
104 | initial_buildings = initial_buildings.to_crs(local_crs)
105 | build_prov = build_prov.to_crs(local_crs)
106 | build_prov.geometry = build_prov.geometry.buffer(10, resolution=4)
107 | services_prov = services_prov.to_crs(local_crs)
108 | links_prov = links_prov.to_crs(local_crs)
109 |
110 | minx, miny, maxx, maxy = initial_buildings.total_bounds
111 | ax.set_xlim(minx, maxx)
112 | ax.set_ylim(miny, maxy)
113 |
114 | initial_buildings.plot(ax=ax, edgecolor="gray", facecolor="none", linewidth=0.2)
115 | build_prov.plot(
116 | ax=ax,
117 | column="avg_dist",
118 | cmap="RdYlGn_r",
119 | alpha=0.8,
120 | label="Buildings",
121 | legend=True,
122 | legend_kwds={"label": "average distance in building to chosen services(meters)", "shrink": 0.5},
123 | )
124 | links_prov.plot(ax=ax, column="service_index", cmap="prism", linewidth=0.15, alpha=0.2, label="Links")
125 | services_prov.plot(ax=ax, color="red", markersize=10, label="Services")
126 |
127 | ax.set_title(f"Service provision {title_suffix}")
128 | ax.legend()
129 | ax.set_axis_off()
130 |
131 | output_path = os.path.join(output_dir, f"service_provision_{filename_suffix}.png")
132 | plt.savefig(output_path, bbox_inches="tight", dpi=150)
133 | plt.close()
134 |
135 | return output_path
136 |
--------------------------------------------------------------------------------
/src/tests/test_visibility.py:
--------------------------------------------------------------------------------
1 | import os
2 |
3 | import geopandas as gpd
4 | import pytest
5 | from matplotlib import pyplot as plt
6 | from matplotlib.patches import Patch
7 | from shapely import Point
8 |
9 | from objectnat import get_visibilities_from_points, get_visibility, get_visibility_accurate
10 | from tests.conftest import output_dir
11 |
12 |
13 | @pytest.fixture(scope="module")
14 | def gdf_1point_special():
15 | return gpd.GeoDataFrame(geometry=[Point(30.2312112, 59.9482336)], crs=4326)
16 |
17 |
18 | def test_compare_visibility_methods(gdf_1point_special, buildings_data):
19 |
20 | radius = 800
21 |
22 | simple = get_visibility(gdf_1point_special, buildings_data, radius)
23 | accurate = get_visibility_accurate(gdf_1point_special, buildings_data, radius)
24 |
25 | assert simple.crs == gdf_1point_special.crs
26 | assert accurate.crs == gdf_1point_special.crs
27 |
28 | local_crs = buildings_data.estimate_utm_crs()
29 | buildings = buildings_data.to_crs(local_crs)
30 | point = gdf_1point_special.to_crs(local_crs)
31 | simple = simple.to_crs(local_crs)
32 | accurate = accurate.to_crs(local_crs)
33 |
34 | simple_only = gpd.overlay(simple, accurate, how="difference")
35 | accurate_only = gpd.overlay(accurate, simple, how="difference")
36 | common_area = gpd.overlay(simple, accurate, how="intersection")
37 |
38 | fig, ax = plt.subplots(figsize=(12, 10))
39 |
40 | minx, miny, maxx, maxy = accurate.total_bounds
41 | ax.set_xlim(minx, maxx)
42 | ax.set_ylim(miny, maxy)
43 |
44 | buildings.plot(ax=ax, color="lightgray", alpha=0.7, edgecolor="gray", linewidth=0.5, label="Buildings")
45 |
46 | point.plot(ax=ax, color="purple", markersize=20, edgecolor="black", label="Viewpoint")
47 | legend_elements = []
48 |
49 | if not common_area.empty:
50 | style = dict(color="#1f77b4", alpha=0.5, edgecolor="#0d3d66")
51 | common_area.plot(ax=ax, **style, linewidth=1)
52 | legend_elements.append(Patch(**style, label="Agreement Area (both methods)"))
53 |
54 | if not simple_only.empty:
55 | style = dict(color="#d62728", alpha=0.6, edgecolor="#8b0000")
56 | simple_only.plot(ax=ax, **style, linewidth=1)
57 | legend_elements.append(Patch(**style, label="False Positive (Simple method)"))
58 |
59 | if not accurate_only.empty:
60 | style = dict(color="#2ca02c", alpha=0.6, edgecolor="#006400")
61 | accurate_only.plot(ax=ax, **style, linewidth=1)
62 | legend_elements.append(Patch(**style, label="Advantage (Accurate method)"))
63 |
64 | ax.set_title(f"Visibility comparison\n" f"Radius: {radius}m")
65 | ax.legend(handles=legend_elements, loc="upper left")
66 | ax.set_axis_off()
67 |
68 | output_path = os.path.join(output_dir, "visibility_comparison_methods.png")
69 | plt.savefig(output_path, bbox_inches="tight", dpi=150, facecolor="white")
70 | plt.close()
71 |
72 | assert not simple.is_empty.all()
73 | assert not accurate.is_empty.all()
74 |
75 |
76 | def test_multiple_visibility(gdf_3points, buildings_data):
77 | local_crs = buildings_data.estimate_utm_crs()
78 | result = get_visibilities_from_points(gdf_3points.to_crs(local_crs), buildings_data.to_crs(local_crs), 800)
79 | result = gpd.GeoDataFrame(geometry=result, crs=local_crs)
80 | assert len(result) == len(gdf_3points)
81 |
--------------------------------------------------------------------------------