├── Dashimo.psd1
├── Dashimo.psm1
├── Example
├── Output
│ ├── DashboardActiveDirectory.html
│ ├── DashboardChartsBar.html
│ ├── DashboardChartsBar00.html
│ ├── DashboardChartsLine.html
│ ├── DashboardEasy.html
│ ├── DashboardEasy01.html
│ ├── DashboardEasy02.html
│ ├── DashboardEasy03.html
│ ├── DashboardEasy04_00.html
│ ├── DashboardEasy04_01.html
│ ├── DashboardEasy04_02.html
│ ├── DashboardEasy04_03.html
│ ├── DashboardEasy04_04.html
│ ├── DashboardEasy05.html
│ ├── DashboardEasy06.html
│ ├── DashboardEasy07.html
│ ├── DashboardEasy08.html
│ ├── DashboardEasy09.html
│ ├── DashboardEasy10.html
│ ├── DashboardEasyConditions.html
│ ├── DashboardMixedContent.html
│ ├── DashboardTabsCharts.html
│ └── DashboardTabsLoop.html
├── Run-AdvancedActiveDirectoryDashboard.ps1
├── Run-ChartsBar.ps1
├── Run-ChartsBar00.ps1
├── Run-ChartsLine.ps1
├── Run-ComplicatedExample.ps1
├── Run-EasyDashboard.ps1
├── Run-EasyDashboardConditions.ps1
├── Run-SimplestTable01-DefaultSort.ps1
├── Run-SimplestTable02.ps1
├── Run-SimplestTable03.ps1
├── Run-SimplestTable04.ps1
├── Run-SimplestTable05.ps1
├── Run-SimplestTable06.ps1
├── Run-SimplestTable07.ps1
├── Run-SimplestTable08.ps1
├── Run-SimplestTable09.ps1
├── Run-SimplestTable10.ps1
└── Run-TabsLoop.ps1
└── Readme.md
/Dashimo.psd1:
--------------------------------------------------------------------------------
1 | #
2 | # Module manifest for module 'Dashimo'
3 | #
4 | # Generated by: Przemyslaw Klys
5 | #
6 | # Generated on: 28.09.2019
7 | #
8 |
9 | @{
10 |
11 | # Script module or binary module file associated with this manifest.
12 | RootModule = 'Dashimo.psm1'
13 |
14 | # Version number of this module.
15 | ModuleVersion = '0.0.22'
16 |
17 | # Supported PSEditions
18 | # CompatiblePSEditions = @()
19 |
20 | # ID used to uniquely identify this module
21 | GUID = '727bc45f-468d-4117-b4ff-4245602e0758'
22 |
23 | # Author of this module
24 | Author = 'Przemyslaw Klys'
25 |
26 | # Company or vendor of this module
27 | CompanyName = 'Evotec'
28 |
29 | # Copyright statement for this module
30 | Copyright = '(c) 2011-2019 Przemyslaw Klys. All rights reserved.'
31 |
32 | # Description of the functionality provided by this module
33 | Description = 'Simple module to help building HTML Dashboard. This module has now been integrated into PSWriteHTML and it''s not nessecary to download it separtly anymore.'
34 |
35 | # Minimum version of the Windows PowerShell engine required by this module
36 | PowerShellVersion = '5.1'
37 |
38 | # Name of the Windows PowerShell host required by this module
39 | # PowerShellHostName = ''
40 |
41 | # Minimum version of the Windows PowerShell host required by this module
42 | # PowerShellHostVersion = ''
43 |
44 | # Minimum version of Microsoft .NET Framework required by this module. This prerequisite is valid for the PowerShell Desktop edition only.
45 | # DotNetFrameworkVersion = ''
46 |
47 | # Minimum version of the common language runtime (CLR) required by this module. This prerequisite is valid for the PowerShell Desktop edition only.
48 | # CLRVersion = ''
49 |
50 | # Processor architecture (None, X86, Amd64) required by this module
51 | # ProcessorArchitecture = ''
52 |
53 | # Modules that must be imported into the global environment prior to importing this module
54 | RequiredModules = @(@{ModuleName = 'PSSharedGoods'; GUID = 'ee272aa8-baaa-4edf-9f45-b6d6f7d844fe'; ModuleVersion = '0.0.103'; },
55 | @{ModuleName = 'PSWriteHTML'; GUID = 'a7bdf640-f5cb-4acf-9de0-365b322d245c'; ModuleVersion = '0.0.54'; })
56 |
57 | # Assemblies that must be loaded prior to importing this module
58 | # RequiredAssemblies = @()
59 |
60 | # Script files (.ps1) that are run in the caller's environment prior to importing this module.
61 | # ScriptsToProcess = @()
62 |
63 | # Type files (.ps1xml) to be loaded when importing this module
64 | # TypesToProcess = @()
65 |
66 | # Format files (.ps1xml) to be loaded when importing this module
67 | # FormatsToProcess = @()
68 |
69 | # Modules to import as nested modules of the module specified in RootModule/ModuleToProcess
70 | # NestedModules = @()
71 |
72 | # Functions to export from this module, for best performance, do not use wildcards and do not delete the entry, use an empty array if there are no functions to export.
73 | FunctionsToExport = @()
74 |
75 | # Cmdlets to export from this module, for best performance, do not use wildcards and do not delete the entry, use an empty array if there are no cmdlets to export.
76 | CmdletsToExport = @()
77 |
78 | # Variables to export from this module
79 | # VariablesToExport = @()
80 |
81 | # Aliases to export from this module, for best performance, do not use wildcards and do not delete the entry, use an empty array if there are no aliases to export.
82 | AliasesToExport = @()
83 |
84 | # DSC resources to export from this module
85 | # DscResourcesToExport = @()
86 |
87 | # List of all modules packaged with this module
88 | # ModuleList = @()
89 |
90 | # List of all files packaged with this module
91 | # FileList = @()
92 |
93 | # Private data to pass to the module specified in RootModule/ModuleToProcess. This may also contain a PSData hashtable with additional module metadata used by PowerShell.
94 | PrivateData = @{
95 |
96 | PSData = @{
97 |
98 | # Tags applied to this module. These help with module discovery in online galleries.
99 | Tags = 'Windows', 'MacOs', 'Linux', 'HTML', 'Dashboard', 'Table'
100 |
101 | # A URL to the license for this module.
102 | # LicenseUri = ''
103 |
104 | # A URL to the main website for this project.
105 | ProjectUri = 'https://github.com/EvotecIT/Dashimo'
106 |
107 | # A URL to an icon representing this module.
108 | IconUri = 'https://evotec.xyz/wp-content/uploads/2019/04/Dashimo.png'
109 |
110 | # ReleaseNotes of this module
111 | # ReleaseNotes = ''
112 |
113 | } # End of PSData hashtable
114 |
115 | } # End of PrivateData hashtable
116 |
117 | # HelpInfo URI of this module
118 | # HelpInfoURI = ''
119 |
120 | # Default prefix for commands exported from this module. Override the default prefix using Import-Module -Prefix.
121 | # DefaultCommandPrefix = ''
122 |
123 | }
--------------------------------------------------------------------------------
/Dashimo.psm1:
--------------------------------------------------------------------------------
1 | #Get public and private function definition files.
2 | $Public = @( Get-ChildItem -Path $PSScriptRoot\Public\*.ps1 -ErrorAction SilentlyContinue -Recurse )
3 | $Private = @( Get-ChildItem -Path $PSScriptRoot\Private\*.ps1 -ErrorAction SilentlyContinue -Recurse )
4 |
5 | #Dot source the files
6 | Foreach ($Import in @($Public + $Private)) {
7 | Try {
8 | . $Import.fullname
9 | } Catch {
10 | Write-Error -Message "Failed to Import function $($Import.fullname): $_"
11 | }
12 | }
13 | Export-ModuleMember -Function '*'
--------------------------------------------------------------------------------
/Example/Output/DashboardTabsCharts.html:
--------------------------------------------------------------------------------
1 |
2 |
3 | My title
8 |
9 |
1341 |
1342 |
1343 |
1389 |
1390 |
1391 |
1392 |
1393 |
1394 |
1395 |
--------------------------------------------------------------------------------
/Example/Run-AdvancedActiveDirectoryDashboard.ps1:
--------------------------------------------------------------------------------
1 |
2 | Import-Module Dashimo -Force
3 | Import-Module PSWinDocumentation.AD -Force
4 | Import-Module PSWinReportingV2
5 |
6 | if ($null -eq $DataSetForest) {
7 | $DataSetForest = Get-WinADForestInformation -Verbose -DontRemoveEmpty -PasswordQuality -Splitter "`r`n"
8 | }
9 | if ($null -eq $DataSetEvents) {
10 | $DataSetEvents = Find-Events -Report ADUserChangesDetailed, ADUserChanges, ADUserLockouts, ADUserStatus, ADGroupChanges -Servers 'AD1', 'AD2' -DatesRange Last7days -Quiet
11 | }
12 |
13 | Dashboard -Name 'Dashimo Test' -FilePath $PSScriptRoot\Output\DashboardActiveDirectory.html -Show {
14 | Tab -Name 'Forest' {
15 | Section -Name 'Forest Information' -Invisible {
16 | Section -Name 'Forest Information' {
17 | Table -HideFooter -DataTable $DataSetForest.ForestInformation
18 | }
19 | Section -Name 'FSMO Roles' {
20 | Table -HideFooter -DataTable $DataSetForest.ForestFSMO
21 | }
22 |
23 | }
24 | Section -Name 'Forest Domain Controllers' -Collapsable {
25 | Panel {
26 | Table -HideFooter -DataTable $DataSetForest.ForestDomainControllers
27 | }
28 | }
29 | Section -Name 'Forest Optional Features / UPN Suffixes / SPN Suffixes' -Collapsable {
30 |
31 | Panel {
32 | Table -HideFooter -DataTable $DataSetForest.ForestOptionalFeatures -Verbose
33 | }
34 | Panel {
35 | Table -HideFooter -DataTable $DataSetForest.ForestUPNSuffixes -Verbose
36 | }
37 | Panel {
38 | Table -HideFooter -DataTable $DataSetForest.ForestSPNSuffixes -Verbose
39 | }
40 | }
41 | Section -Name 'Sites / Subnets / SiteLinks' -Collapsable {
42 | Panel {
43 | Table -HideFooter -DataTable $DataSetForest.ForestSites -Verbose
44 | }
45 | Panel {
46 | Table -HideFooter -DataTable $DataSetForest.ForestSubnets -Verbose
47 | }
48 | Panel {
49 | Table -HideFooter -DataTable $DataSetForest.ForestSiteLinks -Verbose
50 | }
51 | }
52 | }
53 |
54 | foreach ($Domain in $DataSetForest.FoundDomains.Keys) {
55 | Tab -Name $Domain {
56 | Section -Name 'Domain Controllers / FSMO Roles' {
57 | Panel {
58 | Table -HideFooter -DataTable $DataSetForest.FoundDomains.$Domain.DomainControllers -Verbose
59 | }
60 | Panel {
61 | Table -HideFooter -DataTable $DataSetForest.FoundDomains.$Domain.DomainFSMO -Verbose
62 | }
63 | }
64 |
65 |
66 | Section -Name 'Password Policies' -Invisible {
67 | Section -Name 'Default Password Policy' {
68 | Table -HideFooter -DataTable $DataSetForest.FoundDomains.$Domain.DomainDefaultPasswordPolicy -Verbose
69 | }
70 |
71 | Section -Name 'Domain Fine Grained Policies' {
72 | Table -HideFooter -DataTable $DataSetForest.FoundDomains.$Domain.DomainFineGrainedPolicies -Verbose
73 | }
74 | }
75 | Section -Name 'Users' {
76 | Panel {
77 | Table -HideFooter -DataTable $DataSetForest.FoundDomains.$Domain.DomainUsers
78 | }
79 | }
80 | Section -Name 'Computers' {
81 | Panel {
82 | Table -HideFooter -DataTable $DataSetForest.FoundDomains.$Domain.DomainComputers
83 | }
84 | }
85 | Section -Name 'Groups Priviliged' {
86 | Panel {
87 | Table -HideFooter -DataTable $DataSetForest.FoundDomains.$Domain.DomainGroupsPriviliged
88 | }
89 | Panel {
90 | #Chart -DataTable $DataSetForest.FoundDomains.'ad.evotec.xyz'.DomainGroupsPriviliged -DataNames 'Group Name' -DataCategories $DataSetForest.FoundDomains.'ad.evotec.xyz'.DomainGroupsPriviliged.'Members Count' -DataValues 'Members Count'
91 | }
92 | }
93 | Section -Name 'Organizational Units' {
94 | Table -HideFooter -DataTable $DataSetForest.FoundDomains.$Domain.DomainOrganizationalUnits
95 | }
96 | Section -Name 'OU ACL Basic' {
97 | Panel {
98 | Table -HideFooter -DataTable $DataSetForest.FoundDomains.$Domain.DomainOrganizationalUnitsBasicACL
99 | }
100 | }
101 | Section -Name 'OU ACL Extended' {
102 | Panel {
103 | Table -HideFooter -DataTable $DataSetForest.FoundDomains.$Domain.DomainOrganizationalUnitsExtended
104 | }
105 | }
106 |
107 | }
108 | }
109 | Tab -Name 'Changes in Last 7 days' {
110 | Section -Name 'Group Changes' -Collapsable {
111 | Table -HideFooter -DataTable $DataSetEvents.ADGroupChanges
112 | }
113 | Section -Name 'User Status' -Collapsable {
114 | Table -HideFooter -DataTable $DataSetEvents.ADUserStatus
115 | }
116 | Section -Name 'User Changes' -Collapsable {
117 | Table -HideFooter -DataTable $DataSetEvents.ADGroupChanges
118 | }
119 | Section -Name 'User Lockouts' -Collapsable {
120 | Table -HideFooter -DataTable $DataSetEvents.ADUserStatus
121 | }
122 | }
123 | }
--------------------------------------------------------------------------------
/Example/Run-ChartsBar.ps1:
--------------------------------------------------------------------------------
1 | Import-Module Dashimo -Force
2 |
3 | Dashboard -Name 'Charts - Bar' -FilePath $PSScriptRoot\Output\DashboardChartsBar.html {
4 | TabOptions -SlimTabs
5 | Tab -Name 'Bar Charts - Bar' -IconRegular chart-bar {
6 | Section -Name 'Bar Charts - Test' -Collapsable {
7 | Panel {
8 | Chart {
9 | ChartLegend -Name 'Time'
10 | ChartBar -Name 'Test' -Value 1
11 | ChartBar -Name 'Test1' -Value 2
12 | ChartBar -Name 'Test2' -Value 3
13 | }
14 | }
15 | Panel {
16 | Chart {
17 | ChartToolbar -Download
18 | ChartLegend -Name 'Time', 'Money', 'Taxes'
19 | ChartBar -Name 'Test' -Value 1, 2, 3
20 | ChartBar -Name 'Test1' -Value 2, 5, 7
21 | ChartBar -Name 'Test2' -Value 3, 1, 2
22 | }
23 | }
24 | Panel {
25 | Chart {
26 | ChartLegend -Name 'Time'
27 | for ($i = 0; $i -le 5; $i++) {
28 | ChartBar -Name "Test $i" -Value $i
29 | }
30 | }
31 | }
32 | Panel {
33 | Chart {
34 | ChartBarOptions -Vertical -DataLabelsColor GreenYellow
35 | ChartLegend -Name 'Time'
36 | for ($i = 0; $i -le 5; $i++) {
37 | ChartBar -Name "Test $i" -Value $i
38 | }
39 | }
40 | }
41 | }
42 | Section -Name 'Bar Charts - Test Colors' -Collapsable {
43 | Panel -Invisible {
44 | Chart {
45 | ChartLegend -Name 'Time'
46 | ChartBar -Name 'Test' -Value 1
47 | ChartBar -Name 'Test1' -Value 2
48 | ChartBar -Name 'Test2' -Value 3
49 | }
50 | }
51 | Panel -Invisible {
52 | Chart {
53 | ChartLegend -Name 'Time', 'Money', 'Taxes'
54 | ChartBar -Name 'Test' -Value 1, 2, 3
55 | ChartBar -Name 'Test1' -Value 2, 5, 7
56 | ChartBar -Name 'Test2' -Value 3, 1, 2
57 | }
58 | }
59 | Panel -Invisible {
60 | Chart {
61 | ChartLegend -Name 'Time'
62 | for ($i = 0; $i -le 5; $i++) {
63 | ChartBar -Name "Test $i" -Value $i
64 | }
65 | }
66 | }
67 | Panel -Invisible {
68 | Chart {
69 | ChartBarOptions -Vertical -DataLabelsColor GreenYellow
70 | ChartLegend -Name 'Time'
71 | for ($i = 0; $i -le 5; $i++) {
72 | ChartBar -Name "Test $i" -Value $i
73 | }
74 | }
75 | }
76 | }
77 | Section -Name 'Bar Charts - Standard Bar' -Collapsable {
78 |
79 | Panel {
80 | $Data1 = 400, 430, 448, 470, 540, 580, 690, 1100, 1200, 1380
81 | $DataNames1 = 'South Korea', 'Canada', 'United Kingdom', 'Netherlands', 'Italy', 'France', 'Japan', 'United States', 'China', 'Germany'
82 | Chart {
83 | ChartLegend -Name 'Number of bottles'
84 | for ($i = 0; $i -lt $Data1.Count; $i++) {
85 | ChartBar -Name $DataNames1[$i] -Value $Data1[$i]
86 | }
87 | }
88 | }
89 |
90 | Panel {
91 | $Data1 = 44, 55, 41, 64, 22, 43, 21
92 | $Data2 = 53, 32, 33, 52, 13, 44, 32
93 | $DataNames1 = 2001, 2002, 2003, 2004, 2005, 2006, 2007
94 |
95 | Chart -Title 'Born vs Dead' -TitleAlignment center {
96 | #ChartBarOptions
97 | ChartLegend -Name 'Born', 'Died'
98 | for ($i = 0; $i -lt $Data1.Count; $i++) {
99 | ChartBar -Name $DataNames1[$i] -Value $Data1[$i], $Data2[$i]
100 | }
101 | }
102 | }
103 | }
104 | Section -Name 'Bar Charts - Standard Bar Vertical' -Collapsable {
105 |
106 | Panel {
107 | $Data1 = 400, 430, 448, 470, 540, 580, 690, 1100, 1200, 1380
108 | $DataNames1 = 'South Korea', 'Canada', 'United Kingdom', 'Netherlands', 'Italy', 'France', 'Japan', 'United States', 'China', 'Germany'
109 | Chart {
110 | ChartBarOptions -Vertical
111 | ChartLegend -Name 'Number of bottles'
112 | for ($i = 0; $i -lt $Data1.Count; $i++) {
113 | ChartBar -Name $DataNames1[$i] -Value $Data1[$i]
114 | }
115 | }
116 | }
117 |
118 | Panel {
119 | $Data1 = 44, 55, 41, 64, 22, 43, 21
120 | $Data2 = 53, 32, 33, 52, 13, 44, 32
121 | $DataNames1 = 2001, 2002, 2003, 2004, 2005, 2006, 2007
122 |
123 | Chart -Title 'Born vs Dead' -TitleAlignment center {
124 | ChartBarOptions -Vertical
125 | ChartLegend -Name 'Born', 'Died'
126 | for ($i = 0; $i -lt $Data1.Count; $i++) {
127 | ChartBar -Name $DataNames1[$i] -Value $Data1[$i], $Data2[$i]
128 | }
129 | }
130 | }
131 | }
132 | Section -Name 'Bar Charts - Standard Bar Vertical & Patterned' -Collapsable {
133 |
134 | Panel {
135 | $Data1 = 400, 430, 448, 470, 540, 580, 690, 1100, 1200, 1380
136 | $DataNames1 = 'South Korea', 'Canada', 'United Kingdom', 'Netherlands', 'Italy', 'France', 'Japan', 'United States', 'China', 'Germany'
137 | Chart {
138 | ChartBarOptions -Vertical -Patterned
139 | ChartLegend -Name 'Number of bottles'
140 | for ($i = 0; $i -lt $Data1.Count; $i++) {
141 | ChartBar -Name $DataNames1[$i] -Value $Data1[$i]
142 | }
143 | }
144 | }
145 |
146 | Panel {
147 | $Data1 = 44, 55, 41, 64, 22, 43, 21
148 | $Data2 = 53, 32, 33, 52, 13, 44, 32
149 | $DataNames1 = 2001, 2002, 2003, 2004, 2005, 2006, 2007
150 |
151 | Chart -Title 'Born vs Dead' -TitleAlignment center {
152 | ChartBarOptions -Vertical -Patterned
153 | ChartLegend -Name 'Born', 'Died'
154 | for ($i = 0; $i -lt $Data1.Count; $i++) {
155 | ChartBar -Name $DataNames1[$i] -Value $Data1[$i], $Data2[$i]
156 | }
157 | }
158 | }
159 | }
160 | }
161 | Tab -Name 'Bar Charts - Bar Stacked' -IconRegular chart-bar {
162 |
163 | Section -Name 'Bar Charts 1 - Bar Stacked' -Collapsable {
164 | # One way to build charts but with 2 values
165 | Panel {
166 | $Data1 = 400, 430, 448, 470, 540, 580, 690, 1100, 1200, 1380
167 | $Data2 = 44, 55, 41, 64, 22, 43, 21
168 | $Data3 = 53, 32, 33, 52, 13, 44, 32
169 | $DataNames1 = 'South Korea', 'Canada', 'United Kingdom', 'Netherlands', 'Italy', 'France', 'Japan', 'United States', 'China', 'Germany'
170 |
171 | Chart {
172 | ChartBarOptions -Type barStacked
173 | ChartLegend -Name 'People', 'Pets', 'Furniture'
174 | for ($i = 0; $i -lt $Data1.Count; $i++) {
175 | ChartBar -Name $DataNames1[$i] -Value $Data1[$i], $Data2[$i], $Data3[$i]
176 | }
177 | }
178 | }
179 | Panel {
180 | $DataNames1 = 2001, 2002, 2003, 2004, 2005, 2006, 2007
181 | Chart -Title 'Pets vs People' -TitleAlignment center {
182 | ChartBarOptions -Type barStacked
183 | ChartLegend -Name 'People', 'Pets'
184 | ChartBar -Name $DataNames1[0] -Value 44, 53
185 | ChartBar -Name $DataNames1[1] -Value 55, 32
186 | ChartBar -Name $DataNames1[2] -Value 41, 33
187 | ChartBar -Name $DataNames1[3] -Value 64, 52
188 | ChartBar -Name $DataNames1[4] -Value 22, 13
189 | ChartBar -Name $DataNames1[5] -Value 43, 44
190 | ChartBar -Name $DataNames1[6] -Value 21, 32
191 | }
192 | }
193 | }
194 | }
195 | Tab -Name 'Bar Charts - Bar Stacked 100%' -IconSolid audio-description {
196 | Section -Name 'Bar Charts - Stacked 100%' -Collapsable {
197 | Panel {
198 | $Data1 = 44, 55, 41, 37, 22, 43, 21
199 | $Data2 = 53, 32, 33, 52, 13, 43, 32
200 | $Data3 = 12, 17, 11, 9, 15, 11, 20
201 | $Data4 = 9, 7, 5, 8, 6, 9, 4
202 | $Data5 = 25, 12, 19, 32, 25, 24, 10
203 | $DataNames1 = 2008, 2009, 2010, 2011, 2012, 2013, 2014
204 | Chart -Title 'Finctional Books Sales' {
205 | ChartBarOptions -Type barStacked100Percent
206 | ChartLegend -Names 'Marine Sprite', 'Striking Calf', 'Tank Picture', 'Tank Picture', 'Bucket Slope', 'Reborn Kid', 'Other' -LegendPosition top
207 | for ($i = 0; $i -lt $Data1.Count; $i++) {
208 | ChartBar -Name $DataNames1[$i] -Value $Data1[$i], $Data2[$i], $Data3[$i], $Data4[$i], $Data5[$i]
209 | }
210 | }
211 | }
212 | Panel {
213 | $Data1 = 44, 55, 41, 64, 22, 43, 21
214 | $Data2 = 53, 32, 33, 52, 13, 44, 32
215 | $DataNames1 = 2001, 2002, 2003, 2004, 2005, 2006, 2007
216 | Chart -Title 'Pets vs People' -TitleAlignment center {
217 | ChartBarOptions -Type barStacked100Percent
218 | ChartLegend -Names 'People', 'Pets' -LegendPosition bottom
219 | for ($i = 0; $i -lt $Data1.Count; $i++) {
220 | ChartBar -Name $DataNames1[$i] -Value $Data1[$i], $Data2[$i]
221 | }
222 | }
223 | }
224 | }
225 | }
226 | Tab -Name 'Bar Charts - Bar Stacked Plus/Minus' -IconRegular file {
227 | Section -Name 'Bar Charts - Stacked 100%' -Collapsable {
228 | Panel {
229 | $Data1 = -0.8, -1.05, -1.06, -1.18, -1.4, -2.2, -2.85, -3.7, -3.96, -4.22, -4.3, -4.4, -4.1, -4, -4.1, -3.4, -3.1, -2.8
230 | $Data2 = 0.4, 0.65, 0.76, 0.88, 1.5, 2.1, 2.9, 3.8, 3.9, 4.2, 4, 4.3, 4.1, 4.2, 4.5, 3.9, 3.5, 3
231 | $DataLegend = 'Males', 'Females' # should match amount of data sets
232 | $DataNames = '85+', '80-84', '75-79', '70-74', '65-69', '60-64', '55-59', '50-54', '45-49', '40-44', '35-39', '30-34', '25-29', '20-24', '15-19', '10-14', '5-9', '0-4'
233 |
234 | Chart -Title 'Mauritius population pyramid 2011' {
235 | ChartBarOptions -Type barStacked
236 | ChartLegend -Names $DataLegend -LegendPosition top
237 | for ($i = 0; $i -lt $Data1.Count; $i++) {
238 | ChartBar -Name $DataNames[$i] -Value $Data1[$i], $Data2[$i]
239 | }
240 | }
241 |
242 | #ChartBar -Data $Data1, $Data2 -DataNames $DataNames -DataLegend $DataLegend -Type barStacked -DataLabelsEnabled $true -Height 500
243 |
244 | }
245 | Panel {
246 | $Data1 = -0.8, -1.05, -1.06, -1.18, -1.4, -2.2, -2.85, -3.7, -3.96, -4.22, -4.3, -4.4, -4.1, -4, -4.1, -3.4, -3.1, -2.8
247 | $Data2 = 0.4, 0.65, 0.76, 0.88, 1.5, 2.1, 2.9, 3.8, 3.9, 4.2, 4, 4.3, 4.1, 4.2, 4.5, 3.9, 3.5, 3
248 | $DataLegend = 'Males', 'Females' # should match amount of data sets
249 | $DataNames = '85+', '80-84', '75-79', '70-74', '65-69', '60-64', '55-59', '50-54', '45-49', '40-44', '35-39', '30-34', '25-29', '20-24', '15-19', '10-14', '5-9', '0-4'
250 |
251 | Chart -Title 'Mauritius population pyramid 2011' {
252 | ChartBarOptions -Type barStacked -Vertical
253 | ChartLegend -Names $DataLegend -LegendPosition top
254 | for ($i = 0; $i -lt $Data1.Count; $i++) {
255 | ChartBar -Name $DataNames[$i] -Value $Data1[$i], $Data2[$i]
256 | }
257 | }
258 | }
259 | }
260 | }
261 | } -Show
--------------------------------------------------------------------------------
/Example/Run-ChartsBar00.ps1:
--------------------------------------------------------------------------------
1 | Import-Module Dashimo -Force
2 |
3 | $Process = Get-Process | Select-Object -First 30
4 |
5 | Dashboard -Name 'Charts - Bar' -FilePath $PSScriptRoot\Output\DashboardChartsBar00.html {
6 | Section -Invisible {
7 | Panel -Invisible {
8 | Chart {
9 | ChartLegend -Name 'Time'
10 | ChartBar -Name 'Test' -Value 1
11 | ChartBar -Name 'Test1' -Value 2
12 | ChartBar -Name 'Test2' -Value 3
13 | }
14 | }
15 | Panel -Invisible {
16 | Chart {
17 | ChartToolbar -Download
18 | ChartLegend -Name 'Time', 'Money', 'Taxes'
19 | ChartBar -Name 'Test' -Value 1, 2, 3
20 | ChartBar -Name 'Test1' -Value 2, 5, 7
21 | ChartBar -Name 'Test2' -Value 3, 1, 2
22 | }
23 | }
24 | Panel -Invisible {
25 | Chart {
26 | ChartLegend -Name 'Time'
27 | for ($i = 0; $i -le 5; $i++) {
28 | ChartBar -Name "Test $i" -Value $i
29 | }
30 | }
31 | }
32 | Panel -Invisible {
33 | Chart {
34 | ChartBarOptions -Vertical -DataLabelsColor GreenYellow
35 | ChartLegend -Name 'Time'
36 | for ($i = 0; $i -le 5; $i++) {
37 | ChartBar -Name "Test $i" -Value $i
38 | }
39 | }
40 | }
41 | }
42 | Section -Invisible {
43 | Table -DataTable $Process -HideFooter {
44 | TableConditionalFormatting -Name 'ID' -ComparisonType number -Operator gt -Value 10000 -Color BlueViolet -Row
45 | TableConditionalFormatting -Name 'Name' -ComparisonType string -Operator eq -Value 'chrome' -Color White -BackgroundColor Crimson -Row
46 | TableConditionalFormatting -Name 'PriorityClass' -ComparisonType string -Operator eq -Value 'Idle' -Color White -BackgroundColor Green
47 | }
48 | }
49 | Section -Invisible {
50 | Panel -Invisible {
51 | Chart -Title 'Incidents Reported vs Solved' -TitleAlignment center {
52 | ChartAxisX -Name 'Jan', 'Feb', 'Mar', 'Apr', 'May', 'Jun', 'Jul', 'Aug', 'Sep'
53 | ChartLine -Name 'Incidents per month' -Value 10, 41, 35, 51, 49, 62, 69, 91, 148
54 | ChartLine -Name 'Incidents per month resolved' -Value 5, 10, 20, 31, 49, 62, 69, 91, 148
55 | }
56 | }
57 | Panel -Invisible {
58 | Chart -Title 'Incidents Reported vs Solved' -TitleAlignment center {
59 | ChartAxisX -Name 'Jan', 'Feb', 'Mar', 'Apr', 'May', 'Jun', 'Jul', 'Aug', 'Sep'
60 | ChartLine -Name 'Incidents per month' -Value 10, 41, 35, 51, 49, 62, 69, 91, 148 -Color Red -Cap square -Dash 5
61 | ChartLine -Name 'Incidents per month resolved' -Value 5, 10, 20, 31, 49, 62, 69, 91, 148 -Color Green -Curve stepline -Width 10
62 | }
63 | }
64 | Panel -Invisible {
65 | Table -DataTable $Process -Filtering -FilteringLocation Bottom -PagingOptions 7, 14 {
66 | TableButtonExcel
67 | TableButtonPDF -Title 'Test' -PageSize A4 -Orientation landscape
68 | TableButtonPageLength
69 | TableConditionalFormatting -Name 'ID' -ComparisonType number -Operator gt -Value 10000 -Color BlueViolet -Row
70 | TableConditionalFormatting -Name 'Name' -ComparisonType string -Operator eq -Value 'chrome' -Color White -BackgroundColor Crimson -Row
71 | TableConditionalFormatting -Name 'PriorityClass' -ComparisonType string -Operator eq -Value 'Idle' -Color White -BackgroundColor Green
72 | }
73 | }
74 | }
75 | } -Show
--------------------------------------------------------------------------------
/Example/Run-ChartsLine.ps1:
--------------------------------------------------------------------------------
1 | Import-Module Dashimo -Force
2 |
3 | Dashboard -Name 'Charts - Line' -FilePath $PSScriptRoot\Output\DashboardChartsLine.html {
4 | TabOptions -SlimTabs
5 | Tab -Name 'Line Charts' -IconRegular hourglass {
6 | Section -Name 'Line Charts - Test' -Collapsable {
7 | Panel {
8 | Chart -Title 'Incidents Reported vs Solved' -TitleAlignment center {
9 | ChartAxisX -Name 'Jan', 'Feb', 'Mar', 'Apr', 'May', 'Jun', 'Jul', 'Aug', 'Sep'
10 | ChartLine -Name 'Incidents per month' -Value 10, 41, 35, 51, 49, 62, 69, 91, 148
11 | ChartLine -Name 'Incidents per month resolved' -Value 5, 10, 20, 31, 49, 62, 69, 91, 148
12 | }
13 | }
14 | Panel {
15 | Chart -Title 'Incidents Reported vs Solved' -TitleAlignment center {
16 | ChartAxisX -Name 'Jan', 'Feb', 'Mar', 'Apr', 'May', 'Jun', 'Jul', 'Aug', 'Sep'
17 | ChartLine -Name 'Incidents per month' -Value 10, 41, 35, 51, 49, 62, 69, 91, 148 -Color Red -Cap square -Dash 5
18 | ChartLine -Name 'Incidents per month resolved' -Value 5, 10, 20, 31, 49, 62, 69, 91, 148 -Color Green -Curve stepline -Width 10
19 | }
20 | }
21 |
22 | }
23 | Section -Name 'Line Charts - Test' -Collapsable {
24 | Panel {
25 | Chart -Title 'Product Trends by Month' -TitleAlignment center {
26 | ChartAxisX -Name 'Jan', 'Feb', 'Mar', 'Apr', 'May', 'Jun', 'Jul', 'Aug', 'Sep'
27 | ChartLine -Name 'Desktop' -Value 10, 41, 35, 51, 49, 62, 69, 91, 148
28 | }
29 | }
30 | Panel {
31 | Chart -Title 'Average High & Low Temperature' -TitleAlignment left {
32 | ChartAxisX -Name 'Jan', 'Feb', 'Mar', 'Apr', 'May', 'Jun', 'Jul'
33 | ChartLine -Name "High - 2013" -Value 28, 29, 33, 36, 32, 32, 33 #-Color Red -Cap square -Dash 5
34 | ChartLine -Name "Low - 2013" -Value 12, 11, 14, 18, 17, 13, 13 #-Color Green -Curve stepline -Width 10
35 | }
36 | }
37 |
38 | }
39 | Section -Name 'Line Charts - Test' -Collapsable {
40 | Panel {
41 | Chart -Title 'Product Trends by Month' -TitleAlignment center {
42 | ChartAxisX -Name 'Jan', 'Feb', 'Mar', 'Apr', 'May', 'Jun', 'Jul', 'Aug', 'Sep'
43 | ChartLine -Name 'Desktop' -Value 10, 41, 35, 51, 49, 62, 69, 91, 148
44 | }
45 | }
46 | Panel {
47 | Chart -Title 'Average High & Low Temperature' -TitleAlignment left {
48 | ChartAxisX -Name 'Jan', 'Feb', 'Mar', 'Apr', 'May', 'Jun', 'Jul'
49 | ChartLine -Name "High - 2013" -Value 28, 29, 33, 36, 32, 32, 33 -Color Red -Cap square -Dash 5
50 | ChartLine -Name "Low - 2013" -Value 12, 11, 14, 18, 17, 13, 13 -Color BlueViolet
51 |
52 | }
53 | }
54 |
55 | }
56 | Section -Name 'Line Charts - Test' -Collapsable {
57 | Panel {
58 | Chart -Title 'Product Trends by Month' -TitleAlignment center {
59 | ChartAxisX -Name 'Jan', 'Feb', 'Mar', 'Apr', 'May', 'Jun', 'Jul', 'Aug', 'Sep'
60 | ChartLine -Name 'Desktop' -Value 10, 41, 35, 51, 49, 62, 69, 91, 148 -Curve stepline -Width 10
61 | }
62 | }
63 | Panel {
64 | Chart -Title 'Average High & Low Temperature' -TitleAlignment left {
65 | # This controls how the grid looks like
66 | ChartGrid -Show -Position front -xAxisLinesShow -StrokeDash 5 -RowColors Aquamarine, DarkCyan
67 | # This is category (responsible for values on axis X)
68 | ChartAxisX -Name 'Jan', 'Feb', 'Mar', 'Apr', 'May', 'Jun', 'Jul' -TitleText 'Month'
69 | ChartAxisY -TitleText 'Temperature' -Show -ShowAlways
70 | # Data and control of data
71 | ChartLine -Name "High - 2013" -Value 28, 29, 33, 36, 32, 32, 33 -Curve smooth #-Color Red -Cap square -Dash 5
72 | ChartLine -Name "Low - 2013" -Value 12, 11, 14, 18, 17, 13, 13 -Curve smooth #-Color Green -Curve stepline -Width 10
73 |
74 | }
75 | }
76 |
77 | }
78 | }
79 | } -Show
--------------------------------------------------------------------------------
/Example/Run-ComplicatedExample.ps1:
--------------------------------------------------------------------------------
1 | Import-Module Dashimo -Force
2 |
3 | $Process = Get-Process | Select-Object -First 30
4 |
5 | Dashboard -Name 'Mixed Content Example' -FilePath $PSScriptRoot\Output\DashboardMixedContent.html {
6 | TabOptions -SlimTabs
7 | Tab -Name 'Mixed content with Bars' -IconRegular chart-bar {
8 | Section -Name 'Bar Charts - Test' -Collapsable -BackgroundColor LightPink -TextColor Black {
9 | Panel {
10 | Chart {
11 | ChartLegend -Name 'Time'
12 | ChartBar -Name 'Test' -Value 1
13 | ChartBar -Name 'Test1' -Value 2
14 | ChartBar -Name 'Test2' -Value 3
15 | }
16 | }
17 | Panel {
18 | Chart {
19 | ChartToolbar -Download
20 | ChartLegend -Name 'Time', 'Money', 'Taxes'
21 | ChartBar -Name 'Test' -Value 1, 2, 3
22 | ChartBar -Name 'Test1' -Value 2, 5, 7
23 | ChartBar -Name 'Test2' -Value 3, 1, 2
24 | }
25 | }
26 | Panel {
27 | Chart {
28 | ChartLegend -Name 'Time'
29 | for ($i = 0; $i -le 5; $i++) {
30 | ChartBar -Name "Test $i" -Value $i
31 | }
32 | }
33 | }
34 | Panel {
35 | Chart {
36 | ChartBarOptions -Vertical -DataLabelsColor GreenYellow
37 | ChartLegend -Name 'Time'
38 | for ($i = 0; $i -le 5; $i++) {
39 | ChartBar -Name "Test $i" -Value $i
40 | }
41 | }
42 | }
43 | }
44 | Section -Name 'Test' -Collapsable -TextBackGroundColor Gray {
45 | Container {
46 | Panel {
47 | Table -DataTable $Process {
48 | TableButtonPDF -
49 | TableButtonCopy
50 | TableButtonExcel
51 | TableButtonPageLength
52 | } -Buttons @() -DisableSearch -PagingOptions @(5, 10) -HideFooter
53 | }
54 | Panel {
55 | Table -DataTable $Process -DisableSearch -HideFooter -PagingOptions @(5, 10)
56 | }
57 | Panel {
58 | Table -DataTable $Process -Buttons copyHtml5, excelHtml5, pdfHtml5 -DisableSearch -DisablePaging
59 | }
60 | }
61 | Container {
62 | Panel {
63 | Chart {
64 | ChartLegend -Name 'Time'
65 | ChartBar -Name 'Test' -Value 1
66 | ChartBar -Name 'Test1' -Value 2
67 | ChartBar -Name 'Test2' -Value 3
68 | }
69 | }
70 | Panel {
71 | Table -DataTable $Process {
72 | TableButtonPDF
73 | TableButtonCopy
74 | TableButtonExcel
75 | TableButtonPageLength
76 | } -DisableSearch -PagingOptions @(4, 8) -Filtering
77 | }
78 | Panel {
79 | Chart {
80 | ChartToolbar -Download
81 | ChartLegend -Name 'Time', 'Money', 'Taxes'
82 | ChartBar -Name 'Test' -Value 1, 2, 3
83 | ChartBar -Name 'Test1' -Value 2, 5, 7
84 | ChartBar -Name 'Test2' -Value 3, 1, 2
85 | }
86 | }
87 | Panel {
88 | Chart {
89 | ChartLegend -Name 'Time'
90 | for ($i = 0; $i -le 5; $i++) {
91 | ChartBar -Name "Test $i" -Value $i
92 | }
93 | }
94 | }
95 | Panel {
96 | Chart {
97 | ChartBarOptions -Vertical -DataLabelsColor GreenYellow
98 | ChartLegend -Name 'Time'
99 | for ($i = 0; $i -le 5; $i++) {
100 | ChartBar -Name "Test $i" -Value $i
101 | }
102 | }
103 | }
104 | }
105 | }
106 | Section -Name 'Bar Charts - Test Colors' -TextColor PaleVioletRed {
107 | Panel -Invisible {
108 | Chart {
109 | ChartLegend -Name 'Time'
110 | ChartBar -Name 'Test' -Value 1
111 | ChartBar -Name 'Test1' -Value 2
112 | ChartBar -Name 'Test2' -Value 3
113 | }
114 | }
115 | Panel -Invisible {
116 | Chart {
117 | ChartLegend -Name 'Time', 'Money', 'Taxes'
118 | ChartBar -Name 'Test' -Value 1, 2, 3
119 | ChartBar -Name 'Test1' -Value 2, 5, 7
120 | ChartBar -Name 'Test2' -Value 3, 1, 2
121 | }
122 | }
123 | Panel -Invisible {
124 | Chart {
125 | ChartLegend -Name 'Time'
126 | for ($i = 0; $i -le 5; $i++) {
127 | ChartBar -Name "Test $i" -Value $i
128 | }
129 | }
130 | }
131 | Panel -Invisible {
132 | Chart {
133 | ChartBarOptions -Vertical -DataLabelsColor GreenYellow
134 | ChartLegend -Name 'Time'
135 | for ($i = 0; $i -le 5; $i++) {
136 | ChartBar -Name "Test $i" -Value $i
137 | }
138 | }
139 | }
140 | }
141 | Section -Name 'Bar Charts - Standard Bar' -Collapsable {
142 |
143 | Panel {
144 | $Data1 = 400, 430, 448, 470, 540, 580, 690, 1100, 1200, 1380
145 | $DataNames1 = 'South Korea', 'Canada', 'United Kingdom', 'Netherlands', 'Italy', 'France', 'Japan', 'United States', 'China', 'Germany'
146 | Chart {
147 | ChartLegend -Name 'Number of bottles'
148 | for ($i = 0; $i -lt $Data1.Count; $i++) {
149 | ChartBar -Name $DataNames1[$i] -Value $Data1[$i]
150 | }
151 | }
152 | }
153 |
154 | Panel {
155 | $Data1 = 44, 55, 41, 64, 22, 43, 21
156 | $Data2 = 53, 32, 33, 52, 13, 44, 32
157 | $DataNames1 = 2001, 2002, 2003, 2004, 2005, 2006, 2007
158 |
159 | Chart -Title 'Born vs Dead' -TitleAlignment center {
160 | #ChartBarOptions
161 | ChartLegend -Name 'Born', 'Died'
162 | for ($i = 0; $i -lt $Data1.Count; $i++) {
163 | ChartBar -Name $DataNames1[$i] -Value $Data1[$i], $Data2[$i]
164 | }
165 | }
166 | }
167 | }
168 | Section -Name 'Bar Charts - Standard Bar Vertical' -Collapsable {
169 |
170 | Panel {
171 | $Data1 = 400, 430, 448, 470, 540, 580, 690, 1100, 1200, 1380
172 | $DataNames1 = 'South Korea', 'Canada', 'United Kingdom', 'Netherlands', 'Italy', 'France', 'Japan', 'United States', 'China', 'Germany'
173 | Chart {
174 | ChartBarOptions -Vertical
175 | ChartLegend -Name 'Number of bottles'
176 | for ($i = 0; $i -lt $Data1.Count; $i++) {
177 | ChartBar -Name $DataNames1[$i] -Value $Data1[$i]
178 | }
179 | }
180 | }
181 |
182 | Panel {
183 | $Data1 = 44, 55, 41, 64, 22, 43, 21
184 | $Data2 = 53, 32, 33, 52, 13, 44, 32
185 | $DataNames1 = 2001, 2002, 2003, 2004, 2005, 2006, 2007
186 |
187 | Chart -Title 'Born vs Dead' -TitleAlignment center {
188 | ChartBarOptions -Vertical
189 | ChartLegend -Name 'Born', 'Died'
190 | for ($i = 0; $i -lt $Data1.Count; $i++) {
191 | ChartBar -Name $DataNames1[$i] -Value $Data1[$i], $Data2[$i]
192 | }
193 | }
194 | }
195 | }
196 | Section -Name 'Bar Charts - Standard Bar Vertical & Patterned' -Collapsable {
197 |
198 | Panel {
199 | $Data1 = 400, 430, 448, 470, 540, 580, 690, 1100, 1200, 1380
200 | $DataNames1 = 'South Korea', 'Canada', 'United Kingdom', 'Netherlands', 'Italy', 'France', 'Japan', 'United States', 'China', 'Germany'
201 | Chart {
202 | ChartBarOptions -Vertical -Patterned
203 | ChartLegend -Name 'Number of bottles'
204 | for ($i = 0; $i -lt $Data1.Count; $i++) {
205 | ChartBar -Name $DataNames1[$i] -Value $Data1[$i]
206 | }
207 | }
208 | }
209 |
210 | Panel {
211 | $Data1 = 44, 55, 41, 64, 22, 43, 21
212 | $Data2 = 53, 32, 33, 52, 13, 44, 32
213 | $DataNames1 = 2001, 2002, 2003, 2004, 2005, 2006, 2007
214 |
215 | Chart -Title 'Born vs Dead' -TitleAlignment center {
216 | ChartBarOptions -Vertical -Patterned
217 | ChartLegend -Name 'Born', 'Died'
218 | for ($i = 0; $i -lt $Data1.Count; $i++) {
219 | ChartBar -Name $DataNames1[$i] -Value $Data1[$i], $Data2[$i]
220 | }
221 | }
222 | }
223 | }
224 | }
225 | Tab -Name 'Bar Charts - Bar Stacked' -IconRegular chart-bar {
226 |
227 | Section -Name 'Bar Charts 1 - Bar Stacked' -Collapsable {
228 | # One way to build charts but with 2 values
229 | Panel {
230 | $Data1 = 400, 430, 448, 470, 540, 580, 690, 1100, 1200, 1380
231 | $Data2 = 44, 55, 41, 64, 22, 43, 21
232 | $Data3 = 53, 32, 33, 52, 13, 44, 32
233 | $DataNames1 = 'South Korea', 'Canada', 'United Kingdom', 'Netherlands', 'Italy', 'France', 'Japan', 'United States', 'China', 'Germany'
234 |
235 | Chart {
236 | ChartBarOptions -Type barStacked
237 | ChartLegend -Name 'People', 'Pets', 'Furniture'
238 | for ($i = 0; $i -lt $Data1.Count; $i++) {
239 | ChartBar -Name $DataNames1[$i] -Value $Data1[$i], $Data2[$i], $Data3[$i]
240 | }
241 | }
242 | }
243 | Panel {
244 | $DataNames1 = 2001, 2002, 2003, 2004, 2005, 2006, 2007
245 | Chart -Title 'Pets vs People' -TitleAlignment center {
246 | ChartBarOptions -Type barStacked
247 | ChartLegend -Name 'People', 'Pets'
248 | ChartBar -Name $DataNames1[0] -Value 44, 53
249 | ChartBar -Name $DataNames1[1] -Value 55, 32
250 | ChartBar -Name $DataNames1[2] -Value 41, 33
251 | ChartBar -Name $DataNames1[3] -Value 64, 52
252 | ChartBar -Name $DataNames1[4] -Value 22, 13
253 | ChartBar -Name $DataNames1[5] -Value 43, 44
254 | ChartBar -Name $DataNames1[6] -Value 21, 32
255 | }
256 | }
257 | }
258 | }
259 | Tab -Name 'Bar Charts - Bar Stacked 100%' -IconSolid audio-description {
260 | Section -Name 'Bar Charts - Stacked 100%' -Collapsable {
261 | Panel {
262 | $Data1 = 44, 55, 41, 37, 22, 43, 21
263 | $Data2 = 53, 32, 33, 52, 13, 43, 32
264 | $Data3 = 12, 17, 11, 9, 15, 11, 20
265 | $Data4 = 9, 7, 5, 8, 6, 9, 4
266 | $Data5 = 25, 12, 19, 32, 25, 24, 10
267 | $DataNames1 = 2008, 2009, 2010, 2011, 2012, 2013, 2014
268 | Chart -Title 'Finctional Books Sales' {
269 | ChartBarOptions -Type barStacked100Percent
270 | ChartLegend -Names 'Marine Sprite', 'Striking Calf', 'Tank Picture', 'Tank Picture', 'Bucket Slope', 'Reborn Kid', 'Other' -LegendPosition top
271 | for ($i = 0; $i -lt $Data1.Count; $i++) {
272 | ChartBar -Name $DataNames1[$i] -Value $Data1[$i], $Data2[$i], $Data3[$i], $Data4[$i], $Data5[$i]
273 | }
274 | }
275 | }
276 | Panel {
277 | $Data1 = 44, 55, 41, 64, 22, 43, 21
278 | $Data2 = 53, 32, 33, 52, 13, 44, 32
279 | $DataNames1 = 2001, 2002, 2003, 2004, 2005, 2006, 2007
280 | Chart -Title 'Pets vs People' -TitleAlignment center {
281 | ChartBarOptions -Type barStacked100Percent
282 | ChartLegend -Names 'People', 'Pets' -LegendPosition bottom
283 | for ($i = 0; $i -lt $Data1.Count; $i++) {
284 | ChartBar -Name $DataNames1[$i] -Value $Data1[$i], $Data2[$i]
285 | }
286 | }
287 | }
288 | }
289 | }
290 | Tab -Name 'Bar Charts - Bar Stacked Plus/Minus' -IconRegular file {
291 | Section -Name 'Bar Charts - Stacked 100%' -Collapsable {
292 | Panel {
293 | $Data1 = -0.8, -1.05, -1.06, -1.18, -1.4, -2.2, -2.85, -3.7, -3.96, -4.22, -4.3, -4.4, -4.1, -4, -4.1, -3.4, -3.1, -2.8
294 | $Data2 = 0.4, 0.65, 0.76, 0.88, 1.5, 2.1, 2.9, 3.8, 3.9, 4.2, 4, 4.3, 4.1, 4.2, 4.5, 3.9, 3.5, 3
295 | $DataLegend = 'Males', 'Females' # should match amount of data sets
296 | $DataNames = '85+', '80-84', '75-79', '70-74', '65-69', '60-64', '55-59', '50-54', '45-49', '40-44', '35-39', '30-34', '25-29', '20-24', '15-19', '10-14', '5-9', '0-4'
297 |
298 | Chart -Title 'Mauritius population pyramid 2011' {
299 | ChartBarOptions -Type barStacked
300 | ChartLegend -Names $DataLegend -LegendPosition top
301 | for ($i = 0; $i -lt $Data1.Count; $i++) {
302 | ChartBar -Name $DataNames[$i] -Value $Data1[$i], $Data2[$i]
303 | }
304 | }
305 |
306 | #ChartBar -Data $Data1, $Data2 -DataNames $DataNames -DataLegend $DataLegend -Type barStacked -DataLabelsEnabled $true -Height 500
307 |
308 | }
309 | Panel {
310 | $Data1 = -0.8, -1.05, -1.06, -1.18, -1.4, -2.2, -2.85, -3.7, -3.96, -4.22, -4.3, -4.4, -4.1, -4, -4.1, -3.4, -3.1, -2.8
311 | $Data2 = 0.4, 0.65, 0.76, 0.88, 1.5, 2.1, 2.9, 3.8, 3.9, 4.2, 4, 4.3, 4.1, 4.2, 4.5, 3.9, 3.5, 3
312 | $DataLegend = 'Males', 'Females' # should match amount of data sets
313 | $DataNames = '85+', '80-84', '75-79', '70-74', '65-69', '60-64', '55-59', '50-54', '45-49', '40-44', '35-39', '30-34', '25-29', '20-24', '15-19', '10-14', '5-9', '0-4'
314 |
315 | Chart -Title 'Mauritius population pyramid 2011' {
316 | ChartBarOptions -Type barStacked -Vertical
317 | ChartLegend -Names $DataLegend -LegendPosition top
318 | for ($i = 0; $i -lt $Data1.Count; $i++) {
319 | ChartBar -Name $DataNames[$i] -Value $Data1[$i], $Data2[$i]
320 | }
321 | }
322 | }
323 | }
324 | }
325 | Tab -Name 'Line Charts' -IconRegular hourglass {
326 | Section -Name 'Line Charts - Test' -Collapsable {
327 | Panel {
328 | Chart -Title 'Incidents Reported vs Solved' -TitleAlignment center {
329 | ChartAxisX -Name 'Jan', 'Feb', 'Mar', 'Apr', 'May', 'Jun', 'Jul', 'Aug', 'Sep'
330 | ChartLine -Name 'Incidents per month' -Value 10, 41, 35, 51, 49, 62, 69, 91, 148
331 | ChartLine -Name 'Incidents per month resolved' -Value 5, 10, 20, 31, 49, 62, 69, 91, 148
332 | }
333 | }
334 | Panel {
335 | Chart -Title 'Incidents Reported vs Solved' -TitleAlignment center {
336 | ChartAxisX -Name 'Jan', 'Feb', 'Mar', 'Apr', 'May', 'Jun', 'Jul', 'Aug', 'Sep'
337 | ChartLine -Name 'Incidents per month' -Value 10, 41, 35, 51, 49, 62, 69, 91, 148 -Color Red -Cap square -Dash 5
338 | ChartLine -Name 'Incidents per month resolved' -Value 5, 10, 20, 31, 49, 62, 69, 91, 148 -Color Green -Curve stepline -Width 10
339 | }
340 | }
341 |
342 | }
343 | Section -Name 'Line Charts - Test' -Collapsable {
344 | Panel {
345 | Chart -Title 'Product Trends by Month' -TitleAlignment center {
346 | ChartAxisX -Name 'Jan', 'Feb', 'Mar', 'Apr', 'May', 'Jun', 'Jul', 'Aug', 'Sep'
347 | ChartLine -Name 'Desktop' -Value 10, 41, 35, 51, 49, 62, 69, 91, 148
348 | }
349 | }
350 | Panel {
351 | Chart -Title 'Average High & Low Temperature' -TitleAlignment left {
352 | ChartAxisX -Name 'Jan', 'Feb', 'Mar', 'Apr', 'May', 'Jun', 'Jul'
353 | ChartLine -Name "High - 2013" -Value 28, 29, 33, 36, 32, 32, 33 #-Color Red -Cap square -Dash 5
354 | ChartLine -Name "Low - 2013" -Value 12, 11, 14, 18, 17, 13, 13 #-Color Green -Curve stepline -Width 10
355 | }
356 | }
357 |
358 | }
359 | Section -Name 'Line Charts - Test' -Collapsable {
360 | Panel {
361 | Chart -Title 'Product Trends by Month' -TitleAlignment center {
362 | ChartAxisX -Name 'Jan', 'Feb', 'Mar', 'Apr', 'May', 'Jun', 'Jul', 'Aug', 'Sep'
363 | ChartLine -Name 'Desktop' -Value 10, 41, 35, 51, 49, 62, 69, 91, 148
364 | }
365 | }
366 | Panel {
367 | Chart -Title 'Average High & Low Temperature' -TitleAlignment left {
368 | ChartAxisX -Name 'Jan', 'Feb', 'Mar', 'Apr', 'May', 'Jun', 'Jul'
369 | ChartLine -Name "High - 2013" -Value 28, 29, 33, 36, 32, 32, 33 -Color Red -Cap square -Dash 5
370 | ChartLine -Name "Low - 2013" -Value 12, 11, 14, 18, 17, 13, 13 -Color BlueViolet
371 |
372 | }
373 | }
374 |
375 | }
376 | Section -Name 'Line Charts - Test' -Collapsable {
377 | Panel {
378 | Chart -Title 'Product Trends by Month' -TitleAlignment center {
379 | ChartAxisX -Name 'Jan', 'Feb', 'Mar', 'Apr', 'May', 'Jun', 'Jul', 'Aug', 'Sep'
380 | ChartLine -Name 'Desktop' -Value 10, 41, 35, 51, 49, 62, 69, 91, 148 -Curve stepline -Width 10
381 | }
382 | }
383 | Panel -BackgroundColor Yellow {
384 | Chart -Title 'Average High & Low Temperature' -TitleAlignment left {
385 | # This controls how the grid looks like
386 | ChartGrid -Show -Position front -xAxisLinesShow -StrokeDash 5 -RowColors Aquamarine, DarkCyan
387 | # This is category (responsible for values on axis X)
388 | ChartAxisX -Name 'Jan', 'Feb', 'Mar', 'Apr', 'May', 'Jun', 'Jul' -TitleText 'Month'
389 | ChartAxisY -TitleText 'Temperature' -Show -ShowAlways
390 | # Data and control of data
391 | ChartLine -Name "High - 2013" -Value 28, 29, 33, 36, 32, 32, 33 -Curve smooth #-Color Red -Cap square -Dash 5
392 | ChartLine -Name "Low - 2013" -Value 12, 11, 14, 18, 17, 13, 13 -Curve smooth #-Color Green -Curve stepline -Width 10
393 |
394 | }
395 | }
396 |
397 | }
398 | }
399 | Tab -Name 'Line Charts but Invisible' -IconBrands app-store {
400 | Section -Invisible -Name 'Line Charts - Test' -Collapsable {
401 | Panel -Invisible {
402 | Chart -Title 'Incidents Reported vs Solved' -TitleAlignment center {
403 | ChartAxisX -Name 'Jan', 'Feb', 'Mar', 'Apr', 'May', 'Jun', 'Jul', 'Aug', 'Sep'
404 | ChartLine -Name 'Incidents per month' -Value 10, 41, 35, 51, 49, 62, 69, 91, 148
405 | ChartLine -Name 'Incidents per month resolved' -Value 5, 10, 20, 31, 49, 62, 69, 91, 148
406 | }
407 | }
408 | Panel -Invisible {
409 | Chart -Title 'Incidents Reported vs Solved' -TitleAlignment center {
410 | ChartAxisX -Name 'Jan', 'Feb', 'Mar', 'Apr', 'May', 'Jun', 'Jul', 'Aug', 'Sep'
411 | ChartLine -Name 'Incidents per month' -Value 10, 41, 35, 51, 49, 62, 69, 91, 148 -Color Red -Cap square -Dash 5
412 | ChartLine -Name 'Incidents per month resolved' -Value 5, 10, 20, 31, 49, 62, 69, 91, 148 -Color Green -Curve stepline -Width 10
413 | }
414 | }
415 |
416 | }
417 | Section -Invisible -Name 'Line Charts - Test' -Collapsable {
418 | Panel -Invisible {
419 | Chart -Title 'Product Trends by Month' -TitleAlignment center {
420 | ChartAxisX -Name 'Jan', 'Feb', 'Mar', 'Apr', 'May', 'Jun', 'Jul', 'Aug', 'Sep'
421 | ChartLine -Name 'Desktop' -Value 10, 41, 35, 51, 49, 62, 69, 91, 148
422 | }
423 | }
424 | Panel -Invisible {
425 | Chart -Title 'Average High & Low Temperature' -TitleAlignment left {
426 | ChartAxisX -Name 'Jan', 'Feb', 'Mar', 'Apr', 'May', 'Jun', 'Jul'
427 | ChartLine -Name "High - 2013" -Value 28, 29, 33, 36, 32, 32, 33 #-Color Red -Cap square -Dash 5
428 | ChartLine -Name "Low - 2013" -Value 12, 11, 14, 18, 17, 13, 13 #-Color Green -Curve stepline -Width 10
429 | }
430 | }
431 |
432 | }
433 | Section -Invisible -Name 'Line Charts - Test' -Collapsable {
434 | Panel -Invisible {
435 | Chart -Title 'Product Trends by Month' -TitleAlignment center {
436 | ChartAxisX -Name 'Jan', 'Feb', 'Mar', 'Apr', 'May', 'Jun', 'Jul', 'Aug', 'Sep'
437 | ChartLine -Name 'Desktop' -Value 10, 41, 35, 51, 49, 62, 69, 91, 148
438 | }
439 | }
440 | Panel -Invisible {
441 | Chart -Title 'Average High & Low Temperature' -TitleAlignment left {
442 | ChartAxisX -Name 'Jan', 'Feb', 'Mar', 'Apr', 'May', 'Jun', 'Jul'
443 | ChartLine -Name "High - 2013" -Value 28, 29, 33, 36, 32, 32, 33 -Color Red -Cap square -Dash 5
444 | ChartLine -Name "Low - 2013" -Value 12, 11, 14, 18, 17, 13, 13 -Color BlueViolet
445 |
446 | }
447 | }
448 |
449 | }
450 | Section -Invisible -Name 'Line Charts - Test' -Collapsable {
451 | Panel -Invisible {
452 | Chart -Title 'Product Trends by Month' -TitleAlignment center {
453 | ChartAxisX -Name 'Jan', 'Feb', 'Mar', 'Apr', 'May', 'Jun', 'Jul', 'Aug', 'Sep'
454 | ChartLine -Name 'Desktop' -Value 10, 41, 35, 51, 49, 62, 69, 91, 148 -Curve stepline -Width 10
455 | }
456 | }
457 | Panel -Invisible -BackgroundColor Yellow {
458 | Chart -Title 'Average High & Low Temperature' -TitleAlignment left {
459 | # This controls how the grid looks like
460 | ChartGrid -Show -Position front -xAxisLinesShow -StrokeDash 5 -RowColors Aquamarine, DarkCyan
461 | # This is category (responsible for values on axis X)
462 | ChartAxisX -Name 'Jan', 'Feb', 'Mar', 'Apr', 'May', 'Jun', 'Jul' -TitleText 'Month'
463 | ChartAxisY -TitleText 'Temperature' -Show -ShowAlways
464 | # Data and control of data
465 | ChartLine -Name "High - 2013" -Value 28, 29, 33, 36, 32, 32, 33 -Curve smooth #-Color Red -Cap square -Dash 5
466 | ChartLine -Name "Low - 2013" -Value 12, 11, 14, 18, 17, 13, 13 -Curve smooth #-Color Green -Curve stepline -Width 10
467 |
468 | }
469 | }
470 |
471 | }
472 | }
473 | } -Show
--------------------------------------------------------------------------------
/Example/Run-EasyDashboard.ps1:
--------------------------------------------------------------------------------
1 |
2 | $Process = Get-Process | Select-Object -First 30
3 | $Process1 = Get-Process | Select-Object -First 5
4 | $Process2 = Get-Process | Select-Object -First 10
5 | $Process3 = Get-Process | Select-Object -First 10
6 |
7 | Dashboard -Name 'Dashimo Test' -FilePath $PSScriptRoot\Output\DashboardEasy.html -Show {
8 | Tab -Name 'First tab' {
9 | Section -Name 'Test' {
10 | Table -DataTable $Process -Filtering
11 | }
12 | Section -Name 'Test2' -Collapsable -Collapsed {
13 | Panel {
14 | Table -DataTable $Process1
15 | }
16 | Panel {
17 | Table -DataTable $Process1
18 | }
19 | }
20 | Section -Name 'Test3' {
21 | Table -DataTable $Process -DefaultSortColumn 'Id'
22 | }
23 | }
24 | Tab -Name 'second tab' {
25 | Panel {
26 | Table -DataTable $Process2
27 | }
28 | Panel {
29 | Table -DataTable $Process2
30 | }
31 | Panel {
32 | Table -DataTable $Process3 -DefaultSortIndex 4 -ScrollCollapse
33 | }
34 | }
35 | }
--------------------------------------------------------------------------------
/Example/Run-EasyDashboardConditions.ps1:
--------------------------------------------------------------------------------
1 |
2 | $Process = Get-Process | Select-Object -First 30
3 | $Process1 = Get-Process | Select-Object -First 5
4 | $Process2 = Get-Process | Select-Object -First 10
5 |
6 | Dashboard -Name 'Dashimo Test' -FilePath $PSScriptRoot\Output\DashboardEasyConditions.html -Show {
7 | Tab -Name 'First tab' {
8 | Section -Name 'Test' {
9 | Table -DataTable $Process {
10 | TableConditionalFormatting -Name 'ID' -ComparisonType number -Operator gt -Value 16000 -Color BlueViolet -Row
11 | TableConditionalFormatting -Name 'PriorityClass' -ComparisonType string -Operator eq -Value 'Normal' -BackgroundColor Gold
12 | TableConditionalFormatting -Name 'PriorityClass' -ComparisonType string -Operator eq -Value 'Idle' -BackgroundColor Gold -Color Green
13 | }
14 | }
15 | Section -Name 'Test2' {
16 | Panel {
17 | Table -DataTable $Process1 {
18 | TableConditionalFormatting -Name 'HandleCount' -ComparisonType number -Operator lt -Value 200 -Color MidnightBlue
19 | }
20 | }
21 | Panel {
22 | Table -DataTable $Process1
23 | }
24 | }
25 | Section -Name 'Test3' {
26 | Table -DataTable $Process {
27 | TableConditionalFormatting -Name 'HandleCount' -ComparisonType number -Operator lt -Value 200 -BackgroundColor MidnightBlue -Color White
28 | }
29 | }
30 | }
31 | Tab -Name 'second tab' {
32 | Panel {
33 | Table -DataTable $Process2
34 | }
35 | Panel {
36 | Table -DataTable $Process2
37 | }
38 | Panel {
39 | Table -DataTable $Process2
40 | }
41 | }
42 | }
--------------------------------------------------------------------------------
/Example/Run-SimplestTable01-DefaultSort.ps1:
--------------------------------------------------------------------------------
1 |
2 | $Process = Get-Process | Select-Object -First 30
3 |
4 | Dashboard -Name 'Dashimo Test' -FilePath $PSScriptRoot\Output\DashboardEasy01.html -AutoRefresh 15 -Show {
5 | Table -DataTable $Process -DefaultSortIndex 4 -ScrollCollapse -HideFooter -Buttons @()
6 |
7 | Table -DataTable $Process -DefaultSortColumn 'WorkingSet' -ScrollCollapse -HideFooter -Buttons @()
8 |
9 | Table -DataTable $Process -DefaultSortColumn 'WorkingSet' -DefaultSortOrder Descending -ScrollCollapse -HideFooter -Buttons @()
10 | }
--------------------------------------------------------------------------------
/Example/Run-SimplestTable02.ps1:
--------------------------------------------------------------------------------
1 | $Process = Get-Process | Select-Object -First 200
2 | $Process1 = Get-Process | Select-Object -First 5
3 |
4 | Dashboard -Name 'Dashimo Test' -FilePath $PSScriptRoot\Output\DashboardEasy02.html -Show {
5 | Section -Name 'Test1' -TextAlignment left -TextBackGroundColor BlueViolet {
6 | Table -DataTable $Process -PagingOptions @(50, 100, 150, 200) -HideFooter
7 | #Table -DataTable $Process1
8 | }
9 | Section -Name 'Test3' -BackgroundColor DarkOrange {
10 | Table -DataTable $Process1
11 | # Table -DataTable $Process1
12 | }
13 | Section -Name 'Test2' -Collapsable {
14 | Panel {
15 | # Table -DataTable $Process1
16 | }
17 | Panel {
18 | # Table -DataTable $Process1
19 | }
20 | }
21 | }
--------------------------------------------------------------------------------
/Example/Run-SimplestTable03.ps1:
--------------------------------------------------------------------------------
1 | $Process = Get-Process | Select-Object -First 30
2 |
3 | Dashboard -Name 'Dashimo Test' -FilePath $PSScriptRoot\Output\DashboardEasy03.html -Show {
4 | Section -Name 'Test1' -TextAlignment left -TextBackGroundColor BlueViolet {
5 | Table -DataTable $Process
6 | Table -DataTable $Process {
7 | TableConditionalFormatting -Name 'ID' -ComparisonType number -Operator gt -Value 16000 -Color BlueViolet -Row
8 | TableConditionalFormatting -Name 'PriorityClass' -ComparisonType string -Operator eq -Value 'Normal' -BackgroundColor Gold
9 | TableConditionalFormatting -Name 'PriorityClass' -ComparisonType string -Operator eq -Value 'Idle' -BackgroundColor Gold -Color Green
10 | } -PreContent {
11 | New-HTMLText -Text 'TestPreContent' -Color Coral -Alignment center
12 | } -PostContent {
13 | # Notice how I'm adding table below another table in a very specific scenario
14 | New-HTMLText -Text 'TestPostContent' -Color Coral -Alignment center
15 | Table -DataTable $Process
16 | }
17 | }
18 | Section -Name 'Test3' -BackgroundColor DarkOrange {
19 | Table -DataTable $Process -DisablePaging
20 | Container {
21 | # a different way to add post and pre content
22 | Table -DataTable $Process1
23 | New-HTMLText -Text 'TestPostContent' -Color DodgerBlue -Alignment center
24 | Table -DataTable $Process
25 | }
26 | }
27 | Section -Name 'Test2' -Collapsable {
28 | Panel {
29 | Table -DataTable $Process
30 | }
31 | Panel {
32 | Table -DataTable $Process
33 | }
34 | }
35 | }
--------------------------------------------------------------------------------
/Example/Run-SimplestTable04.ps1:
--------------------------------------------------------------------------------
1 | $Process = Get-Process | Select-Object -First 15 | Select-Object name, Priorityclass, fileversion, handles, cpu
2 |
3 | Dashboard -Name 'Dashimo Test' -FilePath $PSScriptRoot\Output\DashboardEasy04_00.html -Show {
4 | Section -Name 'Test2' -Collapsable {
5 | Container {
6 | Panel {
7 | Table -DataTable $Process -PreContent { New-HTMLText -Text 'TestPostContent' -Color DodgerBlue -Alignment center } -Buttons @() -DisableSearch -DisablePaging -HideFooter
8 | }
9 | Panel {
10 | Table -DataTable $Process -PreContent { New-HTMLText -Text 'TestPostContent' -Color DodgerBlue -Alignment center } -Buttons @() -DisableSearch -DisablePaging -HideFooter
11 | }
12 | }
13 | }
14 |
15 | }
16 |
17 |
18 | $Process = Get-Process | Select-Object -First 15 | Select-Object name, Priorityclass, fileversion, handles, cpu
19 |
20 | Dashboard -Name 'Dashimo Test' -FilePath $PSScriptRoot\Output\DashboardEasy04_01.html -Show {
21 | Panel {
22 | Section {
23 | Table -DataTable $Process -PreContent { New-HTMLText -Text 'TestPostContent' -Color DodgerBlue -Alignment center } -Buttons @()
24 | }
25 | Section {
26 | Table -DataTable $Process -PreContent { New-HTMLText -Text 'TestPostContent' -Color DodgerBlue -Alignment center } -Buttons @()
27 | }
28 | }
29 |
30 | }
31 |
32 | $Process = Get-Process | Select-Object -First 15 | Select-Object name, Priorityclass, fileversion, handles, cpu
33 |
34 | Dashboard -Name 'Dashimo Test' -FilePath $PSScriptRoot\Output\DashboardEasy04_02.html -Show {
35 |
36 | Section -Name 'Test 4' {
37 | Table -DataTable $Process -PreContent {
38 | New-HTMLText -Text 'TestPostContent' -Color DodgerBlue -Alignment center
39 | } -PostContent {
40 | Table -DataTable $Process -PreContent {
41 | New-HTMLText -Text 'TestPostContent' -Color DodgerBlue -Alignment center
42 | }
43 | }
44 | }
45 | }
46 |
47 | $Process = Get-Process | Select-Object -First 15 | Select-Object name, Priorityclass, fileversion, handles, cpu
48 |
49 | Dashboard -Name 'Dashimo Test' -FilePath $PSScriptRoot\Output\DashboardEasy04_03.html -Show {
50 | Panel {
51 | Panel {
52 | Table -DataTable $Process -PreContent { New-HTMLText -Text 'TestPostContent' -Color DodgerBlue -Alignment center }
53 | }
54 | Panel {
55 | Table -DataTable $Process -PreContent { New-HTMLText -Text 'TestPostContent' -Color DodgerBlue -Alignment center }
56 | }
57 | }
58 |
59 | }
60 |
61 | $Process = Get-Process | Select-Object -First 15 | Select-Object name, Priorityclass, fileversion, handles, cpu
62 |
63 | Dashboard -Name 'Dashimo Test' -FilePath $PSScriptRoot\Output\DashboardEasy04_04.html -Show {
64 | Section -Name 'Test2' -Collapsable -Collapsed -TextAlignment left -TextColor Black -TextBackGroundColor Yellow {
65 | Table -DataTable $Process -buttons @() -DisableSearch -HideFooter -DisablePaging -PreContent {
66 | New-HTMLText -Text 'TestPostContent' -Color DodgerBlue -Alignment left
67 | } -PostContent {
68 | Table -DataTable $Process -buttons @() -DisableSearch -HideFooter -DisablePaging -PreContent { New-HTMLText -Text 'TestPostContent' -Color DodgerBlue -Alignment Left
69 | }
70 | }
71 | }
72 |
73 | }
--------------------------------------------------------------------------------
/Example/Run-SimplestTable05.ps1:
--------------------------------------------------------------------------------
1 | $Process = Get-Process | Select-Object -First 15 | Select-Object name, Priorityclass, fileversion, handles, cpu
2 |
3 | Dashboard -Name 'Dashimo Test' -FilePath $PSScriptRoot\Output\DashboardEasy05.html -Show {
4 | Section -Name 'Test' -Collapsable {
5 | Container {
6 | Panel {
7 | Table -DataTable $Process {
8 | TableButtonPDF
9 | TableButtonCopy
10 | TableButtonExcel
11 | TableButtonPageLength
12 | } -Buttons @() -DisableSearch -PagingOptions @(5, 10) -HideFooter
13 | }
14 | Panel {
15 | Table -DataTable $Process -DisableSearch -HideFooter -PagingOptions @(5, 10)
16 | }
17 | Panel {
18 | Table -DataTable $Process {
19 | TableButtonPDF -PageSize A10 -Orientation landscape
20 | TableButtonCopy
21 | TableButtonExcel
22 | } -Buttons @() -DisableSearch -DisablePaging -HideFooter
23 | }
24 | }
25 | }
26 | }
--------------------------------------------------------------------------------
/Example/Run-SimplestTable06.ps1:
--------------------------------------------------------------------------------
1 | $Process = Get-Process | Select-Object -First 15 | Select-Object name, Priorityclass, fileversion, handles, cpu
2 |
3 | $PagingOptions = @(5, 10)
4 | $Proces = '1Password', 'aesm_service'
5 |
6 | $ProcessGreen = 'audiodg', 'browser_broker'
7 |
8 | Dashboard -Name 'Dashimo Test' -FilePath $PSScriptRoot\Output\DashboardEasy06.html {
9 | Section -Name 'Test' -Collapsable {
10 | Container {
11 | Panel {
12 | Table -DataTable $Process {
13 | TableButtonPDF
14 | TableButtonCopy
15 | TableButtonExcel
16 | TableButtonPageLength
17 | foreach ($T in $Proces) {
18 | TableConditionalFormatting -Name 'Name' -ComparisonType string -Operator eq -Value $T -Row -Color Red
19 | }
20 | foreach ($Green in $ProcessGreen) {
21 | TableConditionalFormatting -Name 'Name' -ComparisonType string -Operator eq -Value $Green -Row -BackgroundColor Green
22 | }
23 | } -Buttons @() -DisableSearch -PagingOptions $PagingOptions -HideFooter
24 | }
25 | }
26 | }
27 | } -Show
--------------------------------------------------------------------------------
/Example/Run-SimplestTable07.ps1:
--------------------------------------------------------------------------------
1 | $Process = Get-Process | Select-Object -First 30
2 |
3 | Dashboard -Name 'Dashimo Test' -FilePath $PSScriptRoot\Output\DashboardEasy07.html -Show {
4 | Table -DataTable $Process -HideFooter {
5 | TableConditionalFormatting -Name 'ID' -ComparisonType number -Operator gt -Value 10000 -Color BlueViolet -Row
6 | TableConditionalFormatting -Name 'Name' -ComparisonType string -Operator eq -Value 'chrome' -Color White -BackgroundColor Crimson -Row
7 | TableConditionalFormatting -Name 'PriorityClass' -ComparisonType string -Operator eq -Value 'Idle' -Color White -BackgroundColor Green
8 | }
9 | }
--------------------------------------------------------------------------------
/Example/Run-SimplestTable08.ps1:
--------------------------------------------------------------------------------
1 | $Process = Get-Process | Select-Object -First 30
2 |
3 | Dashboard -Name 'Dashimo Test' -FilePath $PSScriptRoot\Output\DashboardEasy08.html -Show {
4 | Tab {
5 | Table -DataTable $Process -HideFooter {
6 | TableConditionalFormatting -Name 'ID' -ComparisonType number -Operator gt -Value 10000 -Color BlueViolet -Row
7 | TableConditionalFormatting -Name 'Name' -ComparisonType string -Operator eq -Value 'chrome' -Color White -BackgroundColor Crimson -Row
8 | TableConditionalFormatting -Name 'PriorityClass' -ComparisonType string -Operator eq -Value 'Idle' -Color White -BackgroundColor Green
9 | }
10 | }
11 | Tab -Name 'Test 1' -IconBrands adobe {
12 | Section -Name 'Test' -Collapsable -Collapsed {
13 | Table -DataTable $Process -HideFooter {
14 | TableConditionalFormatting -Name 'ID' -ComparisonType number -Operator gt -Value 10000 -Color BlueViolet -Row
15 | TableConditionalFormatting -Name 'Name' -ComparisonType string -Operator eq -Value 'chrome' -Color White -BackgroundColor Crimson -Row
16 | TableConditionalFormatting -Name 'PriorityClass' -ComparisonType string -Operator eq -Value 'Idle' -Color White -BackgroundColor Green
17 | }
18 | }
19 | }
20 | }
--------------------------------------------------------------------------------
/Example/Run-SimplestTable09.ps1:
--------------------------------------------------------------------------------
1 | $Process = Get-Process | Select-Object -First 30
2 |
3 | Dashboard -Name 'Dashimo Test' -FilePath $PSScriptRoot\Output\DashboardEasy09.html -Show {
4 |
5 | Section -Name 'Test' -Collapsable {
6 | Table -DataTable $Process -HideFooter {
7 | TableConditionalFormatting -Name 'ID' -ComparisonType number -Operator gt -Value 10000 -Color BlueViolet -Row
8 | TableConditionalFormatting -Name 'Name' -ComparisonType string -Operator eq -Value 'chrome' -Color White -BackgroundColor Crimson -Row
9 | TableConditionalFormatting -Name 'PriorityClass' -ComparisonType string -Operator eq -Value 'Idle' -Color White -BackgroundColor Green
10 | }
11 | }
12 |
13 | }
--------------------------------------------------------------------------------
/Example/Run-SimplestTable10.ps1:
--------------------------------------------------------------------------------
1 | $Process = Get-Process | Select-Object -First 30
2 |
3 | Dashboard -Name 'Dashimo Test' -FilePath $PSScriptRoot\Output\DashboardEasy10.html -Show {
4 | TabOptions -SlimTabs -SelectorColor AntiqueWhite -Transition -LinearGradient -SelectorColorTarget DodgerBlue
5 | Tab -Name 'Test 0' -IconSolid user-alt -IconColor Green {
6 | Table -DataTable $Process -HideFooter {
7 | TableButtonExcel
8 | TableButtonPageLength
9 | TableConditionalFormatting -Name 'ID' -ComparisonType number -Operator gt -Value 10000 -Color BlueViolet -Row
10 | TableConditionalFormatting -Name 'Name' -ComparisonType string -Operator eq -Value 'chrome' -Color White -BackgroundColor Crimson -Row
11 | TableConditionalFormatting -Name 'PriorityClass' -ComparisonType string -Operator eq -Value 'Idle' -Color White -BackgroundColor Green
12 | }
13 | }
14 | Tab -Name 'Test 1' -IconBrands adobe {
15 | Section -Name 'Test' -Collapsable {
16 | Table -DataTable $Process -HideFooter {
17 | TableConditionalFormatting -Name 'ID' -ComparisonType number -Operator gt -Value 10000 -Color BlueViolet -Row
18 | TableConditionalFormatting -Name 'Name' -ComparisonType string -Operator eq -Value 'chrome' -Color White -BackgroundColor Crimson -Row
19 | TableConditionalFormatting -Name 'PriorityClass' -ComparisonType string -Operator eq -Value 'Idle' -Color White -BackgroundColor Green
20 | }
21 | }
22 | }
23 | Tab -Name 'Test 2' -IconRegular clone -TextColor Gold -IconColor MediumPurple {
24 | Section -Name 'Test' -Collapsable {
25 | Table -DataTable $Process -HideFooter {
26 | TableConditionalFormatting -Name 'ID' -ComparisonType number -Operator gt -Value 10000 -Color BlueViolet -Row
27 | TableConditionalFormatting -Name 'Name' -ComparisonType string -Operator eq -Value 'chrome' -Color White -BackgroundColor Crimson -Row
28 | TableConditionalFormatting -Name 'PriorityClass' -ComparisonType string -Operator eq -Value 'Idle' -Color White -BackgroundColor Green
29 | }
30 | }
31 | }
32 | Tab -Name 'Line Charts' -IconRegular hourglass {
33 | Section -Name 'Line Charts - Test' -Collapsable {
34 | Panel {
35 | Chart -Title 'Incidents Reported vs Solved' -TitleAlignment center {
36 | ChartAxisX -Name 'Jan', 'Feb', 'Mar', 'Apr', 'May', 'Jun', 'Jul', 'Aug', 'Sep'
37 | ChartLine -Name 'Incidents per month' -Value 10, 41, 35, 51, 49, 62, 69, 91, 148
38 | ChartLine -Name 'Incidents per month resolved' -Value 5, 10, 20, 31, 49, 62, 69, 91, 148
39 | }
40 | }
41 | Panel {
42 | Chart -Title 'Incidents Reported vs Solved' -TitleAlignment center {
43 | ChartAxisX -Name 'Jan', 'Feb', 'Mar', 'Apr', 'May', 'Jun', 'Jul', 'Aug', 'Sep'
44 | ChartLine -Name 'Incidents per month' -Value 10, 41, 35, 51, 49, 62, 69, 91, 148 -Color Red -Cap square -Dash 5
45 | ChartLine -Name 'Incidents per month resolved' -Value 5, 10, 20, 31, 49, 62, 69, 91, 148 -Color Green -Curve stepline -Width 10
46 | }
47 | }
48 |
49 | }
50 | Section -Name 'Line Charts - Test' -Collapsable {
51 | Panel {
52 | Chart -Title 'Product Trends by Month' -TitleAlignment center {
53 | ChartAxisX -Name 'Jan', 'Feb', 'Mar', 'Apr', 'May', 'Jun', 'Jul', 'Aug', 'Sep'
54 | ChartLine -Name 'Desktop' -Value 10, 41, 35, 51, 49, 62, 69, 91, 148
55 | }
56 | }
57 | Panel {
58 | Chart -Title 'Average High & Low Temperature' -TitleAlignment left {
59 | ChartAxisX -Name 'Jan', 'Feb', 'Mar', 'Apr', 'May', 'Jun', 'Jul'
60 | ChartLine -Name "High - 2013" -Value 28, 29, 33, 36, 32, 32, 33 #-Color Red -Cap square -Dash 5
61 | ChartLine -Name "Low - 2013" -Value 12, 11, 14, 18, 17, 13, 13 #-Color Green -Curve stepline -Width 10
62 | }
63 | }
64 |
65 | }
66 | Section -Name 'Line Charts - Test' -Collapsable {
67 | Panel {
68 | Chart -Title 'Product Trends by Month' -TitleAlignment center {
69 | ChartAxisX -Name 'Jan', 'Feb', 'Mar', 'Apr', 'May', 'Jun', 'Jul', 'Aug', 'Sep'
70 | ChartLine -Name 'Desktop' -Value 10, 41, 35, 51, 49, 62, 69, 91, 148
71 | }
72 | }
73 | Panel {
74 | Chart -Title 'Average High & Low Temperature' -TitleAlignment left {
75 | ChartAxisX -Name 'Jan', 'Feb', 'Mar', 'Apr', 'May', 'Jun', 'Jul'
76 | ChartLine -Name "High - 2013" -Value 28, 29, 33, 36, 32, 32, 33 -Color Red -Cap square -Dash 5
77 | ChartLine -Name "Low - 2013" -Value 12, 11, 14, 18, 17, 13, 13 -Color BlueViolet
78 |
79 | }
80 | }
81 |
82 | }
83 | Section -Name 'Line Charts - Test' -Collapsable {
84 | Panel {
85 | Chart -Title 'Product Trends by Month' -TitleAlignment center {
86 | ChartAxisX -Name 'Jan', 'Feb', 'Mar', 'Apr', 'May', 'Jun', 'Jul', 'Aug', 'Sep'
87 | ChartLine -Name 'Desktop' -Value 10, 41, 35, 51, 49, 62, 69, 91, 148 -Curve stepline -Width 10
88 | }
89 | }
90 | Panel {
91 | Chart -Title 'Average High & Low Temperature' -TitleAlignment left {
92 | # This controls how the grid looks like
93 | ChartGrid -Show -Position front -xAxisLinesShow -StrokeDash 5 -RowColors Aquamarine, DarkCyan
94 | # This is category (responsible for values on axis X)
95 | ChartAxisX -Name 'Jan', 'Feb', 'Mar', 'Apr', 'May', 'Jun', 'Jul' -TitleText 'Month'
96 | ChartAxisY -TitleText 'Temperature' -Show -ShowAlways
97 | # Data and control of data
98 | ChartLine -Name "High - 2013" -Value 28, 29, 33, 36, 32, 32, 33 -Curve smooth #-Color Red -Cap square -Dash 5
99 | ChartLine -Name "Low - 2013" -Value 12, 11, 14, 18, 17, 13, 13 -Curve smooth #-Color Green -Curve stepline -Width 10
100 |
101 | }
102 | }
103 |
104 | }
105 | }
106 | }
--------------------------------------------------------------------------------
/Example/Run-TabsLoop.ps1:
--------------------------------------------------------------------------------
1 | Dashboard -Name 'Dashimo Test' -FilePath $PSScriptRoot\Output\DashboardTabsLoop.html -Show {
2 | $Tabs = 'vCenter', 'vCenter1', 'vCenter2'
3 | foreach ($_ in $Tabs) {
4 | Tab -Name $_ {
5 | Section -Name 'Test' {
6 | $Process = Get-Process | Select-Object -First 5
7 | Table -DataTable $Process {
8 | TableConditionalFormatting -Name 'ID' -ComparisonType number -Operator gt -Value 16000 -Color BlueViolet -Row
9 | TableConditionalFormatting -Name 'PriorityClass' -ComparisonType string -Operator eq -Value 'Normal' -BackgroundColor Gold
10 | TableConditionalFormatting -Name 'PriorityClass' -ComparisonType string -Operator eq -Value 'Idle' -BackgroundColor Gold -Color Green
11 | }
12 | }
13 | }
14 | }
15 | for ($i = 0; $i -lt 5; $i++) {
16 | Tab -Name "vCenter#$i" {
17 | Section -Name "Section Name$i" {
18 | $Process = Get-Process | Select-Object -First 5
19 | Table -DataTable $Process {
20 | TableConditionalFormatting -Name 'ID' -ComparisonType number -Operator gt -Value 16000 -Color BlueViolet -Row
21 | TableConditionalFormatting -Name 'PriorityClass' -ComparisonType string -Operator eq -Value 'Normal' -BackgroundColor Gold
22 | TableConditionalFormatting -Name 'PriorityClass' -ComparisonType string -Operator eq -Value 'Idle' -BackgroundColor Gold -Color Green
23 | }
24 | }
25 | }
26 | }
27 | }
--------------------------------------------------------------------------------
/Readme.md:
--------------------------------------------------------------------------------
1 |
2 |
6 |
7 |
8 |
13 |
14 |
15 |
19 |
20 |
21 | # Dashimo - PowerShell Module
22 |
23 | Dashimo is very simple, intuitive PowerShell generated HTML file. That's right. A single, static HTML file that you can send to email or host on a website. Dashimo is based on [PSWriteHTML](https://github.com/EvotecIT/PSWriteHTML) which I've written and is under development. What you can do in **Dashimo** you can do there and more. If you would like to help with development all code related to **HTML/JS/CSS** is on **PSWriteHTML** repo.
24 |
25 | ## IMPORTANT
26 |
27 | **Dashimo** project has been integrated back to [PSWriteHTML](https://github.com/EvotecIT/PSWriteHTML). This project is now **ARCHIVED**. Dashimo syntax will live as part of [PSWriteHTML](https://github.com/EvotecIT/PSWriteHTML) aliases.
28 |
29 | ```PowerShell
30 | Uninstall-Module Dashimo -AllVersions
31 | Install-Module PSWriteHTML -Force
32 | ```
33 |
34 | Everything below is now a bit irrelevant. Leaving this for historical reasons. The reason for moving Dashimo syntax to PSWriteHTML was that it was getting hard to keep both modules in sync, especially that 90% of features was identical. I still like Dashimo syntax therefore it will be fully supported as part of PSWriteHTML. Hope to see you in that project.
35 |
36 | ## ARCHIVE
37 |
38 | ### How to Install
39 |
40 | While you can take sources and use it from here, **Dashimo** actually is composed of multiple other of my modules. To get it up and running you will neeed **PSWriteHTML**. **PSWriteHTML** will need **PSSharedGoods**, and **PSSharedGoods** will need **Connectimo** and **PSWriteColor**. You can get all that from sources but if you **just want** to use my modules you should use `Install-Module` command. It's available in PowerShell 5.1. As an added bonus when I publish modules to **PowerShellGallery** I remove any junk, minimize modules to a single file which makes them faster to load and use. I really encourage you to use module from PowerShellGallery and treat **GitHub** as highely development version.
41 |
42 | Simply use:
43 |
44 | ```powershell
45 | Install-Module Dashimo
46 | ```
47 |
48 | And to update
49 |
50 | ```powershell
51 | Update-Module Dashimo
52 | ```
53 |
54 | That's it. Whenever there's new version you simply run the command and you can enjoy it. Remember, that you may need to close, reopen PowerShell session if you have already used module before updating it.
55 |
56 | **The important thing** is if something works for you on production, keep using it till you test the new version on a test computer. I do changes that may not be big, but big enough that auto-update will break your code. For example, small rename to a parameter and your code stops working! Be responsible!
57 |
58 | ### Changelog
59 |
60 | - 0.0.22
61 | - [x] This is last release of DASHIMO. It basically points to PSWRITEHTML making Dashimo, an empty module that just downloads PSWriteHTML. There is no need to download/install Dashimo. You can use Dashimo syntax straight from PSWriteHTML, just like you did before. Just make sure to update PSWriteHTML to newest version.
62 |
63 | - 0.0.20
64 | - [X] TableConditionalFormatting
65 | - Function was moved to PSWriteHTML (as an alias to New-HTMLTableConditionalFormatting) due to added benefits. It has much more functionality now.
66 |
67 | - 0.0.19 - 2019.07.12
68 | - [x] Table
69 | - [ ] Fix for Buttons - Add pageLength to Table button validation set - PR by dizech
70 |
71 | - 0.0.18 - 2019.07.09
72 | - [x] Table
73 | - [ ] Added $PriorityProperties parameter - it works also on ScrollX and other types of places contrary to ResponsivePriorityProperties which only works on Responsive Table
74 |
75 | - 0.0.17 - 2019.07.08
76 | - [x] Table
77 | - [ ] Small improvement when no data provided
78 | - [x] TableCondition
79 | - [ ] Supports contains now - PR by Adam Cook (codamok)
80 | - [ ] Removed ColorSchemes - removal of ReportHTML old code
81 |
82 | - 0.0.16 - 2019.07.01
83 | - [x] Table
84 | - [ ] Fix for ScrollX with low amount of columns
85 |
86 | - 0.0.15 - 2019.07.01
87 | - [x] TableConditionalFormatting
88 | - [ ] Fix for Powershell Core, where conditional formatting wouldn't show up
89 |
90 | - 0.0.14 - 2019.06.30
91 | - [x] TableHeader - removing need for AddRow switch
92 | - [ ] If used with only Title it will assume AddRow
93 | - [ ] If used with Names it will assume merging
94 | - [ ] If used with Names without Title it will assume styling
95 | - [ ] Left AddRow for compatibility reasons, may remove it in future
96 |
97 | - 0.0.13 - 2019.06.29 - https://evotec.xyz/all-your-html-tables-are-belong-to-us/
98 | - [x] Table features
99 | - [x] FixedHeader/FixedFooter options
100 | - [x] Scrolling
101 | - ScrollX,
102 | - ScrollY, ScrollSizeY
103 | - FreezeColumnsLeft, FreezeColumnsRight
104 | - [x] ResponivePriorityOrder, ResponsivePriorityOrderIndex
105 | - [x] TableHeader - **new command**
106 | - [x] Mergin header, styling header, adding header row
107 |
108 | - 0.0.12 - 20.06.2019
109 | - Fix for DefaultSortColumn
110 | - Fix for DefaultSortOrder when set to descending
111 |
112 | - 0.0.11 - 17.06.2019 - http://evotec.xyz/dashimo-pswritehtml-charting-icons-and-few-other-changes
113 | - Support for Bar Charts / Line charts
114 | - Support for Icons in Tabs
115 | - Support for Tabs options
116 | - Lots of small fixes
117 | - Couple of new features
118 |
119 | - 0.0.10 - 28.05.2019
120 | - Date Time formatting for Table (added by **Ferdi Weiner (ferwe)**)
121 |
122 | - 0.0.9 - 12.05.2019
123 | - Don't remember, had to be important
124 |
125 | - 0.0.8 - 3.05.2019
126 | - More fixes
127 | - More parameters
128 | - added features (ability for Pre/post content for Table)
129 | - added features (added container - for pre/post content alternative)
130 |
131 | - 0.0.2 - 4.04.2019 - https://evotec.xyz/dashimo-easy-table-conditional-formatting-and-more/
132 | - conditional formatting
133 | - more exposed parameters to Table
134 | - description of Autorefresh
135 | - Show parameter for dashboard
136 |
137 | - 0.0.1 - 01.04.2019 - https://evotec.xyz/meet-dashimo-powershell-generated-dashboard/ is an overview of what Dashimo is.
138 |
139 |
140 | ### Credits
141 |
142 | [Matthew Quickenden](https://www.linkedin.com/in/matthewquickenden/) ([@lucidqdreams](https://github.com/lucidqdreams)) - author of ReportHTML - without him this wouldn't be possible.
143 |
144 | ### Examples
145 |
146 | #### Conditional formatting in action...
147 |
148 | ```
149 | $Process = Get-Process | Select-Object -First 30
150 |
151 | Dashboard -Name 'Dashimo Test' -FilePath $PSScriptRoot\DashboardSimplestTableConditions.html -Show {
152 | Table -DataTable $Process -HideFooter {
153 | TableConditionalFormatting -Name 'ID' -ComparisonType number -Operator gt -Value 10000 -Color BlueViolet -Row
154 | TableConditionalFormatting -Name 'Name' -ComparisonType string -Operator eq -Value 'chrome' -Color White -BackgroundColor Crimson -Row
155 | TableConditionalFormatting -Name 'PriorityClass' -ComparisonType string -Operator eq -Value 'Idle' -Color White -BackgroundColor Green
156 | }
157 | }
158 | ```
159 |
160 | 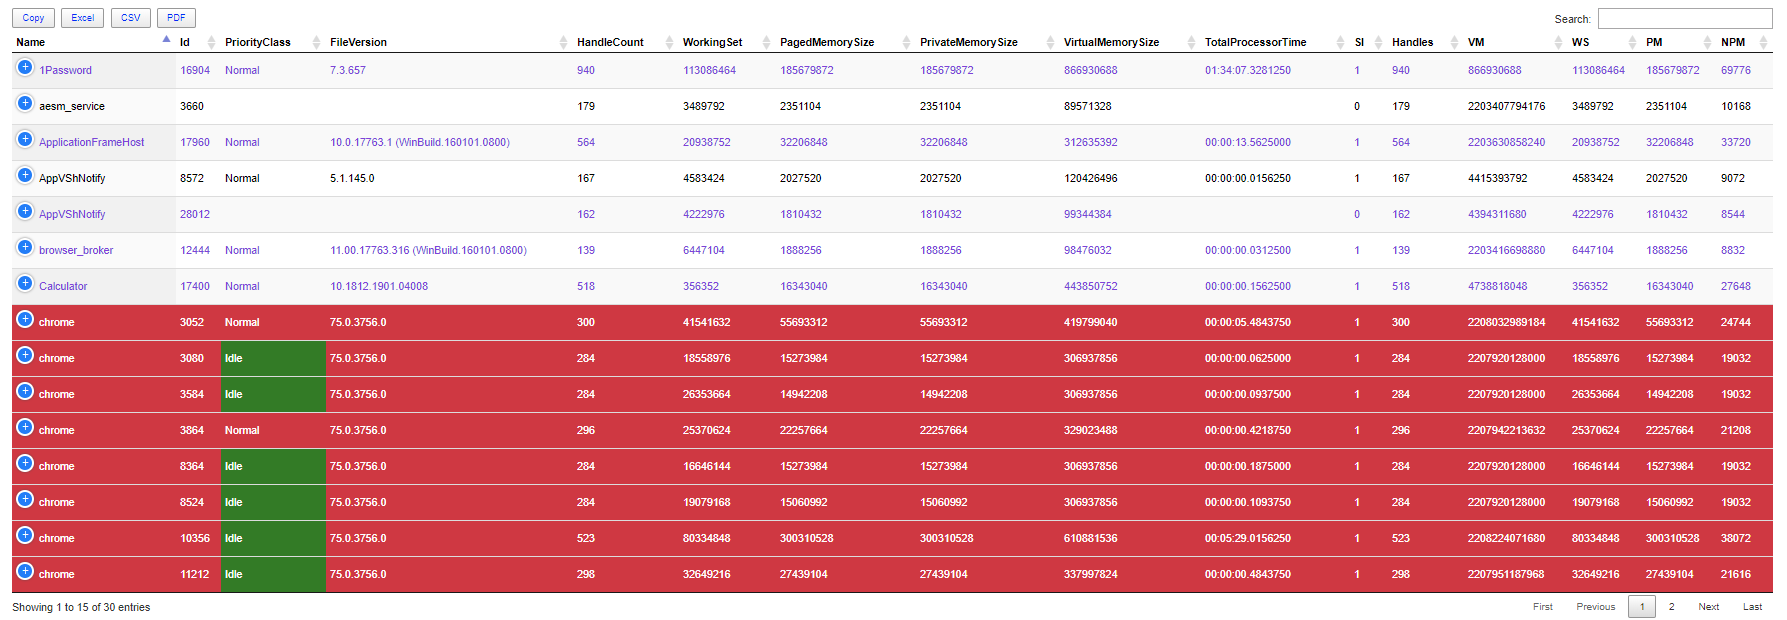
161 |
162 | #### Easy example:
163 |
164 | ```
165 | $Process = Get-Process | Select-Object -First 30
166 |
167 | Dashboard -Name 'Dashimo Test' -FilePath $PSScriptRoot\DashboardSimplestTable.html -AutoRefresh 15 -Show {
168 | Table -DataTable $Process -DefaultSortIndex 4 -ScrollCollapse -HideFooter -Buttons @()
169 | }
170 | ```
171 |
172 | 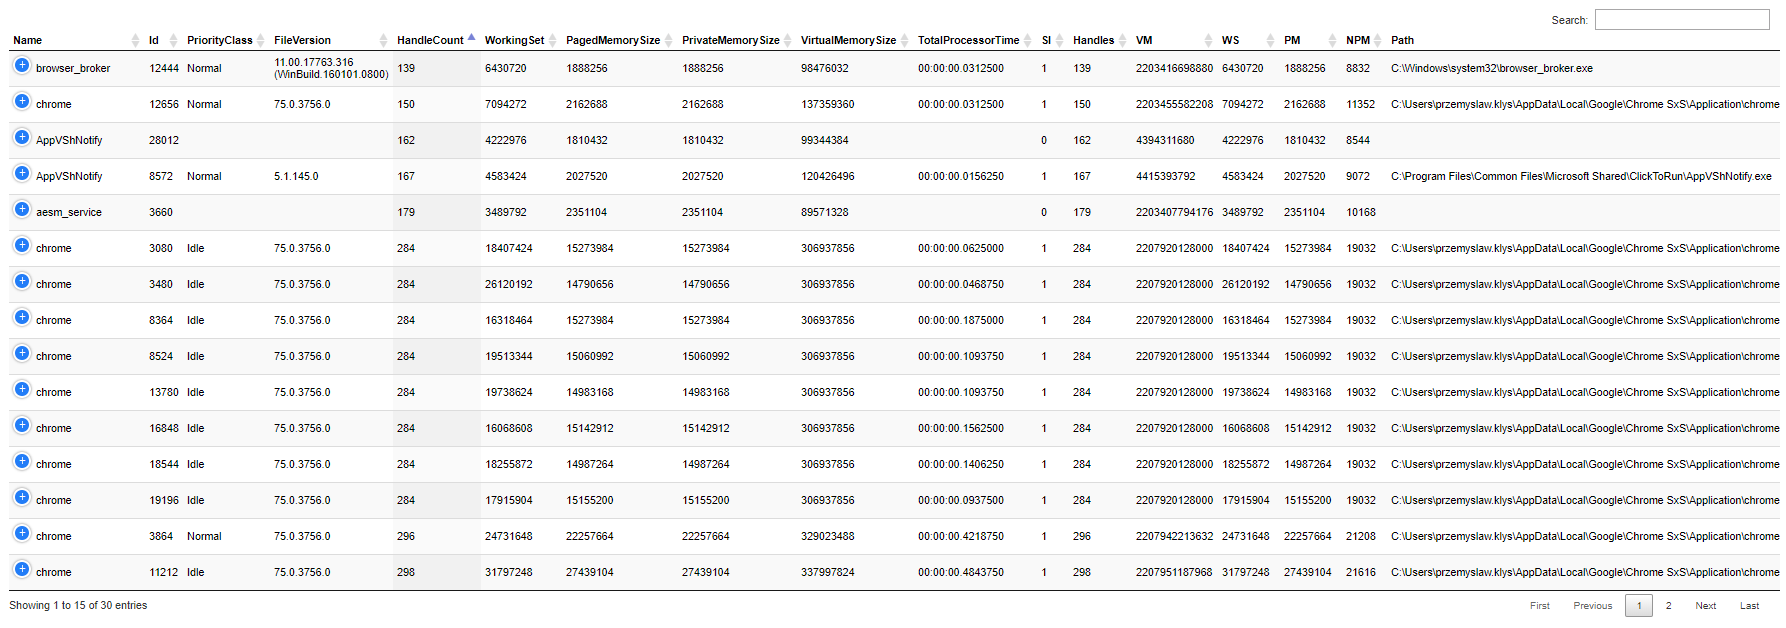
173 |
174 |
175 | #### Complicated, still easy example:
176 | ```
177 |
178 | $Process = Get-Process | Select-Object -First 30
179 | $Process1 = Get-Process | Select-Object -First 5
180 | $Process2 = Get-Process | Select-Object -First 10
181 | $Process3 = Get-Process | Select-Object -First 10
182 |
183 | Dashboard -Name 'Dashimo Test' -FilePath $PSScriptRoot\DashboardEasy.html -Show {
184 | Tab -Name 'First tab' {
185 | Section -Name 'Test' {
186 | Table -DataTable $Process
187 | }
188 | Section -Name 'Test2' {
189 | Panel {
190 | Table -DataTable $Process1
191 | }
192 | Panel {
193 | Table -DataTable $Process1
194 | }
195 | }
196 | Section -Name 'Test3' {
197 | Table -DataTable $Process -DefaultSortColumn 'Id'
198 | }
199 | }
200 | Tab -Name 'second tab' {
201 | Panel {
202 | Table -DataTable $Process2
203 | }
204 | Panel {
205 | Table -DataTable $Process2
206 | }
207 | Panel {
208 | Table -DataTable $Process3 -DefaultSortIndex 4
209 | }
210 | }
211 | }
212 | ```
213 |
214 | 
--------------------------------------------------------------------------------
 16 |
16 |