├── pic
└── 2017-07-31_12_47_18.780000.png
├── static
└── style.css
├── t_server.py
├── get_data.py
├── stock_price.py
├── templates
└── heatmap.html
├── LICENSE
├── README.md
├── .gitignore
└── heatmap_real_time.py
/pic/2017-07-31_12_47_18.780000.png:
--------------------------------------------------------------------------------
https://raw.githubusercontent.com/FrankBGao/HeatMap_for_TuShare/HEAD/pic/2017-07-31_12_47_18.780000.png
--------------------------------------------------------------------------------
/static/style.css:
--------------------------------------------------------------------------------
1 | #Container {
2 | font: 20px Microsoft YaHei, "Trebuchet MS", Arial, Helvetica, sans-serif;
3 | width: 900px;
4 | margin: 0 auto;
5 | }
6 |
--------------------------------------------------------------------------------
/t_server.py:
--------------------------------------------------------------------------------
1 | from tornado.httpserver import HTTPServer
2 | from tornado.ioloop import IOLoop
3 | from tornado.wsgi import WSGIContainer
4 | from stock_price import app
5 |
6 |
7 | server = HTTPServer(WSGIContainer(app))
8 | server.listen(5001)
9 | IOLoop.current().start()
--------------------------------------------------------------------------------
/get_data.py:
--------------------------------------------------------------------------------
1 | # -*- coding: utf8 -*-
2 | import pandas as pd
3 |
4 | def too_big_get_11(data):
5 | if data > 10:
6 | return 11
7 | elif data < -10:
8 | return -11
9 | else:
10 | return data
11 |
12 |
13 | def get_data_real_time(code_info,today):
14 | today = today.drop('name',axis = 1)
15 | today['rate'] = today['changepercent']
16 |
17 | data = pd.merge(today, code_info, on='code')
18 |
19 | data['rate'] = data['rate'].apply(too_big_get_11)
20 | data['rate'] = data['rate'].astype(int)
21 | return data
--------------------------------------------------------------------------------
/stock_price.py:
--------------------------------------------------------------------------------
1 | from flask import Flask, request, render_template
2 | import tushare as ts
3 | import get_data as gd
4 | import heatmap_real_time as heatmap
5 | app = Flask(__name__)
6 |
7 |
8 | @app.route('/', methods=['GET'])
9 | def plot_days():
10 | if request.method == 'GET' :
11 | today = ts.get_today_all()
12 | code_info = ts.get_industry_classified()
13 |
14 | today['code'] = today['code'].astype(unicode)
15 | one_day = gd.get_data_real_time(code_info, today)
16 | body = heatmap.get_heatmap('Today', one_day)
17 | return render_template('heatmap.html', body=body)
18 |
19 | if __name__ == '__main__':
20 | app.debug = True
21 | app.run()
22 |
23 |
--------------------------------------------------------------------------------
/templates/heatmap.html:
--------------------------------------------------------------------------------
1 |
2 |
3 |
4 |
5 | HeatMap
6 |
7 |
8 |
9 |
10 |
13 |
25 |
26 |
27 |
28 |
29 |
30 |
34 | {% if body %}
35 | {{ body|safe }}
36 | {% endif %}
37 |
38 |
--------------------------------------------------------------------------------
/LICENSE:
--------------------------------------------------------------------------------
1 | MIT License
2 |
3 | Copyright (c) 2017 FrankBGao
4 |
5 | Permission is hereby granted, free of charge, to any person obtaining a copy
6 | of this software and associated documentation files (the "Software"), to deal
7 | in the Software without restriction, including without limitation the rights
8 | to use, copy, modify, merge, publish, distribute, sublicense, and/or sell
9 | copies of the Software, and to permit persons to whom the Software is
10 | furnished to do so, subject to the following conditions:
11 |
12 | The above copyright notice and this permission notice shall be included in all
13 | copies or substantial portions of the Software.
14 |
15 | THE SOFTWARE IS PROVIDED "AS IS", WITHOUT WARRANTY OF ANY KIND, EXPRESS OR
16 | IMPLIED, INCLUDING BUT NOT LIMITED TO THE WARRANTIES OF MERCHANTABILITY,
17 | FITNESS FOR A PARTICULAR PURPOSE AND NONINFRINGEMENT. IN NO EVENT SHALL THE
18 | AUTHORS OR COPYRIGHT HOLDERS BE LIABLE FOR ANY CLAIM, DAMAGES OR OTHER
19 | LIABILITY, WHETHER IN AN ACTION OF CONTRACT, TORT OR OTHERWISE, ARISING FROM,
20 | OUT OF OR IN CONNECTION WITH THE SOFTWARE OR THE USE OR OTHER DEALINGS IN THE
21 | SOFTWARE.
22 |
--------------------------------------------------------------------------------
/README.md:
--------------------------------------------------------------------------------
1 | Please see the project of HeatMap_Echart_for_TuShare, it is better solution.
2 | # HeatMap_for_TuShare
3 | Create a heatmap for Real time China stocks price by TuShare's data
4 |
5 | This project is aiming at visualizing data from tushare. At this point of time, we create a heatmap for real time China stock price. Wtihin this map, you could view all stock's day price movement in one glimpse. Meanwhile, the stocks in one horizontal line are in same industry, so you could easliy identify which industry is focused by market.
6 |
7 | And this project is create by Flask for dealing requests, Bokeh for visualizing data and TuShare for getting data. Many thanks for those wonderful project.
8 |
9 | Usage of this project is simple, you just download those files and run stock.py. Then, browsing the link http://localhost:5000, waiting a bit of time for tushare downloading data, and you will see the pic.
10 |
11 | 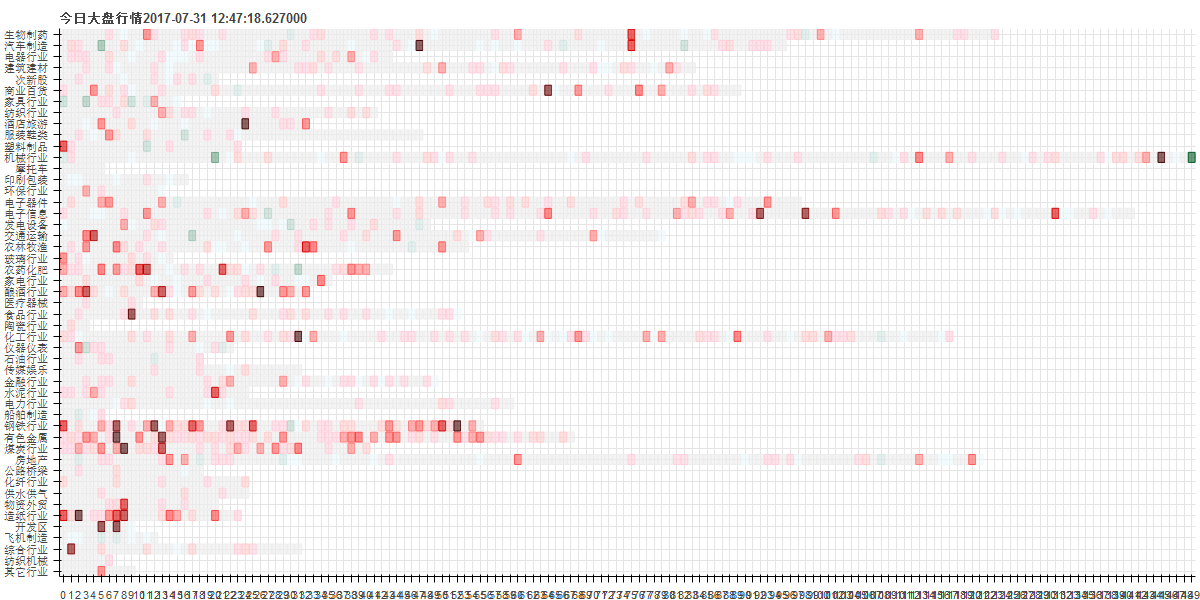
12 |
13 |
14 |
15 | 请参阅HeatMap_Echart_for_TuShare的项目,更好的解决方案。
16 | 使用TuShare作为数据源,制作了中国股市的股价的实时热力图。
17 |
18 | TuShare具有很多很丰富的股市数据,这个工作致力于将这些数据可视化,进而挖掘数据价值。目前我们基于TuShare的实时股价接口,制作了股价热力图,直观表现股价的每日变化。同时,将同一行业板块的股票放置在同一行,可以很直观的发现市场热点板块,追踪热点。
19 |
20 | 这个项目是主要由Flask、Bokeh、TuShare搭建而成。Flask作为框架驱动程序、完成访问,Bokeh完成可视化、绘制热力图,TuShare作为数据源下载数据。十分感谢这些很牛逼的开源项目,没有他们将我将无法完成本项目。
21 |
22 | 使用本项目很简单,只要下载代码,然后运行stock.py。你也可以使用各种其他Flask的wsgi部署方式。然后,访问http://localhost:5000, 等TuShare下载数据后,你将看到下图。
23 |
24 | 
25 |
26 |
--------------------------------------------------------------------------------
/.gitignore:
--------------------------------------------------------------------------------
1 | # Byte-compiled / optimized / DLL files
2 | __pycache__/
3 | *.py[cod]
4 | *$py.class
5 |
6 | # C extensions
7 | *.so
8 |
9 | # Distribution / packaging
10 | .Python
11 | env/
12 | build/
13 | develop-eggs/
14 | dist/
15 | downloads/
16 | eggs/
17 | .eggs/
18 | lib/
19 | lib64/
20 | parts/
21 | sdist/
22 | var/
23 | wheels/
24 | *.egg-info/
25 | .installed.cfg
26 | *.egg
27 |
28 | # PyInstaller
29 | # Usually these files are written by a python script from a template
30 | # before PyInstaller builds the exe, so as to inject date/other infos into it.
31 | *.manifest
32 | *.spec
33 |
34 | # Installer logs
35 | pip-log.txt
36 | pip-delete-this-directory.txt
37 |
38 | # Unit test / coverage reports
39 | htmlcov/
40 | .tox/
41 | .coverage
42 | .coverage.*
43 | .cache
44 | nosetests.xml
45 | coverage.xml
46 | *.cover
47 | .hypothesis/
48 |
49 | # Translations
50 | *.mo
51 | *.pot
52 |
53 | # Django stuff:
54 | *.log
55 | local_settings.py
56 |
57 | # Flask stuff:
58 | instance/
59 | .webassets-cache
60 |
61 | # Scrapy stuff:
62 | .scrapy
63 |
64 | # Sphinx documentation
65 | docs/_build/
66 |
67 | # PyBuilder
68 | target/
69 |
70 | # Jupyter Notebook
71 | .ipynb_checkpoints
72 |
73 | # pyenv
74 | .python-version
75 |
76 | # celery beat schedule file
77 | celerybeat-schedule
78 |
79 | # SageMath parsed files
80 | *.sage.py
81 |
82 | # dotenv
83 | .env
84 |
85 | # virtualenv
86 | .venv
87 | venv/
88 | ENV/
89 |
90 | # Spyder project settings
91 | .spyderproject
92 | .spyproject
93 |
94 | # Rope project settings
95 | .ropeproject
96 |
97 | # mkdocs documentation
98 | /site
99 |
100 | # mypy
101 | .mypy_cache/
102 |
--------------------------------------------------------------------------------
/heatmap_real_time.py:
--------------------------------------------------------------------------------
1 | # -*- coding: utf8 -*-
2 | from bokeh.models import ColumnDataSource, HoverTool
3 | from bokeh.plotting import figure
4 | from bokeh.embed import components
5 |
6 | from datetime import datetime
7 |
8 |
9 | def get_index(data):
10 | data['index_len'] = range(len(data))
11 | return data
12 |
13 | def get_heatmap(day,one_day):
14 | one_day = one_day.drop_duplicates()
15 | print len(one_day)
16 | # I don't want 创业板
17 | one_day['code_is'] = one_day['code'].apply(lambda x: x[0])
18 | one_day = one_day[one_day['code_is'] != '3']
19 |
20 | one_day = one_day.groupby('c_name', as_index=False).apply(get_index)
21 | romans = one_day['c_name'].drop_duplicates().values # [str(x) for x in range(0, one_day['index_len'].max())]
22 |
23 |
24 | group_range = [str(x) for x in range(0, one_day['index_len'].max())]
25 |
26 | colormap = {
27 | -11: '#005824',
28 | -10: '#005824',
29 | -9: '#1A693B',
30 | -8: '#347B53',
31 | -7: '#4F8D6B',
32 | -6: '#699F83',
33 | -5: '#83B09B',
34 | -4: '#9EC2B3',
35 | -3: '#B8D4CB',
36 | -2: '#D2E6E3',
37 | -1: '#EDF8FB',
38 | 0: '#ededed',
39 | 1: '#ffcfdc',
40 | 2: '#ffcccc',
41 | 3: '#ff8080',
42 | 4: '#ff5959',
43 | 5: '#ff4040',
44 | 6: '#d90000',
45 | 7: '#b20000',
46 | 8: '#7f0000',
47 | 9: '#660000',
48 | 10: '#400000',
49 | 11: '#400000'
50 | }
51 | if 'trade' in one_day.columns:
52 | source = ColumnDataSource(
53 | data=dict(
54 | group=[unicode(x) for x in one_day["c_name"]],
55 | period=[unicode(y) for y in one_day["index_len"]],
56 | type_color=[colormap[x] for x in one_day["rate"]],
57 | code=one_day["code"],
58 | amount=one_day["amount"],
59 | trade=one_day["trade"],
60 | c_name=one_day["c_name"],
61 | name=one_day["name"],
62 | rate=one_day["rate"],
63 | volume=one_day["volume"],
64 | high=one_day["high"],
65 | low=one_day["low"],
66 | open=one_day["open"],
67 | )
68 | )
69 | p = figure(title=u"今日大盘行情"+ str(datetime.now()) , tools="pan,wheel_zoom,box_zoom,reset,save,hover",
70 | x_range=group_range, y_range=list(reversed(romans)))
71 | else:
72 | source = ColumnDataSource(
73 | data=dict(
74 | group=[unicode(x) for x in one_day["c_name"]],
75 | period=[unicode(y) for y in one_day["index_len"]],
76 | type_color=[colormap[x] for x in one_day["rate"]],
77 | code=one_day["code"],
78 | amount=one_day["amount"],
79 | close=one_day["close"],
80 | c_name=one_day["c_name"],
81 | name=one_day["name"],
82 | rate=one_day["rate"],
83 | volume=one_day["volume"],
84 | high=one_day["high"],
85 | low=one_day["low"],
86 | open=one_day["open"],
87 | )
88 | )
89 | p = figure(title=u"大盘行情" + day, tools="pan,wheel_zoom,box_zoom,reset,save,hover",
90 | x_range=group_range, y_range=list(reversed(romans)))
91 |
92 |
93 | p.plot_width = 1200
94 | p.toolbar_location = None
95 | p.outline_line_color = None
96 |
97 | p.rect("period", "group", 0.9, 0.9, source=source,
98 | fill_alpha=0.6, color="type_color")
99 |
100 | p.select_one(HoverTool).tooltips = [
101 | ("c_name", "@c_name"),
102 | ("name", "@name"),
103 | ("code", "@code"),
104 | ("rate", "@rate"),
105 | ("volume", "@volume"),
106 | ("amount", "@amount"),
107 | ("high", "@high"),
108 | ("low", "@low"),
109 | ("open", "@open"),
110 | ("close", "@close"),
111 | ("trade", "@trade"),
112 | ]
113 | script, div = components(p)
114 | return div + script
115 |
--------------------------------------------------------------------------------