}}
42 |
43 | \if{html}{\out{
44 |
45 | }}
46 | }
47 |
48 |
--------------------------------------------------------------------------------
/man/footnote_plan.Rd:
--------------------------------------------------------------------------------
1 | % Generated by roxygen2: do not edit by hand
2 | % Please edit documentation in R/footnote_plan.R
3 | \name{footnote_plan}
4 | \alias{footnote_plan}
5 | \title{Footnote Plan}
6 | \usage{
7 | footnote_plan(..., marks = c("numbers", "letters", "standard", "extended"))
8 | }
9 | \arguments{
10 | \item{...}{a series of \code{\link[=footnote_structure]{footnote_structure()}} separated by commas}
11 |
12 | \item{marks}{type of marks required for footnotes, properties inherited from
13 | tab_footnote in 'gt'. Available options are "numbers", "letters",
14 | "standard" and "extended" (standard for a traditional set of 4 symbols,
15 | extended for 6 symbols). The default option is set to "numbers".}
16 | }
17 | \value{
18 | footnote plan object
19 | }
20 | \description{
21 | Defining the location and content of footnotes with a series of footnote
22 | structures. Each structure is a footnote and can be applied in multiple locations.
23 | }
24 | \examples{
25 |
26 | # Adds a footnote indicated by letters rather than numbers to Group 1
27 | footnote_plan <- footnote_plan(
28 | footnote_structure(footnote_text = "Source Note", group_val = "Group 1"),
29 | marks="letters")
30 |
31 | # Adds a footnote to the 'Placebo' column
32 | footnote_plan <- footnote_plan(
33 | footnote_structure(footnote_text = "footnote", column_val = "Placebo"),
34 | marks="numbers")
35 |
36 | }
37 |
--------------------------------------------------------------------------------
/man/element_block.Rd:
--------------------------------------------------------------------------------
1 | % Generated by roxygen2: do not edit by hand
2 | % Please edit documentation in R/theme_element.R
3 | \name{element_block}
4 | \alias{element_block}
5 | \title{Element block}
6 | \usage{
7 | element_block(post_space = c(NULL, " ", "-"), fill = TRUE)
8 | }
9 | \arguments{
10 | \item{post_space}{Values to show in a new line created after the group block}
11 |
12 | \item{fill}{Whether to recycle the value of \code{post_space} to match width of the data. Defaults to \code{TRUE}}
13 | }
14 | \value{
15 | element block object
16 | }
17 | \description{
18 | Element block
19 | }
20 | \examples{
21 |
22 | tfrmt_spec <- tfrmt(
23 | group = grp1,
24 | label = label,
25 | param = param,
26 | value = value,
27 | column = column,
28 | row_grp_plan = row_grp_plan(
29 | row_grp_structure(group_val = ".default", element_block(post_space = " "))
30 | ),
31 | body_plan = body_plan(
32 | frmt_structure(group_val = ".default", label_val = ".default", frmt("xx"))
33 | )
34 | )
35 | }
36 | \seealso{
37 | \code{\link[=row_grp_plan]{row_grp_plan()}} for more details on how to group row group
38 | structures, \code{\link[=row_grp_structure]{row_grp_structure()}} for more details on how to specify row group
39 | structures, \code{\link[=element_row_grp_loc]{element_row_grp_loc()}} for more details on how to
40 | specify whether row group titles span the entire table or collapse.
41 | }
42 |
--------------------------------------------------------------------------------
/man/row_grp_structure.Rd:
--------------------------------------------------------------------------------
1 | % Generated by roxygen2: do not edit by hand
2 | % Please edit documentation in R/row_group_plan.R
3 | \name{row_grp_structure}
4 | \alias{row_grp_structure}
5 | \title{Row Group Structure Object}
6 | \usage{
7 | row_grp_structure(group_val = ".default", element_block)
8 | }
9 | \arguments{
10 | \item{group_val}{A string or a named list of strings which represent the
11 | value of group should be when the given frmt is implemented}
12 |
13 | \item{element_block}{element_block() object to define the block styling}
14 | }
15 | \value{
16 | row_grp_structure object
17 | }
18 | \description{
19 | Function needed to create a row_grp_structure object, which is a building block
20 | of \code{\link[=row_grp_plan]{row_grp_plan()}}
21 | }
22 | \examples{
23 |
24 | ## single grouping variable example
25 | row_grp_structure(group_val = c("A","C"), element_block(post_space = "---"))
26 |
27 | ## example with multiple grouping variables
28 | row_grp_structure(group_val = list(grp1 = "A", grp2 = "b"), element_block(post_space = " "))
29 |
30 | }
31 | \seealso{
32 | \code{\link[=row_grp_plan]{row_grp_plan()}} for more details on how to group row group
33 | structures, \code{\link[=element_block]{element_block()}} for more details on how to specify spacing
34 | between each group.
35 |
36 | \href{https://gsk-biostatistics.github.io/tfrmt/articles/row_grp_plan.html}{Link to related article}
37 | }
38 |
--------------------------------------------------------------------------------
/man/param_set.Rd:
--------------------------------------------------------------------------------
1 | % Generated by roxygen2: do not edit by hand
2 | % Please edit documentation in R/tfrmt_sigdig.R
3 | \name{param_set}
4 | \alias{param_set}
5 | \title{Set custom parameter-level significant digits rounding}
6 | \usage{
7 | param_set(...)
8 | }
9 | \arguments{
10 | \item{...}{Series of name-value pairs, optionally formatted using
11 | \code{glue::glue()} syntax (note \code{glue} syntax is required for combined
12 | parameters).The name represents the parameter and the value represents the number of places to round the parameter to.
13 | For combined parameters (e.g., \code{"{min}, {max}"}), value should
14 | be a vector of the same length (e.g., c(1,1)).}
15 | }
16 | \value{
17 | list of default parameter-level significant digits rounding
18 | }
19 | \description{
20 | Set custom parameter-level significant digits rounding
21 | }
22 | \details{
23 | Type \code{param_set()} in console to view package defaults. Use of the
24 | function will add to the defaults and/or override included defaults of the
25 | same name. For values that are integers, use \code{NA} so no decimal places will
26 | be added.
27 | }
28 | \examples{
29 | # View included defaults
30 | param_set()
31 |
32 | # Update the defaults
33 | param_set("{mean} ({sd})" = c(2,3), "pct" = 1)
34 |
35 | # Separate mean and SD to different lines
36 | param_set("mean" = 2, "sd" = 3)
37 |
38 | # Add formatting using the glue syntax
39 | param_set("{pct} \%" = 1)
40 |
41 | }
42 |
--------------------------------------------------------------------------------
/man/big_n_structure.Rd:
--------------------------------------------------------------------------------
1 | % Generated by roxygen2: do not edit by hand
2 | % Please edit documentation in R/big_n.R
3 | \name{big_n_structure}
4 | \alias{big_n_structure}
5 | \title{Big N Structure}
6 | \usage{
7 | big_n_structure(param_val, n_frmt = frmt("\\nN = xx"), by_page = FALSE)
8 | }
9 | \arguments{
10 | \item{param_val}{row value(s) of the parameter column for which the values
11 | are big N's}
12 |
13 | \item{n_frmt}{\code{\link[=frmt]{frmt()}} to control the formatting of the big N's}
14 |
15 | \item{by_page}{Option to include different big N's for each group-defined set
16 | of pages (defined by any variables set to \code{".default"} in the \code{page_plan}).
17 | Default is \code{FALSE}, meaning only the overall Ns are applied}
18 | }
19 | \value{
20 | big_n_structure object
21 | }
22 | \description{
23 | Big N structure allows you to specify which values should become the subject
24 | totals ("big N" values) and how they should be formatted in the table's
25 | column labels. Values are specified by providing the value(s) of the \code{param}
26 | column for which the values are big N's. This will remove these from the
27 | body of the table and place them into columns matching the values in the
28 | column column(s). The default formatting is \code{N = xx}, on its own line, but
29 | that can be changed by providing a different \code{frmt()} to \code{n_frmt}.
30 | }
31 | \seealso{
32 | \href{https://gsk-biostatistics.github.io/tfrmt/articles/big_ns.html}{Link to related article}
33 | }
34 |
--------------------------------------------------------------------------------
/.github/workflows/pkgdown.yaml:
--------------------------------------------------------------------------------
1 | # Workflow derived from https://github.com/r-lib/actions/tree/v2/examples
2 | # Need help debugging build failures? Start at https://github.com/r-lib/actions#where-to-find-help
3 | on:
4 | push:
5 | branches: [main, master]
6 | pull_request:
7 | branches: [main, master]
8 | release:
9 | types: [published]
10 | workflow_dispatch:
11 |
12 | name: pkgdown
13 |
14 | jobs:
15 | pkgdown:
16 | runs-on: ubuntu-latest
17 | # Only restrict concurrency for non-PR jobs
18 | concurrency:
19 | group: pkgdown-${{ github.event_name != 'pull_request' || github.run_id }}
20 | env:
21 | GITHUB_PAT: ${{ secrets.GITHUB_TOKEN }}
22 | permissions:
23 | contents: write
24 | steps:
25 | - uses: actions/checkout@v4
26 |
27 | - uses: r-lib/actions/setup-pandoc@v2
28 |
29 | - uses: r-lib/actions/setup-r@v2
30 | with:
31 | use-public-rspm: true
32 |
33 | - uses: r-lib/actions/setup-r-dependencies@v2
34 | with:
35 | extra-packages: any::pkgdown, local::.
36 | needs: website
37 |
38 | - name: Build site
39 | run: pkgdown::build_site_github_pages(new_process = FALSE, install = FALSE)
40 | shell: Rscript {0}
41 |
42 | - name: Deploy to GitHub pages 🚀
43 | if: github.event_name != 'pull_request'
44 | uses: JamesIves/github-pages-deploy-action@v4.5.0
45 | with:
46 | clean: false
47 | branch: gh-pages
48 | folder: docs
49 |
--------------------------------------------------------------------------------
/man/layer_tfrmt.Rd:
--------------------------------------------------------------------------------
1 | % Generated by roxygen2: do not edit by hand
2 | % Please edit documentation in R/tfrmt_layer.R
3 | \name{layer_tfrmt}
4 | \alias{layer_tfrmt}
5 | \title{Layer tfrmt objects together}
6 | \usage{
7 | layer_tfrmt(x, y, ..., join_body_plans = TRUE)
8 | }
9 | \arguments{
10 | \item{x, y}{tfrmt objects that need to be combined}
11 |
12 | \item{...}{arguments passed to layer_tfrmt_arg functions for combining different tfrmt elements}
13 |
14 | \item{join_body_plans}{should the \code{body_plans} be combined, or just keep styling in y. See details: join_body_plans for more details.}
15 | }
16 | \value{
17 | tfrmt object
18 | }
19 | \description{
20 | Provide utility for layering tfrmt objects together. If both tfrmt's have
21 | values, it will preferentially choose the second tfrmt by default. This is an
22 | alternative to piping together tfrmt's
23 | }
24 | \details{
25 | \subsection{join_body_plan}{
26 |
27 | When combining two body_plans, the body plans will stack together, first the
28 | body plan from x tfrmt then y tfrmt. This means that frmt_structures in y
29 | will take priority over those in x.
30 |
31 | Combining two tfrmt with large body_plans can lead to slow table evaluation.
32 | Consider setting \code{join_body_plan} to \code{FALSE}. Only the y \code{body_plan} will be
33 | preserved.
34 | }
35 | }
36 | \examples{
37 |
38 | tfrmt_1 <- tfrmt(title = "title1")
39 |
40 | tfrmt_2 <- tfrmt(title = "title2",subtitle = "subtitle2")
41 |
42 | layered_table_format <- layer_tfrmt(tfrmt_1, tfrmt_2)
43 |
44 | }
45 |
--------------------------------------------------------------------------------
/man/prep_big_n.Rd:
--------------------------------------------------------------------------------
1 | % Generated by roxygen2: do not edit by hand
2 | % Please edit documentation in R/prep_card.R
3 | \name{prep_big_n}
4 | \alias{prep_big_n}
5 | \title{Prepare \code{bigN} stat variables}
6 | \usage{
7 | prep_big_n(df, vars)
8 | }
9 | \arguments{
10 | \item{df}{(data.frame)}
11 |
12 | \item{vars}{(character) a vector of variables to prepare \code{bigN} for.}
13 | }
14 | \value{
15 | a data.frame with the same columns as the input. The \code{stat_name}
16 | column is modified.
17 | }
18 | \description{
19 | \ifelse{html}{\href{https://lifecycle.r-lib.org/articles/stages.html#experimental}{\figure{lifecycle-experimental.svg}{options: alt='[Experimental]'}}}{\strong{[Experimental]}}
20 |
21 | \code{prep_big_n()}:
22 | \itemize{
23 | \item recodes the \code{"n"} \code{stat_name} into \code{bigN} for the desired variables,
24 | and
25 | \item drops all other \code{stat_names} for the same variables.
26 | }
27 |
28 | If your \code{tfrmt} contains a \code{\link[=big_n_structure]{big_n_structure()}} you pass the tfrmt \code{column} to
29 | \code{prep_big_n()} via \code{vars}.
30 | }
31 | \examples{
32 | df <- data.frame(
33 | stat_name = c("n", "max", "min", rep(c("n", "N", "p"), times = 2)),
34 | context = rep(c("continuous", "hierarchical", "categorical"), each = 3),
35 | stat_variable = rep(c("a", "b", "c"), each = 3)
36 | ) |>
37 | dplyr::bind_rows(
38 | data.frame(
39 | stat_name = "n",
40 | context = "total_n",
41 | stat_variable = "d"
42 | )
43 | )
44 |
45 | prep_big_n(
46 | df,
47 | vars = c("b", "c")
48 | )
49 | }
50 |
--------------------------------------------------------------------------------
/man/apply_frmt.Rd:
--------------------------------------------------------------------------------
1 | % Generated by roxygen2: do not edit by hand
2 | % Please edit documentation in R/apply_frmt_methods.R
3 | \name{apply_frmt}
4 | \alias{apply_frmt}
5 | \alias{apply_frmt.frmt}
6 | \alias{apply_frmt.frmt_combine}
7 | \alias{apply_frmt.frmt_when}
8 | \title{Apply formatting}
9 | \usage{
10 | apply_frmt(frmt_def, .data, value, mock = FALSE, ...)
11 |
12 | \method{apply_frmt}{frmt}(frmt_def, .data, value, mock = FALSE, ...)
13 |
14 | \method{apply_frmt}{frmt_combine}(
15 | frmt_def,
16 | .data,
17 | value,
18 | mock = FALSE,
19 | param,
20 | column,
21 | label,
22 | group,
23 | ...
24 | )
25 |
26 | \method{apply_frmt}{frmt_when}(frmt_def, .data, value, mock = FALSE, ...)
27 | }
28 | \arguments{
29 | \item{frmt_def}{formatting to be applied}
30 |
31 | \item{.data}{data, but only what is getting changed}
32 |
33 | \item{value}{value symbol should only be one}
34 |
35 | \item{mock}{Logical value is this is for a mock or not. By default \code{FALSE}}
36 |
37 | \item{...}{additional arguments for methods}
38 |
39 | \item{param}{param column as a quosure}
40 |
41 | \item{column}{column columns as a list of quosures}
42 |
43 | \item{label}{label column as a quosure}
44 |
45 | \item{group}{group column as a list of quosures}
46 | }
47 | \value{
48 | formatted dataset
49 | }
50 | \description{
51 | Apply formatting
52 | }
53 | \examples{
54 |
55 | library(tibble)
56 | library(dplyr)
57 | # Set up data
58 | df <- tibble(x = c(20.12,34.54,12.34))
59 |
60 | apply_frmt(
61 | frmt_def = frmt("XX.X"),
62 | .data=df,
63 | value=quo(x))
64 |
65 | }
66 |
--------------------------------------------------------------------------------
/man/tfrmt_n_pct.Rd:
--------------------------------------------------------------------------------
1 | % Generated by roxygen2: do not edit by hand
2 | % Please edit documentation in R/tfrmt_n_pct.R
3 | \name{tfrmt_n_pct}
4 | \alias{tfrmt_n_pct}
5 | \title{N Percent Template}
6 | \usage{
7 | tfrmt_n_pct(
8 | n = "n",
9 | pct = "pct",
10 | pct_frmt_when = frmt_when("==100" ~ frmt(""), ">99" ~ frmt("(>99\%)"), "==0" ~ "", "<1"
11 | ~ frmt("(<1\%)"), "TRUE" ~ frmt("(xx.x\%)")),
12 | tfrmt_obj = NULL
13 | )
14 | }
15 | \arguments{
16 | \item{n}{name of count (n) value in the parameter column}
17 |
18 | \item{pct}{name of percent (pct) value in the parameter column}
19 |
20 | \item{pct_frmt_when}{formatting to be used on the the percent values}
21 |
22 | \item{tfrmt_obj}{an optional tfrmt object to layer}
23 | }
24 | \value{
25 | tfrmt object
26 | }
27 | \description{
28 | This function creates an tfrmt for an n \% table, so count based table. The
29 | parameter values for n and percent can be provided (by default it will assume
30 | \code{n} and \code{pct}). Additionally the \code{frmt_when} for formatting the percent can
31 | be specified. By default 100\% and 0\% will not appear and everything between
32 | 99\% and 100\% and 0\% and 1\% will be rounded using greater than (>) and less
33 | than (<) signs respectively.
34 | }
35 | \section{Examples}{
36 |
37 |
38 | \if{html}{\out{
}}
63 |
64 | \if{html}{\out{ }}
65 | }
66 |
67 |
--------------------------------------------------------------------------------
/tests/testthat/test-check_order_vars.R:
--------------------------------------------------------------------------------
1 |
2 | test_that("Message is printed if order variables are causing mismatching rows",{
3 | data <- tibble::tibble(param = c("N","N","n","n","pct","pct"),
4 | value = c(111,222,11,22,11,22),
5 | order1=c(NA,NA,1,1,1,1),
6 | order2=c(NA,NA,1,2,1,2),
7 | order3=c(1,2,NA,NA,NA,NA),
8 | label=c("Training set","Training set","Sex, n(%)","Sex, n(%)","Sex, n(%)","Sex, n(%)"),
9 | column=c("Test","Train","Test","Train","Test","Train"))
10 |
11 | data2 <- data %>%
12 | rbind(data) %>%
13 | mutate(group= c(rep("group1",6),rep("group2",6)))
14 |
15 | data3 <- tibble::tibble(param = c("N","N","n","n","pct","pct"),
16 | value = c(111,222,11,22,11,22),
17 | order1=c(NA,NA,1,1,1,1),
18 | order2=c(NA,NA,1,1,1,1),
19 | order3=c(1,1,NA,NA,NA,NA),
20 | label=c("Training set","Training set","Sex, n(%)","Sex, n(%)","Sex, n(%)","Sex, n(%)"),
21 | column=c("Test","Train","Test","Train","Test","Train"))
22 |
23 | tfrmt = tfrmt(
24 | label = label,
25 | column = column,
26 | param = param,
27 | value=value,
28 | sorting_cols=c(order1,order2,order3),
29 | col_plan = col_plan(
30 | -order1,
31 | -order2,
32 | -order3
33 | ))
34 |
35 | tfrmt2 <- tfrmt(
36 | group = group,
37 | label = label,
38 | column = column,
39 | param = param,
40 | value=value,
41 | sorting_cols=c(order1,order2,order3),
42 | col_plan = col_plan(
43 | -order1,
44 | -order2,
45 | -order3
46 | ))
47 |
48 | # use quietly to grab messages from apply_tfrmt
49 | safe_check_order<-purrr::quietly(check_order_vars)
50 |
51 | expect_equal(
52 | safe_check_order(data, tfrmt)$messages[1],
53 | "Note: Some row labels have values printed over more than 1 line.\n This could be due to incorrect sorting variables. Each row in your output table should have only one sorting var combination assigned to it.\n")
54 |
55 | expect_equal(
56 | safe_check_order(data2, tfrmt2)$messages[1],
57 | "Note: Some row labels have values printed over more than 1 line.\n This could be due to incorrect sorting variables. Each row in your output table should have only one sorting var combination assigned to it.\n")
58 |
59 | expect_equal(
60 | safe_check_order(data3, tfrmt)$messages,
61 | character(0))
62 |
63 | })
64 |
--------------------------------------------------------------------------------
/tests/testthat/test-quo_get.R:
--------------------------------------------------------------------------------
1 | test_that("turn length one unquoted vals into args", {
2 |
3 | temp_function <- function(x){
4 | quo_get(
5 | args = "x",
6 | as_var_args = "x"
7 | )
8 | }
9 |
10 | expect_equal(
11 | temp_function(bare_arg_val)$x,
12 | vars(bare_arg_val),
13 | ignore_attr = TRUE
14 | )
15 |
16 | })
17 |
18 | test_that("turn length 2 unquoted vals into args", {
19 |
20 | temp_function <- function(x){
21 | quo_get(
22 | args = "x",
23 | as_var_args = "x"
24 | )
25 | }
26 |
27 | expect_equal(
28 | temp_function(c(bare_arg_val1, bare_arg_val2))$x,
29 | vars(bare_arg_val1, bare_arg_val2),
30 | ignore_attr = TRUE
31 | )
32 |
33 | })
34 |
35 | test_that("turn length one unquoted quo into args", {
36 |
37 | temp_function <- function(x){
38 | quo_get(
39 | args = "x",
40 | as_quo_args = "x"
41 | )
42 | }
43 |
44 | expect_equal(
45 | temp_function(bare_arg_val)$x,
46 | quo(bare_arg_val),
47 | ignore_attr = TRUE
48 | )
49 |
50 | })
51 |
52 | test_that("turn length two unquoted quo into args", {
53 |
54 | temp_function <- function(x){
55 | quo_get(
56 | args = "x",
57 | as_quo_args = "x"
58 | )
59 | }
60 |
61 | warning_res <- capture_warnings({
62 | tempfunc_res <-
63 | temp_function(c(bare_arg_val1, bare_arg_val2))
64 | })
65 |
66 | expect_equal(
67 | tempfunc_res$x,
68 | quo(bare_arg_val1),
69 | ignore_attr = TRUE
70 | )
71 |
72 | })
73 |
74 |
75 | test_that("throw error when input argument errors out", {
76 |
77 | temp_function_1 <- function(x, ...){
78 | val <- temp_function_2(...)
79 | val
80 | }
81 |
82 | temp_function_2 <- function(..., env = parent.frame()){
83 |
84 | arg_parent <- names(formals(sys.function(sys.parent(1))))
85 |
86 | args <- setdiff(arg_parent,c("..."))
87 |
88 | val <- quo_get(
89 | args,
90 | envir = env
91 | )
92 |
93 | val
94 | }
95 |
96 | fail_function <- function(...){
97 |
98 | dot_list <- as.list(substitute(substitute(...)))[-1]
99 |
100 | if(length(dot_list) == 0){
101 | stop("I HAVE FAILED")
102 | }else{
103 | dot_list
104 | }
105 | }
106 |
107 | expect_silent(
108 | temp_function_1(x = fail_function("test value"))
109 | )
110 |
111 | expect_error(
112 | temp_function_1(x = fail_function()),
113 | "Error in evaluating argument `x`:\n Error in fail_function(): I HAVE FAILED",
114 | fixed = TRUE
115 | )
116 |
117 | })
118 |
119 |
--------------------------------------------------------------------------------
/R/tfrmt_n_pct.R:
--------------------------------------------------------------------------------
1 | #' N Percent Template
2 | #'
3 | #' This function creates an tfrmt for an n % table, so count based table. The
4 | #' parameter values for n and percent can be provided (by default it will assume
5 | #' `n` and `pct`). Additionally the `frmt_when` for formatting the percent can
6 | #' be specified. By default 100% and 0% will not appear and everything between
7 | #' 99% and 100% and 0% and 1% will be rounded using greater than (>) and less
8 | #' than (<) signs respectively.
9 | #' @param n name of count (n) value in the parameter column
10 | #' @param pct name of percent (pct) value in the parameter column
11 | #' @param pct_frmt_when formatting to be used on the the percent values
12 | #' @param tfrmt_obj an optional tfrmt object to layer
13 | #'
14 | #' @returns tfrmt object
15 | #' @export
16 | #' @section Examples:
17 | #'
18 | #' ```r
19 | #' print_mock_gt(tfrmt_n_pct())
20 | #' ```
21 | #'
22 | #' \if{html}{\out{
23 | #' `r ""`
24 | #' }}
25 | #'
26 | #' @importFrom rlang parse_expr
27 | tfrmt_n_pct <- function(n = "n",
28 | pct = "pct",
29 | pct_frmt_when = frmt_when("==100"~ frmt(""),
30 | ">99"~ frmt("(>99%)"),
31 | "==0"~ "",
32 | "<1" ~ frmt("(<1%)"),
33 | "TRUE" ~ frmt("(xx.x%)")),
34 | tfrmt_obj = NULL){
35 | if(is.null(n)|is.na(n)|n==""){
36 | stop("`n` value must be provided")
37 | }
38 | if(is.null(pct)|is.na(pct)|pct==""){
39 | stop("`pct` value must be provided")
40 | }
41 |
42 | combo <- paste0(
43 | "frmt_combine('{",
44 | n,
45 | "} {", pct, "}',",
46 | n, "=frmt('x'),",
47 | pct, "=pct_frmt_when)"
48 | ) %>%
49 | parse_expr() %>% eval()
50 |
51 | if(!is.null(tfrmt_obj)){
52 | ae_tbl <- tfrmt(
53 | body_plan = body_plan(
54 | frmt_structure(
55 | group_val = ".default", label_val = ".default",
56 | combo
57 | )
58 | )
59 | )
60 | ae_tbl <- layer_tfrmt(x = tfrmt_obj, y = ae_tbl)
61 | } else {
62 | ae_tbl <- tfrmt(
63 | param = "param",
64 | label = "row_label1",
65 | column = "col1",
66 | value = "value",
67 | body_plan = body_plan(
68 | frmt_structure(
69 | group_val = ".default", label_val = ".default",
70 | combo
71 | )
72 | )
73 | )
74 | }
75 | ae_tbl
76 | }
77 |
--------------------------------------------------------------------------------
/tests/testthat/test-tfrmt_n_pct.R:
--------------------------------------------------------------------------------
1 | test_that("tfrmt_n_pct", {
2 |
3 | # format to avoid issues with the environment
4 | expect_equal(format(tfrmt_n_pct()$body_plan),
5 | body_plan(
6 | frmt_structure(
7 | group_val = ".default", label_val = ".default",
8 | frmt_combine("{n} {pct}", n = frmt("xxx"),
9 | pct = frmt_when("==100"~ frmt(""),
10 | ">99"~ frmt("(>99%)"),
11 | "==0"~ "",
12 | "<1" ~ frmt("(<1%)"),
13 | "TRUE" ~ frmt("(xx.x%)")))
14 | )
15 | ) %>% format()
16 | )
17 | # See that it can change when n is changed
18 | expect_equal(format(tfrmt_n_pct("n_distinct")$body_plan),
19 | body_plan(
20 | frmt_structure(
21 | group_val = ".default", label_val = ".default",
22 | frmt_combine("{n_distinct} {pct}", n_distinct = frmt("xxx"),
23 | pct = frmt_when("==100"~ frmt(""),
24 | ">99"~ frmt("(>99%)"),
25 | "==0"~ "",
26 | "<1" ~ frmt("(<1%)"),
27 | "TRUE" ~ frmt("(xx.x%)")))
28 | )
29 | ) %>% format()
30 | )
31 | # Change the frmt_when
32 | expect_equal(format(tfrmt_n_pct(pct_frmt_when =
33 | frmt_when(
34 | "==100" ~ "",
35 | "==0" ~ "",
36 | TRUE ~ frmt("(xx.x %)")
37 | ))$body_plan),
38 | body_plan(
39 | frmt_structure(
40 | group_val = ".default", label_val = ".default",
41 | frmt_combine("{n} {pct}", n = frmt("xxx"),
42 | pct = frmt_when(
43 | "==100" ~ "",
44 | "==0" ~ "",
45 | TRUE ~ frmt("(xx.x %)")
46 | ))
47 | )
48 | ) %>% format()
49 | )
50 |
51 | # layer with existing tfrmt
52 | test <- tfrmt(
53 | column = column
54 | )
55 | expect_equal(tfrmt_n_pct(tfrmt_obj = test)$column[[1]] %>%
56 | as_label(),
57 | "column")
58 |
59 | expect_error(tfrmt_n_pct(n = ""))
60 | expect_error(tfrmt_n_pct(pct = NULL))
61 |
62 | })
63 |
64 |
--------------------------------------------------------------------------------
/.github/workflows/pr-commands.yaml:
--------------------------------------------------------------------------------
1 | # Workflow derived from https://github.com/r-lib/actions/tree/v2/examples
2 | # Need help debugging build failures? Start at https://github.com/r-lib/actions#where-to-find-help
3 | on:
4 | issue_comment:
5 | types: [created]
6 |
7 | name: Commands
8 |
9 | jobs:
10 | document:
11 | if: ${{ github.event.issue.pull_request && (github.event.comment.author_association == 'MEMBER' || github.event.comment.author_association == 'OWNER') && startsWith(github.event.comment.body, '/document') }}
12 | name: document
13 | runs-on: ubuntu-latest
14 | env:
15 | GITHUB_PAT: ${{ secrets.GITHUB_TOKEN }}
16 | steps:
17 | - uses: actions/checkout@v4
18 |
19 | - uses: r-lib/actions/pr-fetch@v2
20 | with:
21 | repo-token: ${{ secrets.GITHUB_TOKEN }}
22 |
23 | - uses: r-lib/actions/setup-r@v2
24 | with:
25 | use-public-rspm: true
26 |
27 | - uses: r-lib/actions/setup-r-dependencies@v2
28 | with:
29 | extra-packages: any::roxygen2
30 | needs: pr-document
31 |
32 | - name: Document
33 | run: roxygen2::roxygenise()
34 | shell: Rscript {0}
35 |
36 | - name: commit
37 | run: |
38 | git config --local user.name "$GITHUB_ACTOR"
39 | git config --local user.email "$GITHUB_ACTOR@users.noreply.github.com"
40 | git add man/\* NAMESPACE
41 | git commit -m 'Document'
42 |
43 | - uses: r-lib/actions/pr-push@v2
44 | with:
45 | repo-token: ${{ secrets.GITHUB_TOKEN }}
46 |
47 | style:
48 | if: ${{ github.event.issue.pull_request && (github.event.comment.author_association == 'MEMBER' || github.event.comment.author_association == 'OWNER') && startsWith(github.event.comment.body, '/style') }}
49 | name: style
50 | runs-on: ubuntu-latest
51 | env:
52 | GITHUB_PAT: ${{ secrets.GITHUB_TOKEN }}
53 | steps:
54 | - uses: actions/checkout@v4
55 |
56 | - uses: r-lib/actions/pr-fetch@v2
57 | with:
58 | repo-token: ${{ secrets.GITHUB_TOKEN }}
59 |
60 | - uses: r-lib/actions/setup-r@v2
61 |
62 | - name: Install dependencies
63 | run: install.packages("styler")
64 | shell: Rscript {0}
65 |
66 | - name: Style
67 | run: styler::style_pkg()
68 | shell: Rscript {0}
69 |
70 | - name: commit
71 | run: |
72 | git config --local user.name "$GITHUB_ACTOR"
73 | git config --local user.email "$GITHUB_ACTOR@users.noreply.github.com"
74 | git add \*.R
75 | git commit -m 'Style'
76 |
77 | - uses: r-lib/actions/pr-push@v2
78 | with:
79 | repo-token: ${{ secrets.GITHUB_TOKEN }}
80 |
--------------------------------------------------------------------------------
/R/data.R:
--------------------------------------------------------------------------------
1 | #' Demography Analysis Results Data
2 | #'
3 | #' A dataset containing the results needed for a demography table. Using the
4 | #' CDISC pilot data.
5 | #'
6 | #' @format A data frame with 386 rows and 7 variables:
7 | #' \describe{
8 | #' \item{rowlbl1}{highest level row labels}
9 | #' \item{rowlbl2}{more specific row labels}
10 | #' \item{param}{parameter to explain each value}
11 | #' \item{grp}{grouping column used to distinguish continuous and categorical}
12 | #' \item{ord1}{controls ordering}
13 | #' \item{ord2}{more ordering controls}
14 | #' \item{column}{column names}
15 | #' \item{value}{values to put in a table}
16 | #' }
17 | "data_demog"
18 |
19 |
20 | #' Adverse Events Analysis Results Data
21 | #'
22 | #' A dataset containing the results needed for an AE table. Using the
23 | #' CDISC pilot data.
24 | #'
25 | #' @format A data frame with 2,794 rows and 8 variables:
26 | #' \describe{
27 | #' \item{AEBODSYS}{highest level row labels: System Organ Class}
28 | #' \item{AETERM}{more specific row labels: Preferred Term}
29 | #' \item{col2}{higher level column names (spanners)}
30 | #' \item{col1}{lower level column names}
31 | #' \item{param}{parameter to explain each value}
32 | #' \item{value}{values to put in a table}
33 | #' \item{ord1}{controls ordering}
34 | #' \item{ord2}{more ordering controls}
35 | #' }
36 | "data_ae"
37 |
38 | #' Efficacy Analysis Results Data
39 | #'
40 | #' A dataset containing the results needed for an Efficacy table. Using the
41 | #' CDISC pilot data for ADAS-Cog(11).
42 | #'
43 | #' @format A data frame with 70 rows and 7 variables:
44 | #' \describe{
45 | #' \item{group}{highest level row labels}
46 | #' \item{label}{more specific row labels}
47 | #' \item{column}{column names}
48 | #' \item{param}{parameter to explain each value}
49 | #' \item{value}{values to put in a table}
50 | #' \item{ord1}{controls ordering}
51 | #' \item{ord2}{more ordering controls}
52 | #' }
53 | "data_efficacy"
54 |
55 |
56 | #' Labs Analysis Results Data
57 | #'
58 | #' A dataset containing the results needed for an labs results table. Using the
59 | #' CDISC pilot data.
60 | #'
61 | #' @format A data frame with 4,950 rows and 7 variables:
62 | #' \describe{
63 | #' \item{group1}{highest level row labels: Lab value class}
64 | #' \item{group2}{more specific row labels: Lab parameter}
65 | #' \item{rowlbl}{most specific row labels: Study visit}
66 | #' \item{col1}{higher level column names (spanners)}
67 | #' \item{col2}{lower level column names}
68 | #' \item{param}{parameter to explain each value}
69 | #' \item{value}{values to put in a table}
70 | #' \item{ord1}{controls ordering}
71 | #' \item{ord2}{more ordering controls}
72 | #' \item{ord3}{more ordering controls}
73 | #' }
74 | "data_labs"
75 |
--------------------------------------------------------------------------------
/vignettes/json.Rmd:
--------------------------------------------------------------------------------
1 | ---
2 | title: "JSON metadata"
3 | output: rmarkdown::html_vignette
4 | vignette: >
5 | %\VignetteIndexEntry{JSON metadata}
6 | %\VignetteEngine{knitr::rmarkdown}
7 | %\VignetteEncoding{UTF-8}
8 | ---
9 |
10 | ```{r, include = FALSE}
11 | knitr::opts_chunk$set(
12 | collapse = TRUE,
13 | comment = "#>"
14 | )
15 | ```
16 |
17 | ```{r setup, message = FALSE, warning = FALSE}
18 | library(tfrmt)
19 | ```
20 |
21 | Aside from R code, `tfrmt` objects can be represented as machine-readable metadata in `JSON` format. This enables users to save formatting metadata to a database, or alternatively import templates stored as `JSON` files. There are several utilities available for seamless translation between `tfrmt` and `JSON`.
22 |
23 | ## tfrmt to JSON
24 |
25 | A `tfrmt` object can be converted to `JSON` using the `tfrmt_to_json` function. Suppose we have a basic `tfrmt`:
26 |
27 | ```{r}
28 | template_tfrmt <- tfrmt(
29 | group = grp,
30 | label = label,
31 | column = column,
32 | param = param,
33 | value = value,
34 | body_plan = body_plan(
35 | frmt_structure(
36 | group_val = ".default",
37 | label_val = ".default",
38 | frmt("xx.x")
39 | )
40 | )
41 | )
42 | template_tfrmt |> print_mock_gt()
43 | ```
44 |
45 | We can pass this through `tfrmt_to_json` to convert to `JSON` metadata.
46 | ```{r}
47 | template_tfrmt |>
48 | tfrmt_to_json()
49 | ```
50 |
51 | This `JSON` can optionally be saved to a file by providing a file path as the second argument to the function:
52 |
53 | ```{r eval = FALSE}
54 | tfrmt(
55 | group = grp,
56 | label = label,
57 | column = column,
58 | param = param,
59 | value = value,
60 | body_plan = body_plan(
61 | frmt_structure(
62 | group_val = ".default",
63 | label_val = ".default",
64 | frmt("xx.x")
65 | )
66 | )
67 | ) |>
68 | tfrmt_to_json(path = "template.JSON")
69 | ```
70 |
71 |
72 | ## JSON to tfrmt
73 |
74 | If a `JSON` file already exists, users can import this into R.
75 |
76 | ```{r echo=FALSE}
77 | template_json <- tfrmt(
78 | group = grp,
79 | label = label,
80 | column = column,
81 | param = param,
82 | value = value,
83 | title = "mytitle",
84 | body_plan = body_plan(
85 | frmt_structure(
86 | group_val = ".default",
87 | label_val = ".default",
88 | frmt("xx.x")
89 | )
90 | )
91 | )
92 | ```
93 |
94 | ```{r eval = FALSE}
95 | template_json <- json_to_tfrmt(path = "template.JSON")
96 | ```
97 |
98 |
99 | Once available in the R session, users can optionally build on this template as needed.
100 | ```{r}
101 | template_json |>
102 | layer_tfrmt(
103 | tfrmt(title = "Custom title")
104 | ) |>
105 | print_mock_gt()
106 | ```
107 |
108 |
109 |
--------------------------------------------------------------------------------
/R/page_plan.R:
--------------------------------------------------------------------------------
1 | #' Page Plan
2 | #'
3 | #' Defining the location and/or frequency of page splits with a series of
4 | #' page_structure's and the row_every_n argument, respectively.
5 | #'
6 | #' @param ... a series of [page_structure()] separated by commas
7 | #' @param note_loc Location of the note describing each table's subset value(s).
8 | #' Useful if the `page_structure` contains only ".default" values (meaning the
9 | #' table is split by every unique level of a grouping variable), and that
10 | #' variable is dropped in the col_plan. `preheader` only available for rtf output.
11 | #' @param max_rows Option to set a maximum number of rows per page. Takes a numeric value.
12 | #'
13 | #' @return page_plan object
14 | #' @export
15 | #'
16 | #' @examples
17 | #' # use of page_struct
18 | #' page_plan(
19 | #' page_structure(group_val = "grp1", label_val = "lbl1")
20 | #' )
21 | #'
22 | #' # use of # rows
23 | #' page_plan(
24 | #' max_rows = 5
25 | #' )
26 | #'
27 | #'
28 | page_plan <- function(...,
29 | note_loc = c("noprint","preheader","subtitle","source_note"),
30 | max_rows = NULL){
31 |
32 | page_structure_list <- list(...)
33 | note_loc <- match.arg(note_loc)
34 |
35 | structure(
36 | list(struct_list = page_structure_list, note_loc=note_loc, max_rows=max_rows),
37 | class = c("page_plan", "plan")
38 | )
39 | }
40 |
41 | #' Page structure
42 | #'
43 | #' @param group_val string or a named list of strings which represent the value of group to split after.
44 | #' Set to ".default" if the split should occur after every unique value of the variable.
45 | #' @param label_val string which represents the value of label to split after.
46 | #' Set to ".default" if the split should occur after every unique value of
47 | #' the variable.
48 |
49 | #'
50 | #' @return page structure object
51 | #' @export
52 | #'
53 | #' @examples
54 | #' # split page after every unique level of the grouping variable
55 | #' page_structure(group_val = ".default", label_val = NULL)
56 | #'
57 | #' # split page after specific levels
58 | #' page_structure(group_val = "grp1", label_val = "lbl3")
59 | page_structure <- function(group_val = NULL, label_val = NULL){
60 |
61 |
62 | if(length(group_val)>1 && is.list(group_val)==FALSE && !is.null(names(group_val))){
63 | group_val <- as.list(group_val)
64 | }else if(length(group_val)==1 && !is.null(names(group_val))){
65 | group_val<-as.list(group_val)
66 | }
67 |
68 |
69 | if(is.list(group_val)){
70 | group_val_names <- names(group_val)
71 | if(is.null(group_val_names)){
72 | stop("when group_val is a list, must be a named list")
73 | }else if(any(group_val_names == "")){
74 | stop("when group_val is a list, each entry must be named")
75 | }
76 | }
77 |
78 | structure(
79 | list(
80 | group_val = group_val,
81 | label_val = label_val),
82 | class = c("page_structure","structure")
83 | )
84 |
85 | }
86 |
--------------------------------------------------------------------------------
/tests/testthat/test-expr_to_filter.R:
--------------------------------------------------------------------------------
1 | test_that("expr_to_filter - quosure", {
2 |
3 | var <- "value1"
4 | default <- ".default"
5 | quo_val <- quo(col)
6 |
7 | filter_var <- expr_to_filter.quosure(cols = quo_val, val = var)
8 | filter_default <- expr_to_filter.quosure(cols = quo_val, val = default)
9 |
10 | expect_equal(filter_var, "`col` %in% c(\"value1\")")
11 | expect_equal(filter_default, "TRUE")
12 |
13 | })
14 |
15 |
16 | test_that("expr_to_filter - quosures", {
17 |
18 | var <- "value1"
19 | default <- ".default"
20 | var_list_named <- list(col1 = "value1", col2 = "value2")
21 | var_list_default <- list(col1 = ".default", col2 = "value2")
22 | var_list_misnamed <- list(col1 = ".default", col12 = "value2")
23 | var_list_missing <- list(col2 = "value2")
24 | quos_val_1 <- vars(col1)
25 | quos_val_2 <- vars(col1,col2)
26 |
27 | ## length 1 vars = length one var
28 | filter_var <- expr_to_filter.quosures(cols = quos_val_1, val = var)
29 | filter_default <- expr_to_filter.quosures(cols = quos_val_1, val = default)
30 |
31 | expect_equal(filter_var, "`col1` %in% c(\"value1\")")
32 | expect_equal(filter_default, "TRUE")
33 |
34 | ## length 2 vars & length one var
35 |
36 | ### Must be a list
37 | expect_error(
38 | expr_to_filter.quosures(cols = quos_val_2, val = var),
39 | "If multiple cols are provided, val must be a named list",
40 | fixed = TRUE
41 | )
42 |
43 | ### .default is allowed
44 | expect_equal(
45 | expr_to_filter.quosures(cols = quos_val_2, val = default),
46 | "TRUE"
47 | )
48 |
49 | ## length 2 vars & length two var
50 | filter_var_list_named <- expr_to_filter.quosures(cols = quos_val_2, val = var_list_named)
51 | filter_var_list_default <- expr_to_filter.quosures(cols = quos_val_2, val = var_list_default)
52 |
53 | expect_equal(filter_var_list_named, "`col1` %in% c(\"value1\") & `col2` %in% c(\"value2\")")
54 | expect_equal(filter_var_list_default, "TRUE & `col2` %in% c(\"value2\")")
55 |
56 | ## length 2 vars & length two var incorrect names
57 | expect_error(
58 | expr_to_filter.quosures(cols = quos_val_2, val = var_list_misnamed),
59 | "Names of val entries do not all match col values",
60 | fixed = TRUE
61 | )
62 |
63 |
64 |
65 | })
66 |
67 | test_that("expr_to_filter - quosure - with quotes", {
68 |
69 | quo_val <- quo(col)
70 |
71 | var <- "value1's"
72 | filter_var <- expr_to_filter.quosure(cols = quo_val, val = var)
73 | expect_equal(filter_var, "`col` %in% c(\"value1's\")")
74 |
75 | var <- 'value1\'s'
76 | filter_var <- expr_to_filter.quosure(cols = quo_val, val = var)
77 | expect_equal(filter_var, "`col` %in% c(\"value1's\")")
78 |
79 | var <- '"a value with quotes"'
80 | filter_var <- expr_to_filter.quosure(cols = quo_val, val = var)
81 | expect_equal(filter_var, "`col` %in% c(\"\\\"a value with quotes\\\"\")")
82 |
83 | var <- "\"a value with quotes\""
84 | filter_var <- expr_to_filter.quosure(cols = quo_val, val = var)
85 | expect_equal(filter_var, "`col` %in% c(\"\\\"a value with quotes\\\"\")")
86 | })
87 |
88 |
--------------------------------------------------------------------------------
/vignettes/unusual_tables.Rmd:
--------------------------------------------------------------------------------
1 | ---
2 | title: "Unusual Tables"
3 | output: rmarkdown::html_vignette
4 | vignette: >
5 | %\VignetteIndexEntry{Unusual Tables}
6 | %\VignetteEngine{knitr::rmarkdown}
7 | %\VignetteEncoding{UTF-8}
8 | ---
9 |
10 | ```{r, include = FALSE}
11 | knitr::opts_chunk$set(
12 | collapse = TRUE,
13 | comment = "#>"
14 | )
15 | ```
16 |
17 | ```{r setup, message=FALSE,warning=FALSE}
18 | library(tfrmt)
19 | ```
20 |
21 |
22 | # Multiple columns of Row Labels
23 |
24 | It is not all that unusual for listings (and some tables) to have multiple row label columns. When this happens, it is often easier to avoid using gt's out-of-the box stub functions/formatting. An example of a table like this is the "Summary of Number of Subjects by Site" from the CDISC pilot.
25 | 
26 |
27 | To make this table the values will be long with "Pooled Id" and "Site Id" in their own columns, as if they were group or label variables. We also will need a column for the parameters even though they are all the same.
28 |
29 | ```{r}
30 | data <- tibble::tribble(
31 | ~`Pooled Id`, ~`Site Id`,
32 | "701", "701",
33 | "703", "703",
34 | "704", "704",
35 | "705", "705",
36 | "708", "708",
37 | "709", "709",
38 | "710", "710",
39 | "713", "713",
40 | "716", "716",
41 | "718", "718",
42 | "900", "702",
43 | "900", "706",
44 | "900", "707",
45 | "900", "711",
46 | "900", "714",
47 | "900", "715",
48 | "900", "717",
49 | "Total", " "
50 | ) |>
51 | tidyr::crossing(
52 | col1 = c(
53 | "Placebo (N=86)",
54 | "Xanomeline Low Dose (N=84)",
55 | "Xanomeline High Dose (N=84)",
56 | "Total (N=254)"
57 | ),
58 | col2 = factor(c("ITT", "Eff", "Com"), levels = c("ITT", "Eff", "Com"))
59 | ) |>
60 | dplyr::mutate(
61 | val = rpois(216, 15), # Here I am just faking the data for display purposes
62 | param = "val"
63 | )
64 | ```
65 |
66 | Once we have the data in the standard ARD format we can make the `tfrmt`. What makes this `tfrmt` different is we won't include group or label, and our two ID columns will be displayed as regular columns. This also means that all columns of the table, including the ID columns, can be ordered via the `col_plan()`. Because the `col_plan()` follows the conventions of `select()` we can't specify the order of the highest level spanning columns and the lower level columns. But, `tfrmt` respects the order things are put in, which is why we used a factor for the populations.
67 | ```{r}
68 | tfrmt(
69 | param = "param",
70 | value = "val",
71 | column = vars(col1, col2),
72 | body_plan = body_plan(
73 | frmt_structure(group_val = ".default", label_val = ".default", frmt("XX"))
74 | ),
75 | row_grp_plan = row_grp_plan(label_loc = element_row_grp_loc("column")),
76 | col_plan = col_plan(
77 | `Pooled Id`, `Site Id`,
78 | contains("Placebo"),
79 | contains("High Dose"),
80 | contains("Low Dose"),
81 | everything()
82 | )
83 | ) |>
84 | print_to_gt(data)
85 | ```
86 |
87 |
--------------------------------------------------------------------------------
/tests/testthat/_snaps/big_n.md:
--------------------------------------------------------------------------------
1 | # big Ns constant by page
2 |
3 | Code
4 | auto <- apply_tfrmt(.data = data, tfrmt = mytfrmt, mock = FALSE)
5 | Message
6 | Mismatch between big Ns and page_plan. For varying big N's by page (`by_page` = TRUE in `big_n_structure`), data must contain 1 big N value per unique grouping variable/value set to ".default" in `page_plan` and bigNs must be in order of the data
7 |
8 | ---
9 |
10 | The following columns have multiple Big N's associated with them:
11 | c("Placebo", "Total", "Treatment")
12 |
13 | # not enough big Ns by page
14 |
15 | Code
16 | apply_tfrmt(.data = data, tfrmt = mytfrmt, mock = FALSE)
17 | Message
18 | Mismatch between big Ns and page_plan. For varying big N's by page (`by_page` = TRUE in `big_n_structure`), data must contain 1 big N value per unique grouping variable/value set to ".default" in `page_plan` and bigNs must be in order of the data
19 | Output
20 | [[1]]
21 | # A tibble: 3 x 5
22 | Label `Placebo\nN = 12` `Treatment\nN = 14` `Total\nN = 31`
23 | *
24 | 1 "Age (y)"
25 | 2 " n" "12" "14" "31"
26 | 3 " " " " " " " "
27 | # i 1 more variable: ..tfrmt_row_grp_lbl
28 |
29 | [[2]]
30 | # A tibble: 3 x 5
31 | Label `Placebo\nN = 12` `Treatment\nN = 14` `Total\nN = 31`
32 | *
33 | 1 "Sex"
34 | 2 " n" "20" "32" "18"
35 | 3 " " " " " " " "
36 | # i 1 more variable: ..tfrmt_row_grp_lbl
37 |
38 |
39 | # Paging (group) variable is sorted non-alphabetically
40 |
41 | Code
42 | apply_tfrmt(.data = data, tfrmt = mytfrmt, mock = FALSE)
43 | Message
44 | Mismatch between big Ns and page_plan. For varying big N's by page (`by_page` = TRUE in `big_n_structure`), data must contain 1 big N value per unique grouping variable/value set to ".default" in `page_plan` and bigNs must be in order of the data
45 | Output
46 | [[1]]
47 | # A tibble: 3 x 5
48 | Label `Placebo\nN = 12` `Treatment\nN = 14` `Total\nN = 31`
49 | *
50 | 1 "Sex"
51 | 2 " n" "20" "32" "18"
52 | 3 " " " " " " " "
53 | # i 1 more variable: ..tfrmt_row_grp_lbl
54 |
55 | [[2]]
56 | # A tibble: 3 x 5
57 | Label `Placebo\nN = 20` `Treatment\nN = 32` `Total\nN = 18`
58 | *
59 | 1 "Age (y)"
60 | 2 " n" "12" "14" "31"
61 | 3 " " " " " " " "
62 | # i 1 more variable: ..tfrmt_row_grp_lbl
63 |
64 |
65 |
--------------------------------------------------------------------------------
/man/theme_element.Rd:
--------------------------------------------------------------------------------
1 | % Generated by roxygen2: do not edit by hand
2 | % Please edit documentation in R/col_style_plan.R
3 | \name{col_style_structure}
4 | \alias{col_style_structure}
5 | \title{Column Style Structure}
6 | \usage{
7 | col_style_structure(
8 | col,
9 | align = NULL,
10 | type = c("char", "pos"),
11 | width = NULL,
12 | ...
13 | )
14 | }
15 | \arguments{
16 | \item{col}{Column value to align on from \code{column} variable. May be a quoted
17 | or unquoted column name, a tidyselect semantic, or a span_structure.}
18 |
19 | \item{align}{Alignment to be applied to column. Defaults to \code{left} alignment. See details for acceptable values.}
20 |
21 | \item{type}{Type of alignment: "char" or "pos", for character alignment (default), and positional alignment, respectively. Positional alignment allows for aligning over multiple positions in the column.}
22 |
23 | \item{width}{Width to apply to the column in number of characters. Acceptable values include a
24 | numeric value, or a character string of a number.}
25 |
26 | \item{...}{These dots are for future extensions and must be empty}
27 | }
28 | \value{
29 | col_style_structure object
30 | }
31 | \description{
32 | Column Style Structure
33 | }
34 | \details{
35 | Supports alignment and width setting of data value columns (values found in the \code{column} column). Row group and label columns are left-aligned by default. Acceptable input values for \code{align} differ by type = "char" or "pos":
36 | \subsection{Character alignment (type = "char"):}{
37 | \itemize{
38 | \item "left" for left alignment
39 | \item "right" for right alignment"
40 | \item supply a vector of character(s) to align on. If more than
41 | one character is provided, alignment will be based on the first occurrence
42 | of any of the characters. For alignment based on white space, leading white
43 | spaces will be ignored.
44 | }
45 | }
46 |
47 | \subsection{Positional alignment (type = "pos"):}{
48 |
49 | supply a vector of strings covering all formatted cell values, with numeric values represented as x's. These values can be created manually or obtained by utilizing the helper \code{display_val_frmts()}. Alignment positions will be represented by vertical bars. For example, with starting values: c("12.3", "(5\%)", "2.35 (10.23)") we can align all of the first sets of decimals and parentheses by providing align = c("xx|.x", "||(x\%)", "x|.xx |")
50 | }
51 | }
52 | \examples{
53 |
54 | plan <- col_style_plan(
55 | col_style_structure(col = "my_var",
56 | align = c("xx| |(xx\%)",
57 | "xx|.x |(xx.x - xx.x)"),
58 | type = "pos", width = 100),
59 | col_style_structure(col = vars(four), align = "right", width = 200),
60 | col_style_structure(col = vars(two, three), align = c(".", ",", " ")),
61 | col_style_structure(col = c(two, three), width = 25),
62 | col_style_structure(col = two, width = 25),
63 | col_style_structure(col = span_structure(span = value, col = val2),
64 | width = 25)
65 | )
66 |
67 | }
68 | \seealso{
69 | \code{\link[=col_style_plan]{col_style_plan()}} for more information on how to combine
70 | col_style_structure()'s together to form a plan.
71 |
72 | \href{https://gsk-biostatistics.github.io/tfrmt/articles/col_style_plan.html}{Link to related article}
73 | }
74 |
--------------------------------------------------------------------------------
/inst/json_examples/tfrmt_ae.json:
--------------------------------------------------------------------------------
1 | {
2 | "group": ["AEBODSYS"],
3 | "label": ["AETERM"],
4 | "param": ["param"],
5 | "value": ["value"],
6 | "column": ["col2", "col1"],
7 | "row_grp_plan": {
8 | "struct_list": [],
9 | "label_loc": {
10 | "location": ["indented"],
11 | "indent": [" "]
12 | }
13 | },
14 | "body_plan": [
15 | {
16 | "group_val": [".default"],
17 | "label_val": [".default"],
18 | "param_val": ["n", "pct"],
19 | "frmt_combine": {
20 | "expression": ["{n} {pct}"],
21 | "frmt_ls": {
22 | "n": {
23 | "frmt": {
24 | "expression": ["XXX"],
25 | "missing": {},
26 | "scientific": {},
27 | "transform": {}
28 | }
29 | },
30 | "pct": {
31 | "frmt_when": {
32 | "frmt_ls": {
33 | "==100": [""],
34 | "==0": [""],
35 | "TRUE": {
36 | "frmt": {
37 | "expression": ["(xx.x %)"],
38 | "missing": {},
39 | "scientific": {},
40 | "transform": {}
41 | }
42 | }
43 | },
44 | "missing": {}
45 | }
46 | }
47 | },
48 | "missing": {}
49 | }
50 | },
51 | {
52 | "group_val": [".default"],
53 | "label_val": [".default"],
54 | "param_val": ["AEs"],
55 | "frmt": {
56 | "expression": ["[XXX]"],
57 | "missing": {},
58 | "scientific": {},
59 | "transform": {}
60 | }
61 | },
62 | {
63 | "group_val": [".default"],
64 | "label_val": [".default"],
65 | "param_val": ["pval"],
66 | "frmt_when": {
67 | "frmt_ls": {
68 | ">0.99": [">0.99"],
69 | "<0.001": ["<0.001"],
70 | "<0.05": {
71 | "frmt": {
72 | "expression": ["x.xxx*"],
73 | "missing": {},
74 | "scientific": {},
75 | "transform": {}
76 | }
77 | },
78 | "TRUE": {
79 | "frmt": {
80 | "expression": ["x.xxx"],
81 | "missing": ["--"],
82 | "scientific": {},
83 | "transform": {}
84 | }
85 | }
86 | },
87 | "missing": {}
88 | }
89 | }
90 | ],
91 | "col_style_plan": [
92 | {
93 | "cols": [
94 | ["p_low"],
95 | ["p_high"]
96 | ],
97 | "align": [".", ",", " "],
98 | "type": ["char"],
99 | "width": {}
100 | }
101 | ],
102 | "col_plan": {
103 | "col_plan": {
104 | "dots": [
105 | ["-starts_with(\"ord\")"],
106 | {
107 | "span_structure": {
108 | "col2": ["Xanomeline High Dose", "Xanomeline Low Dose", "Placebo"],
109 | "col1": ["n_pct", "AEs"]
110 | }
111 | },
112 | {
113 | "span_structure": {
114 | "col2": ["fisher_pval"],
115 | "col1": ["p_low", "p_high"]
116 | }
117 | }
118 | ],
119 | ".drop": [false]
120 | }
121 | },
122 | "sorting_cols": ["ord1", "ord2"]
123 | }
124 |
--------------------------------------------------------------------------------
/vignettes/faq.Rmd:
--------------------------------------------------------------------------------
1 | ---
2 | title: "FAQ"
3 | output: rmarkdown::html_vignette
4 | vignette: >
5 | %\VignetteIndexEntry{FAQ}
6 | %\VignetteEngine{knitr::rmarkdown}
7 | %\VignetteEncoding{UTF-8}
8 | ---
9 |
10 | ```{r, include = FALSE}
11 | knitr::opts_chunk$set(
12 | collapse = TRUE,
13 | comment = "#>"
14 | )
15 | ```
16 |
17 | ```{r setup, message=FALSE, warning=FALSE, echo=FALSE}
18 | library(tfrmt)
19 | ```
20 |
21 | ### Can you format a column header?
22 |
23 | To format your column header, just use markdown syntax within your character strings. Examples of this could be a newline, or bolding certain words. To add a newline to your column header you need to include the markdown syntax ` ` or `\n` in your character string. For bolding, surround your text with `**` on either side. Some example code is provided below:
24 |
25 | ```{r}
26 | es_data <- tibble::tibble(
27 | rowlbl1 = c(rep("Completion Status", 12), rep("Primary reason for withdrawal", 28)),
28 | rowlbl2 = c(rep("Completed", 4), rep("Prematurely Withdrawn", 4), rep("Unknown", 4), rep("Adverse Event", 4), rep("Lost to follow-up", 4), rep("Protocol violation", 4), rep("Subject decided to withdraw", 4), rep("Protocol Violation", 4), rep("Pre-Operative Dose[1]", 4), rep("Other", 4)),
29 | param = c(rep(c("n", "n", "pct", "pct"), 10)),
30 | column = c(rep(c("Placebo (N=48)", "Treatment\n**(N=38)**"), 20)), # newline and bold syntax
31 | value = c(24, 19, 2400 / 48, 1900 / 38, 5, 1, 500 / 48, 100 / 38, 19, 18, 1900 / 48, 1800 / 38, 1, 1, 100 / 48, 100 / 38, 0, 0, 0, 0, 0, 0, 0, 0, 1, 1, 100 / 48, 100 / 38, 1, 4, 100 / 48, 400 / 38, 1, 0, 100 / 48, 0, 2, 3, 200 / 48, 300 / 38)
32 | )
33 |
34 | tfrmt(
35 | # specify columns in the data
36 | group = c(rowlbl1),
37 | label = rowlbl2,
38 | column = column,
39 | param = param,
40 | value = value,
41 | # set formatting for values
42 | body_plan = body_plan(
43 | frmt_structure(
44 | group_val = ".default",
45 | label_val = ".default",
46 | frmt_combine(
47 | "{n} {pct}",
48 | n = frmt("xxx"),
49 | pct = frmt_when(
50 | "==100" ~ "",
51 | "==0" ~ "",
52 | TRUE ~ frmt("(xx.x %)")
53 | )
54 | )
55 | )
56 | ),
57 |
58 | # Specify row group plan
59 | # Indent the rowlbl2
60 | row_grp_plan = row_grp_plan(
61 | row_grp_structure(group_val = ".default", element_block(post_space = " ")),
62 | label_loc = element_row_grp_loc(location = "indented")
63 | )
64 | ) |>
65 | print_to_gt(es_data) |>
66 | gt::tab_options(container.width = 1000)
67 | ```
68 |
69 |
70 | ### How do I output my table?
71 |
72 | In order to share your table with others, you will likely want to output it to a document. You can view your table in R using `tfrmt`'s `print_to_gt` and `print_mock_gt` functions, which create `gt` table objects. However, `tfrmt` does not offer functionality to save the table directly to a document. To save and share your table, we recommend leveraging the export capabilities provided by the {gt} package. {gt} offers a range of export options for various document types, including HTML, LaTeX, and Word. For more information on exporting, see [the gt package documentation](https://gt.rstudio.com/reference/gtsave.html).
73 |
74 |
75 | In summary, the `print_to_gt` and `print_mock_gt` functions create a `gt` table object that can be viewed in R, while exporting the table to a document is handled through `gt`'s export functions.
76 |
--------------------------------------------------------------------------------
/vignettes/building_blocks.Rmd:
--------------------------------------------------------------------------------
1 | ---
2 | title: "Building Blocks"
3 | output: rmarkdown::html_vignette
4 | vignette: >
5 | %\VignetteIndexEntry{Building Blocks}
6 | %\VignetteEngine{knitr::rmarkdown}
7 | %\VignetteEncoding{UTF-8}
8 | ---
9 |
10 | ```{r, include = FALSE}
11 | knitr::opts_chunk$set(
12 | collapse = TRUE,
13 | comment = "#>"
14 | )
15 | ```
16 |
17 | **1. Table format:** `tfrmt()`
18 |
19 | The table format ("tfrmt") object is the most fundamental building block in tfrmt. tfrmt is a way to predefine the non-data components of your tables and how the data will be handled once added. tfrmt allows you to specify cell formats and labelling such as column headers, footnotes, etc. In addition, tfrmts can be layered.
20 |
21 | **2. Plans:** `*_plan()`
22 |
23 | Much of the tfrmt is divided into "plans" which provide the blueprint for how the table will look. These plans are as follows:
24 |
25 | - Body plan (`body_plan`): define how cells will be formatted
26 | - Column plan (`col_plan`): define column and spanning headers, order columns, and drop unnecessary columns
27 | - Row group plan (`row_grp_plan`): define labelling for groups of rows and add styling to groups of rows
28 | - Column styling plan (`col_style_plan`): define how column values will be aligned and set their widths
29 |
30 |
31 |
32 |
33 |
34 |
35 |
36 | Additional features that use this system:
37 |
38 | - Footnotes can be specified via footnote plan (`footnote_plan`) to define what footnote contents and where they should be applied.
39 | - Pagination can be specified via a page plan (`page_plan`) to define where the table should be split for separating onto multiple pages.
40 |
41 | **3. Structures:** `*_structure()`
42 |
43 | The structure objects are for defining how the *location* of where a specific styling should be applied. Within a plan, one or more structures may be provided. Each structure specifies the layers within a plan. For example, in the body plan, each "frmt_structure" object defines how a set of values (e.g., all "p-values") should be formatted. Structures are primarily row-oriented, and can range from broad (e.g., apply to all relevant rows in the data) to specific (e.g., apply to all relevant rows within a specific grouping value). The one exception to this is `col_style_structure`, which specifies the colwise styling.
44 |
45 | In the figure below, each colour represents a different format structure (`frmt_structure`) to be passed in the table body plan (`body_plan`).
46 |
47 |
48 |
49 |
50 |
51 |
52 |
53 | The following structures are available:
54 |
55 | - Format structure (`frmt_structure`) inside of body plan (`body_plan`)
56 | - Column label spanning structure (`span_structure`) inside of column plan (`col_plan`)
57 | - Row group structure (`row_grp_structure`) inside of row group plan (`row_grp_plan`)
58 | - Column style structure (`col_style_structure`) inside of column style plan (`col_style_plan`)
59 | - Footnote structure (`footnote_structure`) inside of footnote plan (`footnote_plan`)
60 | - Page structure (`page_structure`) inside of a page plan (`page_plan`)
61 |
62 | **4. Elements** `element_*()` **and Formats:** `frmt_*()`
63 |
64 | The element and format objects are for defining the *aesthetics* of the table. Inspired by ggplot2, elements provide a mechanism for performing aesthetic modifications such as numeric rounding (`frmt()`) or the positioning of group labels (`element_row_grp_loc`). These are passed through structure objects.
65 |
--------------------------------------------------------------------------------
/R/row_group_plan.R:
--------------------------------------------------------------------------------
1 | #' Row Group Plan
2 | #'
3 | #' Define the look of the table groups on the output. This function allows you to
4 | #' add spaces after blocks and allows you to control how the groups are viewed
5 | #' whether they span the entire table or are nested as a column.
6 | #'
7 | #' @seealso [row_grp_structure()] for more details on how to specify row group
8 | #' structures, [element_block()] for more details on how to specify spacing
9 | #' between each group, [element_row_grp_loc()] for more details on how to
10 | #' specify whether row group titles span the entire table or collapse.
11 | #'
12 | #' \href{https://gsk-biostatistics.github.io/tfrmt/articles/row_grp_plan.html}{Link to related article}
13 | #'
14 | #' @param ... Row group structure objects separated by commas
15 | #' @param label_loc [element_row_grp_loc()] object specifying location
16 | #'
17 | #'
18 | #' @return row_grp_plan object
19 | #'
20 | #' @examples
21 | #'
22 | #'
23 | #' ## single grouping variable example
24 | #' sample_grp_plan <- row_grp_plan(
25 | #' row_grp_structure(group_val = c("A","C"), element_block(post_space = "---")),
26 | #' row_grp_structure(group_val = c("B"), element_block(post_space = " ")),
27 | #' label_loc = element_row_grp_loc(location = "column")
28 | #' )
29 | #'
30 | #' ## example with multiple grouping variables
31 | #' sample_grp_plan <- row_grp_plan(
32 | #' row_grp_structure(group_val = list(grp1 = "A", grp2 = "b"), element_block(post_space = " ")),
33 | #' label_loc = element_row_grp_loc(location = "spanning")
34 | #' )
35 | #'
36 | #' @export
37 | #'
38 | row_grp_plan <- function(..., label_loc = element_row_grp_loc(location = "indented")){
39 |
40 | row_grp_structure_list <- list(...)
41 |
42 | for(struct_idx in seq_along(row_grp_structure_list)){
43 | if(!is_row_grp_structure(row_grp_structure_list[[struct_idx]])){
44 | stop(paste0("Entry number ",struct_idx," is not an object of class `row_grp_structure`.
45 | If you want specify `spanning_label` please enter 'spanning_label ='"))
46 | }
47 | }
48 |
49 | structure(
50 | list(struct_list = row_grp_structure_list, label_loc = label_loc),
51 | class = c("row_grp_plan", "frmt_table")
52 | )
53 | }
54 |
55 | #' Row Group Structure Object
56 | #'
57 | #' Function needed to create a row_grp_structure object, which is a building block
58 | #' of [row_grp_plan()]
59 | #'
60 | #' @seealso [row_grp_plan()] for more details on how to group row group
61 | #' structures, [element_block()] for more details on how to specify spacing
62 | #' between each group.
63 | #'
64 | #' \href{https://gsk-biostatistics.github.io/tfrmt/articles/row_grp_plan.html}{Link to related article}
65 | #'
66 | #' @param group_val A string or a named list of strings which represent the
67 | #' value of group should be when the given frmt is implemented
68 | #' @param element_block element_block() object to define the block styling
69 | #'
70 | #' @returns row_grp_structure object
71 | #' @export
72 | #' @examples
73 | #'
74 | #' ## single grouping variable example
75 | #' row_grp_structure(group_val = c("A","C"), element_block(post_space = "---"))
76 | #'
77 | #' ## example with multiple grouping variables
78 | #' row_grp_structure(group_val = list(grp1 = "A", grp2 = "b"), element_block(post_space = " "))
79 | #'
80 | row_grp_structure <- function(group_val = ".default", element_block){
81 |
82 | if(!is_element_block(element_block)){
83 | stop("element_block, must be an element_block type")
84 | }
85 |
86 | if(is.list(group_val)){
87 | group_val_names <- names(group_val)
88 | if(is.null(group_val_names)){
89 | stop("when group_val is a list, must be a named list")
90 | }else if(any(group_val_names == "")){
91 | stop("when group_val is a list, each entry must be named")
92 | }
93 | }
94 |
95 | structure(
96 | list(
97 | group_val = group_val,
98 | block_to_apply = element_block),
99 | class = c("row_grp_structure","frmt_table")
100 | )
101 | }
102 |
--------------------------------------------------------------------------------
/man/tfrmt_sigdig.Rd:
--------------------------------------------------------------------------------
1 | % Generated by roxygen2: do not edit by hand
2 | % Please edit documentation in R/tfrmt_sigdig.R
3 | \name{tfrmt_sigdig}
4 | \alias{tfrmt_sigdig}
5 | \title{Create tfrmt object from significant digits spec}
6 | \usage{
7 | tfrmt_sigdig(
8 | sigdig_df,
9 | group = vars(),
10 | label = quo(),
11 | param_defaults = param_set(),
12 | missing = NULL,
13 | tfrmt_obj = NULL,
14 | ...
15 | )
16 | }
17 | \arguments{
18 | \item{sigdig_df}{data frame containing significant digits formatting spec.
19 | Has 1 record per group/label value, and columns for relevant group and/or
20 | label variables, as well as a numeric column \code{sigdig} containing the
21 | significant digits rounding to be applied in addition to the default. If
22 | unique group/label values are represented in multiple rows, this will
23 | result in only one of the \code{sigdig} values being carried through in
24 | implementation.}
25 |
26 | \item{group}{what are the grouping vars of the input dataset}
27 |
28 | \item{label}{what is the label column of the input dataset}
29 |
30 | \item{param_defaults}{Option to override or add to default parameters.}
31 |
32 | \item{missing}{missing option to be included in all \code{frmt}s}
33 |
34 | \item{tfrmt_obj}{an optional tfrmt object to layer}
35 |
36 | \item{...}{These dots are for future extensions and must be empty.}
37 | }
38 | \value{
39 | \code{tfrmt} object with a \code{body_plan} constructed based on the
40 | significant digits data spec and param-level significant digits defaults.
41 | }
42 | \description{
43 | This function creates a tfrmt based on significant digits specifications for
44 | group/label values. The input data spec provided to \code{sigdig_df} will contain
45 | group/label value specifications. \code{tfrmt_sigdig} assumes that these columns
46 | are group columns unless otherwise specified. The user may optionally choose
47 | to pass the names of the group and/or label columns as arguments to the
48 | function.
49 | }
50 | \details{
51 | \subsection{Formats covered}{
52 |
53 | Currently covers specifications for \code{frmt} and
54 | \code{frmt_combine}. \code{frmt_when} not supported and must be supplied in additional
55 | \code{tfrmt} that is layered on.
56 | }
57 |
58 | \subsection{Group/label variables}{
59 |
60 | If the group/label variables are not provided to the arguments, the body_plan
61 | will be constructed from the input data with the following behaviour:
62 | \itemize{
63 | \item If no group or label are supplied, it will be assumed that all columns in the input
64 | data are group columns.
65 | \item If a label variable is provided, but nothing is
66 | specified for group, any leftover columns (i.e. not matching \code{sigdig} or the
67 | supplied label variable name) in the input data will be assumed to be group
68 | columns.
69 | \item If any group variable is provided, any leftover columns (i.e. not
70 | matching \code{sigdig} or the supplied group/label variable) will be disregarded.
71 | }
72 | }
73 | }
74 | \section{Examples}{
75 |
76 |
77 | \if{html}{\out{
 45 | }}
46 | }
47 |
48 |
--------------------------------------------------------------------------------
/man/footnote_plan.Rd:
--------------------------------------------------------------------------------
1 | % Generated by roxygen2: do not edit by hand
2 | % Please edit documentation in R/footnote_plan.R
3 | \name{footnote_plan}
4 | \alias{footnote_plan}
5 | \title{Footnote Plan}
6 | \usage{
7 | footnote_plan(..., marks = c("numbers", "letters", "standard", "extended"))
8 | }
9 | \arguments{
10 | \item{...}{a series of \code{\link[=footnote_structure]{footnote_structure()}} separated by commas}
11 |
12 | \item{marks}{type of marks required for footnotes, properties inherited from
13 | tab_footnote in 'gt'. Available options are "numbers", "letters",
14 | "standard" and "extended" (standard for a traditional set of 4 symbols,
15 | extended for 6 symbols). The default option is set to "numbers".}
16 | }
17 | \value{
18 | footnote plan object
19 | }
20 | \description{
21 | Defining the location and content of footnotes with a series of footnote
22 | structures. Each structure is a footnote and can be applied in multiple locations.
23 | }
24 | \examples{
25 |
26 | # Adds a footnote indicated by letters rather than numbers to Group 1
27 | footnote_plan <- footnote_plan(
28 | footnote_structure(footnote_text = "Source Note", group_val = "Group 1"),
29 | marks="letters")
30 |
31 | # Adds a footnote to the 'Placebo' column
32 | footnote_plan <- footnote_plan(
33 | footnote_structure(footnote_text = "footnote", column_val = "Placebo"),
34 | marks="numbers")
35 |
36 | }
37 |
--------------------------------------------------------------------------------
/man/element_block.Rd:
--------------------------------------------------------------------------------
1 | % Generated by roxygen2: do not edit by hand
2 | % Please edit documentation in R/theme_element.R
3 | \name{element_block}
4 | \alias{element_block}
5 | \title{Element block}
6 | \usage{
7 | element_block(post_space = c(NULL, " ", "-"), fill = TRUE)
8 | }
9 | \arguments{
10 | \item{post_space}{Values to show in a new line created after the group block}
11 |
12 | \item{fill}{Whether to recycle the value of \code{post_space} to match width of the data. Defaults to \code{TRUE}}
13 | }
14 | \value{
15 | element block object
16 | }
17 | \description{
18 | Element block
19 | }
20 | \examples{
21 |
22 | tfrmt_spec <- tfrmt(
23 | group = grp1,
24 | label = label,
25 | param = param,
26 | value = value,
27 | column = column,
28 | row_grp_plan = row_grp_plan(
29 | row_grp_structure(group_val = ".default", element_block(post_space = " "))
30 | ),
31 | body_plan = body_plan(
32 | frmt_structure(group_val = ".default", label_val = ".default", frmt("xx"))
33 | )
34 | )
35 | }
36 | \seealso{
37 | \code{\link[=row_grp_plan]{row_grp_plan()}} for more details on how to group row group
38 | structures, \code{\link[=row_grp_structure]{row_grp_structure()}} for more details on how to specify row group
39 | structures, \code{\link[=element_row_grp_loc]{element_row_grp_loc()}} for more details on how to
40 | specify whether row group titles span the entire table or collapse.
41 | }
42 |
--------------------------------------------------------------------------------
/man/row_grp_structure.Rd:
--------------------------------------------------------------------------------
1 | % Generated by roxygen2: do not edit by hand
2 | % Please edit documentation in R/row_group_plan.R
3 | \name{row_grp_structure}
4 | \alias{row_grp_structure}
5 | \title{Row Group Structure Object}
6 | \usage{
7 | row_grp_structure(group_val = ".default", element_block)
8 | }
9 | \arguments{
10 | \item{group_val}{A string or a named list of strings which represent the
11 | value of group should be when the given frmt is implemented}
12 |
13 | \item{element_block}{element_block() object to define the block styling}
14 | }
15 | \value{
16 | row_grp_structure object
17 | }
18 | \description{
19 | Function needed to create a row_grp_structure object, which is a building block
20 | of \code{\link[=row_grp_plan]{row_grp_plan()}}
21 | }
22 | \examples{
23 |
24 | ## single grouping variable example
25 | row_grp_structure(group_val = c("A","C"), element_block(post_space = "---"))
26 |
27 | ## example with multiple grouping variables
28 | row_grp_structure(group_val = list(grp1 = "A", grp2 = "b"), element_block(post_space = " "))
29 |
30 | }
31 | \seealso{
32 | \code{\link[=row_grp_plan]{row_grp_plan()}} for more details on how to group row group
33 | structures, \code{\link[=element_block]{element_block()}} for more details on how to specify spacing
34 | between each group.
35 |
36 | \href{https://gsk-biostatistics.github.io/tfrmt/articles/row_grp_plan.html}{Link to related article}
37 | }
38 |
--------------------------------------------------------------------------------
/man/param_set.Rd:
--------------------------------------------------------------------------------
1 | % Generated by roxygen2: do not edit by hand
2 | % Please edit documentation in R/tfrmt_sigdig.R
3 | \name{param_set}
4 | \alias{param_set}
5 | \title{Set custom parameter-level significant digits rounding}
6 | \usage{
7 | param_set(...)
8 | }
9 | \arguments{
10 | \item{...}{Series of name-value pairs, optionally formatted using
11 | \code{glue::glue()} syntax (note \code{glue} syntax is required for combined
12 | parameters).The name represents the parameter and the value represents the number of places to round the parameter to.
13 | For combined parameters (e.g., \code{"{min}, {max}"}), value should
14 | be a vector of the same length (e.g., c(1,1)).}
15 | }
16 | \value{
17 | list of default parameter-level significant digits rounding
18 | }
19 | \description{
20 | Set custom parameter-level significant digits rounding
21 | }
22 | \details{
23 | Type \code{param_set()} in console to view package defaults. Use of the
24 | function will add to the defaults and/or override included defaults of the
25 | same name. For values that are integers, use \code{NA} so no decimal places will
26 | be added.
27 | }
28 | \examples{
29 | # View included defaults
30 | param_set()
31 |
32 | # Update the defaults
33 | param_set("{mean} ({sd})" = c(2,3), "pct" = 1)
34 |
35 | # Separate mean and SD to different lines
36 | param_set("mean" = 2, "sd" = 3)
37 |
38 | # Add formatting using the glue syntax
39 | param_set("{pct} \%" = 1)
40 |
41 | }
42 |
--------------------------------------------------------------------------------
/man/big_n_structure.Rd:
--------------------------------------------------------------------------------
1 | % Generated by roxygen2: do not edit by hand
2 | % Please edit documentation in R/big_n.R
3 | \name{big_n_structure}
4 | \alias{big_n_structure}
5 | \title{Big N Structure}
6 | \usage{
7 | big_n_structure(param_val, n_frmt = frmt("\\nN = xx"), by_page = FALSE)
8 | }
9 | \arguments{
10 | \item{param_val}{row value(s) of the parameter column for which the values
11 | are big N's}
12 |
13 | \item{n_frmt}{\code{\link[=frmt]{frmt()}} to control the formatting of the big N's}
14 |
15 | \item{by_page}{Option to include different big N's for each group-defined set
16 | of pages (defined by any variables set to \code{".default"} in the \code{page_plan}).
17 | Default is \code{FALSE}, meaning only the overall Ns are applied}
18 | }
19 | \value{
20 | big_n_structure object
21 | }
22 | \description{
23 | Big N structure allows you to specify which values should become the subject
24 | totals ("big N" values) and how they should be formatted in the table's
25 | column labels. Values are specified by providing the value(s) of the \code{param}
26 | column for which the values are big N's. This will remove these from the
27 | body of the table and place them into columns matching the values in the
28 | column column(s). The default formatting is \code{N = xx}, on its own line, but
29 | that can be changed by providing a different \code{frmt()} to \code{n_frmt}.
30 | }
31 | \seealso{
32 | \href{https://gsk-biostatistics.github.io/tfrmt/articles/big_ns.html}{Link to related article}
33 | }
34 |
--------------------------------------------------------------------------------
/.github/workflows/pkgdown.yaml:
--------------------------------------------------------------------------------
1 | # Workflow derived from https://github.com/r-lib/actions/tree/v2/examples
2 | # Need help debugging build failures? Start at https://github.com/r-lib/actions#where-to-find-help
3 | on:
4 | push:
5 | branches: [main, master]
6 | pull_request:
7 | branches: [main, master]
8 | release:
9 | types: [published]
10 | workflow_dispatch:
11 |
12 | name: pkgdown
13 |
14 | jobs:
15 | pkgdown:
16 | runs-on: ubuntu-latest
17 | # Only restrict concurrency for non-PR jobs
18 | concurrency:
19 | group: pkgdown-${{ github.event_name != 'pull_request' || github.run_id }}
20 | env:
21 | GITHUB_PAT: ${{ secrets.GITHUB_TOKEN }}
22 | permissions:
23 | contents: write
24 | steps:
25 | - uses: actions/checkout@v4
26 |
27 | - uses: r-lib/actions/setup-pandoc@v2
28 |
29 | - uses: r-lib/actions/setup-r@v2
30 | with:
31 | use-public-rspm: true
32 |
33 | - uses: r-lib/actions/setup-r-dependencies@v2
34 | with:
35 | extra-packages: any::pkgdown, local::.
36 | needs: website
37 |
38 | - name: Build site
39 | run: pkgdown::build_site_github_pages(new_process = FALSE, install = FALSE)
40 | shell: Rscript {0}
41 |
42 | - name: Deploy to GitHub pages 🚀
43 | if: github.event_name != 'pull_request'
44 | uses: JamesIves/github-pages-deploy-action@v4.5.0
45 | with:
46 | clean: false
47 | branch: gh-pages
48 | folder: docs
49 |
--------------------------------------------------------------------------------
/man/layer_tfrmt.Rd:
--------------------------------------------------------------------------------
1 | % Generated by roxygen2: do not edit by hand
2 | % Please edit documentation in R/tfrmt_layer.R
3 | \name{layer_tfrmt}
4 | \alias{layer_tfrmt}
5 | \title{Layer tfrmt objects together}
6 | \usage{
7 | layer_tfrmt(x, y, ..., join_body_plans = TRUE)
8 | }
9 | \arguments{
10 | \item{x, y}{tfrmt objects that need to be combined}
11 |
12 | \item{...}{arguments passed to layer_tfrmt_arg functions for combining different tfrmt elements}
13 |
14 | \item{join_body_plans}{should the \code{body_plans} be combined, or just keep styling in y. See details: join_body_plans for more details.}
15 | }
16 | \value{
17 | tfrmt object
18 | }
19 | \description{
20 | Provide utility for layering tfrmt objects together. If both tfrmt's have
21 | values, it will preferentially choose the second tfrmt by default. This is an
22 | alternative to piping together tfrmt's
23 | }
24 | \details{
25 | \subsection{join_body_plan}{
26 |
27 | When combining two body_plans, the body plans will stack together, first the
28 | body plan from x tfrmt then y tfrmt. This means that frmt_structures in y
29 | will take priority over those in x.
30 |
31 | Combining two tfrmt with large body_plans can lead to slow table evaluation.
32 | Consider setting \code{join_body_plan} to \code{FALSE}. Only the y \code{body_plan} will be
33 | preserved.
34 | }
35 | }
36 | \examples{
37 |
38 | tfrmt_1 <- tfrmt(title = "title1")
39 |
40 | tfrmt_2 <- tfrmt(title = "title2",subtitle = "subtitle2")
41 |
42 | layered_table_format <- layer_tfrmt(tfrmt_1, tfrmt_2)
43 |
44 | }
45 |
--------------------------------------------------------------------------------
/man/prep_big_n.Rd:
--------------------------------------------------------------------------------
1 | % Generated by roxygen2: do not edit by hand
2 | % Please edit documentation in R/prep_card.R
3 | \name{prep_big_n}
4 | \alias{prep_big_n}
5 | \title{Prepare \code{bigN} stat variables}
6 | \usage{
7 | prep_big_n(df, vars)
8 | }
9 | \arguments{
10 | \item{df}{(data.frame)}
11 |
12 | \item{vars}{(character) a vector of variables to prepare \code{bigN} for.}
13 | }
14 | \value{
15 | a data.frame with the same columns as the input. The \code{stat_name}
16 | column is modified.
17 | }
18 | \description{
19 | \ifelse{html}{\href{https://lifecycle.r-lib.org/articles/stages.html#experimental}{\figure{lifecycle-experimental.svg}{options: alt='[Experimental]'}}}{\strong{[Experimental]}}
20 |
21 | \code{prep_big_n()}:
22 | \itemize{
23 | \item recodes the \code{"n"} \code{stat_name} into \code{bigN} for the desired variables,
24 | and
25 | \item drops all other \code{stat_names} for the same variables.
26 | }
27 |
28 | If your \code{tfrmt} contains a \code{\link[=big_n_structure]{big_n_structure()}} you pass the tfrmt \code{column} to
29 | \code{prep_big_n()} via \code{vars}.
30 | }
31 | \examples{
32 | df <- data.frame(
33 | stat_name = c("n", "max", "min", rep(c("n", "N", "p"), times = 2)),
34 | context = rep(c("continuous", "hierarchical", "categorical"), each = 3),
35 | stat_variable = rep(c("a", "b", "c"), each = 3)
36 | ) |>
37 | dplyr::bind_rows(
38 | data.frame(
39 | stat_name = "n",
40 | context = "total_n",
41 | stat_variable = "d"
42 | )
43 | )
44 |
45 | prep_big_n(
46 | df,
47 | vars = c("b", "c")
48 | )
49 | }
50 |
--------------------------------------------------------------------------------
/man/apply_frmt.Rd:
--------------------------------------------------------------------------------
1 | % Generated by roxygen2: do not edit by hand
2 | % Please edit documentation in R/apply_frmt_methods.R
3 | \name{apply_frmt}
4 | \alias{apply_frmt}
5 | \alias{apply_frmt.frmt}
6 | \alias{apply_frmt.frmt_combine}
7 | \alias{apply_frmt.frmt_when}
8 | \title{Apply formatting}
9 | \usage{
10 | apply_frmt(frmt_def, .data, value, mock = FALSE, ...)
11 |
12 | \method{apply_frmt}{frmt}(frmt_def, .data, value, mock = FALSE, ...)
13 |
14 | \method{apply_frmt}{frmt_combine}(
15 | frmt_def,
16 | .data,
17 | value,
18 | mock = FALSE,
19 | param,
20 | column,
21 | label,
22 | group,
23 | ...
24 | )
25 |
26 | \method{apply_frmt}{frmt_when}(frmt_def, .data, value, mock = FALSE, ...)
27 | }
28 | \arguments{
29 | \item{frmt_def}{formatting to be applied}
30 |
31 | \item{.data}{data, but only what is getting changed}
32 |
33 | \item{value}{value symbol should only be one}
34 |
35 | \item{mock}{Logical value is this is for a mock or not. By default \code{FALSE}}
36 |
37 | \item{...}{additional arguments for methods}
38 |
39 | \item{param}{param column as a quosure}
40 |
41 | \item{column}{column columns as a list of quosures}
42 |
43 | \item{label}{label column as a quosure}
44 |
45 | \item{group}{group column as a list of quosures}
46 | }
47 | \value{
48 | formatted dataset
49 | }
50 | \description{
51 | Apply formatting
52 | }
53 | \examples{
54 |
55 | library(tibble)
56 | library(dplyr)
57 | # Set up data
58 | df <- tibble(x = c(20.12,34.54,12.34))
59 |
60 | apply_frmt(
61 | frmt_def = frmt("XX.X"),
62 | .data=df,
63 | value=quo(x))
64 |
65 | }
66 |
--------------------------------------------------------------------------------
/man/tfrmt_n_pct.Rd:
--------------------------------------------------------------------------------
1 | % Generated by roxygen2: do not edit by hand
2 | % Please edit documentation in R/tfrmt_n_pct.R
3 | \name{tfrmt_n_pct}
4 | \alias{tfrmt_n_pct}
5 | \title{N Percent Template}
6 | \usage{
7 | tfrmt_n_pct(
8 | n = "n",
9 | pct = "pct",
10 | pct_frmt_when = frmt_when("==100" ~ frmt(""), ">99" ~ frmt("(>99\%)"), "==0" ~ "", "<1"
11 | ~ frmt("(<1\%)"), "TRUE" ~ frmt("(xx.x\%)")),
12 | tfrmt_obj = NULL
13 | )
14 | }
15 | \arguments{
16 | \item{n}{name of count (n) value in the parameter column}
17 |
18 | \item{pct}{name of percent (pct) value in the parameter column}
19 |
20 | \item{pct_frmt_when}{formatting to be used on the the percent values}
21 |
22 | \item{tfrmt_obj}{an optional tfrmt object to layer}
23 | }
24 | \value{
25 | tfrmt object
26 | }
27 | \description{
28 | This function creates an tfrmt for an n \% table, so count based table. The
29 | parameter values for n and percent can be provided (by default it will assume
30 | \code{n} and \code{pct}). Additionally the \code{frmt_when} for formatting the percent can
31 | be specified. By default 100\% and 0\% will not appear and everything between
32 | 99\% and 100\% and 0\% and 1\% will be rounded using greater than (>) and less
33 | than (<) signs respectively.
34 | }
35 | \section{Examples}{
36 |
37 |
38 | \if{html}{\out{
45 | }}
46 | }
47 |
48 |
--------------------------------------------------------------------------------
/man/footnote_plan.Rd:
--------------------------------------------------------------------------------
1 | % Generated by roxygen2: do not edit by hand
2 | % Please edit documentation in R/footnote_plan.R
3 | \name{footnote_plan}
4 | \alias{footnote_plan}
5 | \title{Footnote Plan}
6 | \usage{
7 | footnote_plan(..., marks = c("numbers", "letters", "standard", "extended"))
8 | }
9 | \arguments{
10 | \item{...}{a series of \code{\link[=footnote_structure]{footnote_structure()}} separated by commas}
11 |
12 | \item{marks}{type of marks required for footnotes, properties inherited from
13 | tab_footnote in 'gt'. Available options are "numbers", "letters",
14 | "standard" and "extended" (standard for a traditional set of 4 symbols,
15 | extended for 6 symbols). The default option is set to "numbers".}
16 | }
17 | \value{
18 | footnote plan object
19 | }
20 | \description{
21 | Defining the location and content of footnotes with a series of footnote
22 | structures. Each structure is a footnote and can be applied in multiple locations.
23 | }
24 | \examples{
25 |
26 | # Adds a footnote indicated by letters rather than numbers to Group 1
27 | footnote_plan <- footnote_plan(
28 | footnote_structure(footnote_text = "Source Note", group_val = "Group 1"),
29 | marks="letters")
30 |
31 | # Adds a footnote to the 'Placebo' column
32 | footnote_plan <- footnote_plan(
33 | footnote_structure(footnote_text = "footnote", column_val = "Placebo"),
34 | marks="numbers")
35 |
36 | }
37 |
--------------------------------------------------------------------------------
/man/element_block.Rd:
--------------------------------------------------------------------------------
1 | % Generated by roxygen2: do not edit by hand
2 | % Please edit documentation in R/theme_element.R
3 | \name{element_block}
4 | \alias{element_block}
5 | \title{Element block}
6 | \usage{
7 | element_block(post_space = c(NULL, " ", "-"), fill = TRUE)
8 | }
9 | \arguments{
10 | \item{post_space}{Values to show in a new line created after the group block}
11 |
12 | \item{fill}{Whether to recycle the value of \code{post_space} to match width of the data. Defaults to \code{TRUE}}
13 | }
14 | \value{
15 | element block object
16 | }
17 | \description{
18 | Element block
19 | }
20 | \examples{
21 |
22 | tfrmt_spec <- tfrmt(
23 | group = grp1,
24 | label = label,
25 | param = param,
26 | value = value,
27 | column = column,
28 | row_grp_plan = row_grp_plan(
29 | row_grp_structure(group_val = ".default", element_block(post_space = " "))
30 | ),
31 | body_plan = body_plan(
32 | frmt_structure(group_val = ".default", label_val = ".default", frmt("xx"))
33 | )
34 | )
35 | }
36 | \seealso{
37 | \code{\link[=row_grp_plan]{row_grp_plan()}} for more details on how to group row group
38 | structures, \code{\link[=row_grp_structure]{row_grp_structure()}} for more details on how to specify row group
39 | structures, \code{\link[=element_row_grp_loc]{element_row_grp_loc()}} for more details on how to
40 | specify whether row group titles span the entire table or collapse.
41 | }
42 |
--------------------------------------------------------------------------------
/man/row_grp_structure.Rd:
--------------------------------------------------------------------------------
1 | % Generated by roxygen2: do not edit by hand
2 | % Please edit documentation in R/row_group_plan.R
3 | \name{row_grp_structure}
4 | \alias{row_grp_structure}
5 | \title{Row Group Structure Object}
6 | \usage{
7 | row_grp_structure(group_val = ".default", element_block)
8 | }
9 | \arguments{
10 | \item{group_val}{A string or a named list of strings which represent the
11 | value of group should be when the given frmt is implemented}
12 |
13 | \item{element_block}{element_block() object to define the block styling}
14 | }
15 | \value{
16 | row_grp_structure object
17 | }
18 | \description{
19 | Function needed to create a row_grp_structure object, which is a building block
20 | of \code{\link[=row_grp_plan]{row_grp_plan()}}
21 | }
22 | \examples{
23 |
24 | ## single grouping variable example
25 | row_grp_structure(group_val = c("A","C"), element_block(post_space = "---"))
26 |
27 | ## example with multiple grouping variables
28 | row_grp_structure(group_val = list(grp1 = "A", grp2 = "b"), element_block(post_space = " "))
29 |
30 | }
31 | \seealso{
32 | \code{\link[=row_grp_plan]{row_grp_plan()}} for more details on how to group row group
33 | structures, \code{\link[=element_block]{element_block()}} for more details on how to specify spacing
34 | between each group.
35 |
36 | \href{https://gsk-biostatistics.github.io/tfrmt/articles/row_grp_plan.html}{Link to related article}
37 | }
38 |
--------------------------------------------------------------------------------
/man/param_set.Rd:
--------------------------------------------------------------------------------
1 | % Generated by roxygen2: do not edit by hand
2 | % Please edit documentation in R/tfrmt_sigdig.R
3 | \name{param_set}
4 | \alias{param_set}
5 | \title{Set custom parameter-level significant digits rounding}
6 | \usage{
7 | param_set(...)
8 | }
9 | \arguments{
10 | \item{...}{Series of name-value pairs, optionally formatted using
11 | \code{glue::glue()} syntax (note \code{glue} syntax is required for combined
12 | parameters).The name represents the parameter and the value represents the number of places to round the parameter to.
13 | For combined parameters (e.g., \code{"{min}, {max}"}), value should
14 | be a vector of the same length (e.g., c(1,1)).}
15 | }
16 | \value{
17 | list of default parameter-level significant digits rounding
18 | }
19 | \description{
20 | Set custom parameter-level significant digits rounding
21 | }
22 | \details{
23 | Type \code{param_set()} in console to view package defaults. Use of the
24 | function will add to the defaults and/or override included defaults of the
25 | same name. For values that are integers, use \code{NA} so no decimal places will
26 | be added.
27 | }
28 | \examples{
29 | # View included defaults
30 | param_set()
31 |
32 | # Update the defaults
33 | param_set("{mean} ({sd})" = c(2,3), "pct" = 1)
34 |
35 | # Separate mean and SD to different lines
36 | param_set("mean" = 2, "sd" = 3)
37 |
38 | # Add formatting using the glue syntax
39 | param_set("{pct} \%" = 1)
40 |
41 | }
42 |
--------------------------------------------------------------------------------
/man/big_n_structure.Rd:
--------------------------------------------------------------------------------
1 | % Generated by roxygen2: do not edit by hand
2 | % Please edit documentation in R/big_n.R
3 | \name{big_n_structure}
4 | \alias{big_n_structure}
5 | \title{Big N Structure}
6 | \usage{
7 | big_n_structure(param_val, n_frmt = frmt("\\nN = xx"), by_page = FALSE)
8 | }
9 | \arguments{
10 | \item{param_val}{row value(s) of the parameter column for which the values
11 | are big N's}
12 |
13 | \item{n_frmt}{\code{\link[=frmt]{frmt()}} to control the formatting of the big N's}
14 |
15 | \item{by_page}{Option to include different big N's for each group-defined set
16 | of pages (defined by any variables set to \code{".default"} in the \code{page_plan}).
17 | Default is \code{FALSE}, meaning only the overall Ns are applied}
18 | }
19 | \value{
20 | big_n_structure object
21 | }
22 | \description{
23 | Big N structure allows you to specify which values should become the subject
24 | totals ("big N" values) and how they should be formatted in the table's
25 | column labels. Values are specified by providing the value(s) of the \code{param}
26 | column for which the values are big N's. This will remove these from the
27 | body of the table and place them into columns matching the values in the
28 | column column(s). The default formatting is \code{N = xx}, on its own line, but
29 | that can be changed by providing a different \code{frmt()} to \code{n_frmt}.
30 | }
31 | \seealso{
32 | \href{https://gsk-biostatistics.github.io/tfrmt/articles/big_ns.html}{Link to related article}
33 | }
34 |
--------------------------------------------------------------------------------
/.github/workflows/pkgdown.yaml:
--------------------------------------------------------------------------------
1 | # Workflow derived from https://github.com/r-lib/actions/tree/v2/examples
2 | # Need help debugging build failures? Start at https://github.com/r-lib/actions#where-to-find-help
3 | on:
4 | push:
5 | branches: [main, master]
6 | pull_request:
7 | branches: [main, master]
8 | release:
9 | types: [published]
10 | workflow_dispatch:
11 |
12 | name: pkgdown
13 |
14 | jobs:
15 | pkgdown:
16 | runs-on: ubuntu-latest
17 | # Only restrict concurrency for non-PR jobs
18 | concurrency:
19 | group: pkgdown-${{ github.event_name != 'pull_request' || github.run_id }}
20 | env:
21 | GITHUB_PAT: ${{ secrets.GITHUB_TOKEN }}
22 | permissions:
23 | contents: write
24 | steps:
25 | - uses: actions/checkout@v4
26 |
27 | - uses: r-lib/actions/setup-pandoc@v2
28 |
29 | - uses: r-lib/actions/setup-r@v2
30 | with:
31 | use-public-rspm: true
32 |
33 | - uses: r-lib/actions/setup-r-dependencies@v2
34 | with:
35 | extra-packages: any::pkgdown, local::.
36 | needs: website
37 |
38 | - name: Build site
39 | run: pkgdown::build_site_github_pages(new_process = FALSE, install = FALSE)
40 | shell: Rscript {0}
41 |
42 | - name: Deploy to GitHub pages 🚀
43 | if: github.event_name != 'pull_request'
44 | uses: JamesIves/github-pages-deploy-action@v4.5.0
45 | with:
46 | clean: false
47 | branch: gh-pages
48 | folder: docs
49 |
--------------------------------------------------------------------------------
/man/layer_tfrmt.Rd:
--------------------------------------------------------------------------------
1 | % Generated by roxygen2: do not edit by hand
2 | % Please edit documentation in R/tfrmt_layer.R
3 | \name{layer_tfrmt}
4 | \alias{layer_tfrmt}
5 | \title{Layer tfrmt objects together}
6 | \usage{
7 | layer_tfrmt(x, y, ..., join_body_plans = TRUE)
8 | }
9 | \arguments{
10 | \item{x, y}{tfrmt objects that need to be combined}
11 |
12 | \item{...}{arguments passed to layer_tfrmt_arg functions for combining different tfrmt elements}
13 |
14 | \item{join_body_plans}{should the \code{body_plans} be combined, or just keep styling in y. See details: join_body_plans for more details.}
15 | }
16 | \value{
17 | tfrmt object
18 | }
19 | \description{
20 | Provide utility for layering tfrmt objects together. If both tfrmt's have
21 | values, it will preferentially choose the second tfrmt by default. This is an
22 | alternative to piping together tfrmt's
23 | }
24 | \details{
25 | \subsection{join_body_plan}{
26 |
27 | When combining two body_plans, the body plans will stack together, first the
28 | body plan from x tfrmt then y tfrmt. This means that frmt_structures in y
29 | will take priority over those in x.
30 |
31 | Combining two tfrmt with large body_plans can lead to slow table evaluation.
32 | Consider setting \code{join_body_plan} to \code{FALSE}. Only the y \code{body_plan} will be
33 | preserved.
34 | }
35 | }
36 | \examples{
37 |
38 | tfrmt_1 <- tfrmt(title = "title1")
39 |
40 | tfrmt_2 <- tfrmt(title = "title2",subtitle = "subtitle2")
41 |
42 | layered_table_format <- layer_tfrmt(tfrmt_1, tfrmt_2)
43 |
44 | }
45 |
--------------------------------------------------------------------------------
/man/prep_big_n.Rd:
--------------------------------------------------------------------------------
1 | % Generated by roxygen2: do not edit by hand
2 | % Please edit documentation in R/prep_card.R
3 | \name{prep_big_n}
4 | \alias{prep_big_n}
5 | \title{Prepare \code{bigN} stat variables}
6 | \usage{
7 | prep_big_n(df, vars)
8 | }
9 | \arguments{
10 | \item{df}{(data.frame)}
11 |
12 | \item{vars}{(character) a vector of variables to prepare \code{bigN} for.}
13 | }
14 | \value{
15 | a data.frame with the same columns as the input. The \code{stat_name}
16 | column is modified.
17 | }
18 | \description{
19 | \ifelse{html}{\href{https://lifecycle.r-lib.org/articles/stages.html#experimental}{\figure{lifecycle-experimental.svg}{options: alt='[Experimental]'}}}{\strong{[Experimental]}}
20 |
21 | \code{prep_big_n()}:
22 | \itemize{
23 | \item recodes the \code{"n"} \code{stat_name} into \code{bigN} for the desired variables,
24 | and
25 | \item drops all other \code{stat_names} for the same variables.
26 | }
27 |
28 | If your \code{tfrmt} contains a \code{\link[=big_n_structure]{big_n_structure()}} you pass the tfrmt \code{column} to
29 | \code{prep_big_n()} via \code{vars}.
30 | }
31 | \examples{
32 | df <- data.frame(
33 | stat_name = c("n", "max", "min", rep(c("n", "N", "p"), times = 2)),
34 | context = rep(c("continuous", "hierarchical", "categorical"), each = 3),
35 | stat_variable = rep(c("a", "b", "c"), each = 3)
36 | ) |>
37 | dplyr::bind_rows(
38 | data.frame(
39 | stat_name = "n",
40 | context = "total_n",
41 | stat_variable = "d"
42 | )
43 | )
44 |
45 | prep_big_n(
46 | df,
47 | vars = c("b", "c")
48 | )
49 | }
50 |
--------------------------------------------------------------------------------
/man/apply_frmt.Rd:
--------------------------------------------------------------------------------
1 | % Generated by roxygen2: do not edit by hand
2 | % Please edit documentation in R/apply_frmt_methods.R
3 | \name{apply_frmt}
4 | \alias{apply_frmt}
5 | \alias{apply_frmt.frmt}
6 | \alias{apply_frmt.frmt_combine}
7 | \alias{apply_frmt.frmt_when}
8 | \title{Apply formatting}
9 | \usage{
10 | apply_frmt(frmt_def, .data, value, mock = FALSE, ...)
11 |
12 | \method{apply_frmt}{frmt}(frmt_def, .data, value, mock = FALSE, ...)
13 |
14 | \method{apply_frmt}{frmt_combine}(
15 | frmt_def,
16 | .data,
17 | value,
18 | mock = FALSE,
19 | param,
20 | column,
21 | label,
22 | group,
23 | ...
24 | )
25 |
26 | \method{apply_frmt}{frmt_when}(frmt_def, .data, value, mock = FALSE, ...)
27 | }
28 | \arguments{
29 | \item{frmt_def}{formatting to be applied}
30 |
31 | \item{.data}{data, but only what is getting changed}
32 |
33 | \item{value}{value symbol should only be one}
34 |
35 | \item{mock}{Logical value is this is for a mock or not. By default \code{FALSE}}
36 |
37 | \item{...}{additional arguments for methods}
38 |
39 | \item{param}{param column as a quosure}
40 |
41 | \item{column}{column columns as a list of quosures}
42 |
43 | \item{label}{label column as a quosure}
44 |
45 | \item{group}{group column as a list of quosures}
46 | }
47 | \value{
48 | formatted dataset
49 | }
50 | \description{
51 | Apply formatting
52 | }
53 | \examples{
54 |
55 | library(tibble)
56 | library(dplyr)
57 | # Set up data
58 | df <- tibble(x = c(20.12,34.54,12.34))
59 |
60 | apply_frmt(
61 | frmt_def = frmt("XX.X"),
62 | .data=df,
63 | value=quo(x))
64 |
65 | }
66 |
--------------------------------------------------------------------------------
/man/tfrmt_n_pct.Rd:
--------------------------------------------------------------------------------
1 | % Generated by roxygen2: do not edit by hand
2 | % Please edit documentation in R/tfrmt_n_pct.R
3 | \name{tfrmt_n_pct}
4 | \alias{tfrmt_n_pct}
5 | \title{N Percent Template}
6 | \usage{
7 | tfrmt_n_pct(
8 | n = "n",
9 | pct = "pct",
10 | pct_frmt_when = frmt_when("==100" ~ frmt(""), ">99" ~ frmt("(>99\%)"), "==0" ~ "", "<1"
11 | ~ frmt("(<1\%)"), "TRUE" ~ frmt("(xx.x\%)")),
12 | tfrmt_obj = NULL
13 | )
14 | }
15 | \arguments{
16 | \item{n}{name of count (n) value in the parameter column}
17 |
18 | \item{pct}{name of percent (pct) value in the parameter column}
19 |
20 | \item{pct_frmt_when}{formatting to be used on the the percent values}
21 |
22 | \item{tfrmt_obj}{an optional tfrmt object to layer}
23 | }
24 | \value{
25 | tfrmt object
26 | }
27 | \description{
28 | This function creates an tfrmt for an n \% table, so count based table. The
29 | parameter values for n and percent can be provided (by default it will assume
30 | \code{n} and \code{pct}). Additionally the \code{frmt_when} for formatting the percent can
31 | be specified. By default 100\% and 0\% will not appear and everything between
32 | 99\% and 100\% and 0\% and 1\% will be rounded using greater than (>) and less
33 | than (<) signs respectively.
34 | }
35 | \section{Examples}{
36 |
37 |
38 | \if{html}{\out{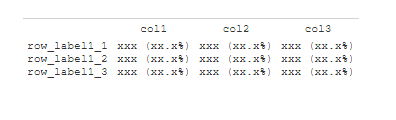 43 | }}
44 | }
45 |
46 |
--------------------------------------------------------------------------------
/man/footnote_structure.Rd:
--------------------------------------------------------------------------------
1 | % Generated by roxygen2: do not edit by hand
2 | % Please edit documentation in R/footnote_plan.R
3 | \name{footnote_structure}
4 | \alias{footnote_structure}
5 | \title{Footnote Structure}
6 | \usage{
7 | footnote_structure(
8 | footnote_text,
9 | column_val = NULL,
10 | group_val = NULL,
11 | label_val = NULL
12 | )
13 | }
14 | \arguments{
15 | \item{footnote_text}{string with text for footnote}
16 |
17 | \item{column_val}{string or a named list of strings which represent the column to apply the footnote to}
18 |
19 | \item{group_val}{string or a named list of strings which represent the value of group to apply the footnote to}
20 |
21 | \item{label_val}{string which represents the value of label to apply the footnote to}
22 | }
23 | \value{
24 | footnote structure object
25 | }
26 | \description{
27 | Footnote Structure
28 | }
29 | \examples{
30 |
31 | # Adds a source note aka a footnote without a symbol in the table
32 | footnote_structure <- footnote_structure(footnote_text = "Source Note")
33 |
34 | # Adds a footnote to the 'Placebo' column
35 | footnote_structure <- footnote_structure(footnote_text = "Text",
36 | column_val = "Placebo")
37 |
38 | # Adds a footnote to either 'Placebo' or 'Treatment groups' depending on which
39 | # which is last to appear in the column vector
40 | footnote_structure <- footnote_structure(footnote_text = "Text",
41 | column_val = list(col1 = "Placebo", col2= "Treatment groups"))
42 |
43 | # Adds a footnote to the 'Adverse Event' label
44 | footnote_structure <- footnote_structure("Text", label_val = "Adverse Event")
45 | }
46 |
--------------------------------------------------------------------------------
/man/display_row_frmts.Rd:
--------------------------------------------------------------------------------
1 | % Generated by roxygen2: do not edit by hand
2 | % Please edit documentation in R/display_insights.R
3 | \name{display_row_frmts}
4 | \alias{display_row_frmts}
5 | \title{Display formatting applied to each row}
6 | \usage{
7 | display_row_frmts(tfrmt, .data, convert_to_txt = TRUE)
8 | }
9 | \arguments{
10 | \item{tfrmt}{tfrmt object to apply to the data}
11 |
12 | \item{.data}{Data to apply the tfrmt to}
13 |
14 | \item{convert_to_txt}{Logical value converting formatting to text, by default
15 | \code{TRUE}}
16 | }
17 | \value{
18 | formatted tibble
19 | }
20 | \description{
21 | Used when debugging formatting, it is an easy way to allow you to see which
22 | formats are applied to each row in your dataset.
23 | }
24 | \examples{
25 | library(dplyr)
26 | library(tidyr)
27 |
28 | tfrmt_spec <- tfrmt(
29 | label = label,
30 | column = column,
31 | param = param,
32 | value=value,
33 | body_plan = body_plan(
34 | frmt_structure(group_val = ".default", label_val = ".default",
35 | frmt_combine(
36 | "{count} {percent}",
37 | count = frmt("xxx"),
38 | percent = frmt_when("==100"~ frmt(""),
39 | "==0"~ "",
40 | "TRUE" ~ frmt("(xx.x\%)"))))
41 | ))
42 |
43 | # Create data
44 | df <- tidyr::crossing(label = c("label 1", "label 2"),
45 | column = c("placebo", "trt1"),
46 | param = c("count", "percent")) |>
47 | dplyr::mutate(value=c(24,19,2400/48,1900/38,5,1,500/48,100/38))
48 |
49 | display_row_frmts(tfrmt_spec,df)
50 | }
51 |
--------------------------------------------------------------------------------
/.github/workflows/test-coverage.yaml:
--------------------------------------------------------------------------------
1 | # Workflow derived from https://github.com/r-lib/actions/tree/v2/examples
2 | # Need help debugging build failures? Start at https://github.com/r-lib/actions#where-to-find-help
3 |
4 | # This will cancel running jobs once a new run is triggered
5 | concurrency:
6 | group: ${{ github.workflow }}-${{ github.head_ref }}
7 | cancel-in-progress: true
8 |
9 | on:
10 | push:
11 | branches: [main, master]
12 | pull_request:
13 | branches: [main, master]
14 |
15 | name: test-coverage
16 |
17 | jobs:
18 | test-coverage:
19 | runs-on: ubuntu-latest
20 | env:
21 | GITHUB_PAT: ${{ secrets.GITHUB_TOKEN }}
22 |
23 | steps:
24 | - uses: actions/checkout@v4
25 |
26 | - uses: r-lib/actions/setup-r@v2
27 | with:
28 | use-public-rspm: true
29 |
30 | - uses: r-lib/actions/setup-r-dependencies@v2
31 | with:
32 | extra-packages: any::covr
33 | needs: coverage
34 |
35 | - name: Test coverage
36 | run: |
37 | covr::codecov(
38 | quiet = FALSE,
39 | clean = FALSE,
40 | install_path = file.path(normalizePath(Sys.getenv("RUNNER_TEMP"), winslash = "/"), "package")
41 | )
42 | shell: Rscript {0}
43 |
44 | - name: Show testthat output
45 | if: always()
46 | run: |
47 | ## --------------------------------------------------------------------
48 | find ${{ runner.temp }}/package -name 'testthat.Rout*' -exec cat '{}' \; || true
49 | shell: bash
50 |
51 | - name: Upload test results
52 | if: failure()
53 | uses: actions/upload-artifact@v4
54 | with:
55 | name: coverage-test-failures
56 | path: ${{ runner.temp }}/package
57 |
--------------------------------------------------------------------------------
/man/print_to_gt.Rd:
--------------------------------------------------------------------------------
1 | % Generated by roxygen2: do not edit by hand
2 | % Please edit documentation in R/print_to_gt.R
3 | \name{print_to_gt}
4 | \alias{print_to_gt}
5 | \title{Print to gt}
6 | \usage{
7 | print_to_gt(tfrmt, .data, .unicode_ws = TRUE)
8 | }
9 | \arguments{
10 | \item{tfrmt}{tfrmt object that will dictate the structure of the table}
11 |
12 | \item{.data}{Data to style in order to make the table}
13 |
14 | \item{.unicode_ws}{Whether to convert white space to unicode in preparation for output}
15 | }
16 | \value{
17 | a stylized gt object
18 | }
19 | \description{
20 | Print to gt
21 | }
22 | \section{Examples}{
23 |
24 |
25 | \if{html}{\out{
43 | }}
44 | }
45 |
46 |
--------------------------------------------------------------------------------
/man/footnote_structure.Rd:
--------------------------------------------------------------------------------
1 | % Generated by roxygen2: do not edit by hand
2 | % Please edit documentation in R/footnote_plan.R
3 | \name{footnote_structure}
4 | \alias{footnote_structure}
5 | \title{Footnote Structure}
6 | \usage{
7 | footnote_structure(
8 | footnote_text,
9 | column_val = NULL,
10 | group_val = NULL,
11 | label_val = NULL
12 | )
13 | }
14 | \arguments{
15 | \item{footnote_text}{string with text for footnote}
16 |
17 | \item{column_val}{string or a named list of strings which represent the column to apply the footnote to}
18 |
19 | \item{group_val}{string or a named list of strings which represent the value of group to apply the footnote to}
20 |
21 | \item{label_val}{string which represents the value of label to apply the footnote to}
22 | }
23 | \value{
24 | footnote structure object
25 | }
26 | \description{
27 | Footnote Structure
28 | }
29 | \examples{
30 |
31 | # Adds a source note aka a footnote without a symbol in the table
32 | footnote_structure <- footnote_structure(footnote_text = "Source Note")
33 |
34 | # Adds a footnote to the 'Placebo' column
35 | footnote_structure <- footnote_structure(footnote_text = "Text",
36 | column_val = "Placebo")
37 |
38 | # Adds a footnote to either 'Placebo' or 'Treatment groups' depending on which
39 | # which is last to appear in the column vector
40 | footnote_structure <- footnote_structure(footnote_text = "Text",
41 | column_val = list(col1 = "Placebo", col2= "Treatment groups"))
42 |
43 | # Adds a footnote to the 'Adverse Event' label
44 | footnote_structure <- footnote_structure("Text", label_val = "Adverse Event")
45 | }
46 |
--------------------------------------------------------------------------------
/man/display_row_frmts.Rd:
--------------------------------------------------------------------------------
1 | % Generated by roxygen2: do not edit by hand
2 | % Please edit documentation in R/display_insights.R
3 | \name{display_row_frmts}
4 | \alias{display_row_frmts}
5 | \title{Display formatting applied to each row}
6 | \usage{
7 | display_row_frmts(tfrmt, .data, convert_to_txt = TRUE)
8 | }
9 | \arguments{
10 | \item{tfrmt}{tfrmt object to apply to the data}
11 |
12 | \item{.data}{Data to apply the tfrmt to}
13 |
14 | \item{convert_to_txt}{Logical value converting formatting to text, by default
15 | \code{TRUE}}
16 | }
17 | \value{
18 | formatted tibble
19 | }
20 | \description{
21 | Used when debugging formatting, it is an easy way to allow you to see which
22 | formats are applied to each row in your dataset.
23 | }
24 | \examples{
25 | library(dplyr)
26 | library(tidyr)
27 |
28 | tfrmt_spec <- tfrmt(
29 | label = label,
30 | column = column,
31 | param = param,
32 | value=value,
33 | body_plan = body_plan(
34 | frmt_structure(group_val = ".default", label_val = ".default",
35 | frmt_combine(
36 | "{count} {percent}",
37 | count = frmt("xxx"),
38 | percent = frmt_when("==100"~ frmt(""),
39 | "==0"~ "",
40 | "TRUE" ~ frmt("(xx.x\%)"))))
41 | ))
42 |
43 | # Create data
44 | df <- tidyr::crossing(label = c("label 1", "label 2"),
45 | column = c("placebo", "trt1"),
46 | param = c("count", "percent")) |>
47 | dplyr::mutate(value=c(24,19,2400/48,1900/38,5,1,500/48,100/38))
48 |
49 | display_row_frmts(tfrmt_spec,df)
50 | }
51 |
--------------------------------------------------------------------------------
/.github/workflows/test-coverage.yaml:
--------------------------------------------------------------------------------
1 | # Workflow derived from https://github.com/r-lib/actions/tree/v2/examples
2 | # Need help debugging build failures? Start at https://github.com/r-lib/actions#where-to-find-help
3 |
4 | # This will cancel running jobs once a new run is triggered
5 | concurrency:
6 | group: ${{ github.workflow }}-${{ github.head_ref }}
7 | cancel-in-progress: true
8 |
9 | on:
10 | push:
11 | branches: [main, master]
12 | pull_request:
13 | branches: [main, master]
14 |
15 | name: test-coverage
16 |
17 | jobs:
18 | test-coverage:
19 | runs-on: ubuntu-latest
20 | env:
21 | GITHUB_PAT: ${{ secrets.GITHUB_TOKEN }}
22 |
23 | steps:
24 | - uses: actions/checkout@v4
25 |
26 | - uses: r-lib/actions/setup-r@v2
27 | with:
28 | use-public-rspm: true
29 |
30 | - uses: r-lib/actions/setup-r-dependencies@v2
31 | with:
32 | extra-packages: any::covr
33 | needs: coverage
34 |
35 | - name: Test coverage
36 | run: |
37 | covr::codecov(
38 | quiet = FALSE,
39 | clean = FALSE,
40 | install_path = file.path(normalizePath(Sys.getenv("RUNNER_TEMP"), winslash = "/"), "package")
41 | )
42 | shell: Rscript {0}
43 |
44 | - name: Show testthat output
45 | if: always()
46 | run: |
47 | ## --------------------------------------------------------------------
48 | find ${{ runner.temp }}/package -name 'testthat.Rout*' -exec cat '{}' \; || true
49 | shell: bash
50 |
51 | - name: Upload test results
52 | if: failure()
53 | uses: actions/upload-artifact@v4
54 | with:
55 | name: coverage-test-failures
56 | path: ${{ runner.temp }}/package
57 |
--------------------------------------------------------------------------------
/man/print_to_gt.Rd:
--------------------------------------------------------------------------------
1 | % Generated by roxygen2: do not edit by hand
2 | % Please edit documentation in R/print_to_gt.R
3 | \name{print_to_gt}
4 | \alias{print_to_gt}
5 | \title{Print to gt}
6 | \usage{
7 | print_to_gt(tfrmt, .data, .unicode_ws = TRUE)
8 | }
9 | \arguments{
10 | \item{tfrmt}{tfrmt object that will dictate the structure of the table}
11 |
12 | \item{.data}{Data to style in order to make the table}
13 |
14 | \item{.unicode_ws}{Whether to convert white space to unicode in preparation for output}
15 | }
16 | \value{
17 | a stylized gt object
18 | }
19 | \description{
20 | Print to gt
21 | }
22 | \section{Examples}{
23 |
24 |
25 | \if{html}{\out{ 54 | }}
55 | }
56 |
57 |
--------------------------------------------------------------------------------
/man/row_grp_plan.Rd:
--------------------------------------------------------------------------------
1 | % Generated by roxygen2: do not edit by hand
2 | % Please edit documentation in R/row_group_plan.R
3 | \name{row_grp_plan}
4 | \alias{row_grp_plan}
5 | \title{Row Group Plan}
6 | \usage{
7 | row_grp_plan(..., label_loc = element_row_grp_loc(location = "indented"))
8 | }
9 | \arguments{
10 | \item{...}{Row group structure objects separated by commas}
11 |
12 | \item{label_loc}{\code{\link[=element_row_grp_loc]{element_row_grp_loc()}} object specifying location}
13 | }
14 | \value{
15 | row_grp_plan object
16 | }
17 | \description{
18 | Define the look of the table groups on the output. This function allows you to
19 | add spaces after blocks and allows you to control how the groups are viewed
20 | whether they span the entire table or are nested as a column.
21 | }
22 | \examples{
23 |
24 |
25 | ## single grouping variable example
26 | sample_grp_plan <- row_grp_plan(
27 | row_grp_structure(group_val = c("A","C"), element_block(post_space = "---")),
28 | row_grp_structure(group_val = c("B"), element_block(post_space = " ")),
29 | label_loc = element_row_grp_loc(location = "column")
30 | )
31 |
32 | ## example with multiple grouping variables
33 | sample_grp_plan <- row_grp_plan(
34 | row_grp_structure(group_val = list(grp1 = "A", grp2 = "b"), element_block(post_space = " ")),
35 | label_loc = element_row_grp_loc(location = "spanning")
36 | )
37 |
38 | }
39 | \seealso{
40 | \code{\link[=row_grp_structure]{row_grp_structure()}} for more details on how to specify row group
41 | structures, \code{\link[=element_block]{element_block()}} for more details on how to specify spacing
42 | between each group, \code{\link[=element_row_grp_loc]{element_row_grp_loc()}} for more details on how to
43 | specify whether row group titles span the entire table or collapse.
44 |
45 | \href{https://gsk-biostatistics.github.io/tfrmt/articles/row_grp_plan.html}{Link to related article}
46 | }
47 |
--------------------------------------------------------------------------------
/.github/workflows/R-CMD-check.yaml:
--------------------------------------------------------------------------------
1 | # Workflow derived from https://github.com/r-lib/actions/tree/v2/examples
2 | # Need help debugging build failures? Start at https://github.com/r-lib/actions#where-to-find-help
3 | #
4 | # NOTE: This workflow is overkill for most R packages and
5 | # check-standard.yaml is likely a better choice.
6 | # usethis::use_github_action("check-standard") will install it.
7 |
8 | # This will cancel running jobs once a new run is triggered
9 | concurrency:
10 | group: ${{ github.workflow }}-${{ github.head_ref }}
11 | cancel-in-progress: true
12 |
13 | on:
14 | push:
15 | branches: [main, master]
16 | pull_request:
17 | branches: [main, master]
18 |
19 | name: R-CMD-check
20 |
21 | jobs:
22 | R-CMD-check:
23 | runs-on: ${{ matrix.config.os }}
24 |
25 | name: ${{ matrix.config.os }} (${{ matrix.config.r }})
26 |
27 | strategy:
28 | fail-fast: false
29 | matrix:
30 | config:
31 | - {os: macos-latest, r: 'release'}
32 | - {os: windows-latest, r: 'release'}
33 | - {os: ubuntu-latest, r: 'devel', http-user-agent: 'release'}
34 | - {os: ubuntu-latest, r: 'release'}
35 | - {os: ubuntu-latest, r: 'oldrel-1'}
36 | - {os: ubuntu-latest, r: 'oldrel-2'}
37 | - {os: ubuntu-latest, r: 'oldrel-3'}
38 |
39 | env:
40 | GITHUB_PAT: ${{ secrets.GITHUB_TOKEN }}
41 | R_KEEP_PKG_SOURCE: yes
42 |
43 | steps:
44 | - uses: actions/checkout@v4
45 |
46 | - uses: r-lib/actions/setup-pandoc@v2
47 |
48 | - uses: r-lib/actions/setup-r@v2
49 | with:
50 | r-version: ${{ matrix.config.r }}
51 | http-user-agent: ${{ matrix.config.http-user-agent }}
52 | use-public-rspm: true
53 |
54 | - uses: r-lib/actions/setup-r-dependencies@v2
55 | with:
56 | extra-packages: any::rcmdcheck
57 | needs: check
58 |
59 | - uses: r-lib/actions/check-r-package@v2
60 | with:
61 | upload-snapshots: true
62 |
--------------------------------------------------------------------------------
/pkgdown/index.Rmd:
--------------------------------------------------------------------------------
1 | ---
2 | output: github_document
3 | ---
4 |
5 | ```{r child='../README.Rmd'}
6 | ```
7 |
8 | ## Other Resources
9 |
10 | ```{r, echo=FALSE}
11 | dplyr::tribble(
12 | ~venue, ~presenters, ~title,
13 | "2022 R/Pharma", "Christina Fillmore", "[Why do I spend all my life formatting tables?](https://www.youtube.com/watch?v=00lGhuANUJw)",
14 | "2023 R/Pharma", "Becca Krouse", "[Everyone's Invited: A Case Study on Bridging the Usability Gap](https://www.youtube.com/watch?v=Zg1LPJSO0kQ)",
15 | "2022 R/Pharma Workshop", "Christina Fillmore, Ellis Hughes and Thomas Neitmann", "[Clinical Reporting in R (Day 2)](https://www.youtube.com/watch?v=rYflZhFDSZQ)",
16 | "2023 R/Pharma Workshop", "Thomas Neitmann, Pawel Rucki and Ellis Hughes", "[Leveraging and contributing to the the pharmaverse for clinical trial reporting in R](https://github.com/posit-conf-2023/r-pharma)",
17 | "Posit conf 2024", "Daniel D. Sjoberg, Becca Krouse, Ellis Hughes, Andrew Bates and Casey Aguilar-Gervase", "[Flavors of the pharmaverse](https://posit-conf-2024.github.io/pharmaverse/)",
18 | "Posit conf 2024", "Becca Krouse", "[Stitch by Stitch: The Art of Engaging New Users](https://www.youtube.com/watch?v=R3VMij_1aSE)",
19 | "R in Pharma 2024", "Daniel D. Sjoberg, Becca Krouse and Jack Talboys", "[Unlocking Analysis Results Datasets (ARDs)](https://www.danieldsjoberg.com/ARD-RinPharma-workshop-2024/)",
20 | "PHUSE US Connect 2025", "Daniel D. Sjoberg and Becca Krouse", "[Analysis Results Datasets Using Open-Source Tools from the {pharmaverse}](https://www.danieldsjoberg.com/ARD-PHUSE-workshop-2025/)",
21 | "Posit conf 2025", "Daniel D. Sjoberg, Becca Krouse, Ben Straub and Rammprasad Ganapathy", "[End-to-End Submissions in R with the Pharmaverse](https://posit-conf-2025.github.io/pharmaverse/)"
22 | ) |>
23 | gt::gt() |>
24 | # fmt_markdown is all that is needed to render the links defined in the title column
25 | gt::fmt_markdown(columns = c(venue, title)) |>
26 | gt::sub_missing(missing_text = "") |>
27 | gt::tab_options(column_labels.hidden = TRUE)
28 | ```
29 |
--------------------------------------------------------------------------------
/_pkgdown.yml:
--------------------------------------------------------------------------------
1 | url: https://gsk-biostatistics.github.io/tfrmt/
2 | template:
3 | bootstrap: 5
4 | opengraph:
5 | image:
6 | src: man/figures/tfrmt.png
7 | alt: "tfrmt Hex Sticker"
8 | development:
9 | mode: auto
10 | version_label: default
11 | articles:
12 | - title: Table Components
13 | navbar: Table Components
14 | contents:
15 | - building_blocks
16 | - body_plan
17 | - row_grp_plan
18 | - col_plan
19 | - col_style_plan
20 | - big_ns
21 | - footnote_plan
22 | - page_plan
23 | - title: Building Tables
24 | navbar: Building Tables
25 | contents:
26 | - examples
27 | - layer
28 | - building_mocks
29 | - templates
30 | - cards_to_tfrmt
31 | - title:
32 | navbar: More
33 | contents:
34 | - json
35 | - print_to_ggplot
36 | - faq
37 | - mock_examples
38 | - unusual_tables
39 | reference:
40 | - title: Build tfrmt
41 | contents:
42 | - tfrmt
43 | - body_plan
44 | - frmt_structure
45 | - frmt
46 | - frmt_combine
47 | - frmt_when
48 | - col_plan
49 | - span_structure
50 | - col_style_plan
51 | - col_style_structure
52 | - row_grp_plan
53 | - row_grp_structure
54 | - element_block
55 | - element_row_grp_loc
56 | - footnote_plan
57 | - footnote_structure
58 | - big_n_structure
59 | - page_plan
60 | - page_structure
61 | - title: Layer
62 | contents:
63 | - layer_tfrmt
64 | - update_group
65 | - title: Print/Export
66 | contents:
67 | - print_mock_gt
68 | - print_to_gt
69 | - print_to_ggplot
70 | - tfrmt_to_json
71 | - json_to_tfrmt
72 | - as_json
73 | - title: Included Templates
74 | contents:
75 | - tfrmt_n_pct
76 | - tfrmt_sigdig
77 | - param_set
78 | - title: Example Data
79 | contents:
80 | - starts_with("data_")
81 | - title: Helpers
82 | contents:
83 | - display_row_frmts
84 | - display_val_frmts
85 | - apply_frmt
86 | - cleaned_data_to_gt
87 | - starts_with("is_")
88 | - make_mock_data
89 | - title: "ARD Helpers for {cards} to {tfrmt}"
90 | contents:
91 | - shuffle_card
92 | - prep_big_n
93 | - prep_combine_vars
94 | - prep_hierarchical_fill
95 | - prep_label
96 |
--------------------------------------------------------------------------------
/man/frmt_structure.Rd:
--------------------------------------------------------------------------------
1 | % Generated by roxygen2: do not edit by hand
2 | % Please edit documentation in R/frmt_plans.R
3 | \name{frmt_structure}
4 | \alias{frmt_structure}
5 | \title{Format Structure Object}
6 | \usage{
7 | frmt_structure(group_val = ".default", label_val = ".default", ...)
8 | }
9 | \arguments{
10 | \item{group_val}{A string or a named list of strings which represent the
11 | value of group should be when the given frmt is implemented}
12 |
13 | \item{label_val}{A string which represent the value of label should be when
14 | the given frmt is implemented}
15 |
16 | \item{...}{either a \code{\link[=frmt]{frmt()}}, \code{\link[=frmt_combine]{frmt_combine()}}, or a \code{\link[=frmt_when]{frmt_when()}} object.
17 | This can be named to also specify the parameter value}
18 | }
19 | \value{
20 | frmt_structure object
21 | }
22 | \description{
23 | Function needed to create a frmt_structure object, which is a building block
24 | of \code{\link[=body_plan]{body_plan()}}. This specifies the rows the format will be applied to.
25 | }
26 | \section{Images}{
27 |
28 | Here are some example outputs:
29 | \if{html}{\out{
30 |
54 | }}
55 | }
56 |
57 |
--------------------------------------------------------------------------------
/man/row_grp_plan.Rd:
--------------------------------------------------------------------------------
1 | % Generated by roxygen2: do not edit by hand
2 | % Please edit documentation in R/row_group_plan.R
3 | \name{row_grp_plan}
4 | \alias{row_grp_plan}
5 | \title{Row Group Plan}
6 | \usage{
7 | row_grp_plan(..., label_loc = element_row_grp_loc(location = "indented"))
8 | }
9 | \arguments{
10 | \item{...}{Row group structure objects separated by commas}
11 |
12 | \item{label_loc}{\code{\link[=element_row_grp_loc]{element_row_grp_loc()}} object specifying location}
13 | }
14 | \value{
15 | row_grp_plan object
16 | }
17 | \description{
18 | Define the look of the table groups on the output. This function allows you to
19 | add spaces after blocks and allows you to control how the groups are viewed
20 | whether they span the entire table or are nested as a column.
21 | }
22 | \examples{
23 |
24 |
25 | ## single grouping variable example
26 | sample_grp_plan <- row_grp_plan(
27 | row_grp_structure(group_val = c("A","C"), element_block(post_space = "---")),
28 | row_grp_structure(group_val = c("B"), element_block(post_space = " ")),
29 | label_loc = element_row_grp_loc(location = "column")
30 | )
31 |
32 | ## example with multiple grouping variables
33 | sample_grp_plan <- row_grp_plan(
34 | row_grp_structure(group_val = list(grp1 = "A", grp2 = "b"), element_block(post_space = " ")),
35 | label_loc = element_row_grp_loc(location = "spanning")
36 | )
37 |
38 | }
39 | \seealso{
40 | \code{\link[=row_grp_structure]{row_grp_structure()}} for more details on how to specify row group
41 | structures, \code{\link[=element_block]{element_block()}} for more details on how to specify spacing
42 | between each group, \code{\link[=element_row_grp_loc]{element_row_grp_loc()}} for more details on how to
43 | specify whether row group titles span the entire table or collapse.
44 |
45 | \href{https://gsk-biostatistics.github.io/tfrmt/articles/row_grp_plan.html}{Link to related article}
46 | }
47 |
--------------------------------------------------------------------------------
/.github/workflows/R-CMD-check.yaml:
--------------------------------------------------------------------------------
1 | # Workflow derived from https://github.com/r-lib/actions/tree/v2/examples
2 | # Need help debugging build failures? Start at https://github.com/r-lib/actions#where-to-find-help
3 | #
4 | # NOTE: This workflow is overkill for most R packages and
5 | # check-standard.yaml is likely a better choice.
6 | # usethis::use_github_action("check-standard") will install it.
7 |
8 | # This will cancel running jobs once a new run is triggered
9 | concurrency:
10 | group: ${{ github.workflow }}-${{ github.head_ref }}
11 | cancel-in-progress: true
12 |
13 | on:
14 | push:
15 | branches: [main, master]
16 | pull_request:
17 | branches: [main, master]
18 |
19 | name: R-CMD-check
20 |
21 | jobs:
22 | R-CMD-check:
23 | runs-on: ${{ matrix.config.os }}
24 |
25 | name: ${{ matrix.config.os }} (${{ matrix.config.r }})
26 |
27 | strategy:
28 | fail-fast: false
29 | matrix:
30 | config:
31 | - {os: macos-latest, r: 'release'}
32 | - {os: windows-latest, r: 'release'}
33 | - {os: ubuntu-latest, r: 'devel', http-user-agent: 'release'}
34 | - {os: ubuntu-latest, r: 'release'}
35 | - {os: ubuntu-latest, r: 'oldrel-1'}
36 | - {os: ubuntu-latest, r: 'oldrel-2'}
37 | - {os: ubuntu-latest, r: 'oldrel-3'}
38 |
39 | env:
40 | GITHUB_PAT: ${{ secrets.GITHUB_TOKEN }}
41 | R_KEEP_PKG_SOURCE: yes
42 |
43 | steps:
44 | - uses: actions/checkout@v4
45 |
46 | - uses: r-lib/actions/setup-pandoc@v2
47 |
48 | - uses: r-lib/actions/setup-r@v2
49 | with:
50 | r-version: ${{ matrix.config.r }}
51 | http-user-agent: ${{ matrix.config.http-user-agent }}
52 | use-public-rspm: true
53 |
54 | - uses: r-lib/actions/setup-r-dependencies@v2
55 | with:
56 | extra-packages: any::rcmdcheck
57 | needs: check
58 |
59 | - uses: r-lib/actions/check-r-package@v2
60 | with:
61 | upload-snapshots: true
62 |
--------------------------------------------------------------------------------
/pkgdown/index.Rmd:
--------------------------------------------------------------------------------
1 | ---
2 | output: github_document
3 | ---
4 |
5 | ```{r child='../README.Rmd'}
6 | ```
7 |
8 | ## Other Resources
9 |
10 | ```{r, echo=FALSE}
11 | dplyr::tribble(
12 | ~venue, ~presenters, ~title,
13 | "2022 R/Pharma", "Christina Fillmore", "[Why do I spend all my life formatting tables?](https://www.youtube.com/watch?v=00lGhuANUJw)",
14 | "2023 R/Pharma", "Becca Krouse", "[Everyone's Invited: A Case Study on Bridging the Usability Gap](https://www.youtube.com/watch?v=Zg1LPJSO0kQ)",
15 | "2022 R/Pharma Workshop", "Christina Fillmore, Ellis Hughes and Thomas Neitmann", "[Clinical Reporting in R (Day 2)](https://www.youtube.com/watch?v=rYflZhFDSZQ)",
16 | "2023 R/Pharma Workshop", "Thomas Neitmann, Pawel Rucki and Ellis Hughes", "[Leveraging and contributing to the the pharmaverse for clinical trial reporting in R](https://github.com/posit-conf-2023/r-pharma)",
17 | "Posit conf 2024", "Daniel D. Sjoberg, Becca Krouse, Ellis Hughes, Andrew Bates and Casey Aguilar-Gervase", "[Flavors of the pharmaverse](https://posit-conf-2024.github.io/pharmaverse/)",
18 | "Posit conf 2024", "Becca Krouse", "[Stitch by Stitch: The Art of Engaging New Users](https://www.youtube.com/watch?v=R3VMij_1aSE)",
19 | "R in Pharma 2024", "Daniel D. Sjoberg, Becca Krouse and Jack Talboys", "[Unlocking Analysis Results Datasets (ARDs)](https://www.danieldsjoberg.com/ARD-RinPharma-workshop-2024/)",
20 | "PHUSE US Connect 2025", "Daniel D. Sjoberg and Becca Krouse", "[Analysis Results Datasets Using Open-Source Tools from the {pharmaverse}](https://www.danieldsjoberg.com/ARD-PHUSE-workshop-2025/)",
21 | "Posit conf 2025", "Daniel D. Sjoberg, Becca Krouse, Ben Straub and Rammprasad Ganapathy", "[End-to-End Submissions in R with the Pharmaverse](https://posit-conf-2025.github.io/pharmaverse/)"
22 | ) |>
23 | gt::gt() |>
24 | # fmt_markdown is all that is needed to render the links defined in the title column
25 | gt::fmt_markdown(columns = c(venue, title)) |>
26 | gt::sub_missing(missing_text = "") |>
27 | gt::tab_options(column_labels.hidden = TRUE)
28 | ```
29 |
--------------------------------------------------------------------------------
/_pkgdown.yml:
--------------------------------------------------------------------------------
1 | url: https://gsk-biostatistics.github.io/tfrmt/
2 | template:
3 | bootstrap: 5
4 | opengraph:
5 | image:
6 | src: man/figures/tfrmt.png
7 | alt: "tfrmt Hex Sticker"
8 | development:
9 | mode: auto
10 | version_label: default
11 | articles:
12 | - title: Table Components
13 | navbar: Table Components
14 | contents:
15 | - building_blocks
16 | - body_plan
17 | - row_grp_plan
18 | - col_plan
19 | - col_style_plan
20 | - big_ns
21 | - footnote_plan
22 | - page_plan
23 | - title: Building Tables
24 | navbar: Building Tables
25 | contents:
26 | - examples
27 | - layer
28 | - building_mocks
29 | - templates
30 | - cards_to_tfrmt
31 | - title:
32 | navbar: More
33 | contents:
34 | - json
35 | - print_to_ggplot
36 | - faq
37 | - mock_examples
38 | - unusual_tables
39 | reference:
40 | - title: Build tfrmt
41 | contents:
42 | - tfrmt
43 | - body_plan
44 | - frmt_structure
45 | - frmt
46 | - frmt_combine
47 | - frmt_when
48 | - col_plan
49 | - span_structure
50 | - col_style_plan
51 | - col_style_structure
52 | - row_grp_plan
53 | - row_grp_structure
54 | - element_block
55 | - element_row_grp_loc
56 | - footnote_plan
57 | - footnote_structure
58 | - big_n_structure
59 | - page_plan
60 | - page_structure
61 | - title: Layer
62 | contents:
63 | - layer_tfrmt
64 | - update_group
65 | - title: Print/Export
66 | contents:
67 | - print_mock_gt
68 | - print_to_gt
69 | - print_to_ggplot
70 | - tfrmt_to_json
71 | - json_to_tfrmt
72 | - as_json
73 | - title: Included Templates
74 | contents:
75 | - tfrmt_n_pct
76 | - tfrmt_sigdig
77 | - param_set
78 | - title: Example Data
79 | contents:
80 | - starts_with("data_")
81 | - title: Helpers
82 | contents:
83 | - display_row_frmts
84 | - display_val_frmts
85 | - apply_frmt
86 | - cleaned_data_to_gt
87 | - starts_with("is_")
88 | - make_mock_data
89 | - title: "ARD Helpers for {cards} to {tfrmt}"
90 | contents:
91 | - shuffle_card
92 | - prep_big_n
93 | - prep_combine_vars
94 | - prep_hierarchical_fill
95 | - prep_label
96 |
--------------------------------------------------------------------------------
/man/frmt_structure.Rd:
--------------------------------------------------------------------------------
1 | % Generated by roxygen2: do not edit by hand
2 | % Please edit documentation in R/frmt_plans.R
3 | \name{frmt_structure}
4 | \alias{frmt_structure}
5 | \title{Format Structure Object}
6 | \usage{
7 | frmt_structure(group_val = ".default", label_val = ".default", ...)
8 | }
9 | \arguments{
10 | \item{group_val}{A string or a named list of strings which represent the
11 | value of group should be when the given frmt is implemented}
12 |
13 | \item{label_val}{A string which represent the value of label should be when
14 | the given frmt is implemented}
15 |
16 | \item{...}{either a \code{\link[=frmt]{frmt()}}, \code{\link[=frmt_combine]{frmt_combine()}}, or a \code{\link[=frmt_when]{frmt_when()}} object.
17 | This can be named to also specify the parameter value}
18 | }
19 | \value{
20 | frmt_structure object
21 | }
22 | \description{
23 | Function needed to create a frmt_structure object, which is a building block
24 | of \code{\link[=body_plan]{body_plan()}}. This specifies the rows the format will be applied to.
25 | }
26 | \section{Images}{
27 |
28 | Here are some example outputs:
29 | \if{html}{\out{
30 |  31 | }}
32 | }
33 |
34 | \examples{
35 |
36 | sample_structure <- frmt_structure(
37 | group_val = c("group1"),
38 | label_val = ".default",
39 | frmt("XXX")
40 | )
41 | ## multiple group columns
42 | sample_structure <- frmt_structure(
43 | group_val = list(grp_col1 = "group1", grp_col2 = "subgroup3"),
44 | label_val = ".default",
45 | frmt("XXX")
46 | )
47 |
48 | }
49 | \seealso{
50 | \code{\link[=body_plan]{body_plan()}} combines the frmt_structures to be applied to the
51 | table body, and \code{\link[=frmt]{frmt()}}, \code{\link[=frmt_combine]{frmt_combine()}}, and \code{\link[=frmt_when]{frmt_when()}} define the
52 | format semantics.
53 |
54 | \href{https://gsk-biostatistics.github.io/tfrmt/articles/body_plan.html}{Link to related article}
55 | }
56 |
--------------------------------------------------------------------------------
/man/prep_combine_vars.Rd:
--------------------------------------------------------------------------------
1 | % Generated by roxygen2: do not edit by hand
2 | % Please edit documentation in R/prep_card.R
3 | \name{prep_combine_vars}
4 | \alias{prep_combine_vars}
5 | \title{Combine variables}
6 | \usage{
7 | prep_combine_vars(df, vars, remove = TRUE)
8 | }
9 | \arguments{
10 | \item{df}{(data.frame)}
11 |
12 | \item{vars}{(character) a vector of variables to unite. If a single variable
13 | is supplied, the input is returned unchanged.}
14 |
15 | \item{remove}{If \code{TRUE}, remove input columns from output data frame.}
16 | }
17 | \value{
18 | a data.frame with an additional column, called \code{variable_level} or
19 | the input unchanged.
20 | }
21 | \description{
22 | \ifelse{html}{\href{https://lifecycle.r-lib.org/articles/stages.html#experimental}{\figure{lifecycle-experimental.svg}{options: alt='[Experimental]'}}}{\strong{[Experimental]}}
23 |
24 | A wrapper around \code{tidyr::unite()} which pastes several columns into one.
25 | In addition it checks the output is identical to \code{dplyr::coalesce()}. If not
26 | identical, the input data.frame is returned unchanged. Useful for uniting
27 | sparsely populated columns, for example when processing an ard that was
28 | created with \code{\link[cards:ard_stack]{cards::ard_stack()}} then shuffled with \verb{[shuffle_card()]}.
29 |
30 | If the data is the result of a hierarchical ard stack (with
31 | \code{\link[cards:ard_stack_hierarchical]{cards::ard_stack_hierarchical()}} or
32 | \code{\link[cards:ard_stack_hierarchical]{cards::ard_stack_hierarchical_count()}}), the input is returned unchanged.
33 | This is assessed from the information in the \code{context} column which needs to
34 | be present. If the input data does not have a \code{context} column, the input
35 | will be returned unmodified.
36 | }
37 | \examples{
38 | df <- data.frame(
39 | a = 1:6,
40 | context = rep("categorical", 6),
41 | b = c("a", rep(NA, 5)),
42 | c = c(NA, "b", rep(NA, 4)),
43 | d = c(NA, NA, "c", rep(NA, 3)),
44 | e = c(NA, NA, NA, "d", rep(NA, 2)),
45 | f = c(NA, NA, NA, NA, "e", NA),
46 | g = c(rep(NA, 5), "f")
47 | )
48 |
49 | prep_combine_vars(
50 | df,
51 | vars = c("b", "c", "d", "e", "f", "g")
52 | )
53 | }
54 |
--------------------------------------------------------------------------------
/DESCRIPTION:
--------------------------------------------------------------------------------
1 | Package: tfrmt
2 | Title: Applies Display Metadata to Analysis Results Datasets
3 | Version: 0.2.1.9000
4 | Authors@R: c(
5 | person("Becca", "Krouse", , "becca.z.krouse@gsk.com", role = c("aut", "cre")),
6 | person("Christina", "Fillmore", , "christina.e.fillmore@gsk.com", role = "aut",
7 | comment = c(ORCID = "0000-0003-0595-2302")),
8 | person("Ellis", "Hughes", , "ellis.h.hughes@gsk.com", role = "aut",
9 | comment = c(ORCID = "0000-0003-0637-4436")),
10 | person("Karima", "Ahmad", , "karima.j.ahmad@gsk.com", role = "aut",
11 | comment = c(ORCID = "0000-0002-8784-1712")),
12 | person("Shannon", "Haughton", , "shannon.l.haughton@gsk.com", role = "aut"),
13 | person("Dragoș", "Moldovan-Grünfeld", , "dragos.v.moldovan-grunfeld@gsk.com", role = "aut"),
14 | person("Alanah", "Jonas", "alanah.x.jonas@gsk.com", role = "aut"),
15 | person("GlaxoSmithKline Research & Development Limited", role = c("cph", "fnd")),
16 | person("Atorus Research LLC", role = c("cph", "fnd"))
17 | )
18 | Description: Creates a framework to store and apply display metadata to
19 | Analysis Results Datasets (ARDs). The use of 'tfrmt' allows users to
20 | define table format and styling without the data, and later apply the
21 | format to the data.
22 | License: Apache License (>= 2)
23 | URL: https://GSK-Biostatistics.github.io/tfrmt/,
24 | https://github.com/GSK-Biostatistics/tfrmt
25 | BugReports: https://github.com/GSK-Biostatistics/tfrmt/issues
26 | Depends:
27 | R (>= 4.2.0)
28 | Imports:
29 | cli,
30 | dplyr,
31 | forcats,
32 | ggplot2,
33 | glue,
34 | gt (>= 0.6.0),
35 | jsonlite,
36 | magrittr,
37 | purrr,
38 | rlang,
39 | stringi,
40 | stringr,
41 | tibble,
42 | tidyr,
43 | tidyselect
44 | Suggests:
45 | cards (>= 0.6.0),
46 | covr,
47 | ggfortify,
48 | knitr,
49 | patchwork,
50 | pharmaverseadam,
51 | rmarkdown,
52 | survival,
53 | testthat (>= 3.0.0),
54 | withr
55 | Config/testthat/edition: 3
56 | Encoding: UTF-8
57 | Language: en-GB
58 | LazyData: true
59 | Roxygen: list(markdown = TRUE)
60 | RoxygenNote: 7.3.3
61 |
--------------------------------------------------------------------------------
/man/display_val_frmts.Rd:
--------------------------------------------------------------------------------
1 | % Generated by roxygen2: do not edit by hand
2 | % Please edit documentation in R/display_insights.R
3 | \name{display_val_frmts}
4 | \alias{display_val_frmts}
5 | \title{Display formatted values}
6 | \usage{
7 | display_val_frmts(tfrmt, .data, mock = FALSE, col = NULL)
8 | }
9 | \arguments{
10 | \item{tfrmt}{tfrmt object to apply to the data}
11 |
12 | \item{.data}{Data to apply the tfrmt to}
13 |
14 | \item{mock}{Mock table? TRUE or FALSE (default)}
15 |
16 | \item{col}{Column value to align on from \code{column} variable. May be a quoted
17 | or unquoted column name, a tidyselect semantic, or a span_structure.}
18 | }
19 | \value{
20 | text representing character vector of formatted values to be copied and modified in the col_style_plan
21 | }
22 | \description{
23 | A helper for creating positional-alignment specifications for the col_style_plan.
24 | Returns all unique formatted values to appear in the column(s) specified. Numeric values are represented by x's.
25 | }
26 | \examples{
27 | tf_spec <- tfrmt(
28 | group = c(rowlbl1,grp),
29 | label = rowlbl2,
30 | column = column,
31 | param = param,
32 | value = value,
33 | sorting_cols = c(ord1, ord2),
34 | body_plan = body_plan(
35 | frmt_structure(group_val = ".default", label_val = ".default", frmt_combine("{n} ({pct} \%)",
36 | n = frmt("xxx"),
37 | pct = frmt("xx.x"))),
38 | frmt_structure(group_val = ".default", label_val = "n", frmt("xxx")),
39 | frmt_structure(group_val = ".default", label_val = c("Mean", "Median", "Min","Max"),
40 | frmt("xxx.x")),
41 | frmt_structure(group_val = ".default", label_val = "SD", frmt("xxx.xx")),
42 | frmt_structure(group_val = ".default", label_val = ".default",
43 | p = frmt_when(">0.99" ~ ">0.99",
44 | "<0.15" ~ "<0.15",
45 | TRUE ~ frmt("x.xxx", missing = "")))
46 | ))
47 |
48 | display_val_frmts(tf_spec, data_demog, col = vars(everything()))
49 | display_val_frmts(tf_spec, data_demog, col = "p-value")
50 | }
51 |
--------------------------------------------------------------------------------
/man/element_row_grp_loc.Rd:
--------------------------------------------------------------------------------
1 | % Generated by roxygen2: do not edit by hand
2 | % Please edit documentation in R/theme_element.R
3 | \name{element_row_grp_loc}
4 | \alias{element_row_grp_loc}
5 | \title{Element Row Group Location}
6 | \usage{
7 | element_row_grp_loc(
8 | location = c("indented", "spanning", "column", "noprint", "gtdefault"),
9 | indent = " "
10 | )
11 | }
12 | \arguments{
13 | \item{location}{Location of the row group labels. Specifying 'indented'
14 | combines all group and label variables into a single column with each
15 | sub-group indented under its parent. 'spanning' and 'column' retain the
16 | highest level group variable in its own column and combine all remaining
17 | group and label variables into a single column with sub-groups indented. The
18 | highest level group column will either be printed as a spanning header or in
19 | its own column in the gt. The 'noprint' option allows the user to suppress
20 | group values from being printed. Finally, the 'gtdefault' option allows
21 | users to use the 'gt' defaults for styling multiple group columns.}
22 |
23 | \item{indent}{A string of the number of spaces you want to indent}
24 | }
25 | \value{
26 | element_row_grp_loc object
27 | }
28 | \description{
29 | Element Row Group Location
30 | }
31 | \section{Images}{
32 | Here are some example outputs:
33 |
34 | \if{html}{\out{
31 | }}
32 | }
33 |
34 | \examples{
35 |
36 | sample_structure <- frmt_structure(
37 | group_val = c("group1"),
38 | label_val = ".default",
39 | frmt("XXX")
40 | )
41 | ## multiple group columns
42 | sample_structure <- frmt_structure(
43 | group_val = list(grp_col1 = "group1", grp_col2 = "subgroup3"),
44 | label_val = ".default",
45 | frmt("XXX")
46 | )
47 |
48 | }
49 | \seealso{
50 | \code{\link[=body_plan]{body_plan()}} combines the frmt_structures to be applied to the
51 | table body, and \code{\link[=frmt]{frmt()}}, \code{\link[=frmt_combine]{frmt_combine()}}, and \code{\link[=frmt_when]{frmt_when()}} define the
52 | format semantics.
53 |
54 | \href{https://gsk-biostatistics.github.io/tfrmt/articles/body_plan.html}{Link to related article}
55 | }
56 |
--------------------------------------------------------------------------------
/man/prep_combine_vars.Rd:
--------------------------------------------------------------------------------
1 | % Generated by roxygen2: do not edit by hand
2 | % Please edit documentation in R/prep_card.R
3 | \name{prep_combine_vars}
4 | \alias{prep_combine_vars}
5 | \title{Combine variables}
6 | \usage{
7 | prep_combine_vars(df, vars, remove = TRUE)
8 | }
9 | \arguments{
10 | \item{df}{(data.frame)}
11 |
12 | \item{vars}{(character) a vector of variables to unite. If a single variable
13 | is supplied, the input is returned unchanged.}
14 |
15 | \item{remove}{If \code{TRUE}, remove input columns from output data frame.}
16 | }
17 | \value{
18 | a data.frame with an additional column, called \code{variable_level} or
19 | the input unchanged.
20 | }
21 | \description{
22 | \ifelse{html}{\href{https://lifecycle.r-lib.org/articles/stages.html#experimental}{\figure{lifecycle-experimental.svg}{options: alt='[Experimental]'}}}{\strong{[Experimental]}}
23 |
24 | A wrapper around \code{tidyr::unite()} which pastes several columns into one.
25 | In addition it checks the output is identical to \code{dplyr::coalesce()}. If not
26 | identical, the input data.frame is returned unchanged. Useful for uniting
27 | sparsely populated columns, for example when processing an ard that was
28 | created with \code{\link[cards:ard_stack]{cards::ard_stack()}} then shuffled with \verb{[shuffle_card()]}.
29 |
30 | If the data is the result of a hierarchical ard stack (with
31 | \code{\link[cards:ard_stack_hierarchical]{cards::ard_stack_hierarchical()}} or
32 | \code{\link[cards:ard_stack_hierarchical]{cards::ard_stack_hierarchical_count()}}), the input is returned unchanged.
33 | This is assessed from the information in the \code{context} column which needs to
34 | be present. If the input data does not have a \code{context} column, the input
35 | will be returned unmodified.
36 | }
37 | \examples{
38 | df <- data.frame(
39 | a = 1:6,
40 | context = rep("categorical", 6),
41 | b = c("a", rep(NA, 5)),
42 | c = c(NA, "b", rep(NA, 4)),
43 | d = c(NA, NA, "c", rep(NA, 3)),
44 | e = c(NA, NA, NA, "d", rep(NA, 2)),
45 | f = c(NA, NA, NA, NA, "e", NA),
46 | g = c(rep(NA, 5), "f")
47 | )
48 |
49 | prep_combine_vars(
50 | df,
51 | vars = c("b", "c", "d", "e", "f", "g")
52 | )
53 | }
54 |
--------------------------------------------------------------------------------
/DESCRIPTION:
--------------------------------------------------------------------------------
1 | Package: tfrmt
2 | Title: Applies Display Metadata to Analysis Results Datasets
3 | Version: 0.2.1.9000
4 | Authors@R: c(
5 | person("Becca", "Krouse", , "becca.z.krouse@gsk.com", role = c("aut", "cre")),
6 | person("Christina", "Fillmore", , "christina.e.fillmore@gsk.com", role = "aut",
7 | comment = c(ORCID = "0000-0003-0595-2302")),
8 | person("Ellis", "Hughes", , "ellis.h.hughes@gsk.com", role = "aut",
9 | comment = c(ORCID = "0000-0003-0637-4436")),
10 | person("Karima", "Ahmad", , "karima.j.ahmad@gsk.com", role = "aut",
11 | comment = c(ORCID = "0000-0002-8784-1712")),
12 | person("Shannon", "Haughton", , "shannon.l.haughton@gsk.com", role = "aut"),
13 | person("Dragoș", "Moldovan-Grünfeld", , "dragos.v.moldovan-grunfeld@gsk.com", role = "aut"),
14 | person("Alanah", "Jonas", "alanah.x.jonas@gsk.com", role = "aut"),
15 | person("GlaxoSmithKline Research & Development Limited", role = c("cph", "fnd")),
16 | person("Atorus Research LLC", role = c("cph", "fnd"))
17 | )
18 | Description: Creates a framework to store and apply display metadata to
19 | Analysis Results Datasets (ARDs). The use of 'tfrmt' allows users to
20 | define table format and styling without the data, and later apply the
21 | format to the data.
22 | License: Apache License (>= 2)
23 | URL: https://GSK-Biostatistics.github.io/tfrmt/,
24 | https://github.com/GSK-Biostatistics/tfrmt
25 | BugReports: https://github.com/GSK-Biostatistics/tfrmt/issues
26 | Depends:
27 | R (>= 4.2.0)
28 | Imports:
29 | cli,
30 | dplyr,
31 | forcats,
32 | ggplot2,
33 | glue,
34 | gt (>= 0.6.0),
35 | jsonlite,
36 | magrittr,
37 | purrr,
38 | rlang,
39 | stringi,
40 | stringr,
41 | tibble,
42 | tidyr,
43 | tidyselect
44 | Suggests:
45 | cards (>= 0.6.0),
46 | covr,
47 | ggfortify,
48 | knitr,
49 | patchwork,
50 | pharmaverseadam,
51 | rmarkdown,
52 | survival,
53 | testthat (>= 3.0.0),
54 | withr
55 | Config/testthat/edition: 3
56 | Encoding: UTF-8
57 | Language: en-GB
58 | LazyData: true
59 | Roxygen: list(markdown = TRUE)
60 | RoxygenNote: 7.3.3
61 |
--------------------------------------------------------------------------------
/man/display_val_frmts.Rd:
--------------------------------------------------------------------------------
1 | % Generated by roxygen2: do not edit by hand
2 | % Please edit documentation in R/display_insights.R
3 | \name{display_val_frmts}
4 | \alias{display_val_frmts}
5 | \title{Display formatted values}
6 | \usage{
7 | display_val_frmts(tfrmt, .data, mock = FALSE, col = NULL)
8 | }
9 | \arguments{
10 | \item{tfrmt}{tfrmt object to apply to the data}
11 |
12 | \item{.data}{Data to apply the tfrmt to}
13 |
14 | \item{mock}{Mock table? TRUE or FALSE (default)}
15 |
16 | \item{col}{Column value to align on from \code{column} variable. May be a quoted
17 | or unquoted column name, a tidyselect semantic, or a span_structure.}
18 | }
19 | \value{
20 | text representing character vector of formatted values to be copied and modified in the col_style_plan
21 | }
22 | \description{
23 | A helper for creating positional-alignment specifications for the col_style_plan.
24 | Returns all unique formatted values to appear in the column(s) specified. Numeric values are represented by x's.
25 | }
26 | \examples{
27 | tf_spec <- tfrmt(
28 | group = c(rowlbl1,grp),
29 | label = rowlbl2,
30 | column = column,
31 | param = param,
32 | value = value,
33 | sorting_cols = c(ord1, ord2),
34 | body_plan = body_plan(
35 | frmt_structure(group_val = ".default", label_val = ".default", frmt_combine("{n} ({pct} \%)",
36 | n = frmt("xxx"),
37 | pct = frmt("xx.x"))),
38 | frmt_structure(group_val = ".default", label_val = "n", frmt("xxx")),
39 | frmt_structure(group_val = ".default", label_val = c("Mean", "Median", "Min","Max"),
40 | frmt("xxx.x")),
41 | frmt_structure(group_val = ".default", label_val = "SD", frmt("xxx.xx")),
42 | frmt_structure(group_val = ".default", label_val = ".default",
43 | p = frmt_when(">0.99" ~ ">0.99",
44 | "<0.15" ~ "<0.15",
45 | TRUE ~ frmt("x.xxx", missing = "")))
46 | ))
47 |
48 | display_val_frmts(tf_spec, data_demog, col = vars(everything()))
49 | display_val_frmts(tf_spec, data_demog, col = "p-value")
50 | }
51 |
--------------------------------------------------------------------------------
/man/element_row_grp_loc.Rd:
--------------------------------------------------------------------------------
1 | % Generated by roxygen2: do not edit by hand
2 | % Please edit documentation in R/theme_element.R
3 | \name{element_row_grp_loc}
4 | \alias{element_row_grp_loc}
5 | \title{Element Row Group Location}
6 | \usage{
7 | element_row_grp_loc(
8 | location = c("indented", "spanning", "column", "noprint", "gtdefault"),
9 | indent = " "
10 | )
11 | }
12 | \arguments{
13 | \item{location}{Location of the row group labels. Specifying 'indented'
14 | combines all group and label variables into a single column with each
15 | sub-group indented under its parent. 'spanning' and 'column' retain the
16 | highest level group variable in its own column and combine all remaining
17 | group and label variables into a single column with sub-groups indented. The
18 | highest level group column will either be printed as a spanning header or in
19 | its own column in the gt. The 'noprint' option allows the user to suppress
20 | group values from being printed. Finally, the 'gtdefault' option allows
21 | users to use the 'gt' defaults for styling multiple group columns.}
22 |
23 | \item{indent}{A string of the number of spaces you want to indent}
24 | }
25 | \value{
26 | element_row_grp_loc object
27 | }
28 | \description{
29 | Element Row Group Location
30 | }
31 | \section{Images}{
32 | Here are some example outputs:
33 |
34 | \if{html}{\out{  }}
35 | }
36 |
37 | \examples{
38 |
39 | tfrmt_spec <- tfrmt(
40 | group = c(grp1, grp2),
41 | label = label,
42 | param = param,
43 | value = value,
44 | column = column,
45 | row_grp_plan = row_grp_plan(label_loc = element_row_grp_loc(location = "noprint")),
46 | body_plan = body_plan(
47 | frmt_structure(group_val = ".default", label_val = ".default", frmt("xx"))
48 | )
49 | )
50 |
51 | }
52 | \seealso{
53 | \code{\link[=row_grp_plan]{row_grp_plan()}} for more details on how to group row group
54 | structures, \code{\link[=row_grp_structure]{row_grp_structure()}} for more details on how to specify row
55 | group structures, \code{\link[=element_block]{element_block()}} for more details on how to specify
56 | spacing between each group.
57 |
58 | \href{https://gsk-biostatistics.github.io/tfrmt/articles/row_grp_plan.html}{Link
59 | to related article}
60 | }
61 |
--------------------------------------------------------------------------------
/man/prep_hierarchical_fill.Rd:
--------------------------------------------------------------------------------
1 | % Generated by roxygen2: do not edit by hand
2 | % Please edit documentation in R/prep_card.R
3 | \name{prep_hierarchical_fill}
4 | \alias{prep_hierarchical_fill}
5 | \title{Fill missing values in hierarchical variables}
6 | \usage{
7 | prep_hierarchical_fill(
8 | df,
9 | vars,
10 | fill = "Any {colname}",
11 | fill_from_left = FALSE
12 | )
13 | }
14 | \arguments{
15 | \item{df}{(data.frame)}
16 |
17 | \item{vars}{(character) a vector of variables to generate pairs from.}
18 |
19 | \item{fill}{(character) value to replace with. Defaults to \code{"Any {colname}"},
20 | in which case \code{colname} will be replaced with the name of the column.}
21 |
22 | \item{fill_from_left}{(logical) indicating whether to fill from the left
23 | (first) column in the pair. Defaults to \code{FALSE}. If \code{TRUE} it takes
24 | precedence over \code{fill}.}
25 | }
26 | \value{
27 | a data.frame with the same columns as the input, but in which some
28 | the desired columns have been filled pairwise.
29 | }
30 | \description{
31 | \ifelse{html}{\href{https://lifecycle.r-lib.org/articles/stages.html#experimental}{\figure{lifecycle-experimental.svg}{options: alt='[Experimental]'}}}{\strong{[Experimental]}}
32 |
33 | Replace \code{NA} values in one column conditional on the same row having a
34 | non-NA value in a different column.
35 |
36 | The user supplies a vector of columns from which the pairs will be extracted
37 | with a rolling window. For example \code{vars <- c("A", "B", "C")} will generate
38 | 2 pairs \verb{("A", "B")} and \verb{("B", "C")}. Therefore the order of the variables
39 | matters.
40 |
41 | In each pair the second column \code{B} will be filled if \code{A} is not missing. One
42 | can choose the value to fill with:
43 | \itemize{
44 | \item \code{"Any {colname}"}, in this case evaluating to \code{"Any B"} is the default.
45 | \item Any other value. For example \code{"Any event"} for an adverse effects table.
46 | \item the value of pair's first column. In this case, the value of \code{A}.
47 | }
48 | }
49 | \examples{
50 | df <- data.frame(
51 | x = c(1, 2, NA),
52 | y = c("a", NA, "b"),
53 | z = rep(NA, 3)
54 | )
55 |
56 | prep_hierarchical_fill(
57 | df,
58 | vars = c("x", "y")
59 | )
60 |
61 | prep_hierarchical_fill(
62 | df,
63 | vars = c("x", "y"),
64 | fill = "foo"
65 | )
66 |
67 | prep_hierarchical_fill(
68 | df,
69 | vars = c("x", "y", "z"),
70 | fill_from_left = TRUE
71 | )
72 | }
73 |
--------------------------------------------------------------------------------
/man/shuffle_card.Rd:
--------------------------------------------------------------------------------
1 | % Generated by roxygen2: do not edit by hand
2 | % Please edit documentation in R/shuffle_card.R
3 | \name{shuffle_card}
4 | \alias{shuffle_card}
5 | \title{Shuffle \code{cards}}
6 | \usage{
7 | shuffle_card(
8 | x,
9 | by = NULL,
10 | trim = TRUE,
11 | order_rows = TRUE,
12 | fill_overall = "Overall {colname}",
13 | fill_hierarchical_overall = "Any {colname}"
14 | )
15 | }
16 | \arguments{
17 | \item{x}{an ARD data frame of class 'card'}
18 |
19 | \item{by}{Grouping variable(s) used in calculations. Defaults to \code{NULL}. If
20 | available (i.e. if \code{x} comes from a stacking function), \code{attributes(x)$by}
21 | will be used instead of \code{by}.}
22 |
23 | \item{trim}{logical representing whether or not to trim away \code{fmt_fun},
24 | \code{error}, and \code{warning} columns}
25 |
26 | \item{order_rows}{logical representing whether or not to apply
27 | \code{cards::tidy_ard_row_order()} to sort the rows}
28 |
29 | \item{fill_overall}{scalar to fill missing grouping or variable levels. If a
30 | character is passed, then it is processed with \code{\link[glue:glue]{glue::glue()}} where the
31 | colname element is available to inject into the string,
32 | e.g. \verb{Overall \{colname\}} may resolve to \code{"Overall AGE"} for an \code{AGE}
33 | column. Default is \verb{Overall \{colname\}}. If \code{NA} then no fill will occur.}
34 |
35 | \item{fill_hierarchical_overall}{scalar to fill variable levels for overall
36 | hierarchical calculations. If a character is passed, then it is processed
37 | with \code{\link[glue:glue]{glue::glue()}} where the colname element is available to inject into
38 | the string, e.g. \verb{Any \{colname\}} may resolve to \code{"Any AESOC"} for an
39 | \code{AESOC} column. Default is \verb{Any \{colname\}}. If \code{NA} then no fill will
40 | occur.}
41 | }
42 | \value{
43 | a tibble
44 | }
45 | \description{
46 | \ifelse{html}{\href{https://lifecycle.r-lib.org/articles/stages.html#experimental}{\figure{lifecycle-experimental.svg}{options: alt='[Experimental]'}}}{\strong{[Experimental]}}
47 |
48 | This function ingests an ARD object of class \code{card} and shuffles the information to prepare
49 | for analysis. Helpful for streamlining across multiple ARDs.
50 | }
51 | \examples{
52 | \dontrun{
53 | cards::bind_ard(
54 | cards::ard_categorical(cards::ADSL, by = "ARM", variables = "AGEGR1"),
55 | cards::ard_categorical(cards::ADSL, variables = "ARM")
56 | ) |>
57 | shuffle_card()
58 | }
59 | }
60 |
--------------------------------------------------------------------------------
/man/print_mock_gt.Rd:
--------------------------------------------------------------------------------
1 | % Generated by roxygen2: do not edit by hand
2 | % Please edit documentation in R/print_to_gt.R
3 | \name{print_mock_gt}
4 | \alias{print_mock_gt}
5 | \title{Print mock table to GT}
6 | \usage{
7 | print_mock_gt(
8 | tfrmt,
9 | .data = NULL,
10 | .default = 1:3,
11 | n_cols = NULL,
12 | .unicode_ws = TRUE
13 | )
14 | }
15 | \arguments{
16 | \item{tfrmt}{tfrmt the mock table will be based off of}
17 |
18 | \item{.data}{Optional data. If this is missing, group values, labels values
19 | and parameter values will be estimated based on the tfrmt}
20 |
21 | \item{.default}{sequence to replace the default values if a dataset isn't
22 | provided}
23 |
24 | \item{n_cols}{the number of columns. This will only be used if mock data isn't
25 | provided. If not supplied, it will default to using the \code{col_plan} from the
26 | \code{tfrmt}. If neither are available it will use 3.}
27 |
28 | \item{.unicode_ws}{Whether to convert white space to unicode in preparation for output}
29 | }
30 | \value{
31 | a stylized gt object
32 | }
33 | \description{
34 | Print mock table to GT
35 | }
36 | \section{Examples}{
37 |
38 |
39 | \if{html}{\out{
}}
35 | }
36 |
37 | \examples{
38 |
39 | tfrmt_spec <- tfrmt(
40 | group = c(grp1, grp2),
41 | label = label,
42 | param = param,
43 | value = value,
44 | column = column,
45 | row_grp_plan = row_grp_plan(label_loc = element_row_grp_loc(location = "noprint")),
46 | body_plan = body_plan(
47 | frmt_structure(group_val = ".default", label_val = ".default", frmt("xx"))
48 | )
49 | )
50 |
51 | }
52 | \seealso{
53 | \code{\link[=row_grp_plan]{row_grp_plan()}} for more details on how to group row group
54 | structures, \code{\link[=row_grp_structure]{row_grp_structure()}} for more details on how to specify row
55 | group structures, \code{\link[=element_block]{element_block()}} for more details on how to specify
56 | spacing between each group.
57 |
58 | \href{https://gsk-biostatistics.github.io/tfrmt/articles/row_grp_plan.html}{Link
59 | to related article}
60 | }
61 |
--------------------------------------------------------------------------------
/man/prep_hierarchical_fill.Rd:
--------------------------------------------------------------------------------
1 | % Generated by roxygen2: do not edit by hand
2 | % Please edit documentation in R/prep_card.R
3 | \name{prep_hierarchical_fill}
4 | \alias{prep_hierarchical_fill}
5 | \title{Fill missing values in hierarchical variables}
6 | \usage{
7 | prep_hierarchical_fill(
8 | df,
9 | vars,
10 | fill = "Any {colname}",
11 | fill_from_left = FALSE
12 | )
13 | }
14 | \arguments{
15 | \item{df}{(data.frame)}
16 |
17 | \item{vars}{(character) a vector of variables to generate pairs from.}
18 |
19 | \item{fill}{(character) value to replace with. Defaults to \code{"Any {colname}"},
20 | in which case \code{colname} will be replaced with the name of the column.}
21 |
22 | \item{fill_from_left}{(logical) indicating whether to fill from the left
23 | (first) column in the pair. Defaults to \code{FALSE}. If \code{TRUE} it takes
24 | precedence over \code{fill}.}
25 | }
26 | \value{
27 | a data.frame with the same columns as the input, but in which some
28 | the desired columns have been filled pairwise.
29 | }
30 | \description{
31 | \ifelse{html}{\href{https://lifecycle.r-lib.org/articles/stages.html#experimental}{\figure{lifecycle-experimental.svg}{options: alt='[Experimental]'}}}{\strong{[Experimental]}}
32 |
33 | Replace \code{NA} values in one column conditional on the same row having a
34 | non-NA value in a different column.
35 |
36 | The user supplies a vector of columns from which the pairs will be extracted
37 | with a rolling window. For example \code{vars <- c("A", "B", "C")} will generate
38 | 2 pairs \verb{("A", "B")} and \verb{("B", "C")}. Therefore the order of the variables
39 | matters.
40 |
41 | In each pair the second column \code{B} will be filled if \code{A} is not missing. One
42 | can choose the value to fill with:
43 | \itemize{
44 | \item \code{"Any {colname}"}, in this case evaluating to \code{"Any B"} is the default.
45 | \item Any other value. For example \code{"Any event"} for an adverse effects table.
46 | \item the value of pair's first column. In this case, the value of \code{A}.
47 | }
48 | }
49 | \examples{
50 | df <- data.frame(
51 | x = c(1, 2, NA),
52 | y = c("a", NA, "b"),
53 | z = rep(NA, 3)
54 | )
55 |
56 | prep_hierarchical_fill(
57 | df,
58 | vars = c("x", "y")
59 | )
60 |
61 | prep_hierarchical_fill(
62 | df,
63 | vars = c("x", "y"),
64 | fill = "foo"
65 | )
66 |
67 | prep_hierarchical_fill(
68 | df,
69 | vars = c("x", "y", "z"),
70 | fill_from_left = TRUE
71 | )
72 | }
73 |
--------------------------------------------------------------------------------
/man/shuffle_card.Rd:
--------------------------------------------------------------------------------
1 | % Generated by roxygen2: do not edit by hand
2 | % Please edit documentation in R/shuffle_card.R
3 | \name{shuffle_card}
4 | \alias{shuffle_card}
5 | \title{Shuffle \code{cards}}
6 | \usage{
7 | shuffle_card(
8 | x,
9 | by = NULL,
10 | trim = TRUE,
11 | order_rows = TRUE,
12 | fill_overall = "Overall {colname}",
13 | fill_hierarchical_overall = "Any {colname}"
14 | )
15 | }
16 | \arguments{
17 | \item{x}{an ARD data frame of class 'card'}
18 |
19 | \item{by}{Grouping variable(s) used in calculations. Defaults to \code{NULL}. If
20 | available (i.e. if \code{x} comes from a stacking function), \code{attributes(x)$by}
21 | will be used instead of \code{by}.}
22 |
23 | \item{trim}{logical representing whether or not to trim away \code{fmt_fun},
24 | \code{error}, and \code{warning} columns}
25 |
26 | \item{order_rows}{logical representing whether or not to apply
27 | \code{cards::tidy_ard_row_order()} to sort the rows}
28 |
29 | \item{fill_overall}{scalar to fill missing grouping or variable levels. If a
30 | character is passed, then it is processed with \code{\link[glue:glue]{glue::glue()}} where the
31 | colname element is available to inject into the string,
32 | e.g. \verb{Overall \{colname\}} may resolve to \code{"Overall AGE"} for an \code{AGE}
33 | column. Default is \verb{Overall \{colname\}}. If \code{NA} then no fill will occur.}
34 |
35 | \item{fill_hierarchical_overall}{scalar to fill variable levels for overall
36 | hierarchical calculations. If a character is passed, then it is processed
37 | with \code{\link[glue:glue]{glue::glue()}} where the colname element is available to inject into
38 | the string, e.g. \verb{Any \{colname\}} may resolve to \code{"Any AESOC"} for an
39 | \code{AESOC} column. Default is \verb{Any \{colname\}}. If \code{NA} then no fill will
40 | occur.}
41 | }
42 | \value{
43 | a tibble
44 | }
45 | \description{
46 | \ifelse{html}{\href{https://lifecycle.r-lib.org/articles/stages.html#experimental}{\figure{lifecycle-experimental.svg}{options: alt='[Experimental]'}}}{\strong{[Experimental]}}
47 |
48 | This function ingests an ARD object of class \code{card} and shuffles the information to prepare
49 | for analysis. Helpful for streamlining across multiple ARDs.
50 | }
51 | \examples{
52 | \dontrun{
53 | cards::bind_ard(
54 | cards::ard_categorical(cards::ADSL, by = "ARM", variables = "AGEGR1"),
55 | cards::ard_categorical(cards::ADSL, variables = "ARM")
56 | ) |>
57 | shuffle_card()
58 | }
59 | }
60 |
--------------------------------------------------------------------------------
/man/print_mock_gt.Rd:
--------------------------------------------------------------------------------
1 | % Generated by roxygen2: do not edit by hand
2 | % Please edit documentation in R/print_to_gt.R
3 | \name{print_mock_gt}
4 | \alias{print_mock_gt}
5 | \title{Print mock table to GT}
6 | \usage{
7 | print_mock_gt(
8 | tfrmt,
9 | .data = NULL,
10 | .default = 1:3,
11 | n_cols = NULL,
12 | .unicode_ws = TRUE
13 | )
14 | }
15 | \arguments{
16 | \item{tfrmt}{tfrmt the mock table will be based off of}
17 |
18 | \item{.data}{Optional data. If this is missing, group values, labels values
19 | and parameter values will be estimated based on the tfrmt}
20 |
21 | \item{.default}{sequence to replace the default values if a dataset isn't
22 | provided}
23 |
24 | \item{n_cols}{the number of columns. This will only be used if mock data isn't
25 | provided. If not supplied, it will default to using the \code{col_plan} from the
26 | \code{tfrmt}. If neither are available it will use 3.}
27 |
28 | \item{.unicode_ws}{Whether to convert white space to unicode in preparation for output}
29 | }
30 | \value{
31 | a stylized gt object
32 | }
33 | \description{
34 | Print mock table to GT
35 | }
36 | \section{Examples}{
37 |
38 |
39 | \if{html}{\out{ }}
53 |
54 | \if{html}{\out{
}}
53 |
54 | \if{html}{\out{ }}
65 | }
66 |
67 |
--------------------------------------------------------------------------------
/tests/testthat/test-check_order_vars.R:
--------------------------------------------------------------------------------
1 |
2 | test_that("Message is printed if order variables are causing mismatching rows",{
3 | data <- tibble::tibble(param = c("N","N","n","n","pct","pct"),
4 | value = c(111,222,11,22,11,22),
5 | order1=c(NA,NA,1,1,1,1),
6 | order2=c(NA,NA,1,2,1,2),
7 | order3=c(1,2,NA,NA,NA,NA),
8 | label=c("Training set","Training set","Sex, n(%)","Sex, n(%)","Sex, n(%)","Sex, n(%)"),
9 | column=c("Test","Train","Test","Train","Test","Train"))
10 |
11 | data2 <- data %>%
12 | rbind(data) %>%
13 | mutate(group= c(rep("group1",6),rep("group2",6)))
14 |
15 | data3 <- tibble::tibble(param = c("N","N","n","n","pct","pct"),
16 | value = c(111,222,11,22,11,22),
17 | order1=c(NA,NA,1,1,1,1),
18 | order2=c(NA,NA,1,1,1,1),
19 | order3=c(1,1,NA,NA,NA,NA),
20 | label=c("Training set","Training set","Sex, n(%)","Sex, n(%)","Sex, n(%)","Sex, n(%)"),
21 | column=c("Test","Train","Test","Train","Test","Train"))
22 |
23 | tfrmt = tfrmt(
24 | label = label,
25 | column = column,
26 | param = param,
27 | value=value,
28 | sorting_cols=c(order1,order2,order3),
29 | col_plan = col_plan(
30 | -order1,
31 | -order2,
32 | -order3
33 | ))
34 |
35 | tfrmt2 <- tfrmt(
36 | group = group,
37 | label = label,
38 | column = column,
39 | param = param,
40 | value=value,
41 | sorting_cols=c(order1,order2,order3),
42 | col_plan = col_plan(
43 | -order1,
44 | -order2,
45 | -order3
46 | ))
47 |
48 | # use quietly to grab messages from apply_tfrmt
49 | safe_check_order<-purrr::quietly(check_order_vars)
50 |
51 | expect_equal(
52 | safe_check_order(data, tfrmt)$messages[1],
53 | "Note: Some row labels have values printed over more than 1 line.\n This could be due to incorrect sorting variables. Each row in your output table should have only one sorting var combination assigned to it.\n")
54 |
55 | expect_equal(
56 | safe_check_order(data2, tfrmt2)$messages[1],
57 | "Note: Some row labels have values printed over more than 1 line.\n This could be due to incorrect sorting variables. Each row in your output table should have only one sorting var combination assigned to it.\n")
58 |
59 | expect_equal(
60 | safe_check_order(data3, tfrmt)$messages,
61 | character(0))
62 |
63 | })
64 |
--------------------------------------------------------------------------------
/tests/testthat/test-quo_get.R:
--------------------------------------------------------------------------------
1 | test_that("turn length one unquoted vals into args", {
2 |
3 | temp_function <- function(x){
4 | quo_get(
5 | args = "x",
6 | as_var_args = "x"
7 | )
8 | }
9 |
10 | expect_equal(
11 | temp_function(bare_arg_val)$x,
12 | vars(bare_arg_val),
13 | ignore_attr = TRUE
14 | )
15 |
16 | })
17 |
18 | test_that("turn length 2 unquoted vals into args", {
19 |
20 | temp_function <- function(x){
21 | quo_get(
22 | args = "x",
23 | as_var_args = "x"
24 | )
25 | }
26 |
27 | expect_equal(
28 | temp_function(c(bare_arg_val1, bare_arg_val2))$x,
29 | vars(bare_arg_val1, bare_arg_val2),
30 | ignore_attr = TRUE
31 | )
32 |
33 | })
34 |
35 | test_that("turn length one unquoted quo into args", {
36 |
37 | temp_function <- function(x){
38 | quo_get(
39 | args = "x",
40 | as_quo_args = "x"
41 | )
42 | }
43 |
44 | expect_equal(
45 | temp_function(bare_arg_val)$x,
46 | quo(bare_arg_val),
47 | ignore_attr = TRUE
48 | )
49 |
50 | })
51 |
52 | test_that("turn length two unquoted quo into args", {
53 |
54 | temp_function <- function(x){
55 | quo_get(
56 | args = "x",
57 | as_quo_args = "x"
58 | )
59 | }
60 |
61 | warning_res <- capture_warnings({
62 | tempfunc_res <-
63 | temp_function(c(bare_arg_val1, bare_arg_val2))
64 | })
65 |
66 | expect_equal(
67 | tempfunc_res$x,
68 | quo(bare_arg_val1),
69 | ignore_attr = TRUE
70 | )
71 |
72 | })
73 |
74 |
75 | test_that("throw error when input argument errors out", {
76 |
77 | temp_function_1 <- function(x, ...){
78 | val <- temp_function_2(...)
79 | val
80 | }
81 |
82 | temp_function_2 <- function(..., env = parent.frame()){
83 |
84 | arg_parent <- names(formals(sys.function(sys.parent(1))))
85 |
86 | args <- setdiff(arg_parent,c("..."))
87 |
88 | val <- quo_get(
89 | args,
90 | envir = env
91 | )
92 |
93 | val
94 | }
95 |
96 | fail_function <- function(...){
97 |
98 | dot_list <- as.list(substitute(substitute(...)))[-1]
99 |
100 | if(length(dot_list) == 0){
101 | stop("I HAVE FAILED")
102 | }else{
103 | dot_list
104 | }
105 | }
106 |
107 | expect_silent(
108 | temp_function_1(x = fail_function("test value"))
109 | )
110 |
111 | expect_error(
112 | temp_function_1(x = fail_function()),
113 | "Error in evaluating argument `x`:\n Error in fail_function(): I HAVE FAILED",
114 | fixed = TRUE
115 | )
116 |
117 | })
118 |
119 |
--------------------------------------------------------------------------------
/R/tfrmt_n_pct.R:
--------------------------------------------------------------------------------
1 | #' N Percent Template
2 | #'
3 | #' This function creates an tfrmt for an n % table, so count based table. The
4 | #' parameter values for n and percent can be provided (by default it will assume
5 | #' `n` and `pct`). Additionally the `frmt_when` for formatting the percent can
6 | #' be specified. By default 100% and 0% will not appear and everything between
7 | #' 99% and 100% and 0% and 1% will be rounded using greater than (>) and less
8 | #' than (<) signs respectively.
9 | #' @param n name of count (n) value in the parameter column
10 | #' @param pct name of percent (pct) value in the parameter column
11 | #' @param pct_frmt_when formatting to be used on the the percent values
12 | #' @param tfrmt_obj an optional tfrmt object to layer
13 | #'
14 | #' @returns tfrmt object
15 | #' @export
16 | #' @section Examples:
17 | #'
18 | #' ```r
19 | #' print_mock_gt(tfrmt_n_pct())
20 | #' ```
21 | #'
22 | #' \if{html}{\out{
23 | #' `r "
}}
65 | }
66 |
67 |
--------------------------------------------------------------------------------
/tests/testthat/test-check_order_vars.R:
--------------------------------------------------------------------------------
1 |
2 | test_that("Message is printed if order variables are causing mismatching rows",{
3 | data <- tibble::tibble(param = c("N","N","n","n","pct","pct"),
4 | value = c(111,222,11,22,11,22),
5 | order1=c(NA,NA,1,1,1,1),
6 | order2=c(NA,NA,1,2,1,2),
7 | order3=c(1,2,NA,NA,NA,NA),
8 | label=c("Training set","Training set","Sex, n(%)","Sex, n(%)","Sex, n(%)","Sex, n(%)"),
9 | column=c("Test","Train","Test","Train","Test","Train"))
10 |
11 | data2 <- data %>%
12 | rbind(data) %>%
13 | mutate(group= c(rep("group1",6),rep("group2",6)))
14 |
15 | data3 <- tibble::tibble(param = c("N","N","n","n","pct","pct"),
16 | value = c(111,222,11,22,11,22),
17 | order1=c(NA,NA,1,1,1,1),
18 | order2=c(NA,NA,1,1,1,1),
19 | order3=c(1,1,NA,NA,NA,NA),
20 | label=c("Training set","Training set","Sex, n(%)","Sex, n(%)","Sex, n(%)","Sex, n(%)"),
21 | column=c("Test","Train","Test","Train","Test","Train"))
22 |
23 | tfrmt = tfrmt(
24 | label = label,
25 | column = column,
26 | param = param,
27 | value=value,
28 | sorting_cols=c(order1,order2,order3),
29 | col_plan = col_plan(
30 | -order1,
31 | -order2,
32 | -order3
33 | ))
34 |
35 | tfrmt2 <- tfrmt(
36 | group = group,
37 | label = label,
38 | column = column,
39 | param = param,
40 | value=value,
41 | sorting_cols=c(order1,order2,order3),
42 | col_plan = col_plan(
43 | -order1,
44 | -order2,
45 | -order3
46 | ))
47 |
48 | # use quietly to grab messages from apply_tfrmt
49 | safe_check_order<-purrr::quietly(check_order_vars)
50 |
51 | expect_equal(
52 | safe_check_order(data, tfrmt)$messages[1],
53 | "Note: Some row labels have values printed over more than 1 line.\n This could be due to incorrect sorting variables. Each row in your output table should have only one sorting var combination assigned to it.\n")
54 |
55 | expect_equal(
56 | safe_check_order(data2, tfrmt2)$messages[1],
57 | "Note: Some row labels have values printed over more than 1 line.\n This could be due to incorrect sorting variables. Each row in your output table should have only one sorting var combination assigned to it.\n")
58 |
59 | expect_equal(
60 | safe_check_order(data3, tfrmt)$messages,
61 | character(0))
62 |
63 | })
64 |
--------------------------------------------------------------------------------
/tests/testthat/test-quo_get.R:
--------------------------------------------------------------------------------
1 | test_that("turn length one unquoted vals into args", {
2 |
3 | temp_function <- function(x){
4 | quo_get(
5 | args = "x",
6 | as_var_args = "x"
7 | )
8 | }
9 |
10 | expect_equal(
11 | temp_function(bare_arg_val)$x,
12 | vars(bare_arg_val),
13 | ignore_attr = TRUE
14 | )
15 |
16 | })
17 |
18 | test_that("turn length 2 unquoted vals into args", {
19 |
20 | temp_function <- function(x){
21 | quo_get(
22 | args = "x",
23 | as_var_args = "x"
24 | )
25 | }
26 |
27 | expect_equal(
28 | temp_function(c(bare_arg_val1, bare_arg_val2))$x,
29 | vars(bare_arg_val1, bare_arg_val2),
30 | ignore_attr = TRUE
31 | )
32 |
33 | })
34 |
35 | test_that("turn length one unquoted quo into args", {
36 |
37 | temp_function <- function(x){
38 | quo_get(
39 | args = "x",
40 | as_quo_args = "x"
41 | )
42 | }
43 |
44 | expect_equal(
45 | temp_function(bare_arg_val)$x,
46 | quo(bare_arg_val),
47 | ignore_attr = TRUE
48 | )
49 |
50 | })
51 |
52 | test_that("turn length two unquoted quo into args", {
53 |
54 | temp_function <- function(x){
55 | quo_get(
56 | args = "x",
57 | as_quo_args = "x"
58 | )
59 | }
60 |
61 | warning_res <- capture_warnings({
62 | tempfunc_res <-
63 | temp_function(c(bare_arg_val1, bare_arg_val2))
64 | })
65 |
66 | expect_equal(
67 | tempfunc_res$x,
68 | quo(bare_arg_val1),
69 | ignore_attr = TRUE
70 | )
71 |
72 | })
73 |
74 |
75 | test_that("throw error when input argument errors out", {
76 |
77 | temp_function_1 <- function(x, ...){
78 | val <- temp_function_2(...)
79 | val
80 | }
81 |
82 | temp_function_2 <- function(..., env = parent.frame()){
83 |
84 | arg_parent <- names(formals(sys.function(sys.parent(1))))
85 |
86 | args <- setdiff(arg_parent,c("..."))
87 |
88 | val <- quo_get(
89 | args,
90 | envir = env
91 | )
92 |
93 | val
94 | }
95 |
96 | fail_function <- function(...){
97 |
98 | dot_list <- as.list(substitute(substitute(...)))[-1]
99 |
100 | if(length(dot_list) == 0){
101 | stop("I HAVE FAILED")
102 | }else{
103 | dot_list
104 | }
105 | }
106 |
107 | expect_silent(
108 | temp_function_1(x = fail_function("test value"))
109 | )
110 |
111 | expect_error(
112 | temp_function_1(x = fail_function()),
113 | "Error in evaluating argument `x`:\n Error in fail_function(): I HAVE FAILED",
114 | fixed = TRUE
115 | )
116 |
117 | })
118 |
119 |
--------------------------------------------------------------------------------
/R/tfrmt_n_pct.R:
--------------------------------------------------------------------------------
1 | #' N Percent Template
2 | #'
3 | #' This function creates an tfrmt for an n % table, so count based table. The
4 | #' parameter values for n and percent can be provided (by default it will assume
5 | #' `n` and `pct`). Additionally the `frmt_when` for formatting the percent can
6 | #' be specified. By default 100% and 0% will not appear and everything between
7 | #' 99% and 100% and 0% and 1% will be rounded using greater than (>) and less
8 | #' than (<) signs respectively.
9 | #' @param n name of count (n) value in the parameter column
10 | #' @param pct name of percent (pct) value in the parameter column
11 | #' @param pct_frmt_when formatting to be used on the the percent values
12 | #' @param tfrmt_obj an optional tfrmt object to layer
13 | #'
14 | #' @returns tfrmt object
15 | #' @export
16 | #' @section Examples:
17 | #'
18 | #' ```r
19 | #' print_mock_gt(tfrmt_n_pct())
20 | #' ```
21 | #'
22 | #' \if{html}{\out{
23 | #' `r " "`
24 | #' }}
25 | #'
26 | #' @importFrom rlang parse_expr
27 | tfrmt_n_pct <- function(n = "n",
28 | pct = "pct",
29 | pct_frmt_when = frmt_when("==100"~ frmt(""),
30 | ">99"~ frmt("(>99%)"),
31 | "==0"~ "",
32 | "<1" ~ frmt("(<1%)"),
33 | "TRUE" ~ frmt("(xx.x%)")),
34 | tfrmt_obj = NULL){
35 | if(is.null(n)|is.na(n)|n==""){
36 | stop("`n` value must be provided")
37 | }
38 | if(is.null(pct)|is.na(pct)|pct==""){
39 | stop("`pct` value must be provided")
40 | }
41 |
42 | combo <- paste0(
43 | "frmt_combine('{",
44 | n,
45 | "} {", pct, "}',",
46 | n, "=frmt('x'),",
47 | pct, "=pct_frmt_when)"
48 | ) %>%
49 | parse_expr() %>% eval()
50 |
51 | if(!is.null(tfrmt_obj)){
52 | ae_tbl <- tfrmt(
53 | body_plan = body_plan(
54 | frmt_structure(
55 | group_val = ".default", label_val = ".default",
56 | combo
57 | )
58 | )
59 | )
60 | ae_tbl <- layer_tfrmt(x = tfrmt_obj, y = ae_tbl)
61 | } else {
62 | ae_tbl <- tfrmt(
63 | param = "param",
64 | label = "row_label1",
65 | column = "col1",
66 | value = "value",
67 | body_plan = body_plan(
68 | frmt_structure(
69 | group_val = ".default", label_val = ".default",
70 | combo
71 | )
72 | )
73 | )
74 | }
75 | ae_tbl
76 | }
77 |
--------------------------------------------------------------------------------
/tests/testthat/test-tfrmt_n_pct.R:
--------------------------------------------------------------------------------
1 | test_that("tfrmt_n_pct", {
2 |
3 | # format to avoid issues with the environment
4 | expect_equal(format(tfrmt_n_pct()$body_plan),
5 | body_plan(
6 | frmt_structure(
7 | group_val = ".default", label_val = ".default",
8 | frmt_combine("{n} {pct}", n = frmt("xxx"),
9 | pct = frmt_when("==100"~ frmt(""),
10 | ">99"~ frmt("(>99%)"),
11 | "==0"~ "",
12 | "<1" ~ frmt("(<1%)"),
13 | "TRUE" ~ frmt("(xx.x%)")))
14 | )
15 | ) %>% format()
16 | )
17 | # See that it can change when n is changed
18 | expect_equal(format(tfrmt_n_pct("n_distinct")$body_plan),
19 | body_plan(
20 | frmt_structure(
21 | group_val = ".default", label_val = ".default",
22 | frmt_combine("{n_distinct} {pct}", n_distinct = frmt("xxx"),
23 | pct = frmt_when("==100"~ frmt(""),
24 | ">99"~ frmt("(>99%)"),
25 | "==0"~ "",
26 | "<1" ~ frmt("(<1%)"),
27 | "TRUE" ~ frmt("(xx.x%)")))
28 | )
29 | ) %>% format()
30 | )
31 | # Change the frmt_when
32 | expect_equal(format(tfrmt_n_pct(pct_frmt_when =
33 | frmt_when(
34 | "==100" ~ "",
35 | "==0" ~ "",
36 | TRUE ~ frmt("(xx.x %)")
37 | ))$body_plan),
38 | body_plan(
39 | frmt_structure(
40 | group_val = ".default", label_val = ".default",
41 | frmt_combine("{n} {pct}", n = frmt("xxx"),
42 | pct = frmt_when(
43 | "==100" ~ "",
44 | "==0" ~ "",
45 | TRUE ~ frmt("(xx.x %)")
46 | ))
47 | )
48 | ) %>% format()
49 | )
50 |
51 | # layer with existing tfrmt
52 | test <- tfrmt(
53 | column = column
54 | )
55 | expect_equal(tfrmt_n_pct(tfrmt_obj = test)$column[[1]] %>%
56 | as_label(),
57 | "column")
58 |
59 | expect_error(tfrmt_n_pct(n = ""))
60 | expect_error(tfrmt_n_pct(pct = NULL))
61 |
62 | })
63 |
64 |
--------------------------------------------------------------------------------
/.github/workflows/pr-commands.yaml:
--------------------------------------------------------------------------------
1 | # Workflow derived from https://github.com/r-lib/actions/tree/v2/examples
2 | # Need help debugging build failures? Start at https://github.com/r-lib/actions#where-to-find-help
3 | on:
4 | issue_comment:
5 | types: [created]
6 |
7 | name: Commands
8 |
9 | jobs:
10 | document:
11 | if: ${{ github.event.issue.pull_request && (github.event.comment.author_association == 'MEMBER' || github.event.comment.author_association == 'OWNER') && startsWith(github.event.comment.body, '/document') }}
12 | name: document
13 | runs-on: ubuntu-latest
14 | env:
15 | GITHUB_PAT: ${{ secrets.GITHUB_TOKEN }}
16 | steps:
17 | - uses: actions/checkout@v4
18 |
19 | - uses: r-lib/actions/pr-fetch@v2
20 | with:
21 | repo-token: ${{ secrets.GITHUB_TOKEN }}
22 |
23 | - uses: r-lib/actions/setup-r@v2
24 | with:
25 | use-public-rspm: true
26 |
27 | - uses: r-lib/actions/setup-r-dependencies@v2
28 | with:
29 | extra-packages: any::roxygen2
30 | needs: pr-document
31 |
32 | - name: Document
33 | run: roxygen2::roxygenise()
34 | shell: Rscript {0}
35 |
36 | - name: commit
37 | run: |
38 | git config --local user.name "$GITHUB_ACTOR"
39 | git config --local user.email "$GITHUB_ACTOR@users.noreply.github.com"
40 | git add man/\* NAMESPACE
41 | git commit -m 'Document'
42 |
43 | - uses: r-lib/actions/pr-push@v2
44 | with:
45 | repo-token: ${{ secrets.GITHUB_TOKEN }}
46 |
47 | style:
48 | if: ${{ github.event.issue.pull_request && (github.event.comment.author_association == 'MEMBER' || github.event.comment.author_association == 'OWNER') && startsWith(github.event.comment.body, '/style') }}
49 | name: style
50 | runs-on: ubuntu-latest
51 | env:
52 | GITHUB_PAT: ${{ secrets.GITHUB_TOKEN }}
53 | steps:
54 | - uses: actions/checkout@v4
55 |
56 | - uses: r-lib/actions/pr-fetch@v2
57 | with:
58 | repo-token: ${{ secrets.GITHUB_TOKEN }}
59 |
60 | - uses: r-lib/actions/setup-r@v2
61 |
62 | - name: Install dependencies
63 | run: install.packages("styler")
64 | shell: Rscript {0}
65 |
66 | - name: Style
67 | run: styler::style_pkg()
68 | shell: Rscript {0}
69 |
70 | - name: commit
71 | run: |
72 | git config --local user.name "$GITHUB_ACTOR"
73 | git config --local user.email "$GITHUB_ACTOR@users.noreply.github.com"
74 | git add \*.R
75 | git commit -m 'Style'
76 |
77 | - uses: r-lib/actions/pr-push@v2
78 | with:
79 | repo-token: ${{ secrets.GITHUB_TOKEN }}
80 |
--------------------------------------------------------------------------------
/R/data.R:
--------------------------------------------------------------------------------
1 | #' Demography Analysis Results Data
2 | #'
3 | #' A dataset containing the results needed for a demography table. Using the
4 | #' CDISC pilot data.
5 | #'
6 | #' @format A data frame with 386 rows and 7 variables:
7 | #' \describe{
8 | #' \item{rowlbl1}{highest level row labels}
9 | #' \item{rowlbl2}{more specific row labels}
10 | #' \item{param}{parameter to explain each value}
11 | #' \item{grp}{grouping column used to distinguish continuous and categorical}
12 | #' \item{ord1}{controls ordering}
13 | #' \item{ord2}{more ordering controls}
14 | #' \item{column}{column names}
15 | #' \item{value}{values to put in a table}
16 | #' }
17 | "data_demog"
18 |
19 |
20 | #' Adverse Events Analysis Results Data
21 | #'
22 | #' A dataset containing the results needed for an AE table. Using the
23 | #' CDISC pilot data.
24 | #'
25 | #' @format A data frame with 2,794 rows and 8 variables:
26 | #' \describe{
27 | #' \item{AEBODSYS}{highest level row labels: System Organ Class}
28 | #' \item{AETERM}{more specific row labels: Preferred Term}
29 | #' \item{col2}{higher level column names (spanners)}
30 | #' \item{col1}{lower level column names}
31 | #' \item{param}{parameter to explain each value}
32 | #' \item{value}{values to put in a table}
33 | #' \item{ord1}{controls ordering}
34 | #' \item{ord2}{more ordering controls}
35 | #' }
36 | "data_ae"
37 |
38 | #' Efficacy Analysis Results Data
39 | #'
40 | #' A dataset containing the results needed for an Efficacy table. Using the
41 | #' CDISC pilot data for ADAS-Cog(11).
42 | #'
43 | #' @format A data frame with 70 rows and 7 variables:
44 | #' \describe{
45 | #' \item{group}{highest level row labels}
46 | #' \item{label}{more specific row labels}
47 | #' \item{column}{column names}
48 | #' \item{param}{parameter to explain each value}
49 | #' \item{value}{values to put in a table}
50 | #' \item{ord1}{controls ordering}
51 | #' \item{ord2}{more ordering controls}
52 | #' }
53 | "data_efficacy"
54 |
55 |
56 | #' Labs Analysis Results Data
57 | #'
58 | #' A dataset containing the results needed for an labs results table. Using the
59 | #' CDISC pilot data.
60 | #'
61 | #' @format A data frame with 4,950 rows and 7 variables:
62 | #' \describe{
63 | #' \item{group1}{highest level row labels: Lab value class}
64 | #' \item{group2}{more specific row labels: Lab parameter}
65 | #' \item{rowlbl}{most specific row labels: Study visit}
66 | #' \item{col1}{higher level column names (spanners)}
67 | #' \item{col2}{lower level column names}
68 | #' \item{param}{parameter to explain each value}
69 | #' \item{value}{values to put in a table}
70 | #' \item{ord1}{controls ordering}
71 | #' \item{ord2}{more ordering controls}
72 | #' \item{ord3}{more ordering controls}
73 | #' }
74 | "data_labs"
75 |
--------------------------------------------------------------------------------
/vignettes/json.Rmd:
--------------------------------------------------------------------------------
1 | ---
2 | title: "JSON metadata"
3 | output: rmarkdown::html_vignette
4 | vignette: >
5 | %\VignetteIndexEntry{JSON metadata}
6 | %\VignetteEngine{knitr::rmarkdown}
7 | %\VignetteEncoding{UTF-8}
8 | ---
9 |
10 | ```{r, include = FALSE}
11 | knitr::opts_chunk$set(
12 | collapse = TRUE,
13 | comment = "#>"
14 | )
15 | ```
16 |
17 | ```{r setup, message = FALSE, warning = FALSE}
18 | library(tfrmt)
19 | ```
20 |
21 | Aside from R code, `tfrmt` objects can be represented as machine-readable metadata in `JSON` format. This enables users to save formatting metadata to a database, or alternatively import templates stored as `JSON` files. There are several utilities available for seamless translation between `tfrmt` and `JSON`.
22 |
23 | ## tfrmt to JSON
24 |
25 | A `tfrmt` object can be converted to `JSON` using the `tfrmt_to_json` function. Suppose we have a basic `tfrmt`:
26 |
27 | ```{r}
28 | template_tfrmt <- tfrmt(
29 | group = grp,
30 | label = label,
31 | column = column,
32 | param = param,
33 | value = value,
34 | body_plan = body_plan(
35 | frmt_structure(
36 | group_val = ".default",
37 | label_val = ".default",
38 | frmt("xx.x")
39 | )
40 | )
41 | )
42 | template_tfrmt |> print_mock_gt()
43 | ```
44 |
45 | We can pass this through `tfrmt_to_json` to convert to `JSON` metadata.
46 | ```{r}
47 | template_tfrmt |>
48 | tfrmt_to_json()
49 | ```
50 |
51 | This `JSON` can optionally be saved to a file by providing a file path as the second argument to the function:
52 |
53 | ```{r eval = FALSE}
54 | tfrmt(
55 | group = grp,
56 | label = label,
57 | column = column,
58 | param = param,
59 | value = value,
60 | body_plan = body_plan(
61 | frmt_structure(
62 | group_val = ".default",
63 | label_val = ".default",
64 | frmt("xx.x")
65 | )
66 | )
67 | ) |>
68 | tfrmt_to_json(path = "template.JSON")
69 | ```
70 |
71 |
72 | ## JSON to tfrmt
73 |
74 | If a `JSON` file already exists, users can import this into R.
75 |
76 | ```{r echo=FALSE}
77 | template_json <- tfrmt(
78 | group = grp,
79 | label = label,
80 | column = column,
81 | param = param,
82 | value = value,
83 | title = "mytitle",
84 | body_plan = body_plan(
85 | frmt_structure(
86 | group_val = ".default",
87 | label_val = ".default",
88 | frmt("xx.x")
89 | )
90 | )
91 | )
92 | ```
93 |
94 | ```{r eval = FALSE}
95 | template_json <- json_to_tfrmt(path = "template.JSON")
96 | ```
97 |
98 |
99 | Once available in the R session, users can optionally build on this template as needed.
100 | ```{r}
101 | template_json |>
102 | layer_tfrmt(
103 | tfrmt(title = "Custom title")
104 | ) |>
105 | print_mock_gt()
106 | ```
107 |
108 |
109 |
--------------------------------------------------------------------------------
/R/page_plan.R:
--------------------------------------------------------------------------------
1 | #' Page Plan
2 | #'
3 | #' Defining the location and/or frequency of page splits with a series of
4 | #' page_structure's and the row_every_n argument, respectively.
5 | #'
6 | #' @param ... a series of [page_structure()] separated by commas
7 | #' @param note_loc Location of the note describing each table's subset value(s).
8 | #' Useful if the `page_structure` contains only ".default" values (meaning the
9 | #' table is split by every unique level of a grouping variable), and that
10 | #' variable is dropped in the col_plan. `preheader` only available for rtf output.
11 | #' @param max_rows Option to set a maximum number of rows per page. Takes a numeric value.
12 | #'
13 | #' @return page_plan object
14 | #' @export
15 | #'
16 | #' @examples
17 | #' # use of page_struct
18 | #' page_plan(
19 | #' page_structure(group_val = "grp1", label_val = "lbl1")
20 | #' )
21 | #'
22 | #' # use of # rows
23 | #' page_plan(
24 | #' max_rows = 5
25 | #' )
26 | #'
27 | #'
28 | page_plan <- function(...,
29 | note_loc = c("noprint","preheader","subtitle","source_note"),
30 | max_rows = NULL){
31 |
32 | page_structure_list <- list(...)
33 | note_loc <- match.arg(note_loc)
34 |
35 | structure(
36 | list(struct_list = page_structure_list, note_loc=note_loc, max_rows=max_rows),
37 | class = c("page_plan", "plan")
38 | )
39 | }
40 |
41 | #' Page structure
42 | #'
43 | #' @param group_val string or a named list of strings which represent the value of group to split after.
44 | #' Set to ".default" if the split should occur after every unique value of the variable.
45 | #' @param label_val string which represents the value of label to split after.
46 | #' Set to ".default" if the split should occur after every unique value of
47 | #' the variable.
48 |
49 | #'
50 | #' @return page structure object
51 | #' @export
52 | #'
53 | #' @examples
54 | #' # split page after every unique level of the grouping variable
55 | #' page_structure(group_val = ".default", label_val = NULL)
56 | #'
57 | #' # split page after specific levels
58 | #' page_structure(group_val = "grp1", label_val = "lbl3")
59 | page_structure <- function(group_val = NULL, label_val = NULL){
60 |
61 |
62 | if(length(group_val)>1 && is.list(group_val)==FALSE && !is.null(names(group_val))){
63 | group_val <- as.list(group_val)
64 | }else if(length(group_val)==1 && !is.null(names(group_val))){
65 | group_val<-as.list(group_val)
66 | }
67 |
68 |
69 | if(is.list(group_val)){
70 | group_val_names <- names(group_val)
71 | if(is.null(group_val_names)){
72 | stop("when group_val is a list, must be a named list")
73 | }else if(any(group_val_names == "")){
74 | stop("when group_val is a list, each entry must be named")
75 | }
76 | }
77 |
78 | structure(
79 | list(
80 | group_val = group_val,
81 | label_val = label_val),
82 | class = c("page_structure","structure")
83 | )
84 |
85 | }
86 |
--------------------------------------------------------------------------------
/tests/testthat/test-expr_to_filter.R:
--------------------------------------------------------------------------------
1 | test_that("expr_to_filter - quosure", {
2 |
3 | var <- "value1"
4 | default <- ".default"
5 | quo_val <- quo(col)
6 |
7 | filter_var <- expr_to_filter.quosure(cols = quo_val, val = var)
8 | filter_default <- expr_to_filter.quosure(cols = quo_val, val = default)
9 |
10 | expect_equal(filter_var, "`col` %in% c(\"value1\")")
11 | expect_equal(filter_default, "TRUE")
12 |
13 | })
14 |
15 |
16 | test_that("expr_to_filter - quosures", {
17 |
18 | var <- "value1"
19 | default <- ".default"
20 | var_list_named <- list(col1 = "value1", col2 = "value2")
21 | var_list_default <- list(col1 = ".default", col2 = "value2")
22 | var_list_misnamed <- list(col1 = ".default", col12 = "value2")
23 | var_list_missing <- list(col2 = "value2")
24 | quos_val_1 <- vars(col1)
25 | quos_val_2 <- vars(col1,col2)
26 |
27 | ## length 1 vars = length one var
28 | filter_var <- expr_to_filter.quosures(cols = quos_val_1, val = var)
29 | filter_default <- expr_to_filter.quosures(cols = quos_val_1, val = default)
30 |
31 | expect_equal(filter_var, "`col1` %in% c(\"value1\")")
32 | expect_equal(filter_default, "TRUE")
33 |
34 | ## length 2 vars & length one var
35 |
36 | ### Must be a list
37 | expect_error(
38 | expr_to_filter.quosures(cols = quos_val_2, val = var),
39 | "If multiple cols are provided, val must be a named list",
40 | fixed = TRUE
41 | )
42 |
43 | ### .default is allowed
44 | expect_equal(
45 | expr_to_filter.quosures(cols = quos_val_2, val = default),
46 | "TRUE"
47 | )
48 |
49 | ## length 2 vars & length two var
50 | filter_var_list_named <- expr_to_filter.quosures(cols = quos_val_2, val = var_list_named)
51 | filter_var_list_default <- expr_to_filter.quosures(cols = quos_val_2, val = var_list_default)
52 |
53 | expect_equal(filter_var_list_named, "`col1` %in% c(\"value1\") & `col2` %in% c(\"value2\")")
54 | expect_equal(filter_var_list_default, "TRUE & `col2` %in% c(\"value2\")")
55 |
56 | ## length 2 vars & length two var incorrect names
57 | expect_error(
58 | expr_to_filter.quosures(cols = quos_val_2, val = var_list_misnamed),
59 | "Names of val entries do not all match col values",
60 | fixed = TRUE
61 | )
62 |
63 |
64 |
65 | })
66 |
67 | test_that("expr_to_filter - quosure - with quotes", {
68 |
69 | quo_val <- quo(col)
70 |
71 | var <- "value1's"
72 | filter_var <- expr_to_filter.quosure(cols = quo_val, val = var)
73 | expect_equal(filter_var, "`col` %in% c(\"value1's\")")
74 |
75 | var <- 'value1\'s'
76 | filter_var <- expr_to_filter.quosure(cols = quo_val, val = var)
77 | expect_equal(filter_var, "`col` %in% c(\"value1's\")")
78 |
79 | var <- '"a value with quotes"'
80 | filter_var <- expr_to_filter.quosure(cols = quo_val, val = var)
81 | expect_equal(filter_var, "`col` %in% c(\"\\\"a value with quotes\\\"\")")
82 |
83 | var <- "\"a value with quotes\""
84 | filter_var <- expr_to_filter.quosure(cols = quo_val, val = var)
85 | expect_equal(filter_var, "`col` %in% c(\"\\\"a value with quotes\\\"\")")
86 | })
87 |
88 |
--------------------------------------------------------------------------------
/vignettes/unusual_tables.Rmd:
--------------------------------------------------------------------------------
1 | ---
2 | title: "Unusual Tables"
3 | output: rmarkdown::html_vignette
4 | vignette: >
5 | %\VignetteIndexEntry{Unusual Tables}
6 | %\VignetteEngine{knitr::rmarkdown}
7 | %\VignetteEncoding{UTF-8}
8 | ---
9 |
10 | ```{r, include = FALSE}
11 | knitr::opts_chunk$set(
12 | collapse = TRUE,
13 | comment = "#>"
14 | )
15 | ```
16 |
17 | ```{r setup, message=FALSE,warning=FALSE}
18 | library(tfrmt)
19 | ```
20 |
21 |
22 | # Multiple columns of Row Labels
23 |
24 | It is not all that unusual for listings (and some tables) to have multiple row label columns. When this happens, it is often easier to avoid using gt's out-of-the box stub functions/formatting. An example of a table like this is the "Summary of Number of Subjects by Site" from the CDISC pilot.
25 | 
26 |
27 | To make this table the values will be long with "Pooled Id" and "Site Id" in their own columns, as if they were group or label variables. We also will need a column for the parameters even though they are all the same.
28 |
29 | ```{r}
30 | data <- tibble::tribble(
31 | ~`Pooled Id`, ~`Site Id`,
32 | "701", "701",
33 | "703", "703",
34 | "704", "704",
35 | "705", "705",
36 | "708", "708",
37 | "709", "709",
38 | "710", "710",
39 | "713", "713",
40 | "716", "716",
41 | "718", "718",
42 | "900", "702",
43 | "900", "706",
44 | "900", "707",
45 | "900", "711",
46 | "900", "714",
47 | "900", "715",
48 | "900", "717",
49 | "Total", " "
50 | ) |>
51 | tidyr::crossing(
52 | col1 = c(
53 | "Placebo (N=86)",
54 | "Xanomeline Low Dose (N=84)",
55 | "Xanomeline High Dose (N=84)",
56 | "Total (N=254)"
57 | ),
58 | col2 = factor(c("ITT", "Eff", "Com"), levels = c("ITT", "Eff", "Com"))
59 | ) |>
60 | dplyr::mutate(
61 | val = rpois(216, 15), # Here I am just faking the data for display purposes
62 | param = "val"
63 | )
64 | ```
65 |
66 | Once we have the data in the standard ARD format we can make the `tfrmt`. What makes this `tfrmt` different is we won't include group or label, and our two ID columns will be displayed as regular columns. This also means that all columns of the table, including the ID columns, can be ordered via the `col_plan()`. Because the `col_plan()` follows the conventions of `select()` we can't specify the order of the highest level spanning columns and the lower level columns. But, `tfrmt` respects the order things are put in, which is why we used a factor for the populations.
67 | ```{r}
68 | tfrmt(
69 | param = "param",
70 | value = "val",
71 | column = vars(col1, col2),
72 | body_plan = body_plan(
73 | frmt_structure(group_val = ".default", label_val = ".default", frmt("XX"))
74 | ),
75 | row_grp_plan = row_grp_plan(label_loc = element_row_grp_loc("column")),
76 | col_plan = col_plan(
77 | `Pooled Id`, `Site Id`,
78 | contains("Placebo"),
79 | contains("High Dose"),
80 | contains("Low Dose"),
81 | everything()
82 | )
83 | ) |>
84 | print_to_gt(data)
85 | ```
86 |
87 |
--------------------------------------------------------------------------------
/tests/testthat/_snaps/big_n.md:
--------------------------------------------------------------------------------
1 | # big Ns constant by page
2 |
3 | Code
4 | auto <- apply_tfrmt(.data = data, tfrmt = mytfrmt, mock = FALSE)
5 | Message
6 | Mismatch between big Ns and page_plan. For varying big N's by page (`by_page` = TRUE in `big_n_structure`), data must contain 1 big N value per unique grouping variable/value set to ".default" in `page_plan` and bigNs must be in order of the data
7 |
8 | ---
9 |
10 | The following columns have multiple Big N's associated with them:
11 | c("Placebo", "Total", "Treatment")
12 |
13 | # not enough big Ns by page
14 |
15 | Code
16 | apply_tfrmt(.data = data, tfrmt = mytfrmt, mock = FALSE)
17 | Message
18 | Mismatch between big Ns and page_plan. For varying big N's by page (`by_page` = TRUE in `big_n_structure`), data must contain 1 big N value per unique grouping variable/value set to ".default" in `page_plan` and bigNs must be in order of the data
19 | Output
20 | [[1]]
21 | # A tibble: 3 x 5
22 | Label `Placebo\nN = 12` `Treatment\nN = 14` `Total\nN = 31`
23 | *
"`
24 | #' }}
25 | #'
26 | #' @importFrom rlang parse_expr
27 | tfrmt_n_pct <- function(n = "n",
28 | pct = "pct",
29 | pct_frmt_when = frmt_when("==100"~ frmt(""),
30 | ">99"~ frmt("(>99%)"),
31 | "==0"~ "",
32 | "<1" ~ frmt("(<1%)"),
33 | "TRUE" ~ frmt("(xx.x%)")),
34 | tfrmt_obj = NULL){
35 | if(is.null(n)|is.na(n)|n==""){
36 | stop("`n` value must be provided")
37 | }
38 | if(is.null(pct)|is.na(pct)|pct==""){
39 | stop("`pct` value must be provided")
40 | }
41 |
42 | combo <- paste0(
43 | "frmt_combine('{",
44 | n,
45 | "} {", pct, "}',",
46 | n, "=frmt('x'),",
47 | pct, "=pct_frmt_when)"
48 | ) %>%
49 | parse_expr() %>% eval()
50 |
51 | if(!is.null(tfrmt_obj)){
52 | ae_tbl <- tfrmt(
53 | body_plan = body_plan(
54 | frmt_structure(
55 | group_val = ".default", label_val = ".default",
56 | combo
57 | )
58 | )
59 | )
60 | ae_tbl <- layer_tfrmt(x = tfrmt_obj, y = ae_tbl)
61 | } else {
62 | ae_tbl <- tfrmt(
63 | param = "param",
64 | label = "row_label1",
65 | column = "col1",
66 | value = "value",
67 | body_plan = body_plan(
68 | frmt_structure(
69 | group_val = ".default", label_val = ".default",
70 | combo
71 | )
72 | )
73 | )
74 | }
75 | ae_tbl
76 | }
77 |
--------------------------------------------------------------------------------
/tests/testthat/test-tfrmt_n_pct.R:
--------------------------------------------------------------------------------
1 | test_that("tfrmt_n_pct", {
2 |
3 | # format to avoid issues with the environment
4 | expect_equal(format(tfrmt_n_pct()$body_plan),
5 | body_plan(
6 | frmt_structure(
7 | group_val = ".default", label_val = ".default",
8 | frmt_combine("{n} {pct}", n = frmt("xxx"),
9 | pct = frmt_when("==100"~ frmt(""),
10 | ">99"~ frmt("(>99%)"),
11 | "==0"~ "",
12 | "<1" ~ frmt("(<1%)"),
13 | "TRUE" ~ frmt("(xx.x%)")))
14 | )
15 | ) %>% format()
16 | )
17 | # See that it can change when n is changed
18 | expect_equal(format(tfrmt_n_pct("n_distinct")$body_plan),
19 | body_plan(
20 | frmt_structure(
21 | group_val = ".default", label_val = ".default",
22 | frmt_combine("{n_distinct} {pct}", n_distinct = frmt("xxx"),
23 | pct = frmt_when("==100"~ frmt(""),
24 | ">99"~ frmt("(>99%)"),
25 | "==0"~ "",
26 | "<1" ~ frmt("(<1%)"),
27 | "TRUE" ~ frmt("(xx.x%)")))
28 | )
29 | ) %>% format()
30 | )
31 | # Change the frmt_when
32 | expect_equal(format(tfrmt_n_pct(pct_frmt_when =
33 | frmt_when(
34 | "==100" ~ "",
35 | "==0" ~ "",
36 | TRUE ~ frmt("(xx.x %)")
37 | ))$body_plan),
38 | body_plan(
39 | frmt_structure(
40 | group_val = ".default", label_val = ".default",
41 | frmt_combine("{n} {pct}", n = frmt("xxx"),
42 | pct = frmt_when(
43 | "==100" ~ "",
44 | "==0" ~ "",
45 | TRUE ~ frmt("(xx.x %)")
46 | ))
47 | )
48 | ) %>% format()
49 | )
50 |
51 | # layer with existing tfrmt
52 | test <- tfrmt(
53 | column = column
54 | )
55 | expect_equal(tfrmt_n_pct(tfrmt_obj = test)$column[[1]] %>%
56 | as_label(),
57 | "column")
58 |
59 | expect_error(tfrmt_n_pct(n = ""))
60 | expect_error(tfrmt_n_pct(pct = NULL))
61 |
62 | })
63 |
64 |
--------------------------------------------------------------------------------
/.github/workflows/pr-commands.yaml:
--------------------------------------------------------------------------------
1 | # Workflow derived from https://github.com/r-lib/actions/tree/v2/examples
2 | # Need help debugging build failures? Start at https://github.com/r-lib/actions#where-to-find-help
3 | on:
4 | issue_comment:
5 | types: [created]
6 |
7 | name: Commands
8 |
9 | jobs:
10 | document:
11 | if: ${{ github.event.issue.pull_request && (github.event.comment.author_association == 'MEMBER' || github.event.comment.author_association == 'OWNER') && startsWith(github.event.comment.body, '/document') }}
12 | name: document
13 | runs-on: ubuntu-latest
14 | env:
15 | GITHUB_PAT: ${{ secrets.GITHUB_TOKEN }}
16 | steps:
17 | - uses: actions/checkout@v4
18 |
19 | - uses: r-lib/actions/pr-fetch@v2
20 | with:
21 | repo-token: ${{ secrets.GITHUB_TOKEN }}
22 |
23 | - uses: r-lib/actions/setup-r@v2
24 | with:
25 | use-public-rspm: true
26 |
27 | - uses: r-lib/actions/setup-r-dependencies@v2
28 | with:
29 | extra-packages: any::roxygen2
30 | needs: pr-document
31 |
32 | - name: Document
33 | run: roxygen2::roxygenise()
34 | shell: Rscript {0}
35 |
36 | - name: commit
37 | run: |
38 | git config --local user.name "$GITHUB_ACTOR"
39 | git config --local user.email "$GITHUB_ACTOR@users.noreply.github.com"
40 | git add man/\* NAMESPACE
41 | git commit -m 'Document'
42 |
43 | - uses: r-lib/actions/pr-push@v2
44 | with:
45 | repo-token: ${{ secrets.GITHUB_TOKEN }}
46 |
47 | style:
48 | if: ${{ github.event.issue.pull_request && (github.event.comment.author_association == 'MEMBER' || github.event.comment.author_association == 'OWNER') && startsWith(github.event.comment.body, '/style') }}
49 | name: style
50 | runs-on: ubuntu-latest
51 | env:
52 | GITHUB_PAT: ${{ secrets.GITHUB_TOKEN }}
53 | steps:
54 | - uses: actions/checkout@v4
55 |
56 | - uses: r-lib/actions/pr-fetch@v2
57 | with:
58 | repo-token: ${{ secrets.GITHUB_TOKEN }}
59 |
60 | - uses: r-lib/actions/setup-r@v2
61 |
62 | - name: Install dependencies
63 | run: install.packages("styler")
64 | shell: Rscript {0}
65 |
66 | - name: Style
67 | run: styler::style_pkg()
68 | shell: Rscript {0}
69 |
70 | - name: commit
71 | run: |
72 | git config --local user.name "$GITHUB_ACTOR"
73 | git config --local user.email "$GITHUB_ACTOR@users.noreply.github.com"
74 | git add \*.R
75 | git commit -m 'Style'
76 |
77 | - uses: r-lib/actions/pr-push@v2
78 | with:
79 | repo-token: ${{ secrets.GITHUB_TOKEN }}
80 |
--------------------------------------------------------------------------------
/R/data.R:
--------------------------------------------------------------------------------
1 | #' Demography Analysis Results Data
2 | #'
3 | #' A dataset containing the results needed for a demography table. Using the
4 | #' CDISC pilot data.
5 | #'
6 | #' @format A data frame with 386 rows and 7 variables:
7 | #' \describe{
8 | #' \item{rowlbl1}{highest level row labels}
9 | #' \item{rowlbl2}{more specific row labels}
10 | #' \item{param}{parameter to explain each value}
11 | #' \item{grp}{grouping column used to distinguish continuous and categorical}
12 | #' \item{ord1}{controls ordering}
13 | #' \item{ord2}{more ordering controls}
14 | #' \item{column}{column names}
15 | #' \item{value}{values to put in a table}
16 | #' }
17 | "data_demog"
18 |
19 |
20 | #' Adverse Events Analysis Results Data
21 | #'
22 | #' A dataset containing the results needed for an AE table. Using the
23 | #' CDISC pilot data.
24 | #'
25 | #' @format A data frame with 2,794 rows and 8 variables:
26 | #' \describe{
27 | #' \item{AEBODSYS}{highest level row labels: System Organ Class}
28 | #' \item{AETERM}{more specific row labels: Preferred Term}
29 | #' \item{col2}{higher level column names (spanners)}
30 | #' \item{col1}{lower level column names}
31 | #' \item{param}{parameter to explain each value}
32 | #' \item{value}{values to put in a table}
33 | #' \item{ord1}{controls ordering}
34 | #' \item{ord2}{more ordering controls}
35 | #' }
36 | "data_ae"
37 |
38 | #' Efficacy Analysis Results Data
39 | #'
40 | #' A dataset containing the results needed for an Efficacy table. Using the
41 | #' CDISC pilot data for ADAS-Cog(11).
42 | #'
43 | #' @format A data frame with 70 rows and 7 variables:
44 | #' \describe{
45 | #' \item{group}{highest level row labels}
46 | #' \item{label}{more specific row labels}
47 | #' \item{column}{column names}
48 | #' \item{param}{parameter to explain each value}
49 | #' \item{value}{values to put in a table}
50 | #' \item{ord1}{controls ordering}
51 | #' \item{ord2}{more ordering controls}
52 | #' }
53 | "data_efficacy"
54 |
55 |
56 | #' Labs Analysis Results Data
57 | #'
58 | #' A dataset containing the results needed for an labs results table. Using the
59 | #' CDISC pilot data.
60 | #'
61 | #' @format A data frame with 4,950 rows and 7 variables:
62 | #' \describe{
63 | #' \item{group1}{highest level row labels: Lab value class}
64 | #' \item{group2}{more specific row labels: Lab parameter}
65 | #' \item{rowlbl}{most specific row labels: Study visit}
66 | #' \item{col1}{higher level column names (spanners)}
67 | #' \item{col2}{lower level column names}
68 | #' \item{param}{parameter to explain each value}
69 | #' \item{value}{values to put in a table}
70 | #' \item{ord1}{controls ordering}
71 | #' \item{ord2}{more ordering controls}
72 | #' \item{ord3}{more ordering controls}
73 | #' }
74 | "data_labs"
75 |
--------------------------------------------------------------------------------
/vignettes/json.Rmd:
--------------------------------------------------------------------------------
1 | ---
2 | title: "JSON metadata"
3 | output: rmarkdown::html_vignette
4 | vignette: >
5 | %\VignetteIndexEntry{JSON metadata}
6 | %\VignetteEngine{knitr::rmarkdown}
7 | %\VignetteEncoding{UTF-8}
8 | ---
9 |
10 | ```{r, include = FALSE}
11 | knitr::opts_chunk$set(
12 | collapse = TRUE,
13 | comment = "#>"
14 | )
15 | ```
16 |
17 | ```{r setup, message = FALSE, warning = FALSE}
18 | library(tfrmt)
19 | ```
20 |
21 | Aside from R code, `tfrmt` objects can be represented as machine-readable metadata in `JSON` format. This enables users to save formatting metadata to a database, or alternatively import templates stored as `JSON` files. There are several utilities available for seamless translation between `tfrmt` and `JSON`.
22 |
23 | ## tfrmt to JSON
24 |
25 | A `tfrmt` object can be converted to `JSON` using the `tfrmt_to_json` function. Suppose we have a basic `tfrmt`:
26 |
27 | ```{r}
28 | template_tfrmt <- tfrmt(
29 | group = grp,
30 | label = label,
31 | column = column,
32 | param = param,
33 | value = value,
34 | body_plan = body_plan(
35 | frmt_structure(
36 | group_val = ".default",
37 | label_val = ".default",
38 | frmt("xx.x")
39 | )
40 | )
41 | )
42 | template_tfrmt |> print_mock_gt()
43 | ```
44 |
45 | We can pass this through `tfrmt_to_json` to convert to `JSON` metadata.
46 | ```{r}
47 | template_tfrmt |>
48 | tfrmt_to_json()
49 | ```
50 |
51 | This `JSON` can optionally be saved to a file by providing a file path as the second argument to the function:
52 |
53 | ```{r eval = FALSE}
54 | tfrmt(
55 | group = grp,
56 | label = label,
57 | column = column,
58 | param = param,
59 | value = value,
60 | body_plan = body_plan(
61 | frmt_structure(
62 | group_val = ".default",
63 | label_val = ".default",
64 | frmt("xx.x")
65 | )
66 | )
67 | ) |>
68 | tfrmt_to_json(path = "template.JSON")
69 | ```
70 |
71 |
72 | ## JSON to tfrmt
73 |
74 | If a `JSON` file already exists, users can import this into R.
75 |
76 | ```{r echo=FALSE}
77 | template_json <- tfrmt(
78 | group = grp,
79 | label = label,
80 | column = column,
81 | param = param,
82 | value = value,
83 | title = "mytitle",
84 | body_plan = body_plan(
85 | frmt_structure(
86 | group_val = ".default",
87 | label_val = ".default",
88 | frmt("xx.x")
89 | )
90 | )
91 | )
92 | ```
93 |
94 | ```{r eval = FALSE}
95 | template_json <- json_to_tfrmt(path = "template.JSON")
96 | ```
97 |
98 |
99 | Once available in the R session, users can optionally build on this template as needed.
100 | ```{r}
101 | template_json |>
102 | layer_tfrmt(
103 | tfrmt(title = "Custom title")
104 | ) |>
105 | print_mock_gt()
106 | ```
107 |
108 |
109 |
--------------------------------------------------------------------------------
/R/page_plan.R:
--------------------------------------------------------------------------------
1 | #' Page Plan
2 | #'
3 | #' Defining the location and/or frequency of page splits with a series of
4 | #' page_structure's and the row_every_n argument, respectively.
5 | #'
6 | #' @param ... a series of [page_structure()] separated by commas
7 | #' @param note_loc Location of the note describing each table's subset value(s).
8 | #' Useful if the `page_structure` contains only ".default" values (meaning the
9 | #' table is split by every unique level of a grouping variable), and that
10 | #' variable is dropped in the col_plan. `preheader` only available for rtf output.
11 | #' @param max_rows Option to set a maximum number of rows per page. Takes a numeric value.
12 | #'
13 | #' @return page_plan object
14 | #' @export
15 | #'
16 | #' @examples
17 | #' # use of page_struct
18 | #' page_plan(
19 | #' page_structure(group_val = "grp1", label_val = "lbl1")
20 | #' )
21 | #'
22 | #' # use of # rows
23 | #' page_plan(
24 | #' max_rows = 5
25 | #' )
26 | #'
27 | #'
28 | page_plan <- function(...,
29 | note_loc = c("noprint","preheader","subtitle","source_note"),
30 | max_rows = NULL){
31 |
32 | page_structure_list <- list(...)
33 | note_loc <- match.arg(note_loc)
34 |
35 | structure(
36 | list(struct_list = page_structure_list, note_loc=note_loc, max_rows=max_rows),
37 | class = c("page_plan", "plan")
38 | )
39 | }
40 |
41 | #' Page structure
42 | #'
43 | #' @param group_val string or a named list of strings which represent the value of group to split after.
44 | #' Set to ".default" if the split should occur after every unique value of the variable.
45 | #' @param label_val string which represents the value of label to split after.
46 | #' Set to ".default" if the split should occur after every unique value of
47 | #' the variable.
48 |
49 | #'
50 | #' @return page structure object
51 | #' @export
52 | #'
53 | #' @examples
54 | #' # split page after every unique level of the grouping variable
55 | #' page_structure(group_val = ".default", label_val = NULL)
56 | #'
57 | #' # split page after specific levels
58 | #' page_structure(group_val = "grp1", label_val = "lbl3")
59 | page_structure <- function(group_val = NULL, label_val = NULL){
60 |
61 |
62 | if(length(group_val)>1 && is.list(group_val)==FALSE && !is.null(names(group_val))){
63 | group_val <- as.list(group_val)
64 | }else if(length(group_val)==1 && !is.null(names(group_val))){
65 | group_val<-as.list(group_val)
66 | }
67 |
68 |
69 | if(is.list(group_val)){
70 | group_val_names <- names(group_val)
71 | if(is.null(group_val_names)){
72 | stop("when group_val is a list, must be a named list")
73 | }else if(any(group_val_names == "")){
74 | stop("when group_val is a list, each entry must be named")
75 | }
76 | }
77 |
78 | structure(
79 | list(
80 | group_val = group_val,
81 | label_val = label_val),
82 | class = c("page_structure","structure")
83 | )
84 |
85 | }
86 |
--------------------------------------------------------------------------------
/tests/testthat/test-expr_to_filter.R:
--------------------------------------------------------------------------------
1 | test_that("expr_to_filter - quosure", {
2 |
3 | var <- "value1"
4 | default <- ".default"
5 | quo_val <- quo(col)
6 |
7 | filter_var <- expr_to_filter.quosure(cols = quo_val, val = var)
8 | filter_default <- expr_to_filter.quosure(cols = quo_val, val = default)
9 |
10 | expect_equal(filter_var, "`col` %in% c(\"value1\")")
11 | expect_equal(filter_default, "TRUE")
12 |
13 | })
14 |
15 |
16 | test_that("expr_to_filter - quosures", {
17 |
18 | var <- "value1"
19 | default <- ".default"
20 | var_list_named <- list(col1 = "value1", col2 = "value2")
21 | var_list_default <- list(col1 = ".default", col2 = "value2")
22 | var_list_misnamed <- list(col1 = ".default", col12 = "value2")
23 | var_list_missing <- list(col2 = "value2")
24 | quos_val_1 <- vars(col1)
25 | quos_val_2 <- vars(col1,col2)
26 |
27 | ## length 1 vars = length one var
28 | filter_var <- expr_to_filter.quosures(cols = quos_val_1, val = var)
29 | filter_default <- expr_to_filter.quosures(cols = quos_val_1, val = default)
30 |
31 | expect_equal(filter_var, "`col1` %in% c(\"value1\")")
32 | expect_equal(filter_default, "TRUE")
33 |
34 | ## length 2 vars & length one var
35 |
36 | ### Must be a list
37 | expect_error(
38 | expr_to_filter.quosures(cols = quos_val_2, val = var),
39 | "If multiple cols are provided, val must be a named list",
40 | fixed = TRUE
41 | )
42 |
43 | ### .default is allowed
44 | expect_equal(
45 | expr_to_filter.quosures(cols = quos_val_2, val = default),
46 | "TRUE"
47 | )
48 |
49 | ## length 2 vars & length two var
50 | filter_var_list_named <- expr_to_filter.quosures(cols = quos_val_2, val = var_list_named)
51 | filter_var_list_default <- expr_to_filter.quosures(cols = quos_val_2, val = var_list_default)
52 |
53 | expect_equal(filter_var_list_named, "`col1` %in% c(\"value1\") & `col2` %in% c(\"value2\")")
54 | expect_equal(filter_var_list_default, "TRUE & `col2` %in% c(\"value2\")")
55 |
56 | ## length 2 vars & length two var incorrect names
57 | expect_error(
58 | expr_to_filter.quosures(cols = quos_val_2, val = var_list_misnamed),
59 | "Names of val entries do not all match col values",
60 | fixed = TRUE
61 | )
62 |
63 |
64 |
65 | })
66 |
67 | test_that("expr_to_filter - quosure - with quotes", {
68 |
69 | quo_val <- quo(col)
70 |
71 | var <- "value1's"
72 | filter_var <- expr_to_filter.quosure(cols = quo_val, val = var)
73 | expect_equal(filter_var, "`col` %in% c(\"value1's\")")
74 |
75 | var <- 'value1\'s'
76 | filter_var <- expr_to_filter.quosure(cols = quo_val, val = var)
77 | expect_equal(filter_var, "`col` %in% c(\"value1's\")")
78 |
79 | var <- '"a value with quotes"'
80 | filter_var <- expr_to_filter.quosure(cols = quo_val, val = var)
81 | expect_equal(filter_var, "`col` %in% c(\"\\\"a value with quotes\\\"\")")
82 |
83 | var <- "\"a value with quotes\""
84 | filter_var <- expr_to_filter.quosure(cols = quo_val, val = var)
85 | expect_equal(filter_var, "`col` %in% c(\"\\\"a value with quotes\\\"\")")
86 | })
87 |
88 |
--------------------------------------------------------------------------------
/vignettes/unusual_tables.Rmd:
--------------------------------------------------------------------------------
1 | ---
2 | title: "Unusual Tables"
3 | output: rmarkdown::html_vignette
4 | vignette: >
5 | %\VignetteIndexEntry{Unusual Tables}
6 | %\VignetteEngine{knitr::rmarkdown}
7 | %\VignetteEncoding{UTF-8}
8 | ---
9 |
10 | ```{r, include = FALSE}
11 | knitr::opts_chunk$set(
12 | collapse = TRUE,
13 | comment = "#>"
14 | )
15 | ```
16 |
17 | ```{r setup, message=FALSE,warning=FALSE}
18 | library(tfrmt)
19 | ```
20 |
21 |
22 | # Multiple columns of Row Labels
23 |
24 | It is not all that unusual for listings (and some tables) to have multiple row label columns. When this happens, it is often easier to avoid using gt's out-of-the box stub functions/formatting. An example of a table like this is the "Summary of Number of Subjects by Site" from the CDISC pilot.
25 | 
26 |
27 | To make this table the values will be long with "Pooled Id" and "Site Id" in their own columns, as if they were group or label variables. We also will need a column for the parameters even though they are all the same.
28 |
29 | ```{r}
30 | data <- tibble::tribble(
31 | ~`Pooled Id`, ~`Site Id`,
32 | "701", "701",
33 | "703", "703",
34 | "704", "704",
35 | "705", "705",
36 | "708", "708",
37 | "709", "709",
38 | "710", "710",
39 | "713", "713",
40 | "716", "716",
41 | "718", "718",
42 | "900", "702",
43 | "900", "706",
44 | "900", "707",
45 | "900", "711",
46 | "900", "714",
47 | "900", "715",
48 | "900", "717",
49 | "Total", " "
50 | ) |>
51 | tidyr::crossing(
52 | col1 = c(
53 | "Placebo (N=86)",
54 | "Xanomeline Low Dose (N=84)",
55 | "Xanomeline High Dose (N=84)",
56 | "Total (N=254)"
57 | ),
58 | col2 = factor(c("ITT", "Eff", "Com"), levels = c("ITT", "Eff", "Com"))
59 | ) |>
60 | dplyr::mutate(
61 | val = rpois(216, 15), # Here I am just faking the data for display purposes
62 | param = "val"
63 | )
64 | ```
65 |
66 | Once we have the data in the standard ARD format we can make the `tfrmt`. What makes this `tfrmt` different is we won't include group or label, and our two ID columns will be displayed as regular columns. This also means that all columns of the table, including the ID columns, can be ordered via the `col_plan()`. Because the `col_plan()` follows the conventions of `select()` we can't specify the order of the highest level spanning columns and the lower level columns. But, `tfrmt` respects the order things are put in, which is why we used a factor for the populations.
67 | ```{r}
68 | tfrmt(
69 | param = "param",
70 | value = "val",
71 | column = vars(col1, col2),
72 | body_plan = body_plan(
73 | frmt_structure(group_val = ".default", label_val = ".default", frmt("XX"))
74 | ),
75 | row_grp_plan = row_grp_plan(label_loc = element_row_grp_loc("column")),
76 | col_plan = col_plan(
77 | `Pooled Id`, `Site Id`,
78 | contains("Placebo"),
79 | contains("High Dose"),
80 | contains("Low Dose"),
81 | everything()
82 | )
83 | ) |>
84 | print_to_gt(data)
85 | ```
86 |
87 |
--------------------------------------------------------------------------------
/tests/testthat/_snaps/big_n.md:
--------------------------------------------------------------------------------
1 | # big Ns constant by page
2 |
3 | Code
4 | auto <- apply_tfrmt(.data = data, tfrmt = mytfrmt, mock = FALSE)
5 | Message
6 | Mismatch between big Ns and page_plan. For varying big N's by page (`by_page` = TRUE in `big_n_structure`), data must contain 1 big N value per unique grouping variable/value set to ".default" in `page_plan` and bigNs must be in order of the data
7 |
8 | ---
9 |
10 | The following columns have multiple Big N's associated with them:
11 | c("Placebo", "Total", "Treatment")
12 |
13 | # not enough big Ns by page
14 |
15 | Code
16 | apply_tfrmt(.data = data, tfrmt = mytfrmt, mock = FALSE)
17 | Message
18 | Mismatch between big Ns and page_plan. For varying big N's by page (`by_page` = TRUE in `big_n_structure`), data must contain 1 big N value per unique grouping variable/value set to ".default" in `page_plan` and bigNs must be in order of the data
19 | Output
20 | [[1]]
21 | # A tibble: 3 x 5
22 | Label `Placebo\nN = 12` `Treatment\nN = 14` `Total\nN = 31`
23 | *  33 |
34 |
33 |
34 |  50 |
51 |
50 |
51 | 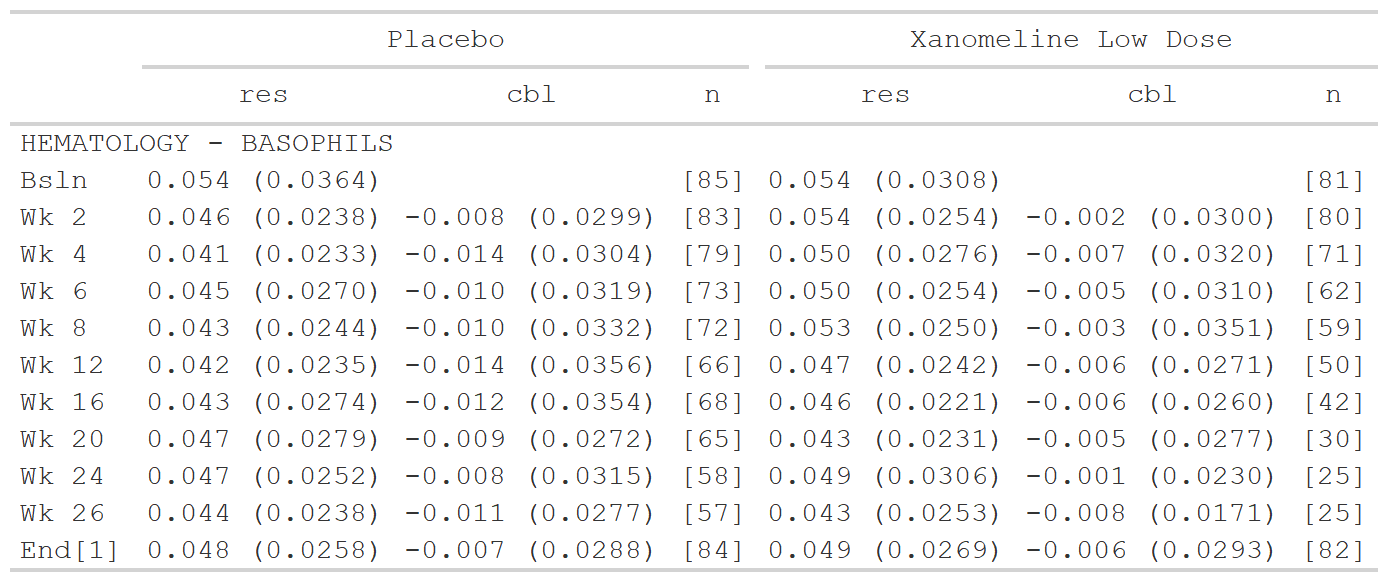 101 | }}
102 | }
103 |
104 |
--------------------------------------------------------------------------------
/inst/json_examples/tfrmt_demog.json:
--------------------------------------------------------------------------------
1 | {
2 | "group": ["rowlbl1", "grp"],
3 | "label": ["rowlbl2"],
4 | "param": ["param"],
5 | "value": ["value"],
6 | "column": ["column"],
7 | "row_grp_plan": {
8 | "struct_list": [
9 | {
10 | "group_val": [".default"],
11 | "block_to_apply": {
12 | "post_space": [" "],
13 | "fill": [true]
14 | }
15 | }
16 | ],
17 | "label_loc": {
18 | "location": ["column"],
19 | "indent": [" "]
20 | }
21 | },
22 | "body_plan": [
23 | {
24 | "group_val": [".default"],
25 | "label_val": [".default"],
26 | "param_val": ["n", "pct"],
27 | "frmt_combine": {
28 | "expression": ["{n} {pct}"],
29 | "frmt_ls": {
30 | "n": {
31 | "frmt": {
32 | "expression": ["xxx"],
33 | "missing": {},
34 | "scientific": {},
35 | "transform": {}
36 | }
37 | },
38 | "pct": {
39 | "frmt_when": {
40 | "frmt_ls": {
41 | "==100": [""],
42 | "==0": [""],
43 | "TRUE": {
44 | "frmt": {
45 | "expression": ["(xx.x %)"],
46 | "missing": {},
47 | "scientific": {},
48 | "transform": {}
49 | }
50 | }
51 | },
52 | "missing": {}
53 | }
54 | }
55 | },
56 | "missing": {}
57 | }
58 | },
59 | {
60 | "group_val": [".default"],
61 | "label_val": ["n"],
62 | "param_val": [".default"],
63 | "frmt": {
64 | "expression": ["xxx"],
65 | "missing": {},
66 | "scientific": {},
67 | "transform": {}
68 | }
69 | },
70 | {
71 | "group_val": [".default"],
72 | "label_val": ["Mean", "Median", "Min", "Max"],
73 | "param_val": [".default"],
74 | "frmt": {
75 | "expression": ["xxx.x"],
76 | "missing": {},
77 | "scientific": {},
78 | "transform": {}
79 | }
80 | },
81 | {
82 | "group_val": [".default"],
83 | "label_val": ["SD"],
84 | "param_val": [".default"],
85 | "frmt": {
86 | "expression": ["xxx.xx"],
87 | "missing": {},
88 | "scientific": {},
89 | "transform": {}
90 | }
91 | },
92 | {
93 | "group_val": [".default"],
94 | "label_val": [".default"],
95 | "param_val": ["p"],
96 | "frmt": {
97 | "expression": [""],
98 | "missing": {},
99 | "scientific": {},
100 | "transform": {}
101 | }
102 | },
103 | {
104 | "group_val": [".default"],
105 | "label_val": ["n", "<65 yrs", "<12 months", "<25"],
106 | "param_val": ["p"],
107 | "frmt_when": {
108 | "frmt_ls": {
109 | ">0.99": [">0.99"],
110 | "<0.001": ["<0.001"],
111 | "TRUE": {
112 | "frmt": {
113 | "expression": ["x.xxx"],
114 | "missing": [""],
115 | "scientific": {},
116 | "transform": {}
117 | }
118 | }
119 | },
120 | "missing": {}
121 | }
122 | }
123 | ],
124 | "col_style_plan": [
125 | {
126 | "cols": [
127 | ["Placebo"],
128 | ["Xanomeline Low Dose"],
129 | ["Xanomeline High Dose"],
130 | ["Total"],
131 | ["p-value"]
132 | ],
133 | "align": [".", ",", " "],
134 | "type": ["char"],
135 | "width": {}
136 | },
137 | {
138 | "cols": [
139 | ["rowlbl1"],
140 | ["rowlbl2"]
141 | ],
142 | "align": ["left"],
143 | "type": ["char"],
144 | "width": {}
145 | }
146 | ],
147 | "col_plan": {
148 | "col_plan": {
149 | "dots": [
150 | ["-grp"],
151 | ["-starts_with(\"ord\")"],
152 | ["rowlbl1"],
153 | ["rowlbl2"],
154 | ["Placebo"],
155 | ["Xanomeline Low Dose"],
156 | ["Xanomeline High Dose"],
157 | ["Total"],
158 | ["p-value"]
159 | ],
160 | ".drop": [false]
161 | }
162 | },
163 | "sorting_cols": ["ord1", "ord2"]
164 | }
165 |
--------------------------------------------------------------------------------
/R/footnote_plan.R:
--------------------------------------------------------------------------------
1 | #' Footnote Plan
2 | #'
3 | #' Defining the location and content of footnotes with a series of footnote
4 | #' structures. Each structure is a footnote and can be applied in multiple locations.
5 | #'
6 | #' @param ... a series of [footnote_structure()] separated by commas
7 | #' @param marks type of marks required for footnotes, properties inherited from
8 | #' tab_footnote in 'gt'. Available options are "numbers", "letters",
9 | #' "standard" and "extended" (standard for a traditional set of 4 symbols,
10 | #' extended for 6 symbols). The default option is set to "numbers".
11 | #'
12 | #' @return footnote plan object
13 | #' @export
14 | #'
15 | #' @examples
16 | #'
17 | #' # Adds a footnote indicated by letters rather than numbers to Group 1
18 | #' footnote_plan <- footnote_plan(
19 | #' footnote_structure(footnote_text = "Source Note", group_val = "Group 1"),
20 | #' marks="letters")
21 | #'
22 | #' # Adds a footnote to the 'Placebo' column
23 | #' footnote_plan <- footnote_plan(
24 | #' footnote_structure(footnote_text = "footnote", column_val = "Placebo"),
25 | #' marks="numbers")
26 | #'
27 | footnote_plan <- function(...,marks=c("numbers","letters","standard","extended")){
28 | footnote_structure_list <- list(...)
29 | marks = match.arg(marks)
30 |
31 | structure(
32 | list(struct_list=footnote_structure_list, marks=marks),
33 | class = c("footnote_plan", "plan")
34 | )
35 | }
36 |
37 | #' Footnote Structure
38 | #'
39 | #' @param footnote_text string with text for footnote
40 | #' @param column_val string or a named list of strings which represent the column to apply the footnote to
41 | #' @param group_val string or a named list of strings which represent the value of group to apply the footnote to
42 | #' @param label_val string which represents the value of label to apply the footnote to
43 | #'
44 | #' @return footnote structure object
45 | #' @export
46 | #'
47 | #' @examples
48 | #'
49 | #' # Adds a source note aka a footnote without a symbol in the table
50 | #' footnote_structure <- footnote_structure(footnote_text = "Source Note")
51 | #'
52 | #' # Adds a footnote to the 'Placebo' column
53 | #' footnote_structure <- footnote_structure(footnote_text = "Text",
54 | #' column_val = "Placebo")
55 | #'
56 | #' # Adds a footnote to either 'Placebo' or 'Treatment groups' depending on which
57 | #' # which is last to appear in the column vector
58 | #' footnote_structure <- footnote_structure(footnote_text = "Text",
59 | #' column_val = list(col1 = "Placebo", col2= "Treatment groups"))
60 | #'
61 | #' # Adds a footnote to the 'Adverse Event' label
62 | #' footnote_structure <- footnote_structure("Text", label_val = "Adverse Event")
63 | footnote_structure <- function(footnote_text, column_val = NULL, group_val = NULL, label_val = NULL){
64 |
65 | # force column_val and group_val into a list if a named vector
66 | if(length(column_val)>1 && is.list(column_val)==FALSE && !is.null(names(column_val))){
67 | column_val <- as.list(column_val)
68 | }else if(length(column_val)==1 && !is.null(names(column_val))){
69 | column_val<-as.list(column_val)
70 | }
71 |
72 | if(length(group_val)>1 && is.list(group_val)==FALSE && !is.null(names(group_val))){
73 | group_val <- as.list(group_val)
74 | }else if(length(group_val)==1 && !is.null(names(group_val))){
75 | group_val<-as.list(group_val)
76 | }
77 |
78 | # warnings if elements arent named
79 |
80 | if(is.list(column_val)){
81 | column_val_names <- names(column_val)
82 | if(is.null(column_val_names)){
83 | stop("when column_val is a list, must be a named list")
84 | }else if(any(column_val_names == "")){
85 | stop("when column_val is a list, each entry must be named")
86 | }
87 | }
88 |
89 | if(is.list(group_val)){
90 | group_val_names <- names(group_val)
91 | if(is.null(group_val_names)){
92 | stop("when group_val is a list, must be a named list")
93 | }else if(any(group_val_names == "")){
94 | stop("when group_val is a list, each entry must be named")
95 | }
96 | }
97 |
98 | structure(
99 | list(
100 | column_val = column_val,
101 | group_val = group_val,
102 | label_val = label_val,
103 | footnote_text = footnote_text),
104 | class = c("footnote_structure","structure")
105 | )
106 |
107 |
108 | }
109 |
--------------------------------------------------------------------------------
/man/frmt.Rd:
--------------------------------------------------------------------------------
1 | % Generated by roxygen2: do not edit by hand
2 | % Please edit documentation in R/frmt_plans.R
3 | \name{frmt}
4 | \alias{frmt}
5 | \alias{frmt_combine}
6 | \alias{frmt_when}
7 | \title{Table Value Formatting}
8 | \usage{
9 | frmt(expression, missing = NULL, scientific = NULL, transform = NULL, ...)
10 |
11 | frmt_combine(expression, ..., missing = NULL)
12 |
13 | frmt_when(..., missing = NULL)
14 | }
15 | \arguments{
16 | \item{expression}{this is the string representing the intended format. See details: expression for more a detailed description.}
17 |
18 | \item{missing}{when a value is missing that is intended to be formatted, what value to place. See details: missing for more a detailed description.}
19 |
20 | \item{scientific}{a string representing the intended scientific notation to be appended to the expression. Ex. "e^XX" or " x10^XX".}
21 |
22 | \item{transform}{this is what should happen to the value prior to formatting,
23 | It should be a formula or function. Ex. \code{~.*100}if you want to convert a
24 | percent from a decimal prior to rounding}
25 |
26 | \item{...}{See details: \code{...} for a detailed description.}
27 | }
28 | \value{
29 | frmt object
30 | }
31 | \description{
32 | These functions provide an abstracted way to approach to define formatting of table
33 | contents. By defining in this way, the formats can be
34 | layered to be more specific and general cell styling can be done first.
35 |
36 | \code{frmt()} is the base definition of a format. This defines spacing, rounding,
37 | and missing behaviour.
38 |
39 | \code{frmt_combine()} is used when two or more rows need to be combined into a
40 | single cell in the table. Each of the rows needs to have a defined \code{frmt()}
41 | and need to share a label.
42 |
43 | \code{frmt_when()} is used when a rows format behaviour is dependent on the value itself and is written similarly to \code{\link[dplyr:case_when]{dplyr::case_when()}}.
44 | The left hand side of the equation is a \code{"TRUE"}for the default case or the right hand side of a boolean expression \code{">50"}.
45 | }
46 | \details{
47 | \subsection{expression}{
48 | \itemize{
49 | \item \code{frmt()} All numbers are represented by "x". Any additional character are
50 | printed as-is. If additional X's present to the left of the decimal point
51 | than the value, they will be represented as spaces.
52 | \item \code{frmt_combine()} defines how the parameters will be combined as a
53 | \code{glue::glue()} statement. Parameters need to be equal to the values in the
54 | param column and defined in the expression as \code{"{param1} {param2}"}.
55 | }
56 | }
57 |
58 | \subsection{missing}{
59 | \itemize{
60 | \item \code{frmt()} Value to enter when the value is missing. When NULL, the value
61 | is "".
62 | \item \code{frmt_combine()} defines how when all values to be combined are missing.
63 | When NULL the value is "".
64 | }
65 | }
66 |
67 | \subsection{...}{
68 | \itemize{
69 | \item \code{frmt()} These dots are for future extensions and must be
70 | empty.
71 | \item \code{frmt_combine()} accepts named arguments defining the \code{frmt()} to
72 | be applied to which parameters before being combined.
73 | \item \code{frmt_when()}accepts a series of equations separated by commas, similar
74 | to \code{\link[dplyr:case_when]{dplyr::case_when()}}. The left hand side of the equation is a \code{"TRUE"}for the
75 | default case or the right hand side of a boolean expression \code{">50"}. The
76 | right hand side of the equation is the \code{frmt()} to apply when the left
77 | side evaluates to \code{TRUE}.
78 | }
79 | }
80 | }
81 | \examples{
82 |
83 | frmt("XXX \%")
84 |
85 | frmt("XX.XXX")
86 |
87 | frmt("xx.xx", scientific = "x10^xx")
88 |
89 | frmt_combine(
90 | "{param1} {param2}",
91 | param1 = frmt("XXX \%"),
92 | param2 = frmt("XX.XXX")
93 | )
94 |
95 | frmt_when(
96 | ">3" ~ frmt("(X.X\%)"),
97 | "<=3" ~ frmt("Undetectable")
98 | )
99 |
100 | frmt_when(
101 | "==100"~ frmt(""),
102 | "==0"~ "",
103 | "TRUE" ~ frmt("(XXX.X\%)")
104 | )
105 |
106 | }
107 | \seealso{
108 | \code{\link[=body_plan]{body_plan()}} combines the frmt_structures to be applied to the
109 | table body, and \code{\link[=frmt_structure]{frmt_structure()}} defines which rows the formats will be applied
110 | to.
111 |
112 | \href{https://gsk-biostatistics.github.io/tfrmt/articles/body_plan.html}{Link to related article}
113 | }
114 |
--------------------------------------------------------------------------------
/man/col_plan.Rd:
--------------------------------------------------------------------------------
1 | % Generated by roxygen2: do not edit by hand
2 | % Please edit documentation in R/col_plan.R
3 | \name{col_plan}
4 | \alias{col_plan}
5 | \alias{span_structure}
6 | \title{Define the Column Plan & Span Structures}
7 | \usage{
8 | col_plan(..., .drop = FALSE)
9 |
10 | span_structure(...)
11 | }
12 | \arguments{
13 | \item{...}{For a col_plan and span_structure,
14 | <\code{\link[dplyr:dplyr_tidy_select]{tidy-select}}> arguments, unquoted expressions
15 | separated by commas, and span_structures. span_structures must have the
16 | arguments named to match the name the column in the input data has to identify the correct columns. See the examples}
17 |
18 | \item{.drop}{Boolean. Should un-listed columns be dropped from the data.
19 | Defaults to FALSE.}
20 | }
21 | \value{
22 | col_plan object
23 |
24 | span_structure object
25 | }
26 | \description{
27 | Using <\code{\link[dplyr:dplyr_tidy_select]{tidy-select}}> expressions and a series
28 | span_structures, define the order of the columns. The selection follows "last
29 | selected" principals, meaning columns are moved to the \emph{last} selection as
30 | opposed to preserving the first location.
31 | }
32 | \details{
33 | \subsection{Column Selection}{
34 |
35 | When col_plan gets applied and is used to create the output table, the
36 | underlying logic sorts out which column specifically is being selected. If a column
37 | is selected twice, the \emph{last} instance in which the column is selected will be
38 | the location it gets rendered.
39 |
40 | Avoid beginning the \code{col_plan()} column selection with a deselection (i.e.
41 | \code{col_plan(-col1)}, \code{col_plan(-starts_with("value")))}. This will
42 | result in the table preserving all columns not "de-selected" in the
43 | statement, and the order of the columns not changed. It is preferred when
44 | creating the \code{col_plan()} to identify all the columns planned on
45 | preserving in the order they are wished to appear, or if
46 | <\code{\link[dplyr:dplyr_tidy_select]{tidy-select}}> arguments - such as
47 | \code{\link[dplyr]{everything}}- are used, identify the de-selection after
48 | the positive-selection.
49 |
50 | Alternatively, once the gt table is produced, use the
51 | \code{\link[gt]{cols_hide}} function to remove un-wanted columns.
52 | }
53 | }
54 | \section{Images}{
55 |
56 | Here are some example outputs:
57 |
58 | \if{html}{\out{
59 |
101 | }}
102 | }
103 |
104 |
--------------------------------------------------------------------------------
/inst/json_examples/tfrmt_demog.json:
--------------------------------------------------------------------------------
1 | {
2 | "group": ["rowlbl1", "grp"],
3 | "label": ["rowlbl2"],
4 | "param": ["param"],
5 | "value": ["value"],
6 | "column": ["column"],
7 | "row_grp_plan": {
8 | "struct_list": [
9 | {
10 | "group_val": [".default"],
11 | "block_to_apply": {
12 | "post_space": [" "],
13 | "fill": [true]
14 | }
15 | }
16 | ],
17 | "label_loc": {
18 | "location": ["column"],
19 | "indent": [" "]
20 | }
21 | },
22 | "body_plan": [
23 | {
24 | "group_val": [".default"],
25 | "label_val": [".default"],
26 | "param_val": ["n", "pct"],
27 | "frmt_combine": {
28 | "expression": ["{n} {pct}"],
29 | "frmt_ls": {
30 | "n": {
31 | "frmt": {
32 | "expression": ["xxx"],
33 | "missing": {},
34 | "scientific": {},
35 | "transform": {}
36 | }
37 | },
38 | "pct": {
39 | "frmt_when": {
40 | "frmt_ls": {
41 | "==100": [""],
42 | "==0": [""],
43 | "TRUE": {
44 | "frmt": {
45 | "expression": ["(xx.x %)"],
46 | "missing": {},
47 | "scientific": {},
48 | "transform": {}
49 | }
50 | }
51 | },
52 | "missing": {}
53 | }
54 | }
55 | },
56 | "missing": {}
57 | }
58 | },
59 | {
60 | "group_val": [".default"],
61 | "label_val": ["n"],
62 | "param_val": [".default"],
63 | "frmt": {
64 | "expression": ["xxx"],
65 | "missing": {},
66 | "scientific": {},
67 | "transform": {}
68 | }
69 | },
70 | {
71 | "group_val": [".default"],
72 | "label_val": ["Mean", "Median", "Min", "Max"],
73 | "param_val": [".default"],
74 | "frmt": {
75 | "expression": ["xxx.x"],
76 | "missing": {},
77 | "scientific": {},
78 | "transform": {}
79 | }
80 | },
81 | {
82 | "group_val": [".default"],
83 | "label_val": ["SD"],
84 | "param_val": [".default"],
85 | "frmt": {
86 | "expression": ["xxx.xx"],
87 | "missing": {},
88 | "scientific": {},
89 | "transform": {}
90 | }
91 | },
92 | {
93 | "group_val": [".default"],
94 | "label_val": [".default"],
95 | "param_val": ["p"],
96 | "frmt": {
97 | "expression": [""],
98 | "missing": {},
99 | "scientific": {},
100 | "transform": {}
101 | }
102 | },
103 | {
104 | "group_val": [".default"],
105 | "label_val": ["n", "<65 yrs", "<12 months", "<25"],
106 | "param_val": ["p"],
107 | "frmt_when": {
108 | "frmt_ls": {
109 | ">0.99": [">0.99"],
110 | "<0.001": ["<0.001"],
111 | "TRUE": {
112 | "frmt": {
113 | "expression": ["x.xxx"],
114 | "missing": [""],
115 | "scientific": {},
116 | "transform": {}
117 | }
118 | }
119 | },
120 | "missing": {}
121 | }
122 | }
123 | ],
124 | "col_style_plan": [
125 | {
126 | "cols": [
127 | ["Placebo"],
128 | ["Xanomeline Low Dose"],
129 | ["Xanomeline High Dose"],
130 | ["Total"],
131 | ["p-value"]
132 | ],
133 | "align": [".", ",", " "],
134 | "type": ["char"],
135 | "width": {}
136 | },
137 | {
138 | "cols": [
139 | ["rowlbl1"],
140 | ["rowlbl2"]
141 | ],
142 | "align": ["left"],
143 | "type": ["char"],
144 | "width": {}
145 | }
146 | ],
147 | "col_plan": {
148 | "col_plan": {
149 | "dots": [
150 | ["-grp"],
151 | ["-starts_with(\"ord\")"],
152 | ["rowlbl1"],
153 | ["rowlbl2"],
154 | ["Placebo"],
155 | ["Xanomeline Low Dose"],
156 | ["Xanomeline High Dose"],
157 | ["Total"],
158 | ["p-value"]
159 | ],
160 | ".drop": [false]
161 | }
162 | },
163 | "sorting_cols": ["ord1", "ord2"]
164 | }
165 |
--------------------------------------------------------------------------------
/R/footnote_plan.R:
--------------------------------------------------------------------------------
1 | #' Footnote Plan
2 | #'
3 | #' Defining the location and content of footnotes with a series of footnote
4 | #' structures. Each structure is a footnote and can be applied in multiple locations.
5 | #'
6 | #' @param ... a series of [footnote_structure()] separated by commas
7 | #' @param marks type of marks required for footnotes, properties inherited from
8 | #' tab_footnote in 'gt'. Available options are "numbers", "letters",
9 | #' "standard" and "extended" (standard for a traditional set of 4 symbols,
10 | #' extended for 6 symbols). The default option is set to "numbers".
11 | #'
12 | #' @return footnote plan object
13 | #' @export
14 | #'
15 | #' @examples
16 | #'
17 | #' # Adds a footnote indicated by letters rather than numbers to Group 1
18 | #' footnote_plan <- footnote_plan(
19 | #' footnote_structure(footnote_text = "Source Note", group_val = "Group 1"),
20 | #' marks="letters")
21 | #'
22 | #' # Adds a footnote to the 'Placebo' column
23 | #' footnote_plan <- footnote_plan(
24 | #' footnote_structure(footnote_text = "footnote", column_val = "Placebo"),
25 | #' marks="numbers")
26 | #'
27 | footnote_plan <- function(...,marks=c("numbers","letters","standard","extended")){
28 | footnote_structure_list <- list(...)
29 | marks = match.arg(marks)
30 |
31 | structure(
32 | list(struct_list=footnote_structure_list, marks=marks),
33 | class = c("footnote_plan", "plan")
34 | )
35 | }
36 |
37 | #' Footnote Structure
38 | #'
39 | #' @param footnote_text string with text for footnote
40 | #' @param column_val string or a named list of strings which represent the column to apply the footnote to
41 | #' @param group_val string or a named list of strings which represent the value of group to apply the footnote to
42 | #' @param label_val string which represents the value of label to apply the footnote to
43 | #'
44 | #' @return footnote structure object
45 | #' @export
46 | #'
47 | #' @examples
48 | #'
49 | #' # Adds a source note aka a footnote without a symbol in the table
50 | #' footnote_structure <- footnote_structure(footnote_text = "Source Note")
51 | #'
52 | #' # Adds a footnote to the 'Placebo' column
53 | #' footnote_structure <- footnote_structure(footnote_text = "Text",
54 | #' column_val = "Placebo")
55 | #'
56 | #' # Adds a footnote to either 'Placebo' or 'Treatment groups' depending on which
57 | #' # which is last to appear in the column vector
58 | #' footnote_structure <- footnote_structure(footnote_text = "Text",
59 | #' column_val = list(col1 = "Placebo", col2= "Treatment groups"))
60 | #'
61 | #' # Adds a footnote to the 'Adverse Event' label
62 | #' footnote_structure <- footnote_structure("Text", label_val = "Adverse Event")
63 | footnote_structure <- function(footnote_text, column_val = NULL, group_val = NULL, label_val = NULL){
64 |
65 | # force column_val and group_val into a list if a named vector
66 | if(length(column_val)>1 && is.list(column_val)==FALSE && !is.null(names(column_val))){
67 | column_val <- as.list(column_val)
68 | }else if(length(column_val)==1 && !is.null(names(column_val))){
69 | column_val<-as.list(column_val)
70 | }
71 |
72 | if(length(group_val)>1 && is.list(group_val)==FALSE && !is.null(names(group_val))){
73 | group_val <- as.list(group_val)
74 | }else if(length(group_val)==1 && !is.null(names(group_val))){
75 | group_val<-as.list(group_val)
76 | }
77 |
78 | # warnings if elements arent named
79 |
80 | if(is.list(column_val)){
81 | column_val_names <- names(column_val)
82 | if(is.null(column_val_names)){
83 | stop("when column_val is a list, must be a named list")
84 | }else if(any(column_val_names == "")){
85 | stop("when column_val is a list, each entry must be named")
86 | }
87 | }
88 |
89 | if(is.list(group_val)){
90 | group_val_names <- names(group_val)
91 | if(is.null(group_val_names)){
92 | stop("when group_val is a list, must be a named list")
93 | }else if(any(group_val_names == "")){
94 | stop("when group_val is a list, each entry must be named")
95 | }
96 | }
97 |
98 | structure(
99 | list(
100 | column_val = column_val,
101 | group_val = group_val,
102 | label_val = label_val,
103 | footnote_text = footnote_text),
104 | class = c("footnote_structure","structure")
105 | )
106 |
107 |
108 | }
109 |
--------------------------------------------------------------------------------
/man/frmt.Rd:
--------------------------------------------------------------------------------
1 | % Generated by roxygen2: do not edit by hand
2 | % Please edit documentation in R/frmt_plans.R
3 | \name{frmt}
4 | \alias{frmt}
5 | \alias{frmt_combine}
6 | \alias{frmt_when}
7 | \title{Table Value Formatting}
8 | \usage{
9 | frmt(expression, missing = NULL, scientific = NULL, transform = NULL, ...)
10 |
11 | frmt_combine(expression, ..., missing = NULL)
12 |
13 | frmt_when(..., missing = NULL)
14 | }
15 | \arguments{
16 | \item{expression}{this is the string representing the intended format. See details: expression for more a detailed description.}
17 |
18 | \item{missing}{when a value is missing that is intended to be formatted, what value to place. See details: missing for more a detailed description.}
19 |
20 | \item{scientific}{a string representing the intended scientific notation to be appended to the expression. Ex. "e^XX" or " x10^XX".}
21 |
22 | \item{transform}{this is what should happen to the value prior to formatting,
23 | It should be a formula or function. Ex. \code{~.*100}if you want to convert a
24 | percent from a decimal prior to rounding}
25 |
26 | \item{...}{See details: \code{...} for a detailed description.}
27 | }
28 | \value{
29 | frmt object
30 | }
31 | \description{
32 | These functions provide an abstracted way to approach to define formatting of table
33 | contents. By defining in this way, the formats can be
34 | layered to be more specific and general cell styling can be done first.
35 |
36 | \code{frmt()} is the base definition of a format. This defines spacing, rounding,
37 | and missing behaviour.
38 |
39 | \code{frmt_combine()} is used when two or more rows need to be combined into a
40 | single cell in the table. Each of the rows needs to have a defined \code{frmt()}
41 | and need to share a label.
42 |
43 | \code{frmt_when()} is used when a rows format behaviour is dependent on the value itself and is written similarly to \code{\link[dplyr:case_when]{dplyr::case_when()}}.
44 | The left hand side of the equation is a \code{"TRUE"}for the default case or the right hand side of a boolean expression \code{">50"}.
45 | }
46 | \details{
47 | \subsection{expression}{
48 | \itemize{
49 | \item \code{frmt()} All numbers are represented by "x". Any additional character are
50 | printed as-is. If additional X's present to the left of the decimal point
51 | than the value, they will be represented as spaces.
52 | \item \code{frmt_combine()} defines how the parameters will be combined as a
53 | \code{glue::glue()} statement. Parameters need to be equal to the values in the
54 | param column and defined in the expression as \code{"{param1} {param2}"}.
55 | }
56 | }
57 |
58 | \subsection{missing}{
59 | \itemize{
60 | \item \code{frmt()} Value to enter when the value is missing. When NULL, the value
61 | is "".
62 | \item \code{frmt_combine()} defines how when all values to be combined are missing.
63 | When NULL the value is "".
64 | }
65 | }
66 |
67 | \subsection{...}{
68 | \itemize{
69 | \item \code{frmt()} These dots are for future extensions and must be
70 | empty.
71 | \item \code{frmt_combine()} accepts named arguments defining the \code{frmt()} to
72 | be applied to which parameters before being combined.
73 | \item \code{frmt_when()}accepts a series of equations separated by commas, similar
74 | to \code{\link[dplyr:case_when]{dplyr::case_when()}}. The left hand side of the equation is a \code{"TRUE"}for the
75 | default case or the right hand side of a boolean expression \code{">50"}. The
76 | right hand side of the equation is the \code{frmt()} to apply when the left
77 | side evaluates to \code{TRUE}.
78 | }
79 | }
80 | }
81 | \examples{
82 |
83 | frmt("XXX \%")
84 |
85 | frmt("XX.XXX")
86 |
87 | frmt("xx.xx", scientific = "x10^xx")
88 |
89 | frmt_combine(
90 | "{param1} {param2}",
91 | param1 = frmt("XXX \%"),
92 | param2 = frmt("XX.XXX")
93 | )
94 |
95 | frmt_when(
96 | ">3" ~ frmt("(X.X\%)"),
97 | "<=3" ~ frmt("Undetectable")
98 | )
99 |
100 | frmt_when(
101 | "==100"~ frmt(""),
102 | "==0"~ "",
103 | "TRUE" ~ frmt("(XXX.X\%)")
104 | )
105 |
106 | }
107 | \seealso{
108 | \code{\link[=body_plan]{body_plan()}} combines the frmt_structures to be applied to the
109 | table body, and \code{\link[=frmt_structure]{frmt_structure()}} defines which rows the formats will be applied
110 | to.
111 |
112 | \href{https://gsk-biostatistics.github.io/tfrmt/articles/body_plan.html}{Link to related article}
113 | }
114 |
--------------------------------------------------------------------------------
/man/col_plan.Rd:
--------------------------------------------------------------------------------
1 | % Generated by roxygen2: do not edit by hand
2 | % Please edit documentation in R/col_plan.R
3 | \name{col_plan}
4 | \alias{col_plan}
5 | \alias{span_structure}
6 | \title{Define the Column Plan & Span Structures}
7 | \usage{
8 | col_plan(..., .drop = FALSE)
9 |
10 | span_structure(...)
11 | }
12 | \arguments{
13 | \item{...}{For a col_plan and span_structure,
14 | <\code{\link[dplyr:dplyr_tidy_select]{tidy-select}}> arguments, unquoted expressions
15 | separated by commas, and span_structures. span_structures must have the
16 | arguments named to match the name the column in the input data has to identify the correct columns. See the examples}
17 |
18 | \item{.drop}{Boolean. Should un-listed columns be dropped from the data.
19 | Defaults to FALSE.}
20 | }
21 | \value{
22 | col_plan object
23 |
24 | span_structure object
25 | }
26 | \description{
27 | Using <\code{\link[dplyr:dplyr_tidy_select]{tidy-select}}> expressions and a series
28 | span_structures, define the order of the columns. The selection follows "last
29 | selected" principals, meaning columns are moved to the \emph{last} selection as
30 | opposed to preserving the first location.
31 | }
32 | \details{
33 | \subsection{Column Selection}{
34 |
35 | When col_plan gets applied and is used to create the output table, the
36 | underlying logic sorts out which column specifically is being selected. If a column
37 | is selected twice, the \emph{last} instance in which the column is selected will be
38 | the location it gets rendered.
39 |
40 | Avoid beginning the \code{col_plan()} column selection with a deselection (i.e.
41 | \code{col_plan(-col1)}, \code{col_plan(-starts_with("value")))}. This will
42 | result in the table preserving all columns not "de-selected" in the
43 | statement, and the order of the columns not changed. It is preferred when
44 | creating the \code{col_plan()} to identify all the columns planned on
45 | preserving in the order they are wished to appear, or if
46 | <\code{\link[dplyr:dplyr_tidy_select]{tidy-select}}> arguments - such as
47 | \code{\link[dplyr]{everything}}- are used, identify the de-selection after
48 | the positive-selection.
49 |
50 | Alternatively, once the gt table is produced, use the
51 | \code{\link[gt]{cols_hide}} function to remove un-wanted columns.
52 | }
53 | }
54 | \section{Images}{
55 |
56 | Here are some example outputs:
57 |
58 | \if{html}{\out{
59 |  60 | }}
61 | }
62 |
63 | \examples{
64 |
65 | library(dplyr)
66 |
67 | ## select col_1 as the first column, remove col_last, then create spanning
68 | ## structures that have multiple levels
69 | ##
70 | ## examples also assume the tfrmt has the column argument set to c(c1, c2, c3)
71 | ##
72 | spanning_col_plan_ex <- col_plan(
73 | col_1,
74 | -col_last,
75 | span_structure(
76 | c1 = "Top Label Level 1",
77 | c2 = "Second Label Level 1.1",
78 | c3 = c(col_3, col_4)
79 | ),
80 | span_structure(
81 | c1 = "Top Label Level 1",
82 | c2 = "Second Label Level 1.2",
83 | c3 = starts_with("B")
84 | ),
85 | span_structure(
86 | c1 = "Top Label Level 1",
87 | c3 = col_5
88 | ),
89 | span_structure(
90 | c2 = "Top Label Level 2",
91 | c3 = c(col_6, col_7)
92 | )
93 | )
94 |
95 | ## select my_col_1 as the first column, then
96 | ## rename col_2 to new_col_1 and put as the
97 | ## second column, then select the rest of the columns
98 | renaming_col_plan_ex <- col_plan(
99 | my_col_1,
100 | new_col_1 = col_2,
101 | everything()
102 | )
103 |
104 | renaming_col_plan_ex2 <- col_plan(
105 | my_col_1,
106 | new_col_1 = col_2,
107 | span_structure(
108 | c1 = c(`My Favorite span name` = "Top Label Level 1"),
109 | c3 = c(`the results column` = col_5)
110 | )
111 | )
112 |
113 | ## To add a stub header rename the group variable in the column plan
114 | ## If multiple group variables exist, any of them can be renamed.
115 | ## If more than one is renamed, {tfrmt} will use the highest level group name available.
116 |
117 | renaming_group <- col_plan(
118 | my_grp = group, # rename group
119 | label,
120 | starts_with("col")
121 | )
122 |
123 | }
124 | \seealso{
125 | \href{https://gsk-biostatistics.github.io/tfrmt/articles/col_plan.html}{Link to related article}
126 | }
127 |
--------------------------------------------------------------------------------
/data-raw/create_data_efficacy.R:
--------------------------------------------------------------------------------
1 | # data for table 3.01
2 | # code adapted from Atorus cdisc pilot replication https://github.com/atorus-research/CDISC_pilot_replication/blob/master/programs/funcs.R
3 |
4 | library(dplyr)
5 | library(forcats)
6 | library(lme4)
7 | library(emmeans)
8 | library(broom)
9 | library(gt)
10 | library(tidyr)
11 |
12 | adas <- safetyData::adam_adqsadas %>%
13 | filter(EFFFL == "Y" & # efficacy population
14 | ITTFL == "Y" & # ITT population
15 | PARAMCD == 'ACTOT' & # ADAS-Cog(11) subscore
16 | ANL01FL == 'Y' # Analysis record flag 01
17 | ) %>%
18 | mutate(AVISIT = fct_reorder(AVISIT, AVISITN),
19 | TRTP = fct_reorder(TRTP, TRTPN)) %>%
20 | select(USUBJID, SITEGR1, SEX, TRTP, TRTPN, AVISIT, AVISITN, BASE, CHG, AVAL)
21 |
22 | ### 1. summary data
23 | summ_dat <- adas %>%
24 | select(USUBJID, AVISIT, TRTP, AVAL, CHG) %>%
25 | filter(AVISIT %in% c("Baseline","Week 24")) %>%
26 | group_by(AVISIT, TRTP) %>%
27 | summarise(across(c(AVAL,CHG), list(n = length, mean = mean, sd = sd, median = median, min = min, max = max))) %>%
28 | pivot_longer(-c(AVISIT, TRTP), names_to = "param", values_to = "value") %>%
29 | filter(!(AVISIT=="Baseline" & str_detect(param, "CHG"))) %>%
30 | separate(param, c("val", "param"), sep = "_") %>%
31 | mutate(label = case_when(
32 | param == "n" ~ "n",
33 | param %in% c("mean","sd") ~ "Mean (SD)",
34 | TRUE ~ "Median (Range)"
35 | ),
36 | AVISIT = as.character(AVISIT),
37 | AVISIT= ifelse(val=="CHG","Change from Baseline", AVISIT)) %>%
38 | rename(column = TRTP,
39 | group = AVISIT) %>%
40 | select(-val)
41 |
42 | ### 2. dose-response p-value
43 | adas2 <- adas %>% filter(AVISIT=="Week 24")
44 | mod2 <- lm(CHG ~ TRTPN + SITEGR1 + BASE, data=adas2)
45 | dose_resp_p <- tibble(param = "p.value",
46 | label = "p-value (Dose Response)",
47 | value = car::Anova(mod2, type=3)[2, 'Pr(>F)'],
48 | column = "Xanomeline High Dose",
49 | group = "p-value (Dose Response)")
50 |
51 | ### 3. emmeans results
52 | mod1 <- lm(CHG ~ TRTP + SITEGR1 + BASE, data=adas2)
53 | emm <- emmeans(mod1, ~TRTP, weights='proportional')
54 | emm_diff <- emm %>% contrast(method = "revpairwise", adjust = "none") %>% summary(infer = TRUE)
55 |
56 | # tidy up
57 | emm_diff_df <- emm_diff %>% as.data.frame() %>%
58 | select(TRTP = contrast, diff = estimate, diff_se = SE, diff_lcl = lower.CL, diff_ucl = upper.CL, p.value)
59 | efficacy_dat <- emm_diff_df %>%
60 | pivot_longer(-TRTP, names_to = "param", values_to = "value") %>%
61 | na.omit() %>%
62 | mutate(label = case_when(
63 | param %in% c("mean","se") ~ "LS Means (SE)",
64 | param %in% c("diff_lcl","diff_ucl") ~ "95% CI",
65 | param %in% c("diff", "diff_se") ~ "Diff of LS Means (SE)",
66 | param == "p.value" & TRTP=="Xanomeline High Dose - Xanomeline Low Dose" ~ "p-value (Xan High - Xan Low)",
67 | param == "p.value" & TRTP=="Xanomeline High Dose - Placebo" ~ "p-value (Xan - Placebo)",
68 | param == "p.value" & TRTP=="Xanomeline Low Dose - Placebo" ~ "p-value (Xan - Placebo)"),
69 | group = case_when(
70 | label=="LS Means (SE)" | str_detect(label, "p-value") ~ label,
71 | TRUE ~ NA_character_
72 | )
73 | ) %>%
74 | mutate(param_ord = as.numeric(factor(param, levels = c("mean","se","p.value","diff","diff_se", "diff_lcl","diff_ucl"))),
75 | column = str_extract(TRTP, "[^-]+") %>% trimws()) %>%
76 | arrange(TRTP, column, param_ord) %>%
77 | fill(group, .direction = "down") %>%
78 | select(-c(TRTP, param_ord)) %>%
79 | ungroup %>%
80 | select(group, label, column, param, value)
81 |
82 | # all combined
83 | data_efficacy <- summ_dat %>%
84 | bind_rows(dose_resp_p) %>%
85 | bind_rows(efficacy_dat) %>%
86 | select(group, label, column, param, value)%>%
87 | ungroup %>%
88 | mutate(ord1 = as.numeric(factor(group, levels = c("Baseline", "Week 24", "Change from Baseline", "p-value (Dose Response)","p-value (Xan - Placebo)","p-value (Xan High - Xan Low)"))),
89 | ord2 = case_when(
90 | param == "n" ~ 1,
91 | param %in% c("mean","se") ~ 2,
92 | param %in% c("median", "min", "max") ~ 3,
93 | param =="p.value" ~ 4,
94 | param %in% c("diff", "diff_se") ~ 5,
95 | TRUE ~ 6)) %>%
96 | arrange(ord1, ord2)
97 |
98 |
99 | usethis::use_data(data_efficacy, overwrite = TRUE)
100 |
101 |
--------------------------------------------------------------------------------
/R/theme_element.R:
--------------------------------------------------------------------------------
1 |
2 | #' Element Row Group Location
3 | #'
4 | #'
5 | #' @param location Location of the row group labels. Specifying 'indented'
6 | #' combines all group and label variables into a single column with each
7 | #' sub-group indented under its parent. 'spanning' and 'column' retain the
8 | #' highest level group variable in its own column and combine all remaining
9 | #' group and label variables into a single column with sub-groups indented. The
10 | #' highest level group column will either be printed as a spanning header or in
11 | #' its own column in the gt. The 'noprint' option allows the user to suppress
12 | #' group values from being printed. Finally, the 'gtdefault' option allows
13 | #' users to use the 'gt' defaults for styling multiple group columns.
14 | #' @param indent A string of the number of spaces you want to indent
15 | #'
16 | #' @seealso [row_grp_plan()] for more details on how to group row group
17 | #' structures, [row_grp_structure()] for more details on how to specify row
18 | #' group structures, [element_block()] for more details on how to specify
19 | #' spacing between each group.
20 | #'
21 | #' \href{https://gsk-biostatistics.github.io/tfrmt/articles/row_grp_plan.html}{Link
22 | #' to related article}
23 | #'
24 | #' @returns element_row_grp_loc object
25 | #' @export
26 | #' @examples
27 | #'
28 | #' tfrmt_spec <- tfrmt(
29 | #' group = c(grp1, grp2),
30 | #' label = label,
31 | #' param = param,
32 | #' value = value,
33 | #' column = column,
34 | #' row_grp_plan = row_grp_plan(label_loc = element_row_grp_loc(location = "noprint")),
35 | #' body_plan = body_plan(
36 | #' frmt_structure(group_val = ".default", label_val = ".default", frmt("xx"))
37 | #' )
38 | #' )
39 | #'
40 | #' @section Images: Here are some example outputs:
41 | #'
42 | #' \if{html}{\out{ `r "
60 | }}
61 | }
62 |
63 | \examples{
64 |
65 | library(dplyr)
66 |
67 | ## select col_1 as the first column, remove col_last, then create spanning
68 | ## structures that have multiple levels
69 | ##
70 | ## examples also assume the tfrmt has the column argument set to c(c1, c2, c3)
71 | ##
72 | spanning_col_plan_ex <- col_plan(
73 | col_1,
74 | -col_last,
75 | span_structure(
76 | c1 = "Top Label Level 1",
77 | c2 = "Second Label Level 1.1",
78 | c3 = c(col_3, col_4)
79 | ),
80 | span_structure(
81 | c1 = "Top Label Level 1",
82 | c2 = "Second Label Level 1.2",
83 | c3 = starts_with("B")
84 | ),
85 | span_structure(
86 | c1 = "Top Label Level 1",
87 | c3 = col_5
88 | ),
89 | span_structure(
90 | c2 = "Top Label Level 2",
91 | c3 = c(col_6, col_7)
92 | )
93 | )
94 |
95 | ## select my_col_1 as the first column, then
96 | ## rename col_2 to new_col_1 and put as the
97 | ## second column, then select the rest of the columns
98 | renaming_col_plan_ex <- col_plan(
99 | my_col_1,
100 | new_col_1 = col_2,
101 | everything()
102 | )
103 |
104 | renaming_col_plan_ex2 <- col_plan(
105 | my_col_1,
106 | new_col_1 = col_2,
107 | span_structure(
108 | c1 = c(`My Favorite span name` = "Top Label Level 1"),
109 | c3 = c(`the results column` = col_5)
110 | )
111 | )
112 |
113 | ## To add a stub header rename the group variable in the column plan
114 | ## If multiple group variables exist, any of them can be renamed.
115 | ## If more than one is renamed, {tfrmt} will use the highest level group name available.
116 |
117 | renaming_group <- col_plan(
118 | my_grp = group, # rename group
119 | label,
120 | starts_with("col")
121 | )
122 |
123 | }
124 | \seealso{
125 | \href{https://gsk-biostatistics.github.io/tfrmt/articles/col_plan.html}{Link to related article}
126 | }
127 |
--------------------------------------------------------------------------------
/data-raw/create_data_efficacy.R:
--------------------------------------------------------------------------------
1 | # data for table 3.01
2 | # code adapted from Atorus cdisc pilot replication https://github.com/atorus-research/CDISC_pilot_replication/blob/master/programs/funcs.R
3 |
4 | library(dplyr)
5 | library(forcats)
6 | library(lme4)
7 | library(emmeans)
8 | library(broom)
9 | library(gt)
10 | library(tidyr)
11 |
12 | adas <- safetyData::adam_adqsadas %>%
13 | filter(EFFFL == "Y" & # efficacy population
14 | ITTFL == "Y" & # ITT population
15 | PARAMCD == 'ACTOT' & # ADAS-Cog(11) subscore
16 | ANL01FL == 'Y' # Analysis record flag 01
17 | ) %>%
18 | mutate(AVISIT = fct_reorder(AVISIT, AVISITN),
19 | TRTP = fct_reorder(TRTP, TRTPN)) %>%
20 | select(USUBJID, SITEGR1, SEX, TRTP, TRTPN, AVISIT, AVISITN, BASE, CHG, AVAL)
21 |
22 | ### 1. summary data
23 | summ_dat <- adas %>%
24 | select(USUBJID, AVISIT, TRTP, AVAL, CHG) %>%
25 | filter(AVISIT %in% c("Baseline","Week 24")) %>%
26 | group_by(AVISIT, TRTP) %>%
27 | summarise(across(c(AVAL,CHG), list(n = length, mean = mean, sd = sd, median = median, min = min, max = max))) %>%
28 | pivot_longer(-c(AVISIT, TRTP), names_to = "param", values_to = "value") %>%
29 | filter(!(AVISIT=="Baseline" & str_detect(param, "CHG"))) %>%
30 | separate(param, c("val", "param"), sep = "_") %>%
31 | mutate(label = case_when(
32 | param == "n" ~ "n",
33 | param %in% c("mean","sd") ~ "Mean (SD)",
34 | TRUE ~ "Median (Range)"
35 | ),
36 | AVISIT = as.character(AVISIT),
37 | AVISIT= ifelse(val=="CHG","Change from Baseline", AVISIT)) %>%
38 | rename(column = TRTP,
39 | group = AVISIT) %>%
40 | select(-val)
41 |
42 | ### 2. dose-response p-value
43 | adas2 <- adas %>% filter(AVISIT=="Week 24")
44 | mod2 <- lm(CHG ~ TRTPN + SITEGR1 + BASE, data=adas2)
45 | dose_resp_p <- tibble(param = "p.value",
46 | label = "p-value (Dose Response)",
47 | value = car::Anova(mod2, type=3)[2, 'Pr(>F)'],
48 | column = "Xanomeline High Dose",
49 | group = "p-value (Dose Response)")
50 |
51 | ### 3. emmeans results
52 | mod1 <- lm(CHG ~ TRTP + SITEGR1 + BASE, data=adas2)
53 | emm <- emmeans(mod1, ~TRTP, weights='proportional')
54 | emm_diff <- emm %>% contrast(method = "revpairwise", adjust = "none") %>% summary(infer = TRUE)
55 |
56 | # tidy up
57 | emm_diff_df <- emm_diff %>% as.data.frame() %>%
58 | select(TRTP = contrast, diff = estimate, diff_se = SE, diff_lcl = lower.CL, diff_ucl = upper.CL, p.value)
59 | efficacy_dat <- emm_diff_df %>%
60 | pivot_longer(-TRTP, names_to = "param", values_to = "value") %>%
61 | na.omit() %>%
62 | mutate(label = case_when(
63 | param %in% c("mean","se") ~ "LS Means (SE)",
64 | param %in% c("diff_lcl","diff_ucl") ~ "95% CI",
65 | param %in% c("diff", "diff_se") ~ "Diff of LS Means (SE)",
66 | param == "p.value" & TRTP=="Xanomeline High Dose - Xanomeline Low Dose" ~ "p-value (Xan High - Xan Low)",
67 | param == "p.value" & TRTP=="Xanomeline High Dose - Placebo" ~ "p-value (Xan - Placebo)",
68 | param == "p.value" & TRTP=="Xanomeline Low Dose - Placebo" ~ "p-value (Xan - Placebo)"),
69 | group = case_when(
70 | label=="LS Means (SE)" | str_detect(label, "p-value") ~ label,
71 | TRUE ~ NA_character_
72 | )
73 | ) %>%
74 | mutate(param_ord = as.numeric(factor(param, levels = c("mean","se","p.value","diff","diff_se", "diff_lcl","diff_ucl"))),
75 | column = str_extract(TRTP, "[^-]+") %>% trimws()) %>%
76 | arrange(TRTP, column, param_ord) %>%
77 | fill(group, .direction = "down") %>%
78 | select(-c(TRTP, param_ord)) %>%
79 | ungroup %>%
80 | select(group, label, column, param, value)
81 |
82 | # all combined
83 | data_efficacy <- summ_dat %>%
84 | bind_rows(dose_resp_p) %>%
85 | bind_rows(efficacy_dat) %>%
86 | select(group, label, column, param, value)%>%
87 | ungroup %>%
88 | mutate(ord1 = as.numeric(factor(group, levels = c("Baseline", "Week 24", "Change from Baseline", "p-value (Dose Response)","p-value (Xan - Placebo)","p-value (Xan High - Xan Low)"))),
89 | ord2 = case_when(
90 | param == "n" ~ 1,
91 | param %in% c("mean","se") ~ 2,
92 | param %in% c("median", "min", "max") ~ 3,
93 | param =="p.value" ~ 4,
94 | param %in% c("diff", "diff_se") ~ 5,
95 | TRUE ~ 6)) %>%
96 | arrange(ord1, ord2)
97 |
98 |
99 | usethis::use_data(data_efficacy, overwrite = TRUE)
100 |
101 |
--------------------------------------------------------------------------------
/R/theme_element.R:
--------------------------------------------------------------------------------
1 |
2 | #' Element Row Group Location
3 | #'
4 | #'
5 | #' @param location Location of the row group labels. Specifying 'indented'
6 | #' combines all group and label variables into a single column with each
7 | #' sub-group indented under its parent. 'spanning' and 'column' retain the
8 | #' highest level group variable in its own column and combine all remaining
9 | #' group and label variables into a single column with sub-groups indented. The
10 | #' highest level group column will either be printed as a spanning header or in
11 | #' its own column in the gt. The 'noprint' option allows the user to suppress
12 | #' group values from being printed. Finally, the 'gtdefault' option allows
13 | #' users to use the 'gt' defaults for styling multiple group columns.
14 | #' @param indent A string of the number of spaces you want to indent
15 | #'
16 | #' @seealso [row_grp_plan()] for more details on how to group row group
17 | #' structures, [row_grp_structure()] for more details on how to specify row
18 | #' group structures, [element_block()] for more details on how to specify
19 | #' spacing between each group.
20 | #'
21 | #' \href{https://gsk-biostatistics.github.io/tfrmt/articles/row_grp_plan.html}{Link
22 | #' to related article}
23 | #'
24 | #' @returns element_row_grp_loc object
25 | #' @export
26 | #' @examples
27 | #'
28 | #' tfrmt_spec <- tfrmt(
29 | #' group = c(grp1, grp2),
30 | #' label = label,
31 | #' param = param,
32 | #' value = value,
33 | #' column = column,
34 | #' row_grp_plan = row_grp_plan(label_loc = element_row_grp_loc(location = "noprint")),
35 | #' body_plan = body_plan(
36 | #' frmt_structure(group_val = ".default", label_val = ".default", frmt("xx"))
37 | #' )
38 | #' )
39 | #'
40 | #' @section Images: Here are some example outputs:
41 | #'
42 | #' \if{html}{\out{ `r " "` }}
43 | #'
44 | element_row_grp_loc <- function(location = c("indented", "spanning", "column", "noprint", "gtdefault"),
45 | indent = " "){
46 | location = match.arg(location)
47 | structure(
48 | list(location = location, indent = indent),
49 | class = c("element_row_grp_loc", "element")
50 | )
51 | }
52 |
53 | is_element_row_grp_loc <- function(x){
54 | inherits(x, "element_row_grp_loc")
55 | }
56 |
57 |
58 | #' Element block
59 | #'
60 | #' @param post_space Values to show in a new line created after the group block
61 | #' @param fill Whether to recycle the value of `post_space` to match width of the data. Defaults to `TRUE`
62 | #'
63 | #' @return element block object
64 | #'
65 | #' @seealso [row_grp_plan()] for more details on how to group row group
66 | #' structures, [row_grp_structure()] for more details on how to specify row group
67 | #' structures, [element_row_grp_loc()] for more details on how to
68 | #' specify whether row group titles span the entire table or collapse.
69 | #'
70 | #' @export
71 | #' @examples
72 | #'
73 | #' tfrmt_spec <- tfrmt(
74 | #' group = grp1,
75 | #' label = label,
76 | #' param = param,
77 | #' value = value,
78 | #' column = column,
79 | #' row_grp_plan = row_grp_plan(
80 | #' row_grp_structure(group_val = ".default", element_block(post_space = " "))
81 | #' ),
82 | #' body_plan = body_plan(
83 | #' frmt_structure(group_val = ".default", label_val = ".default", frmt("xx"))
84 | #' )
85 | #' )
86 | element_block <- function(post_space = c(NULL, " ", "-"),
87 | fill = TRUE){
88 | structure(
89 | list(post_space = post_space, fill = fill),
90 | class = c("element_block", "element")
91 | )
92 |
93 | }
94 |
95 | is_element_block <- function(x){
96 | inherits(x, "element_block")
97 | }
98 |
99 |
100 |
101 | element_stub <- function(collapse_ord = vars(), collapse_into = vars(), remove_dups = NULL){
102 | structure(
103 | list(collapse_ord = collapse_ord, collapse_into = collapse_into, remove_dups = remove_dups),
104 | class = c("element_stub", "element")
105 | )
106 | }
107 |
108 | #col_labels = element_label(newCol = "Hello World", wrap_txt = 30)
109 | element_label <- function(..., wrap_txt = 30){
110 | structure(
111 | list(...) %>%
112 | c(wrap_txt = wrap_txt),
113 | class = c("element_label", "element")
114 | )
115 | }
116 |
117 | is_element_label <- function(x){
118 | inherits(x, "element_label")
119 | }
120 |
--------------------------------------------------------------------------------
/vignettes/layer.Rmd:
--------------------------------------------------------------------------------
1 | ---
2 | title: "Layering tfrmts"
3 | output: rmarkdown::html_vignette
4 | vignette: >
5 | %\VignetteIndexEntry{Layering tfrmts}
6 | %\VignetteEncoding{UTF-8}
7 | %\VignetteEngine{knitr::rmarkdown}
8 | editor_options:
9 | chunk_output_type: console
10 | ---
11 |
12 | ```{r, include = FALSE}
13 | knitr::opts_chunk$set(
14 | collapse = TRUE,
15 | comment = "#>"
16 | )
17 | ```
18 |
19 | ```{r setup, message=FALSE}
20 | library(tfrmt)
21 | ```
22 |
23 | A core design element of `tfrmt` is to offer the ability to layer tfrmts together. This ability provides an opportunity to build template table formats that can be shared, improved, and reused across multiple projects. `tfrmt` provides a few tfrmt templates to facilitate the creation of basic tfrmts, but they require customization. This can be done through layering.
24 |
25 | To layer tfrmts, you can pipe or use the `layer_tfrmt()` function. Piping is the preferred method for readability.
26 |
27 | When a tfrmt gets layered, the values in the first tfrmt are coalesced with values in the second tfrmt. If the second tfrmt has any of the same parameters specified as the first tfrmt, the values from the second tfrmt are prioritized. The exception to this rule is the "body_plan", which will stack the plans together. To change this behavior see the `layer_tfrmt()` documentation.
28 |
29 | ## Example
30 |
31 | Here is an example of layering through piping. We create a template from `tfrmt_sigdig()` and pipe it into a separate `tfrmt`.
32 |
33 | We provide `tfrmt_sigdig()` with a data.frame detailing the groups and the significant digits the values are to be rounded to and it creates a `tfrmt` with a body_plan that supports this.
34 |
35 | The second tfrmt defines the table specific information, including title, specific columns to use for row labels and output columns, as well as the col_plan.
36 |
37 | The output tfrmt generates a table with the subset `data_labs`.
38 |
39 | ```{r, results = "asis"}
40 | data_labs_subset <- data_labs |>
41 | dplyr::filter(
42 | group2 %in% c("ALANINE AMINOTRANSFERASE", "ALBUMIN", "ALKALINE PHOSPHATASE", "ASPARTATE AMINOTRANSFERASE", "BASOPHILS"),
43 | rowlbl %in% c("Bsln", "End[1]")
44 | )
45 |
46 | data_input <- tibble::tribble(
47 | ~group1, ~group2, ~sigdig,
48 | "CHEMISTRY", ".default", 3,
49 | "CHEMISTRY", "ALBUMIN", 1,
50 | "CHEMISTRY", "CALCIUM", 1,
51 | ".default", ".default", 2
52 | )
53 |
54 |
55 | labs_tfrmt_template <- tfrmt_sigdig(
56 | sigdig_df = data_input,
57 | group = vars(group1, group2),
58 | label = rowlbl,
59 | param_defaults = param_set("[{n}]" = NA)
60 | )
61 |
62 | labs_tfrmt <- labs_tfrmt_template |>
63 | tfrmt(
64 | column = vars(col1, col2),
65 | param = param,
66 | value = value,
67 | sorting_cols = vars(ord1, ord2, ord3),
68 | row_grp_plan = row_grp_plan(
69 | label_loc = element_row_grp_loc(location = "indent")
70 | ),
71 | col_plan = col_plan(
72 | group1, group2,
73 | rowlbl,
74 | "Residuals" = res,
75 | "Change From Baseline" = cbl,
76 | n,
77 | -starts_with("ord")
78 | )
79 | )
80 |
81 | labs_tfrmt |>
82 | print_to_gt(data_labs_subset) |>
83 | gt::tab_options(
84 | container.width = 1000
85 | )
86 | ```
87 |
88 | ## Conflicting Layers
89 |
90 | As two tfrmt are layered, there may come a case where the
91 | groups value is not the same across the body plan. Additionally, data may be provided in a slightly different group names than was expected. Addressing this without having to re-write the entire body_plan is able to be done with the `update_group()` function.
92 |
93 | Similar to the `rename()` function, here we provide the new group name and which old group name needs to be updated. The function maps across the entire tfrmt and updates all references of the old group name to the new one.
94 |
95 | For example, this is useful when a template tfrmt needs references updated. This could happen when the input data set has a slightly different naming convention than expected.
96 |
97 | ```{r}
98 | ## provided data had different column names for groups
99 | alternate_data_labs_subset <- data_labs_subset |>
100 | dplyr::rename(
101 | `Lab Type` = group1,
102 | `Lab Test` = group2,
103 | )
104 |
105 | labs_tfrmt |>
106 | update_group(
107 | `Lab Type` = group1,
108 | `Lab Test` = group2,
109 | ) |>
110 | tfrmt(
111 | col_plan = col_plan(
112 | `Lab Type`, `Lab Test`,
113 | rowlbl,
114 | "Residuals" = res,
115 | "Change From Baseline" = cbl,
116 | n,
117 | -starts_with("ord")
118 | )
119 | ) |>
120 | print_to_gt(alternate_data_labs_subset) |>
121 | gt::tab_options(
122 | container.width = 1000
123 | )
124 | ```
125 |
--------------------------------------------------------------------------------
/R/body_plan.R:
--------------------------------------------------------------------------------
1 | #' Table Body Plan
2 | #'
3 | #' Define the formatting of the body contents of the table through a series of
4 | #' frmt_structures. Structures get applied in order from bottom up, so the last
5 | #' added structure is the first applied.
6 | #'
7 | #' @seealso [frmt_structure()] defines which rows the formats will be applied
8 | #' to, and [frmt()], [frmt_combine()], and [frmt_when()] define the format
9 | #' semantics.
10 | #'
11 | #' \href{https://gsk-biostatistics.github.io/tfrmt/articles/body_plan.html}{Link to related article}
12 | #'
13 | #' @param ... list of frmt_structures defining the body formatting
14 | #'
15 | #' @return body_plan object
16 | #'
17 | #' @examples
18 | #'
19 | #' tfrmt_spec<- tfrmt(
20 | #' title = "Table Title",
21 | #' body_plan = body_plan(
22 | #' frmt_structure(
23 | #' group_val = c("group1"),
24 | #' label_val = ".default",
25 | #' frmt("XXX")
26 | #' )
27 | #' )
28 | #' )
29 | #'
30 | #' @export
31 | #'
32 | body_plan <- function(...){
33 |
34 | frmt_structure_list <- list(...)
35 |
36 | for(struct_idx in seq_along(frmt_structure_list)){
37 | if(!is_frmt_structure(frmt_structure_list[[struct_idx]])){
38 | stop(paste0("Entry number ",struct_idx," is not an object of class `frmt_structure`."))
39 | }
40 | }
41 |
42 | structure(
43 | frmt_structure_list,
44 | class = c("body_plan", "frmt_table")
45 | )
46 | }
47 |
48 |
49 | #' Build contents of body (group/label value-specific) plan based on significant digits specifications
50 | #'
51 | #' @param data significant digits data for a given set of group/label values
52 | #' @param tfrmt tfrmt object
53 | #' @param param_defaults parameter-level significant digits specifications
54 | #' @param missing missing option to be included in all `frmt`s
55 | #'
56 | #' @return list of `frmt_structure` objects
57 | #' @noRd
58 | #' @importFrom stringr str_detect str_extract_all
59 | #' @importFrom purrr map_dfr map map_chr quietly pmap_chr
60 | #' @importFrom dplyr mutate group_by filter group_split select across
61 | #' @importFrom tidyr unnest
62 | #' @importFrom rlang as_name quo_is_missing
63 | body_plan_builder <- function(data, group, label, param_defaults, missing = NULL){
64 |
65 | # prep params for frmt functions
66 | param_tbl <- seq_along(param_defaults) %>%
67 | map_dfr(~tibble(param_display = names(param_defaults)[.x],
68 | sigdig = list(param_defaults[[.x]] + data$sigdig[[1]]),
69 | pos = .x)) %>%
70 | mutate(contains_glue = str_detect(.data$param_display, "\\{.*\\}"), # is this to be a frmt_combine
71 | param = map2(.data$param_display, .data$contains_glue, ~ if(.y==TRUE){
72 | str_extract_all(.x, "(?<=\\{)[^\\}]+(?=\\})") %>% unlist
73 | } else {.x}),
74 | single_glue_to_frmt = pmap_chr(list(.data$contains_glue, .data$param, .data$param_display), function(a,b,c){
75 | if(a==TRUE & length(b) == 1) c else NA_character_
76 | } )) %>%
77 | unnest(
78 | tidyselect::everything()
79 | ) %>%
80 | mutate(frmt_string = map2_chr(.data$sigdig, .data$single_glue_to_frmt, sigdig_frmt_string))
81 |
82 | frmt_vec <- param_tbl %>%
83 | group_by(.data$pos) %>%
84 | group_split() %>%
85 | map(function(x){
86 | if(sum(x$contains_glue)>1){
87 | frmt_combine_builder(x$param_display[[1]], x$param, x$frmt_string, missing)
88 | } else{
89 | frmt_builder(x$param, x$frmt_string, missing)
90 | }
91 | })
92 |
93 | frmt_vec <-do.call(c, frmt_vec)
94 |
95 | # group/label names from tfrmt
96 | grp_names <- if (length(group)==0) character(0) else group %>% map_chr(as_name)
97 | lbl_names <- if(quo_is_missing(label)) character(0) else as_name(label)
98 |
99 | # sigdig value
100 | sigdig <- data$sigdig[[1]]
101 |
102 | which_grp <- grp_names[grp_names %in% names(data)]
103 | which_lbl <- lbl_names[lbl_names %in% names(data)]
104 |
105 | if(length(which_grp)>0){
106 | group_val <- data[,which_grp] %>%
107 | as.list() %>%
108 | map(unique)
109 |
110 | if (length(grp_names)>length(group_val)){
111 | group_val_to_add <- grp_names[!grp_names %in% names(group_val)]
112 | group_list_to_add <- rep(".default", length(group_val_to_add)) %>%
113 | as.list() %>%
114 | setNames(group_val_to_add)
115 | group_val <- c(group_val, group_list_to_add)[grp_names]
116 | }
117 | } else {
118 | group_val <- ".default"
119 | }
120 |
121 | if(length(which_lbl)>0){
122 | label_val <- data[,which_lbl, drop = TRUE] %>% unique()
123 | label_val <- if(any(label_val==".default")){".default"} else {label_val}
124 | } else {
125 | label_val <- ".default"
126 | }
127 |
128 | frmt_structure_builder(group_val, label_val, frmt_vec)
129 |
130 | }
131 |
--------------------------------------------------------------------------------
/R/apply_footnote_plan.R:
--------------------------------------------------------------------------------
1 | #' Apply Footnote Plan
2 | #'
3 | #' @param gt gt object to potentially add a footnote to
4 | #' @param tfrmt tfrmt object
5 | #' @param footnote_loc list containing footnote location
6 | #'
7 | #' @return gt object
8 | #' @noRd
9 | #'
10 | #' @importFrom gt tab_footnote md opt_footnote_marks
11 | apply_footnote_plan <- function(gt, tfrmt,footnote_loc){
12 | if(is.null(tfrmt$footnote_plan)){
13 | gt
14 | } else {
15 | for (i in 1:length(tfrmt$footnote_plan$struct_list)) {
16 |
17 | gt <- gt %>%
18 | apply_source_note(footnote_loc[[i]]) %>%
19 | apply_cells_column_labels(footnote_loc[[i]]) %>%
20 | apply_cells_column_spanners(footnote_loc[[i]]) %>%
21 | apply_cells_stub(tfrmt,footnote_loc[[i]]) %>%
22 | apply_cells_row_groups(tfrmt,footnote_loc[[i]]) %>%
23 | apply_cells_body(footnote_loc[[i]])
24 |
25 | }
26 | gt %>%
27 | opt_footnote_marks(marks = tfrmt$footnote_plan$marks )
28 |
29 |
30 |
31 | }
32 | }
33 |
34 |
35 | #' Apply Source Note
36 | #'
37 | #' @param gt gt object to potentially add a source note to
38 | #' @param loc list containing source note text
39 | #'
40 | #' @return gt object
41 | #' @noRd
42 | #'
43 | #' @importFrom gt tab_source_note
44 | apply_source_note <- function(gt,loc){
45 | if(length(loc$row)==0 && length(loc$col)==0){
46 | gt <- gt %>%
47 | tab_source_note(loc$note)
48 |
49 |
50 | }
51 | gt
52 |
53 | }
54 |
55 | #' Apply Cells Column Labels
56 | #'
57 | #' @param gt gt object to potentially add a footnote to
58 | #' @param loc list containing location of footnote and footnote text
59 | #'
60 | #'
61 | #' @return gt object
62 | #' @noRd
63 | #'
64 | #' @importFrom gt tab_footnote md opt_footnote_marks
65 | apply_cells_column_labels <- function(gt,loc){
66 | # check row is empty - therefore a column footnote, and not a spanning column
67 |
68 | if(is.null(loc$row) && loc$spanning ==FALSE){
69 |
70 | gt<- gt %>%
71 | tab_footnote(
72 | footnote = loc$note,
73 | locations = cells_column_labels(columns = loc$col)
74 | )
75 |
76 | }
77 | gt
78 |
79 |
80 | }
81 |
82 |
83 | #' Apply Cells Column Spanners
84 | #'
85 | #' @param gt gt object to potentially add a footnote to
86 | #' @param loc list containing location of footnote and footnote text
87 | #'
88 | #' @return gt object
89 | #' @noRd
90 | #'
91 | #' @importFrom gt tab_footnote md opt_footnote_marks
92 | apply_cells_column_spanners <- function(gt,loc){
93 | # check row is empty - therefore a column footnote
94 | if(is.null(loc$row) && loc$spanning ==TRUE){
95 |
96 | gt<- gt %>%
97 | tab_footnote(
98 | footnote = loc$note,
99 | locations = cells_column_spanners(spanners = loc$col
100 | )
101 | )
102 |
103 |
104 | }
105 | gt
106 | }
107 |
108 |
109 | #' Apply Cells Stub
110 | #'
111 | #' @param gt gt object to potentially add a footnote to
112 | #' @param tfrmt tfrmt object
113 | #' @param loc list containing location of footnote and footnote text
114 | #'
115 | #' @return gt object
116 | #' @noRd
117 | #'
118 | #' @importFrom gt tab_footnote md opt_footnote_marks
119 | #' @importFrom rlang quo_get_expr
120 | apply_cells_stub <- function(gt,tfrmt,loc){
121 | if(length(loc$col)>0){
122 | if(all(loc$col == as_label(tfrmt$label))){
123 |
124 | gt<- gt %>%
125 | tab_footnote(
126 | footnote = loc$note,
127 | locations = cells_stub(rows = loc$row)
128 | )
129 |
130 |
131 | }
132 |
133 | }
134 | gt
135 |
136 | }
137 |
138 |
139 |
140 | #' Apply Cells Row Groups
141 | #'
142 | #' @param gt gt object to potentially add a footnote to
143 | #' @param tfrmt tfrmt object
144 | #' @param loc list containing location of footnote and footnote text
145 | #'
146 | #' @return gt object
147 | #' @noRd
148 | #'
149 | #' @importFrom gt tab_footnote md opt_footnote_marks
150 | apply_cells_row_groups <- function(gt,tfrmt,loc){
151 | if(length(loc$col)>0){
152 | if(all(loc$col %in% map_chr(tfrmt$group, as_label) )){
153 |
154 | gt<- gt %>%
155 | tab_footnote(
156 | footnote = loc$note,
157 | locations = cells_row_groups(groups = loc$row)
158 | )
159 |
160 | }
161 |
162 | }
163 | gt
164 | }
165 |
166 |
167 | #' Apply Cells Body
168 | #'
169 | #' @param gt gt object to potentially add a footnote to
170 | #' @param loc list containing location of footnote and footnote text
171 | #'
172 | #' @return gt object
173 | #' @noRd
174 | #'
175 | #' @importFrom gt tab_footnote md opt_footnote_marks
176 | apply_cells_body<- function(gt,loc){
177 | if(!is.null(loc$col) && !is.null(loc$row)){
178 | gt<- gt %>%
179 | tab_footnote(
180 | footnote = loc$note,
181 | locations = cells_body(columns = loc$col, rows = loc$row
182 | )
183 | )
184 | }
185 | gt
186 |
187 | }
188 |
--------------------------------------------------------------------------------
/NEWS.md:
--------------------------------------------------------------------------------
1 | # tfrmt development version
2 |
3 | ## Improvements
4 | * Replace all spaces in the cell body of an output gt with unicode whitespace to ensure formatting is retained when going to pdf
5 |
6 | # tfrmt 0.2.1
7 |
8 | Patch release for latest {gt} release and upcoming {purrr} and {stringr} releases:
9 | * Ensure `rowname_col = NULL` in `gt()` within `print_to_gt()` if no row label exists.
10 | * Use of `seq_along(x)` in lieu of `1:length(x)` prior to `str_replace()` as it no longer accepts NA patterns.
11 | * Ensure values are character before processing via `map_chr()` as it no longer coerces to character.
12 |
13 | # tfrmt 0.2.0
14 |
15 | ## Improvements
16 |
17 | * Working with ARDs created from the {cards} package:
18 | * Added `shuffle_card()`, which prepares a `card` ARD object for analysis.
19 | * Added `prep_...()` functions to reduce the manual processing required for a
20 | `card` ARD object once it has been shuffled. (#509, @dragosmg)
21 | * `prep_combine_vars()`: useful for combining sparsely populated columns into
22 | a single one.
23 | * `prep_big_n()`: useful when the tfrmt contains a bigN structure. It recodes
24 | the `"n"` `stat_name` into `"bigN"` for the desired variables.
25 | * `prep_label()`: combines `stat_label` and `variable_level` for categorical
26 | (or categorical-like) variables.
27 | * `prep_hierarchical_fill()`: does a pair-wise replacement of missing values
28 | (`NAs`) in one column based on another column. It can replace `NA` either
29 | with a predetermined value, with the value of the other column in the pair, or
30 | with a {glue} expression.
31 | * Updated RTF footnotes so they go in the document footer by default.
32 |
33 | ## Bug fixes
34 |
35 | * Fix issue where `*_structure` functions did not correctly parse strings containing quotes in some cases. (#466)
36 | * Fix issue where page_plan doesn't work if there is only one level in your paging variable. (#506)
37 | * Fix issues where an error is thrown instead of a message if: (1) levels of page-specific big Ns do not align with levels of pagination (#505) or (2) the pagination levels are sorted non-alphabetically. (#516)
38 | * Fix issue where the big_n_structure doesn't work when the column name used for page_plan/grouping has a space in it. (#522)
39 |
40 |
41 | # tfrmt 0.1.3
42 |
43 | ## Improvements
44 |
45 | * Incorporate contents of `col_style_plan` in the creation of mock data.
46 |
47 | ## Bug fixes
48 |
49 | * Fixed issue where JSON conversion of `frmt_when` dropped quotes from strings
50 | * Avoid use of deprecated functionality in `dplyr::summarise()`
51 |
52 |
53 | # tfrmt 0.1.2
54 |
55 | ## Bug fixes
56 | * Fixed issue where table stub indentation does not transfer to all output types
57 | * Fixed issue where incomplete `body_plan` may error if the grouping variable is a factor
58 |
59 |
60 | # tfrmt 0.1.1
61 |
62 | ## Bug fixes
63 |
64 | * Fixed issue where `frmt_combine` couldn't process variable names surrounded by backticks
65 | * Fixed issue where `row_grp_plan` post space did not respect `col_style_plan` widths by adding new `fill` argument to `element_block`. The `fill` argument controls whether post space values should be recycled for the cell's data width. For example, a cell width of 3 will be respected by the post space with the following syntax: `element_block(post_space = "---", fill = FALSE)`.
66 | * Remove unused `border` argument in `element_block`.
67 | * Fixed bug where `row_grp_plan` splits on all grouping variables, even if not mentioned. Instead, the logic has been updated to split on those explicitly mentioned, similar to `page_plan`
68 | * Fixed issue where padding and alignment is lost for non-HTML outputs via the `.unicode_ws` argument added to `print_to_gt()` and `print_mock_gt()`. This defaults to `TRUE` but should be set to `FALSE` for RTF outputs (until {gt} bug is resolved).
69 | * Fixed issue where `make_mock_data` could result in duplicate rows
70 |
71 |
72 | # tfrmt 0.1.0
73 |
74 | ## New features:
75 |
76 | * Improved column alignment capabilities (via `col_style_plan`). Alignment options now fall into two types: character (type = "char") and positional (type = "pos"). Positional alignment is new and allows for aligning across multiple positions.
77 | * Add `page_plan` for splitting tables across multiple pages
78 | * Add ability to add a group/label header via the `col_plan`
79 |
80 | ## Breaking changes:
81 |
82 | * Name of the list component inside `row_grp_plan` that stores `row_grp_structure`s has been changed from "struct_ls" to "struct_list" to be consistent with other objects. This may impact compatibility with JSON files created using prior versions of {tfrmt}.
83 |
84 | ## Bug fixes:
85 |
86 | * `frmt_combine` no longer throws error if group variable is named "var"
87 | * `row_grp_plan` with post-space no longer throws error if character column contains NA values
88 |
89 |
90 | # tfrmt 0.0.3
91 |
92 | * Fixed bugs with JSON read/write
93 | * Added transformation capabilities to `frmt()`
94 |
95 |
96 | # tfrmt 0.0.2
97 |
98 | * Added a `NEWS.md` file to track changes to the package.
99 | * Added functionality to read/write tfrmts to JSON files
100 | * Updates made to work with the newest version of dplyr
101 |
--------------------------------------------------------------------------------
/README.md:
--------------------------------------------------------------------------------
1 |
2 | # tfrmt
"` }}
43 | #'
44 | element_row_grp_loc <- function(location = c("indented", "spanning", "column", "noprint", "gtdefault"),
45 | indent = " "){
46 | location = match.arg(location)
47 | structure(
48 | list(location = location, indent = indent),
49 | class = c("element_row_grp_loc", "element")
50 | )
51 | }
52 |
53 | is_element_row_grp_loc <- function(x){
54 | inherits(x, "element_row_grp_loc")
55 | }
56 |
57 |
58 | #' Element block
59 | #'
60 | #' @param post_space Values to show in a new line created after the group block
61 | #' @param fill Whether to recycle the value of `post_space` to match width of the data. Defaults to `TRUE`
62 | #'
63 | #' @return element block object
64 | #'
65 | #' @seealso [row_grp_plan()] for more details on how to group row group
66 | #' structures, [row_grp_structure()] for more details on how to specify row group
67 | #' structures, [element_row_grp_loc()] for more details on how to
68 | #' specify whether row group titles span the entire table or collapse.
69 | #'
70 | #' @export
71 | #' @examples
72 | #'
73 | #' tfrmt_spec <- tfrmt(
74 | #' group = grp1,
75 | #' label = label,
76 | #' param = param,
77 | #' value = value,
78 | #' column = column,
79 | #' row_grp_plan = row_grp_plan(
80 | #' row_grp_structure(group_val = ".default", element_block(post_space = " "))
81 | #' ),
82 | #' body_plan = body_plan(
83 | #' frmt_structure(group_val = ".default", label_val = ".default", frmt("xx"))
84 | #' )
85 | #' )
86 | element_block <- function(post_space = c(NULL, " ", "-"),
87 | fill = TRUE){
88 | structure(
89 | list(post_space = post_space, fill = fill),
90 | class = c("element_block", "element")
91 | )
92 |
93 | }
94 |
95 | is_element_block <- function(x){
96 | inherits(x, "element_block")
97 | }
98 |
99 |
100 |
101 | element_stub <- function(collapse_ord = vars(), collapse_into = vars(), remove_dups = NULL){
102 | structure(
103 | list(collapse_ord = collapse_ord, collapse_into = collapse_into, remove_dups = remove_dups),
104 | class = c("element_stub", "element")
105 | )
106 | }
107 |
108 | #col_labels = element_label(newCol = "Hello World", wrap_txt = 30)
109 | element_label <- function(..., wrap_txt = 30){
110 | structure(
111 | list(...) %>%
112 | c(wrap_txt = wrap_txt),
113 | class = c("element_label", "element")
114 | )
115 | }
116 |
117 | is_element_label <- function(x){
118 | inherits(x, "element_label")
119 | }
120 |
--------------------------------------------------------------------------------
/vignettes/layer.Rmd:
--------------------------------------------------------------------------------
1 | ---
2 | title: "Layering tfrmts"
3 | output: rmarkdown::html_vignette
4 | vignette: >
5 | %\VignetteIndexEntry{Layering tfrmts}
6 | %\VignetteEncoding{UTF-8}
7 | %\VignetteEngine{knitr::rmarkdown}
8 | editor_options:
9 | chunk_output_type: console
10 | ---
11 |
12 | ```{r, include = FALSE}
13 | knitr::opts_chunk$set(
14 | collapse = TRUE,
15 | comment = "#>"
16 | )
17 | ```
18 |
19 | ```{r setup, message=FALSE}
20 | library(tfrmt)
21 | ```
22 |
23 | A core design element of `tfrmt` is to offer the ability to layer tfrmts together. This ability provides an opportunity to build template table formats that can be shared, improved, and reused across multiple projects. `tfrmt` provides a few tfrmt templates to facilitate the creation of basic tfrmts, but they require customization. This can be done through layering.
24 |
25 | To layer tfrmts, you can pipe or use the `layer_tfrmt()` function. Piping is the preferred method for readability.
26 |
27 | When a tfrmt gets layered, the values in the first tfrmt are coalesced with values in the second tfrmt. If the second tfrmt has any of the same parameters specified as the first tfrmt, the values from the second tfrmt are prioritized. The exception to this rule is the "body_plan", which will stack the plans together. To change this behavior see the `layer_tfrmt()` documentation.
28 |
29 | ## Example
30 |
31 | Here is an example of layering through piping. We create a template from `tfrmt_sigdig()` and pipe it into a separate `tfrmt`.
32 |
33 | We provide `tfrmt_sigdig()` with a data.frame detailing the groups and the significant digits the values are to be rounded to and it creates a `tfrmt` with a body_plan that supports this.
34 |
35 | The second tfrmt defines the table specific information, including title, specific columns to use for row labels and output columns, as well as the col_plan.
36 |
37 | The output tfrmt generates a table with the subset `data_labs`.
38 |
39 | ```{r, results = "asis"}
40 | data_labs_subset <- data_labs |>
41 | dplyr::filter(
42 | group2 %in% c("ALANINE AMINOTRANSFERASE", "ALBUMIN", "ALKALINE PHOSPHATASE", "ASPARTATE AMINOTRANSFERASE", "BASOPHILS"),
43 | rowlbl %in% c("Bsln", "End[1]")
44 | )
45 |
46 | data_input <- tibble::tribble(
47 | ~group1, ~group2, ~sigdig,
48 | "CHEMISTRY", ".default", 3,
49 | "CHEMISTRY", "ALBUMIN", 1,
50 | "CHEMISTRY", "CALCIUM", 1,
51 | ".default", ".default", 2
52 | )
53 |
54 |
55 | labs_tfrmt_template <- tfrmt_sigdig(
56 | sigdig_df = data_input,
57 | group = vars(group1, group2),
58 | label = rowlbl,
59 | param_defaults = param_set("[{n}]" = NA)
60 | )
61 |
62 | labs_tfrmt <- labs_tfrmt_template |>
63 | tfrmt(
64 | column = vars(col1, col2),
65 | param = param,
66 | value = value,
67 | sorting_cols = vars(ord1, ord2, ord3),
68 | row_grp_plan = row_grp_plan(
69 | label_loc = element_row_grp_loc(location = "indent")
70 | ),
71 | col_plan = col_plan(
72 | group1, group2,
73 | rowlbl,
74 | "Residuals" = res,
75 | "Change From Baseline" = cbl,
76 | n,
77 | -starts_with("ord")
78 | )
79 | )
80 |
81 | labs_tfrmt |>
82 | print_to_gt(data_labs_subset) |>
83 | gt::tab_options(
84 | container.width = 1000
85 | )
86 | ```
87 |
88 | ## Conflicting Layers
89 |
90 | As two tfrmt are layered, there may come a case where the
91 | groups value is not the same across the body plan. Additionally, data may be provided in a slightly different group names than was expected. Addressing this without having to re-write the entire body_plan is able to be done with the `update_group()` function.
92 |
93 | Similar to the `rename()` function, here we provide the new group name and which old group name needs to be updated. The function maps across the entire tfrmt and updates all references of the old group name to the new one.
94 |
95 | For example, this is useful when a template tfrmt needs references updated. This could happen when the input data set has a slightly different naming convention than expected.
96 |
97 | ```{r}
98 | ## provided data had different column names for groups
99 | alternate_data_labs_subset <- data_labs_subset |>
100 | dplyr::rename(
101 | `Lab Type` = group1,
102 | `Lab Test` = group2,
103 | )
104 |
105 | labs_tfrmt |>
106 | update_group(
107 | `Lab Type` = group1,
108 | `Lab Test` = group2,
109 | ) |>
110 | tfrmt(
111 | col_plan = col_plan(
112 | `Lab Type`, `Lab Test`,
113 | rowlbl,
114 | "Residuals" = res,
115 | "Change From Baseline" = cbl,
116 | n,
117 | -starts_with("ord")
118 | )
119 | ) |>
120 | print_to_gt(alternate_data_labs_subset) |>
121 | gt::tab_options(
122 | container.width = 1000
123 | )
124 | ```
125 |
--------------------------------------------------------------------------------
/R/body_plan.R:
--------------------------------------------------------------------------------
1 | #' Table Body Plan
2 | #'
3 | #' Define the formatting of the body contents of the table through a series of
4 | #' frmt_structures. Structures get applied in order from bottom up, so the last
5 | #' added structure is the first applied.
6 | #'
7 | #' @seealso [frmt_structure()] defines which rows the formats will be applied
8 | #' to, and [frmt()], [frmt_combine()], and [frmt_when()] define the format
9 | #' semantics.
10 | #'
11 | #' \href{https://gsk-biostatistics.github.io/tfrmt/articles/body_plan.html}{Link to related article}
12 | #'
13 | #' @param ... list of frmt_structures defining the body formatting
14 | #'
15 | #' @return body_plan object
16 | #'
17 | #' @examples
18 | #'
19 | #' tfrmt_spec<- tfrmt(
20 | #' title = "Table Title",
21 | #' body_plan = body_plan(
22 | #' frmt_structure(
23 | #' group_val = c("group1"),
24 | #' label_val = ".default",
25 | #' frmt("XXX")
26 | #' )
27 | #' )
28 | #' )
29 | #'
30 | #' @export
31 | #'
32 | body_plan <- function(...){
33 |
34 | frmt_structure_list <- list(...)
35 |
36 | for(struct_idx in seq_along(frmt_structure_list)){
37 | if(!is_frmt_structure(frmt_structure_list[[struct_idx]])){
38 | stop(paste0("Entry number ",struct_idx," is not an object of class `frmt_structure`."))
39 | }
40 | }
41 |
42 | structure(
43 | frmt_structure_list,
44 | class = c("body_plan", "frmt_table")
45 | )
46 | }
47 |
48 |
49 | #' Build contents of body (group/label value-specific) plan based on significant digits specifications
50 | #'
51 | #' @param data significant digits data for a given set of group/label values
52 | #' @param tfrmt tfrmt object
53 | #' @param param_defaults parameter-level significant digits specifications
54 | #' @param missing missing option to be included in all `frmt`s
55 | #'
56 | #' @return list of `frmt_structure` objects
57 | #' @noRd
58 | #' @importFrom stringr str_detect str_extract_all
59 | #' @importFrom purrr map_dfr map map_chr quietly pmap_chr
60 | #' @importFrom dplyr mutate group_by filter group_split select across
61 | #' @importFrom tidyr unnest
62 | #' @importFrom rlang as_name quo_is_missing
63 | body_plan_builder <- function(data, group, label, param_defaults, missing = NULL){
64 |
65 | # prep params for frmt functions
66 | param_tbl <- seq_along(param_defaults) %>%
67 | map_dfr(~tibble(param_display = names(param_defaults)[.x],
68 | sigdig = list(param_defaults[[.x]] + data$sigdig[[1]]),
69 | pos = .x)) %>%
70 | mutate(contains_glue = str_detect(.data$param_display, "\\{.*\\}"), # is this to be a frmt_combine
71 | param = map2(.data$param_display, .data$contains_glue, ~ if(.y==TRUE){
72 | str_extract_all(.x, "(?<=\\{)[^\\}]+(?=\\})") %>% unlist
73 | } else {.x}),
74 | single_glue_to_frmt = pmap_chr(list(.data$contains_glue, .data$param, .data$param_display), function(a,b,c){
75 | if(a==TRUE & length(b) == 1) c else NA_character_
76 | } )) %>%
77 | unnest(
78 | tidyselect::everything()
79 | ) %>%
80 | mutate(frmt_string = map2_chr(.data$sigdig, .data$single_glue_to_frmt, sigdig_frmt_string))
81 |
82 | frmt_vec <- param_tbl %>%
83 | group_by(.data$pos) %>%
84 | group_split() %>%
85 | map(function(x){
86 | if(sum(x$contains_glue)>1){
87 | frmt_combine_builder(x$param_display[[1]], x$param, x$frmt_string, missing)
88 | } else{
89 | frmt_builder(x$param, x$frmt_string, missing)
90 | }
91 | })
92 |
93 | frmt_vec <-do.call(c, frmt_vec)
94 |
95 | # group/label names from tfrmt
96 | grp_names <- if (length(group)==0) character(0) else group %>% map_chr(as_name)
97 | lbl_names <- if(quo_is_missing(label)) character(0) else as_name(label)
98 |
99 | # sigdig value
100 | sigdig <- data$sigdig[[1]]
101 |
102 | which_grp <- grp_names[grp_names %in% names(data)]
103 | which_lbl <- lbl_names[lbl_names %in% names(data)]
104 |
105 | if(length(which_grp)>0){
106 | group_val <- data[,which_grp] %>%
107 | as.list() %>%
108 | map(unique)
109 |
110 | if (length(grp_names)>length(group_val)){
111 | group_val_to_add <- grp_names[!grp_names %in% names(group_val)]
112 | group_list_to_add <- rep(".default", length(group_val_to_add)) %>%
113 | as.list() %>%
114 | setNames(group_val_to_add)
115 | group_val <- c(group_val, group_list_to_add)[grp_names]
116 | }
117 | } else {
118 | group_val <- ".default"
119 | }
120 |
121 | if(length(which_lbl)>0){
122 | label_val <- data[,which_lbl, drop = TRUE] %>% unique()
123 | label_val <- if(any(label_val==".default")){".default"} else {label_val}
124 | } else {
125 | label_val <- ".default"
126 | }
127 |
128 | frmt_structure_builder(group_val, label_val, frmt_vec)
129 |
130 | }
131 |
--------------------------------------------------------------------------------
/R/apply_footnote_plan.R:
--------------------------------------------------------------------------------
1 | #' Apply Footnote Plan
2 | #'
3 | #' @param gt gt object to potentially add a footnote to
4 | #' @param tfrmt tfrmt object
5 | #' @param footnote_loc list containing footnote location
6 | #'
7 | #' @return gt object
8 | #' @noRd
9 | #'
10 | #' @importFrom gt tab_footnote md opt_footnote_marks
11 | apply_footnote_plan <- function(gt, tfrmt,footnote_loc){
12 | if(is.null(tfrmt$footnote_plan)){
13 | gt
14 | } else {
15 | for (i in 1:length(tfrmt$footnote_plan$struct_list)) {
16 |
17 | gt <- gt %>%
18 | apply_source_note(footnote_loc[[i]]) %>%
19 | apply_cells_column_labels(footnote_loc[[i]]) %>%
20 | apply_cells_column_spanners(footnote_loc[[i]]) %>%
21 | apply_cells_stub(tfrmt,footnote_loc[[i]]) %>%
22 | apply_cells_row_groups(tfrmt,footnote_loc[[i]]) %>%
23 | apply_cells_body(footnote_loc[[i]])
24 |
25 | }
26 | gt %>%
27 | opt_footnote_marks(marks = tfrmt$footnote_plan$marks )
28 |
29 |
30 |
31 | }
32 | }
33 |
34 |
35 | #' Apply Source Note
36 | #'
37 | #' @param gt gt object to potentially add a source note to
38 | #' @param loc list containing source note text
39 | #'
40 | #' @return gt object
41 | #' @noRd
42 | #'
43 | #' @importFrom gt tab_source_note
44 | apply_source_note <- function(gt,loc){
45 | if(length(loc$row)==0 && length(loc$col)==0){
46 | gt <- gt %>%
47 | tab_source_note(loc$note)
48 |
49 |
50 | }
51 | gt
52 |
53 | }
54 |
55 | #' Apply Cells Column Labels
56 | #'
57 | #' @param gt gt object to potentially add a footnote to
58 | #' @param loc list containing location of footnote and footnote text
59 | #'
60 | #'
61 | #' @return gt object
62 | #' @noRd
63 | #'
64 | #' @importFrom gt tab_footnote md opt_footnote_marks
65 | apply_cells_column_labels <- function(gt,loc){
66 | # check row is empty - therefore a column footnote, and not a spanning column
67 |
68 | if(is.null(loc$row) && loc$spanning ==FALSE){
69 |
70 | gt<- gt %>%
71 | tab_footnote(
72 | footnote = loc$note,
73 | locations = cells_column_labels(columns = loc$col)
74 | )
75 |
76 | }
77 | gt
78 |
79 |
80 | }
81 |
82 |
83 | #' Apply Cells Column Spanners
84 | #'
85 | #' @param gt gt object to potentially add a footnote to
86 | #' @param loc list containing location of footnote and footnote text
87 | #'
88 | #' @return gt object
89 | #' @noRd
90 | #'
91 | #' @importFrom gt tab_footnote md opt_footnote_marks
92 | apply_cells_column_spanners <- function(gt,loc){
93 | # check row is empty - therefore a column footnote
94 | if(is.null(loc$row) && loc$spanning ==TRUE){
95 |
96 | gt<- gt %>%
97 | tab_footnote(
98 | footnote = loc$note,
99 | locations = cells_column_spanners(spanners = loc$col
100 | )
101 | )
102 |
103 |
104 | }
105 | gt
106 | }
107 |
108 |
109 | #' Apply Cells Stub
110 | #'
111 | #' @param gt gt object to potentially add a footnote to
112 | #' @param tfrmt tfrmt object
113 | #' @param loc list containing location of footnote and footnote text
114 | #'
115 | #' @return gt object
116 | #' @noRd
117 | #'
118 | #' @importFrom gt tab_footnote md opt_footnote_marks
119 | #' @importFrom rlang quo_get_expr
120 | apply_cells_stub <- function(gt,tfrmt,loc){
121 | if(length(loc$col)>0){
122 | if(all(loc$col == as_label(tfrmt$label))){
123 |
124 | gt<- gt %>%
125 | tab_footnote(
126 | footnote = loc$note,
127 | locations = cells_stub(rows = loc$row)
128 | )
129 |
130 |
131 | }
132 |
133 | }
134 | gt
135 |
136 | }
137 |
138 |
139 |
140 | #' Apply Cells Row Groups
141 | #'
142 | #' @param gt gt object to potentially add a footnote to
143 | #' @param tfrmt tfrmt object
144 | #' @param loc list containing location of footnote and footnote text
145 | #'
146 | #' @return gt object
147 | #' @noRd
148 | #'
149 | #' @importFrom gt tab_footnote md opt_footnote_marks
150 | apply_cells_row_groups <- function(gt,tfrmt,loc){
151 | if(length(loc$col)>0){
152 | if(all(loc$col %in% map_chr(tfrmt$group, as_label) )){
153 |
154 | gt<- gt %>%
155 | tab_footnote(
156 | footnote = loc$note,
157 | locations = cells_row_groups(groups = loc$row)
158 | )
159 |
160 | }
161 |
162 | }
163 | gt
164 | }
165 |
166 |
167 | #' Apply Cells Body
168 | #'
169 | #' @param gt gt object to potentially add a footnote to
170 | #' @param loc list containing location of footnote and footnote text
171 | #'
172 | #' @return gt object
173 | #' @noRd
174 | #'
175 | #' @importFrom gt tab_footnote md opt_footnote_marks
176 | apply_cells_body<- function(gt,loc){
177 | if(!is.null(loc$col) && !is.null(loc$row)){
178 | gt<- gt %>%
179 | tab_footnote(
180 | footnote = loc$note,
181 | locations = cells_body(columns = loc$col, rows = loc$row
182 | )
183 | )
184 | }
185 | gt
186 |
187 | }
188 |
--------------------------------------------------------------------------------
/NEWS.md:
--------------------------------------------------------------------------------
1 | # tfrmt development version
2 |
3 | ## Improvements
4 | * Replace all spaces in the cell body of an output gt with unicode whitespace to ensure formatting is retained when going to pdf
5 |
6 | # tfrmt 0.2.1
7 |
8 | Patch release for latest {gt} release and upcoming {purrr} and {stringr} releases:
9 | * Ensure `rowname_col = NULL` in `gt()` within `print_to_gt()` if no row label exists.
10 | * Use of `seq_along(x)` in lieu of `1:length(x)` prior to `str_replace()` as it no longer accepts NA patterns.
11 | * Ensure values are character before processing via `map_chr()` as it no longer coerces to character.
12 |
13 | # tfrmt 0.2.0
14 |
15 | ## Improvements
16 |
17 | * Working with ARDs created from the {cards} package:
18 | * Added `shuffle_card()`, which prepares a `card` ARD object for analysis.
19 | * Added `prep_...()` functions to reduce the manual processing required for a
20 | `card` ARD object once it has been shuffled. (#509, @dragosmg)
21 | * `prep_combine_vars()`: useful for combining sparsely populated columns into
22 | a single one.
23 | * `prep_big_n()`: useful when the tfrmt contains a bigN structure. It recodes
24 | the `"n"` `stat_name` into `"bigN"` for the desired variables.
25 | * `prep_label()`: combines `stat_label` and `variable_level` for categorical
26 | (or categorical-like) variables.
27 | * `prep_hierarchical_fill()`: does a pair-wise replacement of missing values
28 | (`NAs`) in one column based on another column. It can replace `NA` either
29 | with a predetermined value, with the value of the other column in the pair, or
30 | with a {glue} expression.
31 | * Updated RTF footnotes so they go in the document footer by default.
32 |
33 | ## Bug fixes
34 |
35 | * Fix issue where `*_structure` functions did not correctly parse strings containing quotes in some cases. (#466)
36 | * Fix issue where page_plan doesn't work if there is only one level in your paging variable. (#506)
37 | * Fix issues where an error is thrown instead of a message if: (1) levels of page-specific big Ns do not align with levels of pagination (#505) or (2) the pagination levels are sorted non-alphabetically. (#516)
38 | * Fix issue where the big_n_structure doesn't work when the column name used for page_plan/grouping has a space in it. (#522)
39 |
40 |
41 | # tfrmt 0.1.3
42 |
43 | ## Improvements
44 |
45 | * Incorporate contents of `col_style_plan` in the creation of mock data.
46 |
47 | ## Bug fixes
48 |
49 | * Fixed issue where JSON conversion of `frmt_when` dropped quotes from strings
50 | * Avoid use of deprecated functionality in `dplyr::summarise()`
51 |
52 |
53 | # tfrmt 0.1.2
54 |
55 | ## Bug fixes
56 | * Fixed issue where table stub indentation does not transfer to all output types
57 | * Fixed issue where incomplete `body_plan` may error if the grouping variable is a factor
58 |
59 |
60 | # tfrmt 0.1.1
61 |
62 | ## Bug fixes
63 |
64 | * Fixed issue where `frmt_combine` couldn't process variable names surrounded by backticks
65 | * Fixed issue where `row_grp_plan` post space did not respect `col_style_plan` widths by adding new `fill` argument to `element_block`. The `fill` argument controls whether post space values should be recycled for the cell's data width. For example, a cell width of 3 will be respected by the post space with the following syntax: `element_block(post_space = "---", fill = FALSE)`.
66 | * Remove unused `border` argument in `element_block`.
67 | * Fixed bug where `row_grp_plan` splits on all grouping variables, even if not mentioned. Instead, the logic has been updated to split on those explicitly mentioned, similar to `page_plan`
68 | * Fixed issue where padding and alignment is lost for non-HTML outputs via the `.unicode_ws` argument added to `print_to_gt()` and `print_mock_gt()`. This defaults to `TRUE` but should be set to `FALSE` for RTF outputs (until {gt} bug is resolved).
69 | * Fixed issue where `make_mock_data` could result in duplicate rows
70 |
71 |
72 | # tfrmt 0.1.0
73 |
74 | ## New features:
75 |
76 | * Improved column alignment capabilities (via `col_style_plan`). Alignment options now fall into two types: character (type = "char") and positional (type = "pos"). Positional alignment is new and allows for aligning across multiple positions.
77 | * Add `page_plan` for splitting tables across multiple pages
78 | * Add ability to add a group/label header via the `col_plan`
79 |
80 | ## Breaking changes:
81 |
82 | * Name of the list component inside `row_grp_plan` that stores `row_grp_structure`s has been changed from "struct_ls" to "struct_list" to be consistent with other objects. This may impact compatibility with JSON files created using prior versions of {tfrmt}.
83 |
84 | ## Bug fixes:
85 |
86 | * `frmt_combine` no longer throws error if group variable is named "var"
87 | * `row_grp_plan` with post-space no longer throws error if character column contains NA values
88 |
89 |
90 | # tfrmt 0.0.3
91 |
92 | * Fixed bugs with JSON read/write
93 | * Added transformation capabilities to `frmt()`
94 |
95 |
96 | # tfrmt 0.0.2
97 |
98 | * Added a `NEWS.md` file to track changes to the package.
99 | * Added functionality to read/write tfrmts to JSON files
100 | * Updates made to work with the newest version of dplyr
101 |
--------------------------------------------------------------------------------
/README.md:
--------------------------------------------------------------------------------
1 |
2 | # tfrmt  3 |
4 |
5 |
6 | [](https://github.com/GSK-Biostatistics/tfrmt/actions/workflows/R-CMD-check.yaml)
7 | [](https://app.codecov.io/gh/GSK-Biostatistics/tfrmt?branch=main)
9 | [](https://github.com/GIScience/badges#experimental)
11 | [](https://CRAN.R-project.org/package=tfrmt)
13 |
14 |
15 | The tfrmt package provides a language for defining display-related
16 | metadata, which can then be used to automate and easily update output
17 | formats.
18 |
19 | In clinical trials, displays are generally quite standard, but frequent,
20 | highly specific formatting tweaks (e.g., rounding, footnotes, headers)
21 | are very common. Prior to data analysis, study teams often generate mock
22 | displays to represent the desired end product for sponsors to approve or
23 | programmers to replicate. This process is typically highly manual and
24 | separate from the programming itself. There is also a high importance
25 | placed on verifying the accuracy of the results via a QC (Quality
26 | Control) process such as double programming. Finally, there is a
27 | movement toward an industry standard data structure for Analysis Results
28 | Data “ARD”, which means analysis results datasets will have consistent
29 | structures and column names. Specifically, the ARD is long, with 1
30 | record per computed value. For more information about ARDs click
31 | [here](https://pharmasug.org/download/sde/rtp2021/PharmaSUG-NCSDE_2021-08.pdf).
32 |
33 | tfrmt supports a vision where:
34 |
35 | - Mock displays are integrated with the programming workflow
36 | - Results are QC’ed prior to formatting to reduce rework
37 | - Standard formatting styles can be applied in as little as one line of
38 | code
39 | - The ARD structure can be leveraged to accommodate a variety of tables
40 |
41 | By reducing the amount of repetitive tasks, study teams can focus on the
42 | quality and interpretation of the results themselves.
43 |
44 | # Why tfrmt?
45 |
46 | While there are many existing table-making packages in the R ecosystem,
47 | they typically fall into one of two categories:
48 |
49 | - Table packages that perform analyses and format the results
50 | - Table packages that format and output existing data
51 |
52 | By design, tfrmt is more of the latter, as it is intended to be used
53 | after the results have been computed. What makes tfrmt unique, however,
54 | is that it offers an intuitive interface for defining and layering
55 | standard or custom formats that are often specific to clinical trials.
56 | It also offers the novel ability to easily generate mock displays using
57 | metadata that will be used for the actual displays. tfrmt is built on
58 | top of the powerful gt package, which is intended to support a variety
59 | of output formats in the future.
60 |
61 | # Installation
62 |
63 | The tfrmt package can be installed from CRAN with:
64 |
65 | ``` r
66 | install.packages("tfrmt")
67 | ```
68 |
69 | The development version of tfrmt can be installed with:
70 |
71 | ``` r
72 | devtools::install_github("GSK-Biostatistics/tfrmt")
73 | ```
74 |
75 | # Input data structure
76 |
77 | We expect an input dataset that is long, with 1 record per computed
78 | value. Required columns include:
79 |
80 | - \[Optional\] 1 or more **group** columns, containing grouping values
81 | - A single **label** column, containing row label values
82 | - 1 or more **column** columns, containing column values
83 | - A single **param** column, which provides a label for distinct types
84 | of values
85 | - A single **value** column, containing the computed, raw data values
86 | - \[Optional\] 1 or more **sorting_cols** columns, containing numeric
87 | values to be used in the row ordering
88 |
89 | # Functionality
90 |
91 | Here is an overview of what is possible with tfrmt:
92 |
93 | - Create a “tfrmt” metadata object containing all formatting and
94 | labelling for the display
95 | - Create mock displays based on existing sample data or no prior data
96 | - ARD-standard compliant facilitates reuse and automation
97 |
98 | Other benefits of tfrmt:
99 |
100 | - Provides a tidyverse-friendly, pipeable interface
101 | - Leverages gt as output engine, which allows for further customizations
102 | within gt itself
103 |
104 | # More Info
105 |
106 | For more information about how to build your own tfrmt mocks/tables
107 | (like the one below!), please explore the
108 | [vignettes](https://gsk-biostatistics.github.io/tfrmt/articles/examples.html).
109 |
110 |
3 |
4 |
5 |
6 | [](https://github.com/GSK-Biostatistics/tfrmt/actions/workflows/R-CMD-check.yaml)
7 | [](https://app.codecov.io/gh/GSK-Biostatistics/tfrmt?branch=main)
9 | [](https://github.com/GIScience/badges#experimental)
11 | [](https://CRAN.R-project.org/package=tfrmt)
13 |
14 |
15 | The tfrmt package provides a language for defining display-related
16 | metadata, which can then be used to automate and easily update output
17 | formats.
18 |
19 | In clinical trials, displays are generally quite standard, but frequent,
20 | highly specific formatting tweaks (e.g., rounding, footnotes, headers)
21 | are very common. Prior to data analysis, study teams often generate mock
22 | displays to represent the desired end product for sponsors to approve or
23 | programmers to replicate. This process is typically highly manual and
24 | separate from the programming itself. There is also a high importance
25 | placed on verifying the accuracy of the results via a QC (Quality
26 | Control) process such as double programming. Finally, there is a
27 | movement toward an industry standard data structure for Analysis Results
28 | Data “ARD”, which means analysis results datasets will have consistent
29 | structures and column names. Specifically, the ARD is long, with 1
30 | record per computed value. For more information about ARDs click
31 | [here](https://pharmasug.org/download/sde/rtp2021/PharmaSUG-NCSDE_2021-08.pdf).
32 |
33 | tfrmt supports a vision where:
34 |
35 | - Mock displays are integrated with the programming workflow
36 | - Results are QC’ed prior to formatting to reduce rework
37 | - Standard formatting styles can be applied in as little as one line of
38 | code
39 | - The ARD structure can be leveraged to accommodate a variety of tables
40 |
41 | By reducing the amount of repetitive tasks, study teams can focus on the
42 | quality and interpretation of the results themselves.
43 |
44 | # Why tfrmt?
45 |
46 | While there are many existing table-making packages in the R ecosystem,
47 | they typically fall into one of two categories:
48 |
49 | - Table packages that perform analyses and format the results
50 | - Table packages that format and output existing data
51 |
52 | By design, tfrmt is more of the latter, as it is intended to be used
53 | after the results have been computed. What makes tfrmt unique, however,
54 | is that it offers an intuitive interface for defining and layering
55 | standard or custom formats that are often specific to clinical trials.
56 | It also offers the novel ability to easily generate mock displays using
57 | metadata that will be used for the actual displays. tfrmt is built on
58 | top of the powerful gt package, which is intended to support a variety
59 | of output formats in the future.
60 |
61 | # Installation
62 |
63 | The tfrmt package can be installed from CRAN with:
64 |
65 | ``` r
66 | install.packages("tfrmt")
67 | ```
68 |
69 | The development version of tfrmt can be installed with:
70 |
71 | ``` r
72 | devtools::install_github("GSK-Biostatistics/tfrmt")
73 | ```
74 |
75 | # Input data structure
76 |
77 | We expect an input dataset that is long, with 1 record per computed
78 | value. Required columns include:
79 |
80 | - \[Optional\] 1 or more **group** columns, containing grouping values
81 | - A single **label** column, containing row label values
82 | - 1 or more **column** columns, containing column values
83 | - A single **param** column, which provides a label for distinct types
84 | of values
85 | - A single **value** column, containing the computed, raw data values
86 | - \[Optional\] 1 or more **sorting_cols** columns, containing numeric
87 | values to be used in the row ordering
88 |
89 | # Functionality
90 |
91 | Here is an overview of what is possible with tfrmt:
92 |
93 | - Create a “tfrmt” metadata object containing all formatting and
94 | labelling for the display
95 | - Create mock displays based on existing sample data or no prior data
96 | - ARD-standard compliant facilitates reuse and automation
97 |
98 | Other benefits of tfrmt:
99 |
100 | - Provides a tidyverse-friendly, pipeable interface
101 | - Leverages gt as output engine, which allows for further customizations
102 | within gt itself
103 |
104 | # More Info
105 |
106 | For more information about how to build your own tfrmt mocks/tables
107 | (like the one below!), please explore the
108 | [vignettes](https://gsk-biostatistics.github.io/tfrmt/articles/examples.html).
109 |
110 | 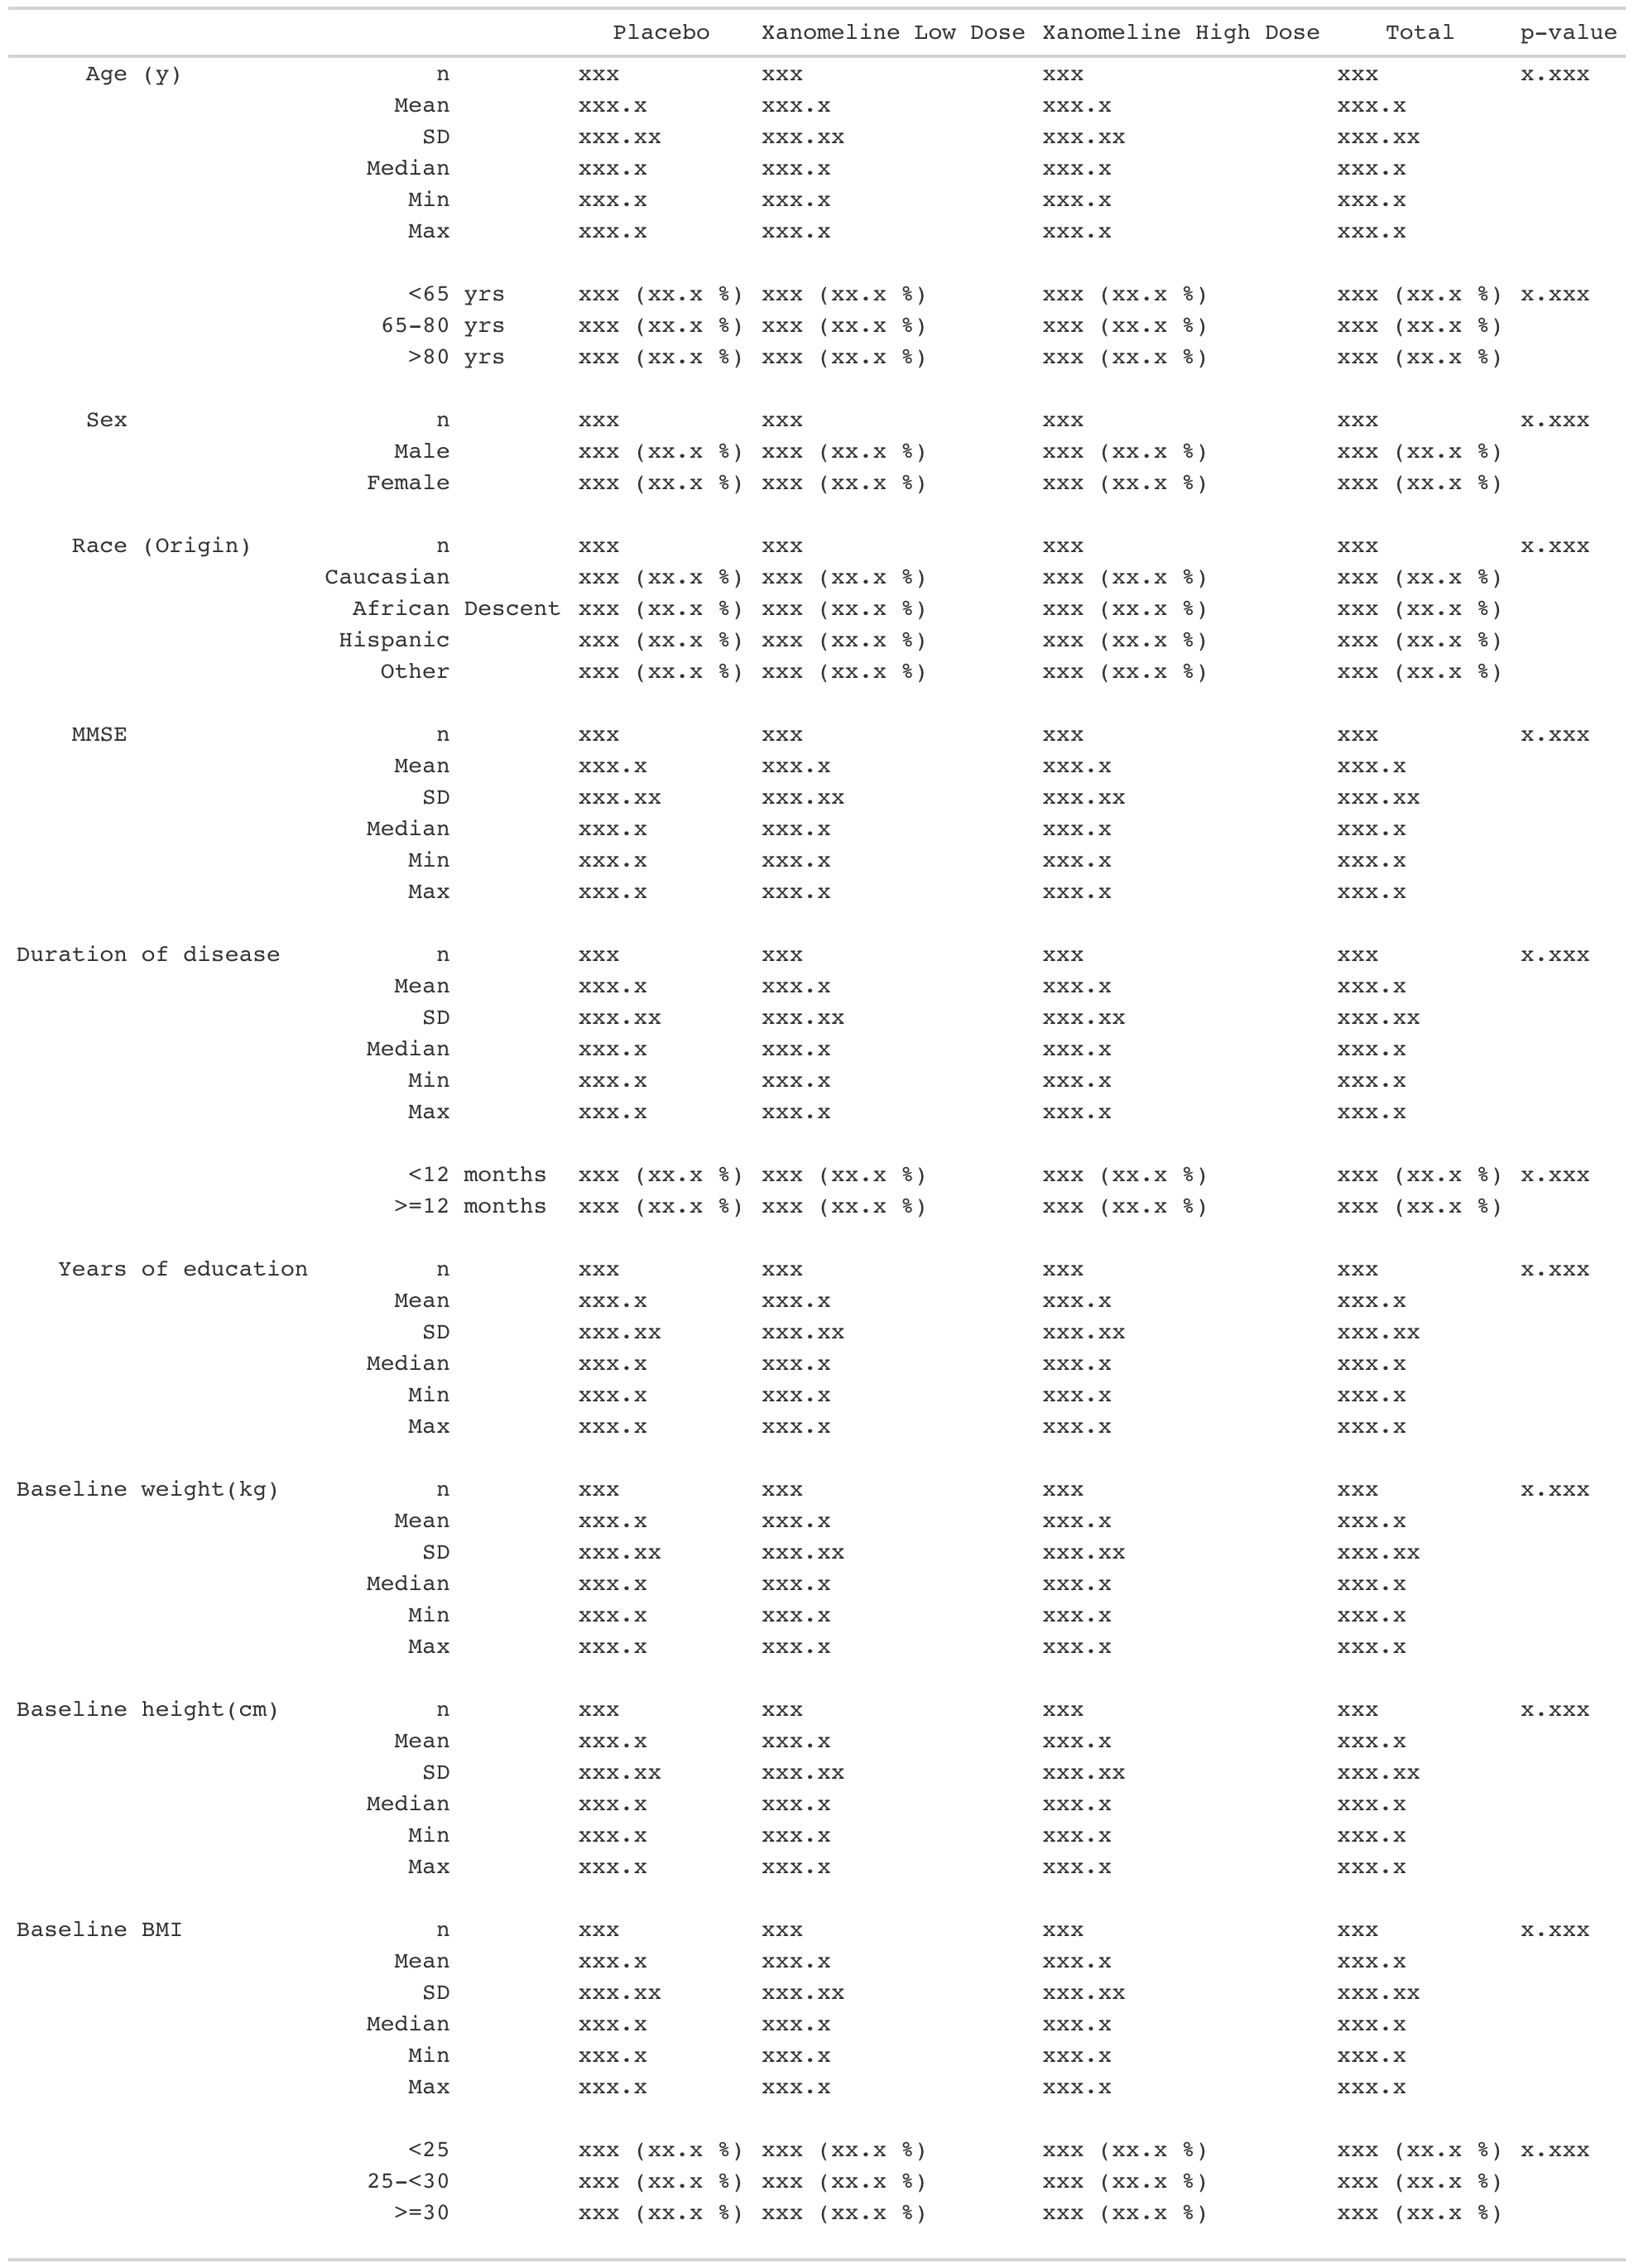 114 |
115 |
114 |
115 |