3 | {% else %}
4 |
10 |
--------------------------------------------------------------------------------
/doc/source/api/stats.rst:
--------------------------------------------------------------------------------
1 | .. currentmodule:: arviz
2 |
3 | .. _stats_api:
4 |
5 | Stats
6 | -----
7 |
8 | .. autosummary::
9 | :toctree: generated/
10 |
11 | apply_test_function
12 | compare
13 | hdi
14 | kde
15 | loo
16 | loo_pit
17 | psislw
18 | r2_score
19 | summary
20 | waic
21 |
--------------------------------------------------------------------------------
/examples/bokeh/bokeh_plot_ppc_cumulative.py:
--------------------------------------------------------------------------------
1 | """
2 | Posterior Predictive Check Cumulative Plot
3 | ==========================================
4 | """
5 |
6 | import arviz as az
7 |
8 | data = az.load_arviz_data("non_centered_eight")
9 | ax = az.plot_ppc(data, alpha=0.03, kind="cumulative", figsize=(12, 6), backend="bokeh")
10 |
--------------------------------------------------------------------------------
/examples/bokeh/bokeh_plot_forest.py:
--------------------------------------------------------------------------------
1 | """
2 | Forest Plot
3 | ===========
4 | """
5 |
6 | import arviz as az
7 |
8 | centered_data = az.load_arviz_data("centered_eight")
9 | ax = az.plot_forest(
10 | centered_data,
11 | var_names=["~tau"],
12 | combined=False,
13 | figsize=(11.5, 5),
14 | backend="bokeh",
15 | )
16 |
--------------------------------------------------------------------------------
/examples/bokeh/bokeh_plot_posterior.py:
--------------------------------------------------------------------------------
1 | """
2 | Posterior Plot
3 | ==============
4 | """
5 |
6 | import arviz as az
7 |
8 | data = az.load_arviz_data("centered_eight")
9 |
10 | coords = {"school": ["Choate"]}
11 | ax = az.plot_posterior(
12 | data, var_names=["mu", "theta"], coords=coords, rope=(-1, 1), backend="bokeh"
13 | )
14 |
--------------------------------------------------------------------------------
/examples/matplotlib/mpl_plot_bpv.py:
--------------------------------------------------------------------------------
1 | """
2 | Bayesian u-value Plot
3 | =====================
4 | _gallery_category: Model Checking
5 | """
6 |
7 | import matplotlib.pyplot as plt
8 |
9 | import arviz as az
10 |
11 | az.style.use("arviz-doc")
12 |
13 | data = az.load_arviz_data("regression1d")
14 | az.plot_bpv(data)
15 |
16 | plt.show()
17 |
--------------------------------------------------------------------------------
/doc/source/api/wrappers.rst:
--------------------------------------------------------------------------------
1 | .. currentmodule:: arviz
2 |
3 | .. _wrappers_api:
4 |
5 | Wrappers
6 | --------
7 | Experimental feature
8 |
9 | .. autosummary::
10 | :toctree: generated/
11 |
12 | SamplingWrapper
13 | CmdStanPySamplingWrapper
14 | PyMCSamplingWrapper
15 | PyStanSamplingWrapper
16 | PyStan2SamplingWrapper
17 |
--------------------------------------------------------------------------------
/examples/bokeh/bokeh_plot_density_single.py:
--------------------------------------------------------------------------------
1 | """
2 | Density Plot
3 | ============
4 | """
5 |
6 | import arviz as az
7 |
8 | centered_data = az.load_arviz_data("centered_eight")
9 | ax = az.plot_density(
10 | [centered_data],
11 | data_labels=["Centered"],
12 | var_names=["theta"],
13 | shade=0.1,
14 | backend="bokeh",
15 | )
16 |
--------------------------------------------------------------------------------
/examples/bokeh/bokeh_plot_pair.py:
--------------------------------------------------------------------------------
1 | """
2 | Pair Plot
3 | =========
4 | """
5 |
6 | import arviz as az
7 |
8 | centered = az.load_arviz_data("centered_eight")
9 |
10 | coords = {"school": ["Choate", "Deerfield"]}
11 | ax = az.plot_pair(
12 | centered, var_names=["theta", "mu", "tau"], coords=coords, divergences=True, backend="bokeh"
13 | )
14 |
--------------------------------------------------------------------------------
/examples/matplotlib/mpl_plot_trace.py:
--------------------------------------------------------------------------------
1 | """
2 | Traceplot
3 | =========
4 | _gallery_category: Mixed Plots
5 | """
6 |
7 | import matplotlib.pyplot as plt
8 |
9 | import arviz as az
10 |
11 | az.style.use("arviz-doc")
12 |
13 | data = az.load_arviz_data("non_centered_eight")
14 | az.plot_trace(data, var_names=("tau", "mu"))
15 |
16 | plt.show()
17 |
--------------------------------------------------------------------------------
/requirements-docs.txt:
--------------------------------------------------------------------------------
1 | docutils
2 | ipython
3 | pickleshare
4 | numpydoc
5 | pydocstyle
6 | Sphinx>=5
7 | pydata-sphinx-theme>=0.13.0
8 | myst-parser
9 | myst-nb
10 | sphinx-notfound-page
11 | sphinx-copybutton
12 | bokeh>=3
13 | contourpy
14 | sphinx_design
15 | sphinx-codeautolink>=0.9.0
16 | jupyter-sphinx
17 | sphinxcontrib-youtube
18 | dm-tree>=0.1.8
19 |
--------------------------------------------------------------------------------
/doc/source/api/index.rst:
--------------------------------------------------------------------------------
1 | .. currentmodule:: arviz
2 |
3 | .. _api:
4 |
5 | API Reference
6 | =============
7 |
8 |
9 | .. toctree::
10 | :maxdepth: 2
11 |
12 | plots
13 | stats
14 | diagnostics
15 | stats_utils
16 | data
17 | inference_data
18 | plot_utils
19 | utils
20 | rcparams
21 | wrappers
22 | stats_refitting
23 |
--------------------------------------------------------------------------------
/examples/bokeh/bokeh_plot_forest_mixed.py:
--------------------------------------------------------------------------------
1 | """
2 | Forest Plot with ESS
3 | ====================
4 | """
5 |
6 | import arviz as az
7 |
8 | centered_data = az.load_arviz_data("centered_eight")
9 | ax = az.plot_forest(
10 | centered_data,
11 | var_names=["theta"],
12 | figsize=(11.5, 5),
13 | ess=True,
14 | # r_hat=True,
15 | backend="bokeh",
16 | )
17 |
--------------------------------------------------------------------------------
/examples/bokeh/bokeh_plot_kde_2d.py:
--------------------------------------------------------------------------------
1 | """
2 | 2D KDE
3 | ======
4 | """
5 |
6 | import numpy as np
7 |
8 | import arviz as az
9 |
10 | az.plot_kde(
11 | np.random.beta(2, 5, size=100),
12 | np.random.beta(2, 5, size=100),
13 | contour_kwargs={"levels": 30},
14 | contourf_kwargs={"alpha": 0.5, "levels": 30, "cmap": "viridis"},
15 | backend="bokeh",
16 | )
17 |
--------------------------------------------------------------------------------
/examples/matplotlib/mpl_plot_violin.py:
--------------------------------------------------------------------------------
1 | """
2 | Violin plot
3 | ===========
4 | _gallery_category: Distributions
5 | """
6 |
7 | import matplotlib.pyplot as plt
8 |
9 | import arviz as az
10 |
11 | az.style.use("arviz-doc")
12 |
13 | data = az.load_arviz_data("non_centered_eight")
14 | az.plot_violin(data, var_names=["mu", "tau"], figsize=(11.5, 5))
15 |
16 | plt.show()
17 |
--------------------------------------------------------------------------------
/examples/matplotlib/mpl_plot_autocorr.py:
--------------------------------------------------------------------------------
1 | """
2 | Autocorrelation Plot
3 | ====================
4 | _gallery_category: Inference Diagnostics
5 | """
6 |
7 | import matplotlib.pyplot as plt
8 |
9 | import arviz as az
10 |
11 | az.style.use("arviz-doc")
12 |
13 | data = az.load_arviz_data("centered_eight")
14 | az.plot_autocorr(data, var_names=("tau", "mu"))
15 |
16 | plt.show()
17 |
--------------------------------------------------------------------------------
/examples/matplotlib/mpl_plot_loo_pit_overlay.py:
--------------------------------------------------------------------------------
1 | """
2 | LOO-PIT Overlay Plot
3 | ====================
4 | _gallery_category: Model Checking
5 | """
6 |
7 | import matplotlib.pyplot as plt
8 |
9 | import arviz as az
10 |
11 | az.style.use("arviz-doc")
12 |
13 | idata = az.load_arviz_data("non_centered_eight")
14 |
15 | az.plot_loo_pit(idata=idata, y="obs")
16 |
17 | plt.show()
18 |
--------------------------------------------------------------------------------
/codecov.yml:
--------------------------------------------------------------------------------
1 | ignore:
2 | - arviz/tests/
3 |
4 | codecov:
5 | notify:
6 | after_n_builds: 6
7 |
8 | comment:
9 | behavior: default
10 | branches:
11 | - "main"
12 |
13 | coverage:
14 | status:
15 | project:
16 | default:
17 | target: auto
18 | threshold: 2%
19 |
20 | patch:
21 | default:
22 | target: 75%
23 |
--------------------------------------------------------------------------------
/examples/matplotlib/mpl_plot_ess_evolution.py:
--------------------------------------------------------------------------------
1 | """
2 | ESS Evolution Plot
3 | ==================
4 | _gallery_category: Inference Diagnostics
5 | """
6 |
7 | import matplotlib.pyplot as plt
8 |
9 | import arviz as az
10 |
11 | az.style.use("arviz-doc")
12 |
13 | idata = az.load_arviz_data("radon")
14 |
15 | az.plot_ess(idata, var_names=["b"], kind="evolution")
16 |
17 | plt.show()
18 |
--------------------------------------------------------------------------------
/examples/matplotlib/mpl_plot_ess_quantile.py:
--------------------------------------------------------------------------------
1 | """
2 | ESS Quantile Plot
3 | =================
4 | _gallery_category: Inference Diagnostics
5 | """
6 |
7 | import matplotlib.pyplot as plt
8 |
9 | import arviz as az
10 |
11 | az.style.use("arviz-doc")
12 |
13 | idata = az.load_arviz_data("radon")
14 |
15 | az.plot_ess(idata, var_names=["sigma"], kind="quantile")
16 |
17 | plt.show()
18 |
--------------------------------------------------------------------------------
/examples/matplotlib/mpl_plot_khat.py:
--------------------------------------------------------------------------------
1 | """
2 | Pareto Shape Plot
3 | =================
4 | _gallery_category: Model Comparison
5 | """
6 |
7 | import matplotlib.pyplot as plt
8 |
9 | import arviz as az
10 |
11 | az.style.use("arviz-doc")
12 |
13 | idata = az.load_arviz_data("radon")
14 | loo = az.loo(idata, pointwise=True)
15 |
16 | az.plot_khat(loo, show_bins=True)
17 |
18 | plt.show()
19 |
--------------------------------------------------------------------------------
/pyproject.toml:
--------------------------------------------------------------------------------
1 | [tool.black]
2 | line-length = 100
3 | extend_exclude = 'example_data'
4 |
5 | [tool.isort]
6 | multi_line_output = 3
7 | include_trailing_comma = true
8 | force_grid_wrap = 0
9 | use_parentheses = true
10 | line_length = 100
11 | skip = [
12 | "arviz/plots/backends/bokeh/__init__.py",
13 | "arviz/plots/backends/matplotlib/__init__.py",
14 | "arviz/__init__.py"
15 | ]
16 |
--------------------------------------------------------------------------------
/.github/workflows/rtd_link_description.yaml:
--------------------------------------------------------------------------------
1 | name: Read the Docs Pull Request Preview
2 | on:
3 | pull_request_target:
4 | types:
5 | - opened
6 |
7 | permissions:
8 | pull-requests: write
9 |
10 | jobs:
11 | documentation-links:
12 | runs-on: ubuntu-latest
13 | steps:
14 | - uses: readthedocs/actions/preview@v1
15 | with:
16 | project-slug: "arviz"
17 |
--------------------------------------------------------------------------------
/examples/bokeh/bokeh_plot_compare.py:
--------------------------------------------------------------------------------
1 | """
2 | Compare Plot
3 | ============
4 | """
5 |
6 | import arviz as az
7 |
8 | model_compare = az.compare(
9 | {
10 | "Centered 8 schools": az.load_arviz_data("centered_eight"),
11 | "Non-centered 8 schools": az.load_arviz_data("non_centered_eight"),
12 | }
13 | )
14 | ax = az.plot_compare(model_compare, figsize=(12, 4), backend="bokeh")
15 |
--------------------------------------------------------------------------------
/examples/matplotlib/mpl_plot_mcse_errorbar.py:
--------------------------------------------------------------------------------
1 | """
2 | Quantile MCSE Errobar Plot
3 | ==========================
4 | _gallery_category: Inference Diagnostics
5 | """
6 |
7 | import matplotlib.pyplot as plt
8 |
9 | import arviz as az
10 |
11 | az.style.use("arviz-doc")
12 |
13 | data = az.load_arviz_data("radon")
14 | az.plot_mcse(data, var_names=["sigma_a"], errorbar=True)
15 |
16 | plt.show()
17 |
--------------------------------------------------------------------------------
/examples/matplotlib/mpl_plot_trace_vlines.py:
--------------------------------------------------------------------------------
1 | """
2 | Traceplot rank_vlines
3 | =====================
4 | _gallery_category: Mixed Plots
5 | """
6 |
7 | import matplotlib.pyplot as plt
8 |
9 | import arviz as az
10 |
11 | az.style.use("arviz-doc")
12 |
13 | data = az.load_arviz_data("non_centered_eight")
14 | az.plot_trace(data, var_names=("tau", "mu"), kind="rank_vlines")
15 |
16 | plt.show()
17 |
--------------------------------------------------------------------------------
/examples/matplotlib/mpl_plot_energy.py:
--------------------------------------------------------------------------------
1 | """
2 | Energy Plot
3 | ===========
4 | _gallery_category: Inference Diagnostics
5 | """
6 |
7 | import matplotlib.pyplot as plt
8 |
9 | import arviz as az
10 |
11 | az.style.use("arviz-doc")
12 |
13 | data = az.load_arviz_data("centered_eight")
14 | ax = az.plot_energy(data, fill_color=("C0", "C1"))
15 |
16 | ax.set_title("Energy Plot")
17 |
18 | plt.show()
19 |
--------------------------------------------------------------------------------
/examples/matplotlib/mpl_plot_kde_quantiles.py:
--------------------------------------------------------------------------------
1 | """
2 | KDE quantiles
3 | =============
4 | _gallery_category: Distributions
5 | """
6 |
7 | import matplotlib.pyplot as plt
8 | import numpy as np
9 |
10 | import arviz as az
11 |
12 | az.style.use("arviz-doc")
13 |
14 | dist = np.random.beta(np.random.uniform(0.5, 10), 5, size=1000)
15 | az.plot_kde(dist, quantiles=[0.25, 0.5, 0.75])
16 |
17 | plt.show()
18 |
--------------------------------------------------------------------------------
/examples/matplotlib/mpl_plot_separation.py:
--------------------------------------------------------------------------------
1 | """
2 | Separation Plot
3 | ===============
4 | _gallery_category: Model Checking
5 | """
6 |
7 | import matplotlib.pyplot as plt
8 |
9 | import arviz as az
10 |
11 | az.style.use("arviz-doc")
12 |
13 | idata = az.load_arviz_data("classification10d")
14 |
15 | az.plot_separation(idata=idata, y="outcome", y_hat="outcome", figsize=(8, 1))
16 |
17 | plt.show()
18 |
--------------------------------------------------------------------------------
/examples/matplotlib/mpl_plot_bpv_tstat.py:
--------------------------------------------------------------------------------
1 | """
2 | Bayesian p-value with T statistic Plot
3 | ======================================
4 | _gallery_category: Model Checking
5 | """
6 |
7 | import matplotlib.pyplot as plt
8 |
9 | import arviz as az
10 |
11 | az.style.use("arviz-doc")
12 |
13 | data = az.load_arviz_data("regression1d")
14 | az.plot_bpv(data, kind="t_stat", t_stat="0.5")
15 |
16 | plt.show()
17 |
--------------------------------------------------------------------------------
/examples/matplotlib/mpl_plot_trace_bars.py:
--------------------------------------------------------------------------------
1 | """
2 | Rank Bars Diagnostic with KDE
3 | =============================
4 | _gallery_category: Mixed Plots
5 | """
6 |
7 | import matplotlib.pyplot as plt
8 |
9 | import arviz as az
10 |
11 | az.style.use("arviz-doc")
12 |
13 | data = az.load_arviz_data("non_centered_eight")
14 | az.plot_trace(data, var_names=("tau", "mu"), kind="rank_bars")
15 |
16 | plt.show()
17 |
--------------------------------------------------------------------------------
/examples/bokeh/bokeh_plot_pair_kde.py:
--------------------------------------------------------------------------------
1 | """
2 | KDE Pair Plot
3 | =============
4 | """
5 |
6 | import arviz as az
7 |
8 | centered = az.load_arviz_data("centered_eight")
9 |
10 | coords = {"school": ["Choate", "Deerfield"]}
11 | ax = az.plot_pair(
12 | centered,
13 | var_names=["theta", "mu", "tau"],
14 | kind="kde",
15 | coords=coords,
16 | divergences=True,
17 | backend="bokeh",
18 | )
19 |
--------------------------------------------------------------------------------
/examples/matplotlib/mpl_plot_ppc.py:
--------------------------------------------------------------------------------
1 | """
2 | Posterior Predictive Check Plot
3 | ===============================
4 | _gallery_category: Model Checking
5 | """
6 |
7 | import matplotlib.pyplot as plt
8 |
9 | import arviz as az
10 |
11 | az.style.use("arviz-doc")
12 |
13 | data = az.load_arviz_data("non_centered_eight")
14 | az.plot_ppc(data, data_pairs={"obs": "obs"}, alpha=0.03, textsize=14)
15 |
16 | plt.show()
17 |
--------------------------------------------------------------------------------
/examples/bokeh/bokeh_plot_forest_ridge.py:
--------------------------------------------------------------------------------
1 | """
2 | Ridgeplot
3 | =========
4 | """
5 |
6 | import arviz as az
7 |
8 | rugby_data = az.load_arviz_data("rugby")
9 | ax = az.plot_forest(
10 | rugby_data,
11 | kind="ridgeplot",
12 | var_names=["defs"],
13 | linewidth=4,
14 | combined=True,
15 | ridgeplot_overlap=1.5,
16 | colors="blue",
17 | figsize=(9, 4),
18 | backend="bokeh",
19 | )
20 |
--------------------------------------------------------------------------------
/examples/matplotlib/mpl_plot_dot.py:
--------------------------------------------------------------------------------
1 | """
2 | Dot Plot
3 | =========
4 | _gallery_category: Distributions
5 | """
6 |
7 | import matplotlib.pyplot as plt
8 | import numpy as np
9 |
10 | import arviz as az
11 |
12 | az.style.use("arviz-doc")
13 |
14 | data = np.random.normal(0, 1, 1000)
15 | ax = az.plot_dot(data, dotcolor="C1", point_interval=True)
16 |
17 | ax.set_title("Gaussian Distribution")
18 |
19 | plt.show()
20 |
--------------------------------------------------------------------------------
/examples/matplotlib/mpl_plot_ess_local.py:
--------------------------------------------------------------------------------
1 | """
2 | ESS Local Plot
3 | ==============
4 | _gallery_category: Inference Diagnostics
5 | """
6 |
7 | import matplotlib.pyplot as plt
8 |
9 | import arviz as az
10 |
11 | az.style.use("arviz-doc")
12 |
13 | idata = az.load_arviz_data("non_centered_eight")
14 |
15 | az.plot_ess(idata, var_names=["mu"], kind="local", marker="_", ms=20, mew=2, rug=True)
16 |
17 | plt.show()
18 |
--------------------------------------------------------------------------------
/examples/matplotlib/mpl_plot_bf.py:
--------------------------------------------------------------------------------
1 | """
2 | Bayes Factor Plot
3 | =================
4 | _gallery_category: Model Comparison
5 | """
6 |
7 | import matplotlib.pyplot as plt
8 | import numpy as np
9 | import arviz as az
10 |
11 | idata = az.from_dict(
12 | posterior={"a": np.random.normal(1, 0.5, 5000)}, prior={"a": np.random.normal(0, 1, 5000)}
13 | )
14 |
15 | az.plot_bf(idata, var_name="a", ref_val=0)
16 | plt.show()
17 |
--------------------------------------------------------------------------------
/arviz/wrappers/__init__.py:
--------------------------------------------------------------------------------
1 | """Sampling wrappers."""
2 |
3 | from .base import SamplingWrapper
4 | from .wrap_stan import PyStan2SamplingWrapper, PyStanSamplingWrapper, CmdStanPySamplingWrapper
5 | from .wrap_pymc import PyMCSamplingWrapper
6 |
7 | __all__ = [
8 | "CmdStanPySamplingWrapper",
9 | "PyMCSamplingWrapper",
10 | "PyStan2SamplingWrapper",
11 | "PyStanSamplingWrapper",
12 | "SamplingWrapper",
13 | ]
14 |
--------------------------------------------------------------------------------
/examples/matplotlib/mpl_plot_trace_circ.py:
--------------------------------------------------------------------------------
1 | """
2 | Traceplot with Circular Variables
3 | =================================
4 | _gallery_category: Mixed Plots
5 | """
6 |
7 | import matplotlib.pyplot as plt
8 |
9 | import arviz as az
10 |
11 | az.style.use("arviz-doc")
12 |
13 | data = az.load_arviz_data("glycan_torsion_angles")
14 | az.plot_trace(data, var_names=["tors", "E"], circ_var_names=["tors"])
15 |
16 | plt.show()
17 |
--------------------------------------------------------------------------------
/examples/matplotlib/mpl_plot_elpd.py:
--------------------------------------------------------------------------------
1 | """
2 | ELPD Plot
3 | =========
4 | _gallery_category: Model Comparison
5 | """
6 |
7 | import matplotlib.pyplot as plt
8 |
9 | import arviz as az
10 |
11 | az.style.use("arviz-doc")
12 |
13 | d1 = az.load_arviz_data("centered_eight")
14 | d2 = az.load_arviz_data("non_centered_eight")
15 |
16 | az.plot_elpd({"Centered eight": d1, "Non centered eight": d2}, xlabels=True)
17 |
18 | plt.show()
19 |
--------------------------------------------------------------------------------
/.readthedocs.yaml:
--------------------------------------------------------------------------------
1 | # Read the Docs configuration file
2 | # See https://docs.readthedocs.io/en/stable/config-file/v2.html for details
3 | version: 2
4 |
5 | build:
6 | os: ubuntu-22.04
7 | tools:
8 | python: "3.11"
9 |
10 | sphinx:
11 | configuration: doc/source/conf.py
12 |
13 | python:
14 | install:
15 | - requirements: requirements.txt
16 | - requirements: requirements-docs.txt
17 | - method: pip
18 | path: .
19 |
--------------------------------------------------------------------------------
/examples/matplotlib/mpl_plot_parallel.py:
--------------------------------------------------------------------------------
1 | """
2 | Parallel Plot
3 | =============
4 | _gallery_category: Inference Diagnostics
5 | """
6 |
7 | import matplotlib.pyplot as plt
8 |
9 | import arviz as az
10 |
11 | az.style.use("arviz-doc")
12 |
13 | data = az.load_arviz_data("centered_eight")
14 | ax = az.plot_parallel(data, var_names=["theta", "tau", "mu"])
15 | ax.set_xticklabels(ax.get_xticklabels(), rotation=45)
16 |
17 | plt.show()
18 |
--------------------------------------------------------------------------------
/examples/matplotlib/mpl_plot_ppc_cumulative.py:
--------------------------------------------------------------------------------
1 | """
2 | Posterior Predictive Check Cumulative Plot
3 | ==========================================
4 | _gallery_category: Model Checking
5 | """
6 |
7 | import matplotlib.pyplot as plt
8 |
9 | import arviz as az
10 |
11 | az.style.use("arviz-doc")
12 |
13 | data = az.load_arviz_data("non_centered_eight")
14 | az.plot_ppc(data, alpha=0.05, kind="cumulative", textsize=14)
15 |
16 | plt.show()
17 |
--------------------------------------------------------------------------------
/examples/bokeh/bokeh_plot_forest_comparison.py:
--------------------------------------------------------------------------------
1 | """
2 | Forest Plot Comparison
3 | ======================
4 | """
5 |
6 | import arviz as az
7 |
8 | centered_data = az.load_arviz_data("centered_eight")
9 | non_centered_data = az.load_arviz_data("non_centered_eight")
10 | ax = az.plot_forest(
11 | [centered_data, non_centered_data],
12 | model_names=["Centered", "Non Centered"],
13 | var_names=["mu"],
14 | backend="bokeh",
15 | )
16 |
--------------------------------------------------------------------------------
/examples/bokeh/bokeh_plot_pair_hex.py:
--------------------------------------------------------------------------------
1 | """
2 | Hexbin PairPlot
3 | ===============
4 | """
5 |
6 | import arviz as az
7 |
8 | centered = az.load_arviz_data("centered_eight")
9 |
10 | coords = {"school": ["Choate", "Deerfield"]}
11 | ax = az.plot_pair(
12 | centered,
13 | var_names=["theta", "mu", "tau"],
14 | kind="hexbin",
15 | coords=coords,
16 | colorbar=True,
17 | divergences=True,
18 | backend="bokeh",
19 | )
20 |
--------------------------------------------------------------------------------
/examples/matplotlib/mpl_plot_mcse.py:
--------------------------------------------------------------------------------
1 | """
2 | Quantile Monte Carlo Standard Error Plot
3 | ========================================
4 | _gallery_category: Inference Diagnostics
5 | """
6 |
7 | import matplotlib.pyplot as plt
8 |
9 | import arviz as az
10 |
11 | az.style.use("arviz-doc")
12 |
13 | data = az.load_arviz_data("centered_eight")
14 | az.plot_mcse(data, var_names=["tau", "mu"], rug=True, extra_methods=True)
15 |
16 | plt.show()
17 |
--------------------------------------------------------------------------------
/examples/matplotlib/mpl_plot_rank.py:
--------------------------------------------------------------------------------
1 | """
2 | Rank plot
3 | =========
4 | _gallery_category: Inference Diagnostics
5 | """
6 |
7 | import matplotlib.pyplot as plt
8 |
9 | import arviz as az
10 |
11 | az.style.use("arviz-doc")
12 |
13 | fig, axes = plt.subplots(1, 2)
14 |
15 | data = az.load_arviz_data("centered_eight")
16 | az.plot_rank(data, var_names=("tau", "mu"), ax=axes)
17 |
18 | fig.suptitle("Rank (All Chains)")
19 |
20 | plt.show()
21 |
--------------------------------------------------------------------------------
/arviz/preview.py:
--------------------------------------------------------------------------------
1 | # pylint: disable=unused-import,unused-wildcard-import,wildcard-import
2 | """Expose features from arviz-xyz refactored packages inside ``arviz.preview`` namespace."""
3 |
4 | try:
5 | from arviz_base import *
6 | except ModuleNotFoundError:
7 | pass
8 |
9 | try:
10 | import arviz_stats
11 | except ModuleNotFoundError:
12 | pass
13 |
14 | try:
15 | from arviz_plots import *
16 | except ModuleNotFoundError:
17 | pass
18 |
--------------------------------------------------------------------------------
/examples/bokeh/bokeh_plot_density.py:
--------------------------------------------------------------------------------
1 | """
2 | Density Plot (Comparison)
3 | =========================
4 | """
5 |
6 | import arviz as az
7 |
8 | centered_data = az.load_arviz_data("centered_eight")
9 | non_centered_data = az.load_arviz_data("non_centered_eight")
10 | ax = az.plot_density(
11 | [centered_data, non_centered_data],
12 | data_labels=["Centered", "Non Centered"],
13 | var_names=["theta"],
14 | shade=0.1,
15 | backend="bokeh",
16 | )
17 |
--------------------------------------------------------------------------------
/examples/matplotlib/mpl_plot_forest.py:
--------------------------------------------------------------------------------
1 | """
2 | Forest Plot
3 | ===========
4 | _gallery_category: Distributions
5 | """
6 |
7 | import matplotlib.pyplot as plt
8 |
9 | import arviz as az
10 |
11 | az.style.use("arviz-doc")
12 |
13 | centered_data = az.load_arviz_data("centered_eight")
14 | ax = az.plot_forest(
15 | centered_data,
16 | var_names=["~tau"],
17 | combined=False,
18 | figsize=(11.5, 5),
19 | colors="C1",
20 | )
21 |
22 | plt.show()
23 |
--------------------------------------------------------------------------------
/examples/matplotlib/mpl_plot_loo_pit_ecdf.py:
--------------------------------------------------------------------------------
1 | """
2 | LOO-PIT ECDF Plot
3 | =================
4 | _gallery_category: Model Checking
5 | Plot LOO predictive ECDF compared to ECDF of uniform distribution to assess predictive calibration.
6 | """
7 |
8 | import matplotlib.pyplot as plt
9 |
10 | import arviz as az
11 |
12 | az.style.use("arviz-doc")
13 |
14 | idata = az.load_arviz_data("radon")
15 |
16 | az.plot_loo_pit(idata, y="y", ecdf=True)
17 |
18 | plt.show()
19 |
--------------------------------------------------------------------------------
/examples/bokeh/bokeh_plot_posterior_combinedims.py:
--------------------------------------------------------------------------------
1 | """
2 | Posterior Plot (reducing school dimension)
3 | ==========================================
4 | """
5 |
6 | import arviz as az
7 |
8 | data = az.load_arviz_data("centered_eight")
9 |
10 | coords = {"school": ["Choate", "Mt. Hermon", "Deerfield"]}
11 | ax = az.plot_posterior(
12 | data,
13 | var_names=["mu", "theta"],
14 | combine_dims={"school"},
15 | coords=coords,
16 | backend="bokeh",
17 | )
18 |
--------------------------------------------------------------------------------
/doc/_templates/layout.html:
--------------------------------------------------------------------------------
1 | {% extends "!layout.html" %}
2 |
3 |
4 | {%- block scripts_end %}
5 | {{ super() }}
6 | {% if not READTHEDOCS %}
7 |
13 | {% endif %}
14 | {%- endblock %}
15 |
--------------------------------------------------------------------------------
/examples/bokeh/bokeh_plot_kde_2d_hdi.py:
--------------------------------------------------------------------------------
1 | """
2 | 2D KDE with HDI Contours
3 | ========================
4 | """
5 |
6 | import numpy as np
7 |
8 | import arviz as az
9 |
10 | rng = np.random.default_rng()
11 | data = rng.multivariate_normal([2, 2], [[1, 0.4], [0.4, 0.8]], 1000000)
12 |
13 | az.plot_kde(
14 | data[:, 0],
15 | data[:, 1],
16 | hdi_probs=[0.393, 0.865, 0.989], # 1, 2 and 3 sigma contours
17 | contourf_kwargs={"cmap": "Blues"},
18 | backend="bokeh",
19 | )
20 |
--------------------------------------------------------------------------------
/examples/matplotlib/mpl_plot_kde_2d.py:
--------------------------------------------------------------------------------
1 | """
2 | 2D KDE
3 | ======
4 | _gallery_category: Distributions
5 | """
6 |
7 | import matplotlib.pyplot as plt
8 | import numpy as np
9 |
10 | import arviz as az
11 |
12 | az.style.use("arviz-doc")
13 |
14 | az.plot_kde(
15 | np.random.beta(2, 5, size=100),
16 | np.random.beta(2, 5, size=100),
17 | contour_kwargs={"colors": None, "cmap": plt.cm.viridis, "levels": 30},
18 | contourf_kwargs={"alpha": 0.5, "levels": 30},
19 | )
20 |
21 | plt.show()
22 |
--------------------------------------------------------------------------------
/examples/matplotlib/mpl_plot_forest_mixed.py:
--------------------------------------------------------------------------------
1 | """
2 | Forest Plot with ESS
3 | ====================
4 | _gallery_category: Mixed Plots
5 | """
6 |
7 | import matplotlib.pyplot as plt
8 |
9 | import arviz as az
10 |
11 | az.style.use("arviz-doc")
12 |
13 | centered_data = az.load_arviz_data("centered_eight")
14 | ax = az.plot_forest(
15 | centered_data,
16 | var_names=["theta"],
17 | figsize=(11.5, 5),
18 | colors="C1",
19 | ess=True,
20 | # r_hat=True,
21 | )
22 |
23 | plt.show()
24 |
--------------------------------------------------------------------------------
/examples/matplotlib/mpl_plot_hdi.py:
--------------------------------------------------------------------------------
1 | """
2 | Plot HDI
3 | ========
4 | _gallery_category: Regression or Time Series
5 | """
6 |
7 | import matplotlib.pyplot as plt
8 | import numpy as np
9 |
10 | import arviz as az
11 |
12 | az.style.use("arviz-doc")
13 |
14 | x_data = np.random.normal(0, 1, 100)
15 | y_data = 2 + x_data * 0.5
16 | y_data_rep = np.random.normal(y_data, 0.5, (4, 200, 100))
17 | ax = az.plot_hdi(x_data, y_data_rep, plot_kwargs={"ls": "--"})
18 | ax.plot(x_data, y_data)
19 |
20 | plt.show()
21 |
--------------------------------------------------------------------------------
/examples/matplotlib/mpl_plot_joint.py:
--------------------------------------------------------------------------------
1 | """
2 | Joint Plot
3 | ==========
4 | _gallery_category: Distributions
5 | """
6 |
7 | import matplotlib.pyplot as plt
8 |
9 | import arviz as az
10 |
11 | az.style.use("arviz-doc")
12 |
13 | data = az.load_arviz_data("non_centered_eight")
14 |
15 | az.plot_pair(
16 | data,
17 | var_names=["theta"],
18 | coords={"school": ["Choate", "Phillips Andover"]},
19 | kind="hexbin",
20 | marginals=True,
21 | figsize=(11.5, 11.5),
22 | )
23 | plt.show()
24 |
--------------------------------------------------------------------------------
/examples/matplotlib/mpl_plot_pair.py:
--------------------------------------------------------------------------------
1 | """
2 | Pair Plot
3 | =========
4 | _gallery_category: Inference Diagnostics
5 | """
6 |
7 | import matplotlib.pyplot as plt
8 |
9 | import arviz as az
10 |
11 | az.style.use("arviz-doc")
12 |
13 | data = az.load_arviz_data("centered_eight")
14 |
15 | coords = {"school": ["Choate", "Deerfield"]}
16 | az.plot_pair(
17 | data,
18 | var_names=["theta", "mu", "tau"],
19 | coords=coords,
20 | divergences=True,
21 | textsize=22,
22 | )
23 |
24 | plt.show()
25 |
--------------------------------------------------------------------------------
/examples/matplotlib/mpl_plot_pair_kde.py:
--------------------------------------------------------------------------------
1 | """
2 | KDE Pair Plot
3 | =============
4 | _gallery_category: Distributions
5 | """
6 |
7 | import matplotlib.pyplot as plt
8 |
9 | import arviz as az
10 |
11 | az.style.use("arviz-doc")
12 |
13 | data = az.load_arviz_data("centered_eight")
14 |
15 | coords = {"school": ["Choate", "Deerfield"]}
16 | az.plot_pair(
17 | data,
18 | var_names=["theta", "mu", "tau"],
19 | kind="kde",
20 | coords=coords,
21 | textsize=22,
22 | )
23 |
24 | plt.show()
25 |
--------------------------------------------------------------------------------
/examples/bokeh/bokeh_plot_joint.py:
--------------------------------------------------------------------------------
1 | """
2 | Joint Plot
3 | ==========
4 | """
5 |
6 | import arviz as az
7 |
8 | data = az.load_arviz_data("non_centered_eight")
9 |
10 | ax = az.plot_pair(
11 | data,
12 | var_names=["theta"],
13 | coords={"school": ["Choate", "Phillips Andover"]},
14 | kind="hexbin",
15 | figsize=(8, 8),
16 | marginals=True,
17 | marginal_kwargs={"plot_kwargs": {"line_width": 3, "line_color": "black"}},
18 | hexbin_kwargs={"size": 1.5},
19 | backend="bokeh",
20 | )
21 |
--------------------------------------------------------------------------------
/examples/matplotlib/mpl_plot_pair_hex.py:
--------------------------------------------------------------------------------
1 | """
2 | Hexbin PairPlot
3 | ===============
4 | _gallery_category: Distributions
5 | """
6 |
7 | import matplotlib.pyplot as plt
8 |
9 | import arviz as az
10 |
11 | az.style.use("arviz-doc")
12 |
13 | centered = az.load_arviz_data("centered_eight")
14 |
15 | coords = {"school": ["Choate", "Deerfield"]}
16 | az.plot_pair(
17 | centered,
18 | var_names=["theta", "mu", "tau"],
19 | kind="hexbin",
20 | coords=coords,
21 | colorbar=True,
22 | )
23 | plt.show()
24 |
--------------------------------------------------------------------------------
/examples/matplotlib/mpl_plot_compare.py:
--------------------------------------------------------------------------------
1 | """
2 | Compare Plot
3 | ============
4 | _gallery_category: Model Comparison
5 | """
6 |
7 | import matplotlib.pyplot as plt
8 |
9 | import arviz as az
10 |
11 | az.style.use("arviz-doc")
12 |
13 | model_compare = az.compare(
14 | {
15 | "Centered 8 schools": az.load_arviz_data("centered_eight"),
16 | "Non-centered 8 schools": az.load_arviz_data("non_centered_eight"),
17 | }
18 | )
19 | az.plot_compare(model_compare, figsize=(11.5, 5))
20 |
21 | plt.show()
22 |
--------------------------------------------------------------------------------
/examples/matplotlib/mpl_plot_ecdf.py:
--------------------------------------------------------------------------------
1 | """
2 | ECDF Plot
3 | =========
4 | _gallery_category: Distributions
5 | """
6 |
7 | import warnings
8 | import matplotlib.pyplot as plt
9 | from scipy.stats import norm
10 |
11 | import arviz as az
12 |
13 | az.style.use("arviz-doc")
14 |
15 | sample = norm(0, 1).rvs(1000)
16 | distribution = norm(0, 1)
17 |
18 | warnings.filterwarnings("ignore", category=az.utils.BehaviourChangeWarning)
19 |
20 | az.plot_ecdf(sample, cdf=distribution.cdf, confidence_bands=True)
21 |
22 | plt.show()
23 |
--------------------------------------------------------------------------------
/scripts/lint.sh:
--------------------------------------------------------------------------------
1 | #! /bin/bash
2 |
3 | set -ex # fail on first error, print commands
4 |
5 | SRC_DIR=${SRC_DIR:-`pwd`}
6 |
7 | echo "Checking documentation..."
8 | python -m pydocstyle --convention=numpy ${SRC_DIR}/arviz/
9 | echo "Success!"
10 |
11 | echo "Checking code style with black..."
12 | python -m black -l 100 --check ${SRC_DIR}/arviz/ ${SRC_DIR}/examples/ ${SRC_DIR}/asv_benchmarks/
13 | echo "Success!"
14 |
15 | echo "Checking code style with pylint..."
16 | python -m pylint ${SRC_DIR}/arviz/
17 | echo "Success!"
18 |
--------------------------------------------------------------------------------
/arviz/plots/backends/bokeh/bfplot.py:
--------------------------------------------------------------------------------
1 | """Bokeh Bayes Factor plot."""
2 |
3 |
4 | def plot_bf(
5 | ax,
6 | nvars,
7 | ngroups,
8 | figsize,
9 | dc_plotters,
10 | legend,
11 | groups,
12 | textsize,
13 | labeller,
14 | prior_kwargs,
15 | posterior_kwargs,
16 | observed_kwargs,
17 | backend_kwargs,
18 | show,
19 | ):
20 | """Bokeh Bayes Factor plot."""
21 | raise NotImplementedError(
22 | "The bokeh backend is still under development. Use matplotlib backend."
23 | )
24 |
--------------------------------------------------------------------------------
/doc/source/user_guide/plotting.md:
--------------------------------------------------------------------------------
1 | (plotting_user_guide)=
2 | # Plotting
3 |
4 | ArviZ provides multiple plotting functions for different functionalities.
5 | You can browse all the functions in the `plot` module {ref}`by name
` or
6 | {ref}`by example output image `.
7 |
8 | The pages in this section will cover common functionality between several plotting
9 | functions in tutorial and how-to guide format.
10 |
11 | ```{toctree}
12 | plots_arguments_guide
13 | plotting_with_matplotlib
14 | plotting_with_bokeh
15 | ```
16 |
--------------------------------------------------------------------------------
/examples/bokeh/bokeh_plot_pair_point_estimate.py:
--------------------------------------------------------------------------------
1 | """
2 | Point Estimate Pairplot
3 | =======================
4 | """
5 |
6 | import arviz as az
7 |
8 | centered = az.load_arviz_data("centered_eight")
9 |
10 | coords = {"school": ["Choate", "Deerfield"]}
11 | ax = az.plot_pair(
12 | centered,
13 | var_names=["mu", "theta"],
14 | kind=["scatter", "kde"],
15 | kde_kwargs={"fill_last": False},
16 | marginals=True,
17 | coords=coords,
18 | point_estimate="median",
19 | figsize=(10, 8),
20 | backend="bokeh",
21 | )
22 |
--------------------------------------------------------------------------------
/doc/source/contributing/review_prs.md:
--------------------------------------------------------------------------------
1 | (review_prs)=
2 | # Review PRs
3 |
4 | :::{caution} Page in construction
5 | :::
6 |
7 | :::{tip}
8 | Start preparing to be a PR reviewer by looking at how
9 | core contributors approach reviews. It will serve
10 | as a way to see which ways of interacting with contributors work
11 | best while also familiarizing with the developer guide,
12 | coding/documentation conventions and styles
13 | :::
14 |
15 | The best place to start is the {ref}`pr_checklist`. Make sure all the
16 | recommendations outlined there are followed.
17 |
--------------------------------------------------------------------------------
/doc/source/contributing/outreach.md:
--------------------------------------------------------------------------------
1 | (oureach_contrib)=
2 | # Outreach
3 |
4 | :::{caution} Page in construction
5 | :::
6 |
7 | You can also contribute to ArviZ by doing outreach, writing blogposts, getting
8 | people to use it at your company or university, helping external libraries integrate with ArviZ (in
9 | any programming language of your choice).
10 |
11 | If you have a website or blog where you often post about ArviZ, a library that integrates with ArviZ reach out to us or
12 | open a PR to add your blog to {ref}`community`, we'd love to hear from you!
13 |
--------------------------------------------------------------------------------
/arviz/plots/backends/bokeh/distcomparisonplot.py:
--------------------------------------------------------------------------------
1 | """Bokeh Density Comparison plot."""
2 |
3 |
4 | def plot_dist_comparison(
5 | ax,
6 | nvars,
7 | ngroups,
8 | figsize,
9 | dc_plotters,
10 | legend,
11 | groups,
12 | textsize,
13 | labeller,
14 | prior_kwargs,
15 | posterior_kwargs,
16 | observed_kwargs,
17 | backend_kwargs,
18 | show,
19 | ):
20 | """Bokeh Density Comparison plot."""
21 | raise NotImplementedError(
22 | "The bokeh backend is still under development. Use matplotlib backend."
23 | )
24 |
--------------------------------------------------------------------------------
/examples/bokeh/bokeh_plot_hdi.py:
--------------------------------------------------------------------------------
1 | """
2 | Plot HDI
3 | ========
4 | """
5 |
6 | import bokeh.plotting as bkp
7 | import numpy as np
8 |
9 | import arviz as az
10 |
11 | x_data = np.random.normal(0, 1, 100)
12 | y_data = 2 + x_data * 0.5
13 | y_data_rep = np.random.normal(y_data, 0.5, (4, 200, 100))
14 | x_data_sorted = np.sort(x_data)
15 |
16 | ax = az.plot_hdi(x_data, y_data_rep, color="red", backend="bokeh", show=False)
17 | ax.line(x_data_sorted, 2 + x_data_sorted * 0.5, line_color="black", line_width=3)
18 |
19 | if az.rcParams["plot.bokeh.show"]:
20 | bkp.show(ax)
21 |
--------------------------------------------------------------------------------
/examples/matplotlib/mpl_plot_density_single.py:
--------------------------------------------------------------------------------
1 | """
2 | Density Plot
3 | ============
4 | _gallery_category: Distributions
5 | """
6 |
7 | import matplotlib.pyplot as plt
8 |
9 | import arviz as az
10 |
11 | az.style.use("arviz-doc")
12 |
13 | centered_data = az.load_arviz_data("centered_eight")
14 |
15 | axes = az.plot_density(
16 | [centered_data],
17 | data_labels=["Centered"],
18 | var_names=["theta"],
19 | shade=0.2,
20 | )
21 |
22 | fig = axes.flatten()[0].get_figure()
23 | fig.suptitle("94% High Density Intervals for Theta")
24 |
25 | plt.show()
26 |
--------------------------------------------------------------------------------
/examples/bokeh/bokeh_plot_lm.py:
--------------------------------------------------------------------------------
1 | """
2 | Regression Plot.
3 | ==========================================
4 | """
5 |
6 | import xarray as xr
7 | import numpy as np
8 | import arviz as az
9 |
10 | data = az.load_arviz_data("regression1d")
11 | x = xr.DataArray(np.linspace(0, 1, 100))
12 | data.add_groups({"constant_data": {"x1": x}})
13 | data.constant_data["x"] = x
14 | data.posterior["y_model"] = (
15 | data.posterior["intercept"] + data.posterior["slope"] * data.constant_data["x"]
16 | )
17 |
18 | az.plot_lm(idata=data, y="y", x="x", y_model="y_model", backend="bokeh", figsize=(12, 6))
19 |
--------------------------------------------------------------------------------
/examples/matplotlib/mpl_plot_forest_ridge.py:
--------------------------------------------------------------------------------
1 | """
2 | Ridgeplot
3 | =========
4 | _gallery_category: Distributions
5 | """
6 |
7 | import matplotlib.pyplot as plt
8 |
9 | import arviz as az
10 |
11 | az.style.use("arviz-doc")
12 |
13 | rugby_data = az.load_arviz_data("rugby")
14 | axes = az.plot_forest(
15 | rugby_data,
16 | kind="ridgeplot",
17 | var_names=["defs"],
18 | linewidth=4,
19 | combined=True,
20 | ridgeplot_overlap=1.5,
21 | figsize=(11.5, 5),
22 | )
23 | axes[0].set_title("Relative defensive strength\nof Six Nation rugby teams")
24 |
25 | plt.show()
26 |
--------------------------------------------------------------------------------
/doc/source/getting_started/schools.stan:
--------------------------------------------------------------------------------
1 | data {
2 | int J;
3 | array[J] real y;
4 | array[J] real sigma;
5 | }
6 |
7 | parameters {
8 | real mu;
9 | real tau;
10 | array[J] real theta;
11 | }
12 |
13 | model {
14 | mu ~ normal(0, 5);
15 | tau ~ cauchy(0, 5);
16 | theta ~ normal(mu, tau);
17 | y ~ normal(theta, sigma);
18 | }
19 | generated quantities {
20 | array[J] real log_lik;
21 | array[J] real y_hat;
22 | for (j in 1:J) {
23 | log_lik[j] = normal_lpdf(y[j] | theta[j], sigma[j]);
24 | y_hat[j] = normal_rng(theta[j], sigma[j]);
25 | }
26 | }
--------------------------------------------------------------------------------
/arviz/data/io_datatree.py:
--------------------------------------------------------------------------------
1 | """Conversion between InferenceData and DataTree."""
2 |
3 | from .inference_data import InferenceData
4 |
5 |
6 | def to_datatree(data):
7 | """Convert InferenceData object to a :class:`~datatree.DataTree`.
8 |
9 | Parameters
10 | ----------
11 | data : InferenceData
12 | """
13 | return data.to_datatree()
14 |
15 |
16 | def from_datatree(datatree):
17 | """Create an InferenceData object from a :class:`~datatree.DataTree`.
18 |
19 | Parameters
20 | ----------
21 | datatree : DataTree
22 | """
23 | return InferenceData.from_datatree(datatree)
24 |
--------------------------------------------------------------------------------
/examples/bokeh/bokeh_plot_violin_single_sided.py:
--------------------------------------------------------------------------------
1 | """
2 | Single sided Violinplot
3 | =======================
4 |
5 | _thumb: .2, .8
6 | """
7 |
8 | import arviz as az
9 |
10 | data = az.load_arviz_data("rugby")
11 | labeller = az.labels.MapLabeller(var_name_map={"defs": "atts | defs"})
12 |
13 | p1 = az.plot_violin(
14 | data.posterior["atts"], side="left", backend="bokeh", show=False, labeller=labeller
15 | )
16 | p2 = az.plot_violin(
17 | data.posterior["defs"],
18 | side="right",
19 | ax=p1,
20 | backend="bokeh",
21 | shade_kwargs={"color": "lightsalmon"},
22 | labeller=labeller,
23 | )
24 |
--------------------------------------------------------------------------------
/examples/matplotlib/mpl_plot_posterior.py:
--------------------------------------------------------------------------------
1 | """
2 | Posterior Plot
3 | ==============
4 | _gallery_category: Distributions
5 | """
6 |
7 | import matplotlib.pyplot as plt
8 |
9 | import arviz as az
10 |
11 | az.style.use("arviz-doc")
12 |
13 | data = az.load_arviz_data("centered_eight")
14 |
15 | coords = {"school": ["Choate"]}
16 | axes = az.plot_posterior(
17 | data,
18 | var_names=["mu", "theta"],
19 | coords=coords,
20 | rope=(-1, 1),
21 | figsize=(11.5, 5),
22 | )
23 |
24 | fig = axes.flatten()[0].get_figure()
25 | fig.suptitle("Centered Eight: mu and theta for Choate")
26 |
27 | plt.show()
28 |
--------------------------------------------------------------------------------
/examples/bokeh/bokeh_plot_pair_kde_hdi.py:
--------------------------------------------------------------------------------
1 | """
2 | KDE Pair Plot with HDI Contours
3 | ===============================
4 | """
5 |
6 | import arviz as az
7 |
8 | centered = az.load_arviz_data("centered_eight")
9 |
10 | coords = {"school": ["Choate", "Deerfield"]}
11 | az.plot_pair(
12 | centered,
13 | var_names=["theta", "mu", "tau"],
14 | kind="kde",
15 | coords=coords,
16 | divergences=True,
17 | textsize=22,
18 | kde_kwargs={
19 | "hdi_probs": [0.3, 0.6, 0.9], # Plot 30%, 60% and 90% HDI contours
20 | "contourf_kwargs": {"cmap": "Blues"},
21 | },
22 | backend="bokeh",
23 | )
24 |
--------------------------------------------------------------------------------
/examples/matplotlib/mpl_plot_kde_2d_hdi.py:
--------------------------------------------------------------------------------
1 | """
2 | 2D KDE with HDI Contours
3 | ========================
4 | _gallery_category: Distributions
5 | """
6 |
7 | import matplotlib.pyplot as plt
8 | import numpy as np
9 |
10 | import arviz as az
11 |
12 | az.style.use("arviz-doc")
13 |
14 | rng = np.random.default_rng()
15 | data = rng.multivariate_normal([2, 2], [[1, 0.4], [0.4, 0.8]], 1000000)
16 |
17 | ax = az.plot_kde(
18 | data[:, 0],
19 | data[:, 1],
20 | hdi_probs=[0.393, 0.865, 0.989], # 1, 2 and 3 sigma contours
21 | contourf_kwargs={"cmap": "Blues"},
22 | )
23 |
24 | ax.set_aspect("equal")
25 | plt.show()
26 |
--------------------------------------------------------------------------------
/doc/source/api/utils.rst:
--------------------------------------------------------------------------------
1 | .. currentmodule:: arviz
2 |
3 | Utils
4 | -----
5 |
6 | Computing utils
7 | ...............
8 |
9 | .. autosummary::
10 | :toctree: generated/
11 | :template: class_no_members.rst
12 |
13 | Numba
14 | Dask
15 |
16 | Bokeh utils
17 | ...........
18 |
19 | .. autosummary::
20 | :toctree: generated/
21 |
22 | ColumnDataSource
23 | create_layout
24 | output_notebook
25 | output_file
26 | show_layout
27 | to_cds
28 |
29 | Matplotlib utils
30 | ................
31 |
32 | .. autosummary::
33 | :toctree: generated/
34 | :template: class_no_members.rst
35 |
36 | interactive_backend
37 |
--------------------------------------------------------------------------------
/examples/matplotlib/mpl_plot_dist.py:
--------------------------------------------------------------------------------
1 | """
2 | Dist Plot
3 | =========
4 | _gallery_category: Distributions
5 | """
6 |
7 | import matplotlib.pyplot as plt
8 | import numpy as np
9 |
10 | import arviz as az
11 |
12 | az.style.use("arviz-doc")
13 |
14 | data_poisson = np.random.poisson(4, 1000)
15 | data_gaussian = np.random.normal(0, 1, 1000)
16 |
17 | fig, ax = plt.subplots(1, 2)
18 | fig.suptitle("Distributions")
19 |
20 | ax[0].set_title("Poisson")
21 | az.plot_dist(data_poisson, color="C1", label="Poisson", ax=ax[0])
22 |
23 | ax[1].set_title("Gaussian")
24 | az.plot_dist(data_gaussian, color="C2", label="Gaussian", ax=ax[1])
25 |
26 | plt.show()
27 |
--------------------------------------------------------------------------------
/examples/matplotlib/mpl_plot_kde.py:
--------------------------------------------------------------------------------
1 | """
2 | KDE Plot
3 | ========
4 | _gallery_category: Distributions
5 | """
6 |
7 | import matplotlib.pyplot as plt
8 | import numpy as np
9 |
10 | import arviz as az
11 |
12 | az.style.use("arviz-doc")
13 |
14 | data = az.load_arviz_data("centered_eight")
15 |
16 | # Combine posterior draws for from xarray of (4,500) to ndarray (2000,)
17 | y_hat = np.concatenate(data.posterior_predictive["obs"].values)
18 |
19 | az.plot_kde(
20 | y_hat,
21 | label="Estimated Effect\n of SAT Prep",
22 | rug=True,
23 | plot_kwargs={"linewidth": 2},
24 | rug_kwargs={"alpha": 0.05},
25 | )
26 |
27 | plt.show()
28 |
--------------------------------------------------------------------------------
/examples/matplotlib/mpl_plot_pair_point_estimate.py:
--------------------------------------------------------------------------------
1 | """
2 | Point Estimate Pairplot
3 | =======================
4 | _gallery_category: Distributions
5 | """
6 |
7 | import matplotlib.pyplot as plt
8 |
9 | import arviz as az
10 |
11 | az.style.use("arviz-doc")
12 |
13 | data = az.load_arviz_data("centered_eight")
14 |
15 | coords = {"school": ["Choate", "Deerfield"]}
16 | ax = az.plot_pair(
17 | data,
18 | var_names=["mu", "theta"],
19 | kind=["scatter", "kde"],
20 | kde_kwargs={"fill_last": False},
21 | marginals=True,
22 | coords=coords,
23 | point_estimate="median",
24 | figsize=(11.5, 5),
25 | )
26 |
27 | plt.show()
28 |
--------------------------------------------------------------------------------
/examples/matplotlib/mpl_plot_forest_comparison.py:
--------------------------------------------------------------------------------
1 | """
2 | Forest Plot Comparison
3 | ======================
4 | _gallery_category: Distribution Comparison
5 | """
6 |
7 | import matplotlib.pyplot as plt
8 |
9 | import arviz as az
10 |
11 | az.style.use("arviz-doc")
12 |
13 | centered_data = az.load_arviz_data("centered_eight")
14 | non_centered_data = az.load_arviz_data("non_centered_eight")
15 | ax = az.plot_forest(
16 | [centered_data, non_centered_data],
17 | model_names=["Centered", "Non Centered"],
18 | var_names=["mu"],
19 | figsize=(11.5, 5),
20 | )
21 | ax[0].set_title("Estimated theta for eight schools model")
22 |
23 | plt.show()
24 |
--------------------------------------------------------------------------------
/arviz/data/example_data/README.md:
--------------------------------------------------------------------------------
1 | # ArviZ `InferenceData` examples
2 |
3 | This repository contains metadata of ArviZ InferenceData examples and the code used to generate some of the examples.
4 | Example models stored remotely are listed in `data_remote.json`.
5 | Example models stored locally are listed in `data_local.json`, and the data themselves are stored in `data/`.
6 | Inclusion of the code serves both as extra information on the models in the JSON files and to ease updating these examples whenever necessary.
7 |
8 | When applicable, code for a model should be added as an executable file (e.g. `.py` or `.ipynb`) to a directory in `code/` of the same name as the model.
9 |
--------------------------------------------------------------------------------
/examples/matplotlib/mpl_plot_lm.py:
--------------------------------------------------------------------------------
1 | """
2 | Regression Plot
3 | ===============
4 | _gallery_category: Regression or Time Series
5 | """
6 |
7 | import matplotlib.pyplot as plt
8 | import xarray as xr
9 | import numpy as np
10 | import arviz as az
11 |
12 | az.style.use("arviz-doc")
13 |
14 | data = az.load_arviz_data("regression1d")
15 | x = xr.DataArray(np.linspace(0, 1, 100))
16 | data.add_groups({"constant_data": {"x1": x}})
17 | data.constant_data["x"] = x
18 | data.posterior["y_model"] = (
19 | data.posterior["intercept"] + data.posterior["slope"] * data.constant_data["x"]
20 | )
21 | az.plot_lm(idata=data, y="y", x="x", y_model="y_model")
22 |
23 | plt.show()
24 |
--------------------------------------------------------------------------------
/doc/_templates/autosummary/class.rst:
--------------------------------------------------------------------------------
1 | {{ fullname | escape | underline}}
2 |
3 | .. currentmodule:: {{ module }}
4 |
5 | .. autoclass:: {{ objname }}
6 |
7 | {% block methods %}
8 | {% if methods %}
9 |
10 | .. rubric:: Methods
11 |
12 | .. autosummary::
13 | :toctree:
14 |
15 | {% for item in methods %}
16 | {{ objname }}.{{ item }}
17 | {%- endfor %}
18 | {% endif %}
19 | {% endblock %}
20 |
21 | {% block attributes %}
22 | {% if attributes %}
23 | .. rubric:: Attributes
24 |
25 | .. autosummary::
26 | {% for item in attributes %}
27 | ~{{ name }}.{{ item }}
28 | {%- endfor %}
29 | {% endif %}
30 | {% endblock %}
31 |
--------------------------------------------------------------------------------
/.github/ISSUE_TEMPLATE/bug-report.md:
--------------------------------------------------------------------------------
1 | ---
2 | name: 'Bug Report'
3 | about: Create a report to help us improve
4 |
5 | ---
6 |
7 | **Describe the bug**
8 | A clear and concise description of what the bug is.
9 |
10 | **To Reproduce**
11 | Steps to reproduce the behavior. Ideally a self-contained snippet of code, or link to a notebook or external code. Please include screenshots/images produced with ArviZ here, or the stacktrace including `arviz` code to help.
12 |
13 | **Expected behavior**
14 | A clear and concise description of what you expected to happen.
15 |
16 | **Additional context**
17 | Versions of `arviz` and other libraries used, operating system used, and anything else that may be useful.
18 |
--------------------------------------------------------------------------------
/examples/matplotlib/mpl_plot_density.py:
--------------------------------------------------------------------------------
1 | """
2 | Density Plot (Comparison)
3 | =========================
4 | _gallery_category: Distribution Comparison
5 | """
6 |
7 | import matplotlib.pyplot as plt
8 |
9 | import arviz as az
10 |
11 | az.style.use("arviz-doc")
12 |
13 | centered_data = az.load_arviz_data("centered_eight")
14 | non_centered_data = az.load_arviz_data("non_centered_eight")
15 |
16 | axes = az.plot_density(
17 | [centered_data, non_centered_data],
18 | data_labels=["Centered", "Non-Centered"],
19 | var_names=["theta"],
20 | shade=0.2,
21 | )
22 |
23 | fig = axes.flatten()[0].get_figure()
24 | fig.suptitle("94% High Density Intervals for Theta")
25 |
26 | plt.show()
27 |
--------------------------------------------------------------------------------
/doc/_templates/class_no_members.rst:
--------------------------------------------------------------------------------
1 | {{ fullname | escape | underline}}
2 |
3 | .. currentmodule:: {{ module }}
4 |
5 | .. autoclass:: {{ objname }}
6 |
7 | {% block methods %}
8 | {% if methods %}
9 |
10 | .. rubric:: Methods
11 |
12 | .. autosummary::
13 | {% for item in methods %}
14 | {% if item != "__init__" %}
15 | {{ item }}
16 | {% endif %}
17 | {%- endfor %}
18 | {% endif %}
19 | {% endblock %}
20 |
21 | {% block attributes %}
22 | {% if attributes %}
23 | .. rubric:: Attributes
24 |
25 | .. autosummary::
26 | {% for item in attributes %}
27 | ~{{ name }}.{{ item }}
28 | {%- endfor %}
29 | {% endif %}
30 | {% endblock %}
31 |
--------------------------------------------------------------------------------
/doc/source/api/plots.rst:
--------------------------------------------------------------------------------
1 | .. currentmodule:: arviz
2 |
3 | .. _plot_api:
4 |
5 | Plots
6 | -----
7 |
8 | .. autosummary::
9 | :toctree: generated/
10 |
11 | plot_autocorr
12 | plot_bf
13 | plot_bpv
14 | plot_compare
15 | plot_density
16 | plot_dist
17 | plot_dist_comparison
18 | plot_dot
19 | plot_ecdf
20 | plot_elpd
21 | plot_energy
22 | plot_ess
23 | plot_forest
24 | plot_hdi
25 | plot_kde
26 | plot_khat
27 | plot_loo_pit
28 | plot_lm
29 | plot_mcse
30 | plot_pair
31 | plot_parallel
32 | plot_posterior
33 | plot_ppc
34 | plot_rank
35 | plot_separation
36 | plot_trace
37 | plot_ts
38 | plot_violin
39 |
--------------------------------------------------------------------------------
/examples/matplotlib/mpl_plot_pair_kde_hdi.py:
--------------------------------------------------------------------------------
1 | """
2 | KDE Pair Plot with HDI Contours
3 | ===============================
4 | _gallery_category: Distributions
5 | """
6 |
7 | import matplotlib.pyplot as plt
8 |
9 | import arviz as az
10 |
11 | az.style.use("arviz-doc")
12 |
13 | centered = az.load_arviz_data("centered_eight")
14 |
15 | coords = {"school": ["Choate", "Deerfield"]}
16 | az.plot_pair(
17 | centered,
18 | var_names=["theta", "mu", "tau"],
19 | kind="kde",
20 | coords=coords,
21 | textsize=22,
22 | kde_kwargs={
23 | "hdi_probs": [0.3, 0.6, 0.9], # Plot 30%, 60% and 90% HDI contours
24 | "contourf_kwargs": {"cmap": "Blues"},
25 | },
26 | )
27 | plt.show()
28 |
--------------------------------------------------------------------------------
/doc/_templates/edit-this-page.html:
--------------------------------------------------------------------------------
1 | {% if sourcename is defined and theme_use_edit_page_button==true and page_source_suffix and "generated" not in sourcename %}
2 | {% set src = sourcename.split('.') %}
3 |
16 | {% endif %}
17 |
--------------------------------------------------------------------------------
/scripts/README.md:
--------------------------------------------------------------------------------
1 | # Scripts
2 | Various scripts that help with ArviZ maintenance
3 |
4 | #### container.sh
5 | Script that helps with building docker image, and running jupyter lab,
6 | jupyter notebooks, building docs, or getting a shell or testing
7 |
8 | #### container.ps1
9 | Same as container.sh
10 |
11 | Example:
12 |
13 | `powershell -File container.ps1 --lab`
14 |
15 | #### create_testenv.sh
16 | Script that helps install ArviZ on whatever computer is being used
17 |
18 | #### lint.sh
19 | Run all linters to check for code quality deviations
20 |
21 | #### install_miniconda.sh
22 | Install miniconda code environment managers and creates arviz environment
23 |
24 | #### Dockerfile
25 | Dockerfile for ArviZ image
26 |
--------------------------------------------------------------------------------
/.github/ISSUE_TEMPLATE/feature-request.md:
--------------------------------------------------------------------------------
1 | ---
2 | name: 'Feature Request'
3 | about: Suggest an idea for this project
4 |
5 | ---
6 |
7 | ## Tell us about it
8 |
9 | The more specific the better. You can assume you have access to any combination of datasets defined in the schema. When considering an implementation, keep in mind that
10 |
11 | - models in ArviZ can have one, or lots, of random variables,
12 | - each random variable can have very few or millions of draws,
13 | - each random variable can have 0 or many dimensions.
14 |
15 | ## Thoughts on implementation
16 |
17 | Not required, but if you have thoughts on how to implement the feature, that can be helpful! In case there are academic references, we welcome those here too.
18 |
--------------------------------------------------------------------------------
/examples/matplotlib/mpl_plot_posterior_combinedims.py:
--------------------------------------------------------------------------------
1 | """
2 | Posterior Plot (reducing school dimension)
3 | ==========================================
4 | _gallery_category: Distributions
5 | """
6 |
7 | import matplotlib.pyplot as plt
8 |
9 | import arviz as az
10 |
11 | az.style.use("arviz-doc")
12 |
13 | data = az.load_arviz_data("centered_eight")
14 |
15 | coords = {"school": ["Choate", "Mt. Hermon", "Deerfield"]}
16 | axes = az.plot_posterior(
17 | data,
18 | var_names=["mu", "theta"],
19 | combine_dims={"school"},
20 | coords=coords,
21 | figsize=(11.5, 5),
22 | )
23 |
24 | fig = axes.flatten()[0].get_figure()
25 | fig.suptitle("Centered Eight: mu and theta for reduced school dimension")
26 |
27 | plt.show()
28 |
--------------------------------------------------------------------------------
/azure-pipelines.yml:
--------------------------------------------------------------------------------
1 | # Python package
2 | # Create and test a Python package on multiple Python versions.
3 | # Add steps that analyze code, save the dist with the build record, publish to a PyPI-compatible index, and more:
4 | # https://docs.microsoft.com/azure/devops/pipelines/languages/python
5 | # -*- mode: yaml -*-
6 | trigger:
7 | branches:
8 | include:
9 | - main
10 | tags:
11 | include:
12 | - '*'
13 |
14 | pr:
15 | branches:
16 | include:
17 | - main
18 |
19 | jobs:
20 | - template: .azure-pipelines/azure-pipelines-base.yml
21 | - template: .azure-pipelines/azure-pipelines-external.yml
22 | - template: .azure-pipelines/azure-pipelines-benchmarks.yml
23 | - template: .azure-pipelines/azure-pipelines-wheel.yml
24 |
--------------------------------------------------------------------------------
/examples/bokeh/bokeh_plot_dist.py:
--------------------------------------------------------------------------------
1 | """
2 | Dist Plot Bokeh
3 | ===============
4 | """
5 |
6 | import bokeh.plotting as bkp
7 | import numpy as np
8 | from bokeh.layouts import row
9 |
10 | import arviz as az
11 |
12 | a = np.random.poisson(4, 1000)
13 | b = np.random.normal(0, 1, 1000)
14 |
15 | figure_kwargs = dict(height=500, width=500, output_backend="webgl")
16 | ax_poisson = bkp.figure(**figure_kwargs)
17 | ax_normal = bkp.figure(**figure_kwargs)
18 |
19 | az.plot_dist(a, color="black", label="Poisson", ax=ax_poisson, backend="bokeh", show=False)
20 | az.plot_dist(b, color="red", label="Gaussian", ax=ax_normal, backend="bokeh", show=False)
21 |
22 | ax = row(ax_poisson, ax_normal)
23 |
24 | if az.rcParams["plot.bokeh.show"]:
25 | bkp.show(ax)
26 |
--------------------------------------------------------------------------------
/examples/bokeh/bokeh_plot_kde.py:
--------------------------------------------------------------------------------
1 | """
2 | KDE Plot Bokeh
3 | ==============
4 | """
5 |
6 | import bokeh.plotting as bkp
7 | import numpy as np
8 |
9 | import arviz as az
10 |
11 | data = az.load_arviz_data("centered_eight")
12 |
13 | # Combine posterior draws for from xarray of (4,500) to ndarray (2000,)
14 | y_hat = np.concatenate(data.posterior_predictive["obs"].values)
15 |
16 | figure_kwargs = dict(height=500, width=500, output_backend="webgl")
17 | ax = bkp.figure(**figure_kwargs)
18 |
19 | ax = az.plot_kde(
20 | y_hat,
21 | label="Estimated Effect\n of SAT Prep",
22 | rug=True,
23 | plot_kwargs={"line_width": 2, "line_color": "black"},
24 | rug_kwargs={"line_color": "black"},
25 | backend="bokeh",
26 | ax=ax,
27 | )
28 |
--------------------------------------------------------------------------------
/arviz/tests/base_tests/test_helpers.py:
--------------------------------------------------------------------------------
1 | import pytest
2 | from _pytest.outcomes import Skipped
3 |
4 | from ..helpers import importorskip
5 |
6 |
7 | def test_importorskip_local(monkeypatch):
8 | """Test ``importorskip`` run on local machine with non-existent module, which should skip."""
9 | monkeypatch.delenv("ARVIZ_REQUIRE_ALL_DEPS", raising=False)
10 | with pytest.raises(Skipped):
11 | importorskip("non-existent-function")
12 |
13 |
14 | def test_importorskip_ci(monkeypatch):
15 | """Test ``importorskip`` run on CI machine with non-existent module, which should fail."""
16 | monkeypatch.setenv("ARVIZ_REQUIRE_ALL_DEPS", 1)
17 | with pytest.raises(ModuleNotFoundError):
18 | importorskip("non-existent-function")
19 |
--------------------------------------------------------------------------------
/Makefile:
--------------------------------------------------------------------------------
1 | # Minimal makefile for Sphinx documentation
2 | #
3 |
4 | # You can set these variables from the command line.
5 | SPHINXOPTS = -b html
6 | SPHINXBUILD = sphinx-build
7 | SPHINXPROJ = ArviZ
8 | SOURCEDIR = doc/source
9 | BUILDDIR = doc/build
10 |
11 | # Put it first so that "make" without argument is like "make help".
12 | help:
13 | @$(SPHINXBUILD) -M help "$(SOURCEDIR)" "$(BUILDDIR)" $(SPHINXOPTS) $(O)
14 |
15 | .PHONY: help Makefile
16 |
17 | html:
18 | sphinx-build "$(SOURCEDIR)" "$(BUILDDIR)" -b html
19 |
20 | livehtml:
21 | sphinx-autobuild "$(SOURCEDIR)" "$(BUILDDIR)" -b html
22 |
23 | cleandocs:
24 | rm -r "$(BUILDDIR)" "doc/jupyter_execute" "$(SOURCEDIR)/api/generated" "$(SOURCEDIR)/examples"
25 |
26 | preview:
27 | python -m webbrowser "$(BUILDDIR)/index.html"
28 |
--------------------------------------------------------------------------------
/.projections.json:
--------------------------------------------------------------------------------
1 | {
2 | "arviz/plots/backends/matplotlib/*.py": {
3 | "alternate": "arviz/plots/backends/bokeh/{}.py",
4 | "related": "arviz/plots/{}.py",
5 | "type": "mpl"
6 | },
7 | "arviz/plots/backends/bokeh/*.py": {
8 | "alternate": "arviz/plots/backends/matplotlib/{}.py",
9 | "related": "arviz/plots/{}.py",
10 | "type": "bokeh"
11 | },
12 | "arviz/plots/*.py": {
13 | "alternate": "arviz/plots/backends/matplotlib/{}.py",
14 | "related": "arviz/plots/backends/bokeh/{}.py",
15 | "type": "base"
16 | },
17 | "arviz/data/io_*.py": {
18 | "alternate": "arviz/tests/external_tests/test_data_{}.py",
19 | "type": "converter"
20 | },
21 | "arviz/tests/external_tests/test_data_*.py": {
22 | "alternate": "arviz/data/io_{}.py",
23 | "type": "test"
24 | }
25 | }
26 |
--------------------------------------------------------------------------------
/doc/source/api/plot_utils.md:
--------------------------------------------------------------------------------
1 | ```{eval-rst}
2 | .. currentmodule:: arviz.labels
3 | ```
4 | # Plot utils
5 |
6 | (labeller_api)=
7 | ## Labellers
8 | See also the {ref}`label_guide`
9 |
10 | ```{eval-rst}
11 | .. autosummary::
12 | :toctree: generated/
13 |
14 | BaseLabeller
15 | DimCoordLabeller
16 | IdxLabeller
17 | DimIdxLabeller
18 | MapLabeller
19 | NoModelLabeller
20 | NoVarLabeller
21 | ```
22 |
23 | ## Labeling utils
24 |
25 | ```{eval-rst}
26 | .. autosummary::
27 | :toctree: generated/
28 |
29 | mix_labellers
30 | ```
31 |
32 | ## Xarray utils
33 | Low level functions to iterate over xarray objects.
34 |
35 | ```{eval-rst}
36 | .. currentmodule:: arviz.sel_utils
37 |
38 | .. autosummary::
39 | :toctree: generated/
40 |
41 | xarray_sel_iter
42 | xarray_var_iter
43 | xarray_to_ndarray
44 | ```
45 |
--------------------------------------------------------------------------------
/examples/matplotlib/mpl_plot_violin_single_sided.py:
--------------------------------------------------------------------------------
1 | """
2 | Single-Sided Violin Plot
3 | ========================
4 | _gallery_category: Distribution Comparison
5 | """
6 |
7 | import matplotlib.pyplot as plt
8 |
9 | import arviz as az
10 |
11 | az.style.use("arviz-doc")
12 |
13 | data = az.load_arviz_data("rugby")
14 |
15 | labeller = az.labels.MapLabeller(var_name_map={"defs": "atts | defs"})
16 | axes = az.plot_violin(
17 | data,
18 | var_names=["atts"],
19 | side="left",
20 | show=False,
21 | figsize=(11.5, 5),
22 | )
23 | az.plot_violin(
24 | data,
25 | var_names=["defs"],
26 | side="right",
27 | labeller=labeller,
28 | ax=axes,
29 | show=True,
30 | )
31 |
32 | fig = axes.flatten()[0].get_figure()
33 | fig.suptitle("Attack/Defense of Rugby Teams")
34 | fig.tight_layout()
35 |
36 | plt.show()
37 |
--------------------------------------------------------------------------------
/.github/ISSUE_TEMPLATE/usage-question.md:
--------------------------------------------------------------------------------
1 | ---
2 | name: 'Usage Question'
3 | about: General questions about ArviZ usage
4 |
5 | ---
6 |
7 | ## Short Description
8 |
9 | Let us know what you're trying to do and we can point you in the right direction. Screenshots/plots or stack traces that include `arviz` are particularly helpful.
10 |
11 | ## Code Example or link
12 |
13 | Please provide a minimal, self-contained, and reproducible example demonstrating what you're trying to do. Ideally it will be a code snippet, link to a notebook, or link to code that can be run on another user's computer.
14 |
15 | Also include the ArviZ version and version of any other relevant packages.
16 |
17 | ## Relevant documentation or public examples
18 |
19 | Please provide documentation, public examples, or any additional information which may be relevant to your question
20 |
--------------------------------------------------------------------------------
/doc/source/user_guide/sampling_wrappers.md:
--------------------------------------------------------------------------------
1 | (wrapper_guide)=
2 | # Sampling wrappers
3 | Sampling wrappers allow ArviZ to call {abbr}`PPL (Probabilistic programming library)`s in order to perform a limited
4 | subset of their capabilities and calculate stats and diagnostics that require
5 | refitting the model on different data.
6 |
7 | Their implementation is still experimental and may vary in the future. In fact,
8 | there are currently two possible approaches when creating sampling wrappers.
9 | The first one delegates all calculations to the PPL
10 | whereas the second one externalizes the computation of the pointwise log
11 | likelihood to the user who is expected to write it with xarray/NumPy.
12 |
13 | ```{toctree}
14 | wrappers/cmdstanpy_refitting
15 | pystan_refitting
16 | pymc_refitting
17 | numpyro_refitting
18 | numpyro_refitting_xr_lik
19 | ```
20 |
--------------------------------------------------------------------------------
/arviz/stats/__init__.py:
--------------------------------------------------------------------------------
1 | # pylint: disable=wildcard-import
2 | """Statistical tests and diagnostics for ArviZ."""
3 | from .density_utils import *
4 | from .diagnostics import *
5 | from .stats import *
6 | from .stats import _calculate_ics
7 | from .stats_refitting import *
8 | from .stats_utils import *
9 |
10 | __all__ = [
11 | "apply_test_function",
12 | "bfmi",
13 | "compare",
14 | "hdi",
15 | "kde",
16 | "loo",
17 | "loo_pit",
18 | "psislw",
19 | "r2_samples",
20 | "r2_score",
21 | "summary",
22 | "waic",
23 | "weight_predictions",
24 | "ELPDData",
25 | "ess",
26 | "rhat",
27 | "mcse",
28 | "autocorr",
29 | "autocov",
30 | "make_ufunc",
31 | "smooth_data",
32 | "wrap_xarray_ufunc",
33 | "reloo",
34 | "_calculate_ics",
35 | "psens",
36 | ]
37 |
--------------------------------------------------------------------------------
/doc/source/contributing/updating_example_data.md:
--------------------------------------------------------------------------------
1 | # Updating the example data
2 |
3 | Metadata for ArviZ's example `InferenceData` objects (which are loadable by {func}`~arviz.load_arviz_data`) is stored in the [`arviz_example_data`](https://github.com/arviz-devs/arviz_example_data) repository.
4 | This repo has been embedded into the `arviz` repo at `/arviz/data/example_data` using [git subtree](https://www.atlassian.com/git/tutorials/git-subtree) with the following command:
5 |
6 | ```bash
7 | $ git subtree add --prefix arviz/data/example_data https://github.com/arviz-devs/arviz_example_data.git main --squash
8 | ```
9 |
10 | When `arviz_example_data` is updated, the subtree within the `arviz` repo also needs to be updated with the following command:
11 |
12 | ```bash
13 | $ git subtree pull --prefix arviz/data/example_data https://github.com/arviz-devs/arviz_example_data.git main --squash
14 | ```
15 |
--------------------------------------------------------------------------------
/CITATION.cff:
--------------------------------------------------------------------------------
1 | cff-version: 1.2.0
2 | message: "If you use this software, please cite it as below."
3 | title: "ArviZ"
4 | url: "https://github.com/arviz-devs/arviz"
5 | preferred-citation:
6 | type: article
7 | authors:
8 | -
9 | family-names: Kumar
10 | given-names: Ravin
11 | orcid: "https://orcid.org/0000-0003-0501-6098"
12 | -
13 | family-names: Carroll
14 | given-names: Colin
15 | orcid: "https://orcid.org/0000-0001-6977-0861"
16 | -
17 | family-names: Hartikainen
18 | given-names: Ari
19 | orcid: "https://orcid.org/0000-0002-4569-569X"
20 | -
21 | family-names: Osvaldo
22 | given-names: Martin
23 | orcid: "https://orcid.org/0000-0001-7419-8978"
24 | doi: "10.21105/joss.01143"
25 | journal: "Journal of Open Source Software"
26 | title: "ArviZ a unified library for exploratory analysis of Bayesian models in Python"
27 |
--------------------------------------------------------------------------------
/doc/source/user_guide/wrappers/linreg_prior.stan:
--------------------------------------------------------------------------------
1 | data {
2 | int N;
3 | real time_since_joined[N];
4 | }
5 |
6 | generated quantities {
7 | real b0;
8 | real b1;
9 | real log_b_sigma;
10 | real b_sigma;
11 |
12 | real c0;
13 | real c1;
14 | real log_c_sigma;
15 | real c_sigma;
16 |
17 | vector[N] slack_comments_hat;
18 | vector[N] github_commits_hat;
19 |
20 | b0 = normal_rng(0,200);
21 | b1 = normal_rng(0,200);
22 | b_sigma = abs(normal_rng(0,300));
23 | log_b_sigma = log(b_sigma);
24 |
25 | c0 = normal_rng(0,10);
26 | c1 = normal_rng(0,10);
27 | c_sigma = fabs(normal_rng(0,6));
28 | log_c_sigma = log(b_sigma);
29 |
30 | for (n in 1:N) {
31 | slack_comments_hat[n] = normal_rng(b0 + b1 * time_since_joined[n], b_sigma);
32 | github_commits_hat[n] = normal_rng(c0 + c1 * time_since_joined[n], c_sigma);
33 | }
34 | }
35 |
--------------------------------------------------------------------------------
/doc/source/contributing/architecture.md:
--------------------------------------------------------------------------------
1 | # Library architecture
2 | ArviZ is organized in modules (the folders in [arviz directory](https://github.com/arviz-devs/arviz/tree/main/arviz)).
3 | The main 3 modules are `data`, `plots` and `stats`.
4 | Then we have 3 more folders. The [tests](https://github.com/arviz-devs/arviz/tree/main/arviz/tests)
5 | folder contains tests for all these 3 modules.
6 |
7 | The [static](https://github.com/arviz-devs/arviz/tree/main/arviz/static)
8 | folder is only used to store style and CSS files to get HTML output for `InferenceData`.
9 | Finally we have the [wrappers](https://github.com/arviz-devs/arviz/tree/main/arviz/wrappers)
10 | folder that contains experimental (not tested yet either) features
11 | and interacts closely with both [data](https://github.com/arviz-devs/arviz/tree/main/arviz/data)
12 | and [stats](https://github.com/arviz-devs/arviz/tree/main/arviz/stats) modules.
13 |
14 | In addition, there are some files on the higher level directory: `utils.py`, `sel_utils.py`,
15 | `rcparams.py` and `labels.py`.
16 |
--------------------------------------------------------------------------------
/doc/source/contributing/doc_toolchain.md:
--------------------------------------------------------------------------------
1 | (doc_toolchain)=
2 | # Documentation toolchain
3 |
4 | ArviZ documentation is built using a Python documentation tool, [Sphinx](https://www.sphinx-doc.org/en/master/).
5 | Sphinx converts `rst`(restructured text) files into HTML websites.
6 | There are different extensions available for converting other types of files
7 | like markdown, jupyter notebooks, etc. into HTML websites.
8 |
9 | ArviZ [docs](https://github.com/arviz-devs/arviz/tree/main/doc/source) consist of `.rst`, `.md` and `.ipynb` files.
10 | It uses `myst-parser` and `myst-nb` for `.md` and `.ipynb` files.
11 | Apart from the content in the `/doc/source` folder, ArviZ documentation also consists of docstrings.
12 | Docstrings are used in the `.py` files to explain the Python objects parameters and return values.
13 |
14 | ArviZ docs also uses sphinx extensions for style, layout, navbar and putting code in the documentation.
15 |
16 | A more detailed overview of the sphinx toolchain used at ArviZ is available at
17 | {doc}`sphinx-primer:index`
18 |
--------------------------------------------------------------------------------
/doc/source/api/data.rst:
--------------------------------------------------------------------------------
1 | .. currentmodule:: arviz
2 |
3 | .. _data_api:
4 |
5 | Data
6 | ----
7 |
8 | Inference library converters
9 | ............................
10 |
11 | .. autosummary::
12 | :toctree: generated/
13 |
14 | from_beanmachine
15 | from_cmdstan
16 | from_cmdstanpy
17 | from_emcee
18 | from_numpyro
19 | from_pyjags
20 | from_pyro
21 | from_pystan
22 |
23 |
24 | IO / General conversion
25 | .......................
26 |
27 | .. autosummary::
28 | :toctree: generated/
29 |
30 | convert_to_inference_data
31 | convert_to_dataset
32 | dict_to_dataset
33 | from_datatree
34 | from_dict
35 | from_json
36 | from_netcdf
37 | to_datatree
38 | to_json
39 | to_netcdf
40 | from_zarr
41 | to_zarr
42 |
43 |
44 | General functions
45 | .................
46 |
47 | .. autosummary::
48 | :toctree: generated/
49 |
50 | concat
51 | extract
52 |
53 | Data examples
54 | .............
55 |
56 | .. autosummary::
57 | :toctree: generated/
58 |
59 | list_datasets
60 | load_arviz_data
61 |
--------------------------------------------------------------------------------
/doc/source/_static/key_feature_diagnostics.svg:
--------------------------------------------------------------------------------
1 |
2 |
--------------------------------------------------------------------------------
/arviz/data/example_data/data_local.json:
--------------------------------------------------------------------------------
1 | [
2 | {
3 | "name": "centered_eight",
4 | "filename": "centered_eight.nc",
5 | "description": "A centered parameterization of the eight schools model. Provided as an example of a model that NUTS has trouble fitting. Compare to `non_centered_eight`.\n\nThe eight schools model is a hierarchical model used for an analysis of the effectiveness of classes that were designed to improve students' performance on the Scholastic Aptitude Test.\n\nSee Bayesian Data Analysis (Gelman et. al.) for more details."
6 | },
7 | {
8 | "name": "non_centered_eight",
9 | "filename": "non_centered_eight.nc",
10 | "description": "A non-centered parameterization of the eight schools model. This is a hierarchical model where sampling problems may be fixed by a non-centered parametrization. Compare to `centered_eight`.\n\nThe eight schools model is a hierarchical model used for an analysis of the effectiveness of classes that were designed to improve students' performance on the Scholastic Aptitude Test.\n\nSee Bayesian Data Analysis (Gelman et. al.) for more details."
11 | }
12 | ]
--------------------------------------------------------------------------------
/doc/_templates/404.html:
--------------------------------------------------------------------------------
1 | {% extends "!layout.html" %}
2 |
3 | {%- block content %}
4 | {% block docs_navbar %} {{ super() }} {% endblock %}
5 |
6 |
7 |
8 | {% block docs_main %}
9 |
10 |
11 |
12 |
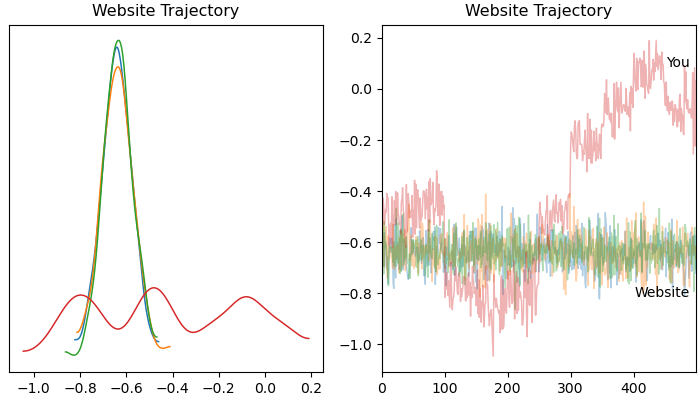
13 |
14 |
Page not found
15 |
Sorry, it looks like your sampler ventured to an undefined region of the documentation space.
16 |
The page you are looking for could not be found.
17 |
Click on the link below to go back to home page (the navbar links are probably not working either).
18 |
Back to Home Page
19 |
20 |
21 |
23 | {% endblock %}
24 |
25 |
26 |
Click to see full traceback
35 |
36 | ```
37 | long and barely comprehensible error traceback
38 | ```
39 |
40 |