├── .flowconfig
├── .gitignore
├── .watchmanconfig
├── LICENSE
├── RNiOSCharts.xcworkspace
└── contents.xcworkspacedata
├── RNiOSCharts
├── ABNumberFormatter.swift
├── BalloonMarker.swift
├── BarLineChartViewBaseExtension.swift
├── ChartViewBaseExtension.swift
├── PieRadarChartViewBaseExtension.swift
├── RCTIOSCharts-Bridging-Header.h
├── RNBarChart.h
├── RNBarChart.m
├── RNBarChart.swift
├── RNBarChartManager.swift
├── RNBubbleChart.h
├── RNBubbleChart.m
├── RNBubbleChart.swift
├── RNBubbleChartManager.swift
├── RNCandleChartManager.swift
├── RNCandleStickChart.h
├── RNCandleStickChart.m
├── RNCandleStickChart.swift
├── RNCombinedChart.h
├── RNCombinedChart.m
├── RNCombinedChart.swift
├── RNCombinedChartManager.swift
├── RNHorizontalBarChart.h
├── RNHorizontalBarChart.m
├── RNHorizontalBarChart.swift
├── RNHorizontalBarChartManager.swift
├── RNLineChart.h
├── RNLineChart.m
├── RNLineChart.swift
├── RNLineChartManager.swift
├── RNPieChart.h
├── RNPieChart.m
├── RNPieChart.swift
├── RNPieChartManager.swift
├── RNRadarChart.h
├── RNRadarChart.m
├── RNRadarChart.swift
├── RNRadarChartManager.swift
├── RNScatterChart.h
├── RNScatterChart.m
├── RNScatterChart.swift
├── RNScatterChartManager.swift
└── chartDataHelpers.swift
├── Readme.md
├── components
├── BarChart.js
├── BubbleChart.js
├── CandleStickChart.js
├── CombinedChart.js
├── HorizontalBarChart.js
├── LineChart.js
├── PieChart.js
├── RadarChart.js
└── ScatterChart.js
├── examples
└── ChartsExplorer
│ ├── .flowconfig
│ ├── .gitignore
│ ├── .watchmanconfig
│ ├── components
│ ├── Bar.js
│ ├── Bubble.js
│ ├── CandleStick.js
│ ├── Combined.js
│ ├── HorizontalBar.js
│ ├── Line.js
│ ├── LiveUpdating.js
│ ├── Pie.js
│ ├── Radar.js
│ └── Scatter.js
│ ├── index.ios.js
│ ├── ios
│ ├── ChartsExplorer-Bridging-Header.h
│ ├── ChartsExplorer.xcodeproj
│ │ ├── project.pbxproj
│ │ └── xcshareddata
│ │ │ └── xcschemes
│ │ │ └── ChartsExplorer.xcscheme
│ ├── ChartsExplorer.xcworkspace
│ │ └── contents.xcworkspacedata
│ ├── ChartsExplorer
│ │ ├── AppDelegate.h
│ │ ├── AppDelegate.m
│ │ ├── Base.lproj
│ │ │ └── LaunchScreen.xib
│ │ ├── Images.xcassets
│ │ │ └── AppIcon.appiconset
│ │ │ │ └── Contents.json
│ │ ├── Info.plist
│ │ └── main.m
│ ├── ChartsExplorerTests
│ │ ├── ChartsExplorerTests.m
│ │ └── Info.plist
│ ├── Podfile
│ └── Podfile.lock
│ ├── package.json
│ └── readme.md
├── index.js
├── package.json
├── screenshots
└── all.png
└── utils
├── commonColorProps.js
└── commonProps.js
/.flowconfig:
--------------------------------------------------------------------------------
1 | [ignore]
2 |
3 | # We fork some components by platform.
4 | .*/*.web.js
5 | .*/*.android.js
6 |
7 | # Some modules have their own node_modules with overlap
8 | .*/node_modules/node-haste/.*
9 |
10 | # Ugh
11 | .*/node_modules/babel.*
12 | .*/node_modules/babylon.*
13 | .*/node_modules/invariant.*
14 |
15 | # Ignore react and fbjs where there are overlaps, but don't ignore
16 | # anything that react-native relies on
17 | .*/node_modules/fbjs-haste/.*/__tests__/.*
18 | .*/node_modules/fbjs-haste/__forks__/Map.js
19 | .*/node_modules/fbjs-haste/__forks__/Promise.js
20 | .*/node_modules/fbjs-haste/__forks__/fetch.js
21 | .*/node_modules/fbjs-haste/core/ExecutionEnvironment.js
22 | .*/node_modules/fbjs-haste/core/isEmpty.js
23 | .*/node_modules/fbjs-haste/crypto/crc32.js
24 | .*/node_modules/fbjs-haste/stubs/ErrorUtils.js
25 | .*/node_modules/react-haste/React.js
26 | .*/node_modules/react-haste/renderers/dom/ReactDOM.js
27 | .*/node_modules/react-haste/renderers/shared/event/eventPlugins/ResponderEventPlugin.js
28 |
29 | # Ignore commoner tests
30 | .*/node_modules/commoner/test/.*
31 |
32 | # See https://github.com/facebook/flow/issues/442
33 | .*/react-tools/node_modules/commoner/lib/reader.js
34 |
35 | # Ignore jest
36 | .*/node_modules/jest-cli/.*
37 |
38 | # Ignore Website
39 | .*/website/.*
40 |
41 | [include]
42 |
43 | [libs]
44 | node_modules/react-native/Libraries/react-native/react-native-interface.js
45 |
46 | [options]
47 | module.system=haste
48 |
49 | munge_underscores=true
50 |
51 | module.name_mapper='^image![a-zA-Z0-9$_-]+$' -> 'GlobalImageStub'
52 | module.name_mapper='^[./a-zA-Z0-9$_-]+\.png$' -> 'RelativeImageStub'
53 |
54 | suppress_type=$FlowIssue
55 | suppress_type=$FlowFixMe
56 | suppress_type=$FixMe
57 |
58 | suppress_comment=\\(.\\|\n\\)*\\$FlowFixMe\\($\\|[^(]\\|(\\(>=0\\.\\(1[0-9]\\|[0-9]\\).[0-9]\\)? *\\(site=[a-z,_]*react_native[a-z,_]*\\)?)\\)
59 | suppress_comment=\\(.\\|\n\\)*\\$FlowIssue\\((\\(>=0\\.\\(1[0-9]\\|[0-9]\\).[0-9]\\)? *\\(site=[a-z,_]*react_native[a-z,_]*\\)?)\\)? #[0-9]+
60 | suppress_comment=\\(.\\|\n\\)*\\$FlowFixedInNextDeploy
61 |
62 | [version]
63 | 0.19.0
64 |
--------------------------------------------------------------------------------
/.gitignore:
--------------------------------------------------------------------------------
1 | # OSX
2 | #
3 | .DS_Store
4 |
5 | # Xcode
6 | #
7 | build/
8 | *.pbxuser
9 | !default.pbxuser
10 | *.mode1v3
11 | !default.mode1v3
12 | *.mode2v3
13 | !default.mode2v3
14 | *.perspectivev3
15 | !default.perspectivev3
16 | xcuserdata
17 | *.xccheckout
18 | *.moved-aside
19 | DerivedData
20 | *.hmap
21 | *.ipa
22 | *.xcuserstate
23 | project.xcworkspace
24 |
25 | # Android/IJ
26 | #
27 | .idea
28 | .gradle
29 | local.properties
30 |
31 | # node.js
32 | #
33 | node_modules
34 | npm-debug.log
35 | build
36 | Pods
37 |
--------------------------------------------------------------------------------
/.watchmanconfig:
--------------------------------------------------------------------------------
1 | {}
--------------------------------------------------------------------------------
/LICENSE:
--------------------------------------------------------------------------------
1 | The MIT License (MIT)
2 |
3 | Copyright (c) 2016 Jose E. Padilla
4 |
5 | Permission is hereby granted, free of charge, to any person obtaining a copy
6 | of this software and associated documentation files (the "Software"), to deal
7 | in the Software without restriction, including without limitation the rights
8 | to use, copy, modify, merge, publish, distribute, sublicense, and/or sell
9 | copies of the Software, and to permit persons to whom the Software is
10 | furnished to do so, subject to the following conditions:
11 |
12 | The above copyright notice and this permission notice shall be included in all
13 | copies or substantial portions of the Software.
14 |
15 | THE SOFTWARE IS PROVIDED "AS IS", WITHOUT WARRANTY OF ANY KIND, EXPRESS OR
16 | IMPLIED, INCLUDING BUT NOT LIMITED TO THE WARRANTIES OF MERCHANTABILITY,
17 | FITNESS FOR A PARTICULAR PURPOSE AND NONINFRINGEMENT. IN NO EVENT SHALL THE
18 | AUTHORS OR COPYRIGHT HOLDERS BE LIABLE FOR ANY CLAIM, DAMAGES OR OTHER
19 | LIABILITY, WHETHER IN AN ACTION OF CONTRACT, TORT OR OTHERWISE, ARISING FROM,
20 | OUT OF OR IN CONNECTION WITH THE SOFTWARE OR THE USE OR OTHER DEALINGS IN THE
21 | SOFTWARE.
--------------------------------------------------------------------------------
/RNiOSCharts.xcworkspace/contents.xcworkspacedata:
--------------------------------------------------------------------------------
1 |
2 |
4 |
7 |
9 |
10 |
12 |
13 |
15 |
16 |
18 |
19 |
21 |
22 |
24 |
25 |
27 |
28 |
30 |
31 |
33 |
34 |
36 |
37 |
39 |
40 |
42 |
43 |
45 |
46 |
48 |
49 |
51 |
52 |
54 |
55 |
57 |
58 |
60 |
61 |
63 |
64 |
66 |
67 |
69 |
70 |
72 |
73 |
75 |
76 |
78 |
79 |
81 |
82 |
84 |
85 |
87 |
88 |
90 |
91 |
93 |
94 |
96 |
97 |
99 |
100 |
102 |
103 |
105 |
106 |
108 |
109 |
111 |
112 |
114 |
115 |
117 |
118 |
120 |
121 |
123 |
124 |
126 |
127 |
129 |
130 |
132 |
133 |
134 |
135 |
--------------------------------------------------------------------------------
/RNiOSCharts/ABNumberFormatter.swift:
--------------------------------------------------------------------------------
1 | //
2 | // ABNumberFormatter.swift
3 | //
4 | //
5 | // Created by Jose Padilla on 2/5/16.
6 | //
7 | //
8 |
9 | import Foundation
10 |
11 | class ABNumberFormatter : NumberFormatter {
12 |
13 | fileprivate var maximumDecimalPlaces: Int = 0;
14 | fileprivate var minimumDecimalPlaces: Int = 0;
15 |
16 | init(minimumDecimalPlaces: Int, maximumDecimalPlaces: Int) {
17 | if (minimumDecimalPlaces < 0) {
18 | self.minimumDecimalPlaces = 0;
19 | } else {
20 | self.minimumDecimalPlaces = minimumDecimalPlaces;
21 | }
22 | if (maximumDecimalPlaces < 0) {
23 | self.maximumDecimalPlaces = 0;
24 | } else {
25 | self.maximumDecimalPlaces = maximumDecimalPlaces;
26 | }
27 | super.init();
28 | }
29 |
30 | required init?(coder aDecoder: NSCoder) {
31 | fatalError("init(coder:) has not been implemented");
32 | }
33 |
34 | func abbreviateNumber(_ num: Int) -> String {
35 | var abbrevNum : String = "";
36 | var number : Float = Float(num);
37 | if (num >= 1000) {
38 | let abbrev = ["K", "M", "B"];
39 | for i in stride(from: (abbrev.count - 1), to: 0, by: -1) {
40 | let size = Float(pow(Double(10), Double((i+1)*3)));
41 | if(size <= number) {
42 | number = number/size;
43 | let numberString = floatToString(number);
44 | self.positiveSuffix = abbrev[i];
45 | abbrevNum = String(format:"%@", numberString);
46 | }
47 | }
48 | } else {
49 | self.positiveSuffix = "";
50 | abbrevNum = String(format:"%d", Int(number));
51 | }
52 |
53 | return abbrevNum;
54 | }
55 |
56 | func floatToString(_ val: Float) -> String {
57 | var ret = String(format:"%.\(self.maximumDecimalPlaces)f", val);
58 | var c = UniChar(String(ret.characters.last! as Character));
59 | while (c == 48) {
60 | ret = ret.substring(to: ret.characters.index(ret.startIndex, offsetBy: ret.characters.count - 1));
61 | c = UniChar(String(ret.characters.last! as Character));
62 | if(c == 46) {
63 | ret = ret.substring(to: ret.characters.index(ret.startIndex, offsetBy: ret.characters.count - 1));
64 | }
65 | }
66 | let formatter = NumberFormatter();
67 | formatter.minimumFractionDigits = self.minimumDecimalPlaces;
68 | formatter.maximumFractionDigits = self.maximumDecimalPlaces;
69 | let floatValue = (ret as NSString).floatValue
70 | return formatter.string(from: NSNumber(value: floatValue))!;
71 | }
72 |
73 | override func string(for obj: Any?) -> String? {
74 | let value = self.abbreviateNumber(obj as! Int);
75 | if String(value.characters.last!) == "0" {
76 | return super.string(for: Int(value)!);
77 | }
78 |
79 | return super.string(for: Float(value)!);
80 | }
81 | }
82 |
--------------------------------------------------------------------------------
/RNiOSCharts/BalloonMarker.swift:
--------------------------------------------------------------------------------
1 | //
2 | // BalloonMarker.swift
3 | // ChartsDemo
4 | //
5 | // Created by Daniel Cohen Gindi on 19/3/15.
6 | //
7 | // Copyright 2015 Daniel Cohen Gindi & Philipp Jahoda
8 | // A port of MPAndroidChart for iOS
9 | // Licensed under Apache License 2.0
10 | //
11 | // https://github.com/danielgindi/ios-charts
12 | // https://github.com/danielgindi/Charts/blob/1788e53f22eb3de79eb4f08574d8ea4b54b5e417/ChartsDemo/Classes/Components/BalloonMarker.swift
13 | // Edit: Added textColor
14 |
15 | import Foundation;
16 | import Charts;
17 |
18 | public class BalloonMarker: ChartMarker
19 | {
20 | public var color: UIColor?
21 | public var arrowSize = CGSize(width: 15, height: 11)
22 | public var font: UIFont?
23 | public var textColor: UIColor?
24 | public var insets = UIEdgeInsets()
25 | public var minimumSize = CGSize()
26 |
27 | private var labelns: NSString?
28 | private var _labelSize: CGSize = CGSize()
29 | private var _size: CGSize = CGSize()
30 | private var _paragraphStyle: NSMutableParagraphStyle?
31 | private var _drawAttributes = [String : AnyObject]()
32 |
33 | public init(color: UIColor, font: UIFont, textColor: UIColor, insets: UIEdgeInsets)
34 | {
35 | super.init()
36 |
37 | self.color = color
38 | self.font = font
39 | self.textColor = textColor
40 | self.insets = insets
41 |
42 | _paragraphStyle = NSParagraphStyle.defaultParagraphStyle().mutableCopy() as? NSMutableParagraphStyle
43 | _paragraphStyle?.alignment = .Center
44 | }
45 |
46 | public override var size: CGSize { return _size; }
47 |
48 | public override func draw(context context: CGContext, point: CGPoint)
49 | {
50 | if (labelns == nil)
51 | {
52 | return
53 | }
54 |
55 | var rect = CGRect(origin: point, size: _size)
56 | rect.origin.x -= _size.width / 2.0
57 | rect.origin.y -= _size.height
58 |
59 | CGContextSaveGState(context)
60 |
61 | CGContextSetFillColorWithColor(context, color?.CGColor)
62 | CGContextBeginPath(context)
63 | CGContextMoveToPoint(context,
64 | rect.origin.x,
65 | rect.origin.y)
66 | CGContextAddLineToPoint(context,
67 | rect.origin.x + rect.size.width,
68 | rect.origin.y)
69 | CGContextAddLineToPoint(context,
70 | rect.origin.x + rect.size.width,
71 | rect.origin.y + rect.size.height - arrowSize.height)
72 | CGContextAddLineToPoint(context,
73 | rect.origin.x + (rect.size.width + arrowSize.width) / 2.0,
74 | rect.origin.y + rect.size.height - arrowSize.height)
75 | CGContextAddLineToPoint(context,
76 | rect.origin.x + rect.size.width / 2.0,
77 | rect.origin.y + rect.size.height)
78 | CGContextAddLineToPoint(context,
79 | rect.origin.x + (rect.size.width - arrowSize.width) / 2.0,
80 | rect.origin.y + rect.size.height - arrowSize.height)
81 | CGContextAddLineToPoint(context,
82 | rect.origin.x,
83 | rect.origin.y + rect.size.height - arrowSize.height)
84 | CGContextAddLineToPoint(context,
85 | rect.origin.x,
86 | rect.origin.y)
87 | CGContextFillPath(context)
88 |
89 | rect.origin.y += self.insets.top
90 | rect.size.height -= self.insets.top + self.insets.bottom
91 |
92 | UIGraphicsPushContext(context)
93 |
94 | labelns?.drawInRect(rect, withAttributes: _drawAttributes)
95 |
96 | UIGraphicsPopContext()
97 |
98 | CGContextRestoreGState(context)
99 | }
100 |
101 | public override func refreshContent(entry entry: ChartDataEntry, highlight: ChartHighlight)
102 | {
103 | let label = entry.value.description
104 | labelns = label as NSString
105 |
106 | _drawAttributes.removeAll()
107 | _drawAttributes[NSFontAttributeName] = self.font
108 | _drawAttributes[NSParagraphStyleAttributeName] = _paragraphStyle
109 | _drawAttributes[NSForegroundColorAttributeName] = self.textColor
110 |
111 | _labelSize = labelns?.sizeWithAttributes(_drawAttributes) ?? CGSizeZero
112 | _size.width = _labelSize.width + self.insets.left + self.insets.right
113 | _size.height = _labelSize.height + self.insets.top + self.insets.bottom
114 | _size.width = max(minimumSize.width, _size.width)
115 | _size.height = max(minimumSize.height, _size.height)
116 | }
117 | }
118 |
--------------------------------------------------------------------------------
/RNiOSCharts/BarLineChartViewBaseExtension.swift:
--------------------------------------------------------------------------------
1 | //
2 | // BarLineChartViewBaseExtension.swift
3 | // PoliRank
4 | //
5 | // Created by Jose Padilla on 2/8/16.
6 | // Copyright © 2016 Facebook. All rights reserved.
7 | //
8 |
9 | import SwiftyJSON
10 | import Charts
11 |
12 | extension BarLineChartViewBase {
13 |
14 | func setBarLineChartViewBaseProps(_ config: String!) {
15 | setChartViewBaseProps(config);
16 |
17 | var maximumDecimalPlaces: Int = 0;
18 | var minimumDecimalPlaces: Int = 0;
19 |
20 | var json: JSON = nil;
21 | if let data = config.data(using: String.Encoding.utf8) {
22 | json = JSON(data: data);
23 | };
24 |
25 | if json["gridBackgroundColor"].exists() {
26 | self.gridBackgroundColor = RCTConvert.uiColor(json["gridBackgroundColor"].intValue);
27 | }
28 |
29 | if json["drawBorders"].exists() {
30 | self.drawBordersEnabled = json["drawBorders"].boolValue;
31 | }
32 |
33 | if json["borderColor"].exists() {
34 | self.borderColor = RCTConvert.uiColor(json["borderColor"].intValue);
35 | }
36 |
37 | if json["borderLineWidth"].exists() {
38 | self.borderLineWidth = CGFloat(json["borderLineWidth"].floatValue);
39 | }
40 |
41 | if json["minOffset"].exists() {
42 | self.minOffset = CGFloat(json["minOffset"].floatValue);
43 | }
44 |
45 | if json["autoScaleMinMax"].exists() {
46 | self.autoScaleMinMaxEnabled = json["autoScaleMinMax"].boolValue;
47 | }
48 |
49 | if json["dragEnabled"].exists() {
50 | self.dragEnabled = json["dragEnabled"].boolValue;
51 | }
52 |
53 | if json["scaleXEnabled"].exists() {
54 | self.scaleXEnabled = json["scaleXEnabled"].boolValue;
55 | }
56 |
57 | if json["scaleYEnabled"].exists() {
58 | self.scaleYEnabled = json["scaleYEnabled"].boolValue;
59 | }
60 |
61 | if json["pinchZoomEnabled"].exists() {
62 | self.pinchZoomEnabled = json["pinchZoomEnabled"].boolValue;
63 | }
64 |
65 | if json["doubleTapToZoomEnabled"].exists() {
66 | self.doubleTapToZoomEnabled = json["doubleTapToZoomEnabled"].boolValue;
67 | }
68 |
69 | if json["highlightPerDragEnabled"].exists() {
70 | self.highlightPerDragEnabled = json["highlightPerDragEnabled"].boolValue;
71 | }
72 |
73 | // xAxis
74 |
75 | if json["xAxis"].exists() {
76 | if json["xAxis"]["enabled"].exists() {
77 | self.xAxis.enabled = json["xAxis"]["enabled"].boolValue;
78 | }
79 |
80 | if json["xAxis"]["drawAxisLine"].exists() {
81 | self.xAxis.drawAxisLineEnabled = json["xAxis"]["drawAxisLine"].boolValue;
82 | }
83 |
84 | if json["xAxis"]["drawGridLines"].exists() {
85 | self.xAxis.drawGridLinesEnabled = json["xAxis"]["drawGridLines"].boolValue;
86 | }
87 |
88 | if json["xAxis"]["drawLabels"].exists() {
89 | self.xAxis.drawLabelsEnabled = json["xAxis"]["drawLabels"].boolValue;
90 | }
91 |
92 | if json["xAxis"]["textColor"].exists() {
93 | self.xAxis.labelTextColor = RCTConvert.uiColor(json["xAxis"]["textColor"].intValue);
94 | }
95 |
96 | if json["xAxis"]["textFontName"].exists() {
97 | self.xAxis.labelFont = UIFont(
98 | name: json["xAxis"]["textFontName"].stringValue,
99 | size: self.xAxis.labelFont.pointSize
100 | )!;
101 | }
102 |
103 | if json["xAxis"]["textSize"].exists() {
104 | self.xAxis.labelFont = self.xAxis.labelFont.withSize(CGFloat(json["xAxis"]["textSize"].floatValue));
105 | }
106 |
107 | if json["xAxis"]["gridColor"].exists() {
108 | self.xAxis.gridColor = RCTConvert.uiColor(json["xAxis"]["gridColor"].intValue);
109 | }
110 |
111 | if json["xAxis"]["gridLineWidth"].exists() {
112 | self.xAxis.gridLineWidth = CGFloat(json["xAxis"]["gridLineWidth"].floatValue);
113 | }
114 |
115 | if json["xAxis"]["axisLineColor"].exists() {
116 | self.xAxis.axisLineColor = RCTConvert.uiColor(json["xAxis"]["axisLineColor"].intValue);
117 | }
118 |
119 | if json["xAxis"]["axisLineWidth"].exists() {
120 | self.xAxis.axisLineWidth = CGFloat(json["xAxis"]["axisLineWidth"].floatValue);
121 | }
122 |
123 | if json["xAxis"]["gridDashedLine"].exists() {
124 |
125 | if json["xAxis"]["gridDashedLine"]["lineLength"].exists() {
126 | self.xAxis.gridLineDashLengths = [CGFloat(
127 | json["xAxis"]["gridDashedLine"]["lineLength"].floatValue
128 | )];
129 | }
130 |
131 | if json["xAxis"]["gridDashedLine"]["spaceLength"].exists() {
132 | self.xAxis.gridLineWidth = CGFloat(
133 | json["xAxis"]["gridDashedLine"]["spaceLength"].floatValue
134 | );
135 | }
136 |
137 | if json["xAxis"]["gridDashedLine"]["phase"].exists() {
138 | self.xAxis.gridLineDashPhase = CGFloat(
139 | json["xAxis"]["gridDashedLine"]["phase"].floatValue
140 | );
141 | }
142 |
143 | }
144 |
145 | if json["xAxis"]["limitLines"].exists() {
146 | let limitLines = json["xAxis"]["limitLines"].arrayObject;
147 | for l in limitLines! {
148 | let tmp = JSON(l);
149 |
150 | if tmp["limit"].exists() &&
151 | tmp["label"].exists() {
152 |
153 | let line = ChartLimitLine(
154 | limit: tmp["limit"].doubleValue,
155 | label: tmp["label"].stringValue
156 | );
157 |
158 | if tmp["position"].exists() {
159 | switch(tmp["position"]) {
160 | case "leftBottom":
161 | line.labelPosition = ChartLimitLine.LabelPosition.leftBottom;
162 | break;
163 | case "leftTop":
164 | line.labelPosition = ChartLimitLine.LabelPosition.leftTop;
165 | break;
166 | case "rightBottom":
167 | line.labelPosition = ChartLimitLine.LabelPosition.rightBottom;
168 | break;
169 | case "rightTop":
170 | line.labelPosition = ChartLimitLine.LabelPosition.rightTop;
171 | break;
172 | default:
173 | line.labelPosition = ChartLimitLine.LabelPosition.rightTop;
174 | break;
175 | }
176 | }
177 |
178 | if tmp["lineColor"].exists() {
179 | line.lineColor = RCTConvert.uiColor(tmp["lineColor"].intValue);
180 | }
181 |
182 | if tmp["lineDashLengths"].exists() {
183 | line.lineDashLengths = [CGFloat(tmp["lineDashLengths"].floatValue)];
184 | }
185 |
186 | if tmp["lineDashPhase"].exists() {
187 | line.lineDashPhase = CGFloat(tmp["lineDashPhase"].floatValue);
188 | }
189 |
190 | if tmp["lineWidth"].exists() {
191 | line.lineWidth = CGFloat(tmp["lineWidth"].floatValue);
192 | }
193 |
194 | if tmp["valueTextColor"].exists() {
195 | line.valueTextColor = RCTConvert.uiColor(tmp["valueTextColor"].intValue);
196 | }
197 |
198 | if tmp["xOffset"].exists() {
199 | line.xOffset = CGFloat(tmp["xOffset"].floatValue);
200 | }
201 |
202 | if tmp["yOffset"].exists() {
203 | line.yOffset = CGFloat(tmp["yOffset"].floatValue);
204 | }
205 |
206 | if tmp["textFontName"].exists() {
207 | line.valueFont = UIFont(
208 | name: tmp["textFontName"].stringValue,
209 | size: line.valueFont.pointSize
210 | )!;
211 | }
212 |
213 | if tmp["textSize"].exists() {
214 | line.valueFont = line.valueFont.withSize(CGFloat(tmp["textSize"].floatValue));
215 | }
216 |
217 |
218 | self.xAxis.addLimitLine(line);
219 | }
220 | }
221 | }
222 |
223 | if json["xAxis"]["position"].exists() {
224 | switch(json["xAxis"]["position"].stringValue) {
225 | case "bothSided":
226 | self.xAxis.labelPosition = ChartXAxis.LabelPosition.bothSided;
227 | break;
228 | case "bottom":
229 | self.xAxis.labelPosition = ChartXAxis.LabelPosition.bottom;
230 | break;
231 | case "bottomInside":
232 | self.xAxis.labelPosition = ChartXAxis.LabelPosition.bottomInside;
233 | break;
234 | case "top":
235 | self.xAxis.labelPosition = ChartXAxis.LabelPosition.top;
236 | break;
237 | case "topInside":
238 | self.xAxis.labelPosition = ChartXAxis.LabelPosition.topInside;
239 | break;
240 | default:
241 | self.xAxis.labelPosition = ChartXAxis.LabelPosition.bottom;
242 | break;
243 | }
244 | }
245 |
246 | if json["xAxis"]["labelRotationAngle"].exists() {
247 | self.xAxis.labelRotationAngle = CGFloat(json["xAxis"]["labelRotationAngle"].floatValue);
248 | }
249 |
250 | if json["xAxis"]["drawLimitLinesBehindData"].exists() {
251 | self.xAxis.drawLimitLinesBehindDataEnabled = json["xAxis"]["drawLimitLinesBehindData"].boolValue;
252 | }
253 |
254 | if json["xAxis"]["spaceBetweenLabels"].exists() {
255 | self.xAxis.spaceBetweenLabels = json["xAxis"]["spaceBetweenLabels"].intValue;
256 | }
257 |
258 | if json["xAxis"]["avoidFirstLastClippingEnabled"].exists() {
259 | self.xAxis.avoidFirstLastClippingEnabled = json["xAxis"]["avoidFirstLastClippingEnabled"].boolValue;
260 | }
261 |
262 | }
263 |
264 | // leftAxis
265 |
266 | if json["leftAxis"].exists() {
267 | if json["leftAxis"]["enabled"].exists() {
268 | self.leftAxis.enabled = json["leftAxis"]["enabled"].boolValue;
269 | }
270 |
271 | if json["leftAxis"]["drawAxisLine"].exists() {
272 | self.leftAxis.drawAxisLineEnabled = json["leftAxis"]["drawAxisLine"].boolValue;
273 | }
274 |
275 | if json["leftAxis"]["drawGridLines"].exists() {
276 | self.leftAxis.drawGridLinesEnabled = json["leftAxis"]["drawGridLines"].boolValue;
277 | }
278 |
279 | if json["leftAxis"]["drawLabels"].exists() {
280 | self.leftAxis.drawLabelsEnabled = json["leftAxis"]["drawLabels"].boolValue;
281 | }
282 |
283 | if json["leftAxis"]["textColor"].exists() {
284 | self.leftAxis.labelTextColor = RCTConvert.uiColor(json["leftAxis"]["textColor"].intValue);
285 | }
286 |
287 | if json["leftAxis"]["textFontName"].exists() {
288 | self.leftAxis.labelFont = UIFont(
289 | name: json["leftAxis"]["textFontName"].stringValue,
290 | size: self.leftAxis.labelFont.pointSize
291 | )!;
292 | }
293 |
294 | if json["leftAxis"]["textSize"].exists() {
295 | self.leftAxis.labelFont = self.leftAxis.labelFont.withSize(CGFloat(json["leftAxis"]["textSize"].floatValue));
296 | }
297 |
298 | if json["leftAxis"]["gridColor"].exists() {
299 | self.leftAxis.gridColor = RCTConvert.uiColor(json["leftAxis"]["gridColor"].intValue);
300 | }
301 |
302 | if json["leftAxis"]["gridLineWidth"].exists() {
303 | self.leftAxis.gridLineWidth = CGFloat(json["leftAxis"]["gridLineWidth"].floatValue);
304 | }
305 |
306 | if json["leftAxis"]["axisLineColor"].exists() {
307 | self.leftAxis.axisLineColor = RCTConvert.uiColor(json["leftAxis"]["axisLineColor"].intValue);
308 | }
309 |
310 | if json["leftAxis"]["axisLineWidth"].exists() {
311 | self.leftAxis.axisLineWidth = CGFloat(json["leftAxis"]["axisLineWidth"].floatValue);
312 | }
313 |
314 | if json["leftAxis"]["gridDashedLine"].exists() {
315 |
316 | if json["leftAxis"]["gridDashedLine"]["lineLength"].exists() {
317 | self.leftAxis.gridLineDashLengths = [CGFloat(
318 | json["leftAxis"]["gridDashedLine"]["lineLength"].floatValue
319 | )];
320 | }
321 |
322 | if json["leftAxis"]["gridDashedLine"]["spaceLength"].exists() {
323 | self.leftAxis.gridLineWidth = CGFloat(
324 | json["leftAxis"]["gridDashedLine"]["spaceLength"].floatValue
325 | );
326 | }
327 |
328 | if json["leftAxis"]["gridDashedLine"]["phase"].exists() {
329 | self.leftAxis.gridLineDashPhase = CGFloat(
330 | json["leftAxis"]["gridDashedLine"]["phase"].floatValue
331 | );
332 | }
333 |
334 | }
335 |
336 | if json["leftAxis"]["limitLines"].exists() {
337 | let limitLines = json["leftAxis"]["limitLines"].arrayObject;
338 | for l in limitLines! {
339 | let tmp = JSON(l);
340 |
341 | if tmp["limit"].exists() &&
342 | tmp["label"].exists() {
343 |
344 | let line = ChartLimitLine(
345 | limit: tmp["limit"].doubleValue,
346 | label: tmp["label"].stringValue
347 | );
348 |
349 | if tmp["position"].exists() {
350 | switch(tmp["position"]) {
351 | case "leftBottom":
352 | line.labelPosition = ChartLimitLine.LabelPosition.leftBottom;
353 | break;
354 | case "leftTop":
355 | line.labelPosition = ChartLimitLine.LabelPosition.leftTop;
356 | break;
357 | case "rightBottom":
358 | line.labelPosition = ChartLimitLine.LabelPosition.rightBottom;
359 | break;
360 | case "rightTop":
361 | line.labelPosition = ChartLimitLine.LabelPosition.rightTop;
362 | break;
363 | default:
364 | line.labelPosition = ChartLimitLine.LabelPosition.rightTop;
365 | break;
366 | }
367 | }
368 |
369 | if tmp["lineColor"].exists() {
370 | line.lineColor = RCTConvert.uiColor(tmp["lineColor"].intValue);
371 | }
372 |
373 | if tmp["lineDashLengths"].exists() {
374 | line.lineDashLengths = [CGFloat(tmp["lineDashLengths"].floatValue)];
375 | }
376 |
377 | if tmp["lineDashPhase"].exists() {
378 | line.lineDashPhase = CGFloat(tmp["lineDashPhase"].floatValue);
379 | }
380 |
381 | if tmp["lineWidth"].exists() {
382 | line.lineWidth = CGFloat(tmp["lineWidth"].floatValue);
383 | }
384 |
385 | if tmp["valueTextColor"].exists() {
386 | line.valueTextColor = RCTConvert.uiColor(tmp["valueTextColor"].intValue);
387 | }
388 |
389 | if tmp["xOffset"].exists() {
390 | line.xOffset = CGFloat(tmp["xOffset"].floatValue);
391 | }
392 |
393 | if tmp["yOffset"].exists() {
394 | line.yOffset = CGFloat(tmp["yOffset"].floatValue);
395 | }
396 |
397 | if tmp["textFontName"].exists() {
398 | line.valueFont = UIFont(
399 | name: tmp["textFontName"].stringValue,
400 | size: line.valueFont.pointSize
401 | )!;
402 | }
403 |
404 | if tmp["textSize"].exists() {
405 | line.valueFont = line.valueFont.withSize(CGFloat(tmp["textSize"].floatValue));
406 | }
407 |
408 | self.leftAxis.addLimitLine(line);
409 | }
410 | }
411 | }
412 |
413 | if json["leftAxis"]["position"].exists() {
414 | switch(json["leftAxis"]["position"].stringValue) {
415 | case "inside":
416 | self.leftAxis.labelPosition = ChartYAxis.LabelPosition.insideChart;
417 | break;
418 | case "outside":
419 | self.leftAxis.labelPosition = ChartYAxis.LabelPosition.outsideChart;
420 | break;
421 | default:
422 | self.leftAxis.labelPosition = ChartYAxis.LabelPosition.outsideChart;
423 | break;
424 | }
425 | }
426 |
427 | if json["leftAxis"]["drawLimitLinesBehindData"].exists() {
428 | self.leftAxis.drawLimitLinesBehindDataEnabled = json["leftAxis"]["drawLimitLinesBehindData"].boolValue;
429 | }
430 |
431 | if json["leftAxis"]["spaceTop"].exists() {
432 | self.leftAxis.spaceTop = CGFloat(json["leftAxis"]["spaceTop"].floatValue);
433 | }
434 |
435 | if json["leftAxis"]["spaceBottom"].exists() {
436 | self.leftAxis.spaceBottom = CGFloat(json["leftAxis"]["spaceBottom"].floatValue);
437 | }
438 |
439 | if json["leftAxis"]["startAtZero"].exists() {
440 | self.leftAxis.startAtZeroEnabled = json["leftAxis"]["startAtZeroEnabled"].boolValue;
441 | }
442 |
443 | if json["leftAxis"]["axisMinimum"].exists() {
444 | self.leftAxis.axisMinValue = json["leftAxis"]["axisMinimum"].doubleValue;
445 | }
446 |
447 | if json["leftAxis"]["axisMaximum"].exists() {
448 | self.leftAxis.axisMaxValue = json["leftAxis"]["axisMaximum"].doubleValue;
449 | }
450 |
451 | if json["leftAxis"]["labelCount"].exists() {
452 | self.leftAxis.labelCount = json["leftAxis"]["labelCount"].intValue;
453 | }
454 |
455 | }
456 |
457 | // rightAxis
458 |
459 | if json["rightAxis"].exists() {
460 | if json["rightAxis"]["enabled"].exists() {
461 | self.rightAxis.enabled = json["rightAxis"]["enabled"].boolValue;
462 | }
463 |
464 | if json["rightAxis"]["drawAxisLine"].exists() {
465 | self.rightAxis.drawAxisLineEnabled = json["rightAxis"]["drawAxisLine"].boolValue;
466 | }
467 |
468 | if json["rightAxis"]["drawGridLines"].exists() {
469 | self.rightAxis.drawGridLinesEnabled = json["rightAxis"]["drawGridLines"].boolValue;
470 | }
471 |
472 | if json["rightAxis"]["drawLabels"].exists() {
473 | self.rightAxis.drawLabelsEnabled = json["rightAxis"]["drawLabels"].boolValue;
474 | }
475 |
476 | if json["rightAxis"]["textColor"].exists() {
477 | self.rightAxis.labelTextColor = RCTConvert.uiColor(json["rightAxis"]["textColor"].intValue);
478 | }
479 |
480 | if json["rightAxis"]["textFontName"].exists() {
481 | self.rightAxis.labelFont = UIFont(
482 | name: json["rightAxis"]["textFontName"].stringValue,
483 | size: self.rightAxis.labelFont.pointSize
484 | )!;
485 | }
486 |
487 | if json["rightAxis"]["textSize"].exists() {
488 | self.rightAxis.labelFont = self.rightAxis.labelFont.withSize(CGFloat(json["rightAxis"]["textSize"].floatValue));
489 | }
490 |
491 | if json["rightAxis"]["gridColor"].exists() {
492 | self.rightAxis.gridColor = RCTConvert.uiColor(json["rightAxis"]["gridColor"].intValue);
493 | }
494 |
495 | if json["rightAxis"]["gridLineWidth"].exists() {
496 | self.rightAxis.gridLineWidth = CGFloat(json["rightAxis"]["gridLineWidth"].floatValue);
497 | }
498 |
499 | if json["rightAxis"]["axisLineColor"].exists() {
500 | self.rightAxis.axisLineColor = RCTConvert.uiColor(json["rightAxis"]["axisLineColor"].intValue);
501 | }
502 |
503 | if json["rightAxis"]["axisLineWidth"].exists() {
504 | self.rightAxis.axisLineWidth = CGFloat(json["rightAxis"]["axisLineWidth"].floatValue);
505 | }
506 |
507 | if json["rightAxis"]["gridDashedLine"].exists() {
508 |
509 | if json["rightAxis"]["gridDashedLine"]["lineLength"].exists() {
510 | self.rightAxis.gridLineDashLengths = [CGFloat(
511 | json["rightAxis"]["gridDashedLine"]["lineLength"].floatValue
512 | )];
513 | }
514 |
515 | if json["rightAxis"]["gridDashedLine"]["spaceLength"].exists() {
516 | self.rightAxis.gridLineWidth = CGFloat(
517 | json["rightAxis"]["gridDashedLine"]["spaceLength"].floatValue
518 | );
519 | }
520 |
521 | if json["rightAxis"]["gridDashedLine"]["phase"].exists() {
522 | self.rightAxis.gridLineDashPhase = CGFloat(
523 | json["rightAxis"]["gridDashedLine"]["phase"].floatValue
524 | );
525 | }
526 |
527 | }
528 |
529 | if json["rightAxis"]["limitLines"].exists() {
530 | let limitLines = json["rightAxis"]["limitLines"].arrayObject;
531 | for l in limitLines! {
532 | let tmp = JSON(l);
533 |
534 | if tmp["limit"].exists() &&
535 | tmp["label"].exists() {
536 |
537 | let line = ChartLimitLine(
538 | limit: tmp["limit"].doubleValue,
539 | label: tmp["label"].stringValue
540 | );
541 |
542 | if tmp["position"].exists() {
543 | switch(tmp["position"]) {
544 | case "leftBottom":
545 | line.labelPosition = ChartLimitLine.LabelPosition.leftBottom;
546 | break;
547 | case "leftTop":
548 | line.labelPosition = ChartLimitLine.LabelPosition.leftTop;
549 | break;
550 | case "rightBottom":
551 | line.labelPosition = ChartLimitLine.LabelPosition.rightBottom;
552 | break;
553 | case "rightTop":
554 | line.labelPosition = ChartLimitLine.LabelPosition.rightTop;
555 | break;
556 | default:
557 | line.labelPosition = ChartLimitLine.LabelPosition.rightTop;
558 | break;
559 | }
560 | }
561 |
562 | if tmp["lineColor"].exists() {
563 | line.lineColor = RCTConvert.uiColor(tmp["lineColor"].intValue);
564 | }
565 |
566 | if tmp["lineDashLengths"].exists() {
567 | line.lineDashLengths = [CGFloat(tmp["lineDashLengths"].floatValue)];
568 | }
569 |
570 | if tmp["lineDashPhase"].exists() {
571 | line.lineDashPhase = CGFloat(tmp["lineDashPhase"].floatValue);
572 | }
573 |
574 | if tmp["lineWidth"].exists() {
575 | line.lineWidth = CGFloat(tmp["lineWidth"].floatValue);
576 | }
577 |
578 | if tmp["valueTextColor"].exists() {
579 | line.valueTextColor = RCTConvert.uiColor(tmp["valueTextColor"].intValue);
580 | }
581 |
582 | if tmp["xOffset"].exists() {
583 | line.xOffset = CGFloat(tmp["xOffset"].floatValue);
584 | }
585 |
586 | if tmp["yOffset"].exists() {
587 | line.yOffset = CGFloat(tmp["yOffset"].floatValue);
588 | }
589 |
590 | if tmp["textFontName"].exists() {
591 | line.valueFont = UIFont(
592 | name: tmp["textFontName"].stringValue,
593 | size: line.valueFont.pointSize
594 | )!;
595 | }
596 |
597 | if tmp["textSize"].exists() {
598 | line.valueFont = line.valueFont.withSize(CGFloat(tmp["textSize"].floatValue));
599 | }
600 |
601 | self.rightAxis.addLimitLine(line);
602 | }
603 | }
604 | }
605 |
606 | if json["rightAxis"]["position"].exists() {
607 | switch(json["rightAxis"]["position"].stringValue) {
608 | case "inside":
609 | self.rightAxis.labelPosition = ChartYAxis.LabelPosition.insideChart;
610 | break;
611 | case "outside":
612 | self.rightAxis.labelPosition = ChartYAxis.LabelPosition.outsideChart;
613 | break;
614 | default:
615 | self.rightAxis.labelPosition = ChartYAxis.LabelPosition.outsideChart;
616 | break;
617 | }
618 | }
619 |
620 | if json["rightAxis"]["drawLimitLinesBehindData"].exists() {
621 | self.rightAxis.drawLimitLinesBehindDataEnabled = json["rightAxis"]["drawLimitLinesBehindData"].boolValue;
622 | }
623 |
624 | if json["rightAxis"]["spaceTop"].exists() {
625 | self.rightAxis.spaceTop = CGFloat(json["rightAxis"]["spaceTop"].floatValue);
626 | }
627 |
628 | if json["rightAxis"]["spaceBottom"].exists() {
629 | self.rightAxis.spaceBottom = CGFloat(json["rightAxis"]["spaceBottom"].floatValue);
630 | }
631 |
632 | if json["rightAxis"]["startAtZero"].exists() {
633 | self.rightAxis.startAtZeroEnabled = json["rightAxis"]["startAtZeroEnabled"].boolValue;
634 | }
635 |
636 | if json["rightAxis"]["axisMinimum"].exists() {
637 | self.rightAxis.axisMinValue = json["rightAxis"]["axisMinimum"].doubleValue;
638 | }
639 |
640 | if json["rightAxis"]["axisMaximum"].exists() {
641 | self.rightAxis.axisMaxValue = json["rightAxis"]["axisMaximum"].doubleValue;
642 | }
643 |
644 | if json["rightAxis"]["labelCount"].exists() {
645 | self.rightAxis.labelCount = json["rightAxis"]["labelCount"].intValue;
646 | }
647 | }
648 |
649 | if json["valueFormatter"].exists() {
650 | if json["valueFormatter"]["minimumDecimalPlaces"].exists() {
651 | minimumDecimalPlaces = json["valueFormatter"]["minimumDecimalPlaces"].intValue;
652 | }
653 | if json["valueFormatter"]["maximumDecimalPlaces"].exists() {
654 | maximumDecimalPlaces = json["valueFormatter"]["maximumDecimalPlaces"].intValue;
655 | }
656 |
657 | if json["valueFormatter"]["type"].exists() {
658 | switch(json["valueFormatter"]["type"]) {
659 | case "regular":
660 | self.leftAxis.valueFormatter = NumberFormatter();
661 | self.rightAxis.valueFormatter = NumberFormatter();
662 | break;
663 | case "abbreviated":
664 | self.leftAxis.valueFormatter = ABNumberFormatter(minimumDecimalPlaces: minimumDecimalPlaces, maximumDecimalPlaces: maximumDecimalPlaces);
665 | self.rightAxis.valueFormatter = ABNumberFormatter(minimumDecimalPlaces: minimumDecimalPlaces, maximumDecimalPlaces: maximumDecimalPlaces);
666 | break;
667 | default:
668 | self.leftAxis.valueFormatter = NumberFormatter();
669 | self.rightAxis.valueFormatter = NumberFormatter();
670 | }
671 | }
672 |
673 | if json["valueFormatter"]["numberStyle"].exists() {
674 | switch(json["valueFormatter"]["numberStyle"]) {
675 | case "CurrencyAccountingStyle":
676 | if #available(iOS 9.0, *) {
677 | self.leftAxis.valueFormatter?.numberStyle = .currencyAccounting;
678 | self.rightAxis.valueFormatter?.numberStyle = .currencyAccounting;
679 | }
680 | break;
681 | case "CurrencyISOCodeStyle":
682 | if #available(iOS 9.0, *) {
683 | self.leftAxis.valueFormatter?.numberStyle = .currencyISOCode;
684 | self.rightAxis.valueFormatter?.numberStyle = .currencyISOCode;
685 | }
686 | break;
687 | case "CurrencyPluralStyle":
688 | if #available(iOS 9.0, *) {
689 | self.leftAxis.valueFormatter?.numberStyle = .currencyPlural;
690 | self.rightAxis.valueFormatter?.numberStyle = .currencyPlural;
691 | }
692 | break;
693 | case "CurrencyStyle":
694 | self.leftAxis.valueFormatter?.numberStyle = .currency;
695 | self.rightAxis.valueFormatter?.numberStyle = .currency;
696 | break;
697 | case "DecimalStyle":
698 | self.leftAxis.valueFormatter?.numberStyle = .decimal;
699 | self.rightAxis.valueFormatter?.numberStyle = .decimal;
700 | break;
701 | case "NoStyle":
702 | self.leftAxis.valueFormatter?.numberStyle = .none;
703 | self.rightAxis.valueFormatter?.numberStyle = .none;
704 | break;
705 | case "OrdinalStyle":
706 | if #available(iOS 9.0, *) {
707 | self.leftAxis.valueFormatter?.numberStyle = .ordinal;
708 | self.rightAxis.valueFormatter?.numberStyle = .ordinal;
709 | }
710 | break;
711 | case "PercentStyle":
712 | self.leftAxis.valueFormatter?.numberStyle = .percent;
713 | self.rightAxis.valueFormatter?.numberStyle = .percent;
714 | break;
715 | case "ScientificStyle":
716 | self.leftAxis.valueFormatter?.numberStyle = .scientific;
717 | self.rightAxis.valueFormatter?.numberStyle = .scientific;
718 | break;
719 | case "SpellOutStyle":
720 | self.leftAxis.valueFormatter?.numberStyle = .spellOut;
721 | self.rightAxis.valueFormatter?.numberStyle = .spellOut;
722 | break;
723 | default:
724 | self.leftAxis.valueFormatter?.numberStyle = .none;
725 | self.rightAxis.valueFormatter?.numberStyle = .none;
726 | }
727 | }
728 |
729 | self.leftAxis.valueFormatter?.minimumFractionDigits = minimumDecimalPlaces;
730 | self.rightAxis.valueFormatter?.minimumFractionDigits = minimumDecimalPlaces;
731 | self.leftAxis.valueFormatter?.maximumFractionDigits = maximumDecimalPlaces;
732 | self.rightAxis.valueFormatter?.maximumFractionDigits = maximumDecimalPlaces;
733 | }
734 |
735 | if json["viewport"].exists() {
736 |
737 | if json["viewport"]["left"].exists() &&
738 | json["viewport"]["top"].exists() &&
739 | json["viewport"]["right"].exists() &&
740 | json["viewport"]["bottom"].exists() {
741 |
742 | self.setViewPortOffsets(
743 | left: CGFloat(json["viewport"]["left"].floatValue),
744 | top: CGFloat(json["viewport"]["top"].floatValue),
745 | right: CGFloat(json["viewport"]["right"].floatValue),
746 | bottom: CGFloat(json["viewport"]["bottom"].floatValue)
747 | )
748 | }
749 | }
750 | }
751 | }
752 |
--------------------------------------------------------------------------------
/RNiOSCharts/ChartViewBaseExtension.swift:
--------------------------------------------------------------------------------
1 |
2 | //
3 | // ChartViewBaseExtension.swift
4 | // PoliRank
5 | //
6 | // Created by Jose Padilla on 2/8/16.
7 | // Copyright © 2016 Facebook. All rights reserved.
8 | //
9 |
10 | import SwiftyJSON
11 | import Charts
12 |
13 | extension ChartViewBase {
14 |
15 | func setChartViewBaseProps(_ config: String!) {
16 | var legendColors: [UIColor] = ChartColorTemplates.colorful();
17 | var legendLabels: [String] = [];
18 |
19 | self.descriptionText = "";
20 | self.backgroundColor = UIColor(red: 255.0, green: 255.0, blue: 255.0, alpha: 0.0);
21 |
22 | var json: JSON = nil;
23 | if let data = config.data(using: String.Encoding.utf8) {
24 | json = JSON(data: data);
25 | };
26 |
27 | if json["backgroundColor"].exists() {
28 | self.backgroundColor = RCTConvert.uiColor(json["backgroundColor"].intValue);
29 | }
30 |
31 | if json["noDataText"].exists() {
32 | self.noDataText = json["noDataText"].stringValue;
33 | }
34 |
35 | if json["descriptionText"].exists() {
36 | self.descriptionText = json["descriptionText"].stringValue;
37 | }
38 |
39 | if json["descriptionFontName"].exists() {
40 | self.descriptionFont = UIFont(
41 | name: json["descriptionFontName"].stringValue,
42 | size: self.descriptionFont!.pointSize
43 | );
44 | }
45 |
46 | if json["descriptionFontSize"].exists() {
47 | self.descriptionFont = self.descriptionFont?.withSize(CGFloat(json["descriptionFontSize"].floatValue));
48 | }
49 |
50 | if json["descriptionTextColor"].exists() {
51 | self.descriptionTextColor = RCTConvert.uiColor(json["descriptionTextColor"].intValue);
52 | }
53 |
54 | if json["descriptionTextPosition"].exists() &&
55 | json["descriptionTextPosition"]["x"].exists() &&
56 | json["descriptionTextPosition"]["y"].exists() {
57 |
58 | self.setDescriptionTextPosition(
59 | x: CGFloat(json["descriptionTextPosition"]["x"].floatValue),
60 | y: CGFloat(json["descriptionTextPosition"]["y"].floatValue)
61 | )
62 | }
63 |
64 | if json["infoTextFontName"].exists() {
65 | self.infoFont = UIFont(
66 | name: json["infoTextFontName"].stringValue,
67 | size: self.infoFont!.pointSize
68 | );
69 | }
70 |
71 | if json["infoTextFontSize"].exists() {
72 | self.infoFont = self.infoFont?.withSize(CGFloat(json["infoTextFontSize"].floatValue));
73 | }
74 |
75 | if json["infoTextColor"].exists() {
76 | self.infoTextColor = RCTConvert.uiColor(json["infoTextColor"].intValue);
77 | }
78 |
79 | if json["descriptionTextAlign"].exists() {
80 | switch (json["descriptionTextAlign"].stringValue) {
81 | case "left":
82 | self.descriptionTextAlign = NSTextAlignment.left;
83 | break;
84 | case "center":
85 | self.descriptionTextAlign = NSTextAlignment.center;
86 | break;
87 | case "right":
88 | self.descriptionTextAlign = NSTextAlignment.right;
89 | break;
90 | case "justified":
91 | self.descriptionTextAlign = NSTextAlignment.justified;
92 | break;
93 | default:
94 | break;
95 | }
96 | }
97 |
98 | if json["drawMarkers"].exists() {
99 | self.drawMarkers = json["drawMarkers"].boolValue;
100 | }
101 |
102 | if json["marker"].exists() {
103 | var markerFont = UIFont.systemFontOfSize(12.0);
104 |
105 | if json["marker"]["markerFontSize"].exists() {
106 | markerFont = markerFont.fontWithSize(CGFloat(json["marker"]["markerFontSize"].floatValue));
107 | }
108 |
109 | if json["marker"]["markerFontName"].exists() {
110 | markerFont = UIFont(
111 | name: json["marker"]["markerFontName"].stringValue,
112 | size: markerFont.pointSize
113 | )!;
114 | }
115 |
116 | self.marker = BalloonMarker(
117 | color: RCTConvert.UIColor(json["marker"]["markerColor"].intValue),
118 | font: markerFont,
119 | textColor: RCTConvert.UIColor(json["marker"]["markerTextColor"].intValue),
120 | insets: UIEdgeInsetsMake(8.0, 8.0, 20.0, 8.0)
121 | )
122 | }
123 |
124 | if json["showLegend"].exists() {
125 | self.legend.enabled = json["showLegend"].boolValue;
126 | }
127 |
128 | if json["legend"].exists() {
129 | if json["legend"]["textColor"].exists() {
130 | self.legend.textColor = RCTConvert.uiColor(json["legend"]["textColor"].intValue);
131 | }
132 |
133 | if json["legend"]["textSize"].exists() {
134 | self.legend.font = self.legend.font.withSize(CGFloat(json["legend"]["textSize"].floatValue));
135 | }
136 |
137 | if json["legend"]["textFontName"].exists() {
138 | self.legend.font = UIFont(
139 | name: json["legend"]["textFontName"].stringValue,
140 | size: self.legend.font.pointSize
141 | )!;
142 | }
143 |
144 | if json["legend"]["wordWrap"].exists() {
145 | self.legend.wordWrapEnabled = json["legend"]["wordWrap"].boolValue;
146 | }
147 |
148 | if json["legend"]["maxSizePercent"].exists() {
149 | self.legend.maxSizePercent = CGFloat(json["legend"]["maxSizePercent"].floatValue);
150 | }
151 |
152 | if json["legend"]["position"].exists() {
153 | switch(json["legend"]["position"].stringValue) {
154 | case "rightOfChart":
155 | self.legend.position = ChartLegend.Position.rightOfChart;
156 | break;
157 | case "rightOfChartCenter":
158 | self.legend.position = ChartLegend.Position.rightOfChartCenter;
159 | break;
160 | case "rightOfChartInside":
161 | self.legend.position = ChartLegend.Position.rightOfChartInside;
162 | break;
163 | case "leftOfChart":
164 | self.legend.position = ChartLegend.Position.leftOfChart;
165 | break;
166 | case "leftOfChartCenter":
167 | self.legend.position = ChartLegend.Position.leftOfChartCenter;
168 | break;
169 | case "leftOfChartInside":
170 | self.legend.position = ChartLegend.Position.leftOfChartInside;
171 | break;
172 | case "belowChartLeft":
173 | self.legend.position = ChartLegend.Position.belowChartLeft;
174 | break;
175 | case "belowChartRight":
176 | self.legend.position = ChartLegend.Position.belowChartRight;
177 | break;
178 | case "belowChartCenter":
179 | self.legend.position = ChartLegend.Position.belowChartCenter;
180 | break;
181 | case "aboveChartLeft":
182 | self.legend.position = ChartLegend.Position.aboveChartLeft;
183 | break;
184 | case "aboveChartRight":
185 | self.legend.position = ChartLegend.Position.aboveChartRight;
186 | break;
187 | case "aboveChartCenter":
188 | self.legend.position = ChartLegend.Position.aboveChartCenter;
189 | break;
190 | case "pieChartCenter":
191 | self.legend.position = ChartLegend.Position.piechartCenter;
192 | break;
193 | default:
194 | self.legend.position = ChartLegend.Position.belowChartLeft;
195 | break;
196 | }
197 | }
198 |
199 | if json["legend"]["form"].exists() {
200 | switch(json["legend"]["form"]) {
201 | case "square":
202 | self.legend.form = ChartLegend.Form.square;
203 | break;
204 | case "circle":
205 | self.legend.form = ChartLegend.Form.circle;
206 | break;
207 | case "line":
208 | self.legend.form = ChartLegend.Form.line;
209 | break;
210 | default:
211 | self.legend.form = ChartLegend.Form.square;
212 | break;
213 | }
214 | }
215 |
216 | if json["legend"]["formSize"].exists() {
217 | self.legend.formSize = CGFloat(json["legend"]["formSize"].floatValue);
218 | }
219 |
220 | if json["legend"]["xEntrySpace"].exists() {
221 | self.legend.xEntrySpace = CGFloat(json["legend"]["xEntrySpace"].floatValue);
222 | }
223 |
224 | if json["legend"]["yEntrySpace"].exists() {
225 | self.legend.yEntrySpace = CGFloat(json["legend"]["yEntrySpace"].floatValue);
226 | }
227 |
228 | if json["legend"]["formToTextSpace"].exists() {
229 | self.legend.formToTextSpace = CGFloat(json["legend"]["formToTextSpace"].floatValue);
230 | }
231 |
232 | if json["legend"]["colors"].exists() {
233 | let arrColors = json["legend"]["colors"].arrayValue.map({$0.intValue});
234 | legendColors = arrColors.map({return RCTConvert.uiColor($0)});
235 | if legendLabels.count == legendColors.count {
236 | legend.setCustom(colors: legendColors, labels: legendLabels);
237 | }
238 | }
239 |
240 | if json["legend"]["labels"].exists() {
241 | legendLabels = json["legend"]["labels"].arrayValue.map({$0.stringValue});
242 | if legendLabels.count == legendColors.count {
243 | legend.setCustom(colors: legendColors, labels: legendLabels);
244 | }
245 | }
246 | }
247 |
248 | if json["userInteractionEnabled"].exists() {
249 | self.isUserInteractionEnabled = json["userInteractionEnabled"].boolValue;
250 | }
251 |
252 | if json["dragDecelerationEnabled"].exists() {
253 | self.dragDecelerationEnabled = json["dragDecelerationEnabled"].boolValue;
254 | }
255 |
256 | if json["dragDecelerationFrictionCoef"].exists() {
257 | self.dragDecelerationFrictionCoef = CGFloat(json["dragDecelerationFrictionCoef"].floatValue);
258 | }
259 |
260 | if json["highlightPerTap"].exists() {
261 | self.highlightPerTapEnabled = json["highlightPerTap"].boolValue;
262 | }
263 |
264 | if json["highlightValues"].exists() {
265 | let highlightValues = json["highlightValues"].arrayValue.map({$0.intValue});
266 | self.highlightValues(highlightValues.map({return ChartHighlight(xIndex: $0, dataSetIndex: 0)}));
267 | }
268 |
269 | if json["animation"].exists() {
270 | let xAxisDuration = json["animation"]["xAxisDuration"].exists() ?
271 | json["animation"]["xAxisDuration"].doubleValue : 0;
272 | let yAxisDuration = json["animation"]["yAxisDuration"].exists() ?
273 | json["animation"]["yAxisDuration"].doubleValue : 0;
274 |
275 | var easingOption: ChartEasingOption = .linear;
276 |
277 | if json["animation"]["easingOption"].exists() {
278 | switch(json["animation"]["easingOption"]) {
279 | case "linear":
280 | easingOption = .linear;
281 | break;
282 | case "easeInQuad":
283 | easingOption = .easeInQuad;
284 | break;
285 | case "easeOutQuad":
286 | easingOption = .easeOutQuad;
287 | break;
288 | case "easeInOutQuad":
289 | easingOption = .easeInOutQuad;
290 | break;
291 | case "easeInCubic":
292 | easingOption = .easeInCubic;
293 | break;
294 | case "easeOutCubic":
295 | easingOption = .easeOutCubic;
296 | break;
297 | case "easeInOutCubic":
298 | easingOption = .easeInOutCubic;
299 | break;
300 | case "easeInQuart":
301 | easingOption = .easeInQuart;
302 | break;
303 | case "easeOutQuart":
304 | easingOption = .easeOutQuart;
305 | break;
306 | case "easeInOutQuart":
307 | easingOption = .easeInOutQuart;
308 | break;
309 | case "easeInQuint":
310 | easingOption = .easeInQuint;
311 | break;
312 | case "easeOutQuint":
313 | easingOption = .easeOutQuint;
314 | break;
315 | case "easeInOutQuint":
316 | easingOption = .easeInOutQuint;
317 | break;
318 | case "easeInSine":
319 | easingOption = .easeInSine;
320 | break;
321 | case "easeOutSine":
322 | easingOption = .easeOutSine;
323 | break;
324 | case "easeInOutSine":
325 | easingOption = .easeInOutSine;
326 | break;
327 | case "easeInExpo":
328 | easingOption = .easeInExpo;
329 | break;
330 | case "easeOutExpo":
331 | easingOption = .easeOutExpo;
332 | break;
333 | case "easeInOutExpo":
334 | easingOption = .easeInOutExpo;
335 | break;
336 | case "easeInCirc":
337 | easingOption = .easeInCirc;
338 | break;
339 | case "easeOutCirc":
340 | easingOption = .easeOutCirc;
341 | break;
342 | case "easeInOutCirc":
343 | easingOption = .easeInOutCirc;
344 | break;
345 | case "easeInElastic":
346 | easingOption = .easeInElastic;
347 | break;
348 | case "easeOutElastic":
349 | easingOption = .easeOutElastic;
350 | break;
351 | case "easeInBack":
352 | easingOption = .easeInBack;
353 | break;
354 | case "easeOutBack":
355 | easingOption = .easeOutBack;
356 | break;
357 | case "easeInOutBack":
358 | easingOption = .easeInOutBack;
359 | break;
360 | case "easeInBounce":
361 | easingOption = .easeInBounce;
362 | break;
363 | case "easeOutBounce":
364 | easingOption = .easeOutBounce;
365 | break;
366 | case "easeInOutBounce":
367 | easingOption = .easeInOutBounce;
368 | break;
369 | default:
370 | easingOption = .linear;
371 | break;
372 | }
373 | }
374 |
375 | self.animate(xAxisDuration: xAxisDuration, yAxisDuration: yAxisDuration, easingOption: easingOption);
376 | }
377 | }
378 | }
379 |
--------------------------------------------------------------------------------
/RNiOSCharts/PieRadarChartViewBaseExtension.swift:
--------------------------------------------------------------------------------
1 | //
2 | // PieRadarChartViewBase.swift
3 | // PoliRank
4 | //
5 | // Created by Jose Padilla on 2/8/16.
6 | // Copyright © 2016 Facebook. All rights reserved.
7 | //
8 |
9 | import Charts
10 | import SwiftyJSON
11 |
12 | extension PieRadarChartViewBase {
13 |
14 | func setPieRadarChartViewBaseProps(_ config: String!) {
15 | setChartViewBaseProps(config);
16 |
17 | var json: JSON = nil;
18 | if let data = config.data(using: String.Encoding.utf8) {
19 | json = JSON(data: data);
20 | };
21 |
22 | if json["rotationEnabled"].exists() {
23 | self.rotationEnabled = json["rotationEnabled"].boolValue;
24 | }
25 |
26 | if json["rotationAngle"].exists() {
27 | self.rotationAngle = CGFloat(json["rotationAngle"].floatValue);
28 | }
29 |
30 | if json["rotationWithTwoFingers"].exists() {
31 | self.rotationWithTwoFingers = json["rotationWithTwoFingers"].boolValue;
32 | }
33 |
34 | if json["minOffset"].exists() {
35 | self.minOffset = CGFloat(json["minOffset"].floatValue);
36 | }
37 |
38 | }
39 | }
40 |
--------------------------------------------------------------------------------
/RNiOSCharts/RCTIOSCharts-Bridging-Header.h:
--------------------------------------------------------------------------------
1 | //
2 | // Use this file to import your target's public headers that you would like to expose to Swift.
3 | //
4 |
5 | #import "RCTBridge.h"
6 | #import "RCTViewManager.h"
7 | #import "RCTUIManager.h"
8 | #import "UIView+React.h"
--------------------------------------------------------------------------------
/RNiOSCharts/RNBarChart.h:
--------------------------------------------------------------------------------
1 | //
2 | // RNBarChart.h
3 | // RCTIOSCharts
4 | //
5 | // Created by Jose Padilla on 12/24/15.
6 | // Copyright © 2015 Facebook. All rights reserved.
7 | //
8 |
9 | #import "RCTView.h"
10 |
11 | @interface RNBarChart : RCTView
12 |
13 | @property (nonatomic, assign) NSString *config;
14 |
15 | @end
16 |
--------------------------------------------------------------------------------
/RNiOSCharts/RNBarChart.m:
--------------------------------------------------------------------------------
1 | //
2 | // RNBarChart.m
3 | // RCTIOSCharts
4 | //
5 | // Created by Jose Padilla on 12/24/15.
6 | // Copyright © 2015 Facebook. All rights reserved.
7 | //
8 |
9 | #import "RNBarChart.h"
10 | #import "RCTViewManager.h"
11 |
12 | @interface RCT_EXTERN_MODULE(RNBarChartSwift, RCTViewManager)
13 |
14 | RCT_EXPORT_VIEW_PROPERTY(config, NSString);
15 | RCT_EXTERN_METHOD(setVisibleXRangeMaximum:(nonnull NSNumber *)reactTag value:(CGFloat *)v);
16 |
17 | @end
--------------------------------------------------------------------------------
/RNiOSCharts/RNBarChart.swift:
--------------------------------------------------------------------------------
1 | //
2 | // BarChart.swift
3 | // PoliRank
4 | //
5 | // Created by Jose Padilla on 2/6/16.
6 | // Copyright © 2016 Facebook. All rights reserved.
7 | //
8 |
9 | import Charts
10 | import SwiftyJSON
11 |
12 | @objc(RNBarChart)
13 | class RNBarChart : BarChartView {
14 |
15 | override init(frame: CGRect) {
16 | super.init(frame: frame);
17 | self.frame = frame;
18 | }
19 |
20 | required init?(coder aDecoder: NSCoder) {
21 | fatalError("init(coder:) has not been implemented");
22 | }
23 |
24 | func setConfig(_ config: String!) {
25 | setBarLineChartViewBaseProps(config);
26 |
27 | var labels: [String] = [];
28 |
29 | var json: JSON = nil;
30 | if let data = config.data(using: String.Encoding.utf8) {
31 | json = JSON(data: data);
32 | };
33 |
34 | if json["labels"].exists() {
35 | labels = json["labels"].arrayValue.map({$0.stringValue});
36 | }
37 |
38 | self.data = getBarData(labels, json: json);
39 |
40 |
41 | if json["drawValueAboveBar"].exists() {
42 | self.drawValueAboveBarEnabled = json["drawValueAboveBar"].boolValue;
43 | }
44 |
45 | if json["drawHighlightArrow"].exists() {
46 | self.drawHighlightArrowEnabled = json["drawHighlightArrow"].boolValue;
47 | }
48 |
49 | if json["drawBarShadow"].exists() {
50 | self.drawBarShadowEnabled = json["drawBarShadow"].boolValue;
51 | }
52 |
53 | }
54 |
55 | }
56 |
--------------------------------------------------------------------------------
/RNiOSCharts/RNBarChartManager.swift:
--------------------------------------------------------------------------------
1 | //
2 | // RNBarChartManager.swift
3 | // RCTIOSCharts
4 | //
5 | // Created by Jose Padilla on 12/24/15.
6 | // Copyright © 2015 Facebook. All rights reserved.
7 | //
8 |
9 | import Foundation
10 |
11 | @objc(RNBarChartSwift)
12 | class RNBarChartManager : RCTViewManager {
13 | override func view() -> UIView! {
14 | return RNBarChart();
15 | }
16 |
17 | @objc func setVisibleXRangeMaximum(_ reactTag: NSNumber, value: CGFloat) {
18 | self.bridge!.uiManager.addUIBlock { (uiManager: RCTUIManager?, viewRegistry:[NSNumber : UIView]?) in
19 | let view: RNBarChart = viewRegistry![reactTag] as! RNBarChart;
20 | view.setVisibleXRangeMaximum(value);
21 | }
22 | }
23 | }
24 |
--------------------------------------------------------------------------------
/RNiOSCharts/RNBubbleChart.h:
--------------------------------------------------------------------------------
1 | //
2 | // RNLineChart.h
3 | // RCTIOSCharts
4 | //
5 | // Created by Jose Padilla on 12/29/15.
6 | // Copyright © 2015 Facebook. All rights reserved.
7 | //
8 |
9 | #import "RCTView.h"
10 |
11 | @interface RNBubbleChart : RCTView
12 |
13 | @property (nonatomic, assign) NSString *config;
14 |
15 | @end
16 |
--------------------------------------------------------------------------------
/RNiOSCharts/RNBubbleChart.m:
--------------------------------------------------------------------------------
1 | //
2 | // RNPieChart.m
3 | // PoliRank
4 | //
5 | // Created by Jose Padilla on 2/8/16.
6 | // Copyright © 2016 Facebook. All rights reserved.
7 | //
8 |
9 | #import "RNBubbleChart.h"
10 | #import "RCTViewManager.h"
11 |
12 | @interface RCT_EXTERN_MODULE(RNBubbleChartSwift, RCTViewManager)
13 |
14 | RCT_EXPORT_VIEW_PROPERTY(config, NSString);
15 |
16 | @end
--------------------------------------------------------------------------------
/RNiOSCharts/RNBubbleChart.swift:
--------------------------------------------------------------------------------
1 | //
2 | // RNPieChart.swift
3 | // PoliRank
4 | //
5 | // Created by Jose Padilla on 2/8/16.
6 | // Copyright © 2016 Facebook. All rights reserved.
7 | //
8 |
9 | import Charts
10 | import SwiftyJSON
11 |
12 | @objc(RNBubbleChart)
13 | class RNBubbleChart : BubbleChartView {
14 |
15 | override init(frame: CGRect) {
16 | super.init(frame: frame);
17 | self.frame = frame;
18 | }
19 |
20 | required init?(coder aDecoder: NSCoder) {
21 | fatalError("init(coder:) has not been implemented");
22 | }
23 |
24 | func setConfig(_ config: String!) {
25 | setBarLineChartViewBaseProps(config);
26 |
27 | var labels: [String] = [];
28 |
29 | var json: JSON = nil;
30 | if let data = config.data(using: String.Encoding.utf8) {
31 | json = JSON(data: data);
32 | };
33 |
34 | if json["labels"].exists() {
35 | labels = json["labels"].arrayValue.map({$0.stringValue});
36 | }
37 |
38 | self.data = getBubbleData(labels, json: json);
39 |
40 | }
41 |
42 | }
43 |
--------------------------------------------------------------------------------
/RNiOSCharts/RNBubbleChartManager.swift:
--------------------------------------------------------------------------------
1 | //
2 | // RNHorizontalBarChartManager.swift
3 | // RCTIOSCharts
4 | //
5 | // Created by Jose Padilla on 12/24/15.
6 | // Copyright © 2015 Facebook. All rights reserved.
7 | //
8 |
9 | import Foundation
10 |
11 | @objc(RNBubbleChartSwift)
12 | class RNBubbleChartManager : RCTViewManager {
13 | override func view() -> UIView! {
14 | return RNBubbleChart();
15 | }
16 | }
--------------------------------------------------------------------------------
/RNiOSCharts/RNCandleChartManager.swift:
--------------------------------------------------------------------------------
1 | //
2 | // RNHorizontalBarChartManager.swift
3 | // RCTIOSCharts
4 | //
5 | // Created by Jose Padilla on 12/24/15.
6 | // Copyright © 2015 Facebook. All rights reserved.
7 | //
8 |
9 | import Foundation
10 |
11 | @objc(RNCandleStickChartSwift)
12 | class RNCandleStickChartManager : RCTViewManager {
13 | override func view() -> UIView! {
14 | return RNCandleStickChart();
15 | }
16 |
17 | @objc func setVisibleXRangeMaximum(reactTag: NSNumber, value: CGFloat) {
18 | self.bridge!.uiManager.addUIBlock { (uiManager: RCTUIManager?, viewRegistry:[NSNumber : UIView]?) in
19 | let view: RNCandleStickChart = viewRegistry![reactTag] as! RNCandleStickChart;
20 | view.setVisibleXRangeMaximum(value);
21 | }
22 | }
23 | }
24 |
--------------------------------------------------------------------------------
/RNiOSCharts/RNCandleStickChart.h:
--------------------------------------------------------------------------------
1 | //
2 | // RNLineChart.h
3 | // RCTIOSCharts
4 | //
5 | // Created by Jose Padilla on 12/29/15.
6 | // Copyright © 2015 Facebook. All rights reserved.
7 | //
8 |
9 | #import "RCTView.h"
10 |
11 | @interface RNCandleStickChart : RCTView
12 |
13 | @property (nonatomic, assign) NSString *config;
14 |
15 | @end
16 |
--------------------------------------------------------------------------------
/RNiOSCharts/RNCandleStickChart.m:
--------------------------------------------------------------------------------
1 | //
2 | // RNPieChart.m
3 | // PoliRank
4 | //
5 | // Created by Jose Padilla on 2/8/16.
6 | // Copyright © 2016 Facebook. All rights reserved.
7 | //
8 |
9 | #import "RNCandleStickChart.h"
10 | #import "RCTViewManager.h"
11 |
12 | @interface RCT_EXTERN_MODULE(RNCandleStickChartSwift, RCTViewManager)
13 |
14 | RCT_EXPORT_VIEW_PROPERTY(config, NSString);
15 | RCT_EXTERN_METHOD(setVisibleXRangeMaximum:(nonnull NSNumber *)reactTag value:(CGFloat *)v);
16 |
17 | @end
--------------------------------------------------------------------------------
/RNiOSCharts/RNCandleStickChart.swift:
--------------------------------------------------------------------------------
1 | //
2 | // RNPieChart.swift
3 | // PoliRank
4 | //
5 | // Created by Jose Padilla on 2/8/16.
6 | // Copyright © 2016 Facebook. All rights reserved.
7 | //
8 |
9 | import Charts
10 | import SwiftyJSON
11 |
12 | @objc(RNCandleStickChart)
13 | class RNCandleStickChart : CandleStickChartView {
14 |
15 | override init(frame: CGRect) {
16 | super.init(frame: frame);
17 | self.frame = frame;
18 | }
19 |
20 | required init?(coder aDecoder: NSCoder) {
21 | fatalError("init(coder:) has not been implemented");
22 | }
23 |
24 | func setConfig(_ config: String!) {
25 | setBarLineChartViewBaseProps(config);
26 |
27 | var labels: [String] = [];
28 |
29 | var json: JSON = nil;
30 | if let data = config.data(using: String.Encoding.utf8) {
31 | json = JSON(data: data);
32 | };
33 |
34 | if json["labels"].exists() {
35 | labels = json["labels"].arrayValue.map({$0.stringValue});
36 | }
37 |
38 | self.data = getCandleStickData(labels, json: json);
39 | }
40 | }
41 |
--------------------------------------------------------------------------------
/RNiOSCharts/RNCombinedChart.h:
--------------------------------------------------------------------------------
1 | //
2 | // RNLineChart.h
3 | // RCTIOSCharts
4 | //
5 | // Created by Jose Padilla on 12/29/15.
6 | // Copyright © 2015 Facebook. All rights reserved.
7 | //
8 |
9 | #import "RCTView.h"
10 |
11 | @interface RNCombinedChart : RCTView
12 |
13 | @property (nonatomic, assign) NSString *config;
14 |
15 | @end
16 |
--------------------------------------------------------------------------------
/RNiOSCharts/RNCombinedChart.m:
--------------------------------------------------------------------------------
1 | //
2 | // RNPieChart.m
3 | // PoliRank
4 | //
5 | // Created by Jose Padilla on 2/8/16.
6 | // Copyright © 2016 Facebook. All rights reserved.
7 | //
8 |
9 | #import "RNCombinedChart.h"
10 | #import "RCTViewManager.h"
11 |
12 | @interface RCT_EXTERN_MODULE(RNCombinedChartSwift, RCTViewManager)
13 |
14 | RCT_EXPORT_VIEW_PROPERTY(config, NSString);
15 |
16 | @end
--------------------------------------------------------------------------------
/RNiOSCharts/RNCombinedChart.swift:
--------------------------------------------------------------------------------
1 | //
2 | // RNPieChart.swift
3 | // PoliRank
4 | //
5 | // Created by Jose Padilla on 2/8/16.
6 | // Copyright © 2016 Facebook. All rights reserved.
7 | //
8 |
9 | import Charts
10 | import SwiftyJSON
11 |
12 | @objc(RNCombinedChart)
13 | class RNCombinedChart : CombinedChartView {
14 |
15 | override init(frame: CGRect) {
16 | super.init(frame: frame);
17 | self.frame = frame;
18 | }
19 |
20 | required init?(coder aDecoder: NSCoder) {
21 | fatalError("init(coder:) has not been implemented");
22 | }
23 |
24 | func setConfig(_ config: String!) {
25 | setBarLineChartViewBaseProps(config);
26 |
27 | var labels: [String] = [];
28 |
29 | var json: JSON = nil;
30 | if let data = config.data(using: String.Encoding.utf8) {
31 | json = JSON(data: data);
32 | };
33 |
34 | if json["labels"].exists() {
35 | labels = json["labels"].arrayValue.map({$0.stringValue});
36 | }
37 |
38 | let data = CombinedChartData(xVals: labels);
39 |
40 | if json["lineData"].exists() {
41 | data.lineData = getLineData(labels, json: json["lineData"]);
42 | }
43 |
44 | if json["barData"].exists() {
45 | data.barData = getBarData(labels, json: json["barData"]);
46 | }
47 |
48 | if json["bubbleData"].exists() {
49 | data.bubbleData = getBubbleData(labels, json: json["bubbleData"]);
50 | }
51 |
52 | if json["scatterData"].exists() {
53 | data.scatterData = getScatterData(labels, json: json["scatterData"]);
54 | }
55 |
56 | if json["candleData"].exists() {
57 | data.candleData = getCandleStickData(labels, json: json["candleData"]);
58 | }
59 |
60 | if json["drawHighlightArrowEnabled"].exists() {
61 | self.drawHighlightArrowEnabled = json["drawHighlightArrowEnabled"].boolValue;
62 | }
63 |
64 | if json["drawValueAboveBarEnabled"].exists() {
65 | self.drawValueAboveBarEnabled = json["drawValueAboveBarEnabled"].boolValue;
66 | }
67 |
68 | if json["drawBarShadowEnabled"].exists() {
69 | self.drawBarShadowEnabled = json["drawBarShadowEnabled"].boolValue;
70 | }
71 |
72 | if json["drawOrder"].exists() {
73 | self.drawOrder = json["drawOrder"].map({
74 | if (String(describing: $0) == "Bar") {
75 | return DrawOrder.bar.rawValue;
76 | }
77 | if (String(describing: $0) == "Bubble") {
78 | return DrawOrder.bubble.rawValue;
79 | }
80 | if (String(describing: $0) == "Line") {
81 | return DrawOrder.line.rawValue;
82 | }
83 | if (String(describing: $0) == "Candle") {
84 | return DrawOrder.candle.rawValue;
85 | }
86 | return DrawOrder.scatter.rawValue;
87 | });
88 | }
89 |
90 | self.data = data;
91 | }
92 | }
93 |
--------------------------------------------------------------------------------
/RNiOSCharts/RNCombinedChartManager.swift:
--------------------------------------------------------------------------------
1 | //
2 | // RNHorizontalBarChartManager.swift
3 | // RCTIOSCharts
4 | //
5 | // Created by Jose Padilla on 12/24/15.
6 | // Copyright © 2015 Facebook. All rights reserved.
7 | //
8 |
9 | import Foundation
10 |
11 | @objc(RNCombinedChartSwift)
12 | class RNCombinedChartManager : RCTViewManager {
13 | override func view() -> UIView! {
14 | return RNCombinedChart();
15 | }
16 | }
--------------------------------------------------------------------------------
/RNiOSCharts/RNHorizontalBarChart.h:
--------------------------------------------------------------------------------
1 | //
2 | // RNHorizontalBarChart.h
3 | // RCTIOSCharts
4 | //
5 | // Created by Jose Padilla on 12/29/15.
6 | // Copyright © 2015 Facebook. All rights reserved.
7 | //
8 |
9 | #import "RCTView.h"
10 |
11 | @interface RNHorizontalBarChart : RCTView
12 |
13 | @property (nonatomic, assign) NSString *config;
14 |
15 | @end
16 |
--------------------------------------------------------------------------------
/RNiOSCharts/RNHorizontalBarChart.m:
--------------------------------------------------------------------------------
1 | //
2 | // RNHorizontalBarChart.m
3 | //
4 | //
5 | // Created by Jose Padilla on 1/29/16.
6 | //
7 | //
8 |
9 | #import "RNBarChart.h"
10 | #import "RCTViewManager.h"
11 |
12 | @interface RCT_EXTERN_MODULE(RNHorizontalBarChartSwift, RCTViewManager)
13 |
14 | RCT_EXPORT_VIEW_PROPERTY(config, NSString);
15 |
16 | @end
--------------------------------------------------------------------------------
/RNiOSCharts/RNHorizontalBarChart.swift:
--------------------------------------------------------------------------------
1 | //
2 | // BarChart.swift
3 | // PoliRank
4 | //
5 | // Created by Jose Padilla on 2/6/16.
6 | // Copyright © 2016 Facebook. All rights reserved.
7 | //
8 |
9 | import Charts
10 | import SwiftyJSON
11 |
12 | @objc(RNHorizontalBarChart)
13 | class RNHorizontalBarChart : HorizontalBarChartView {
14 |
15 | override init(frame: CGRect) {
16 | super.init(frame: frame);
17 | self.frame = frame;
18 | }
19 |
20 | required init?(coder aDecoder: NSCoder) {
21 | fatalError("init(coder:) has not been implemented");
22 | }
23 |
24 | func setConfig(_ config: String!) {
25 | setBarLineChartViewBaseProps(config);
26 |
27 | var maximumDecimalPlaces: Int = 0;
28 | var minimumDecimalPlaces: Int = 0;
29 | var labels: [String] = [];
30 |
31 | var json: JSON = nil;
32 | if let data = config.data(using: String.Encoding.utf8) {
33 | json = JSON(data: data);
34 | };
35 |
36 | if json["labels"].exists() {
37 | labels = json["labels"].arrayValue.map({$0.stringValue});
38 | }
39 |
40 | if json["dataSets"].exists() {
41 | let dataSets = json["dataSets"].arrayObject;
42 |
43 | var sets: [BarChartDataSet] = [];
44 |
45 | for set in dataSets! {
46 | let tmp = JSON(set);
47 | if tmp["values"].exists() {
48 | let values = tmp["values"].arrayValue.map({$0.doubleValue});
49 | let label = tmp["label"].exists() ? tmp["label"].stringValue : "";
50 | var dataEntries: [BarChartDataEntry] = [];
51 |
52 | for i in 0.. UIView! {
14 | return RNHorizontalBarChart();
15 | }
16 | }
--------------------------------------------------------------------------------
/RNiOSCharts/RNLineChart.h:
--------------------------------------------------------------------------------
1 | //
2 | // RNLineChart.h
3 | // RCTIOSCharts
4 | //
5 | // Created by Jose Padilla on 12/29/15.
6 | // Copyright © 2015 Facebook. All rights reserved.
7 | //
8 |
9 | #import "RCTView.h"
10 |
11 | @interface RNLineChart : RCTView
12 |
13 | @property (nonatomic, assign) NSString *config;
14 |
15 | @end
16 |
--------------------------------------------------------------------------------
/RNiOSCharts/RNLineChart.m:
--------------------------------------------------------------------------------
1 | //
2 | // RNLineChart.m
3 | // RCTIOSCharts
4 | //
5 | // Created by Jose Padilla on 12/29/15.
6 | // Copyright © 2015 Facebook. All rights reserved.
7 | //
8 |
9 | #import "RNLineChart.h"
10 | #import "RCTViewManager.h"
11 |
12 | @interface RCT_EXTERN_MODULE(RNLineChartSwift, RCTViewManager)
13 |
14 | RCT_EXPORT_VIEW_PROPERTY(config, NSString);
15 | RCT_EXTERN_METHOD(setVisibleXRangeMaximum:(nonnull NSNumber *)reactTag value:(CGFloat *)v);
16 |
17 | @end
--------------------------------------------------------------------------------
/RNiOSCharts/RNLineChart.swift:
--------------------------------------------------------------------------------
1 | //
2 | // RNLineChart.swift
3 | // RCTIOSCharts
4 | //
5 | // Created by Jose Padilla on 12/29/15.
6 | // Copyright © 2015 Facebook. All rights reserved.
7 | //
8 |
9 | import Foundation
10 | import Charts
11 | import SwiftyJSON
12 |
13 |
14 | @objc(RNLineChart)
15 | class RNLineChart : LineChartView {
16 |
17 | override init(frame: CGRect) {
18 | super.init(frame: frame);
19 | self.frame = frame;
20 | }
21 |
22 | required init?(coder aDecoder: NSCoder) {
23 | fatalError("init(coder:) has not been implemented");
24 | }
25 |
26 | func setConfig(_ config: String!) {
27 | self.descriptionText = "";
28 |
29 | setBarLineChartViewBaseProps(config);
30 |
31 | var labels: [String] = [];
32 |
33 | var json: JSON = nil;
34 | if let data = config.data(using: String.Encoding.utf8) {
35 | json = JSON(data: data);
36 | };
37 |
38 | if json["labels"].exists() {
39 | labels = json["labels"].arrayValue.map({$0.stringValue});
40 | }
41 |
42 | self.data = getLineData(labels, json: json);
43 |
44 | if json["drawMarkers"].exists() {
45 | self.drawMarkers = json["drawMarkers"].boolValue;
46 | }
47 |
48 | if json["leftAxis"]["startAtZero"].exists() {
49 | self.leftAxis.startAtZeroEnabled = json["leftAxis"]["startAtZero"].boolValue;
50 | }
51 | }
52 | }
53 |
--------------------------------------------------------------------------------
/RNiOSCharts/RNLineChartManager.swift:
--------------------------------------------------------------------------------
1 | //
2 | // RNLineChartManager.swift
3 | // RCTIOSCharts
4 | //
5 | // Created by Jose Padilla on 12/29/15.
6 | // Copyright © 2015 Facebook. All rights reserved.
7 | //
8 |
9 | import Foundation
10 |
11 | @objc(RNLineChartSwift)
12 | class RNLineChartManager : RCTViewManager {
13 | override func view() -> UIView! {
14 | return RNLineChart();
15 | }
16 |
17 | @objc func setVisibleXRangeMaximum(_ reactTag: NSNumber, value: CGFloat) {
18 | self.bridge!.uiManager.addUIBlock { (uiManager: RCTUIManager?, viewRegistry:[NSNumber : UIView]?) in
19 | let view: RNLineChart = viewRegistry![reactTag] as! RNLineChart;
20 | view.setVisibleXRangeMaximum(value);
21 | }
22 | }
23 | }
24 |
--------------------------------------------------------------------------------
/RNiOSCharts/RNPieChart.h:
--------------------------------------------------------------------------------
1 | //
2 | // RNLineChart.h
3 | // RCTIOSCharts
4 | //
5 | // Created by Jose Padilla on 12/29/15.
6 | // Copyright © 2015 Facebook. All rights reserved.
7 | //
8 |
9 | #import "RCTView.h"
10 |
11 | @interface RNPieChart : RCTView
12 |
13 | @property (nonatomic, assign) NSString *config;
14 |
15 | @end
16 |
--------------------------------------------------------------------------------
/RNiOSCharts/RNPieChart.m:
--------------------------------------------------------------------------------
1 | //
2 | // RNPieChart.m
3 | // PoliRank
4 | //
5 | // Created by Jose Padilla on 2/8/16.
6 | // Copyright © 2016 Facebook. All rights reserved.
7 | //
8 |
9 | #import "RNPieChart.h"
10 | #import "RCTViewManager.h"
11 |
12 | @interface RCT_EXTERN_MODULE(RNPieChartSwift, RCTViewManager)
13 |
14 | RCT_EXPORT_VIEW_PROPERTY(config, NSString);
15 |
16 | @end
--------------------------------------------------------------------------------
/RNiOSCharts/RNPieChart.swift:
--------------------------------------------------------------------------------
1 | //
2 | // RNPieChart.swift
3 | // PoliRank
4 | //
5 | // Created by Jose Padilla on 2/8/16.
6 | // Copyright © 2016 Facebook. All rights reserved.
7 | //
8 |
9 | import Charts
10 | import SwiftyJSON
11 |
12 | @objc(RNPieChart)
13 | class RNPieChart : PieChartView {
14 |
15 | override init(frame: CGRect) {
16 | super.init(frame: frame);
17 | self.frame = frame;
18 | }
19 |
20 | required init?(coder aDecoder: NSCoder) {
21 | fatalError("init(coder:) has not been implemented");
22 | }
23 |
24 | func setConfig(_ config: String!) {
25 | setPieRadarChartViewBaseProps(config);
26 |
27 | var maximumDecimalPlaces: Int = 0;
28 | var minimumDecimalPlaces: Int = 0;
29 | var labels: [String] = [];
30 |
31 | var json: JSON = nil;
32 | if let data = config.data(using: String.Encoding.utf8) {
33 | json = JSON(data: data);
34 | };
35 |
36 | if json["holeColor"].exists() {
37 | self.holeColor = RCTConvert.uiColor(json["holeColor"].intValue);
38 | }
39 |
40 | if json["drawHoleEnabled"].exists() {
41 | self.drawHoleEnabled = json["drawHoleEnabled"].boolValue;
42 | }
43 |
44 | if json["centerText"].exists() {
45 | self.centerText = json["centerText"].stringValue;
46 | }
47 |
48 | if json["drawCenterTextEnabled"].exists() {
49 | self.drawCenterTextEnabled = json["drawCenterTextEnabled"].boolValue;
50 | }
51 |
52 | if json["holeRadiusPercent"].exists() {
53 | self.holeRadiusPercent = CGFloat(json["holeRadiusPercent"].floatValue);
54 | }
55 |
56 | if json["transparentCircleRadiusPercent"].exists() {
57 | self.transparentCircleRadiusPercent = CGFloat(json["transparentCircleRadiusPercent"].floatValue);
58 | }
59 |
60 | if json["drawSliceTextEnabled"].exists() {
61 | self.drawSliceTextEnabled = json["drawSliceTextEnabled"].boolValue;
62 | }
63 |
64 | if json["usePercentValuesEnabled"].exists() {
65 | self.usePercentValuesEnabled = json["usePercentValuesEnabled"].boolValue;
66 | }
67 |
68 | if json["centerTextRadiusPercent"].exists() {
69 | self.centerTextRadiusPercent = CGFloat(json["centerTextRadiusPercent"].floatValue);
70 | }
71 |
72 | if json["maxAngle"].exists() {
73 | self.maxAngle = CGFloat(json["maxAngle"].floatValue);
74 | }
75 |
76 | if json["labels"].exists() {
77 | labels = json["labels"].arrayValue.map({$0.stringValue});
78 | }
79 |
80 | if json["dataSets"].exists() {
81 | let dataSets = json["dataSets"].arrayObject;
82 |
83 | var sets: [PieChartDataSet] = [];
84 |
85 | for set in dataSets! {
86 | let tmp = JSON(set);
87 | if tmp["values"].exists() {
88 | let values = tmp["values"].arrayValue.map({$0.doubleValue});
89 | let label = tmp["label"].exists() ? tmp["label"].stringValue : "";
90 | var dataEntries: [ChartDataEntry] = [];
91 |
92 | for i in 0.. UIView! {
14 | return RNPieChart();
15 | }
16 | }
--------------------------------------------------------------------------------
/RNiOSCharts/RNRadarChart.h:
--------------------------------------------------------------------------------
1 | //
2 | // RNLineChart.h
3 | // RCTIOSCharts
4 | //
5 | // Created by Jose Padilla on 12/29/15.
6 | // Copyright © 2015 Facebook. All rights reserved.
7 | //
8 |
9 | #import "RCTView.h"
10 |
11 | @interface RNRadarChart : RCTView
12 |
13 | @property (nonatomic, assign) NSString *config;
14 |
15 | @end
16 |
--------------------------------------------------------------------------------
/RNiOSCharts/RNRadarChart.m:
--------------------------------------------------------------------------------
1 | //
2 | // RNPieChart.m
3 | // PoliRank
4 | //
5 | // Created by Jose Padilla on 2/8/16.
6 | // Copyright © 2016 Facebook. All rights reserved.
7 | //
8 |
9 | #import "RNRadarChart.h"
10 | #import "RCTViewManager.h"
11 |
12 | @interface RCT_EXTERN_MODULE(RNRadarChartSwift, RCTViewManager)
13 |
14 | RCT_EXPORT_VIEW_PROPERTY(config, NSString);
15 |
16 | @end
--------------------------------------------------------------------------------
/RNiOSCharts/RNRadarChart.swift:
--------------------------------------------------------------------------------
1 | //
2 | // RNPieChart.swift
3 | // PoliRank
4 | //
5 | // Created by Jose Padilla on 2/8/16.
6 | // Copyright © 2016 Facebook. All rights reserved.
7 | //
8 |
9 | import Charts
10 | import SwiftyJSON
11 |
12 | @objc(RNRadarChart)
13 | class RNRadarChart : RadarChartView {
14 |
15 | override init(frame: CGRect) {
16 | super.init(frame: frame);
17 | self.frame = frame;
18 | }
19 |
20 | required init?(coder aDecoder: NSCoder) {
21 | fatalError("init(coder:) has not been implemented");
22 | }
23 |
24 | func setConfig(_ config: String!) {
25 | setPieRadarChartViewBaseProps(config);
26 |
27 | var maximumDecimalPlaces: Int = 0;
28 | var minimumDecimalPlaces: Int = 0;
29 | var labels: [String] = [];
30 |
31 | var json: JSON = nil;
32 | if let data = config.data(using: String.Encoding.utf8) {
33 | json = JSON(data: data);
34 | };
35 |
36 | if json["labels"].exists() {
37 | labels = json["labels"].arrayValue.map({$0.stringValue});
38 | }
39 |
40 | if json["dataSets"].exists() {
41 | let dataSets = json["dataSets"].arrayObject;
42 |
43 | var sets: [RadarChartDataSet] = [];
44 |
45 | for set in dataSets! {
46 | let tmp = JSON(set);
47 | if tmp["values"].exists() {
48 | let values = tmp["values"].arrayValue.map({$0.doubleValue});
49 | let label = tmp["label"].exists() ? tmp["label"].stringValue : "";
50 | var dataEntries: [ChartDataEntry] = [];
51 |
52 | for i in 0.. UIView! {
14 | return RNRadarChart();
15 | }
16 | }
--------------------------------------------------------------------------------
/RNiOSCharts/RNScatterChart.h:
--------------------------------------------------------------------------------
1 | //
2 | // RNLineChart.h
3 | // RCTIOSCharts
4 | //
5 | // Created by Jose Padilla on 12/29/15.
6 | // Copyright © 2015 Facebook. All rights reserved.
7 | //
8 |
9 | #import "RCTView.h"
10 |
11 | @interface RNScatterChart : RCTView
12 |
13 | @property (nonatomic, assign) NSString *config;
14 |
15 | @end
16 |
--------------------------------------------------------------------------------
/RNiOSCharts/RNScatterChart.m:
--------------------------------------------------------------------------------
1 | //
2 | // RNPieChart.m
3 | // PoliRank
4 | //
5 | // Created by Jose Padilla on 2/8/16.
6 | // Copyright © 2016 Facebook. All rights reserved.
7 | //
8 |
9 | #import "RNScatterChart.h"
10 | #import "RCTViewManager.h"
11 |
12 | @interface RCT_EXTERN_MODULE(RNScatterChartSwift, RCTViewManager)
13 |
14 | RCT_EXPORT_VIEW_PROPERTY(config, NSString);
15 | RCT_EXTERN_METHOD(setVisibleXRangeMaximum:(nonnull NSNumber *)reactTag value:(CGFloat *)v);
16 |
17 | @end
--------------------------------------------------------------------------------
/RNiOSCharts/RNScatterChart.swift:
--------------------------------------------------------------------------------
1 | //
2 | // RNPieChart.swift
3 | // PoliRank
4 | //
5 | // Created by Jose Padilla on 2/8/16.
6 | // Copyright © 2016 Facebook. All rights reserved.
7 | //
8 |
9 | import Charts
10 | import SwiftyJSON
11 |
12 | @objc(RNScatterChart)
13 | class RNScatterChart : ScatterChartView {
14 |
15 | override init(frame: CGRect) {
16 | super.init(frame: frame);
17 | self.frame = frame;
18 | }
19 |
20 | required init?(coder aDecoder: NSCoder) {
21 | fatalError("init(coder:) has not been implemented");
22 | }
23 |
24 | func setConfig(_ config: String!) {
25 | setBarLineChartViewBaseProps(config);
26 |
27 | var labels: [String] = [];
28 |
29 | var json: JSON = nil;
30 | if let data = config.data(using: String.Encoding.utf8) {
31 | json = JSON(data: data);
32 | };
33 |
34 | if json["labels"].exists() {
35 | labels = json["labels"].arrayValue.map({$0.stringValue});
36 | }
37 |
38 | self.data = getScatterData(labels, json: json);
39 | }
40 | }
41 |
--------------------------------------------------------------------------------
/RNiOSCharts/RNScatterChartManager.swift:
--------------------------------------------------------------------------------
1 | //
2 | // RNHorizontalBarChartManager.swift
3 | // RCTIOSCharts
4 | //
5 | // Created by Jose Padilla on 12/24/15.
6 | // Copyright © 2015 Facebook. All rights reserved.
7 | //
8 |
9 | import Foundation
10 |
11 | @objc(RNScatterChartSwift)
12 | class RNScatterChartManager : RCTViewManager {
13 | override func view() -> UIView! {
14 | return RNScatterChart();
15 | }
16 |
17 | @objc func setVisibleXRangeMaximum(_ reactTag: NSNumber, value: CGFloat) {
18 | self.bridge!.uiManager.addUIBlock { (uiManager: RCTUIManager?, viewRegistry:[NSNumber : UIView]?) in
19 | let view: RNScatterChart = viewRegistry![reactTag] as! RNScatterChart;
20 | view.setVisibleXRangeMaximum(value);
21 | }
22 | }
23 | }
24 |
--------------------------------------------------------------------------------
/Readme.md:
--------------------------------------------------------------------------------
1 | # react-native-ios-charts
2 |
3 | # NOT MAINTAINED, LOOKING FOR NEW PROJECT OWNER
4 |
5 | **It's been a while since I've been able to spend some time on this repo and I prefer to transfer it to someone that can do a better job at maintaining it than I am doing right now. If you are interested, please let me know right away at jpadilla1293@gmail.com**
6 |
7 | **Take a look at [react-native-charts-wrapper](https://github.com/wuxudong/react-native-charts-wrapper) it's a library inspired by this one and by [react-native-mp-android-chart](https://github.com/mskec/react-native-mp-android-chart).**
8 |
9 | [](https://www.npmjs.com/package/react-native-ios-charts)
10 | [](https://www.npmjs.com/package/react-native-ios-charts)
11 |
12 | Bringing [iOS Charts](https://github.com/danielgindi/ios-charts) to React Native.
13 |
14 | 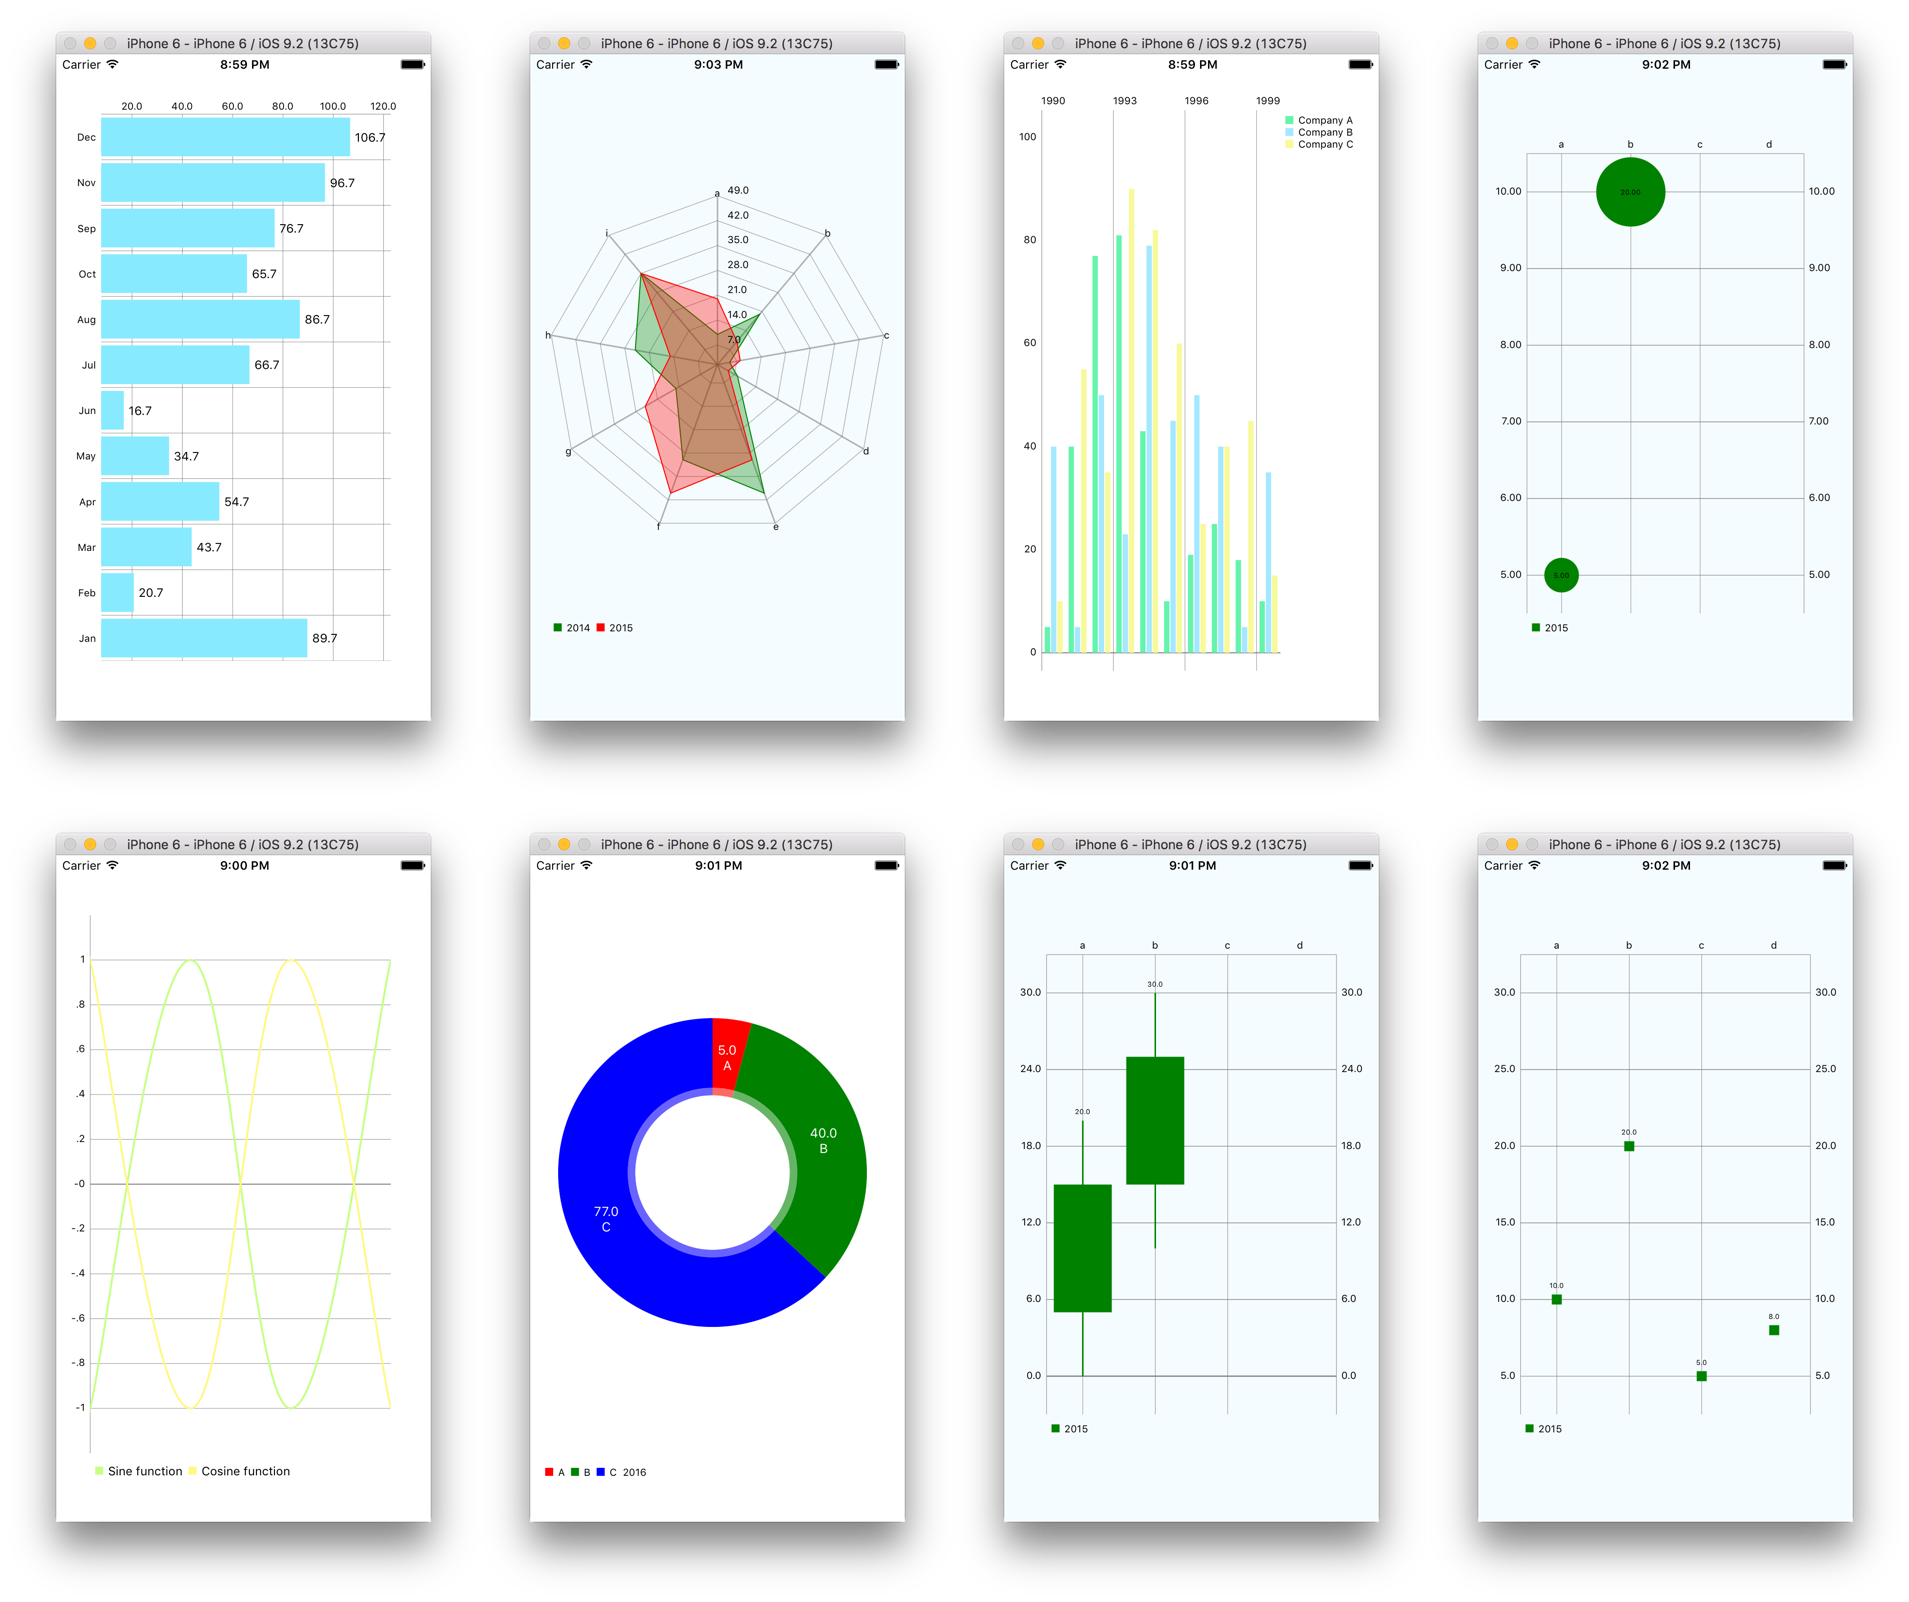
15 |
16 | Check out the ChartsExplorer in the examples folder
17 |
18 | 
19 |
20 | # Introduction
21 |
22 | The aim of this library is to provide reusable React Native components that can graph charts like Bar, Line, Scatter, Combined, Pie, Candle, Bubble from the awesome ios-charts library.
23 |
24 | # Installation
25 |
26 | **The minimum deployment target should be set to iOS 8.0 or greater**
27 |
28 | 1. Run `npm install --save react-native-ios-charts`
29 | 2. Add all the files under node_modules/react-native-ios-charts/RNiOSCharts. (In Xcode: File -> Add files to "App Name")
30 | 3. When you add the files XCode should prompt you to create a bridging header if you haven't done so already. Create it and import the `RCTViewManager.h`. It should look something like this.
31 |
32 | ```Objective-C
33 | #import "RCTBridge.h"
34 | #import "RCTViewManager.h"
35 | #import "RCTUIManager.h"
36 | #import "UIView+React.h"
37 | ```
38 | 3.5. You can use [CocoaPods](https://cocoapods.org) and skip steps 4-6. Just add a `Podfile` to your ios directory with the following content. Then run `pod install` and open the generated .xcworkspace from now on in xcode.
39 |
40 | ```
41 | use_frameworks!
42 |
43 | target 'MyApp' do
44 | pod 'SwiftyJSON', git: 'https://github.com/IBM-Swift/SwiftyJSON.git'
45 | pod 'Charts', git: 'https://github.com/danielgindi/Charts.git'
46 | end
47 |
48 | post_install do |installer|
49 | installer.pods_project.targets.each do |target|
50 | target.build_configurations.each do |config|
51 | config.build_settings['SWIFT_VERSION'] = '3.0'
52 | end
53 | end
54 | end
55 | ```
56 | 4. Install [SwiftyJSON](https://github.com/SwiftyJSON/SwiftyJSON) and [iOS Charts](https://github.com/danielgindi/ios-charts) libraries and add `SwiftyJSON.xcodeproj` and `Charts.xcodeproj` files to your project.
57 | 5. Under `Build Phases`, under `Link Binary With Libraries`, click the plus sign and add `SwiftyJSON.framework` and `Charts.framework`.
58 | 6. Add the `SwiftyJSON.framework` and `Charts.framework` to the `Embedded Binaries` section in your app.
59 | 7. In your project's build settings, go to build options and change the `Embedded Content Contains Swift Code` to `Yes`.
60 |
61 | # Usage
62 |
63 | Currently supported charts:
64 |
65 | - [Bar](https://gist.github.com/Jpadilla1/c833b91576152b4b9bb2)
66 | - [Horizontal Bar](https://gist.github.com/Jpadilla1/d3cb8d52b35ed825e87e)
67 | - [Line](https://gist.github.com/Jpadilla1/5c8f8067225fac40b370)
68 | - [Pie](https://gist.github.com/Jpadilla1/58f88276381b4f1ce31c)
69 | - [Candle Stick](https://gist.github.com/Jpadilla1/f64a4bb4cf8dfd3921d4)
70 | - [Bubble](https://gist.github.com/Jpadilla1/34e52658683feadbeaaa)
71 | - [Scatter](https://gist.github.com/Jpadilla1/abbc1e4378e5f6fd7eca)
72 | - [Radar](https://gist.github.com/Jpadilla1/b944cd86bdf46cb50977)
73 |
74 | Example code:
75 |
76 | ```JavaScript
77 | var { BarChart } = require('react-native-ios-charts');
78 |
79 | var MyComponent = React.createClass({
80 | render: function() {
81 | return (
82 |
83 |
98 |
99 | );
100 | }
101 | });
102 |
103 | var styles = StyleSheet.create({
104 | chart: {
105 | width: 200,
106 | height: 200
107 | }
108 | })
109 | ```
110 |
111 | # Roadmap
112 |
113 | - [X] Support for all charts
114 | - [X] Examples
115 | - [ ] Support for all chart properties
116 | - [ ] Documentation
117 |
118 | # License
119 | The MIT License (MIT)
120 |
121 | Copyright (c) 2016 Jose E. Padilla
122 |
123 | Permission is hereby granted, free of charge, to any person obtaining a copy
124 | of this software and associated documentation files (the "Software"), to deal
125 | in the Software without restriction, including without limitation the rights
126 | to use, copy, modify, merge, publish, distribute, sublicense, and/or sell
127 | copies of the Software, and to permit persons to whom the Software is
128 | furnished to do so, subject to the following conditions:
129 |
130 | The above copyright notice and this permission notice shall be included in all
131 | copies or substantial portions of the Software.
132 |
133 | THE SOFTWARE IS PROVIDED "AS IS", WITHOUT WARRANTY OF ANY KIND, EXPRESS OR
134 | IMPLIED, INCLUDING BUT NOT LIMITED TO THE WARRANTIES OF MERCHANTABILITY,
135 | FITNESS FOR A PARTICULAR PURPOSE AND NONINFRINGEMENT. IN NO EVENT SHALL THE
136 | AUTHORS OR COPYRIGHT HOLDERS BE LIABLE FOR ANY CLAIM, DAMAGES OR OTHER
137 | LIABILITY, WHETHER IN AN ACTION OF CONTRACT, TORT OR OTHERWISE, ARISING FROM,
138 | OUT OF OR IN CONNECTION WITH THE SOFTWARE OR THE USE OR OTHER DEALINGS IN THE
139 | SOFTWARE.
140 |
--------------------------------------------------------------------------------
/components/BarChart.js:
--------------------------------------------------------------------------------
1 | import React, { Component } from 'react';
2 | import {
3 | requireNativeComponent,
4 | NativeModules,
5 | findNodeHandle
6 | } from 'react-native';
7 |
8 | import {
9 | globalCommonProps,
10 | barLineCommonProps,
11 | commonDataSetProps
12 | } from '../utils/commonProps';
13 |
14 | import { processColors } from '../utils/commonColorProps';
15 | const RNBarChartManager = NativeModules.RNBarChartSwift;
16 | const RNBarChart = requireNativeComponent('RNBarChartSwift', BarChart);
17 |
18 | class BarChart extends Component {
19 | constructor(props) {
20 | super(props);
21 | this.setVisibleXRangeMaximum = this.setVisibleXRangeMaximum.bind(this);
22 | }
23 | setVisibleXRangeMaximum(value) {
24 | RNBarChartManager.setVisibleXRangeMaximum(findNodeHandle(this), value);
25 | }
26 | render() {
27 | let { config, ...otherProps } = this.props;
28 | config = JSON.stringify(processColors(config));
29 | return ;
30 | }
31 | }
32 |
33 | BarChart.propTypes = {
34 | config: React.PropTypes.shape({
35 | ...globalCommonProps,
36 | ...barLineCommonProps,
37 | dataSets: React.PropTypes.arrayOf(React.PropTypes.shape({
38 | ...commonDataSetProps,
39 | barShadowColor: React.PropTypes.string,
40 | barSpace: React.PropTypes.number,
41 | highlightAlpha: React.PropTypes.number,
42 | highlightColor: React.PropTypes.string,
43 | highlightLineDashLengths: React.PropTypes.arrayOf(React.PropTypes.number),
44 | highlightLineDashPhase: React.PropTypes.number,
45 | highlightLineWidth: React.PropTypes.number,
46 | stackLabels: React.PropTypes.arrayOf(React.PropTypes.string)
47 | })),
48 | drawValueAboveBar: React.PropTypes.bool,
49 | drawHighlightArrow: React.PropTypes.bool,
50 | drawBarShadow: React.PropTypes.bool
51 | })
52 | };
53 |
54 | export default BarChart;
55 |
--------------------------------------------------------------------------------
/components/BubbleChart.js:
--------------------------------------------------------------------------------
1 | import React, { Component } from 'react';
2 | import { requireNativeComponent } from 'react-native';
3 |
4 | import {
5 | globalCommonProps,
6 | barLineCommonProps,
7 | commonDataSetProps
8 | } from '../utils/commonProps';
9 |
10 | import { processColors } from '../utils/commonColorProps';
11 | const RNBubbleChart = requireNativeComponent('RNBubbleChartSwift', BubbleChart);
12 |
13 | class BubbleChart extends Component {
14 | render() {
15 | let { config, ...otherProps } = this.props;
16 | config = JSON.stringify(processColors(config));
17 | return ;
18 | }
19 | }
20 |
21 | BubbleChart.propTypes = {
22 | config: React.PropTypes.shape({
23 | ...globalCommonProps,
24 | ...barLineCommonProps,
25 | dataSets: React.PropTypes.arrayOf(React.PropTypes.shape({
26 | ...commonDataSetProps,
27 | values: React.PropTypes.arrayOf(React.PropTypes.shape({
28 | value: React.PropTypes.number,
29 | size: React.PropTypes.number
30 | })).isRequired,
31 | highlightCircleWidth: React.PropTypes.number
32 | }))
33 | })
34 | };
35 |
36 | export default BubbleChart;
37 |
--------------------------------------------------------------------------------
/components/CandleStickChart.js:
--------------------------------------------------------------------------------
1 | import React, { Component } from 'react';
2 | import {
3 | requireNativeComponent,
4 | NativeModules,
5 | findNodeHandle
6 | } from 'react-native';
7 |
8 | import {
9 | globalCommonProps,
10 | barLineCommonProps,
11 | commonDataSetProps
12 | } from '../utils/commonProps';
13 |
14 | import { processColors } from '../utils/commonColorProps';
15 | const RNCandleStickChartManager = NativeModules.RNCandleStickChartSwift;
16 | const RNCandleStickChart = requireNativeComponent('RNCandleStickChartSwift', CandleStickChart);
17 |
18 | class CandleStickChart extends Component {
19 | constructor(props) {
20 | super(props);
21 | this.setVisibleXRangeMaximum = this.setVisibleXRangeMaximum.bind(this);
22 | }
23 | setVisibleXRangeMaximum(value) {
24 | RNCandleStickChartManager.setVisibleXRangeMaximum(findNodeHandle(this), value);
25 | }
26 | render() {
27 | let { config, ...otherProps } = this.props;
28 | config = processColors(config);
29 | return ;
30 | }
31 | }
32 | CandleStickChart.propTypes = {
33 | config: React.PropTypes.shape({
34 | ...globalCommonProps,
35 | ...barLineCommonProps,
36 | dataSets: React.PropTypes.arrayOf(React.PropTypes.shape({
37 | ...commonDataSetProps,
38 | values: React.PropTypes.arrayOf(React.PropTypes.shape({
39 | shadowH: React.PropTypes.number.isRequired,
40 | shadowL: React.PropTypes.number.isRequired,
41 | open: React.PropTypes.number.isRequired,
42 | close: React.PropTypes.number.isRequired
43 | })).isRequired,
44 | barSpace: React.PropTypes.number,
45 | showCandleBar: React.PropTypes.bool,
46 | shadowWidth: React.PropTypes.number,
47 | shadowColor: React.PropTypes.string,
48 | shadowColorSameAsCandle: React.PropTypes.bool,
49 | neutralColor: React.PropTypes.string,
50 | increasingColor: React.PropTypes.string,
51 | decreasingColor: React.PropTypes.string,
52 | increasingFilled: React.PropTypes.bool,
53 | decreasingFilled: React.PropTypes.bool
54 | }))
55 | })
56 | };
57 |
58 | export default CandleStickChart;
59 |
--------------------------------------------------------------------------------
/components/CombinedChart.js:
--------------------------------------------------------------------------------
1 | import React, { Component } from 'react';
2 | import { requireNativeComponent } from 'react-native';
3 |
4 | import {
5 | globalCommonProps,
6 | barLineCommonProps,
7 | commonDataSetProps
8 | } from '../utils/commonProps';
9 |
10 | import { processColors } from '../utils/commonColorProps';
11 | const RNCombinedChart = requireNativeComponent('RNCombinedChartSwift', CombinedChart);
12 |
13 | class CombinedChart extends Component {
14 | render() {
15 | let { config, ...otherProps } = this.props;
16 | config = JSON.stringify(processColors(config));
17 | return ;
18 | }
19 | }
20 |
21 | CombinedChart.propTypes = {
22 | config: React.PropTypes.shape({
23 | ...globalCommonProps,
24 | ...barLineCommonProps,
25 | lineData: React.PropTypes.shape({
26 | dataSets: React.PropTypes.arrayOf(React.PropTypes.shape({
27 | ...commonDataSetProps,
28 | drawCircles: React.PropTypes.bool,
29 | circleColors: React.PropTypes.arrayOf(React.PropTypes.string),
30 | circleHoleColor: React.PropTypes.string,
31 | circleRadius: React.PropTypes.number,
32 | cubicIntensity: React.PropTypes.number,
33 | drawCircleHole: React.PropTypes.bool,
34 | drawCubic: React.PropTypes.bool,
35 | drawFilled: React.PropTypes.bool,
36 | drawHorizontalHighlightIndicator: React.PropTypes.bool,
37 | drawVerticalHighlightIndicator: React.PropTypes.bool,
38 | fillAlpha: React.PropTypes.number,
39 | fillColor: React.PropTypes.string,
40 | highlightColor: React.PropTypes.string,
41 | highlightLineDashLengths: React.PropTypes.number,
42 | highlightLineDashPhase: React.PropTypes.number,
43 | highlightLineWidth: React.PropTypes.number,
44 | lineDashLengths: React.PropTypes.number,
45 | lineDashPhase: React.PropTypes.number,
46 | lineWidth: React.PropTypes.number
47 | }))
48 | }),
49 | barData: React.PropTypes.shape({
50 | dataSets: React.PropTypes.arrayOf(React.PropTypes.shape({
51 | ...commonDataSetProps,
52 | barShadowColor: React.PropTypes.string,
53 | barSpace: React.PropTypes.number,
54 | highlightAlpha: React.PropTypes.number,
55 | highlightColor: React.PropTypes.string,
56 | highlightLineDashLengths: React.PropTypes.arrayOf(React.PropTypes.number),
57 | highlightLineDashPhase: React.PropTypes.number,
58 | highlightLineWidth: React.PropTypes.number,
59 | stackLabels: React.PropTypes.arrayOf(React.PropTypes.string)
60 | }))
61 | }),
62 | bubbleData: React.PropTypes.shape({
63 | dataSets: React.PropTypes.arrayOf(React.PropTypes.shape({
64 | ...commonDataSetProps,
65 | values: React.PropTypes.arrayOf(React.PropTypes.shape({
66 | value: React.PropTypes.number,
67 | size: React.PropTypes.number
68 | })).isRequired,
69 | highlightCircleWidth: React.PropTypes.number
70 | }))
71 | }),
72 | candleData: React.PropTypes.shape({
73 | dataSets: React.PropTypes.arrayOf(React.PropTypes.shape({
74 | ...commonDataSetProps,
75 | values: React.PropTypes.arrayOf(React.PropTypes.shape({
76 | shadowH: React.PropTypes.number.isRequired,
77 | shadowL: React.PropTypes.number.isRequired,
78 | open: React.PropTypes.number.isRequired,
79 | close: React.PropTypes.number.isRequired
80 | })).isRequired,
81 | barSpace: React.PropTypes.number,
82 | showCandleBar: React.PropTypes.bool,
83 | shadowWidth: React.PropTypes.number,
84 | shadowColor: React.PropTypes.string,
85 | shadowColorSameAsCandle: React.PropTypes.bool,
86 | neutralColor: React.PropTypes.string,
87 | increasingColor: React.PropTypes.string,
88 | decreasingColor: React.PropTypes.string,
89 | increasingFilled: React.PropTypes.bool,
90 | decreasingFilled: React.PropTypes.bool
91 | }))
92 | }),
93 | scatterData: React.PropTypes.shape({
94 | dataSets: React.PropTypes.arrayOf(React.PropTypes.shape({
95 | ...commonDataSetProps,
96 | scatterShapeSize: React.PropTypes.number,
97 | scatterShapeHoleRadius: React.PropTypes.number,
98 | scatterShapeHoleColor: React.PropTypes.string,
99 | scatterShape: React.PropTypes.oneOf([
100 | 'Square',
101 | 'Circle',
102 | 'Triangle',
103 | 'Cross',
104 | 'X'
105 | ])
106 | }))
107 | }),
108 | drawValueAboveBar: React.PropTypes.bool,
109 | drawHighlightArrow: React.PropTypes.bool,
110 | drawBarShadow: React.PropTypes.bool,
111 | })
112 | };
113 |
114 | export default CombinedChart;
115 |
--------------------------------------------------------------------------------
/components/HorizontalBarChart.js:
--------------------------------------------------------------------------------
1 | import React, { Component } from 'react';
2 | import {
3 | requireNativeComponent
4 | } from 'react-native';
5 |
6 | import {
7 | globalCommonProps,
8 | barLineCommonProps,
9 | commonDataSetProps
10 | } from '../utils/commonProps';
11 |
12 | import { processColors } from '../utils/commonColorProps';
13 | const RNHorizontalBarChart = requireNativeComponent('RNHorizontalBarChartSwift', HorizontalBarChart);
14 |
15 | class HorizontalBarChart extends Component {
16 | render() {
17 | let { config, ...otherProps } = this.props;
18 | config = JSON.stringify(processColors(config));
19 | return ;
20 | }
21 | }
22 |
23 | HorizontalBarChart.propTypes = {
24 | config: React.PropTypes.shape({
25 | ...globalCommonProps,
26 | ...barLineCommonProps,
27 | dataSets: React.PropTypes.arrayOf(React.PropTypes.shape({
28 | ...commonDataSetProps,
29 | barShadowColor: React.PropTypes.string,
30 | barSpace: React.PropTypes.number,
31 | highlightAlpha: React.PropTypes.number,
32 | highlightColor: React.PropTypes.string,
33 | highlightLineDashLengths: React.PropTypes.arrayOf(React.PropTypes.number),
34 | highlightLineDashPhase: React.PropTypes.number,
35 | highlightLineWidth: React.PropTypes.number,
36 | stackLabels: React.PropTypes.arrayOf(React.PropTypes.string)
37 | })),
38 | drawValueAboveBar: React.PropTypes.bool,
39 | drawHighlightArrow: React.PropTypes.bool,
40 | drawBarShadow: React.PropTypes.bool
41 | })
42 | };
43 |
44 | export default HorizontalBarChart;
45 |
--------------------------------------------------------------------------------
/components/LineChart.js:
--------------------------------------------------------------------------------
1 | import React, { Component } from 'react';
2 | import {
3 | requireNativeComponent,
4 | NativeModules,
5 | findNodeHandle
6 | } from 'react-native';
7 |
8 | import {
9 | globalCommonProps,
10 | barLineCommonProps,
11 | commonDataSetProps
12 | } from '../utils/commonProps';
13 |
14 | import { processColors } from '../utils/commonColorProps';
15 | const RNLineChartManager = NativeModules.RNLineChartSwift;
16 | const RNLineChart = requireNativeComponent('RNLineChartSwift', LineChart);
17 |
18 | class LineChart extends Component {
19 | constructor(props) {
20 | super(props);
21 | this.setVisibleXRangeMaximum = this.setVisibleXRangeMaximum.bind(this);
22 | }
23 | setVisibleXRangeMaximum(value) {
24 | RNLineChartManager.setVisibleXRangeMaximum(findNodeHandle(this), value);
25 | }
26 | render() {
27 | let { config, ...otherProps } = this.props;
28 | config = JSON.stringify(processColors(config));
29 | return ;
30 | }
31 | }
32 |
33 | LineChart.propTypes = {
34 | config: React.PropTypes.shape({
35 | ...globalCommonProps,
36 | ...barLineCommonProps,
37 | dataSets: React.PropTypes.arrayOf(React.PropTypes.shape({
38 | ...commonDataSetProps,
39 | drawCircles: React.PropTypes.bool,
40 | circleColors: React.PropTypes.arrayOf(React.PropTypes.string),
41 | circleHoleColor: React.PropTypes.string,
42 | circleRadius: React.PropTypes.number,
43 | cubicIntensity: React.PropTypes.number,
44 | drawCircleHole: React.PropTypes.bool,
45 | drawCubic: React.PropTypes.bool,
46 | drawFilled: React.PropTypes.bool,
47 | drawHorizontalHighlightIndicator: React.PropTypes.bool,
48 | drawVerticalHighlightIndicator: React.PropTypes.bool,
49 | fillAlpha: React.PropTypes.number,
50 | fillColor: React.PropTypes.string,
51 | highlightColor: React.PropTypes.string,
52 | highlightLineDashLengths: React.PropTypes.number,
53 | highlightLineDashPhase: React.PropTypes.number,
54 | highlightLineWidth: React.PropTypes.number,
55 | lineDashLengths: React.PropTypes.number,
56 | lineDashPhase: React.PropTypes.number,
57 | lineWidth: React.PropTypes.number
58 | }))
59 | })
60 | };
61 |
62 | export default LineChart;
63 |
--------------------------------------------------------------------------------
/components/PieChart.js:
--------------------------------------------------------------------------------
1 | import React, { Component } from 'react';
2 | import {
3 | requireNativeComponent
4 | } from 'react-native';
5 |
6 | import {
7 | globalCommonProps,
8 | pieRadarCommonProps,
9 | commonDataSetProps
10 | } from '../utils/commonProps';
11 |
12 | import { processColors } from '../utils/commonColorProps';
13 | const RNPieChart = requireNativeComponent('RNPieChartSwift', PieChart);
14 |
15 |
16 | class PieChart extends Component {
17 | render() {
18 | let { config, ...otherProps } = this.props;
19 | config = JSON.stringify(processColors(config));
20 | return ;
21 | }
22 | }
23 |
24 | PieChart.propTypes = {
25 | config: React.PropTypes.shape({
26 | ...globalCommonProps,
27 | ...pieRadarCommonProps,
28 | dataSets: React.PropTypes.arrayOf(React.PropTypes.shape({
29 | ...commonDataSetProps,
30 | sliceSpace: React.PropTypes.number,
31 | selectionShift: React.PropTypes.number
32 | })),
33 | labels: React.PropTypes.arrayOf(React.PropTypes.string),
34 | holeColor: React.PropTypes.string,
35 | holeTransparent: React.PropTypes.bool,
36 | holeAlpha: React.PropTypes.number,
37 | drawHoleEnabled: React.PropTypes.bool,
38 | centerText: React.PropTypes.string,
39 | drawCenterTextEnabled: React.PropTypes.bool,
40 | holeRadiusPercent: React.PropTypes.number,
41 | transparentCircleRadiusPercent: React.PropTypes.number,
42 | drawSliceTextEnabled: React.PropTypes.bool,
43 | usePercentValuesEnabled: React.PropTypes.bool,
44 | centerTextRadiusPercent: React.PropTypes.number,
45 | maxAngle: React.PropTypes.number
46 | })
47 | };
48 |
49 | export default PieChart;
50 |
--------------------------------------------------------------------------------
/components/RadarChart.js:
--------------------------------------------------------------------------------
1 | import React, { Component } from 'react';
2 | import {
3 | requireNativeComponent
4 | } from 'react-native';
5 |
6 | import {
7 | globalCommonProps,
8 | pieRadarCommonProps,
9 | commonDataSetProps
10 | } from '../utils/commonProps';
11 |
12 | import { processColors } from '../utils/commonColorProps';
13 | const RNRadarChart = requireNativeComponent('RNRadarChartSwift', RadarChart);
14 |
15 | class RadarChart extends Component {
16 | render() {
17 | let { config, ...otherProps } = this.props;
18 | config = JSON.stringify(processColors(config));
19 | return ;
20 | }
21 | }
22 |
23 | RadarChart.propTypes = {
24 | config: React.PropTypes.shape({
25 | ...globalCommonProps,
26 | ...pieRadarCommonProps,
27 | dataSets: React.PropTypes.arrayOf(React.PropTypes.shape({
28 | ...commonDataSetProps,
29 | fillColor: React.PropTypes.string,
30 | fillAlpha: React.PropTypes.number,
31 | lineWidth: React.PropTypes.number,
32 | drawFilledEnabled: React.PropTypes.bool
33 | })),
34 | webLineWidth: React.PropTypes.number,
35 | innerWebLineWidth: React.PropTypes.number,
36 | webColor: React.PropTypes.string,
37 | innerWebColor: React.PropTypes.string,
38 | webAlpha: React.PropTypes.number,
39 | drawWeb: React.PropTypes.bool,
40 | skipWebLineCount: React.PropTypes.number
41 | })
42 | };
43 |
44 | export default RadarChart;
45 |
--------------------------------------------------------------------------------
/components/ScatterChart.js:
--------------------------------------------------------------------------------
1 | import React, { Component } from 'react';
2 | import {
3 | requireNativeComponent,
4 | NativeModules,
5 | findNodeHandle
6 | } from 'react-native';
7 |
8 | import {
9 | globalCommonProps,
10 | barLineCommonProps,
11 | commonDataSetProps
12 | } from '../utils/commonProps';
13 |
14 | import { processColors } from '../utils/commonColorProps';
15 | const RNScatterChartManager = NativeModules.RNScatterChartSwift;
16 | const RNScatterChart = requireNativeComponent('RNScatterChartSwift', ScatterChart);
17 |
18 | class ScatterChart extends Component {
19 | constructor(props) {
20 | super(props);
21 | this.setVisibleXRangeMaximum = this.setVisibleXRangeMaximum.bind(this);
22 | }
23 | setVisibleXRangeMaximum(value) {
24 | RNScatterChartManager.setVisibleXRangeMaximum(findNodeHandle(this), value);
25 | }
26 | render() {
27 | let { config, ...otherProps } = this.props;
28 | config = JSON.stringify(processColors(config));
29 | return ;
30 | }
31 | }
32 |
33 | ScatterChart.propTypes = {
34 | config: React.PropTypes.shape({
35 | ...globalCommonProps,
36 | ...barLineCommonProps,
37 | dataSets: React.PropTypes.arrayOf(React.PropTypes.shape({
38 | ...commonDataSetProps,
39 | scatterShapeSize: React.PropTypes.number,
40 | scatterShapeHoleRadius: React.PropTypes.number,
41 | scatterShapeHoleColor: React.PropTypes.string,
42 | scatterShape: React.PropTypes.oneOf([
43 | 'Square',
44 | 'Circle',
45 | 'Triangle',
46 | 'Cross',
47 | 'X'
48 | ])
49 | }))
50 | })
51 | };
52 |
53 | export default ScatterChart;
54 |
--------------------------------------------------------------------------------
/examples/ChartsExplorer/.flowconfig:
--------------------------------------------------------------------------------
1 | [ignore]
2 |
3 | # We fork some components by platform.
4 | .*/*.web.js
5 | .*/*.android.js
6 |
7 | # Some modules have their own node_modules with overlap
8 | .*/node_modules/node-haste/.*
9 |
10 | # Ugh
11 | .*/node_modules/babel.*
12 | .*/node_modules/babylon.*
13 | .*/node_modules/invariant.*
14 |
15 | # Ignore react and fbjs where there are overlaps, but don't ignore
16 | # anything that react-native relies on
17 | .*/node_modules/fbjs/lib/Map.js
18 | .*/node_modules/fbjs/lib/ErrorUtils.js
19 |
20 | # Flow has a built-in definition for the 'react' module which we prefer to use
21 | # over the currently-untyped source
22 | .*/node_modules/react/react.js
23 | .*/node_modules/react/lib/React.js
24 | .*/node_modules/react/lib/ReactDOM.js
25 |
26 | .*/__mocks__/.*
27 | .*/__tests__/.*
28 |
29 | .*/commoner/test/source/widget/share.js
30 |
31 | # Ignore commoner tests
32 | .*/node_modules/commoner/test/.*
33 |
34 | # See https://github.com/facebook/flow/issues/442
35 | .*/react-tools/node_modules/commoner/lib/reader.js
36 |
37 | # Ignore jest
38 | .*/node_modules/jest-cli/.*
39 |
40 | # Ignore Website
41 | .*/website/.*
42 |
43 | # Ignore generators
44 | .*/local-cli/generator.*
45 |
46 | # Ignore BUCK generated folders
47 | .*\.buckd/
48 |
49 | .*/node_modules/is-my-json-valid/test/.*\.json
50 | .*/node_modules/iconv-lite/encodings/tables/.*\.json
51 | .*/node_modules/y18n/test/.*\.json
52 | .*/node_modules/spdx-license-ids/spdx-license-ids.json
53 | .*/node_modules/spdx-exceptions/index.json
54 | .*/node_modules/resolve/test/subdirs/node_modules/a/b/c/x.json
55 | .*/node_modules/resolve/lib/core.json
56 | .*/node_modules/jsonparse/samplejson/.*\.json
57 | .*/node_modules/json5/test/.*\.json
58 | .*/node_modules/ua-parser-js/test/.*\.json
59 | .*/node_modules/builtin-modules/builtin-modules.json
60 | .*/node_modules/binary-extensions/binary-extensions.json
61 | .*/node_modules/url-regex/tlds.json
62 | .*/node_modules/joi/.*\.json
63 | .*/node_modules/isemail/.*\.json
64 | .*/node_modules/tr46/.*\.json
65 |
66 |
67 | [include]
68 |
69 | [libs]
70 | node_modules/react-native/Libraries/react-native/react-native-interface.js
71 | node_modules/react-native/flow
72 | flow/
73 |
74 | [options]
75 | module.system=haste
76 |
77 | esproposal.class_static_fields=enable
78 | esproposal.class_instance_fields=enable
79 |
80 | munge_underscores=true
81 |
82 | module.name_mapper='^image![a-zA-Z0-9$_-]+$' -> 'GlobalImageStub'
83 | module.name_mapper='^[./a-zA-Z0-9$_-]+\.\(bmp\|gif\|jpg\|jpeg\|png\|psd\|svg\|webp\|m4v\|mov\|mp4\|mpeg\|mpg\|webm\|aac\|aiff\|caf\|m4a\|mp3\|wav\|html\|pdf\)$' -> 'RelativeImageStub'
84 |
85 | suppress_type=$FlowIssue
86 | suppress_type=$FlowFixMe
87 | suppress_type=$FixMe
88 |
89 | suppress_comment=\\(.\\|\n\\)*\\$FlowFixMe\\($\\|[^(]\\|(\\(>=0\\.\\(2[0-4]\\|1[0-9]\\|[0-9]\\).[0-9]\\)? *\\(site=[a-z,_]*react_native[a-z,_]*\\)?)\\)
90 | suppress_comment=\\(.\\|\n\\)*\\$FlowIssue\\((\\(>=0\\.\\(2[0-4]\\|1[0-9]\\|[0-9]\\).[0-9]\\)? *\\(site=[a-z,_]*react_native[a-z,_]*\\)?)\\)?:? #[0-9]+
91 | suppress_comment=\\(.\\|\n\\)*\\$FlowFixedInNextDeploy
92 |
93 | [version]
94 | 0.24.0
95 |
--------------------------------------------------------------------------------
/examples/ChartsExplorer/.gitignore:
--------------------------------------------------------------------------------
1 | # OSX
2 | #
3 | .DS_Store
4 |
5 | # Xcode
6 | #
7 | build/
8 | *.pbxuser
9 | !default.pbxuser
10 | *.mode1v3
11 | !default.mode1v3
12 | *.mode2v3
13 | !default.mode2v3
14 | *.perspectivev3
15 | !default.perspectivev3
16 | xcuserdata
17 | *.xccheckout
18 | *.moved-aside
19 | DerivedData
20 | *.hmap
21 | *.ipa
22 | *.xcuserstate
23 | project.xcworkspace
24 |
25 | # Android/IJ
26 | #
27 | .idea
28 | .gradle
29 | local.properties
30 |
31 | # node.js
32 | #
33 | node_modules/
34 | npm-debug.log
35 |
36 | # BUCK
37 | buck-out/
38 | \.buckd/
39 | android/app/libs
40 | android/keystores/debug.keystore
41 |
--------------------------------------------------------------------------------
/examples/ChartsExplorer/.watchmanconfig:
--------------------------------------------------------------------------------
1 | {}
--------------------------------------------------------------------------------
/examples/ChartsExplorer/components/Bar.js:
--------------------------------------------------------------------------------
1 | import React, { Component } from 'react';
2 | import { StyleSheet } from 'react-native';
3 |
4 | import { BarChart } from 'react-native-ios-charts';
5 |
6 | const styles = StyleSheet.create({
7 | container: {
8 | flex: 1,
9 | justifyContent: 'center',
10 | alignItems: 'stretch',
11 | backgroundColor: 'transparent'
12 | }
13 | });
14 |
15 | export default class Bar extends Component {
16 | static displayName = 'Bar';
17 | componentDidMount() {
18 | this.refs.chart.setVisibleXRangeMaximum(2);
19 | }
20 | render() {
21 | const config = {
22 | dataSets: [{
23 | values: [5, 40, 77, 81, 43],
24 | drawValues: false,
25 | colors: ['rgb(107, 243, 174)'],
26 | label: 'Company A'
27 | }, {
28 | values: [40, 5, 50, 23, 79],
29 | drawValues: false,
30 | colors: ['rgb(166, 232, 255)'],
31 | label: 'Company B'
32 | }, {
33 | values: [10, 55, 35, 90, 82],
34 | drawValues: false,
35 | colors: ['rgb(248, 248, 157)'],
36 | label: 'Company C'
37 | }],
38 | labels: ['1990', '1991', '1992', '1993', '1994'],
39 | legend: {
40 | },
41 | xAxis: {
42 | position: 'bottom'
43 | },
44 | leftAxis: {
45 | drawGridLines: false,
46 | spaceBottom: 0.05
47 | },
48 | rightAxis: {
49 | drawGridLines: false,
50 | spaceBottom: 0.05
51 | },
52 | valueFormatter: {
53 | type: 'regular',
54 | maximumDecimalPlaces: 0
55 | },
56 | viewport: {
57 | left: 20,
58 | top: 0,
59 | right: 20,
60 | bottom: 50
61 | }
62 | };
63 | return (
64 |
65 | );
66 | }
67 | }
68 |
--------------------------------------------------------------------------------
/examples/ChartsExplorer/components/Bubble.js:
--------------------------------------------------------------------------------
1 | import React, { Component } from 'react';
2 | import { StyleSheet } from 'react-native';
3 |
4 | import { BubbleChart } from 'react-native-ios-charts';
5 |
6 | const styles = StyleSheet.create({
7 | container: {
8 | flex: 1,
9 | justifyContent: 'center',
10 | alignItems: 'stretch',
11 | backgroundColor: 'transparent'
12 | }
13 | });
14 |
15 | export default class Bubble extends Component {
16 | static displayName = 'Bubble';
17 |
18 | render() {
19 | const config = {
20 | dataSets: [{
21 | values: [{
22 | size: 23.4,
23 | value: 8
24 | }, {
25 | size: 17.4,
26 | value: 5
27 | }, {
28 | size: 6.0,
29 | value: 2
30 | }, {
31 | size: 52.0,
32 | value: 12
33 | }, {
34 | size: 40.1,
35 | value: 10
36 | }],
37 | colors: ['rgba(241, 152, 174, 0.7)'],
38 | label: 'Company A'
39 | }],
40 | labels: ['1990', '1991', '1992', '1993', '1994'],
41 | legend: {
42 | showLegend: false
43 | },
44 | xAxis: {
45 | position: 'bottom'
46 | },
47 | leftAxis: {
48 | spaceBottom: 0.05
49 | },
50 | rightAxis: {
51 | spaceBottom: 0.05
52 | }
53 | };
54 | return (
55 |
56 | );
57 | }
58 | }
59 |
--------------------------------------------------------------------------------
/examples/ChartsExplorer/components/CandleStick.js:
--------------------------------------------------------------------------------
1 | import React, { Component } from 'react';
2 | import { StyleSheet } from 'react-native';
3 |
4 | import { CandleStickChart } from 'react-native-ios-charts';
5 |
6 |
7 | const styles = StyleSheet.create({
8 | container: {
9 | flex: 1,
10 | justifyContent: 'center',
11 | alignItems: 'stretch',
12 | backgroundColor: 'transparent'
13 | }
14 | });
15 |
16 | export default class CandleStick extends Component {
17 | static displayName = 'CandleStick';
18 |
19 | render() {
20 | const config = {
21 | dataSets: [{
22 | values: [{
23 | shadowH: 20,
24 | shadowL: 0,
25 | open: 15,
26 | close: 5
27 | }, {
28 | shadowH: 30,
29 | shadowL: 10,
30 | open: 25,
31 | close: 15
32 | }, {
33 | shadowH: 10,
34 | shadowL: 5,
35 | open: 15,
36 | close: 10
37 | }, {
38 | shadowH: 50,
39 | shadowL: 30,
40 | open: 25,
41 | close: 15
42 | }],
43 | drawValues: false,
44 | colors: ['red'],
45 | label: 'Company A'
46 | }],
47 | labels: ['1990', '1991', '1992', '1993', '1994'],
48 | legend: {
49 | },
50 | xAxis: {
51 | position: 'bottom'
52 | },
53 | leftAxis: {
54 | drawGridLines: false,
55 | spaceBottom: 0
56 | },
57 | rightAxis: {
58 | drawGridLines: false,
59 | spaceBottom: 0
60 | },
61 | valueFormatter: {
62 | type: 'regular',
63 | maximumDecimalPlaces: 0
64 | }
65 | };
66 | return (
67 |
68 | );
69 | }
70 | }
71 |
--------------------------------------------------------------------------------
/examples/ChartsExplorer/components/Combined.js:
--------------------------------------------------------------------------------
1 | import React, { Component } from 'react';
2 | import { StyleSheet } from 'react-native';
3 |
4 | import { CombinedChart } from 'react-native-ios-charts';
5 |
6 | const styles = StyleSheet.create({
7 | container: {
8 | flex: 1,
9 | justifyContent: 'center',
10 | alignItems: 'stretch',
11 | backgroundColor: 'transparent'
12 | }
13 | });
14 |
15 | export default class Combined extends Component {
16 | static displayName = 'Combined';
17 |
18 | render() {
19 | const config = {
20 | barData: {
21 | dataSets: [{
22 | values: [40, 5, 50, 23, 79],
23 | drawValues: false,
24 | colors: ['rgb(166, 232, 255)'],
25 | label: 'Company B',
26 | axisDependency: 'right'
27 | }]
28 | },
29 | lineData: {
30 | dataSets: [{
31 | values: [5, 10, 5, 10, 5],
32 | drawValues: false,
33 | colors: ['red'],
34 | label: 'Sine function',
35 | drawCubic: true,
36 | drawCircles: false,
37 | lineWidth: 2,
38 | axisDependency: 'right'
39 | }, {
40 | values: [10, 5, 10, 5, 10],
41 | drawValues: false,
42 | colors: ['blue'],
43 | label: 'Cosine function',
44 | drawCubic: true,
45 | drawCircles: false,
46 | lineWidth: 2,
47 | axisDependency: 'right'
48 | }],
49 | },
50 | bubbleData: {
51 | dataSets: [{
52 | values: [{
53 | size: 23.4,
54 | value: 10080
55 | }, {
56 | size: 17.4,
57 | value: 10050
58 | }, {
59 | size: 6.0,
60 | value: 1060
61 | }, {
62 | size: 52.0,
63 | value: 7100
64 | }, {
65 | size: 40.1,
66 | value: 6005
67 | }],
68 | colors: ['rgba(241, 152, 174, 0.7)'],
69 | label: 'Company A',
70 | axisDependency: 'left',
71 | }],
72 | },
73 | candleData: {
74 | dataSets: [{
75 | values: [{
76 | shadowH: 20,
77 | shadowL: 5,
78 | open: 15,
79 | close: 10
80 | }, {
81 | shadowH: 30,
82 | shadowL: 10,
83 | open: 25,
84 | close: 15
85 | }, {
86 | shadowH: 10,
87 | shadowL: 5,
88 | open: 15,
89 | close: 10
90 | }, {
91 | shadowH: 50,
92 | shadowL: 5,
93 | open: 25,
94 | close: 15
95 | }],
96 | axisDependency: 'right',
97 | drawValues: false,
98 | colors: ['red'],
99 | label: 'Company A'
100 | }],
101 | },
102 | scatterData: {
103 | dataSets: [{
104 | values: [15, 40, 77, 81, 43],
105 | drawValues: false,
106 | colors: ['rgb(197, 36, 82)'],
107 | label: 'Company A',
108 | scatterShape: 'Square',
109 | axisDependency: 'right'
110 | }, {
111 | values: [40, 5, 50, 23, 79],
112 | drawValues: false,
113 | colors: ['rgb(255, 101, 0)'],
114 | label: 'Company B',
115 | scatterShape: 'Circle',
116 | axisDependency: 'right'
117 | }, {
118 | values: [10, 55, 35, 90, 82],
119 | drawValues: false,
120 | colors: ['rgb(247, 198, 0)'],
121 | label: 'Company C',
122 | scatterShape: 'Triangle',
123 | axisDependency: 'right'
124 | }],
125 | },
126 | drawBarShadowEnabled: false,
127 | labels: ['1990', '1991', '1992', '1993', '1994'],
128 | showLegend: false,
129 | xAxis: {
130 | position: 'bottom'
131 | },
132 | leftAxis: {
133 | drawGridLines: false,
134 | spaceBottom: 0.05
135 | },
136 | rightAxis: {
137 | drawGridLines: false,
138 | spaceBottom: 0.05,
139 | axisMaximum: 100,
140 | axisMaximum: 0
141 | },
142 | valueFormatter: {
143 | type: 'regular',
144 | maximumDecimalPlaces: 0
145 | }
146 | };
147 | return (
148 |
149 | );
150 | }
151 | }
152 |
--------------------------------------------------------------------------------
/examples/ChartsExplorer/components/HorizontalBar.js:
--------------------------------------------------------------------------------
1 | import React, { Component } from 'react';
2 | import { StyleSheet } from 'react-native';
3 |
4 | import { HorizontalBarChart } from 'react-native-ios-charts';
5 |
6 |
7 |
8 | const styles = StyleSheet.create({
9 | container: {
10 | flex: 1,
11 | justifyContent: 'center',
12 | alignItems: 'stretch',
13 | backgroundColor: 'transparent'
14 | }
15 | });
16 |
17 | export default class HorizontalBar extends Component {
18 | static displayName = 'HorizontalBar';
19 |
20 | render() {
21 | const config = {
22 | dataSets: [{
23 | values: [89.7, 20.7, 43.7, 54.7, 34.7, 16.7, 66.7, 86.7, 65.7, 76.7, 96.7, 106.7],
24 | valueTextFontSize: 12
25 | }],
26 | labels: ['Jan', 'Feb', 'Mar', 'Apr', 'May', 'Jun', 'Jul', 'Aug', 'Oct', 'Sep', 'Nov', 'Dec'],
27 | showLegend: false,
28 | minOffset: 20,
29 | xAxis: {
30 | axisLineWidth: 0,
31 | position: 'bottom'
32 | },
33 | leftAxis: {
34 | spaceTop: 0.18
35 | },
36 | rightAxis: {
37 | enabled: false,
38 | drawGridLines: false
39 | }
40 | };
41 | return (
42 |
43 | );
44 | }
45 | }
46 |
--------------------------------------------------------------------------------
/examples/ChartsExplorer/components/Line.js:
--------------------------------------------------------------------------------
1 | import React, { Component } from 'react';
2 | import { StyleSheet } from 'react-native';
3 |
4 | import { LineChart } from 'react-native-ios-charts';
5 |
6 |
7 | const styles = StyleSheet.create({
8 | container: {
9 | flex: 1,
10 | justifyContent: 'center',
11 | alignItems: 'stretch',
12 | backgroundColor: 'transparent'
13 | }
14 | });
15 |
16 | export default class Line extends Component {
17 | static displayName = 'Line';
18 |
19 | render() {
20 | const config = {
21 | dataSets: [{
22 | values: [-1, 1, -1],
23 | drawValues: false,
24 | colors: ['rgb(199, 255, 140)'],
25 | label: 'Sine function',
26 | drawCubic: true,
27 | drawCircles: false,
28 | lineWidth: 2
29 | }, {
30 | values: [1, -1, 1],
31 | drawValues: false,
32 | colors: ['rgb(255, 247, 141)'],
33 | label: 'Cosine function',
34 | drawCubic: true,
35 | drawCircles: false,
36 | lineWidth: 2
37 | }],
38 | labels: ['Jan', 'Feb', 'Mar'],
39 | minOffset: 20,
40 | scaleYEnabled: false,
41 | drawMarkers: true,
42 | marker: {
43 | markerColor: 'grey',
44 | markerTextColor: 'white',
45 | markerFontSize: 14,
46 | },
47 | legend: {
48 | textSize: 12
49 | },
50 | xAxis: {
51 | axisLineWidth: 0,
52 | drawLabels: false,
53 | position: 'bottom',
54 | drawGridLines: false
55 | },
56 | leftAxis: {
57 | customAxisMax: 1,
58 | customAxisMin: -1,
59 | labelCount: 11,
60 | startAtZero: false,
61 | spaceTop: 0.1,
62 | spaceBottom: 0.1
63 | },
64 | rightAxis: {
65 | enabled: false,
66 | drawGridLines: false
67 | },
68 | valueFormatter: {
69 | minimumSignificantDigits: 1,
70 | type: 'regular',
71 | maximumDecimalPlaces: 1
72 | }
73 | };
74 | return (
75 |
76 | );
77 | }
78 | }
79 |
--------------------------------------------------------------------------------
/examples/ChartsExplorer/components/LiveUpdating.js:
--------------------------------------------------------------------------------
1 | import React, { Component } from 'react';
2 | import { StyleSheet } from 'react-native';
3 |
4 | import { LineChart } from 'react-native-ios-charts';
5 |
6 | const colors = ['red', 'blue', 'green', 'yellow', 'purple', 'pink'];
7 |
8 | const styles = StyleSheet.create({
9 | container: {
10 | flex: 1,
11 | justifyContent: 'center',
12 | alignItems: 'stretch',
13 | backgroundColor: 'transparent'
14 | }
15 | });
16 |
17 | const getConfig = (values, color) => {
18 | return {
19 | dataSets: [{
20 | values: values,
21 | drawValues: false,
22 | colors: [colors[color]],
23 | label: 'Sine function',
24 | drawCubic: true,
25 | drawCircles: false,
26 | lineWidth: 2
27 | }],
28 | labels: values.map(v => v.toString()),
29 | minOffset: 20,
30 | scaleYEnabled: false,
31 | showLegend: false,
32 | legend: {
33 | textSize: 12
34 | },
35 | xAxis: {
36 | axisLineWidth: 0,
37 | drawLabels: false,
38 | position: 'bottom',
39 | drawGridLines: false
40 | },
41 | leftAxis: {
42 | customAxisMax: 1,
43 | customAxisMin: -1,
44 | labelCount: 11,
45 | startAtZero: false,
46 | spaceTop: 0.1,
47 | spaceBottom: 0.1
48 | },
49 | rightAxis: {
50 | enabled: false,
51 | drawGridLines: false
52 | },
53 | valueFormatter: {
54 | minimumSignificantDigits: 1,
55 | type: 'regular',
56 | maximumDecimalPlaces: 1
57 | }
58 | };
59 | };
60 |
61 | export default class LiveUpdating extends Component {
62 | static displayName = 'LiveUpdating';
63 |
64 | constructor(props) {
65 | super(props);
66 | this.state = {
67 | values: [],
68 | color: 0
69 | }
70 | }
71 |
72 | componentDidMount() {
73 | this.interval = setInterval(() => {
74 | if (this.state.values.length >= 20) {
75 | this.setState({
76 | values: []
77 | });
78 | } else {
79 | this.setState({
80 | values: this.state.values.concat([Math.floor((Math.random() * 100) + 1)]),
81 | color: (this.state.color + 1) % colors.length
82 | });
83 | }
84 | }, 500);
85 | }
86 |
87 | componentWillUnmount() {
88 | clearInterval(this.interval);
89 | }
90 |
91 | render() {
92 | const { values, color } = this.state;
93 | const config = getConfig(values, color);
94 | return (
95 |
96 | );
97 | }
98 | }
99 |
--------------------------------------------------------------------------------
/examples/ChartsExplorer/components/Pie.js:
--------------------------------------------------------------------------------
1 | import React, { Component } from 'react';
2 | import { StyleSheet } from 'react-native';
3 |
4 | import { PieChart } from 'react-native-ios-charts';
5 |
6 |
7 | const styles = StyleSheet.create({
8 | container: {
9 | flex: 1,
10 | justifyContent: 'center',
11 | alignItems: 'stretch',
12 | backgroundColor: 'transparent'
13 | }
14 | });
15 |
16 | export default class Pie extends Component {
17 | static displayName = 'Pie';
18 |
19 | render() {
20 | const config = {
21 | dataSets: [{
22 | values: [0.14, 0.14, 0.34, 0.38],
23 | colors: ['rgb(197, 255, 140)', 'rgb(255, 247, 140)', 'rgb(255, 210, 141)', 'rgb(140, 235, 255)'],
24 | label: 'Quarter Revenues 2014'
25 | }],
26 | labels: ['Quarter 1', 'Quarter 2', 'Quarter 3', 'Quarter 4'],
27 | centerText: 'Quartely Revenue',
28 | legend: {
29 | position: 'aboveChartRight',
30 | wordWrap: true
31 | },
32 | valueFormatter: {
33 | type: 'regular',
34 | numberStyle: 'PercentStyle',
35 | maximumDecimalPlaces: 0
36 | }
37 | };
38 | return (
39 |
40 | );
41 | }
42 | }
43 |
--------------------------------------------------------------------------------
/examples/ChartsExplorer/components/Radar.js:
--------------------------------------------------------------------------------
1 | import React, { Component } from 'react';
2 | import { StyleSheet } from 'react-native';
3 |
4 | import { RadarChart } from 'react-native-ios-charts';
5 |
6 |
7 | const styles = StyleSheet.create({
8 | container: {
9 | flex: 1,
10 | justifyContent: 'center',
11 | alignItems: 'stretch',
12 | backgroundColor: 'transparent'
13 | }
14 | });
15 |
16 | export default class Radar extends Component {
17 | static displayName = 'Radar';
18 |
19 | render() {
20 | const config = {
21 | dataSets: [{
22 | values: [230, 100, 150, 145, 160, 150, 100, 185, 200],
23 | colors: ['rgb(197, 254, 144)'],
24 | label: '2014',
25 | drawFilledEnabled: true,
26 | fillColor: 'green',
27 | drawValues: false
28 | }, {
29 | values: [120, 160, 110, 115, 220, 120, 250, 100, 220],
30 | colors: ['rgb(255, 133, 153)'],
31 | label: '2015',
32 | drawFilledEnabled: true,
33 | fillColor: 'red',
34 | drawValues: false
35 | }],
36 | drawMarkers: true,
37 | marker: {
38 | markerColor: 'rgb(255, 133, 153)',
39 | markerTextColor: 'white',
40 | markerFontSize: 14,
41 | },
42 | labels: ['Party A', 'Party B', 'Party C', 'Party D', 'Party E', 'Party F', 'Party G', 'Party H', 'Party I']
43 | };
44 | return (
45 |
46 | );
47 | }
48 | }
49 |
--------------------------------------------------------------------------------
/examples/ChartsExplorer/components/Scatter.js:
--------------------------------------------------------------------------------
1 | import React, { Component } from 'react';
2 | import { StyleSheet } from 'react-native';
3 |
4 | import { ScatterChart } from 'react-native-ios-charts';
5 |
6 |
7 | const styles = StyleSheet.create({
8 | container: {
9 | flex: 1,
10 | justifyContent: 'center',
11 | alignItems: 'stretch',
12 | backgroundColor: 'transparent'
13 | }
14 | });
15 |
16 | export default class Scatter extends Component {
17 | static displayName = 'Scatter';
18 |
19 | render() {
20 | const config = {
21 | dataSets: [{
22 | values: [5, 40, 77, 81, 43],
23 | drawValues: false,
24 | colors: ['rgb(197, 36, 82)'],
25 | label: 'Company A',
26 | scatterShape: 'Square'
27 | }, {
28 | values: [40, 5, 50, 23, 79],
29 | drawValues: false,
30 | colors: ['rgb(255, 101, 0)'],
31 | label: 'Company B',
32 | scatterShape: 'Circle'
33 | }, {
34 | values: [10, 55, 35, 90, 82],
35 | drawValues: false,
36 | colors: ['rgb(247, 198, 0)'],
37 | label: 'Company C',
38 | scatterShape: 'Triangle'
39 | }],
40 | labels: ['1990', '1991', '1992', '1993', '1994'],
41 | legend: {
42 | },
43 | xAxis: {
44 | position: 'bottom'
45 | },
46 | leftAxis: {
47 | spaceBottom: 0.05
48 | },
49 | rightAxis: {
50 | spaceBottom: 0.05
51 | },
52 | valueFormatter: {
53 | type: 'regular',
54 | maximumDecimalPlaces: 0
55 | }
56 | };
57 | return (
58 |
59 | );
60 | }
61 | }
62 |
--------------------------------------------------------------------------------
/examples/ChartsExplorer/index.ios.js:
--------------------------------------------------------------------------------
1 | import React, { Component } from 'react';
2 | import {
3 | AppRegistry,
4 | StyleSheet,
5 | Text,
6 | View,
7 | ListView,
8 | Navigator,
9 | TouchableHighlight
10 | } from 'react-native';
11 |
12 | import Pie from './components/Pie';
13 | import Bar from './components/Bar';
14 | import Line from './components/Line';
15 | import Radar from './components/Radar';
16 | import Bubble from './components/Bubble';
17 | import Scatter from './components/Scatter';
18 | import CandleStick from './components/CandleStick';
19 | import HorizontalBar from './components/HorizontalBar';
20 | import Combined from './components/Combined';
21 | import LiveUpdating from './components/LiveUpdating';
22 |
23 | const ds = new ListView.DataSource({
24 | rowHasChanged: (r1, r2) => r1 !== r2
25 | });
26 |
27 | const data = ds.cloneWithRows([
28 | {
29 | id: 2,
30 | title: '',
31 | description: 'Displays a PieChart'
32 | }, {
33 | id: 3,
34 | title: '',
35 | description: 'Displays a BarChart'
36 | }, {
37 | id: 4,
38 | title: '',
39 | description: 'Displays a LineChart'
40 | }, {
41 | id: 5,
42 | title: '',
43 | description: 'Displays a RadarChart'
44 | }, {
45 | id: 6,
46 | title: '',
47 | description: 'Displays a BubbleChart'
48 | }, {
49 | id: 7,
50 | title: '',
51 | description: 'Displays a ScatterChart'
52 | }, {
53 | id: 8,
54 | title: '',
55 | description: 'Displays a CandleStickChart'
56 | }, {
57 | id: 9,
58 | title: '',
59 | description: 'Displays a HorizontalBarChart'
60 | }, {
61 | id: 10,
62 | title: '',
63 | description: 'Displays a CombinedChart with Bar and Line data.'
64 | }, {
65 | id: 11,
66 | title: 'Live Updating graph',
67 | description: 'Live updating a line chart'
68 | }
69 | ]);
70 |
71 | class Navbar extends Component {
72 | handleBack = () => {
73 | this.props.navigator.pop();
74 | };
75 | render() {
76 | const backStyles = this.props.routeId === 1 ? [styles.navText, styles.right] : styles.navText;
77 | return (
78 |
79 |
83 | Back
84 |
85 | {this.props.title}
86 | Back
87 |
88 | );
89 | }
90 | }
91 |
92 | class ChartList extends Component {
93 | static displayName = 'ChartList';
94 |
95 | renderRow = (row) => {
96 | const handlePress = () => {
97 | this.props.navigator.push({ id: row.id });
98 | };
99 |
100 | return (
101 |
105 |
106 | {row.title}
107 | {row.description}
108 |
109 |
110 | );
111 | };
112 | render() {
113 | return (
114 |
119 | );
120 | }
121 | }
122 |
123 | class ChartsExplorer extends Component {
124 | static displayName = 'ChartsExplorer';
125 | renderScene = (route, navigator) => {
126 | let content = null;
127 | let navText = 'ChartExplorer';
128 | switch (route.id) {
129 | case 1:
130 | content = ;
131 | navText = 'ChartExplorer';
132 | break;
133 | case 2:
134 | content = ;
135 | navText = 'PieChart';
136 | break;
137 | case 3:
138 | content = ;
139 | navText = 'BarChart';
140 | break;
141 | case 4:
142 | content = ;
143 | navText = 'LineChart';
144 | break;
145 | case 5:
146 | content = ;
147 | navText = 'RadarChart';
148 | break;
149 | case 6:
150 | content = ;
151 | navText = 'BubbleChart';
152 | break;
153 | case 7:
154 | content = ;
155 | navText = 'ScatterChart';
156 | break;
157 | case 8:
158 | content = ;
159 | navText = 'CandleStickChart';
160 | break;
161 | case 9:
162 | content = ;
163 | navText = 'HorizontalBarChart';
164 | break;
165 | case 10:
166 | content = ;
167 | navText = 'CombinedChart';
168 | break;
169 | case 11:
170 | content = ;
171 | navText = 'Live Updating';
172 | break;
173 | default:
174 | content = null;
175 | break;
176 | }
177 |
178 | if (route.id !== 1) {
179 | content = {content};
180 | }
181 | return (
182 |
183 |
188 | {content}
189 |
190 | );
191 | };
192 |
193 | render() {
194 | return (
195 | {
197 | return {
198 | ...Navigator.SceneConfigs.HorizontalSwipeJump,
199 | gestures: null
200 | };
201 | }}
202 | initialRoute={{ id: 1 }}
203 | renderScene={this.renderScene}
204 | />
205 | );
206 | }
207 | }
208 |
209 | const styles = StyleSheet.create({
210 | container: {
211 | flex: 1,
212 | justifyContent: 'flex-start',
213 | backgroundColor: 'white',
214 | padding: 20,
215 | paddingTop: 30,
216 | paddingBottom: 30
217 | },
218 | bar: {
219 | flexDirection: 'row',
220 | justifyContent: 'space-between',
221 | alignItems: 'flex-end',
222 | height: 60,
223 | paddingLeft: 10,
224 | paddingRight: 10,
225 | paddingBottom: 10,
226 | backgroundColor: 'rgba(230, 230, 230, 0.3)',
227 | borderBottomWidth: 1,
228 | borderBottomColor: 'rgba(100, 100, 100, 0.2)'
229 | },
230 | navText: {
231 | fontSize: 16
232 | },
233 | right: {
234 | opacity: 0
235 | },
236 | list: {
237 | backgroundColor: 'white',
238 | padding: 0
239 | },
240 | listItem: {
241 | padding: 10,
242 | paddingLeft: 20,
243 | borderBottomWidth: 1,
244 | borderBottomColor: 'rgba(100, 100, 100, 0.2)'
245 | },
246 | description: {
247 | marginTop: 5,
248 | fontSize: 12,
249 | color: 'rgba(100, 100, 100, 0.7)'
250 | }
251 | });
252 |
253 | AppRegistry.registerComponent('ChartsExplorer', () => ChartsExplorer);
254 |
--------------------------------------------------------------------------------
/examples/ChartsExplorer/ios/ChartsExplorer-Bridging-Header.h:
--------------------------------------------------------------------------------
1 | //
2 | // Use this file to import your target's public headers that you would like to expose to Swift.
3 | //
4 |
5 | #import "RCTBridge.h"
6 | #import "RCTViewManager.h"
7 | #import "RCTUIManager.h"
8 | #import "UIView+React.h"
--------------------------------------------------------------------------------
/examples/ChartsExplorer/ios/ChartsExplorer.xcodeproj/xcshareddata/xcschemes/ChartsExplorer.xcscheme:
--------------------------------------------------------------------------------
1 |
2 |
5 |
8 |
9 |
15 |
21 |
22 |
23 |
29 |
35 |
36 |
37 |
38 |
39 |
44 |
45 |
47 |
53 |
54 |
55 |
56 |
57 |
63 |
64 |
65 |
66 |
67 |
68 |
78 |
80 |
86 |
87 |
88 |
89 |
90 |
91 |
97 |
99 |
105 |
106 |
107 |
108 |
110 |
111 |
114 |
115 |
116 |
--------------------------------------------------------------------------------
/examples/ChartsExplorer/ios/ChartsExplorer.xcworkspace/contents.xcworkspacedata:
--------------------------------------------------------------------------------
1 |
2 |
4 |
6 |
7 |
9 |
10 |
11 |
--------------------------------------------------------------------------------
/examples/ChartsExplorer/ios/ChartsExplorer/AppDelegate.h:
--------------------------------------------------------------------------------
1 | /**
2 | * Copyright (c) 2015-present, Facebook, Inc.
3 | * All rights reserved.
4 | *
5 | * This source code is licensed under the BSD-style license found in the
6 | * LICENSE file in the root directory of this source tree. An additional grant
7 | * of patent rights can be found in the PATENTS file in the same directory.
8 | */
9 |
10 | #import
11 |
12 | @interface AppDelegate : UIResponder
13 |
14 | @property (nonatomic, strong) UIWindow *window;
15 |
16 | @end
17 |
--------------------------------------------------------------------------------
/examples/ChartsExplorer/ios/ChartsExplorer/AppDelegate.m:
--------------------------------------------------------------------------------
1 | /**
2 | * Copyright (c) 2015-present, Facebook, Inc.
3 | * All rights reserved.
4 | *
5 | * This source code is licensed under the BSD-style license found in the
6 | * LICENSE file in the root directory of this source tree. An additional grant
7 | * of patent rights can be found in the PATENTS file in the same directory.
8 | */
9 |
10 | #import "AppDelegate.h"
11 |
12 | #import "RCTRootView.h"
13 |
14 | @implementation AppDelegate
15 |
16 | - (BOOL)application:(UIApplication *)application didFinishLaunchingWithOptions:(NSDictionary *)launchOptions
17 | {
18 | NSURL *jsCodeLocation;
19 |
20 | /**
21 | * Loading JavaScript code - uncomment the one you want.
22 | *
23 | * OPTION 1
24 | * Load from development server. Start the server from the repository root:
25 | *
26 | * $ npm start
27 | *
28 | * To run on device, change `localhost` to the IP address of your computer
29 | * (you can get this by typing `ifconfig` into the terminal and selecting the
30 | * `inet` value under `en0:`) and make sure your computer and iOS device are
31 | * on the same Wi-Fi network.
32 | */
33 |
34 | jsCodeLocation = [NSURL URLWithString:@"http://localhost:8081/index.ios.bundle?platform=ios&dev=true"];
35 |
36 | /**
37 | * OPTION 2
38 | * Load from pre-bundled file on disk. The static bundle is automatically
39 | * generated by the "Bundle React Native code and images" build step when
40 | * running the project on an actual device or running the project on the
41 | * simulator in the "Release" build configuration.
42 | */
43 |
44 | // jsCodeLocation = [[NSBundle mainBundle] URLForResource:@"main" withExtension:@"jsbundle"];
45 |
46 | RCTRootView *rootView = [[RCTRootView alloc] initWithBundleURL:jsCodeLocation
47 | moduleName:@"ChartsExplorer"
48 | initialProperties:nil
49 | launchOptions:launchOptions];
50 |
51 | self.window = [[UIWindow alloc] initWithFrame:[UIScreen mainScreen].bounds];
52 | UIViewController *rootViewController = [UIViewController new];
53 | rootViewController.view = rootView;
54 | self.window.rootViewController = rootViewController;
55 | [self.window makeKeyAndVisible];
56 | return YES;
57 | }
58 |
59 | @end
60 |
--------------------------------------------------------------------------------
/examples/ChartsExplorer/ios/ChartsExplorer/Base.lproj/LaunchScreen.xib:
--------------------------------------------------------------------------------
1 |
2 |
3 |
4 |
5 |
6 |
7 |
8 |
9 |
10 |
11 |
12 |
13 |
14 |
15 |
21 |
27 |
28 |
29 |
30 |
31 |
32 |
33 |
34 |
35 |
36 |
37 |
38 |
39 |
40 |
41 |
42 |
43 |
--------------------------------------------------------------------------------
/examples/ChartsExplorer/ios/ChartsExplorer/Images.xcassets/AppIcon.appiconset/Contents.json:
--------------------------------------------------------------------------------
1 | {
2 | "images" : [
3 | {
4 | "idiom" : "iphone",
5 | "size" : "29x29",
6 | "scale" : "2x"
7 | },
8 | {
9 | "idiom" : "iphone",
10 | "size" : "29x29",
11 | "scale" : "3x"
12 | },
13 | {
14 | "idiom" : "iphone",
15 | "size" : "40x40",
16 | "scale" : "2x"
17 | },
18 | {
19 | "idiom" : "iphone",
20 | "size" : "40x40",
21 | "scale" : "3x"
22 | },
23 | {
24 | "idiom" : "iphone",
25 | "size" : "60x60",
26 | "scale" : "2x"
27 | },
28 | {
29 | "idiom" : "iphone",
30 | "size" : "60x60",
31 | "scale" : "3x"
32 | }
33 | ],
34 | "info" : {
35 | "version" : 1,
36 | "author" : "xcode"
37 | }
38 | }
--------------------------------------------------------------------------------
/examples/ChartsExplorer/ios/ChartsExplorer/Info.plist:
--------------------------------------------------------------------------------
1 |
2 |
3 |
4 |
5 | CFBundleDevelopmentRegion
6 | en
7 | CFBundleExecutable
8 | $(EXECUTABLE_NAME)
9 | CFBundleIdentifier
10 | $(PRODUCT_BUNDLE_IDENTIFIER)
11 | CFBundleInfoDictionaryVersion
12 | 6.0
13 | CFBundleName
14 | $(PRODUCT_NAME)
15 | CFBundlePackageType
16 | APPL
17 | CFBundleShortVersionString
18 | 1.0
19 | CFBundleSignature
20 | ????
21 | CFBundleVersion
22 | 1
23 | LSRequiresIPhoneOS
24 |
25 | UILaunchStoryboardName
26 | LaunchScreen
27 | UIRequiredDeviceCapabilities
28 |
29 | armv7
30 |
31 | UISupportedInterfaceOrientations
32 |
33 | UIInterfaceOrientationPortrait
34 | UIInterfaceOrientationLandscapeLeft
35 | UIInterfaceOrientationLandscapeRight
36 |
37 | UIViewControllerBasedStatusBarAppearance
38 |
39 | NSLocationWhenInUseUsageDescription
40 |
41 | NSAppTransportSecurity
42 |
43 |
44 | NSAllowsArbitraryLoads
45 |
46 |
47 |
48 |
49 |
--------------------------------------------------------------------------------
/examples/ChartsExplorer/ios/ChartsExplorer/main.m:
--------------------------------------------------------------------------------
1 | /**
2 | * Copyright (c) 2015-present, Facebook, Inc.
3 | * All rights reserved.
4 | *
5 | * This source code is licensed under the BSD-style license found in the
6 | * LICENSE file in the root directory of this source tree. An additional grant
7 | * of patent rights can be found in the PATENTS file in the same directory.
8 | */
9 |
10 | #import
11 |
12 | #import "AppDelegate.h"
13 |
14 | int main(int argc, char * argv[]) {
15 | @autoreleasepool {
16 | return UIApplicationMain(argc, argv, nil, NSStringFromClass([AppDelegate class]));
17 | }
18 | }
19 |
--------------------------------------------------------------------------------
/examples/ChartsExplorer/ios/ChartsExplorerTests/ChartsExplorerTests.m:
--------------------------------------------------------------------------------
1 | /**
2 | * Copyright (c) 2015-present, Facebook, Inc.
3 | * All rights reserved.
4 | *
5 | * This source code is licensed under the BSD-style license found in the
6 | * LICENSE file in the root directory of this source tree. An additional grant
7 | * of patent rights can be found in the PATENTS file in the same directory.
8 | */
9 |
10 | #import
11 | #import
12 |
13 | #import "RCTLog.h"
14 | #import "RCTRootView.h"
15 |
16 | #define TIMEOUT_SECONDS 600
17 | #define TEXT_TO_LOOK_FOR @"Welcome to React Native!"
18 |
19 | @interface ChartsExplorerTests : XCTestCase
20 |
21 | @end
22 |
23 | @implementation ChartsExplorerTests
24 |
25 | - (BOOL)findSubviewInView:(UIView *)view matching:(BOOL(^)(UIView *view))test
26 | {
27 | if (test(view)) {
28 | return YES;
29 | }
30 | for (UIView *subview in [view subviews]) {
31 | if ([self findSubviewInView:subview matching:test]) {
32 | return YES;
33 | }
34 | }
35 | return NO;
36 | }
37 |
38 | - (void)testRendersWelcomeScreen
39 | {
40 | UIViewController *vc = [[[[UIApplication sharedApplication] delegate] window] rootViewController];
41 | NSDate *date = [NSDate dateWithTimeIntervalSinceNow:TIMEOUT_SECONDS];
42 | BOOL foundElement = NO;
43 |
44 | __block NSString *redboxError = nil;
45 | RCTSetLogFunction(^(RCTLogLevel level, RCTLogSource source, NSString *fileName, NSNumber *lineNumber, NSString *message) {
46 | if (level >= RCTLogLevelError) {
47 | redboxError = message;
48 | }
49 | });
50 |
51 | while ([date timeIntervalSinceNow] > 0 && !foundElement && !redboxError) {
52 | [[NSRunLoop mainRunLoop] runMode:NSDefaultRunLoopMode beforeDate:[NSDate dateWithTimeIntervalSinceNow:0.1]];
53 | [[NSRunLoop mainRunLoop] runMode:NSRunLoopCommonModes beforeDate:[NSDate dateWithTimeIntervalSinceNow:0.1]];
54 |
55 | foundElement = [self findSubviewInView:vc.view matching:^BOOL(UIView *view) {
56 | if ([view.accessibilityLabel isEqualToString:TEXT_TO_LOOK_FOR]) {
57 | return YES;
58 | }
59 | return NO;
60 | }];
61 | }
62 |
63 | RCTSetLogFunction(RCTDefaultLogFunction);
64 |
65 | XCTAssertNil(redboxError, @"RedBox error: %@", redboxError);
66 | XCTAssertTrue(foundElement, @"Couldn't find element with text '%@' in %d seconds", TEXT_TO_LOOK_FOR, TIMEOUT_SECONDS);
67 | }
68 |
69 |
70 | @end
71 |
--------------------------------------------------------------------------------
/examples/ChartsExplorer/ios/ChartsExplorerTests/Info.plist:
--------------------------------------------------------------------------------
1 |
2 |
3 |
4 |
5 | CFBundleDevelopmentRegion
6 | en
7 | CFBundleExecutable
8 | $(EXECUTABLE_NAME)
9 | CFBundleIdentifier
10 | $(PRODUCT_BUNDLE_IDENTIFIER)
11 | CFBundleInfoDictionaryVersion
12 | 6.0
13 | CFBundleName
14 | $(PRODUCT_NAME)
15 | CFBundlePackageType
16 | BNDL
17 | CFBundleShortVersionString
18 | 1.0
19 | CFBundleSignature
20 | ????
21 | CFBundleVersion
22 | 1
23 |
24 |
25 |
--------------------------------------------------------------------------------
/examples/ChartsExplorer/ios/Podfile:
--------------------------------------------------------------------------------
1 | use_frameworks!
2 |
3 | target 'ChartsExplorer' do
4 | pod 'SwiftyJSON', git: 'https://github.com/IBM-Swift/SwiftyJSON.git'
5 | pod 'Charts', git: 'https://github.com/danielgindi/Charts.git', branch: 'Swift-3.0'
6 | end
7 |
8 | post_install do |installer|
9 | installer.pods_project.targets.each do |target|
10 | target.build_configurations.each do |config|
11 | config.build_settings['SWIFT_VERSION'] = '3.0'
12 | end
13 | end
14 | end
15 |
--------------------------------------------------------------------------------
/examples/ChartsExplorer/ios/Podfile.lock:
--------------------------------------------------------------------------------
1 | PODS:
2 | - Charts (2.2.5):
3 | - Charts/Core (= 2.2.5)
4 | - Charts/Core (2.2.5)
5 | - SwiftyJSON (2.3.2)
6 |
7 | DEPENDENCIES:
8 | - Charts (from `https://github.com/danielgindi/Charts.git`, branch `Swift-3.0`)
9 | - SwiftyJSON (from `https://github.com/IBM-Swift/SwiftyJSON.git`)
10 |
11 | EXTERNAL SOURCES:
12 | Charts:
13 | :branch: Swift-3.0
14 | :git: https://github.com/danielgindi/Charts.git
15 | SwiftyJSON:
16 | :git: https://github.com/IBM-Swift/SwiftyJSON.git
17 |
18 | CHECKOUT OPTIONS:
19 | Charts:
20 | :commit: 2dd22b903a78d0d34d07ef71728c41ac22f6a114
21 | :git: https://github.com/danielgindi/Charts.git
22 | SwiftyJSON:
23 | :commit: 21e2e6ba20cc2c0e35162798f0729bb0c4cbe23d
24 | :git: https://github.com/IBM-Swift/SwiftyJSON.git
25 |
26 | SPEC CHECKSUMS:
27 | Charts: b48fcc8d7190de910ff9e9748f5360c8ea7856e5
28 | SwiftyJSON: 04ccea08915aa0109039157c7974cf0298da292a
29 |
30 | PODFILE CHECKSUM: 46743688483f7b5730308f9e37e3d026d2cce951
31 |
32 | COCOAPODS: 1.0.1
33 |
--------------------------------------------------------------------------------
/examples/ChartsExplorer/package.json:
--------------------------------------------------------------------------------
1 | {
2 | "name": "ChartsExplorer",
3 | "version": "0.0.1",
4 | "private": true,
5 | "scripts": {
6 | "start": "node node_modules/react-native/local-cli/cli.js start"
7 | },
8 | "dependencies": {
9 | "react": "15.3.1-rc.2",
10 | "react-native": "0.34.0-rc.0",
11 | "react-native-ios-charts": "git+https://github.com/Jpadilla1/react-native-ios-charts.git"
12 | }
13 | }
14 |
--------------------------------------------------------------------------------
/examples/ChartsExplorer/readme.md:
--------------------------------------------------------------------------------
1 | # ChartsExplorer
2 |
3 | The ChartsExplorer is a sample app that showcases React Native iOS Charts.
4 |
5 | ## Running this app
6 |
7 | Before running the app, make sure you ran:
8 |
9 | git clone https://github.com/Jpadilla1/react-native-ios-charts.git
10 | cd react-native-ios-charts/examples/ChartsExplorer/ios
11 | pod install
12 | cd ..
13 | npm install
14 |
15 | ### Running on iOS
16 |
17 | Mac OS and Xcode are required.
18 |
19 | - Open `examples/ChartsExplorer/ios/ChartsExplorer.xcworkspace` in Xcode
20 | - Hit the Run button
21 |
22 | See [Running on device](https://facebook.github.io/react-native/docs/running-on-device-ios.html) if you want to use a physical device.
23 |
--------------------------------------------------------------------------------
/index.js:
--------------------------------------------------------------------------------
1 | import BarChart from './components/BarChart';
2 | import LineChart from './components/LineChart';
3 | import HorizontalBarChart from './components/HorizontalBarChart';
4 | import PieChart from './components/PieChart';
5 | import CandleStickChart from './components/CandleStickChart';
6 | import BubbleChart from './components/BubbleChart';
7 | import ScatterChart from './components/ScatterChart';
8 | import RadarChart from './components/RadarChart';
9 | import CombinedChart from './components/CombinedChart';
10 |
11 | module.exports = {
12 | BarChart,
13 | LineChart,
14 | HorizontalBarChart,
15 | PieChart,
16 | CandleStickChart,
17 | BubbleChart,
18 | ScatterChart,
19 | RadarChart,
20 | CombinedChart
21 | };
22 |
--------------------------------------------------------------------------------
/package.json:
--------------------------------------------------------------------------------
1 | {
2 | "name": "react-native-ios-charts",
3 | "version": "0.3.0",
4 | "main": "index.js",
5 | "repository": {
6 | "type": "git",
7 | "url": "git+https://github.com/Jpadilla1/react-native-ios-charts.git"
8 | },
9 | "bugs": {
10 | "url": "https://github.com/Jpadilla1/react-native-ios-charts/issues"
11 | },
12 | "homepage": "https://github.com/Jpadilla1/react-native-ios-charts#readme",
13 | "keywords": [
14 | "charts",
15 | "graphs",
16 | "react-native",
17 | "react-component",
18 | "ios"
19 | ],
20 | "author": "Jose Padilla ",
21 | "license": "MIT",
22 | "scripts": {
23 | "start": "react-native start"
24 | }
25 | }
26 |
--------------------------------------------------------------------------------
/screenshots/all.png:
--------------------------------------------------------------------------------
https://raw.githubusercontent.com/Jpadilla1/react-native-ios-charts/8bc59982e278ba1ca31a25b37e6b7081f571574c/screenshots/all.png
--------------------------------------------------------------------------------
/utils/commonColorProps.js:
--------------------------------------------------------------------------------
1 | import { processColor } from 'react-native';
2 |
3 | const processDataSetsColors = (config) => {
4 | const ret = JSON.parse(JSON.stringify(config));
5 | if ('dataSets' in ret) {
6 | ret.dataSets = ret.dataSets.map(function(set) {
7 | if ('colors' in set) {
8 | set.colors = set.colors.map(color => processColor(color));
9 | }
10 | if ('barShadowColor' in set) {
11 | set.barShadowColor = processColor(set.barShadowColor);
12 | }
13 | if ('circleColors' in set) {
14 | set.circleColors = set.circleColors.map(color => processColor(color));
15 | }
16 | if ('circleHoleColor' in set) {
17 | set.circleHoleColor = processColor(set.circleHoleColor);
18 | }
19 | if ('fillColor' in set) {
20 | set.fillColor = processColor(set.fillColor);
21 | }
22 | if ('highlightColor' in set) {
23 | set.highlightColor = processColor(set.highlightColor);
24 | }
25 | if ('valueTextColor' in set) {
26 | set.valueTextColor = processColor(set.valueTextColor);
27 | }
28 | if ('shadowColor' in set) {
29 | set.shadowColor = processColor(set.shadowColor);
30 | }
31 | if ('neutralColor' in set) {
32 | set.neutralColor = processColor(set.neutralColor);
33 | }
34 | if ('increasingColor' in set) {
35 | set.increasingColor = processColor(set.increasingColor);
36 | }
37 | if ('decreasingColor' in set) {
38 | set.decreasingColor = processColor(set.decreasingColor);
39 | }
40 | if ('scatterShapeHoleColor' in set) {
41 | set.scatterShapeHoleColor = processColor(set.scatterShapeHoleColor);
42 | }
43 | if ('webColor' in set) {
44 | set.webColor = processColor(set.webColor);
45 | }
46 | if ('innerWebColor' in set) {
47 | set.innerWebColor = processColor(set.innerWebColor);
48 | }
49 | return set;
50 | });
51 | }
52 | return ret;
53 | };
54 |
55 | export const processColors = (props) => {
56 | let config = JSON.parse(JSON.stringify(props));
57 |
58 | config = processDataSetsColors(config);
59 |
60 | if ('lineData' in config) {
61 | config.lineData = processDataSetsColors(config.lineData);
62 | }
63 |
64 | if ('barData' in config) {
65 | config.barData = processDataSetsColors(config.barData);
66 | }
67 |
68 | if ('bubbleData' in config) {
69 | config.bubbleData = processDataSetsColors(config.bubbleData);
70 | }
71 |
72 | if ('candleData' in config) {
73 | config.candleData = processDataSetsColors(config.candleData);
74 | }
75 |
76 | if ('scatterData' in config) {
77 | config.scatterData = processDataSetsColors(config.scatterData);
78 | }
79 |
80 | if ('backgroundColor' in config) {
81 | config.backgroundColor = processColor(config.backgroundColor);
82 | }
83 |
84 | if ('gridBackgroundColor' in config) {
85 | config.gridBackgroundColor = processColor(config.gridBackgroundColor);
86 | }
87 |
88 | if ('descriptionTextColor' in config) {
89 | config.descriptionTextColor = processColor(config.descriptionTextColor);
90 | }
91 |
92 | if ('infoTextColor' in config) {
93 | config.infoTextColor = processColor(config.infoTextColor);
94 | }
95 |
96 | if ('marker' in config && 'markerColor' in config.marker) {
97 | config.marker.markerColor = processColor(config.marker.markerColor);
98 | }
99 |
100 | if ('marker' in config && 'markerTextColor' in config.marker) {
101 | config.marker.markerTextColor = processColor(config.marker.markerTextColor);
102 | }
103 |
104 | if ('legend' in config && 'textColor' in config.legend) {
105 | config.legend.textColor = processColor(config.legend.textColor);
106 | }
107 |
108 | if ('legend' in config && 'colors' in config.legend) {
109 | config.legend.colors = config.legend.colors.map(color => processColor(color));
110 | }
111 |
112 | if ('xAxis' in config && 'textColor' in config.xAxis) {
113 | config.xAxis.textColor = processColor(config.xAxis.textColor);
114 | }
115 |
116 | if ('xAxis' in config && 'gridColor' in config.xAxis) {
117 | config.xAxis.gridColor = processColor(config.xAxis.gridColor);
118 | }
119 |
120 | if ('xAxis' in config && 'axisLineColor' in config.xAxis) {
121 | config.xAxis.axisLineColor = processColor(config.xAxis.axisLineColor);
122 | }
123 |
124 | if ('xAxis' in config && 'limitLines' in config.xAxis) {
125 | config.xAxis.limitLines = config.xAxis.limitLines.map(function(l) {
126 | if ('lineColor' in l) {
127 | l.lineColor = processColor(l.lineColor);
128 | }
129 | if ('valueTextColor' in l) {
130 | l.valueTextColor = processColor(l.valueTextColor);
131 | }
132 | return l;
133 | });
134 | }
135 |
136 | if ('leftAxis' in config && 'textColor' in config.leftAxis) {
137 | config.leftAxis.textColor = processColor(config.leftAxis.textColor);
138 | }
139 |
140 | if ('leftAxis' in config && 'gridColor' in config.leftAxis) {
141 | config.leftAxis.gridColor = processColor(config.leftAxis.gridColor);
142 | }
143 |
144 | if ('leftAxis' in config && 'axisLineColor' in config.leftAxis) {
145 | config.leftAxis.axisLineColor = processColor(config.leftAxis.axisLineColor);
146 | }
147 |
148 | if ('leftAxis' in config && 'limitLines' in config.leftAxis) {
149 | config.leftAxis.limitLines = config.leftAxis.limitLines.map(function(l) {
150 | if ('lineColor' in l) {
151 | l.lineColor = processColor(l.lineColor);
152 | }
153 | if ('valueTextColor' in l) {
154 | l.valueTextColor = processColor(l.valueTextColor);
155 | }
156 | return l;
157 | });
158 | }
159 |
160 | if ('rightAxis' in config && 'textColor' in config.rightAxis) {
161 | config.rightAxis.textColor = processColor(config.rightAxis.textColor);
162 | }
163 |
164 | if ('rightAxis' in config && 'gridColor' in config.rightAxis) {
165 | config.rightAxis.gridColor = processColor(config.rightAxis.gridColor);
166 | }
167 |
168 | if ('rightAxis' in config && 'axisLineColor' in config.rightAxis) {
169 | config.rightAxis.axisLineColor = processColor(config.rightAxis.axisLineColor);
170 | }
171 |
172 | if ('rightAxis' in config && 'limitLines' in config.rightAxis) {
173 | config.rightAxis.limitLines = config.rightAxis.limitLines.map(function(l) {
174 | if ('lineColor' in l) {
175 | l.lineColor = processColor(l.lineColor);
176 | }
177 | if ('valueTextColor' in l) {
178 | l.valueTextColor = processColor(l.valueTextColor);
179 | }
180 | return l;
181 | });
182 | }
183 |
184 | return config;
185 | };
186 |
--------------------------------------------------------------------------------
/utils/commonProps.js:
--------------------------------------------------------------------------------
1 | import React from 'react';
2 |
3 | export const commonDataSetProps = {
4 | values: React.PropTypes.arrayOf(React.PropTypes.number).isRequired,
5 | label: React.PropTypes.string,
6 | colors: React.PropTypes.arrayOf(React.PropTypes.string),
7 | drawValues: React.PropTypes.bool,
8 | highlightEnabled: React.PropTypes.bool,
9 | valueTextFontName: React.PropTypes.string,
10 | valueTextFontSize: React.PropTypes.number,
11 | valueTextColor: React.PropTypes.string,
12 | axisDependency: React.PropTypes.oneOf(['left', 'right'])
13 | };
14 |
15 | export const globalCommonProps = {
16 | labels: React.PropTypes.arrayOf(React.PropTypes.string).isRequired,
17 | backgroundColor: React.PropTypes.string,
18 | noDataText: React.PropTypes.string,
19 | descriptionText: React.PropTypes.string,
20 | descriptionTextColor: React.PropTypes.string,
21 | descriptionFontName: React.PropTypes.string,
22 | descriptionFontSize: React.PropTypes.number,
23 | descriptionTextPosition: React.PropTypes.shape({
24 | x: React.PropTypes.number,
25 | y: React.PropTypes.number
26 | }),
27 | descriptionTextAlign: React.PropTypes.oneOf([
28 | 'left',
29 | 'center',
30 | 'right',
31 | 'justified'
32 | ]),
33 | infoTextFontName: React.PropTypes.string,
34 | infoTextFontSize: React.PropTypes.number,
35 | infoTextColor: React.PropTypes.string,
36 | drawMarkers: React.PropTypes.bool,
37 | marker: React.PropTypes.shape({
38 | markerColor: React.PropTypes.string.isRequired,
39 | markerTextColor: React.PropTypes.string.isRequired,
40 | markerFontName: React.PropTypes.string,
41 | markerFontSize: React.PropTypes.number,
42 | }),
43 | userInteractionEnabled: React.PropTypes.bool,
44 | dragDecelerationEnabled: React.PropTypes.bool,
45 | dragDecelerationFrictionCoef: React.PropTypes.number,
46 | highlightPerTap: React.PropTypes.bool,
47 | showLegend: React.PropTypes.bool,
48 | legend: React.PropTypes.shape({
49 | textColor: React.PropTypes.string,
50 | textFontName: React.PropTypes.string,
51 | textSize: React.PropTypes.number,
52 | wordWrap: React.PropTypes.bool,
53 | maxSizePercent: React.PropTypes.number,
54 | position: React.PropTypes.oneOf([
55 | 'rightOfChart',
56 | 'rightOfChartCenter',
57 | 'rightOfChartInside',
58 | 'leftOfChart',
59 | 'leftOfChartCenter',
60 | 'leftOfChartInside',
61 | 'belowChartLeft',
62 | 'belowChartRight',
63 | 'belowChartCenter',
64 | 'aboveChartLeft',
65 | 'aboveChartRight',
66 | 'aboveChartCenter',
67 | 'pieChartCenter'
68 | ]),
69 | form: React.PropTypes.oneOf([
70 | 'square',
71 | 'circle',
72 | 'line'
73 | ]),
74 | formSize: React.PropTypes.number,
75 | xEntrySpace: React.PropTypes.number,
76 | yEntrySpace: React.PropTypes.number,
77 | formToTextSpace: React.PropTypes.number,
78 | colors: React.PropTypes.arrayOf(React.PropTypes.string),
79 | labels: React.PropTypes.arrayOf(React.PropTypes.string)
80 | }),
81 | highlightValues: React.PropTypes.arrayOf(React.PropTypes.number),
82 | animation: React.PropTypes.shape({
83 | xAxisDuration: React.PropTypes.number,
84 | yAxisDuration: React.PropTypes.number,
85 | easingOption: React.PropTypes.oneOf([
86 | 'linear',
87 | 'easeInQuad',
88 | 'easeOutQuad',
89 | 'easeInOutQuad',
90 | 'easeInCubic',
91 | 'easeOutCubic',
92 | 'easeInOutCubic',
93 | 'easeInQuart',
94 | 'easeOutQuart',
95 | 'easeInOutQuart',
96 | 'easeInQuint',
97 | 'easeOutQuint',
98 | 'easeInOutQuint',
99 | 'easeInSine',
100 | 'easeOutSine',
101 | 'easeInOutSine',
102 | 'easeInExpo',
103 | 'easeOutExpo',
104 | 'easeInOutExpo',
105 | 'easeInCirc',
106 | 'easeOutCirc',
107 | 'easeInOutCirc',
108 | 'easeInElastic',
109 | 'easeOutElastic',
110 | 'easeInBack',
111 | 'easeOutBack',
112 | 'easeInOutBack',
113 | 'easeInBounce',
114 | 'easeOutBounce',
115 | 'easeInOutBounce'
116 | ])
117 | }),
118 | valueFormatter: React.PropTypes.shape({
119 | type: React.PropTypes.oneOf(['regular', 'abbreviated']),
120 | minimumDecimalPlaces: React.PropTypes.number,
121 | maximumDecimalPlaces: React.PropTypes.number,
122 | numberStyle: React.PropTypes.oneOf([
123 | 'CurrencyAccountingStyle',
124 | 'CurrencyISOCodeStyle',
125 | 'CurrencyPluralStyle',
126 | 'CurrencyStyle',
127 | 'DecimalStyle',
128 | 'NoStyle',
129 | 'OrdinalStyle',
130 | 'PercentStyle',
131 | 'ScientificStyle',
132 | 'SpellOutStyle'
133 | ])
134 | })
135 | };
136 |
137 | export const barLineCommonProps = {
138 | borderColor: React.PropTypes.string,
139 | borderLineWidth: React.PropTypes.number,
140 | drawBorders: React.PropTypes.bool,
141 | minOffset: React.PropTypes.number,
142 | autoScaleMinMax: React.PropTypes.bool,
143 | gridBackgroundColor: React.PropTypes.string,
144 | dragEnabled: React.PropTypes.bool,
145 | scaleXEnabled: React.PropTypes.bool,
146 | scaleYEnabled: React.PropTypes.bool,
147 | pinchZoomEnabled: React.PropTypes.bool,
148 | doubleTapToZoomEnabled: React.PropTypes.bool,
149 | highlightPerDragEnabled: React.PropTypes.bool,
150 | xAxis: React.PropTypes.shape({
151 | enabled: React.PropTypes.bool,
152 | position: React.PropTypes.oneOf([
153 | 'bothSided',
154 | 'bottom',
155 | 'bottomInside',
156 | 'top',
157 | 'topInside'
158 | ]),
159 | labelRotationAngle: React.PropTypes.number,
160 | drawAxisLine: React.PropTypes.bool,
161 | drawGridLines: React.PropTypes.bool,
162 | drawLabels: React.PropTypes.bool,
163 | textColor: React.PropTypes.string,
164 | textSize: React.PropTypes.number,
165 | gridColor: React.PropTypes.string,
166 | gridLineWidth: React.PropTypes.number,
167 | axisLineColor: React.PropTypes.string,
168 | axisLineWidth: React.PropTypes.number,
169 | drawLimitLinesBehindData: React.PropTypes.bool,
170 | gridDashedLine: React.PropTypes.shape({
171 | lineLength: React.PropTypes.number,
172 | spaceLength: React.PropTypes.number,
173 | phase: React.PropTypes.number
174 | }),
175 | limitLines: React.PropTypes.arrayOf(React.PropTypes.shape({
176 | limit: React.PropTypes.number.isRequired,
177 | label: React.PropTypes.string.isRequired,
178 | position: React.PropTypes.oneOf([
179 | 'leftBottom',
180 | 'leftTop',
181 | 'rightBottom',
182 | 'rightTop'
183 | ]),
184 | lineColor: React.PropTypes.string,
185 | lineDashLengths: React.PropTypes.number,
186 | lineWidth: React.PropTypes.number,
187 | lineDashPhase: React.PropTypes.number,
188 | textFontName: React.PropTypes.string,
189 | textSize: React.PropTypes.number,
190 | valueTextColor: React.PropTypes.string,
191 | xOffset: React.PropTypes.number,
192 | yOffset: React.PropTypes.number
193 | })),
194 | avoidFirstLastClippingEnabled: React.PropTypes.bool,
195 | }),
196 | leftAxis: React.PropTypes.shape({
197 | enabled: React.PropTypes.bool,
198 | drawAxisLine: React.PropTypes.bool,
199 | drawGridLines: React.PropTypes.bool,
200 | drawLabels: React.PropTypes.bool,
201 | textColor: React.PropTypes.string,
202 | textSize: React.PropTypes.number,
203 | gridColor: React.PropTypes.string,
204 | gridLineWidth: React.PropTypes.number,
205 | axisLineColor: React.PropTypes.string,
206 | axisLineWidth: React.PropTypes.number,
207 | gridDashedLine: React.PropTypes.shape({
208 | lineLength: React.PropTypes.number,
209 | spaceLength: React.PropTypes.number,
210 | phase: React.PropTypes.number
211 | }),
212 | limitLines: React.PropTypes.arrayOf(React.PropTypes.shape({
213 | limit: React.PropTypes.number.isRequired,
214 | label: React.PropTypes.string.isRequired,
215 | position: React.PropTypes.oneOf([
216 | 'leftBottom',
217 | 'leftTop',
218 | 'rightBottom',
219 | 'rightTop'
220 | ]),
221 | lineColor: React.PropTypes.string,
222 | lineDashLengths: React.PropTypes.number,
223 | lineWidth: React.PropTypes.number,
224 | lineDashPhase: React.PropTypes.number,
225 | textFontName: React.PropTypes.string,
226 | textSize: React.PropTypes.number,
227 | valueTextColor: React.PropTypes.string,
228 | xOffset: React.PropTypes.number,
229 | yOffset: React.PropTypes.number
230 | })),
231 | position: React.PropTypes.oneOf([
232 | 'inside',
233 | 'outside'
234 | ]),
235 | drawLimitLinesBehindData: React.PropTypes.bool,
236 | spaceTop: React.PropTypes.number,
237 | spaceBottom: React.PropTypes.number,
238 | startAtZero: React.PropTypes.bool,
239 | axisMinimum: React.PropTypes.number,
240 | axisMaximum: React.PropTypes.number
241 | }),
242 | rightAxis: React.PropTypes.shape({
243 | enabled: React.PropTypes.bool,
244 | drawAxisLine: React.PropTypes.bool,
245 | drawGridLines: React.PropTypes.bool,
246 | drawLabels: React.PropTypes.bool,
247 | textColor: React.PropTypes.string,
248 | textSize: React.PropTypes.number,
249 | gridColor: React.PropTypes.string,
250 | gridLineWidth: React.PropTypes.number,
251 | axisLineColor: React.PropTypes.string,
252 | axisLineWidth: React.PropTypes.number,
253 | gridDashedLine: React.PropTypes.shape({
254 | lineLength: React.PropTypes.number,
255 | spaceLength: React.PropTypes.number,
256 | phase: React.PropTypes.number
257 | }),
258 | limitLines: React.PropTypes.arrayOf(React.PropTypes.shape({
259 | limit: React.PropTypes.number.isRequired,
260 | label: React.PropTypes.string.isRequired,
261 | position: React.PropTypes.oneOf([
262 | 'leftBottom',
263 | 'leftTop',
264 | 'rightBottom',
265 | 'rightTop'
266 | ]),
267 | lineColor: React.PropTypes.string,
268 | lineDashLengths: React.PropTypes.number,
269 | lineWidth: React.PropTypes.number,
270 | lineDashPhase: React.PropTypes.number,
271 | textFontName: React.PropTypes.string,
272 | textSize: React.PropTypes.number,
273 | valueTextColor: React.PropTypes.string,
274 | xOffset: React.PropTypes.number,
275 | yOffset: React.PropTypes.number
276 | })),
277 | position: React.PropTypes.oneOf([
278 | 'inside',
279 | 'outside'
280 | ]),
281 | drawLimitLinesBehindData: React.PropTypes.bool,
282 | spaceTop: React.PropTypes.number,
283 | spaceBottom: React.PropTypes.number,
284 | startAtZero: React.PropTypes.bool,
285 | axisMinimum: React.PropTypes.number,
286 | axisMaximum: React.PropTypes.number
287 | }),
288 | viewport: React.PropTypes.shape({
289 | left: React.PropTypes.number,
290 | top: React.PropTypes.number,
291 | right: React.PropTypes.number,
292 | bottom: React.PropTypes.number
293 | })
294 | };
295 |
296 | export const pieRadarCommonProps = {
297 | rotationEnabled: React.PropTypes.bool,
298 | rotationAngle: React.PropTypes.number,
299 | rotationWithTwoFingers: React.PropTypes.bool,
300 | minOffset: React.PropTypes.number
301 | };
302 |
--------------------------------------------------------------------------------