 48 |
49 | #### Contact
50 |
51 | [Ivan Dokmanić](mailto:ivan[dot]dokmanic[at]epfl[dot]ch)
48 |
49 | #### Contact
50 |
51 | [Ivan Dokmanić](mailto:ivan[dot]dokmanic[at]epfl[dot]ch)  64 |
65 | Comparison of the conventional Max-SINR and Rake-Max-SINR beamformer on a real
66 | speech sample. Spectrograms of (A) clean signal of interest, (B) signal
67 | corrupted by an interferer and additive white Gaussian noise at the microphone
68 | input, outputs of (C) conventional Max-SINR and (D) Rake-Max- SINR beamformers.
69 | Time naturally goes from left to right, and frequency increases from zero at
70 | the bottom up to Fs/2. To highlight the improvement of Rake-Max-SINR over
71 | Max-SINR, we blow-up three parts of the spectrograms in the lower part of the
72 | figure. The boxes and the corresponding part of the original spectrogram are
73 | numbered in (A). The numbering is the same but omitted in the rest of the
74 | figure for clarity.
75 |
76 | The corresponding sound samples:
77 |
78 | * [A](https://github.com/LCAV/AcousticRakeReceiver/raw/master/samples/singing_8000.wav) Desired signal.
79 | * [B](https://github.com/LCAV/AcousticRakeReceiver/raw/master/output_samples/input_mic.wav) Simulated microphone input signal.
80 | * [C](https://github.com/LCAV/AcousticRakeReceiver/raw/master/output_samples/output_maxsinr.wav) Output of conventional Max-SINR beamformer.
81 | * [D](https://github.com/LCAV/AcousticRakeReceiver/raw/master/output_samples/output_rake-maxsinr.wav) Output of proposed Rake-Max-SINR beamformer.
82 |
83 | ### Beam Patterns
84 |
85 |
64 |
65 | Comparison of the conventional Max-SINR and Rake-Max-SINR beamformer on a real
66 | speech sample. Spectrograms of (A) clean signal of interest, (B) signal
67 | corrupted by an interferer and additive white Gaussian noise at the microphone
68 | input, outputs of (C) conventional Max-SINR and (D) Rake-Max- SINR beamformers.
69 | Time naturally goes from left to right, and frequency increases from zero at
70 | the bottom up to Fs/2. To highlight the improvement of Rake-Max-SINR over
71 | Max-SINR, we blow-up three parts of the spectrograms in the lower part of the
72 | figure. The boxes and the corresponding part of the original spectrogram are
73 | numbered in (A). The numbering is the same but omitted in the rest of the
74 | figure for clarity.
75 |
76 | The corresponding sound samples:
77 |
78 | * [A](https://github.com/LCAV/AcousticRakeReceiver/raw/master/samples/singing_8000.wav) Desired signal.
79 | * [B](https://github.com/LCAV/AcousticRakeReceiver/raw/master/output_samples/input_mic.wav) Simulated microphone input signal.
80 | * [C](https://github.com/LCAV/AcousticRakeReceiver/raw/master/output_samples/output_maxsinr.wav) Output of conventional Max-SINR beamformer.
81 | * [D](https://github.com/LCAV/AcousticRakeReceiver/raw/master/output_samples/output_rake-maxsinr.wav) Output of proposed Rake-Max-SINR beamformer.
82 |
83 | ### Beam Patterns
84 |
85 | 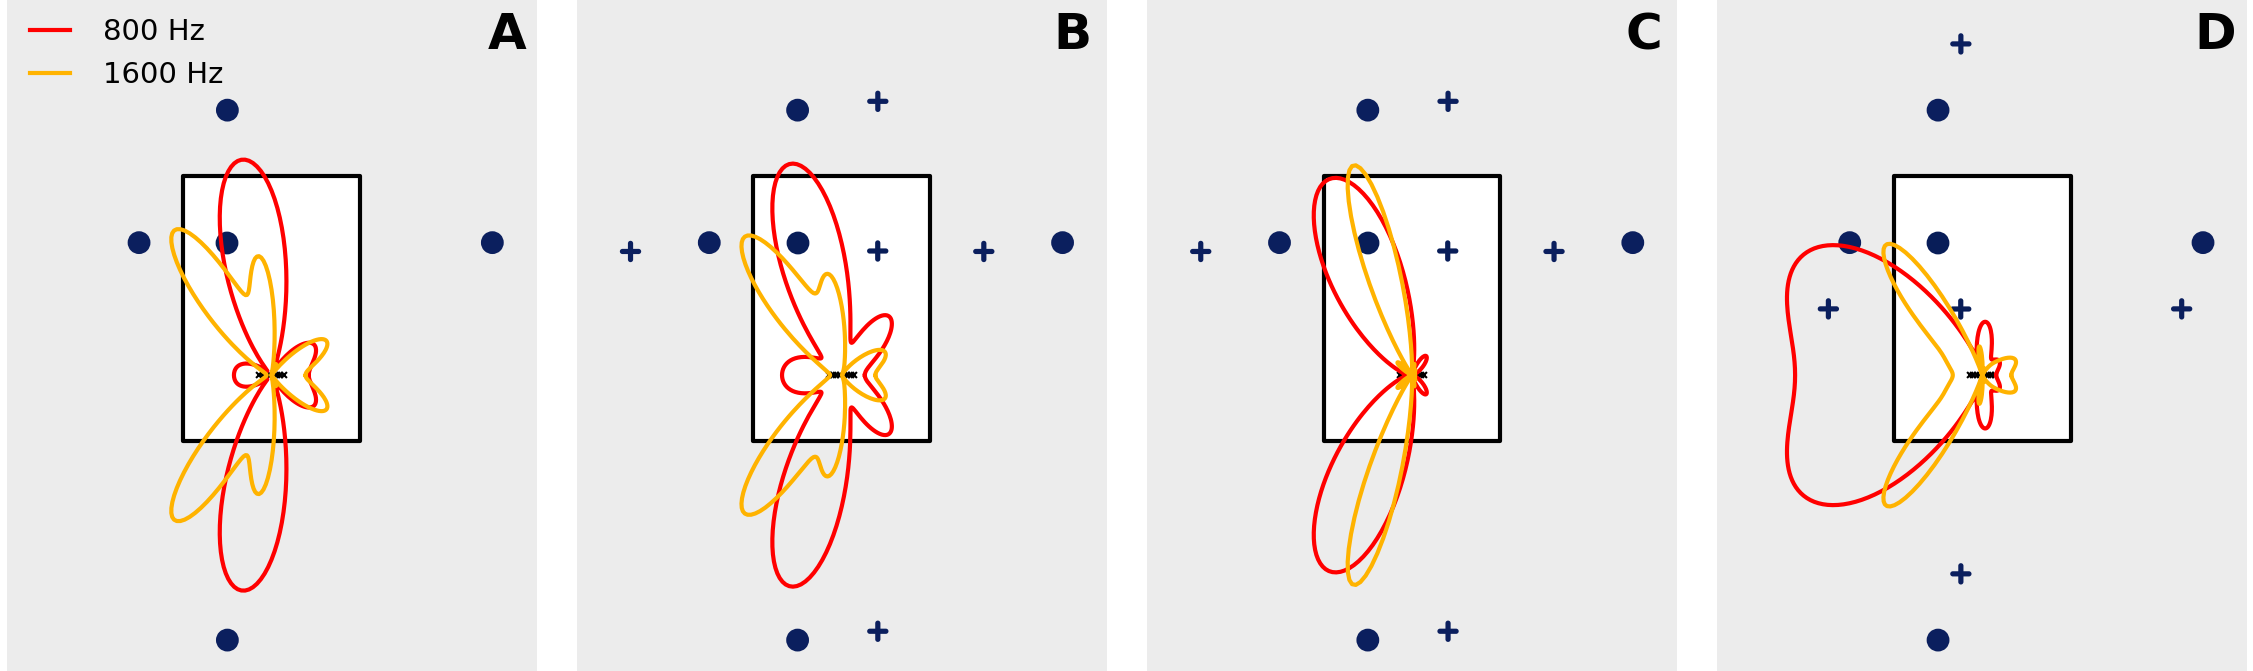 86 |
87 | Beam patterns in different scenarios. The rectangular room is 4 by 6 metres and
88 | contains a source of interest (•) and an interferer (✭) ((B), (C), (D) only).
89 | The first order image sources are also displayed. The weight computation of the
90 | beamformer includes the direct source and the first order image sources of both
91 | desired source and interferer (when applicable). (A) Rake-Max-SINR, no
92 | interferer, (B) Rake-Max-SINR, one interferer, (C) Rake-Max-UDR, one
93 | interferer, (D) Rake-Max-SINR, interferer is in direct path.
94 |
95 | Dependencies
96 | ------------
97 |
98 | * A working distribution of [Python 2.7](https://www.python.org/downloads/).
99 | * The code relies heavily on [Numpy](http://www.numpy.org/), [Scipy](http://www.scipy.org/), and [matplotlib](http://matplotlib.org).
100 | * We use the distribution [anaconda](https://store.continuum.io/cshop/anaconda/) to simplify the setup of the environment.
101 |
102 | ### PESQ Tool
103 |
104 | Download the [source files](http://www.itu.int/rec/T-REC-P.862-200511-I!Amd2/en) of the ITU P.862
105 | compliance tool from the ITU website.
106 |
107 | #### Unix compilation (Linux/Mac OS X)
108 |
109 | Execute the following sequence of commands to get to the source code.
110 |
111 | mkdir PESQ
112 | cd PESQ
113 | wget 'https://www.itu.int/rec/dologin_pub.asp?lang=e&id=T-REC-P.862-200511-I!Amd2!SOFT-ZST-E&type=items'
114 | unzip dologin_pub.asp\?lang\=e\&id\=T-REC-P.862-200511-I\!Amd2\!SOFT-ZST-E\&type\=items
115 | cd Software
116 | unzip 'P862_annex_A_2005_CD wav final.zip'
117 | cd P862_annex_A_2005_CD/source/
118 |
119 | In the `Software/P862_annex_A_2005_CD/source/` directory, create a file called `Makefile` and copy
120 | the following into it.
121 |
122 | CC=gcc
123 | CFLAGS=-O2
124 |
125 | OBJS=dsp.o pesqdsp.o pesqio.o pesqmod.o pesqmain.o
126 | DEPS=dsp.h pesq.h pesqpar.h
127 |
128 | %.o: %.c $(DEPS)
129 | $(CC) -c -o $@ $< $(CFLAGS)
130 |
131 | pesq: $(OBJS)
132 | $(CC) -o $@ $^ $(CFLAGS)
133 |
134 | .PHONY : clean
135 | clean :
136 | -rm pesq $(OBJS)
137 |
138 | Execute compilation by typing this.
139 |
140 | make pesq
141 |
142 | Finally move the `pesq` binary to `
86 |
87 | Beam patterns in different scenarios. The rectangular room is 4 by 6 metres and
88 | contains a source of interest (•) and an interferer (✭) ((B), (C), (D) only).
89 | The first order image sources are also displayed. The weight computation of the
90 | beamformer includes the direct source and the first order image sources of both
91 | desired source and interferer (when applicable). (A) Rake-Max-SINR, no
92 | interferer, (B) Rake-Max-SINR, one interferer, (C) Rake-Max-UDR, one
93 | interferer, (D) Rake-Max-SINR, interferer is in direct path.
94 |
95 | Dependencies
96 | ------------
97 |
98 | * A working distribution of [Python 2.7](https://www.python.org/downloads/).
99 | * The code relies heavily on [Numpy](http://www.numpy.org/), [Scipy](http://www.scipy.org/), and [matplotlib](http://matplotlib.org).
100 | * We use the distribution [anaconda](https://store.continuum.io/cshop/anaconda/) to simplify the setup of the environment.
101 |
102 | ### PESQ Tool
103 |
104 | Download the [source files](http://www.itu.int/rec/T-REC-P.862-200511-I!Amd2/en) of the ITU P.862
105 | compliance tool from the ITU website.
106 |
107 | #### Unix compilation (Linux/Mac OS X)
108 |
109 | Execute the following sequence of commands to get to the source code.
110 |
111 | mkdir PESQ
112 | cd PESQ
113 | wget 'https://www.itu.int/rec/dologin_pub.asp?lang=e&id=T-REC-P.862-200511-I!Amd2!SOFT-ZST-E&type=items'
114 | unzip dologin_pub.asp\?lang\=e\&id\=T-REC-P.862-200511-I\!Amd2\!SOFT-ZST-E\&type\=items
115 | cd Software
116 | unzip 'P862_annex_A_2005_CD wav final.zip'
117 | cd P862_annex_A_2005_CD/source/
118 |
119 | In the `Software/P862_annex_A_2005_CD/source/` directory, create a file called `Makefile` and copy
120 | the following into it.
121 |
122 | CC=gcc
123 | CFLAGS=-O2
124 |
125 | OBJS=dsp.o pesqdsp.o pesqio.o pesqmod.o pesqmain.o
126 | DEPS=dsp.h pesq.h pesqpar.h
127 |
128 | %.o: %.c $(DEPS)
129 | $(CC) -c -o $@ $< $(CFLAGS)
130 |
131 | pesq: $(OBJS)
132 | $(CC) -o $@ $^ $(CFLAGS)
133 |
134 | .PHONY : clean
135 | clean :
136 | -rm pesq $(OBJS)
137 |
138 | Execute compilation by typing this.
139 |
140 | make pesq
141 |
142 | Finally move the `pesq` binary to `
Acoustic Rake Receiver by Ivan Dokmanić, Robin Scheibler, Martin Vetterli is licensed under a Creative Commons Attribution-NonCommercial-ShareAlike 4.0 International License.
Based on a work at https://github.com/LCAV/AcousticRakeReceiver. 219 | 220 | -------------------------------------------------------------------------------- /Room.py: -------------------------------------------------------------------------------- 1 | 2 | import numpy as np 3 | 4 | import beamforming as bf 5 | from SoundSource import SoundSource 6 | 7 | import constants 8 | 9 | ''' 10 | Room 11 | A room geometry is defined by all the sources and all their images 12 | ''' 13 | 14 | class Room(object): 15 | 16 | def __init__( 17 | self, 18 | corners, 19 | Fs, 20 | t0=0., 21 | absorption=1., 22 | max_order=1, 23 | sigma2_awgn=None, 24 | sources=None, 25 | mics=None): 26 | 27 | # make sure we have an ndarray of the right size 28 | corners = np.array(corners) 29 | if (corners.ndim != 2): 30 | raise NameError('Room corners is a 2D array.') 31 | 32 | # make sure the corners are anti-clockwise 33 | if (self.area(corners) <= 0): 34 | raise NameError('Room corners must be anti-clockwise') 35 | 36 | self.corners = corners 37 | self.dim = corners.shape[0] 38 | 39 | # sampling frequency and time offset 40 | self.Fs = Fs 41 | self.t0 = t0 42 | 43 | # circular wall vectors (counter clockwise) 44 | self.walls = self.corners - \ 45 | self.corners[:, xrange(-1, corners.shape[1] - 1)] 46 | 47 | # compute normals (outward pointing) 48 | self.normals = self.walls[[1, 0], :]/np.linalg.norm(self.walls, axis=0)[np.newaxis,:] 49 | self.normals[1, :] *= -1; 50 | 51 | # list of attenuation factors for the wall reflections 52 | absorption = np.array(absorption, dtype='float64') 53 | if (absorption.ndim == 0): 54 | self.absorption = absorption * np.ones(self.corners.shape[1]) 55 | elif (absorption.ndim > 1 or self.corners.shape[1] != len(absorption)): 56 | raise NameError('Absorption and corner must be the same size') 57 | else: 58 | self.absorption = absorption 59 | 60 | # a list of sources 61 | if (sources is None): 62 | self.sources = [] 63 | elif (sources is list): 64 | self.sources = sources 65 | else: 66 | raise NameError('Room needs a source or list of sources.') 67 | 68 | # a microphone array 69 | if (mics is not None): 70 | self.micArray = None 71 | else: 72 | self.micArray = mics 73 | 74 | # a maximum orders for image source computation 75 | self.max_order = max_order 76 | 77 | # pre-compute RIR if needed 78 | if (len(self.sources) > 0 and self.micArray is not None): 79 | self.compute_RIR() 80 | else: 81 | self.rir = [] 82 | 83 | # ambiant additive white gaussian noise level 84 | self.sigma2_awgn = sigma2_awgn 85 | 86 | 87 | def plot(self, img_order=None, freq=None, **kwargs): 88 | 89 | import matplotlib 90 | from matplotlib.patches import Circle, Wedge, Polygon 91 | from matplotlib.collections import PatchCollection 92 | import matplotlib.pyplot as plt 93 | 94 | # get current figure and axis 95 | fig = plt.gcf() 96 | ax = plt.gca() 97 | 98 | # we always want equal aspect ratio 99 | ax.set_aspect('equal') 100 | 101 | # set the properties of the plot 102 | for key in kwargs: 103 | plt.setp(ax, key, kwargs[key]) 104 | 105 | # draw room 106 | polygons = [Polygon(self.corners.T, True)] 107 | p = PatchCollection(polygons, cmap=matplotlib.cm.jet, 108 | facecolor=np.array([1,1,1]), edgecolor=np.array([0,0,0])) 109 | ax.add_collection(p) 110 | 111 | # draw the microphones 112 | if (self.micArray is not None): 113 | for mic in self.micArray.R.T: 114 | ax.scatter(mic[0], mic[1], 115 | marker='x', linewidth=0.5, s=2, c='k') 116 | 117 | # draw the beam pattern of the beamformer if requested (and 118 | # available) 119 | if freq is not None \ 120 | and type(self.micArray) is bf.Beamformer \ 121 | and self.micArray.weights is not None: 122 | 123 | freq = np.array(freq) 124 | if freq.ndim is 0: 125 | freq = np.array([freq]) 126 | 127 | # define a new set of colors for the beam patterns 128 | newmap = plt.get_cmap('autumn') 129 | desat = 0.7 130 | ax.set_color_cycle([newmap(k) for k in desat*np.linspace(0,1,len(freq))]) 131 | 132 | 133 | phis = np.arange(360) * 2 * np.pi / 360. 134 | newfreq = np.zeros(freq.shape) 135 | H = np.zeros((len(freq), len(phis)), dtype=complex) 136 | for i,f in enumerate(freq): 137 | newfreq[i], H[i] = self.micArray.response(phis, f) 138 | 139 | # normalize max amplitude to one 140 | H = np.abs(H)**2/np.abs(H).max()**2 141 | 142 | # a normalization factor according to room size 143 | norm = np.linalg.norm( 144 | (self.corners - self.micArray.center), 145 | axis=0).max() 146 | 147 | # plot all the beam patterns 148 | i = 0 149 | for f,h in zip(newfreq, H): 150 | x = np.cos(phis) * h * norm + self.micArray.center[0, 0] 151 | y = np.sin(phis) * h * norm + self.micArray.center[1, 0] 152 | l = ax.plot(x, y, '-', linewidth=1.0) 153 | #lbl = '%.2f' % f 154 | #i0 = i*360/len(freq) 155 | #ax.text(x[i0], y[i0], lbl, color=plt.getp(l[0], 'color')) 156 | #i += 1 157 | 158 | #ax.legend(freq) 159 | 160 | # define some markers for different sources and colormap for damping 161 | markers = ['o', '$\mathbf{+}$', '*', 'v', 's', '.'] 162 | cmap = plt.get_cmap('YlGnBu') 163 | # draw the scatter of images 164 | for i, source in enumerate(self.sources): 165 | # draw source 166 | ax.scatter( 167 | source.position[0], 168 | source.position[1], 169 | c=cmap(1.), 170 | s=20, 171 | marker=markers[ 172 | i % 173 | len(markers)], 174 | edgecolor=cmap(1.)) 175 | #ax.text(source.position[0]+0.1, source.position[1]+0.1, str(i)) 176 | 177 | # draw images 178 | if (img_order is None): 179 | img_order = self.max_order 180 | for o in xrange(img_order): 181 | # map the damping to a log scale (mapping 1 to 1) 182 | val = (np.log2(source.damping[o]) + 10.) / 10. 183 | # plot the images 184 | ax.scatter(source.images[o][0, :], source.images[o][1,:], \ 185 | c=cmap(val), s=20, 186 | marker=markers[i % len(markers)], edgecolor=cmap(val)) 187 | 188 | # keep axis equal, or the symmetry is lost 189 | #ax.axis('equal') 190 | 191 | def plotRIR(self): 192 | 193 | if self.rir == None: 194 | self.compute_RIR() 195 | 196 | import matplotlib.pyplot as plt 197 | 198 | M = self.micArray.M 199 | S = len(self.sources) 200 | for r in xrange(M): 201 | for s in xrange(S): 202 | h = self.rir[r][s] 203 | plt.subplot(M, S, r*S + s + 1) 204 | plt.plot(np.arange(len(h)) / float(self.Fs), h) 205 | plt.title('RIR: mic'+str(r)+' source'+str(s)) 206 | if r == M-1: 207 | plt.xlabel('Time [s]') 208 | 209 | 210 | def addMicrophoneArray(self, micArray): 211 | self.micArray = micArray 212 | 213 | def addSource(self, position, signal=None, delay=0): 214 | 215 | # generate first order images 216 | i, d = self.firstOrderImages(np.array(position)) 217 | images = [i] 218 | damping = [d] 219 | 220 | # generate all higher order images up to max_order 221 | o = 1 222 | while o < self.max_order: 223 | # generate all images of images of previous order 224 | img = np.zeros((self.dim, 0)) 225 | dmp = np.array([]) 226 | for si, sd in zip(images[o - 1].T, damping[o - 1]): 227 | i, d = self.firstOrderImages(si) 228 | img = np.concatenate((img, i), axis=1) 229 | dmp = np.concatenate((dmp, d * sd)) 230 | 231 | # remove duplicates 232 | ordering = np.lexsort(img) 233 | img = img[:, ordering] 234 | dmp = dmp[ordering] 235 | diff = np.diff(img, axis=1) 236 | ui = np.ones(img.shape[1], 'bool') 237 | ui[1:] = (diff != 0).any(axis=0) 238 | 239 | # add to array of images 240 | images.append(img[:, ui]) 241 | damping.append(dmp[ui]) 242 | 243 | # next order 244 | o += 1 245 | 246 | # add a new source to the source list 247 | self.sources.append( 248 | SoundSource( 249 | position, 250 | images=images, 251 | damping=damping, 252 | signal=signal, 253 | delay=delay)) 254 | 255 | def firstOrderImages(self, source_position): 256 | 257 | # projected length onto normal 258 | ip = np.sum( 259 | self.normals * (self.corners - source_position[:, np.newaxis]), axis=0) 260 | 261 | # projected vector from source to wall 262 | d = ip * self.normals 263 | 264 | # compute images points, positivity is to get only the reflections 265 | # outside the room 266 | images = source_position[:, np.newaxis] + 2 * d[:, ip > 0] 267 | 268 | # collect absorption factors of reflecting walls 269 | damping = self.absorption[ip > 0] 270 | 271 | return images, damping 272 | 273 | def compute_RIR(self, c=constants.c, window=False): 274 | ''' 275 | Compute the room impulse response between every source and microphone 276 | ''' 277 | self.rir = [] 278 | 279 | for mic in self.micArray.R.T: 280 | 281 | h = [] 282 | 283 | for source in self.sources: 284 | 285 | # stack source and all images 286 | img = source.getImages(self.max_order) 287 | dmp = source.getDamping(self.max_order) 288 | 289 | # compute the distance 290 | dist = np.sqrt(np.sum((img - mic[:, np.newaxis]) ** 2, axis=0)) 291 | time = dist / c + self.t0 292 | alpha = dmp/(4.*np.pi*dist) 293 | 294 | # the number of samples needed 295 | N = np.ceil((time.max() + self.t0) * self.Fs) 296 | 297 | t = np.arange(N)/float(self.Fs) 298 | ir = np.zeros(t.shape) 299 | 300 | for ti, ai in zip(time, alpha): 301 | ir += np.sinc(self.Fs*(t-ti))*ai 302 | 303 | h.append(ir) 304 | 305 | self.rir.append(h) 306 | 307 | def simulate(self, recompute_rir=False): 308 | ''' 309 | Simulate the microphone signal at every microphone in the array 310 | ''' 311 | 312 | # import convolution routine 313 | from scipy.signal import fftconvolve 314 | 315 | # Throw an error if we are missing some hardware in the room 316 | if (len(self.sources) is 0): 317 | raise NameError('There are no sound sources in the room.') 318 | if (self.micArray is None): 319 | raise NameError('There is no microphone in the room.') 320 | 321 | # compute RIR if necessary 322 | if len(self.rir) == 0 or recompute_rir: 323 | self.compute_RIR() 324 | 325 | # number of mics and sources 326 | M = self.micArray.M 327 | S = len(self.sources) 328 | 329 | # compute the maximum signal length 330 | from itertools import product 331 | max_len_rir = np.array([len(self.rir[i][j]) 332 | for i, j in product(xrange(M), xrange(S))]).max() 333 | f = lambda i: len( 334 | self.sources[i].signal) + np.floor(self.sources[i].delay * self.Fs) 335 | max_sig_len = np.array([f(i) for i in xrange(S)]).max() 336 | L = max_len_rir + max_sig_len - 1 337 | if L%2 == 1: L += 1 338 | 339 | # the array that will receive all the signals 340 | self.micArray.signals = np.zeros((M, L)) 341 | 342 | # compute the signal at every microphone in the array 343 | for m in np.arange(M): 344 | rx = self.micArray.signals[m] 345 | for s in np.arange(S): 346 | sig = self.sources[s].signal 347 | if sig is None: 348 | continue 349 | d = np.floor(self.sources[s].delay * self.Fs) 350 | h = self.rir[m][s] 351 | rx[d:d + len(sig) + len(h) - 1] += fftconvolve(h, sig) 352 | 353 | # add white gaussian noise if necessary 354 | if self.sigma2_awgn is not None: 355 | rx += np.sqrt(self.sigma2_awgn)*np.random.normal(0., 1., rx.shape) 356 | 357 | 358 | def dSNR(self, x, source=0): 359 | ''' direct Signal-to-Noise Ratio''' 360 | 361 | if source >= len(self.sources): 362 | raise NameError('No such source') 363 | 364 | if self.sources[source].signal is None: 365 | raise NameError('No signal defined for source ' + str(source)) 366 | 367 | if self.sigma2_awgn is None: 368 | return float('inf') 369 | 370 | x = np.array(x) 371 | 372 | sigma2_s = np.mean(self.sources[0].signal**2) 373 | 374 | d2 = np.sum((x - self.sources[source].position)**2) 375 | 376 | return sigma2_s/self.sigma2_awgn/(16*np.pi**2*d2) 377 | 378 | 379 | @classmethod 380 | def shoeBox2D(cls, p1, p2, Fs, **kwargs): 381 | ''' 382 | Create a new Shoe Box room geometry. 383 | Arguments: 384 | p1: the lower left corner of the room 385 | p2: the upper right corner of the room 386 | max_order: the maximum order of image sources desired. 387 | ''' 388 | 389 | # compute room characteristics 390 | corners = np.array( 391 | [[p1[0], p2[0], p2[0], p1[0]], [p1[1], p1[1], p2[1], p2[1]]]) 392 | 393 | return Room(corners, Fs, **kwargs) 394 | 395 | @classmethod 396 | def area(cls, corners): 397 | ''' 398 | Compute the area of a 2D room represented by its corners 399 | ''' 400 | x = corners[0, :] - corners[0, xrange(-1, corners.shape[1]-1)] 401 | y = corners[1, :] + corners[1, xrange(-1, corners.shape[1]-1)] 402 | return -0.5 * (x * y).sum() 403 | 404 | @classmethod 405 | def isAntiClockwise(cls, corners): 406 | ''' 407 | Return true if the corners of the room are arranged anti-clockwise 408 | ''' 409 | return (cls.area(corners) > 0) 410 | 411 | @classmethod 412 | def ccw3p(cls, p): 413 | ''' 414 | Argument: p, a (3,2)-ndarray whose rows are the vertices of a 2D triangle 415 | Returns 416 | 1: if triangle vertices are counter-clockwise 417 | -1: if triangle vertices are clock-wise 418 | 0: if vertices are colinear 419 | 420 | Ref: https://en.wikipedia.org/wiki/Curve_orientation 421 | ''' 422 | if (p.shape != (2, 3)): 423 | raise NameError( 424 | 'Room.ccw3p is for three 2D points, input is 3x2 ndarray') 425 | D = (p[0, 1] - p[0, 0]) * (p[1, 2] - p[1, 0]) - \ 426 | (p[0, 2] - p[0, 0]) * (p[1, 1] - p[1, 0]) 427 | 428 | if (np.abs(D) < constants.eps): 429 | return 0 430 | elif (D > 0): 431 | return 1 432 | else: 433 | return -1 434 | -------------------------------------------------------------------------------- /SoundSource.py: -------------------------------------------------------------------------------- 1 | 2 | import numpy as np 3 | 4 | ''' 5 | A class to represent sound sources 6 | ''' 7 | 8 | 9 | class SoundSource(object): 10 | 11 | def __init__( 12 | self, 13 | position, 14 | images=None, 15 | damping=None, 16 | signal=None, 17 | delay=0): 18 | 19 | self.position = np.array(position) 20 | 21 | if (images is None): 22 | # set to empty list if nothing provided 23 | self.images = [] 24 | self.damping = [] 25 | 26 | else: 27 | # save list if provided 28 | self.images = images 29 | 30 | # we need to have damping factors for every image 31 | if (damping is None): 32 | # set to one if not set 33 | self.damping = [] 34 | for o in images: 35 | self.damping.append(np.ones(o.shape)) 36 | else: 37 | # check damping is the same size as images 38 | if (len(damping) != len(images)): 39 | raise NameError('Images and damping must have same shape') 40 | for i in range(len(damping)): 41 | if (damping[i].shape[0] != images[i].shape[1]): 42 | raise NameError( 43 | 'Images and damping must have same shape') 44 | 45 | # copy over if correct 46 | self.damping = damping 47 | 48 | # The sound signal of the source 49 | self.signal = signal 50 | self.delay = delay 51 | 52 | def addSignal(signal): 53 | 54 | self.signal = signal 55 | 56 | def getImages(self, max_order=None, max_distance=None, n_nearest=None, ref_point=None): 57 | 58 | # TO DO: Add also n_strongest 59 | 60 | # TO DO: Make some of these thing exclusive (e.g. can't have n_nearest 61 | # AND n_strongest (although could have max_order AND n_nearest) 62 | 63 | # TO DO: Make this more efficient if bottleneck (unlikely) 64 | 65 | if (max_order is None): 66 | max_order = len(self.images) 67 | 68 | # stack source and all images 69 | img = np.array([self.position]).T 70 | for o in xrange(max_order): 71 | img = np.concatenate((img, self.images[o]), axis=1) 72 | 73 | if (n_nearest is not None): 74 | dist = np.sum((img - ref_point)**2, axis=0) 75 | i_nearest = dist.argsort()[0:n_nearest] 76 | img = img[:,i_nearest] 77 | 78 | return img 79 | 80 | def getDamping(self, max_order=None): 81 | if (max_order is None): 82 | max_order = len(images) 83 | 84 | # stack source and all images 85 | dmp = np.array([1.]) 86 | for o in xrange(max_order): 87 | dmp = np.concatenate((dmp, self.damping[o])) 88 | 89 | return dmp 90 | -------------------------------------------------------------------------------- /beamforming.py: -------------------------------------------------------------------------------- 1 | import numpy as np 2 | from scipy.linalg import pinv, eig, inv 3 | from time import sleep 4 | 5 | import constants 6 | 7 | import windows 8 | import stft 9 | 10 | 11 | #========================================================================= 12 | # Free (non-class-member) functions related to beamformer design 13 | #========================================================================= 14 | 15 | 16 | def H(A, **kwargs): 17 | '''Returns the conjugate (Hermitian) transpose of a matrix.''' 18 | 19 | return np.transpose(A, **kwargs).conj() 20 | 21 | def sumcols(A): 22 | '''Sums the columns of a matrix (np.array). The output is a 2D np.array 23 | of dimensions M x 1.''' 24 | 25 | return np.sum(A, axis=1, keepdims=1) 26 | 27 | 28 | def mdot(*args): 29 | '''Left-to-right associative matrix multiplication of multiple 2D 30 | ndarrays''' 31 | 32 | ret = args[0] 33 | for a in args[1:]: 34 | ret = np.dot(ret,a) 35 | 36 | return ret 37 | 38 | 39 | def distance(X, Y): 40 | ''' 41 | X and Y are DxN ndarray containing N D-dimensional vectors 42 | distance(X,Y) computes the distance matrix E where E[i,j] = sqrt(sum((X[:,i]-Y[:,j])**2)) 43 | ''' 44 | # Assume X, Y are arrays, *not* matrices 45 | X = np.array(X) 46 | Y = np.array(Y) 47 | 48 | return np.sqrt((X[0,:,np.newaxis]-Y[0,:])**2 + (X[1,:,np.newaxis]-Y[1,:])**2) 49 | 50 | 51 | def unit_vec2D(phi): 52 | return np.array([[np.cos(phi), np.sin(phi)]]).T 53 | 54 | 55 | def linear2DArray(center, M, phi, d): 56 | u = unit_vec2D(phi) 57 | return np.array(center)[:, np.newaxis] + d * \ 58 | (np.arange(M)[np.newaxis, :] - (M - 1.) / 2.) * u 59 | 60 | 61 | def circular2DArray(center, M, phi0, radius): 62 | phi = np.arange(M) * 2. * np.pi / M 63 | return np.array(center)[:, np.newaxis] + radius * \ 64 | np.vstack((np.cos(phi + phi0), np.sin(phi + phi0))) 65 | 66 | 67 | def fir_approximation_ls(weights, T, n1, n2): 68 | 69 | freqs_plus = np.array(weights.keys())[:, np.newaxis] 70 | freqs = np.vstack([freqs_plus, 71 | -freqs_plus]) 72 | omega = 2 * np.pi * freqs 73 | omega_discrete = omega * T 74 | 75 | n = np.arange(n1, n2) 76 | 77 | # Create the DTFT transform matrix corresponding to a discrete set of 78 | # frequencies and the FIR filter indices 79 | F = np.exp(-1j * omega_discrete * n) 80 | print pinv(F) 81 | 82 | w_plus = np.array(weights.values())[:, :, 0] 83 | w = np.vstack([w_plus, 84 | w_plus.conj()]) 85 | 86 | return pinv(F).dot(w) 87 | 88 | 89 | #========================================================================= 90 | # Classes (microphone array and beamformer related) 91 | #========================================================================= 92 | 93 | 94 | class MicrophoneArray(object): 95 | 96 | """Microphone array class.""" 97 | 98 | def __init__(self, R, Fs): 99 | self.dim = R.shape[0] # are we in 2D or in 3D 100 | self.M = R.shape[1] # number of microphones 101 | self.R = R # array geometry 102 | 103 | self.Fs = Fs # sampling frequency of microphones 104 | 105 | self.signals = None 106 | 107 | self.center = np.mean(R, axis=1, keepdims=True) 108 | 109 | 110 | def to_wav(self, filename, mono=False, norm=False, type=float): 111 | ''' 112 | Save all the signals to wav files 113 | ''' 114 | from scipy.io import wavfile 115 | 116 | if mono is True: 117 | signal = self.signals[self.M/2] 118 | else: 119 | signal = self.signals.T # each column is a channel 120 | 121 | if type is float: 122 | bits = None 123 | elif type is np.int8: 124 | bits = 8 125 | elif type is np.int16: 126 | bits = 16 127 | elif type is np.int32: 128 | bits = 32 129 | elif type is np.int64: 130 | bits = 64 131 | else: 132 | raise NameError('No such type.') 133 | 134 | if norm is True: 135 | from utilities import normalize 136 | signal = normalize(signal, bits=bits) 137 | 138 | signal = np.array(signal, dtype=type) 139 | 140 | wavfile.write(filename, self.Fs, signal) 141 | 142 | @classmethod 143 | def linear2D(cls, Fs, center, M, phi, d): 144 | return MicrophoneArray(linear2DArray(center, M, phi, d), Fs) 145 | 146 | @classmethod 147 | def circular2D(cls, Fs, center, M, phi, radius): 148 | return MicrophoneArray(circular2DArray(center, M, phi, radius), Fs) 149 | 150 | 151 | class Beamformer(MicrophoneArray): 152 | 153 | """Beamformer class. At some point, in some nice way, the design methods 154 | should also go here. Probably with generic arguments.""" 155 | 156 | def __init__(self, R, Fs): 157 | MicrophoneArray.__init__(self, R, Fs) 158 | 159 | # All of these will be defined in setProcessing 160 | self.processing = None # Time or frequency domain 161 | self.N = None 162 | self.L = None 163 | self.hop = None 164 | self.zpf = None 165 | self.zpb = None 166 | 167 | self.frequencies = None # frequencies of weights are defined in processing 168 | 169 | # weights will be computed later, the array is of shape (M, N/2+1) 170 | self.weights = None 171 | 172 | 173 | def setProcessing(self, processing, *args): 174 | """ Setup the processing type and parameters """ 175 | 176 | self.processing = processing 177 | 178 | if processing == 'FrequencyDomain': 179 | self.L = args[0] # frame size 180 | if self.L % 2 is not 0: self.L += 1 # ensure even length 181 | self.hop = args[1] # hop between two successive frames 182 | self.zpf = args[2] # zero-padding front 183 | self.zpb = args[3] # zero-padding back 184 | self.N = self.L + self.zpf + self.zpb 185 | if self.N % 2 is not 0: # ensure even length 186 | self.N += 1 187 | self.zpb += 1 188 | elif processing == 'TimeDomain': 189 | self.N = args[0] # filter length 190 | if self.N % 2 is not 0: self.N += 1 # ensure even length 191 | elif processing == 'Total': 192 | self.N = self.signals.shape[1] 193 | else: 194 | raise NameError(processing + ': No such type of processing') 195 | 196 | # for now only support equally spaced frequencies 197 | self.frequencies = np.arange(0, self.N/2+1)/float(self.N)*float(self.Fs) 198 | 199 | def __add__(self, y): 200 | """ Concatenates two beamformers together """ 201 | 202 | return Beamformer(np.concatenate((self.R, y.R), axis=1), self.Fs) 203 | 204 | 205 | # def steering_vector_2D_ff(self, frequency, phi, attn=False): 206 | # phi = np.array([phi]).reshape(phi.size) 207 | # omega = 2*np.pi*frequency 208 | 209 | # return np.exp(-1j*omega*) 210 | 211 | 212 | def steering_vector_2D(self, frequency, phi, dist, attn=False): 213 | 214 | phi = np.array([phi]).reshape(phi.size) 215 | 216 | # Assume phi and dist are measured from the array's center 217 | X = dist * np.array([np.cos(phi), np.sin(phi)]) + self.center 218 | 219 | D = distance(self.R, X) 220 | omega = 2 * np.pi * frequency 221 | 222 | if attn: 223 | # TO DO 1: This will mean slightly different absolute value for 224 | # every entry, even within the same steering vector. Perhaps a 225 | # better paradigm is far-field with phase carrier. 226 | return 1. / (4 * np.pi) / D * np.exp(-1j * omega * D / constants.c) 227 | else: 228 | return np.exp(-1j * omega * D / constants.c) 229 | 230 | 231 | def steering_vector_2D_from_point(self, frequency, source, attn=True, ff=False): 232 | """ Creates a steering vector for a particular frequency and source 233 | 234 | Args: 235 | frequency 236 | source: location in cartesian coordinates 237 | attn: include attenuation factor if True 238 | ff: uses far-field distance if true 239 | 240 | Return: 241 | A 2x1 ndarray containing the steering vector 242 | """ 243 | X = np.array(source) 244 | if X.ndim == 1: 245 | X = source[:,np.newaxis] 246 | 247 | # normalize for far-field if requested 248 | if (ff): 249 | X -= self.center 250 | Xn = np.sqrt(np.sum(X**2, axis=0)) 251 | X *= constants.ffdist/Xn 252 | X += self.center 253 | 254 | D = distance(self.R, X) 255 | omega = 2 * np.pi * frequency 256 | 257 | if attn: 258 | # TO DO 1: This will mean slightly different absolute value for 259 | # every entry, even within the same steering vector. Perhaps a 260 | # better paradigm is far-field with phase carrier. 261 | return 1. / (4 * np.pi) / D * np.exp(-1j * omega * D / constants.c) 262 | else: 263 | return np.exp(-1j * omega * D / constants.c) 264 | 265 | 266 | def response(self, phi_list, frequency): 267 | 268 | i_freq = np.argmin(np.abs(self.frequencies - frequency)) 269 | 270 | # For the moment assume that we are in 2D 271 | bfresp = np.dot(H(self.weights[:,i_freq]), self.steering_vector_2D( 272 | self.frequencies[i_freq], phi_list, constants.ffdist)) 273 | 274 | return self.frequencies[i_freq], bfresp 275 | 276 | 277 | def response_from_point(self, x, frequency): 278 | 279 | i_freq = np.argmin(np.abs(self.frequencies - frequency)) 280 | 281 | # For the moment assume that we are in 2D 282 | bfresp = np.dot(H(self.weights[:,i_freq]), self.steering_vector_2D_from_point( 283 | self.frequencies[i_freq], x, attn=True, ff=False)) 284 | 285 | return self.frequencies[i_freq], bfresp 286 | 287 | 288 | def plot_response_from_point(self, x, legend=None): 289 | 290 | if x.ndim == 0: 291 | x = np.array([x]) 292 | 293 | import matplotlib.pyplot as plt 294 | 295 | HF = np.zeros((x.shape[1], self.frequencies.shape[0]), dtype=complex) 296 | for k,p in enumerate(x.T): 297 | for i,f in enumerate(self.frequencies): 298 | r = np.dot(H(self.weights[:,i]), 299 | self.steering_vector_2D_from_point(f, p, attn=True, ff=False)) 300 | HF[k,i] = r[0] 301 | 302 | 303 | plt.subplot(2,1,1) 304 | plt.title('Beamformer response') 305 | for hf in HF: 306 | plt.plot(self.frequencies, np.abs(hf)) 307 | plt.ylabel('Modulus') 308 | plt.axis('tight') 309 | plt.legend(legend) 310 | 311 | plt.subplot(2,1,2) 312 | for hf in HF: 313 | plt.plot(self.frequencies, np.unwrap(np.angle(hf))) 314 | plt.ylabel('Phase') 315 | plt.xlabel('Frequency [Hz]') 316 | plt.axis('tight') 317 | plt.legend(legend) 318 | 319 | 320 | def plot_beam_response(self): 321 | 322 | phi = np.linspace(-np.pi, np.pi-np.pi/180, 360) 323 | freq = self.frequencies 324 | #freq = self.frequencies[self.frequencies > constants.fc_hp] 325 | 326 | resp = np.zeros((freq.shape[0], phi.shape[0]), dtype=complex) 327 | 328 | for i,f in enumerate(freq): 329 | # For the moment assume that we are in 2D 330 | resp[i,:] = np.dot(H(self.weights[:,i]), self.steering_vector_2D( 331 | f, phi, constants.ffdist)) 332 | 333 | H_abs = np.abs(resp)**2 334 | H_abs /= H_abs.max() 335 | H_abs = 10*np.log10(H_abs) 336 | 337 | p_min = 0 338 | p_max = 100 339 | vmin, vmax = np.percentile(H_abs.flatten(), [p_min, p_max]) 340 | 341 | import matplotlib.pyplot as plt 342 | 343 | plt.imshow(H_abs, 344 | aspect='auto', 345 | origin='lower', 346 | interpolation='sinc', 347 | vmax=vmax, vmin=vmin) 348 | 349 | plt.xlabel('Angle [rad]') 350 | xticks = [-np.pi, -np.pi/2, 0, np.pi/2, np.pi] 351 | for i,p in enumerate(xticks): 352 | xticks[i] = np.argmin(np.abs(p - phi)) 353 | xticklabels = ['$-\pi$', '$-\pi/2$', '0', '$\pi/2$', '$\pi$'] 354 | plt.setp(plt.gca(), 'xticks', xticks) 355 | plt.setp(plt.gca(), 'xticklabels', xticklabels) 356 | 357 | plt.ylabel('Freq [kHz]') 358 | yticks = np.zeros(4) 359 | f_0 = np.floor(self.Fs/8000.) 360 | for i in np.arange(1,5): 361 | yticks[i-1] = np.argmin(np.abs(freq - 1000.*i*f_0)) 362 | #yticks = np.array(plt.getp(plt.gca(), 'yticks'), dtype=np.int) 363 | plt.setp(plt.gca(), 'yticks', yticks) 364 | plt.setp(plt.gca(), 'yticklabels', np.arange(1,5)*f_0) 365 | 366 | 367 | def farFieldWeights(self, phi): 368 | ''' 369 | This method computes weight for a far field at infinity 370 | 371 | phi: direction of beam 372 | ''' 373 | 374 | u = unit_vec2D(phi) 375 | proj = np.dot(u.T, self.R - self.center)[0] 376 | 377 | # normalize the first arriving signal to ensure a causal filter 378 | proj -= proj.max() 379 | 380 | self.weights = np.exp(2j * np.pi * 381 | self.frequencies[:, np.newaxis] * proj / constants.c).T 382 | 383 | 384 | def rakeDelayAndSumWeights(self, source, interferer=None, R_n=None, attn=True, ff=False): 385 | 386 | self.weights = np.zeros((self.M, self.frequencies.shape[0]), dtype=complex) 387 | 388 | K = source.shape[1] - 1 389 | 390 | for i, f in enumerate(self.frequencies): 391 | W = self.steering_vector_2D_from_point(f, source, attn=attn, ff=ff) 392 | self.weights[:,i] = 1.0/self.M/(K+1) * np.sum(W, axis=1) 393 | 394 | 395 | 396 | def rakeOneForcingWeights(self, source, interferer, R_n=None, ff=False, attn=True): 397 | 398 | if R_n is None: 399 | R_n = np.zeros((self.M, self.M)) 400 | 401 | self.weights = np.zeros((self.M, self.frequencies.shape[0]), dtype=complex) 402 | 403 | for i, f in enumerate(self.frequencies): 404 | if interferer is None: 405 | A_bad = np.array([[]]) 406 | else: 407 | A_bad = self.steering_vector_2D_from_point(f, interferer, attn=attn, ff=ff) 408 | 409 | R_nq = R_n + sumcols(A_bad).dot(H(sumcols(A_bad))) 410 | 411 | A_s = self.steering_vector_2D_from_point(f, source, attn=attn, ff=ff) 412 | R_nq_inv = pinv(R_nq) 413 | D = pinv(mdot(H(A_s), R_nq_inv, A_s)) 414 | 415 | self.weights[:,i] = sumcols( mdot( R_nq_inv, A_s, D ) )[:,0] 416 | 417 | def rakeMaxSINRWeights(self, source, interferer, R_n=None, 418 | rcond=0., ff=False, attn=True): 419 | ''' 420 | This method computes a beamformer focusing on a number of specific sources 421 | and ignoring a number of interferers. 422 | 423 | INPUTS 424 | * source : source locations 425 | * interferer : interferer locations 426 | ''' 427 | 428 | if R_n is None: 429 | R_n = np.zeros((self.M, self.M)) 430 | 431 | self.weights = np.zeros((self.M, self.frequencies.shape[0]), dtype=complex) 432 | 433 | for i,f in enumerate(self.frequencies): 434 | 435 | A_good = self.steering_vector_2D_from_point(f, source, attn=attn, ff=ff) 436 | 437 | if interferer is None: 438 | A_bad = np.array([[]]) 439 | else: 440 | A_bad = self.steering_vector_2D_from_point(f, interferer, attn=attn, ff=ff) 441 | 442 | a_good = sumcols(A_good) 443 | a_bad = sumcols(A_bad) 444 | 445 | # TO DO: Fix this (check for numerical rank, use the low rank approximation) 446 | K_inv = pinv(a_bad.dot(H(a_bad)) + R_n + rcond * np.eye(A_bad.shape[0])) 447 | self.weights[:,i] = (K_inv.dot(a_good) / mdot(H(a_good), K_inv, a_good))[:,0] 448 | 449 | 450 | def rakeMaxUDRWeights(self, source, interferer, R_n=None, ff=False, attn=True): 451 | 452 | if source.shape[1] == 1: 453 | self.rakeMaxSINRWeights(source, interferer, R_n=R_n, ff=ff, attn=attn) 454 | return 455 | 456 | if R_n is None: 457 | R_n = np.zeros((self.M, self.M)) 458 | 459 | self.weights = np.zeros((self.M, self.frequencies.shape[0]), dtype=complex) 460 | 461 | for i, f in enumerate(self.frequencies): 462 | A_good = self.steering_vector_2D_from_point(f, source, attn=attn, ff=ff) 463 | 464 | if interferer is None: 465 | A_bad = np.array([[]]) 466 | else: 467 | A_bad = self.steering_vector_2D_from_point(f, interferer, attn=attn, ff=ff) 468 | 469 | R_nq = R_n + sumcols(A_bad).dot(H(sumcols(A_bad))) 470 | 471 | C = np.linalg.cholesky(R_nq) 472 | l, v = eig( mdot( inv(C), A_good, H(A_good), H(inv(C)) ) ) 473 | 474 | self.weights[:,i] = inv(H(C)).dot(v[:,0]) 475 | 476 | 477 | def SNR(self, source, interferer, f, R_n=None, dB=False): 478 | 479 | i_f = np.argmin(np.abs(self.frequencies - f)) 480 | 481 | # This works at a single frequency because otherwise we need to pass 482 | # many many covariance matrices. Easy to change though (you can also 483 | # have frequency independent R_n). 484 | 485 | if R_n is None: 486 | R_n = np.zeros((self.M, self.M)) 487 | 488 | # To compute the SNR, we /must/ use the real steering vectors, so no 489 | # far field, and attn=True 490 | A_good = self.steering_vector_2D_from_point(self.frequencies[i_f], source, attn=True, ff=False) 491 | 492 | if interferer is not None: 493 | A_bad = self.steering_vector_2D_from_point(self.frequencies[i_f], interferer, attn=True, ff=False) 494 | R_nq = R_n + sumcols(A_bad) * H(sumcols(A_bad)) 495 | else: 496 | R_nq = R_n 497 | 498 | w = self.weights[:,i_f] 499 | a_1 = sumcols(A_good) 500 | 501 | SNR = np.real(mdot(H(w), a_1, H(a_1), w) / mdot(H(w), R_nq, w)) 502 | 503 | if dB is True: 504 | SNR = 10 * np.log10(SNR) 505 | 506 | return SNR 507 | 508 | 509 | def UDR(self, source, interferer, f, R_n=None, dB=False): 510 | 511 | i_f = np.argmin(np.abs(self.frequencies - f)) 512 | 513 | if R_n is None: 514 | R_n = np.zeros((self.M, self.M)) 515 | 516 | A_good = self.steering_vector_2D_from_point(self.frequencies[i_f], source, attn=True, ff=False) 517 | 518 | if interferer is not None: 519 | A_bad = self.steering_vector_2D_from_point(self.frequencies[i_f], interferer, attn=True, ff=False) 520 | R_nq = R_n + sumcols(A_bad).dot(H(sumcols(A_bad))) 521 | else: 522 | R_nq = R_n 523 | 524 | w = self.weights[:,i_f] 525 | 526 | UDR = np.real(mdot(H(w), A_good, H(A_good), w) / mdot(H(w), R_nq, w)) 527 | if dB is True: 528 | UDR = 10 * np.log10(UDR) 529 | 530 | return UDR 531 | 532 | 533 | def process(self): 534 | 535 | if (self.signals is None or len(self.signals) == 0): 536 | raise NameError('No signal to beamform') 537 | 538 | if self.processing is 'FrequencyDomain': 539 | 540 | # create window function 541 | win = np.concatenate((np.zeros(self.zpf), 542 | windows.hann(self.L), 543 | np.zeros(self.zpb))) 544 | 545 | # do real STFT of first signal 546 | tfd_sig = stft.stft(self.signals[0], 547 | self.L, 548 | self.hop, 549 | zp_back=self.zpb, 550 | zp_front=self.zpf, 551 | transform=np.fft.rfft, 552 | win=win) * np.conj(self.weights[0]) 553 | for i in xrange(1, self.M): 554 | tfd_sig += stft.stft(self.signals[i], 555 | self.L, 556 | self.hop, 557 | zp_back=self.zpb, 558 | zp_front=self.zpf, 559 | transform=np.fft.rfft, 560 | win=win) * np.conj(self.weights[i]) 561 | 562 | # now reconstruct the signal 563 | output = stft.istft( 564 | tfd_sig, 565 | self.L, 566 | self.hop, 567 | zp_back=self.zpb, 568 | zp_front=self.zpf, 569 | transform=np.fft.irfft) 570 | 571 | # remove the zero padding from output signal 572 | if self.zpb is 0: 573 | output = output[self.zpf:] 574 | else: 575 | output = output[self.zpf:-self.zpb] 576 | 577 | elif self.processing is 'TimeDomain': 578 | 579 | # go back to time domain and shift DC to center 580 | tw = np.sqrt(self.weights.shape[1])*np.fft.irfft(np.conj(self.weights), axis=1) 581 | tw = np.concatenate((tw[:, self.N/2:], tw[:, :self.N/2]), axis=1) 582 | 583 | from scipy.signal import fftconvolve 584 | 585 | # do real STFT of first signal 586 | output = fftconvolve(tw[0], self.signals[0]) 587 | for i in xrange(1, len(self.signals)): 588 | output += fftconvolve(tw[i], self.signals[i]) 589 | 590 | elif self.processing is 'Total': 591 | 592 | W = np.concatenate((self.weights, np.conj(self.weights[:,-2:0:-1])), axis=1) 593 | W[:,0] = np.real(W[:,0]) 594 | W[:,self.N/2] = np.real(W[:,self.N/2]) 595 | 596 | F_sig = np.zeros(self.signals.shape[1], dtype=complex) 597 | for i in xrange(self.M): 598 | F_sig += np.fft.fft(self.signals[i])*np.conj(W[i,:]) 599 | 600 | f_sig = np.fft.ifft(F_sig) 601 | print np.abs(np.imag(f_sig)).mean() 602 | print np.abs(np.real(f_sig)).mean() 603 | 604 | output = np.real(np.fft.ifft(F_sig)) 605 | 606 | return output 607 | 608 | 609 | def plot(self, sum_ir=False): 610 | 611 | import matplotlib.pyplot as plt 612 | 613 | plt.subplot(2, 2, 1) 614 | plt.plot(self.frequencies, np.abs(self.weights.T)) 615 | plt.title('Beamforming weights [modulus]') 616 | plt.xlabel('Frequency [Hz]') 617 | plt.ylabel('Weight modulus') 618 | 619 | plt.subplot(2, 2, 2) 620 | plt.plot(self.frequencies, np.unwrap(np.angle(self.weights.T), axis=0)) 621 | plt.title('Beamforming weights [phase]') 622 | plt.xlabel('Frequency [Hz]') 623 | plt.ylabel('Unwrapped phase') 624 | 625 | plt.subplot(2, 1, 2) 626 | 627 | self.plot_IR(sum_ir=sum_ir) 628 | 629 | plt.title('Beamforming filters') 630 | plt.xlabel('Time [s]') 631 | plt.ylabel('Filter amplitude') 632 | plt.axis('tight') 633 | 634 | 635 | def ir(self, sum_ir=False, norm=None, zp=1, **kwargs): 636 | ''' compute time domain impulse response of the beamformer''' 637 | 638 | # go back to time domain and shift DC to center 639 | tw = np.fft.irfft(np.conj(self.weights), axis=1, n=zp*self.N) 640 | 641 | tw = np.concatenate((tw[:,-self.N/2:], tw[:, :self.N/2]), axis=1) 642 | 643 | if sum_ir is True: 644 | tw = np.sum(tw.T, axis=1) 645 | else: 646 | tw = tw.T 647 | 648 | if norm is not None: 649 | tw *= norm/np.abs(tw).max() 650 | 651 | return tw 652 | 653 | def plot_IR(self, sum_ir=False, norm=None, zp=1, **kwargs): 654 | 655 | tw = self.ir(sum_ir=sum_ir, norm=norm, zp=zp, **kwargs) 656 | 657 | import matplotlib.pyplot as plt 658 | 659 | plt.plot(np.arange(tw.shape[0])/float(self.Fs), tw, **kwargs) 660 | 661 | 662 | @classmethod 663 | def linear2D(cls, Fs, center, M, phi, d): 664 | ''' Create linear beamformer ''' 665 | return Beamformer(linear2DArray(center, M, phi, d), Fs) 666 | 667 | @classmethod 668 | def circular2D(cls, Fs, center, M, phi, radius): 669 | ''' Create circular beamformer''' 670 | return Beamformer(circular2DArray(center, M, phi, radius), Fs) 671 | 672 | @classmethod 673 | def poisson(cls, Fs, center, M, d): 674 | ''' Create beamformer with microphone positions drawn from Poisson process ''' 675 | 676 | from numpy.random import standard_exponential, randint 677 | 678 | R = d*standard_exponential((2, M))*(2*randint(0,2, (2,M)) - 1) 679 | R = R.cumsum(axis=1) 680 | R -= R.mean(axis=1)[:,np.newaxis] 681 | R += np.array([center]).T 682 | 683 | return Beamformer(R, Fs) 684 | 685 | -------------------------------------------------------------------------------- /bin/README.md: -------------------------------------------------------------------------------- 1 | Binary Blobs 2 | =============== 3 | 4 | Put the PESQ binary blob in this directory. 5 | -------------------------------------------------------------------------------- /constants.py: -------------------------------------------------------------------------------- 1 | ''' 2 | This file defines the main physical constants of the system 3 | ''' 4 | 5 | # Speed of sound c=343 m/s 6 | c = 343. 7 | 8 | # distance to the far field 9 | ffdist = 10. 10 | 11 | # cut-off frequency of standard high-pass filter 12 | fc_hp = 300. 13 | 14 | # tolerance for computations 15 | eps = 1e-10 16 | -------------------------------------------------------------------------------- /figure_Measures1.py: -------------------------------------------------------------------------------- 1 | import numpy as np 2 | import matplotlib 3 | import constants 4 | matplotlib.use('TkAgg') 5 | 6 | import matplotlib.pyplot as plt 7 | import matplotlib.colors as colors 8 | import matplotlib.cm as cmx 9 | 10 | 11 | import Room as rg 12 | import beamforming as bf 13 | from scipy.io import wavfile 14 | 15 | # Room 1 : Shoe box 16 | p1 = np.array([0, 0]) 17 | p2 = np.array([4, 6]) 18 | 19 | # The desired signal 20 | source1 = [1.2, 1.5] 21 | 22 | # The interferer 23 | source2 = [2.5, 2] 24 | 25 | # Some simulation parameters 26 | Fs = 44100 27 | absorption = 0.8 28 | max_order = 4 29 | 30 | # create a microphone array 31 | mic1 = [2, 3] 32 | M = 12 33 | d = 0.3 34 | freqs = np.array([1000]) 35 | f = 1000 36 | sigma2 = 1e-3 37 | 38 | mics = bf.Beamformer.circular2D(Fs, mic1, M, 0, d) 39 | mics.frequencies = freqs 40 | 41 | # How much to simulate? 42 | max_K = 21 43 | n_monte_carlo = 20000 44 | 45 | beamformer_names = ['DS', 46 | 'Max-SINR', 47 | 'Rake-DS', 48 | 'Rake-MaxSINR', 49 | 'Rake-MaxUDR'] 50 | # 'Rake-OF'] 51 | bf_weights_fun = [mics.rakeDelayAndSumWeights, 52 | mics.rakeMaxSINRWeights, 53 | mics.rakeDelayAndSumWeights, 54 | mics.rakeMaxSINRWeights, 55 | mics.rakeMaxUDRWeights] 56 | # mics.rakeOneForcingWeights] 57 | 58 | SNR = {} 59 | SNR_ci = {} 60 | SNR_ci_minus = {} 61 | SNR_ci_plus = {} 62 | 63 | UDR = {} 64 | UDR_ci = {} 65 | 66 | for bf in beamformer_names: 67 | SNR.update({bf: np.zeros((max_K, n_monte_carlo))}) 68 | SNR_ci.update({bf: np.float(0)}) 69 | UDR.update({bf: np.zeros((max_K, n_monte_carlo))}) 70 | UDR_ci.update({bf: np.float(0)}) 71 | 72 | SNR_ci_minus = SNR_ci.copy() 73 | SNR_ci_plus = SNR_ci.copy() 74 | 75 | for K in range(0, max_K): 76 | for n in xrange(n_monte_carlo): 77 | 78 | # create the room with sources 79 | room1 = rg.Room.shoeBox2D( 80 | p1, 81 | p2, 82 | Fs, 83 | max_order=max_order, 84 | absorption=absorption) 85 | 86 | source1 = p1 + np.random.rand(2) * (p2 - p1) 87 | source2 = p1 + np.random.rand(2) * (p2 - p1) 88 | 89 | room1.addSource(source1) 90 | room1.addSource(source2) 91 | 92 | # Create different beamformers and evaluate corresponding performance measures 93 | for i, bf in enumerate(beamformer_names): 94 | 95 | if (bf is 'DS') or (bf is 'Max-SINR'): 96 | n_nearest = 1 97 | else: 98 | n_nearest = K+1 99 | 100 | 101 | bf_weights_fun[i](room1.sources[0].getImages(n_nearest=n_nearest, ref_point=mics.center), 102 | room1.sources[1].getImages(n_nearest=n_nearest, ref_point=mics.center), 103 | R_n=sigma2 * np.eye(mics.M), 104 | ff=False, 105 | attn=True) 106 | 107 | room1.addMicrophoneArray(mics) 108 | 109 | SNR[bf][K][n] = mics.SNR(room1.sources[0].getImages(n_nearest=K+1, ref_point=mics.center), 110 | room1.sources[1].getImages(n_nearest=max_K+1, ref_point=mics.center), 111 | f, 112 | R_n=sigma2 * np.eye(mics.M), 113 | dB=True) 114 | UDR[bf][K][n] = mics.UDR(room1.sources[0].getImages(n_nearest=K+1, ref_point=mics.center), 115 | room1.sources[1].getImages(n_nearest=max_K+1, ref_point=mics.center), 116 | f, 117 | R_n=sigma2 * np.eye(mics.M), 118 | dB=True) 119 | 120 | print 'Computed for K =', K 121 | 122 | 123 | # Compute the confidence regions, symmetrically, and then separately for 124 | # positive and for negative differences 125 | p = 0.5 126 | for bf in beamformer_names: 127 | err_SNR = SNR[bf][K] - np.median(SNR[bf][K]) 128 | n_plus = np.sum(err_SNR >= 0) 129 | n_minus = np.sum(err_SNR < 0) 130 | SNR_ci[bf] = np.sort(np.abs(err_SNR))[np.floor(p*n_monte_carlo)] 131 | SNR_ci_plus[bf] = np.sort(err_SNR[err_SNR >= 0])[np.floor(p*n_plus)] 132 | SNR_ci_minus[bf] = np.sort(-err_SNR[err_SNR < 0])[np.floor(p*n_minus)] 133 | 134 | err_UDR = UDR[bf][K] - np.median(UDR[bf][K]) 135 | UDR_ci[bf] = np.sort(np.abs(err_UDR))[np.floor(p*n_monte_carlo)] 136 | 137 | 138 | #--------------------------------------------------------------------- 139 | # Export the SNR figure 140 | #--------------------------------------------------------------------- 141 | 142 | plt.figure(figsize=(4, 3)) 143 | 144 | newmap = plt.get_cmap('gist_heat') 145 | ax1 = plt.gca() 146 | ax1.set_color_cycle([newmap( k ) for k in np.linspace(0.25,0.9,len(beamformer_names))]) 147 | 148 | from itertools import cycle 149 | lines = ['-s','-o','-v','-D','->'] 150 | linecycler = cycle(lines) 151 | 152 | for i, bf in enumerate(beamformer_names): 153 | p, = plt.plot(range(0, max_K), 154 | np.median(SNR[bf], axis=1), 155 | next(linecycler), 156 | linewidth=1, 157 | markersize=4, 158 | markeredgewidth=.5, 159 | clip_on=False) 160 | 161 | plt.fill_between(range(0, max_K), 162 | np.median(SNR['Rake-MaxSINR'], axis=1) - SNR_ci['Rake-MaxSINR'], 163 | np.median(SNR['Rake-MaxSINR'], axis=1) + SNR_ci['Rake-MaxSINR'], 164 | color='grey', 165 | linewidth=0.3, 166 | edgecolor='k', 167 | alpha=0.7) 168 | 169 | # Hide right and top axes 170 | ax1.spines['top'].set_visible(False) 171 | ax1.spines['right'].set_visible(False) 172 | ax1.spines['bottom'].set_position(('outward', 10)) 173 | ax1.spines['left'].set_position(('outward', 15)) 174 | ax1.yaxis.set_ticks_position('left') 175 | ax1.xaxis.set_ticks_position('bottom') 176 | 177 | # Make ticks nicer 178 | ax1.xaxis.set_tick_params(width=.3, length=3) 179 | ax1.yaxis.set_tick_params(width=.3, length=3) 180 | 181 | # Make axis lines thinner 182 | for axis in ['bottom','left']: 183 | ax1.spines[axis].set_linewidth(0.3) 184 | 185 | # Set ticks fontsize 186 | plt.xticks(size=9) 187 | plt.yticks(size=9) 188 | 189 | # Set labels 190 | plt.xlabel(r'Number of images $K$', fontsize=10) 191 | plt.ylabel('Output SINR [dB]', fontsize=10) 192 | plt.tight_layout() 193 | 194 | 195 | plt.legend(beamformer_names, fontsize=7, loc='upper left', frameon=False, labelspacing=0) 196 | 197 | plt.savefig('figures/SINR_vs_K.pdf') 198 | 199 | plt.close() 200 | 201 | #--------------------------------------------------------------------- 202 | # Export the UDR figure 203 | #--------------------------------------------------------------------- 204 | 205 | plt.figure(figsize=(4, 3)) 206 | 207 | newmap = plt.get_cmap('gist_heat') 208 | ax1 = plt.gca() 209 | ax1.set_color_cycle([newmap( k ) for k in np.linspace(0.25,0.9,len(beamformer_names))]) 210 | 211 | for i, bf in enumerate(beamformer_names): 212 | p, = plt.plot(range(0, max_K), 213 | np.median(UDR[bf], axis=1), 214 | next(linecycler), 215 | linewidth=1, 216 | markersize=4, 217 | markeredgewidth=.5, 218 | clip_on=False) 219 | 220 | plt.fill_between(range(0, max_K), 221 | np.median(UDR['Rake-MaxUDR'], axis=1) - UDR_ci['Rake-MaxUDR'], 222 | np.median(UDR['Rake-MaxUDR'], axis=1) + UDR_ci['Rake-MaxUDR'], 223 | color='grey', 224 | linewidth=0.3, 225 | edgecolor='k', 226 | alpha=0.7) 227 | 228 | # Hide right and top axes 229 | ax1.spines['top'].set_visible(False) 230 | ax1.spines['right'].set_visible(False) 231 | ax1.spines['bottom'].set_position(('outward', 10)) 232 | ax1.spines['left'].set_position(('outward', 15)) 233 | ax1.yaxis.set_ticks_position('left') 234 | ax1.xaxis.set_ticks_position('bottom') 235 | 236 | # Make ticks nicer 237 | ax1.xaxis.set_tick_params(width=.3, length=3) 238 | ax1.yaxis.set_tick_params(width=.3, length=3) 239 | 240 | # Make axis lines thinner 241 | for axis in ['bottom','left']: 242 | ax1.spines[axis].set_linewidth(0.3) 243 | 244 | # Set ticks fontsize 245 | plt.xticks(size=9) 246 | plt.yticks(size=9) 247 | 248 | # Set labels 249 | plt.xlabel(r'Number of images $K$', fontsize=10) 250 | plt.ylabel('Output UDR [dB]', fontsize=10) 251 | plt.tight_layout() 252 | 253 | 254 | plt.legend(beamformer_names, fontsize=7, loc='upper left', frameon=False, labelspacing=0) 255 | 256 | plt.savefig('figures/UDR_vs_K.pdf') 257 | -------------------------------------------------------------------------------- /figure_Measures2.py: -------------------------------------------------------------------------------- 1 | import numpy as np 2 | import matplotlib 3 | import constants 4 | matplotlib.use('TkAgg') 5 | 6 | import matplotlib.pyplot as plt 7 | import matplotlib.colors as colors 8 | import matplotlib.cm as cmx 9 | 10 | import Room as rg 11 | import beamforming as bf 12 | from scipy.io import wavfile 13 | 14 | # Room 1 : Shoe box 15 | p1 = np.array([0, 0]) 16 | p2 = np.array([4, 6]) 17 | 18 | # The first signal is Homer 19 | source1 = [1.2, 1.5] 20 | 21 | # the second signal is some speech 22 | source2 = [2.5, 2] 23 | 24 | # Some simulation parameters 25 | Fs = 44100 26 | absorption = 0.8 27 | max_order = 4 28 | 29 | # create a microphone array 30 | mic1 = [2, 3] 31 | M = 12 32 | d = 0.3 33 | freqs = np.arange(100,4000,200) 34 | sigma2 = 1e-3 35 | 36 | mics = bf.Beamformer.circular2D(Fs, mic1, M, 0, d) 37 | mics.frequencies = freqs 38 | 39 | # How much to simulate? 40 | n_monte_carlo = 20000 41 | 42 | beamformer_names = ['DS', 43 | 'Max-SINR', 44 | 'Rake-DS', 45 | 'Rake-MaxSINR', 46 | 'Rake-MaxUDR'] 47 | # 'Rake-OF'] 48 | bf_weights_fun = [mics.rakeDelayAndSumWeights, 49 | mics.rakeMaxSINRWeights, 50 | mics.rakeDelayAndSumWeights, 51 | mics.rakeMaxSINRWeights, 52 | mics.rakeMaxUDRWeights] 53 | # mics.rakeOneForcingWeights] 54 | 55 | SNR = {} 56 | UDR = {} 57 | for bf in beamformer_names: 58 | SNR.update({bf: np.zeros((freqs.size, n_monte_carlo))}) 59 | UDR.update({bf: np.zeros((freqs.size, n_monte_carlo))}) 60 | 61 | K = 10 62 | 63 | # How many images there is in the first 15 generations? 64 | max_K = 1000 65 | 66 | for n in xrange(n_monte_carlo): 67 | 68 | # create the room with sources 69 | room1 = rg.Room.shoeBox2D( 70 | p1, 71 | p2, 72 | Fs, 73 | max_order=max_order, 74 | absorption=absorption) 75 | 76 | source1 = p1 + np.random.rand(2) * (p2 - p1) 77 | source2 = p1 + np.random.rand(2) * (p2 - p1) 78 | 79 | room1.addSource(source1) 80 | room1.addSource(source2) 81 | 82 | # Create different beamformers and evaluate corresponding performance measures 83 | for i_bf, bf in enumerate(beamformer_names): 84 | 85 | if (bf is 'DS') or (bf is 'Max-SINR'): 86 | n_nearest = 1 87 | else: 88 | n_nearest = K+1 89 | 90 | bf_weights_fun[i_bf](room1.sources[0].getImages(n_nearest=n_nearest, ref_point=mics.center), 91 | room1.sources[1].getImages(n_nearest=n_nearest, ref_point=mics.center), 92 | R_n=sigma2 * np.eye(mics.M), 93 | ff=False, 94 | attn=True) 95 | 96 | room1.addMicrophoneArray(mics) 97 | 98 | # TO DO: Average in dB or in the linear scale? 99 | for i_f, f in enumerate(freqs): 100 | SNR[bf][i_f][n] = mics.SNR(room1.sources[0].getImages(n_nearest=K+1, ref_point=mics.center), 101 | room1.sources[1].getImages(n_nearest=max_K+1, ref_point=mics.center), 102 | f, 103 | R_n=sigma2 * np.eye(mics.M), 104 | dB=True) 105 | UDR[bf][i_f][n] = mics.UDR(room1.sources[0].getImages(n_nearest=K+1, ref_point=mics.center), 106 | room1.sources[1].getImages(n_nearest=max_K+1, ref_point=mics.center), 107 | f, 108 | R_n=sigma2 * np.eye(mics.M), 109 | dB=True) 110 | 111 | print 'Computed for n =', n 112 | 113 | # Plot the results 114 | # 115 | # Make SublimeText use iPython, right? currently it uses python... at least make sure that it uses the correct one. 116 | # 117 | plt.figure(figsize=(4, 3)) 118 | 119 | from itertools import cycle 120 | lines = ['-s','-o','-v','-D','->'] 121 | linecycler = cycle(lines) 122 | 123 | newmap = plt.get_cmap('gist_heat') 124 | ax1 = plt.gca() 125 | ax1.set_color_cycle([newmap( k ) for k in np.linspace(0.25,0.9,len(beamformer_names))]) 126 | 127 | for i, bf in enumerate(beamformer_names): 128 | p, = plt.plot(freqs, 129 | np.mean(SNR[bf], axis=1), 130 | next(linecycler), 131 | linewidth=1, 132 | markersize=4, 133 | markeredgewidth=.5) 134 | 135 | # Hide right and top axes 136 | ax1 = plt.gca() 137 | ax1.spines['top'].set_visible(False) 138 | ax1.spines['right'].set_visible(False) 139 | ax1.spines['bottom'].set_position(('outward', 10)) 140 | ax1.spines['left'].set_position(('outward', 15)) 141 | ax1.yaxis.set_ticks_position('left') 142 | ax1.xaxis.set_ticks_position('bottom') 143 | 144 | # Make ticks nicer 145 | ax1.xaxis.set_tick_params(width=.3, length=3) 146 | ax1.yaxis.set_tick_params(width=.3, length=3) 147 | 148 | # Make axis lines thinner 149 | for axis in ['bottom','left']: 150 | ax1.spines[axis].set_linewidth(0.3) 151 | 152 | # Set ticks fontsize 153 | plt.xticks(size=9) 154 | plt.yticks(size=9) 155 | 156 | # Set labels 157 | plt.xlabel(r'Frequency [Hz]', fontsize=10) 158 | plt.ylabel('Output SINR [dB]', fontsize=10) 159 | plt.tight_layout() 160 | 161 | 162 | plt.legend(beamformer_names, fontsize=7, loc='lower right', frameon=False, labelspacing=0) 163 | 164 | plt.savefig('figures/SINR_vs_freq.pdf') 165 | 166 | 167 | 168 | -------------------------------------------------------------------------------- /figure_SumNorm.py: -------------------------------------------------------------------------------- 1 | 2 | import numpy as np 3 | import scipy.special as spfun 4 | 5 | import matplotlib 6 | import constants 7 | 8 | import matplotlib.colors as colors 9 | import matplotlib.cm as cmx 10 | 11 | matplotlib.use('TkAgg') 12 | import matplotlib.pyplot as plt 13 | 14 | import Room as rg 15 | import beamforming as bf 16 | 17 | # Room 1 : Shoe box 18 | p1 = np.array([0, 0]) 19 | p2 = np.array([4, 6]) 20 | mic1 = [2, 3] 21 | Fs = 44100 22 | absorption = 0.8 23 | max_order = 4 24 | 25 | # Parameters for the theoretical curve 26 | a = 5 27 | b = 10 28 | Delta = b-a 29 | 30 | # Create a microphone array 31 | M = 12 32 | d = 0.2 33 | frequencies = np.arange(25, 600, 5) 34 | 35 | mics = bf.Beamformer.linear2D(Fs, mic1, M, 0, d) 36 | 37 | K_list = [16, 8] 38 | n_monte_carlo = 1000 39 | 40 | SNR_gain = np.zeros((len(K_list), frequencies.size)) 41 | SNR_gain_theory = np.zeros((len(K_list), frequencies.size)) 42 | 43 | for i_K, K in enumerate(K_list): 44 | for i, f in enumerate(frequencies): 45 | print 'Simulating for the frequency', f 46 | for n in range(0, n_monte_carlo): 47 | 48 | # Generate a source at a random location. TO DO: Add a bounding box for 49 | # sources! 50 | source1 = p1 + np.random.rand(2) * (p2 - p1) 51 | 52 | # Create the room 53 | room1 = rg.Room.shoeBox2D( 54 | p1, 55 | p2, 56 | Fs, 57 | max_order=max_order, 58 | absorption=absorption) 59 | room1.addSource(source1) 60 | room1.addMicrophoneArray(mics) 61 | 62 | A = mics.steering_vector_2D_from_point(f, room1.sources[0].getImages(n_nearest=K+1, ref_point=mics.center), attn=False) 63 | SNR_gain[i_K][i] += np.linalg.norm(np.sum(A, axis=1))**2 / np.linalg.norm(A[:, 0])**2 64 | 65 | SNR_gain[i_K][i] /= n_monte_carlo 66 | 67 | m = np.arange(M) 68 | kappa = 2*np.pi*f / constants.c 69 | SNR_gain_theory[i_K][i] = np.sum(np.abs(A[0,:]))*np.sum(1 + 2*spfun.jv(0, m*d*kappa)**2 * (1-np.cos(Delta * kappa)) / (Delta * kappa)**2)/np.linalg.norm(A[:, 0])**2 70 | 71 | # Plot the results 72 | plt.figure(figsize=(4, 2.5)) 73 | ax1 = plt.gca() 74 | 75 | newmap = plt.get_cmap('gist_heat') 76 | ax1.set_color_cycle([newmap( k ) for k in np.linspace(0.25,0.8,2)]) 77 | 78 | plt.plot(frequencies, 10*np.log10(SNR_gain.T)) 79 | plt.plot(frequencies, 10*np.log10(SNR_gain_theory.T), 'o', markersize=2.5, markeredgewidth=.3) 80 | 81 | # Hide right and top axes 82 | ax1.spines['top'].set_visible(False) 83 | ax1.spines['right'].set_visible(False) 84 | ax1.spines['bottom'].set_position(('outward', 10)) 85 | ax1.spines['left'].set_position(('outward', 15)) 86 | ax1.yaxis.set_ticks_position('left') 87 | ax1.xaxis.set_ticks_position('bottom') 88 | 89 | # Make ticks nicer 90 | ax1.xaxis.set_tick_params(width=.3, length=3) 91 | ax1.yaxis.set_tick_params(width=.3, length=3) 92 | 93 | # Make axis lines thinner 94 | for axis in ['bottom','left']: 95 | ax1.spines[axis].set_linewidth(0.3) 96 | 97 | # Set ticks 98 | plt.xticks(size=9) 99 | plt.yticks(size=9) 100 | 101 | # Do the legend 102 | plt.legend([r'Simulation, $K=16$', 103 | r'Simulation, $K=8$', 104 | r'Theorem, $K=16$', 105 | r'Theorem, $K=8$'], fontsize=7, loc='upper right', frameon=False, labelspacing=0) 106 | 107 | # Set labels 108 | plt.xlabel(r'Frequency [Hz]', fontsize=10) 109 | plt.ylabel('SNR gain [dB]', fontsize=10) 110 | plt.tight_layout() 111 | 112 | plt.savefig('figures/SNR_gain.pdf') 113 | 114 | -------------------------------------------------------------------------------- /figure_beam_scenarios.py: -------------------------------------------------------------------------------- 1 | 2 | import numpy as np 3 | import matplotlib 4 | import matplotlib.pyplot as plt 5 | from scipy.io import wavfile 6 | from scipy.signal import resample 7 | 8 | import Room as rg 9 | import beamforming as bf 10 | import windows 11 | import utilities as u 12 | 13 | # Beam pattern figure properties 14 | freq=[800, 1600] 15 | figsize=(4*1.88,2.24) 16 | xlim=[-4,8] 17 | ylim=[-5.2,10] 18 | 19 | # Some simulation parameters 20 | Fs = 8000 21 | t0 = 1./(Fs*np.pi*1e-2) # starting time function of sinc decay in RIR response 22 | absorption = 0.90 23 | max_order_sim = 10 24 | sigma2_n = 1e-7 25 | 26 | # Room 1 : Shoe box 27 | room_dim = [4, 6] 28 | 29 | # the good source is fixed for all 30 | good_source = [1, 4.5] # good source 31 | normal_interferer = [2.8, 4.3] # interferer 32 | hard_interferer = [1.5, 3] # interferer in direct path 33 | 34 | # microphone array design parameters 35 | mic1 = [2, 1.5] # position 36 | M = 8 # number of microphones 37 | d = 0.08 # distance between microphones 38 | phi = 0. # angle from horizontal 39 | max_order_design = 1 # maximum image generation used in design 40 | shape = 'Linear' # array shape 41 | 42 | # create a microphone array 43 | if shape is 'Circular': 44 | mics = bf.Beamformer.circular2D(Fs, mic1, M, phi, d*M/(2*np.pi)) 45 | else: 46 | mics = bf.Beamformer.linear2D(Fs, mic1, M, phi, d) 47 | 48 | # define the array processing type 49 | L = 4096 # frame length 50 | hop = 2048 # hop between frames 51 | zp = 2048 # zero padding (front + back) 52 | mics.setProcessing('FrequencyDomain', L, hop, zp, zp) 53 | 54 | # The first signal (of interest) is singing 55 | rate1, signal1 = wavfile.read('samples/singing_'+str(Fs)+'.wav') 56 | signal1 = np.array(signal1, dtype=float) 57 | signal1 = u.normalize(signal1) 58 | signal1 = u.highpass(signal1, Fs) 59 | delay1 = 0. 60 | 61 | # the second signal (interferer) is some german speech 62 | rate2, signal2 = wavfile.read('samples/german_speech_'+str(Fs)+'.wav') 63 | signal2 = np.array(signal2, dtype=float) 64 | signal2 = u.normalize(signal2) 65 | signal2 = u.highpass(signal2, Fs) 66 | delay2 = 1. 67 | 68 | # create the room with sources and mics 69 | room1 = rg.Room.shoeBox2D( 70 | [0,0], 71 | room_dim, 72 | Fs, 73 | t0 = t0, 74 | max_order=max_order_sim, 75 | absorption=absorption, 76 | sigma2_awgn=sigma2_n) 77 | 78 | # add mic and good source to room 79 | room1.addSource(good_source, signal=signal1, delay=delay1) 80 | room1.addMicrophoneArray(mics) 81 | 82 | # start a figure 83 | fig = plt.figure(figsize=figsize) 84 | 85 | #rect = fig.patch 86 | #rect.set_facecolor('white') 87 | #rect.set_alpha(0.15) 88 | 89 | def nice_room_plot(label, leg=None): 90 | ax = plt.gca() 91 | 92 | room1.plot(img_order=np.minimum(room1.max_order, 1), 93 | freq=freq, 94 | xlim=xlim, ylim=ylim, 95 | autoscale_on=False) 96 | 97 | if leg is not None: 98 | l = ax.legend(leg, loc=(0.005,0.85), fontsize=7, frameon=False) 99 | 100 | ax.text(xlim[1]-1.1, ylim[1]-1.1, label, weight='bold') 101 | 102 | ax.axis('on') 103 | ax.tick_params(\ 104 | axis='both', # changes apply to the x-axis 105 | which='both', # both major and minor ticks are affected 106 | bottom='off', # ticks along the bottom edge are off 107 | left='off', 108 | right='off', 109 | top='off', # ticks along the top edge are off 110 | labelbottom='off', 111 | labelleft='off') # 112 | 113 | ax.spines['right'].set_visible(False) 114 | ax.spines['left'].set_visible(False) 115 | ax.spines['bottom'].set_visible(False) 116 | ax.spines['top'].set_visible(False) 117 | 118 | ax.patch.set_facecolor('grey') 119 | ax.patch.set_alpha(0.15) 120 | ax.patch.edgecolor = 'none' 121 | ax.patch.linewidth = 0 122 | ax.edgecolor = 'none' 123 | ax.linewidth = 0 124 | 125 | 126 | ''' 127 | SCENARIO 1 128 | Only one source of interest 129 | Max-SINR 130 | ''' 131 | print 'Scenario1...' 132 | 133 | # Compute the beamforming weights depending on room geometry 134 | good_sources = room1.sources[0].getImages(max_order=max_order_design) 135 | mics.rakeMaxSINRWeights(good_sources, None, 136 | R_n = sigma2_n*np.eye(mics.M), 137 | rcond=0., 138 | attn=True, ff=False) 139 | 140 | # plot the room and beamformer 141 | ax = plt.subplot(1,4,1) 142 | nice_room_plot('A', leg=('800 Hz', '1600 Hz')) 143 | 144 | ''' 145 | SCENARIO 2 146 | One source or interest and one interefer (easy) 147 | Max-SINR 148 | ''' 149 | print 'Scenario2...' 150 | 151 | room1.addSource(normal_interferer, signal=signal2, delay=delay2) 152 | 153 | # Compute the beamforming weights depending on room geometry 154 | bad_sources = room1.sources[1].getImages(max_order=max_order_design) 155 | mics.rakeMaxSINRWeights(good_sources, bad_sources, 156 | R_n = sigma2_n*np.eye(mics.M), 157 | rcond=0., 158 | attn=True, ff=False) 159 | 160 | # plot the room and beamformer 161 | ax = plt.subplot(1,4,2) 162 | nice_room_plot('B') 163 | 164 | 165 | ''' 166 | SCENARIO 3 167 | One source or interest and one interefer (easy) 168 | Max-UDR (eSNR) 169 | ''' 170 | print 'Scenario3...' 171 | 172 | # Compute the beamforming weights depending on room geometry 173 | mics.rakeMaxUDRWeights(good_sources, bad_sources, 174 | R_n = sigma2_n*np.eye(mics.M), 175 | attn=True, ff=False) 176 | 177 | # plot the room and beamformer 178 | plt.subplot(1,4,3) 179 | nice_room_plot('C') 180 | 181 | ''' 182 | SCENARIO 4 183 | One source and one interferer in the direct path (hard) 184 | Max-SINR 185 | ''' 186 | print 'Scenario4...' 187 | 188 | room1.sources.pop() 189 | room1.addSource(hard_interferer, signal=signal2, delay=delay2) 190 | 191 | # Compute the beamforming weights depending on room geometry 192 | bad_sources = room1.sources[1].getImages(max_order=max_order_design) 193 | mics.rakeMaxSINRWeights(good_sources, bad_sources, 194 | R_n = sigma2_n*np.eye(mics.M), 195 | rcond=0., 196 | attn=True, ff=False) 197 | 198 | # plot the room and beamformer 199 | ax = plt.subplot(1,4,4) 200 | nice_room_plot('D') 201 | 202 | plt.subplots_adjust(left=0.0, right=1., bottom=0., top=1., wspace=0.05, hspace=0.02) 203 | 204 | fig.savefig('figures/beam_scenarios.pdf') 205 | fig.savefig('figures/beam_scenarios.png',dpi=300) 206 | 207 | plt.show() 208 | 209 | -------------------------------------------------------------------------------- /figure_filter_avg_ir.py: -------------------------------------------------------------------------------- 1 | 2 | import numpy as np 3 | import matplotlib 4 | import matplotlib.pyplot as plt 5 | from scipy.io import wavfile 6 | from scipy.signal import resample 7 | 8 | import Room as rg 9 | import beamforming as bf 10 | import windows 11 | import utilities as u 12 | 13 | # Beam pattern figure properties 14 | freq=[800, 1600] 15 | figsize=(1.88,2.24) 16 | xlim=[-4,8] 17 | ylim=[-4.9,9.4] 18 | 19 | # Some simulation parameters 20 | Fs = 8000 21 | t0 = 1./(Fs*np.pi*1e-2) # starting time function of sinc decay in RIR response 22 | absorption = 0.90 23 | max_order_sim = 10 24 | sigma2_n = 1e-7 25 | 26 | # Room 1 : Shoe box 27 | room_dim = [4, 6] 28 | 29 | # the good source is fixed for all 30 | good_source = [1, 4.5] # good source 31 | normal_interferer = [3, 4] # interferer 32 | hard_interferer = [1.5, 3] # interferer in direct path 33 | 34 | # microphone array design parameters 35 | mic1 = [2, 1.5] # position 36 | M = 8 # number of microphones 37 | d = 0.08 # distance between microphones 38 | phi = 0. # angle from horizontal 39 | max_order_design = 1 # maximum image generation used in design 40 | shape = 'Linear' # array shape 41 | 42 | # create a microphone array 43 | if shape is 'Circular': 44 | mics = bf.Beamformer.circular2D(Fs, mic1, M, phi, d*M/(2*np.pi)) 45 | else: 46 | mics = bf.Beamformer.linear2D(Fs, mic1, M, phi, d) 47 | 48 | # define the array processing type 49 | N = int(1.5*Fs) # frame length 50 | zero_padding_factor = 2 51 | mics.setProcessing('TimeDomain', N) 52 | 53 | # The first signal (of interest) is singing 54 | rate1, signal1 = wavfile.read('samples/singing_'+str(Fs)+'.wav') 55 | signal1 = np.array(signal1, dtype=float) 56 | signal1 = u.normalize(signal1) 57 | signal1 = u.highpass(signal1, Fs) 58 | delay1 = 0. 59 | 60 | # the second signal (interferer) is some german speech 61 | rate2, signal2 = wavfile.read('samples/german_speech_'+str(Fs)+'.wav') 62 | signal2 = np.array(signal2, dtype=float) 63 | signal2 = u.normalize(signal2) 64 | signal2 = u.highpass(signal2, Fs) 65 | delay2 = 1. 66 | 67 | # create the room with sources and mics 68 | room1 = rg.Room.shoeBox2D( 69 | [0,0], 70 | room_dim, 71 | Fs, 72 | t0 = t0, 73 | max_order=max_order_sim, 74 | absorption=absorption, 75 | sigma2_awgn=sigma2_n) 76 | 77 | # add mic and good source to room 78 | room1.addSource(good_source, signal=signal1, delay=delay1) 79 | room1.addSource(normal_interferer, signal=signal2, delay=delay2) 80 | room1.addMicrophoneArray(mics) 81 | 82 | # plot the room and beamformer 83 | fig = plt.figure(figsize=(4,3)) 84 | 85 | # define a new set of colors for the beam patterns 86 | newmap = plt.get_cmap('autumn') 87 | desat = 0.7 88 | plt.gca().set_color_cycle([newmap(k) for k in desat*np.linspace(0,1,3)]) 89 | 90 | 91 | ''' 92 | BEAMFORMER 1 93 | Rake-MaxSINR 94 | ''' 95 | print 'Beamformer 1...' 96 | 97 | # Compute the beamforming weights depending on room geometry 98 | good_sources = room1.sources[0].getImages(max_order=max_order_design) 99 | bad_sources = room1.sources[1].getImages(max_order=max_order_design) 100 | mics.rakeMaxSINRWeights(good_sources, bad_sources, 101 | R_n = sigma2_n*np.eye(mics.M), 102 | rcond=0., 103 | attn=True, ff=False) 104 | 105 | mics.plot_IR(sum_ir=True, norm=1., zp=zero_padding_factor, linewidth=0.5) 106 | 107 | ''' 108 | BEAMFORMER 2 109 | Rake-MaxUDR (eSNR) 110 | ''' 111 | print 'Beamformer 2...' 112 | 113 | # Compute the beamforming weights depending on room geometry 114 | mics.rakeMaxUDRWeights(good_sources, bad_sources, 115 | R_n = sigma2_n*np.eye(mics.M), 116 | attn=True, ff=False) 117 | 118 | mics.plot_IR(sum_ir=True, norm=1., zp=zero_padding_factor, linewidth=0.5) 119 | 120 | ''' 121 | BEAMFORMER 3 122 | MaxSINR (MVDR) 123 | ''' 124 | print 'Beamformer 3...' 125 | 126 | # Compute the beamforming weights depending on room geometry 127 | mics.rakeMaxSINRWeights(room1.sources[0].getImages(max_order=0), 128 | room1.sources[1].getImages(max_order=0), 129 | R_n = sigma2_n*np.eye(mics.M), 130 | rcond=0., 131 | attn=True, ff=False) 132 | 133 | mics.plot_IR(sum_ir=True, norm=1., zp=zero_padding_factor, linewidth=0.5) 134 | 135 | ''' 136 | FINISH PLOT 137 | ''' 138 | 139 | 140 | leg = ('Rake-MaxSINR', 'Rake-MaxUDR', 'MaxSINR') 141 | plt.legend(leg, fontsize=7, loc='upper left', frameon=False, labelspacing=0) 142 | 143 | # Hide right and top axes 144 | ax1 = plt.gca() 145 | 146 | # prepare axis 147 | #ax1.autoscale(tight=True, axis='x') 148 | ax1.spines['top'].set_visible(False) 149 | ax1.spines['right'].set_visible(False) 150 | ax1.spines['left'].set_visible(False) 151 | ax1.spines['bottom'].set_position(('outward', 5)) 152 | ax1.yaxis.set_ticks_position('left') 153 | ax1.xaxis.set_ticks_position('bottom') 154 | 155 | # set x axis limit 156 | #ax1.set_xlim(0.5, 1.5) 157 | 158 | # Set ticks 159 | plt.xticks(np.arange(0, float(N)/Fs+1, 0.5), size=9) 160 | plt.xlim(0, 1.5) 161 | plt.yticks([]) 162 | 163 | # Set labels 164 | plt.xlabel(r'Time [s]', fontsize=10) 165 | plt.ylabel('') 166 | plt.tight_layout() 167 | 168 | fig.savefig('figures/AvgIR.pdf') 169 | 170 | # show all plots 171 | plt.show() 172 | -------------------------------------------------------------------------------- /figure_quality.sh: -------------------------------------------------------------------------------- 1 | #!/bin/bash 2 | 3 | # This script will dispatch the perceptual quality evaluation 4 | # to multiple process to use most of the computer resource available. 5 | 6 | LOOPS=1000 7 | 8 | # simulate for 1 source to 21 sources 9 | for i in {1..11} 10 | do 11 | echo python figure_quality_sim.py ${i} ${LOOPS} 12 | screen -d -m python figure_quality_sim.py ${i} ${LOOPS} 13 | done 14 | -------------------------------------------------------------------------------- /figure_quality_plot.py: -------------------------------------------------------------------------------- 1 | import numpy as np 2 | import matplotlib.pyplot as plt 3 | import utilities as u 4 | import metrics as metrics 5 | 6 | import sys 7 | import os 8 | import fnmatch 9 | 10 | max_sources = 11 11 | sim_data_dir = './sim_data/' 12 | 13 | beamformer_names = ['Rake-DS', 14 | 'Rake-MaxSINR', 15 | 'Rake-MaxUDR'] 16 | bf_dict = dict(zip(beamformer_names, 17 | range(len(beamformer_names)))) 18 | NBF = len(beamformer_names) 19 | 20 | loops = 0 21 | 22 | if len(sys.argv) == 0: 23 | # if no argument is specified, use all available files 24 | name_pattern = './sim_data/quality_2015*.npz' 25 | files = [file for file in os.listdir(sim_data_dir) if fnmatch.fnmatch(file, name_pattern)] 26 | else: 27 | files = sys.argv[1:] 28 | 29 | # Empty data containers 30 | good_source = np.zeros((0,2)) 31 | bad_source = np.zeros((0,2)) 32 | ipesq = np.zeros((0,2)) 33 | opesq_tri = np.zeros((0,2,2)) 34 | opesq_bf = np.zeros((0,2,NBF,max_sources)) 35 | isinr = np.zeros((0)) 36 | osinr_tri = np.zeros((0,2)) 37 | osinr_bf = np.zeros((0,NBF,max_sources)) 38 | 39 | # Read in all the data 40 | for fname in files: 41 | print 'Loading from',fname 42 | 43 | a = np.load(fname) 44 | 45 | good_source = np.concatenate((good_source, a['good_source']), axis=0) 46 | bad_source = np.concatenate((bad_source, a['bad_source']), axis=0) 47 | 48 | isinr = np.concatenate((isinr,u.dB(a['isinr'])), axis=0) 49 | osinr_bf = np.concatenate((osinr_bf,u.dB(a['osinr_bf'])), axis=0) 50 | osinr_tri = np.concatenate((osinr_tri,u.dB(a['osinr_trinicon'])), axis=0) 51 | ipesq = np.concatenate((ipesq,a['pesq_input']), axis=0) 52 | opesq_bf = np.concatenate((opesq_bf,a['pesq_bf']), axis=0) 53 | opesq_tri = np.concatenate((opesq_tri,a['pesq_trinicon']), axis=0) 54 | 55 | loops = good_source.shape[0] 56 | 57 | print 'Number of loops:',loops 58 | print 'Median input Raw MOS',np.median(ipesq[:,0]) 59 | print 'Median input MOS LQO',np.median(ipesq[:,1]) 60 | print 'Median input SINR',np.median(isinr[:]) 61 | 62 | # Trinicon is blind so we have PESQ for both output channels 63 | # Select the channel that has highest Raw MOS for evaluation 64 | I_tri = np.argmax(opesq_tri[:,0,:], axis=1) 65 | opesq_tri_max = np.array([opesq_tri[i,:,I_tri[i]] for i in xrange(opesq_tri.shape[0])]) 66 | osinr_tri_max = np.array([osinr_tri[i,I_tri[i]] for i in xrange(osinr_tri.shape[0])]) 67 | 68 | print 'Median Trinicon Raw MOS',np.median(opesq_tri_max[:,0]) 69 | print 'Median Trinicon MOS LQO',np.median(opesq_tri_max[:,1]) 70 | print 'Median Trinicon SINR',np.median(osinr_tri_max[:]) 71 | 72 | def nice_plot(x, ylabel, bf_order=None): 73 | ''' 74 | Define a function to plot consistently the data 75 | ''' 76 | 77 | if bf_order is None: 78 | bf_order = beamformer_names 79 | 80 | ax1 = plt.gca() 81 | 82 | newmap = plt.get_cmap('gist_heat') 83 | from itertools import cycle 84 | 85 | # totally a hack to get the same line styles as Fig6/7 86 | lines = ['-D','-v','->','-s','-o'] 87 | linecycler = cycle(lines) 88 | 89 | # totally a hack to get the same line styles as Fig6/7 90 | map1 = [newmap( k ) for k in np.linspace(0.25,0.9,5)] 91 | map2 = [map1[3],map1[2],map1[4],map1[0],map1[1]] 92 | 93 | ax1.set_color_cycle(map2) 94 | 95 | # no clipping of the beautiful markers 96 | plt.setp(ax1,'clip_on',False) 97 | 98 | for bf in bf_order: 99 | i = bf_dict[bf] 100 | p, = plt.plot(range(0, max_sources), 101 | np.median(x[:,i,:], axis=0), 102 | next(linecycler), 103 | linewidth=1, 104 | markersize=4, 105 | markeredgewidth=.5, 106 | clip_on=False) 107 | 108 | if bf == 'Rake-MaxSINR': 109 | plt.fill_between(range(0, max_sources), 110 | np.percentile(x[:,i,:], 25, axis=0), 111 | np.percentile(x[:,i,:], 75, axis=0), 112 | color='grey', 113 | linewidth=0.3, 114 | edgecolor='k', 115 | alpha=0.7) 116 | 117 | # Hide right and top axes 118 | ax1.spines['top'].set_visible(False) 119 | ax1.spines['right'].set_visible(False) 120 | ax1.spines['bottom'].set_position(('outward', 10)) 121 | ax1.spines['left'].set_position(('outward', 15)) 122 | ax1.yaxis.set_ticks_position('left') 123 | ax1.xaxis.set_ticks_position('bottom') 124 | 125 | # Make ticks nicer 126 | ax1.xaxis.set_tick_params(width=.3, length=3) 127 | ax1.yaxis.set_tick_params(width=.3, length=3) 128 | 129 | # Make axis lines thinner 130 | for axis in ['bottom','left']: 131 | ax1.spines[axis].set_linewidth(0.3) 132 | 133 | # Set ticks fontsize 134 | plt.xticks(size=9) 135 | plt.yticks(size=9) 136 | 137 | # Set labels 138 | plt.xlabel(r'Number of images $K$', fontsize=10) 139 | plt.ylabel(ylabel, fontsize=10) 140 | 141 | plt.legend(bf_order, fontsize=7, loc='upper left', frameon=False, labelspacing=0) 142 | 143 | 144 | ''' 145 | # Here is a larger figure with all performance measures. 146 | plt.figure(figsize=(12,6)) 147 | 148 | plt.subplot(2,3,1) 149 | nice_plot(opesq_bf[:,0,:,:], 'PESQ [Raw MOS]') 150 | plt.xlabel('Number of sources') 151 | plt.ylabel('Raw MOS') 152 | 153 | plt.subplot(2,3,2) 154 | nice_plot(opesq_bf[:,1,:,:], 'PESQ [MOS LQO]') 155 | 156 | plt.subplot(2,3,3) 157 | nice_plot(osinr_bf, 'SINR [dB]') 158 | plt.xlabel('Number of sources') 159 | plt.ylabel('output SINR') 160 | 161 | plt.subplot(2,3,4) 162 | nice_plot(opesq_bf[:,0,:,:] - ipesq[:,0,np.newaxis,np.newaxis], 'Improvement PESQ [Raw MOS]') 163 | plt.xlabel('Number of sources') 164 | plt.ylabel('Improvement Raw MOS') 165 | 166 | plt.subplot(2,3,5) 167 | nice_plot(opesq_bf[:,1,:,:] - ipesq[:,1,np.newaxis,np.newaxis], 'Improvement PESQ [MOS LQO]') 168 | plt.xlabel('Number of sources') 169 | plt.ylabel('Improvement MOS LQO') 170 | 171 | plt.subplot(2,3,6) 172 | nice_plot(osinr_bf[:,:,:] - isinr[:,np.newaxis,np.newaxis], 'Improvement SINR [dB]') 173 | plt.xlabel('Number of sources') 174 | plt.ylabel('Improvement SINR') 175 | 176 | plt.tight_layout(pad=0.2) 177 | ''' 178 | 179 | # Here we plot the figure used in the paper (Fig. 10) 180 | plt.figure(figsize=(4,3)) 181 | nice_plot(opesq_bf[:,0,:,:], 'PESQ [MOS]', 182 | bf_order=['Rake-MaxSINR','Rake-DS','Rake-MaxUDR']) 183 | #plt.plot(np.arange(max_sources), np.median(ipesq[:,0])*np.ones(max_sources)) 184 | #plt.plot(np.arange(max_sources), np.median(opesq_tri_max[:,0])*np.ones(max_sources)) 185 | plt.tight_layout() 186 | plt.savefig('figures/perceptual_quality.pdf') 187 | 188 | -------------------------------------------------------------------------------- /figure_quality_sim.py: -------------------------------------------------------------------------------- 1 | 2 | def perceptual_quality_evaluation(good_source, bad_source): 3 | ''' 4 | Perceputal Quality evaluation simulation 5 | Inner Loop 6 | ''' 7 | 8 | # Imports are done in the function so that it can be easily 9 | # parallelized 10 | import numpy as np 11 | from scipy.io import wavfile 12 | from scipy.signal import resample 13 | from os import getpid 14 | 15 | from Room import Room 16 | from beamforming import Beamformer, MicrophoneArray 17 | from trinicon import trinicon 18 | 19 | from utilities import normalize, to_16b, highpass 20 | from phat import time_align 21 | from metrics import snr, pesq 22 | 23 | # number of number of sources 24 | n_sources = np.arange(1,12) 25 | S = n_sources.shape[0] 26 | 27 | # we the speech samples used 28 | speech_sample1 = 'samples/fq_sample1_8000.wav' 29 | speech_sample2 = 'samples/fq_sample2_8000.wav' 30 | 31 | # Some simulation parameters 32 | Fs = 8000 33 | t0 = 1./(Fs*np.pi*1e-2) # starting time function of sinc decay in RIR response 34 | absorption = 0.90 35 | max_order_sim = 10 36 | SNR_at_mic = 20 # SNR at center of microphone array in dB 37 | 38 | # Room 1 : Shoe box 39 | room_dim = [4, 6] 40 | 41 | # microphone array design parameters 42 | mic1 = [2, 1.5] # position 43 | M = 8 # number of microphones 44 | d = 0.08 # distance between microphones 45 | phi = 0. # angle from horizontal 46 | shape = 'Linear' # array shape 47 | 48 | # create a microphone array 49 | if shape is 'Circular': 50 | mics = Beamformer.circular2D(Fs, mic1, M, phi, d*M/(2*np.pi)) 51 | else: 52 | mics = Beamformer.linear2D(Fs, mic1, M, phi, d) 53 | 54 | # create a single reference mic at center of array 55 | ref_mic = MicrophoneArray(mics.center, Fs) 56 | 57 | # define the array processing type 58 | L = 4096 # frame length 59 | hop = 2048 # hop between frames 60 | zp = 2048 # zero padding (front + back) 61 | mics.setProcessing('FrequencyDomain', L, hop, zp, zp) 62 | 63 | # data receptacles 64 | beamformer_names = ['Rake-DS', 65 | 'Rake-MaxSINR', 66 | 'Rake-MaxUDR'] 67 | bf_weights_fun = [mics.rakeDelayAndSumWeights, 68 | mics.rakeMaxSINRWeights, 69 | mics.rakeMaxUDRWeights] 70 | bf_fnames = ['1','2','3'] 71 | NBF = len(beamformer_names) 72 | 73 | # receptacle arrays 74 | pesq_input = np.zeros(2) 75 | pesq_trinicon = np.zeros((2,2)) 76 | pesq_bf = np.zeros((2,NBF,S)) 77 | isinr = 0 78 | osinr_trinicon = np.zeros(2) 79 | osinr_bf = np.zeros((NBF,S)) 80 | 81 | # since we run multiple thread, we need to uniquely identify filenames 82 | pid = str(getpid()) 83 | 84 | file_ref = 'output_samples/fqref' + pid + '.wav' 85 | file_suffix = '-' + pid + '.wav' 86 | files_tri = ['output_samples/fqt' + str(i+1) + file_suffix for i in xrange(2)] 87 | files_bf = ['output_samples/fq' + str(i+1) + file_suffix for i in xrange(NBF)] 88 | file_raw = 'output_samples/fqraw' + pid + '.wav' 89 | 90 | # Read the two speech samples used 91 | rate, good_signal = wavfile.read(speech_sample1) 92 | good_signal = np.array(good_signal, dtype=float) 93 | good_signal = normalize(good_signal) 94 | good_signal = highpass(good_signal, rate) 95 | good_len = good_signal.shape[0]/float(Fs) 96 | 97 | rate, bad_signal = wavfile.read(speech_sample2) 98 | bad_signal = np.array(bad_signal, dtype=float) 99 | bad_signal = normalize(bad_signal) 100 | bad_signal = highpass(bad_signal, rate) 101 | bad_len = bad_signal.shape[0]/float(Fs) 102 | 103 | # variance of good signal 104 | good_sigma2 = np.mean(good_signal**2) 105 | 106 | # normalize interference signal to have equal power with desired signal 107 | bad_signal *= good_sigma2/np.mean(bad_signal**2) 108 | 109 | # pick good source position at random 110 | good_distance = np.linalg.norm(mics.center[:,0] - np.array(good_source)) 111 | 112 | # pick bad source position at random 113 | bad_distance = np.linalg.norm(mics.center[:,0] - np.array(bad_source)) 114 | 115 | if good_len > bad_len: 116 | good_delay = 0 117 | bad_delay = (good_len - bad_len)/2. 118 | else: 119 | bad_delay = 0 120 | good_delay = (bad_len - good_len)/2. 121 | 122 | # compute the noise variance at center of array wrt good signal and SNR 123 | sigma2_n = good_sigma2/(4*np.pi*good_distance)**2/10**(SNR_at_mic/10) 124 | 125 | # create the reference room for freespace, noisless, no interference simulation 126 | ref_room = Room.shoeBox2D( 127 | [0,0], 128 | room_dim, 129 | Fs, 130 | t0 = t0, 131 | max_order=0, 132 | absorption=absorption, 133 | sigma2_awgn=0.) 134 | ref_room.addSource(good_source, signal=good_signal, delay=good_delay) 135 | ref_room.addMicrophoneArray(ref_mic) 136 | ref_room.compute_RIR() 137 | ref_room.simulate() 138 | reference = ref_mic.signals[0] 139 | reference_n = normalize(reference) 140 | 141 | # save the reference desired signal 142 | wavfile.write(file_ref, Fs, to_16b(reference_n)) 143 | 144 | # create the 'real' room with sources and mics 145 | room1 = Room.shoeBox2D( 146 | [0,0], 147 | room_dim, 148 | Fs, 149 | t0 = t0, 150 | max_order=max_order_sim, 151 | absorption=absorption, 152 | sigma2_awgn=sigma2_n) 153 | 154 | # add sources to room 155 | room1.addSource(good_source, signal=good_signal, delay=good_delay) 156 | room1.addSource(bad_source, signal=bad_signal, delay=bad_delay) 157 | 158 | # Record first the degraded signal at reference mic (center of array) 159 | room1.addMicrophoneArray(ref_mic) 160 | room1.compute_RIR() 161 | room1.simulate() 162 | raw_n = normalize(highpass(ref_mic.signals[0], Fs)) 163 | 164 | # save degraded reference signal 165 | wavfile.write(file_raw, Fs, to_16b(raw_n)) 166 | 167 | # Compute PESQ and SINR of raw degraded reference signal 168 | isinr = snr(reference_n, raw_n[:reference_n.shape[0]]) 169 | pesq_input[:] = pesq(file_ref, file_raw, Fs=Fs).T 170 | 171 | # Now record input of microphone array 172 | room1.addMicrophoneArray(mics) 173 | room1.compute_RIR() 174 | room1.simulate() 175 | 176 | # Run the Trinicon algorithm 177 | double_sig = mics.signals.copy() 178 | for i in xrange(2): 179 | double_sig = np.concatenate((double_sig, mics.signals), axis=1) 180 | sig_len = mics.signals.shape[1] 181 | output_trinicon = trinicon(double_sig)[:,-sig_len:] 182 | 183 | # normalize time-align and save to file 184 | output_tri1 = normalize(highpass(output_trinicon[0,:], Fs)) 185 | output_tri1 = time_align(reference_n, output_tri1) 186 | wavfile.write(files_tri[0], Fs, to_16b(output_tri1)) 187 | output_tri2 = normalize(highpass(output_trinicon[1,:], Fs)) 188 | output_tri2 = time_align(reference_n, output_tri2) 189 | wavfile.write(files_tri[1], Fs, to_16b(output_tri2)) 190 | 191 | # evaluate 192 | # Measure PESQ and SINR for both output signals, we'll sort out later 193 | pesq_trinicon = pesq(file_ref, files_tri, Fs=Fs) 194 | osinr_trinicon[0] = snr(reference_n, output_tri1) 195 | osinr_trinicon[1] = snr(reference_n, output_tri2) 196 | 197 | # Run all the beamformers 198 | for k,s in enumerate(n_sources): 199 | 200 | ''' 201 | BEAMFORMING PART 202 | ''' 203 | # Extract image sources locations and create noise covariance matrix 204 | good_sources = room1.sources[0].getImages(n_nearest=s, 205 | ref_point=mics.center) 206 | bad_sources = room1.sources[1].getImages(n_nearest=s, 207 | ref_point=mics.center) 208 | Rn = sigma2_n*np.eye(mics.M) 209 | 210 | # run for all beamformers considered 211 | for i, bfr in enumerate(beamformer_names): 212 | 213 | # compute the beamforming weights 214 | bf_weights_fun[i](good_sources, bad_sources, 215 | R_n = sigma2_n*np.eye(mics.M), 216 | attn=True, ff=False) 217 | 218 | output = mics.process() 219 | output = normalize(highpass(output, Fs)) 220 | output = time_align(reference_n, output) 221 | 222 | # save files for PESQ evaluation 223 | wavfile.write(files_bf[i], Fs, to_16b(output)) 224 | 225 | # compute output SINR 226 | osinr_bf[i,k] = snr(reference_n, output) 227 | 228 | # compute PESQ 229 | pesq_bf[:,i,k] = pesq(file_ref, files_bf[i], Fs=Fs).T 230 | 231 | # end of beamformers loop 232 | 233 | # end of number of sources loop 234 | 235 | return pesq_input, pesq_trinicon, pesq_bf, isinr, osinr_trinicon, osinr_bf 236 | 237 | 238 | 239 | if __name__ == '__main__': 240 | 241 | import numpy as np 242 | import sys 243 | import time 244 | 245 | if len(sys.argv) == 3 and sys.argv[1] == '-s': 246 | parallel = False 247 | Loops = int(sys.argv[2]) 248 | elif len(sys.argv) == 2: 249 | parallel = True 250 | Loops = int(sys.argv[1]) 251 | else: 252 | print 'Usage: ipython figure_quality_sim.py -- [-s]