├── .Rbuildignore
├── .github
└── workflows
│ └── check-standard.yml
├── .gitignore
├── .travis.yml
├── CONTRIBUTING.md
├── DESCRIPTION
├── LICENSE
├── NAMESPACE
├── NEWS.md
├── R
├── calculate_responses.R
├── ceteris_paribus.R
├── explain.R
├── model_performance.R
├── pbcTest.R
├── pbcTrain.R
├── plot_ceteris_paribus.R
├── plot_explainer.R
├── plot_model_performance.R
├── plot_prediction_breakdown.R
├── plot_variable_response.R
├── prediction_breakdown.R
├── print_ceteris_paribus.R
├── print_explainer.R
├── print_model_performance.R
├── print_prediction_breakdown.R
├── print_variable_response.R
├── theme_mi2.R
├── variable_response.R
└── welcome.R
├── README.md
├── _pkgdown.yml
├── codecov.yml
├── data
├── pbcTest.rda
└── pbcTrain.rda
├── docs
├── CONTRIBUTING.html
├── MI2logo.jpg
├── articles
│ ├── Custom_predict_for_survival_models.html
│ ├── Global_explanations.html
│ ├── Global_explanations_files
│ │ └── figure-html
│ │ │ ├── unnamed-chunk-3-1.png
│ │ │ ├── unnamed-chunk-5-1.png
│ │ │ └── unnamed-chunk-6-1.png
│ ├── How_to_compare_models_with_survxai.html
│ ├── How_to_compare_models_with_survxai_files
│ │ └── figure-html
│ │ │ ├── unnamed-chunk-10-1.png
│ │ │ ├── unnamed-chunk-11-1.png
│ │ │ ├── unnamed-chunk-12-1.png
│ │ │ ├── unnamed-chunk-13-1.png
│ │ │ ├── unnamed-chunk-14-1.png
│ │ │ ├── unnamed-chunk-14-2.png
│ │ │ ├── unnamed-chunk-14-3.png
│ │ │ ├── unnamed-chunk-15-1.png
│ │ │ ├── unnamed-chunk-16-1.png
│ │ │ ├── unnamed-chunk-16-2.png
│ │ │ ├── unnamed-chunk-16-3.png
│ │ │ ├── unnamed-chunk-17-1.png
│ │ │ ├── unnamed-chunk-17-2.png
│ │ │ ├── unnamed-chunk-17-3.png
│ │ │ ├── unnamed-chunk-18-1.png
│ │ │ ├── unnamed-chunk-18-2.png
│ │ │ ├── unnamed-chunk-18-3.png
│ │ │ ├── unnamed-chunk-19-1.png
│ │ │ ├── unnamed-chunk-19-2.png
│ │ │ ├── unnamed-chunk-19-3.png
│ │ │ ├── unnamed-chunk-20-1.png
│ │ │ ├── unnamed-chunk-20-2.png
│ │ │ ├── unnamed-chunk-20-3.png
│ │ │ ├── unnamed-chunk-21-1.png
│ │ │ ├── unnamed-chunk-21-2.png
│ │ │ ├── unnamed-chunk-21-3.png
│ │ │ ├── unnamed-chunk-23-1.png
│ │ │ ├── unnamed-chunk-23-2.png
│ │ │ ├── unnamed-chunk-23-3.png
│ │ │ ├── unnamed-chunk-25-1.png
│ │ │ ├── unnamed-chunk-25-2.png
│ │ │ ├── unnamed-chunk-25-3.png
│ │ │ ├── unnamed-chunk-26-1.png
│ │ │ ├── unnamed-chunk-7-1.png
│ │ │ ├── unnamed-chunk-8-1.png
│ │ │ └── unnamed-chunk-9-1.png
│ ├── Local_explanations.html
│ ├── Local_explanations_files
│ │ └── figure-html
│ │ │ ├── unnamed-chunk-2-1.png
│ │ │ ├── unnamed-chunk-3-1.png
│ │ │ └── unnamed-chunk-4-1.png
│ └── index.html
├── authors.html
├── docsearch.css
├── docsearch.js
├── index.html
├── jquery.sticky-kit.min.js
├── link.svg
├── news
│ └── index.html
├── pkgdown.css
├── pkgdown.js
├── pkgdown.yml
└── reference
│ ├── ceteris_paribus.html
│ ├── explain.html
│ ├── index.html
│ ├── model_performance.html
│ ├── pbcTest.html
│ ├── pbcTrain.html
│ ├── plot.surv_ceteris_paribus_explainer-1.png
│ ├── plot.surv_ceteris_paribus_explainer.html
│ ├── plot.surv_explainer-1.png
│ ├── plot.surv_explainer.html
│ ├── plot.surv_model_performance_explainer-1.png
│ ├── plot.surv_model_performance_explainer.html
│ ├── plot.surv_prediction_breakdown_explainer-1.png
│ ├── plot.surv_prediction_breakdown_explainer.html
│ ├── plot.surv_variable_response_explainer-1.png
│ ├── plot.surv_variable_response_explainer.html
│ ├── prediction_breakdown.html
│ ├── print.surv_ceteris_paribus_explainer.html
│ ├── print.surv_explainer.html
│ ├── print.surv_model_performance_explainer.html
│ ├── print.surv_prediction_breakdown_explainer.html
│ ├── print.surv_variable_response_explainer.html
│ ├── theme_mi2.html
│ └── variable_response.html
├── inst
└── CITATION
├── man
├── ceteris_paribus.Rd
├── explain.Rd
├── model_performance.Rd
├── pbcTest.Rd
├── pbcTrain.Rd
├── plot.surv_ceteris_paribus_explainer.Rd
├── plot.surv_explainer.Rd
├── plot.surv_model_performance_explainer.Rd
├── plot.surv_prediction_breakdown_explainer.Rd
├── plot.surv_variable_response_explainer.Rd
├── prediction_breakdown.Rd
├── print.surv_ceteris_paribus_explainer.Rd
├── print.surv_explainer.Rd
├── print.surv_model_performance_explainer.Rd
├── print.surv_prediction_breakdown_explainer.Rd
├── print.surv_variable_response_explainer.Rd
├── theme_mi2.Rd
└── variable_response.Rd
├── materials
├── survxai-cheatsheet.pdf
└── survxai-cheatsheet.png
├── misc
├── img
│ ├── breakdown.png
│ ├── ceteris_paribus.png
│ ├── model_performance.png
│ └── variable_response.png
├── paper.bib
└── paper.md
├── survxai.Rproj
├── tests
├── testthat.R
└── testthat
│ ├── objects_for_tests.R
│ ├── test_explainer.R
│ ├── test_plot_ceteris_paribus.R
│ ├── test_plot_explainer.R
│ ├── test_plot_model_performance.R
│ ├── test_plot_prediction_breakdown.R
│ ├── test_plot_variable_response.R
│ ├── test_prints.R
│ ├── test_surv_ceteris_paribus.R
│ ├── test_surv_model_performance.R
│ ├── test_surv_prediction_breakdown.R
│ └── test_surv_variable_response.R
└── vignettes
├── Custom_predict_for_survival_models.Rmd
├── Global_explanations.Rmd
├── Global_explanations.html
├── How_to_compare_models_with_survxai.Rmd
├── How_to_compare_models_with_survxai.html
├── How_to_compare_models_with_survxai_files
└── figure-html
│ ├── unnamed-chunk-12-1.png
│ ├── unnamed-chunk-13-1.png
│ ├── unnamed-chunk-15-1.png
│ ├── unnamed-chunk-16-1.png
│ └── unnamed-chunk-9-1.png
├── Local_explanations.Rmd
└── Local_explanations.html
/.Rbuildignore:
--------------------------------------------------------------------------------
1 | ^.*\.Rproj$
2 | ^\.Rproj\.user$
3 | ^codecov\.yml$
4 | .travis.yml
5 | _pkgdown.yaml
6 | docs/
7 | materials/
8 | misc/
9 | LICENSE
10 | ^_pkgdown\.yml$
11 | ^docs$
12 | CONTRIBUTING.md
13 | .github
14 |
--------------------------------------------------------------------------------
/.github/workflows/check-standard.yml:
--------------------------------------------------------------------------------
1 | # For help debugging build failures open an issue on the RStudio community with the 'github-actions' tag.
2 | # https://community.rstudio.com/new-topic?category=Package%20development&tags=github-actions
3 | on:
4 | push:
5 | branches:
6 | - master
7 | pull_request:
8 | branches:
9 | - master
10 |
11 | name: R-CMD-check
12 |
13 | jobs:
14 | R-CMD-check:
15 | runs-on: ${{ matrix.config.os }}
16 |
17 | name: ${{ matrix.config.os }} (${{ matrix.config.r }})
18 |
19 | strategy:
20 | fail-fast: false
21 | matrix:
22 | config:
23 | - {os: windows-latest, r: 'release'}
24 | - {os: macOS-latest, r: 'release'}
25 | - {os: ubuntu-20.04, r: 'release', rspm: "https://packagemanager.rstudio.com/cran/__linux__/focal/latest"}
26 | - {os: ubuntu-20.04, r: 'devel', rspm: "https://packagemanager.rstudio.com/cran/__linux__/focal/latest"}
27 |
28 | env:
29 | R_REMOTES_NO_ERRORS_FROM_WARNINGS: true
30 | RSPM: ${{ matrix.config.rspm }}
31 |
32 | steps:
33 | - uses: actions/checkout@v2
34 |
35 | - uses: r-lib/actions/setup-r@master
36 | with:
37 | r-version: ${{ matrix.config.r }}
38 |
39 | - uses: r-lib/actions/setup-pandoc@master
40 |
41 | - name: Query dependencies
42 | run: |
43 | install.packages('remotes')
44 | saveRDS(remotes::dev_package_deps(dependencies = TRUE), ".github/depends.Rds", version = 2)
45 | writeLines(sprintf("R-%i.%i", getRversion()$major, getRversion()$minor), ".github/R-version")
46 | shell: Rscript {0}
47 |
48 | - name: Cache R packages
49 | if: runner.os != 'Windows'
50 | uses: actions/cache@v1
51 | with:
52 | path: ${{ env.R_LIBS_USER }}
53 | key: ${{ runner.os }}-${{ hashFiles('.github/R-version') }}-1-${{ hashFiles('.github/depends.Rds') }}
54 | restore-keys: ${{ runner.os }}-${{ hashFiles('.github/R-version') }}-1-
55 |
56 | - name: Install system dependencies
57 | if: runner.os == 'Linux'
58 | run: |
59 | while read -r cmd
60 | do
61 | eval sudo $cmd
62 | done < <(Rscript -e 'cat(remotes::system_requirements("ubuntu", "20.04"), sep = "\n")')
63 | - name: Install dependencies
64 | run: |
65 | remotes::install_deps(dependencies = TRUE)
66 | remotes::install_cran("rcmdcheck")
67 | shell: Rscript {0}
68 |
69 | - name: Check
70 | env:
71 | _R_CHECK_CRAN_INCOMING_REMOTE_: false
72 | run: rcmdcheck::rcmdcheck(args = c("--no-manual", "--as-cran"), error_on = "warning", check_dir = "check")
73 | shell: Rscript {0}
74 |
75 | - name: Upload check results
76 | if: failure()
77 | uses: actions/upload-artifact@main
78 | with:
79 | name: ${{ runner.os }}-r${{ matrix.config.r }}-results
80 | path: check
81 |
--------------------------------------------------------------------------------
/.gitignore:
--------------------------------------------------------------------------------
1 | .Rproj.user
2 | .Rhistory
3 | .RData
4 | .Ruserdata
5 | inst/doc
6 |
7 |
--------------------------------------------------------------------------------
/.travis.yml:
--------------------------------------------------------------------------------
1 | language: R
2 | sudo: false
3 | cache: packages
4 | env:
5 | global:
6 | - R_CHECK_ARGS="--no-build-vignettes --no-manual --timings"
7 |
8 | notifications:
9 | email: false
10 |
11 | after_success:
12 | - Rscript -e 'covr::codecov()'
--------------------------------------------------------------------------------
/CONTRIBUTING.md:
--------------------------------------------------------------------------------
1 | ## How to contribute to survxai
2 |
3 | #### **Did you find a bug?**
4 |
5 | Please follow these rules when reporting bugs:
6 |
7 | * Install to the latest version of [survxai from GitHub](https://github.com/MI2DataLab/survxai) and check whether the problem still occurs.
8 |
9 | * **Check, if the bug was not already reported** by searching [Issues](https://github.com/MI2DataLab/survxai/issues).
10 |
11 | * If you're unable to find an open issue addressing the problem, [open a new one](https://github.com/MI2DataLab/survxai/issues/new). Be sure to include a **title and clear description**, and a **sample code** demonstrating the problem.
12 |
13 |
14 | #### **Did you fix a bug?**
15 |
16 | * Ensure that changes meet the requirements of [The tidyverse style guide](http://style.tidyverse.org) and relevant tests are added.
17 |
18 | * Open a new GitHub pull request with the solution.
19 |
20 | * Ensure the PR clearly describes the problem and solution. Include the relevant issue number if applicable.
21 |
22 |
23 | #### **Do you intend to add a new feature or change an existing one?**
24 |
25 | * Suggest your change in the [Issues](https://github.com/MI2DataLab/survxai/issues) and start writing code.
26 |
27 |
28 | Thanks!
29 |
30 | MI2 team
31 |
--------------------------------------------------------------------------------
/DESCRIPTION:
--------------------------------------------------------------------------------
1 | Package: survxai
2 | Title: Visualization of the Local and Global Survival Model Explanations
3 | Version: 0.2.1
4 | Authors@R: c(
5 | person("Aleksandra", "Grudziaz", email = "aleksandra.grudziaz@gmail.com", role = c("aut", "cre")),
6 | person("Alicja", "Gosiewska", email = "alicjagosiewska@gmail.com", role = c("aut")),
7 | person("Przemyslaw", "Biecek", email = "przemyslaw.biecek@gmail.com", role = c("aut", "ths"))
8 | )
9 | Description: Survival models may have very different structures. This package contains functions
10 | for creating a unified representation of a `survival` models, which can be further processed by various
11 | survival explainers. Tools implemented in survxai help to understand how input variables are used in
12 | the model and what impact do they have on the final model prediction. Currently, four explanation methods are implemented.
13 | We can divide them into two groups: local and global.
14 | License: GPL
15 | Encoding: UTF-8
16 | LazyData: true
17 | RoxygenNote: 7.1.0
18 | Imports: breakDown,
19 | ggplot2,
20 | pec,
21 | scales,
22 | survival,
23 | survminer
24 | Depends: prodlim
25 | Suggests: CFC,
26 | covr,
27 | DALEX,
28 | knitr,
29 | randomForestSRC,
30 | rmarkdown,
31 | rms,
32 | testthat,
33 | tibble
34 | VignetteBuilder: knitr
35 | URL: https://mi2datalab.github.io/survxai/
36 | BugReports: https://github.com/MI2DataLab/survxai/issues
37 |
--------------------------------------------------------------------------------
/NAMESPACE:
--------------------------------------------------------------------------------
1 | # Generated by roxygen2: do not edit by hand
2 |
3 | S3method(explain,default)
4 | S3method(plot,surv_ceteris_paribus_explainer)
5 | S3method(plot,surv_explainer)
6 | S3method(plot,surv_model_performance_explainer)
7 | S3method(plot,surv_prediction_breakdown_explainer)
8 | S3method(plot,surv_variable_response_explainer)
9 | S3method(predictSurvProb,surv_explainer)
10 | S3method(print,surv_ceteris_paribus_explainer)
11 | S3method(print,surv_explainer)
12 | S3method(print,surv_model_performance_explainer)
13 | S3method(print,surv_prediction_breakdown_explainer)
14 | S3method(print,surv_variable_response_explainer)
15 | export(ceteris_paribus)
16 | export(explain)
17 | export(model_performance)
18 | export(prediction_breakdown)
19 | export(theme_mi2)
20 | export(variable_response)
21 | import(ggplot2)
22 | import(pec)
23 | importFrom(breakDown,broken)
24 | importFrom(prodlim,Hist)
25 | importFrom(scales,seq_gradient_pal)
26 | importFrom(stats,aggregate)
27 | importFrom(stats,as.formula)
28 | importFrom(stats,median)
29 | importFrom(stats,model.frame)
30 | importFrom(stats,na.omit)
31 | importFrom(stats,predict)
32 | importFrom(stats,quantile)
33 | importFrom(stats,weighted.mean)
34 | importFrom(survival,survfit)
35 | importFrom(survminer,ggsurvplot)
36 | importFrom(utils,head)
37 | importFrom(utils,tail)
38 |
--------------------------------------------------------------------------------
/NEWS.md:
--------------------------------------------------------------------------------
1 |
2 | survxai 0.2.1
3 | ----------------------------------------------------------------
4 | * improvment in documentation
5 | * CITATION,md was added
6 |
7 | survxai 0.2.0
8 | ----------------------------------------------------------------
9 | * CONTRIBUTING.md have been added
10 | * Cheatsheet was created
11 | * Colour palette for `broken_prediction()` and `ceteris_paribus()` was added
12 | * New optional arguments for `plot.broken_prediction()` and `plot.ceteris_paribus()` was added
13 |
14 | survxai 0.1.0
15 | ----------------------------------------------------------------
16 | * survxai package is now public
17 | * `model_performance()`, `variable_response()`, `broken_prediction()` and `ceteris_paribus()` functions were implemented
18 | * Vignettes for local and global explanations were added
19 |
--------------------------------------------------------------------------------
/R/calculate_responses.R:
--------------------------------------------------------------------------------
1 | calculate_responses<- function(vname, times_s, observation_s, model_s, explainer_s, grid_points_s, data_s, predict_function_s) {
2 | if(class(data_s[,vname])=="numeric" || class(data_s[,vname])=="integer"){
3 | probs <- seq(0, 1, length.out = grid_points_s)
4 | new_x <- quantile(data_s[,vname], probs = probs)
5 | quant_x <- mean(observation_s[1,vname] >= data_s[,vname], na.rm = TRUE)
6 | new_data <- observation_s[rep(1, grid_points_s),]
7 | new_data[,vname] <- new_x
8 | y_hat <- t(predict_function_s(model_s, new_data, times_s))
9 |
10 | res <- data.frame(y_hat=numeric(), time = numeric(), vname = character(), new_x = numeric(),
11 | x_quant = numeric(), quant = numeric(), relative_quant = numeric(), label = character(),
12 | class = character())
13 |
14 | for(i in 1:grid_points_s){
15 | tmp <- data.frame(y_hat = y_hat[,i])
16 | tmp$new_x <- as.character(new_x[i])
17 | tmp$vname <- vname
18 | tmp$x_quant <- quant_x
19 | tmp$quant <- probs[i]
20 | tmp$relative_quant <- probs[i] - quant_x
21 | tmp$label <- explainer_s$label
22 | tmp$time <- times_s
23 | tmp$class <- "numeric"
24 | res <- rbind(res, tmp)
25 | }
26 | }
27 | if(class(data_s[,vname])=="character" || class(data_s[,vname])=="factor"){
28 | data_s[,vname] <- as.factor(data_s[,vname])
29 | new_data <- observation_s[rep(1, length(levels(data_s[,vname]))),]
30 | new_data[,vname] <- as.factor(new_data[,vname])
31 | new_x <- levels(data_s[,vname])
32 | new_data[,vname] <- new_x
33 | f <- sapply(data_s, is.factor)
34 | cols <- names(which(f))
35 | new_data[cols] <- lapply(new_data[cols], as.factor)
36 | y_hat <- t(predict_function_s(model_s, new_data, times_s))
37 |
38 | res <- data.frame(y_hat=numeric(), time = numeric(), vname = character(), new_x = character(),
39 | x_quant = numeric(), quant = numeric(), relative_quant = numeric(), label = character(),
40 | class = character())
41 |
42 | for(i in 1:length(levels(data_s[,vname]))){
43 | tmp <- data.frame(y_hat = y_hat[,i])
44 | tmp$new_x <- new_x[i]
45 | tmp$vname <- vname
46 | tmp$x_quant <- 0
47 | tmp$quant <- 0
48 | tmp$relative_quant <- 0
49 | tmp$label <- explainer_s$label
50 | tmp$time <- times_s
51 | tmp$class <- "factor"
52 | res <- rbind(res, tmp)
53 | }
54 | }
55 | return(res)
56 | }
57 |
--------------------------------------------------------------------------------
/R/ceteris_paribus.R:
--------------------------------------------------------------------------------
1 | #' Ceteris Paribus
2 | #'
3 | #' @description The \code{ceteris_paribus()} function computes the predictions for the neighbor of our chosen observation. The neighbour is defined as the observations with changed value of one of the variable.
4 | #'
5 | #' @param explainer a model to be explained, preprocessed by the 'survxai::explain' function
6 | #' @param observation a new observation for which predictions need to be explained
7 | #' @param grid_points grid_points number of points used for response path
8 | #' @param selected_variables if specified, then only these variables will be explained
9 | #'
10 | #' @return An object of the class surv_ceteris_paribus_explainer.
11 | #' It's a data frame with calculated average responses.
12 | #' @export
13 | #'
14 | #' @importFrom stats quantile
15 | #' @importFrom utils head
16 | #'
17 | #' @examples
18 | #' \donttest{
19 | #' library(survxai)
20 | #' library(rms)
21 | #' data("pbcTrain")
22 | #' data("pbcTest")
23 | #' predict_times <- function(model, data, times){
24 | #' prob <- rms::survest(model, data, times = times)$surv
25 | #' return(prob)
26 | #' }
27 | #' cph_model <- cph(Surv(years, status)~ sex + bili + stage,
28 | #' data = pbcTrain, surv = TRUE, x = TRUE, y=TRUE)
29 | #' surve_cph <- explain(model = cph_model, data = pbcTest[,-c(1,5)],
30 | #' y = Surv(pbcTest$years, pbcTest$status),
31 | #' predict_function = predict_times)
32 | #' cp_cph <- ceteris_paribus(surve_cph, pbcTest[1,-c(1,5)])
33 | #' }
34 | #' @export
35 |
36 | ceteris_paribus <- function(explainer, observation, grid_points = 5, selected_variables = NULL){
37 | if (!("surv_explainer" %in% class(explainer)))
38 | stop("The ceteris_paribus() function requires an object created with explain() function from survxai package.")
39 | if (is.null(explainer$data))
40 | stop("The ceteris_paribus() function requires explainers created with specified 'data' parameter.")
41 |
42 | data <- base::as.data.frame(explainer$data)
43 | model <- explainer$model
44 | predict_function <- explainer$predict_function
45 | names_to_present <- colnames(data)
46 | grid_points <- grid_points
47 |
48 | if (!is.null(selected_variables)) {
49 | names_to_present <- intersect(names_to_present, selected_variables)
50 | }
51 |
52 | times <- explainer$times
53 | times <- sort(times)
54 |
55 | responses <- lapply(names_to_present, function(vname, times_s, observation_s, model_s, explainer_s, grid_points_s, data_s, predict_function_s) calculate_responses(vname,times_s = times, observation_s = observation, model_s = model, explainer_s = explainer, grid_points_s = grid_points, data_s = data, predict_function_s = predict_function))
56 |
57 | all_responses <- do.call(rbind, responses)
58 | new_y_hat <- predict_function(model, observation, times)
59 | attr(all_responses, "prediction") <- list(observation = observation, new_y_hat = new_y_hat, times = times)
60 | attr(all_responses, "grid_points") <- grid_points
61 |
62 | class(all_responses) <- c("surv_ceteris_paribus_explainer", "data.frame")
63 | all_responses
64 | }
65 |
--------------------------------------------------------------------------------
/R/explain.R:
--------------------------------------------------------------------------------
1 | #' @title Create Survival Model Explainer
2 | #'
3 | #' @description Survival models may have very different structures.
4 | #' This function creates a unified representation of a survival model, which can be further processed by various survival
5 | #' explainers (see also \code{\link[DALEX]{explain}}).
6 | #'
7 | #' Please NOTE, that the \code{model} is actually the only required argument.
8 | #' But some survival explainers may require additional arguments.
9 | #'
10 | #' @param model object - a survival model to be explained
11 | #' @param data data.frame, tibble or matrix - data that will be used by survival explainers. If not provided then will be extracted from the model
12 | #' @param y object of class 'surv', contains event status and times
13 | #' @param times optional argument, the vector of time points on which survival probability will be predicted
14 | #' @param predict_function function that takes three arguments: model, new data, vector with times, and returns numeric vector or matrix with predictions. If not passed, function \code{\link[pec]{predictSurvProb}} is used.
15 | #' @param link function - a transformation/link function that shall be applied to raw model predictions
16 | #' @param label character - the name of the survival model. By default it's extracted from the 'class' attribute of the model.
17 | #' @param ... other parameters
18 | #'
19 | #' @return An object of the class 'surv_explainer'.
20 | #'
21 | #' It's a list with following fields:
22 | #'
23 | #' \itemize{
24 | #' \item \code{model} the explained model
25 | #' \item \code{data} the dataset
26 | #' \item \code{y} event statuses and times
27 | #' \item \code{times} time points on which survival probability is predicted
28 | #' \item \code{predict_function} function that may be used for model predictions, shall return a single numerical value for each time.
29 | #' \item \code{link} function - a transformation/link function that shall be applied to raw model predictions
30 | #' \item \code{class} class/classes of a model
31 | #' \item \code{label} label, by default it's the last value from the \code{class} vector, but may be set to any character.
32 | #' }
33 | #'
34 | #' @importFrom stats predict model.frame
35 | #' @importFrom utils head tail
36 | #'
37 | #' @examples
38 | #' \donttest{
39 | #' library(survxai)
40 | #' library(rms)
41 | #' library(randomForestSRC)
42 | #' data(pbc, package = "randomForestSRC")
43 | #' pbc <- pbc[complete.cases(pbc),]
44 | #' predict_times <- function(model, data, times){
45 | #' prob <- rms::survest(model, data, times = times)$surv
46 | #' return(prob)
47 | #' }
48 | #' cph_model <- cph(Surv(days/365, status)~ sex + bili + stage, data=pbc, surv=TRUE, x = TRUE, y=TRUE)
49 | #' surve_cph <- explain(model = cph_model, data = pbc[,-c(1,2)], y = Surv(pbc$days/365, pbc$status),
50 | #' predict_function = predict_times)
51 | #' }
52 | #' @export
53 |
54 | explain <- function(model, data = NULL, y, times = NULL, predict_function = yhat, link = I, label = tail(class(model), 1), ...) UseMethod("explain")
55 |
56 | #' @rdname explain
57 | #' @export
58 | explain.default <- function(model, data = NULL, y, times = NULL, predict_function = yhat, link = I, label = tail(class(model), 1), ...) {
59 | if (is.null(times)) times <- y[,1]
60 |
61 | if (is.null(data)) {
62 | possible_data <- try(model.frame(model), silent = TRUE)
63 | if (class(possible_data) != "try-error") data <- possible_data
64 | }
65 | # if data is in the tibble format then needs to be translated to data.frame
66 | if ("tbl" %in% class(data)) data <- as.data.frame(data)
67 |
68 | surv_explainer <- list(
69 | model = model,
70 | data = data,
71 | y = y,
72 | times = times,
73 | predict_function = predict_function,
74 | link = link,
75 | class = class(model),
76 | label = label
77 | )
78 | surv_explainer <- c(surv_explainer, list(...))
79 | class(surv_explainer) <- "surv_explainer"
80 | attr(surv_explainer, "formula") <- deparse(substitute(y))
81 | return(surv_explainer)
82 | }
83 |
84 |
85 |
86 | #' @method predictSurvProb surv_explainer
87 | #' @export
88 | predictSurvProb.surv_explainer <- function(object, newdata, times, ...) {
89 | object$predict_function(object$model, newdata, times)
90 | }
91 |
92 | yhat <- function(X.model, newdata, times) {
93 | predictSurvProb(X.model, newdata, times)
94 | }
95 |
--------------------------------------------------------------------------------
/R/model_performance.R:
--------------------------------------------------------------------------------
1 | #' @title Model performance for survival models
2 | #'
3 | #' @description Function \code{model_performance} calculates the prediction error for chosen survival model.
4 | #'
5 | #' @param explainer a model to be explained, preprocessed by the 'survxai::explain' function
6 | #' @param type character - type of the response to be calculated
7 | #' Currently following options are implemented: 'BS' for Expected Brier Score
8 | #'
9 | #' @details
10 | #' For \code{type = "BS"} prediction error is the time dependent estimates of the population average Brier score.
11 | #' At a given time point t, the Brier score for a single observation is the squared difference between observed survival status
12 | #' and a model based prediction of surviving time t.
13 | #'
14 | #' @examples
15 | #' \donttest{
16 | #' library(survxai)
17 | #' library(rms)
18 | #' data("pbcTrain")
19 | #' data("pbcTest")
20 | #' cph_model <- cph(Surv(years, status)~ sex + bili + stage,
21 | #' data=pbcTrain, surv=TRUE, x = TRUE, y=TRUE)
22 | #' surve_cph <- explain(model = cph_model, data = pbcTest[,-c(1,5)],
23 | #' y = Surv(pbcTest$years, pbcTest$status))
24 | #' mp_cph <- model_performance(surve_cph)
25 | #' }
26 | #'
27 | #' @references Ulla B. Mogensen, Hemant Ishwaran, Thomas A. Gerds (2012). Evaluating Random Forests for Survival Analysis Using Prediction Error Curves. Journal of Statistical Software, 50(11), 1-23. URL http://www.jstatsoft.org/v50/i11/.
28 | #'
29 | #' @import pec
30 | #' @importFrom prodlim Hist
31 | #' @importFrom stats as.formula
32 | #'
33 | #' @export
34 |
35 | model_performance <- function(explainer, type = "BS"){
36 | if (!("surv_explainer" %in% class(explainer))) stop("The model_performance() function requires an object created with explain() function from survxai package.")
37 | reference_formula <- eval(explainer$model$call[[2]])
38 | # trick for mlr, to remove third param in Surv
39 | if(length(reference_formula[[2]]) > 3){
40 | reference_formula[[2]][4] <- NULL
41 | }
42 | reference_formula[3] <- 1
43 | surv_vars <- all.vars(explainer$model$call[[2]][[2]])
44 | data <- cbind(explainer$y[,1], explainer$y[,2], explainer$data)
45 | colnames(data)[1:2] <- surv_vars
46 |
47 | switch(type,
48 | BS = {
49 | p <- tryCatch({
50 | p <- pec(explainer$model, data = data, splitMethod = "none", formula = reference_formula)
51 | }, error = function(e) {
52 | p <- pec(explainer, data = data, splitMethod = "none", formula = reference_formula, reference = TRUE)
53 | return(p)
54 | })
55 | res <- data.frame(time = p$time, err = p$AppErr[[2]], err_ref = p$AppErr[[1]], label = explainer$label)
56 | class(res) <- c("surv_model_performance_explainer", "data.frame", "BS")
57 | attr(res, "type") <- type
58 | attr(res, "time") <- explainer$y[,1]
59 | return(res)
60 | },
61 | stop("Currently only 'BS' method is implemented"))
62 | }
63 |
64 |
65 |
66 |
67 |
--------------------------------------------------------------------------------
/R/pbcTest.R:
--------------------------------------------------------------------------------
1 | #' @title pbcTest
2 | #' @description PBC test set
3 | #' Data set based on \code{pbc} from \code{randomForestSRC} package.
4 | #' The data consists of 138 randomly chosen observations The \code{pbcTest} contains only complete cases for each observation.
5 | #' It contains 5 variables: `status`, `sex`, `bili`, `stage`, and `years`.
6 | #'
7 | #' @source randomForestSRC
8 | #' @references Flemming T.R and Harrington D.P., (1991) Counting Processes and Survival Analysis. New York: Wiley.
9 | #' @name pbcTest
10 | #' @docType data
11 | #'
12 | #' @examples
13 | #' data("pbcTest", package = "survxai")
14 | #' head(pbcTest)
15 | NULL
16 |
--------------------------------------------------------------------------------
/R/pbcTrain.R:
--------------------------------------------------------------------------------
1 | #' @title pbcTrain
2 | #' @description PBC train set
3 | #' Data set based on \code{pbc} from \code{randomForestSRC} package.
4 | #' The data consists of 138 randomly chosen observations The \code{pbcTrain} contains only complete cases for each observation.
5 | #' It contains 5 variables: `status`, `sex`, `bili`, `stage`, and `years`.
6 | #'
7 | #' @source randomForestSRC
8 | #' @references Flemming T.R and Harrington D.P., (1991) Counting Processes and Survival Analysis. New York: Wiley.
9 | #' @name pbcTrain
10 | #' @docType data
11 | #'
12 | #' @examples
13 | #' data("pbcTrain", package = "survxai")
14 | #' head(pbcTrain)
15 | NULL
16 |
--------------------------------------------------------------------------------
/R/plot_ceteris_paribus.R:
--------------------------------------------------------------------------------
1 | #' @title Plot for ceteris_paribus object
2 | #'
3 | #' @description Function plot for ceteris_paribus object visualise estimated survival curve of mean probabilities in chosen time points. Black lines on each plot correspond to survival curve for our new observation specified in the \code{ceteris_paribus} function.
4 | #'
5 | #' @param x object of class "surv_ceteris_paribus_explainer"
6 | #' @param ... arguments to be passed to methods, such as graphical parameters for function \code{\link[ggplot2]{geom_step}}.
7 | #' @param selected_variable name of variable we want to draw ceteris paribus plot
8 | #' @param scale_type type of scale of colors, either "discrete" or "gradient"
9 | #' @param scale_col vector containing values of low and high ends of the gradient, when "gradient" type of scale was chosen
10 | #' @param ncol number of columns for faceting
11 | #'
12 | #' @import ggplot2
13 | #' @importFrom scales seq_gradient_pal
14 | #' @examples
15 | #' \donttest{
16 | #' library(survxai)
17 | #' library(rms)
18 | #' data("pbcTest")
19 | #' data("pbcTrain")
20 | #' predict_times <- function(model, data, times){
21 | #' prob <- rms::survest(model, data, times = times)$surv
22 | #' return(prob)
23 | #' }
24 | #' cph_model <- cph(Surv(years, status)~sex + bili + stage, data=pbcTrain, surv=TRUE, x = TRUE, y=TRUE)
25 | #' surve_cph <- explain(model = cph_model, data = pbcTest[,-c(1,5)],
26 | #' y = Surv(pbcTest$years, pbcTest$status), predict_function = predict_times)
27 | #' cp_cph <- ceteris_paribus(surve_cph, pbcTest[1,-c(1,5)])
28 | #' plot(cp_cph)
29 | #' }
30 | #' @method plot surv_ceteris_paribus_explainer
31 | #' @export
32 |
33 | plot.surv_ceteris_paribus_explainer <- function(x, ..., selected_variable = NULL, scale_type = "factor",
34 | scale_col = NULL, ncol = 1) {
35 |
36 | if(!is.null(selected_variable) && !(selected_variable %in% factor(x$vname))){
37 | stop(paste0("Selected variable ", selected_variable, "not present in surv_ceteris_paribus object."))
38 | }
39 |
40 | y_hat <- new_x <- time <- time_2 <- y_hat_2 <- NULL
41 | new_observation_legend <- create_legend(x=x)
42 | seq_length <- attributes(x)$grid_points
43 |
44 | all_responses <- x
45 |
46 | all_predictions <- create_predictions(x)
47 |
48 |
49 | all_responses <- merge(all_responses, new_observation_legend, by="vname")
50 | if(!is.null(selected_variable)){
51 | all_responses <- all_responses[which(all_responses$vname == selected_variable),]
52 | legend <- unique(all_responses$val)
53 | add_theme <- labs(col = legend)
54 | facet <- NULL
55 | title <- ggtitle(paste("Ceteris paribus plot for variable", selected_variable,"."))
56 | }else{
57 | add_theme <- theme(legend.position = "none")
58 | title <- ggtitle(paste("Ceteris paribus plot for", unique(x$label),"model."))
59 | facet <- facet_wrap(~val, ncol = ncol)
60 | }
61 |
62 | #######################
63 | df <- all_responses[,c("vname","new_x")]
64 | df <- unique(df)
65 | df$legend <- 1:nrow(df)
66 | all_responses <- merge(all_responses, df, by=c("vname", "new_x"))
67 |
68 | ############################
69 | scale <- create_scale(all_responses, scale_type, scale_col, selected_variable)
70 |
71 | ggplot(all_responses, aes(x = time, y = y_hat, col = factor(legend))) +
72 | geom_step(...) +
73 | geom_step(data = all_predictions, aes(x = time_2, y = y_hat_2,...), col="black", lty = 2, size = 1) +
74 | scale_y_continuous(breaks = seq(0,1,0.1),
75 | limits = c(0,1),
76 | labels = paste(seq(0,100,10),"%"),
77 | name = "survival probability") +
78 | facet +
79 | theme_mi2() +
80 | add_theme +
81 | title +
82 | scale
83 | }
84 |
85 | create_legend <- function(x){
86 | new_observation <- attributes(x)$prediction$`observation`
87 | values <- as.data.frame(t(new_observation[1,]))
88 | values[,1] <- as.character(values[,1])
89 | new_observation_legend <- data.frame(vname = colnames(new_observation), val = paste0(colnames(new_observation), "=", values[,1]))
90 | return(new_observation_legend)
91 | }
92 |
93 |
94 | create_predictions <- function(x){
95 | pred <- attr(x, "prediction")
96 | all_predictions <- data.frame(prediction = pred$new_y_hat)
97 | times <- data.frame(prediction = pred$times)
98 | all_predictions <- data.frame(t(all_predictions))
99 | all_predictions$time_2 <- times$prediction
100 | colnames(all_predictions)[1] <- "y_hat_2"
101 | return(all_predictions)
102 | }
103 |
104 |
105 | create_scale <- function(all_responses, scale_type, scale_col, selected_variable){
106 | if(scale_type == "gradient"){
107 | if(!is.null(scale_col)){
108 | variables <- unique(all_responses$vname)
109 | v<- c()
110 | for(val in variables){
111 | length <- length(unique(all_responses[all_responses$vname==val,2]))
112 | cc <- seq_gradient_pal(scale_col[1],scale_col[2])(seq(0,1,length.out=length))
113 | v <- c(v,cc)
114 | }
115 | if(!is.null(selected_variable)){
116 | scale <- scale_colour_manual(values = v, labels = factor(unique(all_responses$new_x)))
117 | }else{
118 | scale <- scale_colour_manual(values=v)
119 | }
120 | }else{
121 | message("Please specify the low and high ends of gradient")
122 | scale <- NULL
123 | }
124 | }else{
125 | scale <- NULL
126 | }
127 | return(scale)
128 | }
129 |
--------------------------------------------------------------------------------
/R/plot_explainer.R:
--------------------------------------------------------------------------------
1 | #' @title Plot for surv_explainer object
2 | #'
3 | #' @description Function plot for surv_explainer object visualise estimated survival curve of mean probabilities in chosen time points.
4 | #'
5 | #' @param x object of class "surv_explainer"
6 | #' @param ... other arguments for function \code{\link[survminer]{ggsurvplot}}
7 | #'
8 | #' @import ggplot2
9 | #' @importFrom survival survfit
10 | #' @importFrom survminer ggsurvplot
11 | #' @examples
12 | #' \donttest{
13 | #' library(survxai)
14 | #' library(rms)
15 | #' data("pbcTest")
16 | #' data("pbcTrain")
17 | #' predict_times <- function(model, data, times){
18 | #' prob <- rms::survest(model, data, times = times)$surv
19 | #' return(prob)
20 | #' }
21 | #' cph_model <- cph(Surv(years, status)~sex + bili + stage, data=pbcTrain, surv=TRUE, x = TRUE, y=TRUE)
22 | #' surve_cph <- explain(model = cph_model, data = pbcTest[,-c(1,5)],
23 | #' y = Surv(pbcTest$years, pbcTest$status), predict_function = predict_times)
24 | #' plot(surve_cph)
25 | #' }
26 | #' @method plot surv_explainer
27 | #' @export
28 |
29 |
30 | plot.surv_explainer <- function(x, ...){
31 | fit <- survfit(x$model, data = x$data)
32 | ggsurvplot(fit, data = x$data,...)
33 |
34 | }
35 |
--------------------------------------------------------------------------------
/R/plot_model_performance.R:
--------------------------------------------------------------------------------
1 | #' @title Plot for surv_model_performance object
2 | #'
3 | #' @description Function plot for surv_model_performance object.
4 | #'
5 | #' @param x object of class "surv_model_performance"
6 | #' @param ... optional, additional objects of class "surv_model_performance_explainer"
7 | #'
8 | #' @import ggplot2
9 | #'
10 | #' @examples
11 | #' \donttest{
12 | #' library(survxai)
13 | #' library(rms)
14 | #' data("pbcTest")
15 | #' data("pbcTrain")
16 | #' predict_times <- function(model, data, times){
17 | #' prob <- rms::survest(model, data, times = times)$surv
18 | #' return(prob)
19 | #' }
20 | #' cph_model <- cph(Surv(years, status)~sex + bili + stage, data=pbcTrain, surv=TRUE, x = TRUE, y=TRUE)
21 | #'surve_cph <- explain(model = cph_model, data = pbcTest[,-c(1,5)],
22 | #' y = Surv(pbcTest$years, pbcTest$status), predict_function = predict_times)
23 | #' mp_cph <- model_performance(surve_cph)
24 | #' plot(mp_cph)
25 | #' }
26 | #'
27 | #' @method plot surv_model_performance_explainer
28 | #' @export
29 |
30 | plot.surv_model_performance_explainer <- function(x, ...){
31 | time <- err <- label <- NULL
32 |
33 | df <- data.frame(x)
34 | type <- attributes(x)$type
35 | if (type == "BS") type <- "Brier Score"
36 |
37 | dfl <- list(...)
38 | if (length(dfl) > 0) {
39 | for (resp in dfl) {
40 | class(resp) <- "data.frame"
41 | df <- rbind(df, resp)
42 | }
43 | }
44 |
45 |
46 | ggplot(df, aes(x = time, y = err, color = label)) +
47 | geom_step() +
48 | labs(title = paste("Prediction Error Curve for", type,"method"),
49 | x = "time",
50 | y = "prediction error") +
51 | theme_mi2()+
52 | scale_y_continuous(breaks = seq(0,1,0.1),
53 | limits = c(0,1),
54 | labels = paste(seq(0,100,10),"%"))
55 |
56 |
57 | }
58 |
--------------------------------------------------------------------------------
/R/plot_prediction_breakdown.R:
--------------------------------------------------------------------------------
1 | #' @title Plot for surv_breakdown object
2 | #'
3 | #' @description Function plot for surv_breakdown object visualise estimated survival curve of mean probabilities in chosen time points.
4 | #'
5 | #' @param x an object of class "surv_prediction_breakdown_explainer"
6 | #' @param ... optional, additional objects of class "surv_prediction_breakdown_explainer"
7 | #' @param numerate logical; indicating whether we want to number curves
8 | #' @param lines logical; indicating whether we want to add lines on chosen time point or probability
9 | #' @param lines_type a type of line; see http://sape.inf.usi.ch/quick-reference/ggplot2/linetype
10 | #' @param lines_col a color of line
11 | #' @param scale_col a vector containig two colors for gradient scale in legend
12 | #'
13 | #'
14 | #' @import ggplot2
15 | #' @examples
16 | #' \donttest{
17 | #' library(survxai)
18 | #' library(rms)
19 | #' data("pbcTest")
20 | #' data("pbcTrain")
21 | #' predict_times <- function(model, data, times){
22 | #' prob <- rms::survest(model, data, times = times)$surv
23 | #' return(prob)
24 | #' }
25 | #' cph_model <- cph(Surv(years, status)~sex + bili + stage, data=pbcTrain, surv=TRUE, x = TRUE, y=TRUE)
26 | #' surve_cph <- explain(model = cph_model, data = pbcTest[,-c(1,5)],
27 | #' y = Surv(pbcTest$years, pbcTest$status), predict_function = predict_times)
28 | #' broken_prediction <- prediction_breakdown(surve_cph, pbcTest[1,-c(1,5)])
29 | #' plot(broken_prediction)
30 | #' }
31 | #' @method plot surv_prediction_breakdown_explainer
32 | #'
33 | #' @importFrom scales seq_gradient_pal
34 | #' @export
35 |
36 | plot.surv_prediction_breakdown_explainer <- function(x, ..., numerate = TRUE, lines = TRUE,
37 | lines_type = 1, lines_col = "black",
38 | scale_col = c("#010059","#e0f6fb")){
39 | y <- col <- label <- value <- position <- legend <- NULL
40 |
41 | df <- data.frame(x)
42 | dfl <- list(...)
43 | if (length(dfl) > 0) {
44 | for (resp in dfl) {
45 | class(resp) <- "data.frame"
46 | df <- rbind(df, resp)
47 | }
48 | }
49 |
50 | if(length(dfl)==0){
51 | add_facet <- NULL
52 | legend <- NULL
53 | }else{
54 | add_facet <- facet_wrap(~label, ncol = 1)
55 | legend <- theme(legend.position = "none")
56 | }
57 |
58 |
59 | df <- create_legend_broken(df, x)
60 | #colors
61 | cc <- seq_gradient_pal(scale_col[1],scale_col[2])(seq(0,1,length.out=length(unique(df$legend))))
62 |
63 | median_time <- median(unique(df$x))
64 | median <- which.min(abs(unique(df$x) - median_time))
65 | median <- unique(df$x)[median]
66 |
67 | if(!is.null(attributes(x)$prob)){
68 | line <- geom_hline(yintercept = attributes(x)$prob, color = lines_col, linetype = lines_type)
69 | }else if (!is.null(attributes(x)$time)){
70 | line <- geom_vline(xintercept = attributes(x)$time, color = lines_col, linetype = lines_type)
71 | }else{
72 | line <- geom_vline(xintercept = median, color = lines_col, linetype = lines_type)
73 | }
74 |
75 | if(lines == TRUE){
76 | line <- line
77 | }else{
78 | line <- NULL
79 | }
80 |
81 | if(numerate == TRUE){
82 | numbers <- geom_text(data = df[df$x == median,], aes(label = position), color = "black", show.legend = FALSE, hjust = 0, vjust = 0, nudge_x = 0.4)
83 | }else{
84 | numbers <- NULL
85 | }
86 |
87 | ggplot(df, aes(x=x, y=y, col = factor(legend)))+
88 | geom_step()+
89 | numbers+
90 | labs(title = "BreakDown plot",
91 | x = "time",
92 | y = "mean survival probability",
93 | col = "variable") +
94 | add_facet +
95 | theme_mi2()+
96 | scale_colour_manual(values=cc)+
97 | line+
98 | numbers+
99 | scale_y_continuous(breaks = seq(0,1,0.1),
100 | limits = c(0,1),
101 | labels = paste(seq(0,100,10),"%"),
102 | name = "survival probability") +
103 | legend
104 |
105 |
106 | }
107 |
108 | create_legend_broken <- function(df, x){
109 | df$legend <- paste0(df$position,": ", df$value)
110 | broken_cumm <- attributes(x)$contribution
111 | broken_cumm$contribution <- round(broken_cumm$contribution, digits = 2)
112 | broken_cumm$contribution <- paste0("(", broken_cumm$contribution, ")")
113 | broken_cumm$variable <- as.character(broken_cumm$variable)
114 | broken_cumm <- rbind(broken_cumm, c(round(attributes(x)$Intercept,2), "Intercept"))
115 | broken_cumm <- rbind(broken_cumm, c(round(attributes(x)$Observation,2), "Observation"))
116 |
117 | df <- merge(df, broken_cumm, by = "variable")
118 | df$legend <- paste(df$legend, df$contribution)
119 | df$legend <- factor(df$legend, levels = unique(df$legend[order(df$position)]))
120 | return(df)
121 | }
122 |
--------------------------------------------------------------------------------
/R/plot_variable_response.R:
--------------------------------------------------------------------------------
1 | #' @title Plot for surv_variable_response object
2 | #'
3 | #' @description Function plot for surv_variable_response object shows the expected output condition on a selected variable.
4 | #'
5 | #' @param x an object of class "surv_variable_response"
6 | #' @param ... optional, additional objects of class "surv_variable_response_explainer"
7 | #' @param split a character, either "model" or "variable"; sets the variable for faceting
8 | #'
9 | #' @import ggplot2
10 | #' @importFrom stats aggregate quantile
11 | #'
12 | #' @examples
13 | #' \donttest{
14 | #' library(survxai)
15 | #' library(rms)
16 | #' data("pbcTest")
17 | #' data("pbcTrain")
18 | #' predict_times <- function(model, data, times){
19 | #' prob <- rms::survest(model, data, times = times)$surv
20 | #' return(prob)
21 | #' }
22 | #' cph_model <- cph(Surv(years, status)~sex + bili + stage, data=pbcTrain, surv=TRUE, x = TRUE, y=TRUE)
23 | #' surve_cph <- explain(model = cph_model, data = pbcTest[,-c(1,5)],
24 | #' y = Surv(pbcTest$years, pbcTest$status), predict_function = predict_times)
25 | #' svr_cph <- variable_response(surve_cph, "sex")
26 | #' plot(svr_cph)
27 | #' }
28 | #'
29 | #' @method plot surv_variable_response_explainer
30 | #' @export
31 |
32 | plot.surv_variable_response_explainer <- function(x, ..., split = "model"){
33 | y <- color <- NULL
34 |
35 | df <- data.frame(x)
36 | dfl <- list(...)
37 | if (length(dfl) > 0) {
38 | for (resp in dfl) {
39 | class(resp) <- "data.frame"
40 | df <- rbind(df, resp)
41 | }
42 | }
43 |
44 | if (is.numeric(df$value) & length(unique(df$value))>=4) {
45 | df$value <- cut(df$value, quantile(df$value, prob = seq(0, 1, length.out = 6)), include.lowest = TRUE)
46 | df <- aggregate(y~., data = df, mean)
47 | }
48 |
49 | if (split == "variable") {
50 | add_facet <- facet_wrap(~value, ncol = 1)
51 | df$color <- factor(df$label)
52 | legend <- "model"
53 | } else {
54 | add_facet <- facet_wrap(~label, ncol = 1)
55 | df$color <- factor(df$value)
56 | legend <- x$var[1]
57 | }
58 |
59 |
60 | ggplot(df, aes(x, y, color = color)) +
61 | geom_step() +
62 | labs(title = paste0("Partial Dependency Plot of variable ", df$var[1]),
63 | x = "time",
64 | y = "mean survival probability",
65 | col = legend) +
66 | add_facet +
67 | theme_mi2()+
68 | scale_y_continuous(breaks = seq(0,1,0.1),
69 | limits = c(0,1),
70 | labels = paste(seq(0,100,10),"%"),
71 | name = "survival probability")
72 |
73 |
74 | }
75 |
--------------------------------------------------------------------------------
/R/prediction_breakdown.R:
--------------------------------------------------------------------------------
1 | #' @title BreakDown for survival models
2 | #'
3 | #' @description Function \code{prediction_breakdown} is an extension of a broken function from breakDown package. It computes the contribution in prediction for the variables in the model.
4 | #' The contribution is defined as the difference between survival probabilities for model with added specific value of variable and with the random levels of this variable.
5 | #'
6 | #' @param explainer an object of the class 'surv_explainer'
7 | #' @param observation a new observation to explain
8 | #' @param time a time point at which variable contributions are computed. If NULL median time is taken.
9 | #' @param prob a survival probability at which variable contributions are computed
10 | #' @param ... other parameters corresponding to arguments from \code{\link[breakDown]{broken}} function from \code{breakDown} package. See https://github.com/pbiecek/breakDown/blob/master/R/break_agnostic.R for details
11 | #'
12 | #' @return An object of class surv_prediction_breakdown_explainer
13 | #'
14 | #' @importFrom breakDown broken
15 | #' @importFrom stats weighted.mean na.omit median
16 | #'
17 | #' @examples
18 | #' \donttest{
19 | #' library(survxai)
20 | #' library(rms)
21 | #' data("pbcTest")
22 | #' data("pbcTrain")
23 | #' predict_times <- function(model, data, times){
24 | #' prob <- rms::survest(model, data, times = times)$surv
25 | #' return(prob)
26 | #' }
27 | #' cph_model <- cph(Surv(years, status)~sex + bili + stage, data=pbcTrain, surv=TRUE, x = TRUE, y=TRUE)
28 | #' surve_cph <- explain(model = cph_model, data = pbcTest[,-c(1,5)],
29 | #' y = Surv(pbcTest$years, pbcTest$status), predict_function = predict_times)
30 | #' broken_prediction <- prediction_breakdown(surve_cph, pbcTest[1,-c(1,5)])
31 | #' }
32 | #' @export
33 |
34 |
35 | prediction_breakdown <- function(explainer, observation, time = NULL, prob = NULL, ...){
36 | if (!("surv_explainer" %in% class(explainer))) stop("The prediction_breakdown() function requires an object created with explain() function form survxai package.")
37 | if (is.null(explainer$data)) stop("The prediction_breakdown() function requires explainers created with specified 'data' parameter.")
38 | if (!is.null(time) & !is.null(prob)) stop("Only one of the parameters 'time', 'prob' should be provided.")
39 |
40 | # breakDown
41 | new_pred <- predict_fun(prob, time, explainer)
42 |
43 | oldw <- getOption("warn")
44 | options(warn = -1)
45 | res<- broken(model = explainer$model,
46 | new_observation = observation,
47 | data = explainer$data,
48 | predict.function = new_pred,
49 | ...)
50 | options(warn = oldw)
51 |
52 | class(res) <- "data.frame"
53 |
54 | intercept <- res$contribution[res$variable_name=="Intercept"]
55 | observ <- res$contribution[res$variable=="final_prognosis"]
56 |
57 | result <- data.frame(x = numeric(), y = numeric(), variable = character(), label = character(), position = numeric(), value = character())
58 | res <- res[-c(1, nrow(res)),]
59 |
60 |
61 | times <- sort(explainer$times)
62 |
63 | #baseline
64 | mean_prediction <- calculate_prediction_intercept(explainer, times)
65 | result <- rbind(result, mean_prediction)
66 | #one observation
67 | mean_prediction <- calculate_prediction_observation(explainer, observation, times, res)
68 | result <- rbind(result, mean_prediction)
69 | tmp_data <- explainer$data
70 |
71 | for (i in 1:nrow(res)){
72 | #explainer <- explainer
73 | variable <- res[i, "variable_name"]
74 | tmp_data[,as.character(variable)] <- observation[[as.character(variable)]]
75 | mean_prediction <- calculate_prediction(explainer, tmp_data, times, res, i, variable)
76 | result <- rbind(result, mean_prediction)
77 | }
78 |
79 | res <- res[,c("contribution", "variable_name")]
80 | colnames(res)[2] <- "variable"
81 | attr(result, "contribution") <- res
82 | attr(result, "time") <- time
83 | attr(result, "prob") <- prob
84 | attr(result, "Intercept") <- intercept
85 | attr(result, "Observation") <- observ
86 | class(result) <- c("surv_prediction_breakdown_explainer", "data.frame")
87 | result
88 |
89 | }
90 |
91 |
92 | predict_fun <- function(prob, time, explainer){
93 | if (is.null(prob)) {
94 | if (is.null(time)) time <- median(explainer$times)
95 |
96 | new_pred <- function(model, data){
97 | explainer$predict_function(model, data, times = time)
98 | }
99 | } else {
100 | times_sorted <- sort(explainer$times)
101 |
102 | find_time <- function(x){
103 | tim <- (x < prob)
104 | index <- c(min(which(tim == TRUE)) -1, min(which(tim == TRUE)))
105 | closest_times <- times_sorted[index]
106 | weighted.mean(closest_times, x[index])
107 | }
108 |
109 | new_pred <- function(model, data){
110 | probabilities <- explainer$predict_function(model, data, times = explainer$times)
111 | probabilities <- as.data.frame(probabilities)
112 |
113 | res <- apply(probabilities, MARGIN = 1, FUN = find_time)
114 | res <- na.omit(res)
115 | return(res)
116 |
117 | }
118 |
119 | npred <- new_pred(explainer$model, explainer$data)
120 | message("Number of observations with prob > ", prob, ": ", nrow(explainer$data) - length(npred))
121 | }
122 |
123 | return(new_pred)
124 | }
125 |
126 |
127 |
128 | calculate_prediction_intercept <- function(explainer, times){
129 | prediction <- explainer$predict_function(explainer$model, explainer$data, times)
130 | mean_prediction <- data.frame(x = times, y = colMeans(prediction, na.rm=T))
131 | mean_prediction <- rbind(mean_prediction, c(0, 1))
132 | mean_prediction$variable<- "Intercept"
133 | mean_prediction$label <- explainer$label
134 | mean_prediction$position <- 1
135 | mean_prediction$value <- "Intercept"
136 | return(mean_prediction)
137 | }
138 |
139 | calculate_prediction_observation <- function(explainer, observation, times, res){
140 | prediction <- explainer$predict_function(explainer$model, observation, times)
141 | mean_prediction <- data.frame(x = times, y = prediction[1,])
142 | mean_prediction <- rbind(mean_prediction, c(0, 1))
143 | mean_prediction$variable<- "Observation"
144 | mean_prediction$label <- explainer$label
145 | mean_prediction$position <- nrow(res)+2
146 | mean_prediction$value <- "Observation"
147 | return(mean_prediction)
148 | }
149 |
150 |
151 | calculate_prediction <- function(explainer, tmp_data, times, res, i, variable){
152 | prediction <- explainer$predict_function(explainer$model, tmp_data, times)
153 | mean_prediction <- data.frame(x = times, y = colMeans(prediction, na.rm=T))
154 | mean_prediction <- rbind(mean_prediction, c(0, 1))
155 | mean_prediction$variable<- variable
156 | mean_prediction$label <- explainer$label
157 | mean_prediction$position <- res[i, "position"]
158 | mean_prediction$value <- res[i, "variable"]
159 | return(mean_prediction)
160 | }
161 |
--------------------------------------------------------------------------------
/R/print_ceteris_paribus.R:
--------------------------------------------------------------------------------
1 | #' Ceteris Paribus Print
2 | #'
3 | #' @param x the model of 'surv_ceteris_paribus_explainer' class
4 | #' @param ... further arguments passed to or from other methods
5 | #'
6 | #' @return a data frame
7 | #'
8 | #' @export
9 |
10 | print.surv_ceteris_paribus_explainer <- function(x, ...){
11 | class(x) <- "data.frame"
12 | print(head(x, ...))
13 | }
--------------------------------------------------------------------------------
/R/print_explainer.R:
--------------------------------------------------------------------------------
1 | #' Print Survival Explainer Summary
2 | #'
3 | #' @param x a model survival expaliner created with the `explain()` function
4 | #' @param ... further arguments passed to or from other methods
5 | #'
6 | #' @export
7 |
8 | print.surv_explainer <- function(x, ...) {
9 | cat("Model label: ", x$label, "\n")
10 | cat("Model class: ", paste(x$class, collapse = ","), "\n")
11 | cat("Data head :\n")
12 | print(head(x$data,2))
13 | return(invisible(NULL))
14 | }
--------------------------------------------------------------------------------
/R/print_model_performance.R:
--------------------------------------------------------------------------------
1 | #' Print Survival Model Performance
2 | #'
3 | #' @param x a model to be explained, object of the class 'model_performance_explainer'
4 | #' @param times a vector of integer times on which we want to check the value of prediction error
5 | #' @param ... further arguments passed to or from other methods
6 | #'
7 | #' @export
8 |
9 | print.surv_model_performance_explainer <- function(x, times = NULL, ...) {
10 | if (is.null(times)) times <- sort(attributes(x)$time)[1:10]
11 |
12 | x <- as.data.frame(x)
13 | x <- x[!duplicated(x$time),]
14 | x <- x[which(x$time %in% times),]
15 | rownames(x) <- NULL
16 | colnames(x)[2] <- "prediction error"
17 | x$`prediction error` <- x$`prediction error` * 100
18 | x$`prediction error` <- round(x$`prediction error`, digits = 2)
19 | x$`prediction error` <- paste0("~ ", x$`prediction error`, "%")
20 |
21 | type <- attributes(x)$type
22 | if (type == "BS") type <- "Brier Score"
23 |
24 |
25 | cat(paste("Model performance for", type, "method."))
26 | cat("\n")
27 | print(x[,c("time","prediction error")])
28 | }
29 |
--------------------------------------------------------------------------------
/R/print_prediction_breakdown.R:
--------------------------------------------------------------------------------
1 | #' Prediction Breakdown Print
2 | #'
3 | #' @param x the model model of 'surv_prediction_breakdown_explainer' class
4 | #' @param ... further arguments passed to or from other methods
5 | #' @param digits number of decimal places (round) or significant digits (signif) to be used
6 | #' See the \code{rounding_function} argument
7 | #' @param rounding_function function that is to used for rounding numbers.
8 | #' It may be \code{signif()} which keeps a specified number of significant digits.
9 | #' Or the default \code{round()} to have the same precision for all components
10 | #'
11 | #' @export
12 | print.surv_prediction_breakdown_explainer <- function(x, ..., digits = 3, rounding_function = round) {
13 | broken_cumm <- attributes(x)$contribution
14 | class(broken_cumm) = "data.frame"
15 | broken_cumm$contribution <- broken_cumm$contribution*100
16 | broken_cumm$contribution <- rounding_function(broken_cumm$contribution, digits)
17 | broken_cumm <- broken_cumm[which(abs(broken_cumm$contribution)>=0.01),]
18 | broken_cumm$contribution <- paste0(broken_cumm$contribution, "%")
19 | print(broken_cumm[, "contribution", drop=FALSE])
20 | }
21 |
--------------------------------------------------------------------------------
/R/print_variable_response.R:
--------------------------------------------------------------------------------
1 | #' Variable Response Print
2 | #'
3 | #' @param x the model of 'surv_variable_response_explainer' class
4 | #' @param ... further arguments passed to or from other methods
5 | #'
6 | #' @return a data frame
7 | #'
8 | #' @export
9 |
10 | print.surv_variable_response_explainer <- function(x, ...){
11 | class(x) <- "data.frame"
12 | print(head(x, ...))
13 | }
--------------------------------------------------------------------------------
/R/theme_mi2.R:
--------------------------------------------------------------------------------
1 | #' @title MI^2 plot theme
2 | #'
3 | #' @description ggplot theme for charts generated with MI^2 Data Lab packages.
4 | #'
5 | #' @return theme object that can be added to ggplot2 plots
6 | #'
7 | #' @export
8 | #'
9 | theme_mi2 <- function() {
10 | theme(
11 | axis.ticks = element_line(linetype = "blank"),
12 | axis.title = element_text(family = "sans"),
13 | plot.title = element_text(family = "sans"),
14 | legend.text = element_text(family = "sans"),
15 | legend.title = element_text(family = "sans"),
16 | panel.background = element_rect(fill = "#f5f5f5"),
17 | plot.background = element_rect(
18 | fill = "#f5f5f5",
19 | colour = "aliceblue",
20 | size = 0.8,
21 | linetype = "dotted"
22 | ),
23 | strip.background = element_rect(fill = "gray50"),
24 | strip.text = element_text(family = "sans"),
25 | legend.key = element_rect(fill = NA, colour = NA, size = 0),
26 | legend.background = element_rect(fill = NA)
27 | )
28 | }
29 |
--------------------------------------------------------------------------------
/R/variable_response.R:
--------------------------------------------------------------------------------
1 | #' @title Variable response for survival models
2 | #'
3 | #' @description Function \code{variable_response} calculates the expected output condition on a selected variable.
4 | #'
5 | #' @param explainer an object of the class 'surv_explainer'.
6 | #' @param variable a character with variable name.
7 | #' @param type a character - type of the response to be calculated.
8 | #' Currently following options are implemented: 'pdp' for Partial Dependency.
9 | #' @param link a function - a link function that shall be applied to raw model predictions. This will be inherited from the explainer.
10 | #'
11 | #' @examples
12 | #' \donttest{
13 | #' library(survxai)
14 | #' library(rms)
15 | #' data("pbcTest")
16 | #' data("pbcTrain")
17 | #' predict_times <- function(model, data, times){
18 | #' prob <- rms::survest(model, data, times = times)$surv
19 | #' return(prob)
20 | #' }
21 | #' cph_model <- cph(Surv(years, status)~sex + bili + stage, data=pbcTrain, surv=TRUE, x = TRUE, y=TRUE)
22 | #' surve_cph <- explain(model = cph_model, data = pbcTest[,-c(1,5)],
23 | #' y = Surv(pbcTest$years, pbcTest$status), predict_function = predict_times)
24 | #' svr_cph <- variable_response(surve_cph, "sex")
25 | #' }
26 | #' @export
27 |
28 | variable_response <- function(explainer, variable, type = "pdp", link = explainer$link){
29 | if (!("surv_explainer" %in% class(explainer))) stop("The variable_response() function requires an object created with explain() function from survxai package.")
30 | if (is.null(explainer$data)) stop("The variable_response() function requires explainers created with specified 'data' parameter.")
31 |
32 | switch(type,
33 | pdp = {
34 | res <- surv_partial(explainer, variable)
35 | class(res) <- c("surv_variable_response_explainer", "data.frame", "pdp")
36 | res
37 | },
38 | stop("Currently only 'pdp' method is implemented"))
39 | }
40 |
41 |
42 |
43 |
44 | surv_partial <- function(explainer, variable){
45 | times <- sort(explainer$times)
46 | tmp_data <- explainer$data
47 | values <- unique(explainer$data[,variable])
48 |
49 | partial_data <- data.frame(x = numeric(), y = numeric(), value = character())
50 |
51 | for(i in 1:length(values)){
52 | val <- values[i]
53 | tmp_data[,variable] <- val
54 | prediction <- explainer$predict_function(explainer$model, tmp_data, times)
55 | mean_prediction <- data.frame(x = times, y = colMeans(prediction, na.rm=T))
56 | mean_prediction <- rbind(mean_prediction, c(0, 1))
57 | mean_prediction$value <- val
58 | partial_data <- rbind(partial_data, mean_prediction)
59 | }
60 | partial_data$type <- "pdp"
61 | partial_data$label <- explainer$label
62 | partial_data$var <- variable
63 | return(partial_data)
64 | }
65 |
66 |
67 |
--------------------------------------------------------------------------------
/R/welcome.R:
--------------------------------------------------------------------------------
1 | .onAttach <- function(...) {
2 | packageStartupMessage(paste0("Welcome to survxai (version: ", utils::packageVersion("survxai"), ").", "\n","Information about the package can be found in the GitHub repository: https://github.com/MI2DataLab/survxai"))
3 | }
--------------------------------------------------------------------------------
/README.md:
--------------------------------------------------------------------------------
1 | ```diff
2 | ! Please note that the `survxai` package is not actively maintained.
3 | + Consider using the succeeding `survex` package.
4 | ```
5 | `survex` is available at https://github.com/modeloriented/survex.
6 |
7 | # survxai
8 | [](https://CRAN.R-project.org/package=survxai)
9 | [](http://cranlogs.r-pkg.org/badges/grand-total/survxai)
10 | [](https://travis-ci.org/MI2DataLab/survxai)
11 | [](https://codecov.io/github/MI2DataLab/survxai?branch=master)
12 | [](http://joss.theoj.org/papers/dcc9d53e8a1b1f613d59b9658b113fff)
13 | [](https://bestpractices.coreinfrastructure.org/projects/2123)
14 | [](https://zenodo.org/badge/latestdoi/137778994)
15 |
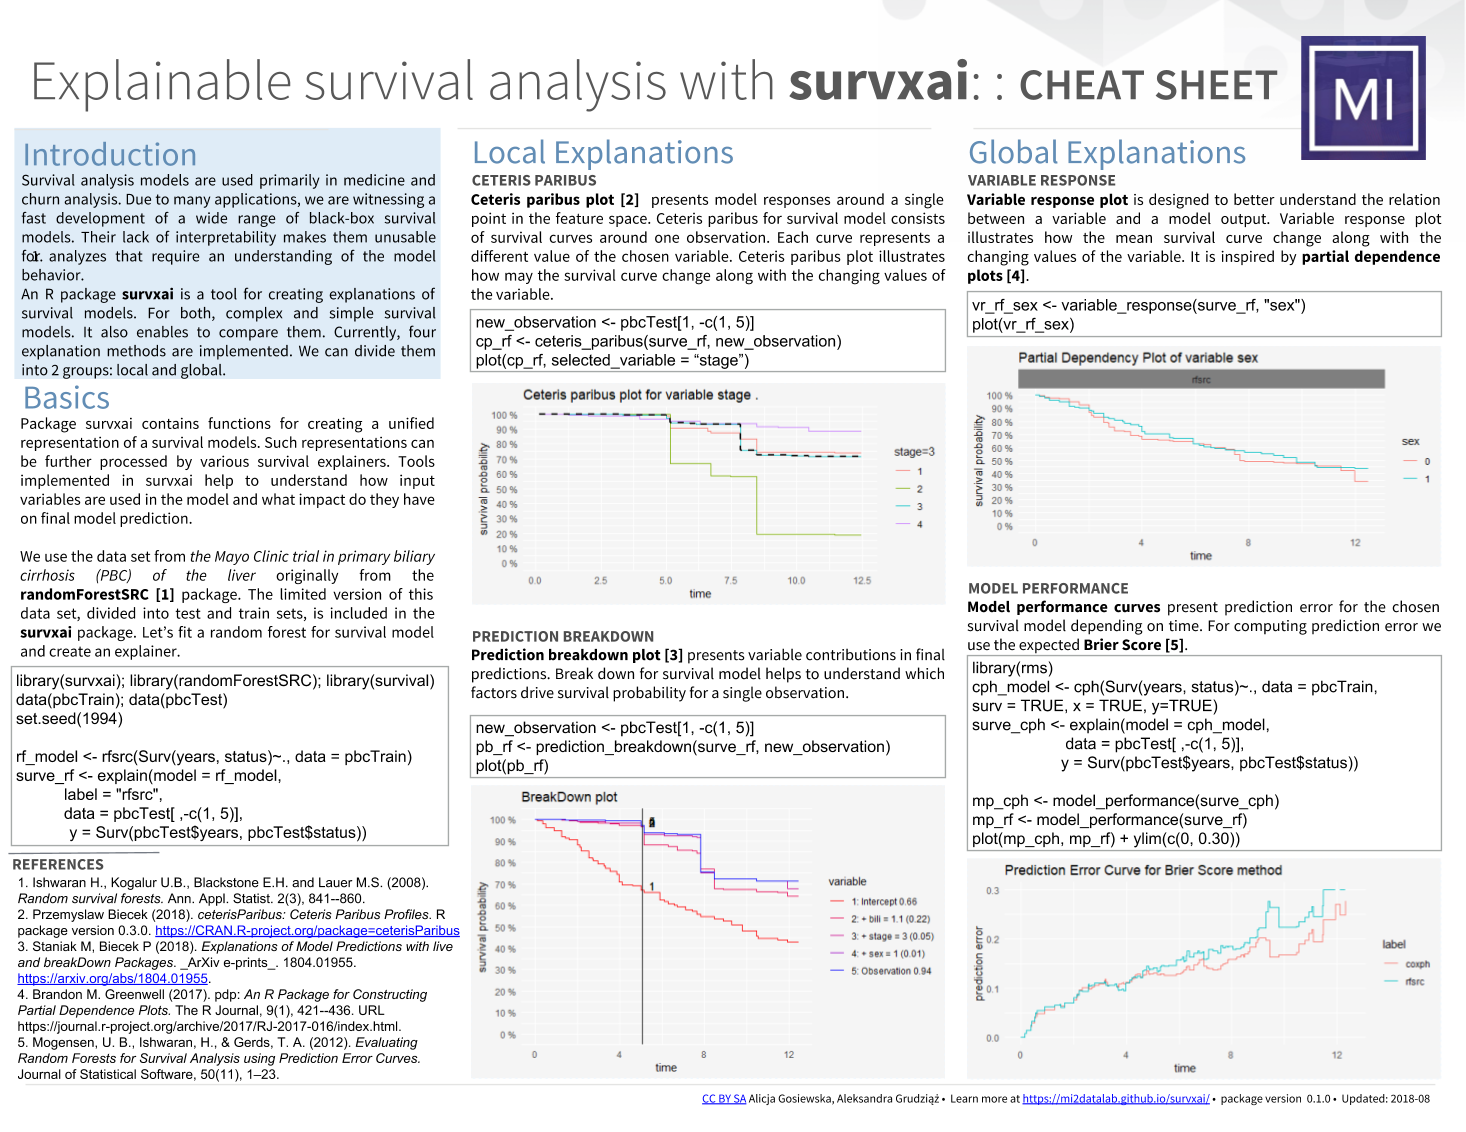
16 | Survival analysis models are used primarily in medicine and churn analysis. Due to many applications, we are witnessing a fast development of a wide range of black-box survival models. Their lack of interpretability makes them unusable for analyzes that require an understanding of the model behavior.
17 |
18 | An R package survxai is a tool for creating explanations of survival models. For both, complex and simple survival models. It also enables to compare them. Currently, four explanation methods are implemented. We can divide them into 2 groups: local and global.
19 |
20 | The read more about the `surxvai` package see paper [survxai: an R package for structure-agnostic explanations of survival models](https://joss.theoj.org/papers/dcc9d53e8a1b1f613d59b9658b113fff) in The Journal of Open Source Software.
21 |
22 | ## Install
23 | ```
24 | devtools::install_github("MI2DataLab/survxai")
25 | ```
26 |
27 | ## CheatSheet
28 |
29 |
30 |
31 |
32 |
33 | ## News
34 | Informations about changes in `survxai` relases can be found in [NEWS](https://github.com/MI2DataLab/survxai/blob/master/NEWS.md).
35 |
36 | ## How to contribute
37 | Informations about creating issues and pull requests in `survxai` can be found in [CONTRIBUTING](https://github.com/MI2DataLab/survxai/blob/master/CONTRIBUTING.md).
38 |
39 |
40 | ## Acknowledgments
41 | Work on this package is financially supported by the 'NCN Opus grant 2016/21/B/ST6/02176'.
42 |
--------------------------------------------------------------------------------
/_pkgdown.yml:
--------------------------------------------------------------------------------
1 | template:
2 | package: MI2template
3 | default_assets: false
4 | home:
5 | links:
6 | - text: Source code
7 | href: https://github.com/MI2DataLab/survxai
8 | - text: Contributing guidelines
9 | href: https://github.com/MI2DataLab/survxai/blob/master/CONTRIBUTING.md
10 |
--------------------------------------------------------------------------------
/codecov.yml:
--------------------------------------------------------------------------------
1 | comment: false
2 |
--------------------------------------------------------------------------------
/data/pbcTest.rda:
--------------------------------------------------------------------------------
https://raw.githubusercontent.com/MI2DataLab/survxai/ee5c7df52b347e422efcf028bf2afe652284fb2d/data/pbcTest.rda
--------------------------------------------------------------------------------
/data/pbcTrain.rda:
--------------------------------------------------------------------------------
https://raw.githubusercontent.com/MI2DataLab/survxai/ee5c7df52b347e422efcf028bf2afe652284fb2d/data/pbcTrain.rda
--------------------------------------------------------------------------------
/docs/CONTRIBUTING.html:
--------------------------------------------------------------------------------
1 |
2 |
3 |
4 |
5 |
6 |
7 |
8 |
9 | NA • survxai
10 |
11 |
12 |
13 |
14 |
15 |
16 |
17 |
18 |
19 |
20 |
21 |
22 |
23 |
24 |
25 |
26 |
27 |
28 |
29 |
33 |
34 |
35 |
36 |
37 |
38 |
39 |
99 |
100 |
101 |
102 |
105 |
106 |
107 |
108 | How to contribute to survxai
109 |
110 |
111 | Did you find a bug?
112 |
113 |
Please follow these rules when reporting bugs:
114 |
115 | Install to the latest version of survxai from GitHub and check whether the problem still occurs.
116 | Check, if the bug was not already reported by searching Issues .
117 | If you’re unable to find an open issue addressing the problem, open a new one . Be sure to include a title and clear description , and a sample code demonstrating the problem.
118 |
119 |
120 |
121 |
122 | Did you fixed a bug?
123 |
124 |
125 | Ensure that changes meet the requirements of The tidyverse style guide and relevant tests are added.
126 | Open a new GitHub pull request with the solution.
127 | Ensure the PR clearly describes the problem and solution. Include the relevant issue number if applicable.
128 |
129 |
130 |
131 |
132 | Do you intend to add a new feature or change an existing one?
133 |
134 |
135 | Suggest your change in the Issues and start writing code.
136 |
137 |
Thanks!
138 |
MI2 team
139 |
140 |
141 |
142 |
143 |
144 |
145 |
146 |
147 |
157 |
158 |
159 |
160 |
161 |
162 |
--------------------------------------------------------------------------------
/docs/MI2logo.jpg:
--------------------------------------------------------------------------------
https://raw.githubusercontent.com/MI2DataLab/survxai/ee5c7df52b347e422efcf028bf2afe652284fb2d/docs/MI2logo.jpg
--------------------------------------------------------------------------------
/docs/articles/Global_explanations_files/figure-html/unnamed-chunk-3-1.png:
--------------------------------------------------------------------------------
https://raw.githubusercontent.com/MI2DataLab/survxai/ee5c7df52b347e422efcf028bf2afe652284fb2d/docs/articles/Global_explanations_files/figure-html/unnamed-chunk-3-1.png
--------------------------------------------------------------------------------
/docs/articles/Global_explanations_files/figure-html/unnamed-chunk-5-1.png:
--------------------------------------------------------------------------------
https://raw.githubusercontent.com/MI2DataLab/survxai/ee5c7df52b347e422efcf028bf2afe652284fb2d/docs/articles/Global_explanations_files/figure-html/unnamed-chunk-5-1.png
--------------------------------------------------------------------------------
/docs/articles/Global_explanations_files/figure-html/unnamed-chunk-6-1.png:
--------------------------------------------------------------------------------
https://raw.githubusercontent.com/MI2DataLab/survxai/ee5c7df52b347e422efcf028bf2afe652284fb2d/docs/articles/Global_explanations_files/figure-html/unnamed-chunk-6-1.png
--------------------------------------------------------------------------------
/docs/articles/How_to_compare_models_with_survxai_files/figure-html/unnamed-chunk-10-1.png:
--------------------------------------------------------------------------------
https://raw.githubusercontent.com/MI2DataLab/survxai/ee5c7df52b347e422efcf028bf2afe652284fb2d/docs/articles/How_to_compare_models_with_survxai_files/figure-html/unnamed-chunk-10-1.png
--------------------------------------------------------------------------------
/docs/articles/How_to_compare_models_with_survxai_files/figure-html/unnamed-chunk-11-1.png:
--------------------------------------------------------------------------------
https://raw.githubusercontent.com/MI2DataLab/survxai/ee5c7df52b347e422efcf028bf2afe652284fb2d/docs/articles/How_to_compare_models_with_survxai_files/figure-html/unnamed-chunk-11-1.png
--------------------------------------------------------------------------------
/docs/articles/How_to_compare_models_with_survxai_files/figure-html/unnamed-chunk-12-1.png:
--------------------------------------------------------------------------------
https://raw.githubusercontent.com/MI2DataLab/survxai/ee5c7df52b347e422efcf028bf2afe652284fb2d/docs/articles/How_to_compare_models_with_survxai_files/figure-html/unnamed-chunk-12-1.png
--------------------------------------------------------------------------------
/docs/articles/How_to_compare_models_with_survxai_files/figure-html/unnamed-chunk-13-1.png:
--------------------------------------------------------------------------------
https://raw.githubusercontent.com/MI2DataLab/survxai/ee5c7df52b347e422efcf028bf2afe652284fb2d/docs/articles/How_to_compare_models_with_survxai_files/figure-html/unnamed-chunk-13-1.png
--------------------------------------------------------------------------------
/docs/articles/How_to_compare_models_with_survxai_files/figure-html/unnamed-chunk-14-1.png:
--------------------------------------------------------------------------------
https://raw.githubusercontent.com/MI2DataLab/survxai/ee5c7df52b347e422efcf028bf2afe652284fb2d/docs/articles/How_to_compare_models_with_survxai_files/figure-html/unnamed-chunk-14-1.png
--------------------------------------------------------------------------------
/docs/articles/How_to_compare_models_with_survxai_files/figure-html/unnamed-chunk-14-2.png:
--------------------------------------------------------------------------------
https://raw.githubusercontent.com/MI2DataLab/survxai/ee5c7df52b347e422efcf028bf2afe652284fb2d/docs/articles/How_to_compare_models_with_survxai_files/figure-html/unnamed-chunk-14-2.png
--------------------------------------------------------------------------------
/docs/articles/How_to_compare_models_with_survxai_files/figure-html/unnamed-chunk-14-3.png:
--------------------------------------------------------------------------------
https://raw.githubusercontent.com/MI2DataLab/survxai/ee5c7df52b347e422efcf028bf2afe652284fb2d/docs/articles/How_to_compare_models_with_survxai_files/figure-html/unnamed-chunk-14-3.png
--------------------------------------------------------------------------------
/docs/articles/How_to_compare_models_with_survxai_files/figure-html/unnamed-chunk-15-1.png:
--------------------------------------------------------------------------------
https://raw.githubusercontent.com/MI2DataLab/survxai/ee5c7df52b347e422efcf028bf2afe652284fb2d/docs/articles/How_to_compare_models_with_survxai_files/figure-html/unnamed-chunk-15-1.png
--------------------------------------------------------------------------------
/docs/articles/How_to_compare_models_with_survxai_files/figure-html/unnamed-chunk-16-1.png:
--------------------------------------------------------------------------------
https://raw.githubusercontent.com/MI2DataLab/survxai/ee5c7df52b347e422efcf028bf2afe652284fb2d/docs/articles/How_to_compare_models_with_survxai_files/figure-html/unnamed-chunk-16-1.png
--------------------------------------------------------------------------------
/docs/articles/How_to_compare_models_with_survxai_files/figure-html/unnamed-chunk-16-2.png:
--------------------------------------------------------------------------------
https://raw.githubusercontent.com/MI2DataLab/survxai/ee5c7df52b347e422efcf028bf2afe652284fb2d/docs/articles/How_to_compare_models_with_survxai_files/figure-html/unnamed-chunk-16-2.png
--------------------------------------------------------------------------------
/docs/articles/How_to_compare_models_with_survxai_files/figure-html/unnamed-chunk-16-3.png:
--------------------------------------------------------------------------------
https://raw.githubusercontent.com/MI2DataLab/survxai/ee5c7df52b347e422efcf028bf2afe652284fb2d/docs/articles/How_to_compare_models_with_survxai_files/figure-html/unnamed-chunk-16-3.png
--------------------------------------------------------------------------------
/docs/articles/How_to_compare_models_with_survxai_files/figure-html/unnamed-chunk-17-1.png:
--------------------------------------------------------------------------------
https://raw.githubusercontent.com/MI2DataLab/survxai/ee5c7df52b347e422efcf028bf2afe652284fb2d/docs/articles/How_to_compare_models_with_survxai_files/figure-html/unnamed-chunk-17-1.png
--------------------------------------------------------------------------------
/docs/articles/How_to_compare_models_with_survxai_files/figure-html/unnamed-chunk-17-2.png:
--------------------------------------------------------------------------------
https://raw.githubusercontent.com/MI2DataLab/survxai/ee5c7df52b347e422efcf028bf2afe652284fb2d/docs/articles/How_to_compare_models_with_survxai_files/figure-html/unnamed-chunk-17-2.png
--------------------------------------------------------------------------------
/docs/articles/How_to_compare_models_with_survxai_files/figure-html/unnamed-chunk-17-3.png:
--------------------------------------------------------------------------------
https://raw.githubusercontent.com/MI2DataLab/survxai/ee5c7df52b347e422efcf028bf2afe652284fb2d/docs/articles/How_to_compare_models_with_survxai_files/figure-html/unnamed-chunk-17-3.png
--------------------------------------------------------------------------------
/docs/articles/How_to_compare_models_with_survxai_files/figure-html/unnamed-chunk-18-1.png:
--------------------------------------------------------------------------------
https://raw.githubusercontent.com/MI2DataLab/survxai/ee5c7df52b347e422efcf028bf2afe652284fb2d/docs/articles/How_to_compare_models_with_survxai_files/figure-html/unnamed-chunk-18-1.png
--------------------------------------------------------------------------------
/docs/articles/How_to_compare_models_with_survxai_files/figure-html/unnamed-chunk-18-2.png:
--------------------------------------------------------------------------------
https://raw.githubusercontent.com/MI2DataLab/survxai/ee5c7df52b347e422efcf028bf2afe652284fb2d/docs/articles/How_to_compare_models_with_survxai_files/figure-html/unnamed-chunk-18-2.png
--------------------------------------------------------------------------------
/docs/articles/How_to_compare_models_with_survxai_files/figure-html/unnamed-chunk-18-3.png:
--------------------------------------------------------------------------------
https://raw.githubusercontent.com/MI2DataLab/survxai/ee5c7df52b347e422efcf028bf2afe652284fb2d/docs/articles/How_to_compare_models_with_survxai_files/figure-html/unnamed-chunk-18-3.png
--------------------------------------------------------------------------------
/docs/articles/How_to_compare_models_with_survxai_files/figure-html/unnamed-chunk-19-1.png:
--------------------------------------------------------------------------------
https://raw.githubusercontent.com/MI2DataLab/survxai/ee5c7df52b347e422efcf028bf2afe652284fb2d/docs/articles/How_to_compare_models_with_survxai_files/figure-html/unnamed-chunk-19-1.png
--------------------------------------------------------------------------------
/docs/articles/How_to_compare_models_with_survxai_files/figure-html/unnamed-chunk-19-2.png:
--------------------------------------------------------------------------------
https://raw.githubusercontent.com/MI2DataLab/survxai/ee5c7df52b347e422efcf028bf2afe652284fb2d/docs/articles/How_to_compare_models_with_survxai_files/figure-html/unnamed-chunk-19-2.png
--------------------------------------------------------------------------------
/docs/articles/How_to_compare_models_with_survxai_files/figure-html/unnamed-chunk-19-3.png:
--------------------------------------------------------------------------------
https://raw.githubusercontent.com/MI2DataLab/survxai/ee5c7df52b347e422efcf028bf2afe652284fb2d/docs/articles/How_to_compare_models_with_survxai_files/figure-html/unnamed-chunk-19-3.png
--------------------------------------------------------------------------------
/docs/articles/How_to_compare_models_with_survxai_files/figure-html/unnamed-chunk-20-1.png:
--------------------------------------------------------------------------------
https://raw.githubusercontent.com/MI2DataLab/survxai/ee5c7df52b347e422efcf028bf2afe652284fb2d/docs/articles/How_to_compare_models_with_survxai_files/figure-html/unnamed-chunk-20-1.png
--------------------------------------------------------------------------------
/docs/articles/How_to_compare_models_with_survxai_files/figure-html/unnamed-chunk-20-2.png:
--------------------------------------------------------------------------------
https://raw.githubusercontent.com/MI2DataLab/survxai/ee5c7df52b347e422efcf028bf2afe652284fb2d/docs/articles/How_to_compare_models_with_survxai_files/figure-html/unnamed-chunk-20-2.png
--------------------------------------------------------------------------------
/docs/articles/How_to_compare_models_with_survxai_files/figure-html/unnamed-chunk-20-3.png:
--------------------------------------------------------------------------------
https://raw.githubusercontent.com/MI2DataLab/survxai/ee5c7df52b347e422efcf028bf2afe652284fb2d/docs/articles/How_to_compare_models_with_survxai_files/figure-html/unnamed-chunk-20-3.png
--------------------------------------------------------------------------------
/docs/articles/How_to_compare_models_with_survxai_files/figure-html/unnamed-chunk-21-1.png:
--------------------------------------------------------------------------------
https://raw.githubusercontent.com/MI2DataLab/survxai/ee5c7df52b347e422efcf028bf2afe652284fb2d/docs/articles/How_to_compare_models_with_survxai_files/figure-html/unnamed-chunk-21-1.png
--------------------------------------------------------------------------------
/docs/articles/How_to_compare_models_with_survxai_files/figure-html/unnamed-chunk-21-2.png:
--------------------------------------------------------------------------------
https://raw.githubusercontent.com/MI2DataLab/survxai/ee5c7df52b347e422efcf028bf2afe652284fb2d/docs/articles/How_to_compare_models_with_survxai_files/figure-html/unnamed-chunk-21-2.png
--------------------------------------------------------------------------------
/docs/articles/How_to_compare_models_with_survxai_files/figure-html/unnamed-chunk-21-3.png:
--------------------------------------------------------------------------------
https://raw.githubusercontent.com/MI2DataLab/survxai/ee5c7df52b347e422efcf028bf2afe652284fb2d/docs/articles/How_to_compare_models_with_survxai_files/figure-html/unnamed-chunk-21-3.png
--------------------------------------------------------------------------------
/docs/articles/How_to_compare_models_with_survxai_files/figure-html/unnamed-chunk-23-1.png:
--------------------------------------------------------------------------------
https://raw.githubusercontent.com/MI2DataLab/survxai/ee5c7df52b347e422efcf028bf2afe652284fb2d/docs/articles/How_to_compare_models_with_survxai_files/figure-html/unnamed-chunk-23-1.png
--------------------------------------------------------------------------------
/docs/articles/How_to_compare_models_with_survxai_files/figure-html/unnamed-chunk-23-2.png:
--------------------------------------------------------------------------------
https://raw.githubusercontent.com/MI2DataLab/survxai/ee5c7df52b347e422efcf028bf2afe652284fb2d/docs/articles/How_to_compare_models_with_survxai_files/figure-html/unnamed-chunk-23-2.png
--------------------------------------------------------------------------------
/docs/articles/How_to_compare_models_with_survxai_files/figure-html/unnamed-chunk-23-3.png:
--------------------------------------------------------------------------------
https://raw.githubusercontent.com/MI2DataLab/survxai/ee5c7df52b347e422efcf028bf2afe652284fb2d/docs/articles/How_to_compare_models_with_survxai_files/figure-html/unnamed-chunk-23-3.png
--------------------------------------------------------------------------------
/docs/articles/How_to_compare_models_with_survxai_files/figure-html/unnamed-chunk-25-1.png:
--------------------------------------------------------------------------------
https://raw.githubusercontent.com/MI2DataLab/survxai/ee5c7df52b347e422efcf028bf2afe652284fb2d/docs/articles/How_to_compare_models_with_survxai_files/figure-html/unnamed-chunk-25-1.png
--------------------------------------------------------------------------------
/docs/articles/How_to_compare_models_with_survxai_files/figure-html/unnamed-chunk-25-2.png:
--------------------------------------------------------------------------------
https://raw.githubusercontent.com/MI2DataLab/survxai/ee5c7df52b347e422efcf028bf2afe652284fb2d/docs/articles/How_to_compare_models_with_survxai_files/figure-html/unnamed-chunk-25-2.png
--------------------------------------------------------------------------------
/docs/articles/How_to_compare_models_with_survxai_files/figure-html/unnamed-chunk-25-3.png:
--------------------------------------------------------------------------------
https://raw.githubusercontent.com/MI2DataLab/survxai/ee5c7df52b347e422efcf028bf2afe652284fb2d/docs/articles/How_to_compare_models_with_survxai_files/figure-html/unnamed-chunk-25-3.png
--------------------------------------------------------------------------------
/docs/articles/How_to_compare_models_with_survxai_files/figure-html/unnamed-chunk-26-1.png:
--------------------------------------------------------------------------------
https://raw.githubusercontent.com/MI2DataLab/survxai/ee5c7df52b347e422efcf028bf2afe652284fb2d/docs/articles/How_to_compare_models_with_survxai_files/figure-html/unnamed-chunk-26-1.png
--------------------------------------------------------------------------------
/docs/articles/How_to_compare_models_with_survxai_files/figure-html/unnamed-chunk-7-1.png:
--------------------------------------------------------------------------------
https://raw.githubusercontent.com/MI2DataLab/survxai/ee5c7df52b347e422efcf028bf2afe652284fb2d/docs/articles/How_to_compare_models_with_survxai_files/figure-html/unnamed-chunk-7-1.png
--------------------------------------------------------------------------------
/docs/articles/How_to_compare_models_with_survxai_files/figure-html/unnamed-chunk-8-1.png:
--------------------------------------------------------------------------------
https://raw.githubusercontent.com/MI2DataLab/survxai/ee5c7df52b347e422efcf028bf2afe652284fb2d/docs/articles/How_to_compare_models_with_survxai_files/figure-html/unnamed-chunk-8-1.png
--------------------------------------------------------------------------------
/docs/articles/How_to_compare_models_with_survxai_files/figure-html/unnamed-chunk-9-1.png:
--------------------------------------------------------------------------------
https://raw.githubusercontent.com/MI2DataLab/survxai/ee5c7df52b347e422efcf028bf2afe652284fb2d/docs/articles/How_to_compare_models_with_survxai_files/figure-html/unnamed-chunk-9-1.png
--------------------------------------------------------------------------------
/docs/articles/Local_explanations_files/figure-html/unnamed-chunk-2-1.png:
--------------------------------------------------------------------------------
https://raw.githubusercontent.com/MI2DataLab/survxai/ee5c7df52b347e422efcf028bf2afe652284fb2d/docs/articles/Local_explanations_files/figure-html/unnamed-chunk-2-1.png
--------------------------------------------------------------------------------
/docs/articles/Local_explanations_files/figure-html/unnamed-chunk-3-1.png:
--------------------------------------------------------------------------------
https://raw.githubusercontent.com/MI2DataLab/survxai/ee5c7df52b347e422efcf028bf2afe652284fb2d/docs/articles/Local_explanations_files/figure-html/unnamed-chunk-3-1.png
--------------------------------------------------------------------------------
/docs/articles/Local_explanations_files/figure-html/unnamed-chunk-4-1.png:
--------------------------------------------------------------------------------
https://raw.githubusercontent.com/MI2DataLab/survxai/ee5c7df52b347e422efcf028bf2afe652284fb2d/docs/articles/Local_explanations_files/figure-html/unnamed-chunk-4-1.png
--------------------------------------------------------------------------------
/docs/articles/index.html:
--------------------------------------------------------------------------------
1 |
2 |
3 |
4 |
5 |
6 |
7 |
8 |
9 | Articles • survxai
10 |
11 |
12 |
13 |
14 |
15 |
16 |
17 |
18 |
19 |
20 |
21 |
22 |
23 |
24 |
25 |
26 |
27 |
28 |
29 |
33 |
34 |
35 |
36 |
37 |
38 |
39 |
99 |
100 |
101 |
102 |
105 |
106 |
107 |
All vignettes
108 |
109 |
110 |
116 |
117 |
118 |
119 |
120 |
130 |
131 |
132 |
133 |
134 |
135 |
--------------------------------------------------------------------------------
/docs/authors.html:
--------------------------------------------------------------------------------
1 |
2 |
3 |
4 |
5 |
6 |
7 |
8 |
9 | Authors • survxai
10 |
11 |
12 |
13 |
14 |
15 |
16 |
17 |
18 |
19 |
20 |
21 |
22 |
23 |
24 |
25 |
26 |
27 |
28 |
29 |
33 |
34 |
35 |
36 |
37 |
38 |
39 |
99 |
100 |
101 |
102 |
105 |
106 |
107 | Aleksandra Grudziaz . Author, maintainer.
108 |
109 |
110 |
111 | Alicja Gosiewska . Author.
112 |
113 |
114 |
115 | Przemyslaw Biecek . Author, thesis advisor.
116 |
117 |
118 |
119 |
120 |
121 |
122 |
123 |
124 |
125 |
135 |
136 |
137 |
138 |
139 |
140 |
--------------------------------------------------------------------------------
/docs/docsearch.js:
--------------------------------------------------------------------------------
1 | $(function() {
2 |
3 | // register a handler to move the focus to the search bar
4 | // upon pressing shift + "/" (i.e. "?")
5 | $(document).on('keydown', function(e) {
6 | if (e.shiftKey && e.keyCode == 191) {
7 | e.preventDefault();
8 | $("#search-input").focus();
9 | }
10 | });
11 |
12 | $(document).ready(function() {
13 | // do keyword highlighting
14 | /* modified from https://jsfiddle.net/julmot/bL6bb5oo/ */
15 | var mark = function() {
16 |
17 | var referrer = document.URL ;
18 | var paramKey = "q" ;
19 |
20 | if (referrer.indexOf("?") !== -1) {
21 | var qs = referrer.substr(referrer.indexOf('?') + 1);
22 | var qs_noanchor = qs.split('#')[0];
23 | var qsa = qs_noanchor.split('&');
24 | var keyword = "";
25 |
26 | for (var i = 0; i < qsa.length; i++) {
27 | var currentParam = qsa[i].split('=');
28 |
29 | if (currentParam.length !== 2) {
30 | continue;
31 | }
32 |
33 | if (currentParam[0] == paramKey) {
34 | keyword = decodeURIComponent(currentParam[1].replace(/\+/g, "%20"));
35 | }
36 | }
37 |
38 | if (keyword !== "") {
39 | $(".contents").unmark({
40 | done: function() {
41 | $(".contents").mark(keyword);
42 | }
43 | });
44 | }
45 | }
46 | };
47 |
48 | mark();
49 | });
50 | });
51 |
52 | /* Search term highlighting ------------------------------*/
53 |
54 | function matchedWords(hit) {
55 | var words = [];
56 |
57 | var hierarchy = hit._highlightResult.hierarchy;
58 | // loop to fetch from lvl0, lvl1, etc.
59 | for (var idx in hierarchy) {
60 | words = words.concat(hierarchy[idx].matchedWords);
61 | }
62 |
63 | var content = hit._highlightResult.content;
64 | if (content) {
65 | words = words.concat(content.matchedWords);
66 | }
67 |
68 | // return unique words
69 | var words_uniq = [...new Set(words)];
70 | return words_uniq;
71 | }
72 |
73 | function updateHitURL(hit) {
74 |
75 | var words = matchedWords(hit);
76 | var url = "";
77 |
78 | if (hit.anchor) {
79 | url = hit.url_without_anchor + '?q=' + escape(words.join(" ")) + '#' + hit.anchor;
80 | } else {
81 | url = hit.url + '?q=' + escape(words.join(" "));
82 | }
83 |
84 | return url;
85 | }
86 |
--------------------------------------------------------------------------------
/docs/jquery.sticky-kit.min.js:
--------------------------------------------------------------------------------
1 | /*
2 | Sticky-kit v1.1.2 | WTFPL | Leaf Corcoran 2015 | http://leafo.net
3 | */
4 | (function(){var b,f;b=this.jQuery||window.jQuery;f=b(window);b.fn.stick_in_parent=function(d){var A,w,J,n,B,K,p,q,k,E,t;null==d&&(d={});t=d.sticky_class;B=d.inner_scrolling;E=d.recalc_every;k=d.parent;q=d.offset_top;p=d.spacer;w=d.bottoming;null==q&&(q=0);null==k&&(k=void 0);null==B&&(B=!0);null==t&&(t="is_stuck");A=b(document);null==w&&(w=!0);J=function(a,d,n,C,F,u,r,G){var v,H,m,D,I,c,g,x,y,z,h,l;if(!a.data("sticky_kit")){a.data("sticky_kit",!0);I=A.height();g=a.parent();null!=k&&(g=g.closest(k));
5 | if(!g.length)throw"failed to find stick parent";v=m=!1;(h=null!=p?p&&a.closest(p):b("
"))&&h.css("position",a.css("position"));x=function(){var c,f,e;if(!G&&(I=A.height(),c=parseInt(g.css("border-top-width"),10),f=parseInt(g.css("padding-top"),10),d=parseInt(g.css("padding-bottom"),10),n=g.offset().top+c+f,C=g.height(),m&&(v=m=!1,null==p&&(a.insertAfter(h),h.detach()),a.css({position:"",top:"",width:"",bottom:""}).removeClass(t),e=!0),F=a.offset().top-(parseInt(a.css("margin-top"),10)||0)-q,
6 | u=a.outerHeight(!0),r=a.css("float"),h&&h.css({width:a.outerWidth(!0),height:u,display:a.css("display"),"vertical-align":a.css("vertical-align"),"float":r}),e))return l()};x();if(u!==C)return D=void 0,c=q,z=E,l=function(){var b,l,e,k;if(!G&&(e=!1,null!=z&&(--z,0>=z&&(z=E,x(),e=!0)),e||A.height()===I||x(),e=f.scrollTop(),null!=D&&(l=e-D),D=e,m?(w&&(k=e+u+c>C+n,v&&!k&&(v=!1,a.css({position:"fixed",bottom:"",top:c}).trigger("sticky_kit:unbottom"))),eb&&!v&&(c-=l,c=Math.max(b-u,c),c=Math.min(q,c),m&&a.css({top:c+"px"})))):e>F&&(m=!0,b={position:"fixed",top:c},b.width="border-box"===a.css("box-sizing")?a.outerWidth()+"px":a.width()+"px",a.css(b).addClass(t),null==p&&(a.after(h),"left"!==r&&"right"!==r||h.append(a)),a.trigger("sticky_kit:stick")),m&&w&&(null==k&&(k=e+u+c>C+n),!v&&k)))return v=!0,"static"===g.css("position")&&g.css({position:"relative"}),
8 | a.css({position:"absolute",bottom:d,top:"auto"}).trigger("sticky_kit:bottom")},y=function(){x();return l()},H=function(){G=!0;f.off("touchmove",l);f.off("scroll",l);f.off("resize",y);b(document.body).off("sticky_kit:recalc",y);a.off("sticky_kit:detach",H);a.removeData("sticky_kit");a.css({position:"",bottom:"",top:"",width:""});g.position("position","");if(m)return null==p&&("left"!==r&&"right"!==r||a.insertAfter(h),h.remove()),a.removeClass(t)},f.on("touchmove",l),f.on("scroll",l),f.on("resize",
9 | y),b(document.body).on("sticky_kit:recalc",y),a.on("sticky_kit:detach",H),setTimeout(l,0)}};n=0;for(K=this.length;n
2 |
3 |
5 |
8 |
12 |
13 |
--------------------------------------------------------------------------------
/docs/news/index.html:
--------------------------------------------------------------------------------
1 |
2 |
3 |
4 |
5 |
6 |
7 |
8 |
9 | Changelog • survxai
10 |
11 |
12 |
13 |
14 |
15 |
16 |
17 |
18 |
19 |
20 |
21 |
22 |
23 |
24 |
25 |
26 |
27 |
28 |
29 |
33 |
34 |
35 |
36 |
37 |
38 |
39 |
99 |
100 |
101 |
102 |
103 |
106 |
107 |
108 |
109 |
110 | survxai 0.2.0
111 |
112 | CONTRIBUTING.md have been added
113 | Cheatsheet was created
114 | Colour palette for broken_prediction()
and ceteris_paribus()
was added
115 | New optional arguments for plot.broken_prediction()
and plot.ceteris_paribus()
was added
116 |
117 |
118 |
119 |
120 | survxai 0.1.0
121 |
127 |
128 |
129 |
130 |
131 |
140 |
141 |
142 |
143 |
153 |
154 |
155 |
156 |
157 |
158 |
--------------------------------------------------------------------------------
/docs/pkgdown.css:
--------------------------------------------------------------------------------
1 | /* Sticker footer */
2 | body > .container {
3 | display: flex;
4 | padding-top: 60px;
5 | min-height: calc(100vh);
6 | flex-direction: column;
7 | }
8 |
9 | body > .container .row {
10 | flex: 1;
11 | }
12 |
13 | footer {
14 | margin-top: 45px;
15 | padding: 35px 0 36px;
16 | border-top: 1px solid #e5e5e5;
17 | color: #666;
18 | display: flex;
19 | }
20 | footer p {
21 | margin-bottom: 0;
22 | }
23 | footer div {
24 | flex: 1;
25 | }
26 | footer .pkgdown {
27 | text-align: right;
28 | }
29 | footer p {
30 | margin-bottom: 0;
31 | }
32 |
33 | img.icon {
34 | float: right;
35 | }
36 |
37 | img {
38 | max-width: 100%;
39 | }
40 |
41 | /* Section anchors ---------------------------------*/
42 |
43 | a.anchor {
44 | margin-left: -30px;
45 | display:inline-block;
46 | width: 30px;
47 | height: 30px;
48 | visibility: hidden;
49 |
50 | background-image: url(./link.svg);
51 | background-repeat: no-repeat;
52 | background-size: 20px 20px;
53 | background-position: center center;
54 | }
55 |
56 | .hasAnchor:hover a.anchor {
57 | visibility: visible;
58 | }
59 |
60 | @media (max-width: 767px) {
61 | .hasAnchor:hover a.anchor {
62 | visibility: hidden;
63 | }
64 | }
65 |
66 |
67 | /* Fixes for fixed navbar --------------------------*/
68 |
69 | .contents h1, .contents h2, .contents h3, .contents h4 {
70 | padding-top: 60px;
71 | margin-top: -60px;
72 | }
73 |
74 | /* Static header placement on mobile devices */
75 | @media (max-width: 767px) {
76 | .navbar-fixed-top {
77 | position: absolute;
78 | }
79 | .navbar {
80 | padding: 0;
81 | }
82 | }
83 |
84 |
85 | /* Sidebar --------------------------*/
86 |
87 | #sidebar {
88 | margin-top: 30px;
89 | }
90 | #sidebar h2 {
91 | font-size: 1.5em;
92 | margin-top: 1em;
93 | }
94 |
95 | #sidebar h2:first-child {
96 | margin-top: 0;
97 | }
98 |
99 | #sidebar .list-unstyled li {
100 | margin-bottom: 0.5em;
101 | }
102 |
103 | /* Reference index & topics ----------------------------------------------- */
104 |
105 | .ref-index th {font-weight: normal;}
106 | .ref-index h2 {font-size: 20px;}
107 |
108 | .ref-index td {vertical-align: top;}
109 | .ref-index .alias {width: 40%;}
110 | .ref-index .title {width: 60%;}
111 |
112 | .ref-index .alias {width: 40%;}
113 | .ref-index .title {width: 60%;}
114 |
115 | .ref-arguments th {text-align: right; padding-right: 10px;}
116 | .ref-arguments th, .ref-arguments td {vertical-align: top;}
117 | .ref-arguments .name {width: 20%;}
118 | .ref-arguments .desc {width: 80%;}
119 |
120 | /* Nice scrolling for wide elements --------------------------------------- */
121 |
122 | table {
123 | display: block;
124 | overflow: auto;
125 | }
126 |
127 | /* Syntax highlighting ---------------------------------------------------- */
128 |
129 | pre {
130 | word-wrap: normal;
131 | word-break: normal;
132 | border: 1px solid #eee;
133 | }
134 |
135 | pre, code {
136 | background-color: #f8f8f8;
137 | color: #333;
138 | }
139 |
140 | pre .img {
141 | margin: 5px 0;
142 | }
143 |
144 | pre .img img {
145 | background-color: #fff;
146 | display: block;
147 | height: auto;
148 | }
149 |
150 | code a, pre a {
151 | color: #375f84;
152 | }
153 | table {
154 | display: block;
155 | overflow: auto;
156 | width: 100% !important;
157 | }
158 |
159 | .fl {color: #1514b5;}
160 | .fu {color: #000000;} /* function */
161 | .ch,.st {color: #036a07;} /* string */
162 | .kw {color: #264D66;} /* keyword */
163 | .co {color: #888888;} /* comment */
164 |
165 | .message { color: black; font-weight: bolder;}
166 | .error { color: orange; font-weight: bolder;}
167 | .warning { color: #6A0366; font-weight: bolder;}
168 |
169 | .navbar-mi2logo {
170 | float: left;
171 | margin-right: 15px;
172 | margin-top: 2px;
173 | }
174 | .navbar-mi2 {
175 | background-color: #4a3c89;
176 | color: #fff !important;
177 | margin-right: 0px;
178 | }
179 | .navbar-mi2 > li > a {
180 | color: #fff !important;
181 | }
182 | .navbar-mi2 > .active > a{
183 | background-color: #370f54 !important;
184 | }
185 | .navbar-mi2 > .open > a:focus, .nav-pills> .open > a:focus{
186 | background-color: #370f54 !important;
187 | }
188 | .dropdown-menu > .active > a, .dropdown-menu > .active > a:focus{
189 | background-color: #370f54 !important;
190 | }
191 |
192 | .contents-mi2 > li > a:focus, .nav-pills > li > a:focus {
193 | background-color: #4a3c89 !important;
194 | color: #fff;
195 | }
196 | .contents-mi2 > li.active > a, .nav-pills > li.active > a{
197 | background-color: #370f54 !important;
198 | }
199 | .contents-mi2 > li > a, .nav-pills > li > a{
200 | background-color: #4a3c89 !important;
201 | color: #fff;
202 | }
203 |
204 | .sidebar-logo {
205 | display:block;
206 | margin-left:auto;
207 | margin-right:auto;
208 | text-align: justify;
209 | }
--------------------------------------------------------------------------------
/docs/pkgdown.js:
--------------------------------------------------------------------------------
1 | $(function() {
2 | $("#sidebar").stick_in_parent({offset_top: 40});
3 | $('body').scrollspy({
4 | target: '#sidebar',
5 | offset: 60
6 | });
7 |
8 | var cur_path = location.href;
9 | $("#navbar ul li a").each(function(index, value) {
10 | if (value.text == "Home")
11 | return;
12 | if (value.getAttribute("href") === "#")
13 | return;
14 |
15 | var path = value.href;
16 | if (cur_path == path) {
17 | // Add class to parent , and enclosing if in dropdown
18 | var menu_anchor = $(value);
19 | menu_anchor.parent().addClass("active");
20 | menu_anchor.closest("li.dropdown").addClass("active");
21 | }
22 | });
23 | });
24 |
--------------------------------------------------------------------------------
/docs/pkgdown.yml:
--------------------------------------------------------------------------------
1 | pandoc: 1.19.2.1
2 | pkgdown: 1.1.0
3 | pkgdown_sha: ~
4 | articles:
5 | Custom_predict_for_survival_models: ../../../Github/survxai/vignettes/Custom_predict_for_survival_models.html
6 | Global_explanations: ../../../Github/survxai/vignettes/Global_explanations.html
7 | How_to_compare_models_with_survxai: ../../../Github/survxai/vignettes/How_to_compare_models_with_survxai.html
8 | Local_explanations: ../../../Github/survxai/vignettes/Local_explanations.html
9 |
10 |
--------------------------------------------------------------------------------
/docs/reference/pbcTest.html:
--------------------------------------------------------------------------------
1 |
2 |
3 |
4 |
5 |
6 |
7 |
8 |
9 | pbcTest — pbcTest • survxai
10 |
11 |
12 |
13 |
14 |
15 |
16 |
17 |
18 |
19 |
20 |
21 |
22 |
23 |
24 |
25 |
26 |
27 |
28 |
29 |
33 |
34 |
35 |
36 |
37 |
38 |
39 |
99 |
100 |
101 |
102 |
105 |
106 |
107 |
PBC test set
108 | Data set based on pbc
from randomForestSRC
package.
109 | The data consists of 138 randomly chosen observations The pbcTest
contains only complete cases for each observation.
110 | It contains 5 variables: `status`, `sex`, `bili`, `stage`, and `years`.
111 |
112 |
113 |
114 |
Source
115 |
116 |
randomForestSRC
117 |
118 |
References
119 |
120 |
Flemming T.R and Harrington D.P., (1991) Counting Processes and Survival Analysis. New York: Wiley.
121 |
122 |
123 |
Examples
124 |
data ("pbcTest" , package = "survxai" )
125 | head (pbcTest )
#> status sex bili stage years
126 | #> 2 0 1 1.1 3 12.328767
127 | #> 3 1 0 1.4 4 2.772603
128 | #> 4 1 1 1.8 4 5.273973
129 | #> 5 0 1 3.4 3 4.120548
130 | #> 8 1 1 0.3 3 6.756164
131 | #> 9 1 1 3.2 2 6.575342
132 |
133 |
145 |
146 |
147 |
157 |
158 |
159 |
160 |
161 |
162 |
--------------------------------------------------------------------------------
/docs/reference/pbcTrain.html:
--------------------------------------------------------------------------------
1 |
2 |
3 |
4 |
5 |
6 |
7 |
8 |
9 | pbcTrain — pbcTrain • survxai
10 |
11 |
12 |
13 |
14 |
15 |
16 |
17 |
18 |
19 |
20 |
21 |
22 |
23 |
24 |
25 |
26 |
27 |
28 |
29 |
33 |
34 |
35 |
36 |
37 |
38 |
39 |
99 |
100 |
101 |
102 |
105 |
106 |
107 |
PBC train set
108 | Data set based on pbc
from randomForestSRC
package.
109 | The data consists of 138 randomly chosen observations The pbcTrain
contains only complete cases for each observation.
110 | It contains 5 variables: `status`, `sex`, `bili`, `stage`, and `years`.
111 |
112 |
113 |
114 |
Source
115 |
116 |
randomForestSRC
117 |
118 |
References
119 |
120 |
Flemming T.R and Harrington D.P., (1991) Counting Processes and Survival Analysis. New York: Wiley.
121 |
122 |
123 |
Examples
124 |
data ("pbcTrain" , package = "survxai" )
125 | head (pbcTrain )
#> status sex bili stage years
126 | #> 90 1 0 1.6 2 7.367123
127 | #> 250 0 1 0.6 4 4.846575
128 | #> 130 1 1 17.4 3 3.871233
129 | #> 277 0 1 1.0 3 3.928767
130 | #> 291 0 1 3.2 4 2.468493
131 | #> 15 1 1 0.8 3 9.819178
132 |
133 |
145 |
146 |
147 |
157 |
158 |
159 |
160 |
161 |
162 |
--------------------------------------------------------------------------------
/docs/reference/plot.surv_ceteris_paribus_explainer-1.png:
--------------------------------------------------------------------------------
https://raw.githubusercontent.com/MI2DataLab/survxai/ee5c7df52b347e422efcf028bf2afe652284fb2d/docs/reference/plot.surv_ceteris_paribus_explainer-1.png
--------------------------------------------------------------------------------
/docs/reference/plot.surv_explainer-1.png:
--------------------------------------------------------------------------------
https://raw.githubusercontent.com/MI2DataLab/survxai/ee5c7df52b347e422efcf028bf2afe652284fb2d/docs/reference/plot.surv_explainer-1.png
--------------------------------------------------------------------------------
/docs/reference/plot.surv_model_performance_explainer-1.png:
--------------------------------------------------------------------------------
https://raw.githubusercontent.com/MI2DataLab/survxai/ee5c7df52b347e422efcf028bf2afe652284fb2d/docs/reference/plot.surv_model_performance_explainer-1.png
--------------------------------------------------------------------------------
/docs/reference/plot.surv_prediction_breakdown_explainer-1.png:
--------------------------------------------------------------------------------
https://raw.githubusercontent.com/MI2DataLab/survxai/ee5c7df52b347e422efcf028bf2afe652284fb2d/docs/reference/plot.surv_prediction_breakdown_explainer-1.png
--------------------------------------------------------------------------------
/docs/reference/plot.surv_variable_response_explainer-1.png:
--------------------------------------------------------------------------------
https://raw.githubusercontent.com/MI2DataLab/survxai/ee5c7df52b347e422efcf028bf2afe652284fb2d/docs/reference/plot.surv_variable_response_explainer-1.png
--------------------------------------------------------------------------------
/docs/reference/print.surv_ceteris_paribus_explainer.html:
--------------------------------------------------------------------------------
1 |
2 |
3 |
4 |
5 |
6 |
7 |
8 |
9 | Ceteris Paribus Print — print.surv_ceteris_paribus_explainer • survxai
10 |
11 |
12 |
13 |
14 |
15 |
16 |
17 |
18 |
19 |
20 |
21 |
22 |
23 |
24 |
25 |
26 |
27 |
28 |
29 |
33 |
34 |
35 |
36 |
37 |
38 |
39 |
99 |
100 |
101 |
102 |
105 |
106 |
107 |
Ceteris Paribus Print
108 |
109 |
110 |
# S3 method for surv_ceteris_paribus_explainer
111 | print (x , ... )
112 |
113 |
Arguments
114 |
115 |
116 |
117 | x
118 | the model of 'surv_ceteris_paribus_explainer' class
119 |
120 |
121 | ...
122 | other parameters
123 |
124 |
125 |
126 |
Value
127 |
128 |
a data frame
129 |
130 |
131 |
132 |
141 |
142 |
143 |
153 |
154 |
155 |
156 |
157 |
158 |
--------------------------------------------------------------------------------
/docs/reference/print.surv_explainer.html:
--------------------------------------------------------------------------------
1 |
2 |
3 |
4 |
5 |
6 |
7 |
8 |
9 | Print Survival Explainer Summary — print.surv_explainer • survxai
10 |
11 |
12 |
13 |
14 |
15 |
16 |
17 |
18 |
19 |
20 |
21 |
22 |
23 |
24 |
25 |
26 |
27 |
28 |
29 |
33 |
34 |
35 |
36 |
37 |
38 |
39 |
99 |
100 |
101 |
102 |
105 |
106 |
107 |
Print Survival Explainer Summary
108 |
109 |
110 |
# S3 method for surv_explainer
111 | print (x , ... )
112 |
113 |
Arguments
114 |
115 |
116 |
117 | x
118 | a model survival expaliner created with the `explain()` function
119 |
120 |
121 | ...
122 | other parameters
123 |
124 |
125 |
126 |
127 |
128 |
135 |
136 |
137 |
147 |
148 |
149 |
150 |
151 |
152 |
--------------------------------------------------------------------------------
/docs/reference/print.surv_model_performance_explainer.html:
--------------------------------------------------------------------------------
1 |
2 |
3 |
4 |
5 |
6 |
7 |
8 |
9 | Print Survival Model Performance — print.surv_model_performance_explainer • survxai
10 |
11 |
12 |
13 |
14 |
15 |
16 |
17 |
18 |
19 |
20 |
21 |
22 |
23 |
24 |
25 |
26 |
27 |
28 |
29 |
33 |
34 |
35 |
36 |
37 |
38 |
39 |
99 |
100 |
101 |
102 |
105 |
106 |
107 |
Print Survival Model Performance
108 |
109 |
110 |
# S3 method for surv_model_performance_explainer
111 | print (x , times = NULL , ... )
112 |
113 |
Arguments
114 |
115 |
116 |
117 | x
118 | a model to be explained, object of the class 'model_performance_explainer'
119 |
120 |
121 | times
122 | a vector of integer times on which we want to check the value of prediction error
123 |
124 |
125 | ...
126 | other parameters
127 |
128 |
129 |
130 |
131 |
132 |
139 |
140 |
141 |
151 |
152 |
153 |
154 |
155 |
156 |
--------------------------------------------------------------------------------
/docs/reference/print.surv_prediction_breakdown_explainer.html:
--------------------------------------------------------------------------------
1 |
2 |
3 |
4 |
5 |
6 |
7 |
8 |
9 | Prediction Breakdown Print — print.surv_prediction_breakdown_explainer • survxai
10 |
11 |
12 |
13 |
14 |
15 |
16 |
17 |
18 |
19 |
20 |
21 |
22 |
23 |
24 |
25 |
26 |
27 |
28 |
29 |
33 |
34 |
35 |
36 |
37 |
38 |
39 |
99 |
100 |
101 |
102 |
105 |
106 |
107 |
Prediction Breakdown Print
108 |
109 |
110 |
# S3 method for surv_prediction_breakdown_explainer
111 | print (x , ... , digits = 3 ,
112 | rounding_function = round )
113 |
114 |
Arguments
115 |
116 |
117 |
118 | x
119 | the model model of 'surv_prediction_breakdown_explainer' class
120 |
121 |
122 | ...
123 | other parameters
124 |
125 |
126 | digits
127 | number of decimal places (round) or significant digits (signif) to be used
128 | See the rounding_function
argument
129 |
130 |
131 | rounding_function
132 | function that is to used for rounding numbers.
133 | It may be signif()
which keeps a specified number of significant digits.
134 | Or the default round()
to have the same precision for all components
135 |
136 |
137 |
138 |
139 |
140 |
147 |
148 |
149 |
159 |
160 |
161 |
162 |
163 |
164 |
--------------------------------------------------------------------------------
/docs/reference/print.surv_variable_response_explainer.html:
--------------------------------------------------------------------------------
1 |
2 |
3 |
4 |
5 |
6 |
7 |
8 |
9 | Variable Response Print — print.surv_variable_response_explainer • survxai
10 |
11 |
12 |
13 |
14 |
15 |
16 |
17 |
18 |
19 |
20 |
21 |
22 |
23 |
24 |
25 |
26 |
27 |
28 |
29 |
33 |
34 |
35 |
36 |
37 |
38 |
39 |
99 |
100 |
101 |
102 |
105 |
106 |
107 |
Variable Response Print
108 |
109 |
110 |
# S3 method for surv_variable_response_explainer
111 | print (x , ... )
112 |
113 |
Arguments
114 |
115 |
116 |
117 | x
118 | the model of 'surv_variable_response_explainer' class
119 |
120 |
121 | ...
122 | other parameters
123 |
124 |
125 |
126 |
Value
127 |
128 |
a data frame
129 |
130 |
131 |
132 |
141 |
142 |
143 |
153 |
154 |
155 |
156 |
157 |
158 |
--------------------------------------------------------------------------------
/docs/reference/theme_mi2.html:
--------------------------------------------------------------------------------
1 |
2 |
3 |
4 |
5 |
6 |
7 |
8 |
9 | MI^2 plot theme — theme_mi2 • survxai
10 |
11 |
12 |
13 |
14 |
15 |
16 |
17 |
18 |
19 |
20 |
21 |
22 |
23 |
24 |
25 |
26 |
27 |
28 |
29 |
33 |
34 |
35 |
36 |
37 |
38 |
39 |
99 |
100 |
101 |
102 |
105 |
106 |
107 |
ggplot theme for charts generated with MI^2 Data Lab packages.
108 |
109 |
110 |
theme_mi2 ()
111 |
112 |
Value
113 |
114 |
theme object that can be added to ggplot2 plots
115 |
116 |
117 |
118 |
126 |
127 |
128 |
138 |
139 |
140 |
141 |
142 |
143 |
--------------------------------------------------------------------------------
/inst/CITATION:
--------------------------------------------------------------------------------
1 | bibentry(bibtype = "Article",
2 | author = c(
3 | person(given = "Aleksandra", "Grudziaz"),
4 | person(given = "Alicja", family = "Gosiewska"),
5 | person(given = "Przemyslaw", family = "Biecek")
6 | ),
7 | title = "{survxai}: an {R} package for structure-agnostic explanations of survival models",
8 | volume = 3,
9 | journal = "Journal of Open Source Software",
10 | archivePrefix = "arXiv",
11 | eprint = "1809.07763",
12 | primaryClass = "stat.CO",
13 | year = "2018",
14 | url= "http://dx.doi.org/10.21105/joss.00961",
15 | DOI = "10.21105/joss.00961",
16 | number = 31,
17 | publisher = "The Open Journal",
18 | year = 2018,
19 | month = "Nov",
20 | pages = 961
21 | )
22 |
--------------------------------------------------------------------------------
/man/ceteris_paribus.Rd:
--------------------------------------------------------------------------------
1 | % Generated by roxygen2: do not edit by hand
2 | % Please edit documentation in R/ceteris_paribus.R
3 | \name{ceteris_paribus}
4 | \alias{ceteris_paribus}
5 | \title{Ceteris Paribus}
6 | \usage{
7 | ceteris_paribus(
8 | explainer,
9 | observation,
10 | grid_points = 5,
11 | selected_variables = NULL
12 | )
13 | }
14 | \arguments{
15 | \item{explainer}{a model to be explained, preprocessed by the 'survxai::explain' function}
16 |
17 | \item{observation}{a new observation for which predictions need to be explained}
18 |
19 | \item{grid_points}{grid_points number of points used for response path}
20 |
21 | \item{selected_variables}{if specified, then only these variables will be explained}
22 | }
23 | \value{
24 | An object of the class surv_ceteris_paribus_explainer.
25 | It's a data frame with calculated average responses.
26 | }
27 | \description{
28 | The \code{ceteris_paribus()} function computes the predictions for the neighbor of our chosen observation. The neighbour is defined as the observations with changed value of one of the variable.
29 | }
30 | \examples{
31 | \donttest{
32 | library(survxai)
33 | library(rms)
34 | data("pbcTrain")
35 | data("pbcTest")
36 | predict_times <- function(model, data, times){
37 | prob <- rms::survest(model, data, times = times)$surv
38 | return(prob)
39 | }
40 | cph_model <- cph(Surv(years, status)~ sex + bili + stage,
41 | data = pbcTrain, surv = TRUE, x = TRUE, y=TRUE)
42 | surve_cph <- explain(model = cph_model, data = pbcTest[,-c(1,5)],
43 | y = Surv(pbcTest$years, pbcTest$status),
44 | predict_function = predict_times)
45 | cp_cph <- ceteris_paribus(surve_cph, pbcTest[1,-c(1,5)])
46 | }
47 | }
48 |
--------------------------------------------------------------------------------
/man/explain.Rd:
--------------------------------------------------------------------------------
1 | % Generated by roxygen2: do not edit by hand
2 | % Please edit documentation in R/explain.R
3 | \name{explain}
4 | \alias{explain}
5 | \alias{explain.default}
6 | \title{Create Survival Model Explainer}
7 | \usage{
8 | explain(
9 | model,
10 | data = NULL,
11 | y,
12 | times = NULL,
13 | predict_function = yhat,
14 | link = I,
15 | label = tail(class(model), 1),
16 | ...
17 | )
18 |
19 | \method{explain}{default}(
20 | model,
21 | data = NULL,
22 | y,
23 | times = NULL,
24 | predict_function = yhat,
25 | link = I,
26 | label = tail(class(model), 1),
27 | ...
28 | )
29 | }
30 | \arguments{
31 | \item{model}{object - a survival model to be explained}
32 |
33 | \item{data}{data.frame, tibble or matrix - data that will be used by survival explainers. If not provided then will be extracted from the model}
34 |
35 | \item{y}{object of class 'surv', contains event status and times}
36 |
37 | \item{times}{optional argument, the vector of time points on which survival probability will be predicted}
38 |
39 | \item{predict_function}{function that takes three arguments: model, new data, vector with times, and returns numeric vector or matrix with predictions. If not passed, function \code{\link[pec]{predictSurvProb}} is used.}
40 |
41 | \item{link}{function - a transformation/link function that shall be applied to raw model predictions}
42 |
43 | \item{label}{character - the name of the survival model. By default it's extracted from the 'class' attribute of the model.}
44 |
45 | \item{...}{other parameters}
46 | }
47 | \value{
48 | An object of the class 'surv_explainer'.
49 |
50 | It's a list with following fields:
51 |
52 | \itemize{
53 | \item \code{model} the explained model
54 | \item \code{data} the dataset
55 | \item \code{y} event statuses and times
56 | \item \code{times} time points on which survival probability is predicted
57 | \item \code{predict_function} function that may be used for model predictions, shall return a single numerical value for each time.
58 | \item \code{link} function - a transformation/link function that shall be applied to raw model predictions
59 | \item \code{class} class/classes of a model
60 | \item \code{label} label, by default it's the last value from the \code{class} vector, but may be set to any character.
61 | }
62 | }
63 | \description{
64 | Survival models may have very different structures.
65 | This function creates a unified representation of a survival model, which can be further processed by various survival
66 | explainers (see also \code{\link[DALEX]{explain}}).
67 |
68 | Please NOTE, that the \code{model} is actually the only required argument.
69 | But some survival explainers may require additional arguments.
70 | }
71 | \examples{
72 | \donttest{
73 | library(survxai)
74 | library(rms)
75 | library(randomForestSRC)
76 | data(pbc, package = "randomForestSRC")
77 | pbc <- pbc[complete.cases(pbc),]
78 | predict_times <- function(model, data, times){
79 | prob <- rms::survest(model, data, times = times)$surv
80 | return(prob)
81 | }
82 | cph_model <- cph(Surv(days/365, status)~ sex + bili + stage, data=pbc, surv=TRUE, x = TRUE, y=TRUE)
83 | surve_cph <- explain(model = cph_model, data = pbc[,-c(1,2)], y = Surv(pbc$days/365, pbc$status),
84 | predict_function = predict_times)
85 | }
86 | }
87 |
--------------------------------------------------------------------------------
/man/model_performance.Rd:
--------------------------------------------------------------------------------
1 | % Generated by roxygen2: do not edit by hand
2 | % Please edit documentation in R/model_performance.R
3 | \name{model_performance}
4 | \alias{model_performance}
5 | \title{Model performance for survival models}
6 | \usage{
7 | model_performance(explainer, type = "BS")
8 | }
9 | \arguments{
10 | \item{explainer}{a model to be explained, preprocessed by the 'survxai::explain' function}
11 |
12 | \item{type}{character - type of the response to be calculated
13 | Currently following options are implemented: 'BS' for Expected Brier Score}
14 | }
15 | \description{
16 | Function \code{model_performance} calculates the prediction error for chosen survival model.
17 | }
18 | \details{
19 | For \code{type = "BS"} prediction error is the time dependent estimates of the population average Brier score.
20 | At a given time point t, the Brier score for a single observation is the squared difference between observed survival status
21 | and a model based prediction of surviving time t.
22 | }
23 | \examples{
24 | \donttest{
25 | library(survxai)
26 | library(rms)
27 | data("pbcTrain")
28 | data("pbcTest")
29 | cph_model <- cph(Surv(years, status)~ sex + bili + stage,
30 | data=pbcTrain, surv=TRUE, x = TRUE, y=TRUE)
31 | surve_cph <- explain(model = cph_model, data = pbcTest[,-c(1,5)],
32 | y = Surv(pbcTest$years, pbcTest$status))
33 | mp_cph <- model_performance(surve_cph)
34 | }
35 |
36 | }
37 | \references{
38 | Ulla B. Mogensen, Hemant Ishwaran, Thomas A. Gerds (2012). Evaluating Random Forests for Survival Analysis Using Prediction Error Curves. Journal of Statistical Software, 50(11), 1-23. URL http://www.jstatsoft.org/v50/i11/.
39 | }
40 |
--------------------------------------------------------------------------------
/man/pbcTest.Rd:
--------------------------------------------------------------------------------
1 | % Generated by roxygen2: do not edit by hand
2 | % Please edit documentation in R/pbcTest.R
3 | \docType{data}
4 | \name{pbcTest}
5 | \alias{pbcTest}
6 | \title{pbcTest}
7 | \source{
8 | randomForestSRC
9 | }
10 | \description{
11 | PBC test set
12 | Data set based on \code{pbc} from \code{randomForestSRC} package.
13 | The data consists of 138 randomly chosen observations The \code{pbcTest} contains only complete cases for each observation.
14 | It contains 5 variables: `status`, `sex`, `bili`, `stage`, and `years`.
15 | }
16 | \examples{
17 | data("pbcTest", package = "survxai")
18 | head(pbcTest)
19 | }
20 | \references{
21 | Flemming T.R and Harrington D.P., (1991) Counting Processes and Survival Analysis. New York: Wiley.
22 | }
23 |
--------------------------------------------------------------------------------
/man/pbcTrain.Rd:
--------------------------------------------------------------------------------
1 | % Generated by roxygen2: do not edit by hand
2 | % Please edit documentation in R/pbcTrain.R
3 | \docType{data}
4 | \name{pbcTrain}
5 | \alias{pbcTrain}
6 | \title{pbcTrain}
7 | \source{
8 | randomForestSRC
9 | }
10 | \description{
11 | PBC train set
12 | Data set based on \code{pbc} from \code{randomForestSRC} package.
13 | The data consists of 138 randomly chosen observations The \code{pbcTrain} contains only complete cases for each observation.
14 | It contains 5 variables: `status`, `sex`, `bili`, `stage`, and `years`.
15 | }
16 | \examples{
17 | data("pbcTrain", package = "survxai")
18 | head(pbcTrain)
19 | }
20 | \references{
21 | Flemming T.R and Harrington D.P., (1991) Counting Processes and Survival Analysis. New York: Wiley.
22 | }
23 |
--------------------------------------------------------------------------------
/man/plot.surv_ceteris_paribus_explainer.Rd:
--------------------------------------------------------------------------------
1 | % Generated by roxygen2: do not edit by hand
2 | % Please edit documentation in R/plot_ceteris_paribus.R
3 | \name{plot.surv_ceteris_paribus_explainer}
4 | \alias{plot.surv_ceteris_paribus_explainer}
5 | \title{Plot for ceteris_paribus object}
6 | \usage{
7 | \method{plot}{surv_ceteris_paribus_explainer}(
8 | x,
9 | ...,
10 | selected_variable = NULL,
11 | scale_type = "factor",
12 | scale_col = NULL,
13 | ncol = 1
14 | )
15 | }
16 | \arguments{
17 | \item{x}{object of class "surv_ceteris_paribus_explainer"}
18 |
19 | \item{...}{arguments to be passed to methods, such as graphical parameters for function \code{\link[ggplot2]{geom_step}}.}
20 |
21 | \item{selected_variable}{name of variable we want to draw ceteris paribus plot}
22 |
23 | \item{scale_type}{type of scale of colors, either "discrete" or "gradient"}
24 |
25 | \item{scale_col}{vector containing values of low and high ends of the gradient, when "gradient" type of scale was chosen}
26 |
27 | \item{ncol}{number of columns for faceting}
28 | }
29 | \description{
30 | Function plot for ceteris_paribus object visualise estimated survival curve of mean probabilities in chosen time points. Black lines on each plot correspond to survival curve for our new observation specified in the \code{ceteris_paribus} function.
31 | }
32 | \examples{
33 | \donttest{
34 | library(survxai)
35 | library(rms)
36 | data("pbcTest")
37 | data("pbcTrain")
38 | predict_times <- function(model, data, times){
39 | prob <- rms::survest(model, data, times = times)$surv
40 | return(prob)
41 | }
42 | cph_model <- cph(Surv(years, status)~sex + bili + stage, data=pbcTrain, surv=TRUE, x = TRUE, y=TRUE)
43 | surve_cph <- explain(model = cph_model, data = pbcTest[,-c(1,5)],
44 | y = Surv(pbcTest$years, pbcTest$status), predict_function = predict_times)
45 | cp_cph <- ceteris_paribus(surve_cph, pbcTest[1,-c(1,5)])
46 | plot(cp_cph)
47 | }
48 | }
49 |
--------------------------------------------------------------------------------
/man/plot.surv_explainer.Rd:
--------------------------------------------------------------------------------
1 | % Generated by roxygen2: do not edit by hand
2 | % Please edit documentation in R/plot_explainer.R
3 | \name{plot.surv_explainer}
4 | \alias{plot.surv_explainer}
5 | \title{Plot for surv_explainer object}
6 | \usage{
7 | \method{plot}{surv_explainer}(x, ...)
8 | }
9 | \arguments{
10 | \item{x}{object of class "surv_explainer"}
11 |
12 | \item{...}{other arguments for function \code{\link[survminer]{ggsurvplot}}}
13 | }
14 | \description{
15 | Function plot for surv_explainer object visualise estimated survival curve of mean probabilities in chosen time points.
16 | }
17 | \examples{
18 | \donttest{
19 | library(survxai)
20 | library(rms)
21 | data("pbcTest")
22 | data("pbcTrain")
23 | predict_times <- function(model, data, times){
24 | prob <- rms::survest(model, data, times = times)$surv
25 | return(prob)
26 | }
27 | cph_model <- cph(Surv(years, status)~sex + bili + stage, data=pbcTrain, surv=TRUE, x = TRUE, y=TRUE)
28 | surve_cph <- explain(model = cph_model, data = pbcTest[,-c(1,5)],
29 | y = Surv(pbcTest$years, pbcTest$status), predict_function = predict_times)
30 | plot(surve_cph)
31 | }
32 | }
33 |
--------------------------------------------------------------------------------
/man/plot.surv_model_performance_explainer.Rd:
--------------------------------------------------------------------------------
1 | % Generated by roxygen2: do not edit by hand
2 | % Please edit documentation in R/plot_model_performance.R
3 | \name{plot.surv_model_performance_explainer}
4 | \alias{plot.surv_model_performance_explainer}
5 | \title{Plot for surv_model_performance object}
6 | \usage{
7 | \method{plot}{surv_model_performance_explainer}(x, ...)
8 | }
9 | \arguments{
10 | \item{x}{object of class "surv_model_performance"}
11 |
12 | \item{...}{optional, additional objects of class "surv_model_performance_explainer"}
13 | }
14 | \description{
15 | Function plot for surv_model_performance object.
16 | }
17 | \examples{
18 | \donttest{
19 | library(survxai)
20 | library(rms)
21 | data("pbcTest")
22 | data("pbcTrain")
23 | predict_times <- function(model, data, times){
24 | prob <- rms::survest(model, data, times = times)$surv
25 | return(prob)
26 | }
27 | cph_model <- cph(Surv(years, status)~sex + bili + stage, data=pbcTrain, surv=TRUE, x = TRUE, y=TRUE)
28 | surve_cph <- explain(model = cph_model, data = pbcTest[,-c(1,5)],
29 | y = Surv(pbcTest$years, pbcTest$status), predict_function = predict_times)
30 | mp_cph <- model_performance(surve_cph)
31 | plot(mp_cph)
32 | }
33 |
34 | }
35 |
--------------------------------------------------------------------------------
/man/plot.surv_prediction_breakdown_explainer.Rd:
--------------------------------------------------------------------------------
1 | % Generated by roxygen2: do not edit by hand
2 | % Please edit documentation in R/plot_prediction_breakdown.R
3 | \name{plot.surv_prediction_breakdown_explainer}
4 | \alias{plot.surv_prediction_breakdown_explainer}
5 | \title{Plot for surv_breakdown object}
6 | \usage{
7 | \method{plot}{surv_prediction_breakdown_explainer}(
8 | x,
9 | ...,
10 | numerate = TRUE,
11 | lines = TRUE,
12 | lines_type = 1,
13 | lines_col = "black",
14 | scale_col = c("#010059", "#e0f6fb")
15 | )
16 | }
17 | \arguments{
18 | \item{x}{an object of class "surv_prediction_breakdown_explainer"}
19 |
20 | \item{...}{optional, additional objects of class "surv_prediction_breakdown_explainer"}
21 |
22 | \item{numerate}{logical; indicating whether we want to number curves}
23 |
24 | \item{lines}{logical; indicating whether we want to add lines on chosen time point or probability}
25 |
26 | \item{lines_type}{a type of line; see http://sape.inf.usi.ch/quick-reference/ggplot2/linetype}
27 |
28 | \item{lines_col}{a color of line}
29 |
30 | \item{scale_col}{a vector containig two colors for gradient scale in legend}
31 | }
32 | \description{
33 | Function plot for surv_breakdown object visualise estimated survival curve of mean probabilities in chosen time points.
34 | }
35 | \examples{
36 | \donttest{
37 | library(survxai)
38 | library(rms)
39 | data("pbcTest")
40 | data("pbcTrain")
41 | predict_times <- function(model, data, times){
42 | prob <- rms::survest(model, data, times = times)$surv
43 | return(prob)
44 | }
45 | cph_model <- cph(Surv(years, status)~sex + bili + stage, data=pbcTrain, surv=TRUE, x = TRUE, y=TRUE)
46 | surve_cph <- explain(model = cph_model, data = pbcTest[,-c(1,5)],
47 | y = Surv(pbcTest$years, pbcTest$status), predict_function = predict_times)
48 | broken_prediction <- prediction_breakdown(surve_cph, pbcTest[1,-c(1,5)])
49 | plot(broken_prediction)
50 | }
51 | }
52 |
--------------------------------------------------------------------------------
/man/plot.surv_variable_response_explainer.Rd:
--------------------------------------------------------------------------------
1 | % Generated by roxygen2: do not edit by hand
2 | % Please edit documentation in R/plot_variable_response.R
3 | \name{plot.surv_variable_response_explainer}
4 | \alias{plot.surv_variable_response_explainer}
5 | \title{Plot for surv_variable_response object}
6 | \usage{
7 | \method{plot}{surv_variable_response_explainer}(x, ..., split = "model")
8 | }
9 | \arguments{
10 | \item{x}{an object of class "surv_variable_response"}
11 |
12 | \item{...}{optional, additional objects of class "surv_variable_response_explainer"}
13 |
14 | \item{split}{a character, either "model" or "variable"; sets the variable for faceting}
15 | }
16 | \description{
17 | Function plot for surv_variable_response object shows the expected output condition on a selected variable.
18 | }
19 | \examples{
20 | \donttest{
21 | library(survxai)
22 | library(rms)
23 | data("pbcTest")
24 | data("pbcTrain")
25 | predict_times <- function(model, data, times){
26 | prob <- rms::survest(model, data, times = times)$surv
27 | return(prob)
28 | }
29 | cph_model <- cph(Surv(years, status)~sex + bili + stage, data=pbcTrain, surv=TRUE, x = TRUE, y=TRUE)
30 | surve_cph <- explain(model = cph_model, data = pbcTest[,-c(1,5)],
31 | y = Surv(pbcTest$years, pbcTest$status), predict_function = predict_times)
32 | svr_cph <- variable_response(surve_cph, "sex")
33 | plot(svr_cph)
34 | }
35 |
36 | }
37 |
--------------------------------------------------------------------------------
/man/prediction_breakdown.Rd:
--------------------------------------------------------------------------------
1 | % Generated by roxygen2: do not edit by hand
2 | % Please edit documentation in R/prediction_breakdown.R
3 | \name{prediction_breakdown}
4 | \alias{prediction_breakdown}
5 | \title{BreakDown for survival models}
6 | \usage{
7 | prediction_breakdown(explainer, observation, time = NULL, prob = NULL, ...)
8 | }
9 | \arguments{
10 | \item{explainer}{an object of the class 'surv_explainer'}
11 |
12 | \item{observation}{a new observation to explain}
13 |
14 | \item{time}{a time point at which variable contributions are computed. If NULL median time is taken.}
15 |
16 | \item{prob}{a survival probability at which variable contributions are computed}
17 |
18 | \item{...}{other parameters corresponding to arguments from \code{\link[breakDown]{broken}} function from \code{breakDown} package. See https://github.com/pbiecek/breakDown/blob/master/R/break_agnostic.R for details}
19 | }
20 | \value{
21 | An object of class surv_prediction_breakdown_explainer
22 | }
23 | \description{
24 | Function \code{prediction_breakdown} is an extension of a broken function from breakDown package. It computes the contribution in prediction for the variables in the model.
25 | The contribution is defined as the difference between survival probabilities for model with added specific value of variable and with the random levels of this variable.
26 | }
27 | \examples{
28 | \donttest{
29 | library(survxai)
30 | library(rms)
31 | data("pbcTest")
32 | data("pbcTrain")
33 | predict_times <- function(model, data, times){
34 | prob <- rms::survest(model, data, times = times)$surv
35 | return(prob)
36 | }
37 | cph_model <- cph(Surv(years, status)~sex + bili + stage, data=pbcTrain, surv=TRUE, x = TRUE, y=TRUE)
38 | surve_cph <- explain(model = cph_model, data = pbcTest[,-c(1,5)],
39 | y = Surv(pbcTest$years, pbcTest$status), predict_function = predict_times)
40 | broken_prediction <- prediction_breakdown(surve_cph, pbcTest[1,-c(1,5)])
41 | }
42 | }
43 |
--------------------------------------------------------------------------------
/man/print.surv_ceteris_paribus_explainer.Rd:
--------------------------------------------------------------------------------
1 | % Generated by roxygen2: do not edit by hand
2 | % Please edit documentation in R/print_ceteris_paribus.R
3 | \name{print.surv_ceteris_paribus_explainer}
4 | \alias{print.surv_ceteris_paribus_explainer}
5 | \title{Ceteris Paribus Print}
6 | \usage{
7 | \method{print}{surv_ceteris_paribus_explainer}(x, ...)
8 | }
9 | \arguments{
10 | \item{x}{the model of 'surv_ceteris_paribus_explainer' class}
11 |
12 | \item{...}{further arguments passed to or from other methods}
13 | }
14 | \value{
15 | a data frame
16 | }
17 | \description{
18 | Ceteris Paribus Print
19 | }
20 |
--------------------------------------------------------------------------------
/man/print.surv_explainer.Rd:
--------------------------------------------------------------------------------
1 | % Generated by roxygen2: do not edit by hand
2 | % Please edit documentation in R/print_explainer.R
3 | \name{print.surv_explainer}
4 | \alias{print.surv_explainer}
5 | \title{Print Survival Explainer Summary}
6 | \usage{
7 | \method{print}{surv_explainer}(x, ...)
8 | }
9 | \arguments{
10 | \item{x}{a model survival expaliner created with the `explain()` function}
11 |
12 | \item{...}{further arguments passed to or from other methods}
13 | }
14 | \description{
15 | Print Survival Explainer Summary
16 | }
17 |
--------------------------------------------------------------------------------
/man/print.surv_model_performance_explainer.Rd:
--------------------------------------------------------------------------------
1 | % Generated by roxygen2: do not edit by hand
2 | % Please edit documentation in R/print_model_performance.R
3 | \name{print.surv_model_performance_explainer}
4 | \alias{print.surv_model_performance_explainer}
5 | \title{Print Survival Model Performance}
6 | \usage{
7 | \method{print}{surv_model_performance_explainer}(x, times = NULL, ...)
8 | }
9 | \arguments{
10 | \item{x}{a model to be explained, object of the class 'model_performance_explainer'}
11 |
12 | \item{times}{a vector of integer times on which we want to check the value of prediction error}
13 |
14 | \item{...}{further arguments passed to or from other methods}
15 | }
16 | \description{
17 | Print Survival Model Performance
18 | }
19 |
--------------------------------------------------------------------------------
/man/print.surv_prediction_breakdown_explainer.Rd:
--------------------------------------------------------------------------------
1 | % Generated by roxygen2: do not edit by hand
2 | % Please edit documentation in R/print_prediction_breakdown.R
3 | \name{print.surv_prediction_breakdown_explainer}
4 | \alias{print.surv_prediction_breakdown_explainer}
5 | \title{Prediction Breakdown Print}
6 | \usage{
7 | \method{print}{surv_prediction_breakdown_explainer}(x, ..., digits = 3, rounding_function = round)
8 | }
9 | \arguments{
10 | \item{x}{the model model of 'surv_prediction_breakdown_explainer' class}
11 |
12 | \item{...}{further arguments passed to or from other methods}
13 |
14 | \item{digits}{number of decimal places (round) or significant digits (signif) to be used
15 | See the \code{rounding_function} argument}
16 |
17 | \item{rounding_function}{function that is to used for rounding numbers.
18 | It may be \code{signif()} which keeps a specified number of significant digits.
19 | Or the default \code{round()} to have the same precision for all components}
20 | }
21 | \description{
22 | Prediction Breakdown Print
23 | }
24 |
--------------------------------------------------------------------------------
/man/print.surv_variable_response_explainer.Rd:
--------------------------------------------------------------------------------
1 | % Generated by roxygen2: do not edit by hand
2 | % Please edit documentation in R/print_variable_response.R
3 | \name{print.surv_variable_response_explainer}
4 | \alias{print.surv_variable_response_explainer}
5 | \title{Variable Response Print}
6 | \usage{
7 | \method{print}{surv_variable_response_explainer}(x, ...)
8 | }
9 | \arguments{
10 | \item{x}{the model of 'surv_variable_response_explainer' class}
11 |
12 | \item{...}{further arguments passed to or from other methods}
13 | }
14 | \value{
15 | a data frame
16 | }
17 | \description{
18 | Variable Response Print
19 | }
20 |
--------------------------------------------------------------------------------
/man/theme_mi2.Rd:
--------------------------------------------------------------------------------
1 | % Generated by roxygen2: do not edit by hand
2 | % Please edit documentation in R/theme_mi2.R
3 | \name{theme_mi2}
4 | \alias{theme_mi2}
5 | \title{MI^2 plot theme}
6 | \usage{
7 | theme_mi2()
8 | }
9 | \value{
10 | theme object that can be added to ggplot2 plots
11 | }
12 | \description{
13 | ggplot theme for charts generated with MI^2 Data Lab packages.
14 | }
15 |
--------------------------------------------------------------------------------
/man/variable_response.Rd:
--------------------------------------------------------------------------------
1 | % Generated by roxygen2: do not edit by hand
2 | % Please edit documentation in R/variable_response.R
3 | \name{variable_response}
4 | \alias{variable_response}
5 | \title{Variable response for survival models}
6 | \usage{
7 | variable_response(explainer, variable, type = "pdp", link = explainer$link)
8 | }
9 | \arguments{
10 | \item{explainer}{an object of the class 'surv_explainer'.}
11 |
12 | \item{variable}{a character with variable name.}
13 |
14 | \item{type}{a character - type of the response to be calculated.
15 | Currently following options are implemented: 'pdp' for Partial Dependency.}
16 |
17 | \item{link}{a function - a link function that shall be applied to raw model predictions. This will be inherited from the explainer.}
18 | }
19 | \description{
20 | Function \code{variable_response} calculates the expected output condition on a selected variable.
21 | }
22 | \examples{
23 | \donttest{
24 | library(survxai)
25 | library(rms)
26 | data("pbcTest")
27 | data("pbcTrain")
28 | predict_times <- function(model, data, times){
29 | prob <- rms::survest(model, data, times = times)$surv
30 | return(prob)
31 | }
32 | cph_model <- cph(Surv(years, status)~sex + bili + stage, data=pbcTrain, surv=TRUE, x = TRUE, y=TRUE)
33 | surve_cph <- explain(model = cph_model, data = pbcTest[,-c(1,5)],
34 | y = Surv(pbcTest$years, pbcTest$status), predict_function = predict_times)
35 | svr_cph <- variable_response(surve_cph, "sex")
36 | }
37 | }
38 |
--------------------------------------------------------------------------------
/materials/survxai-cheatsheet.pdf:
--------------------------------------------------------------------------------
https://raw.githubusercontent.com/MI2DataLab/survxai/ee5c7df52b347e422efcf028bf2afe652284fb2d/materials/survxai-cheatsheet.pdf
--------------------------------------------------------------------------------
/materials/survxai-cheatsheet.png:
--------------------------------------------------------------------------------
https://raw.githubusercontent.com/MI2DataLab/survxai/ee5c7df52b347e422efcf028bf2afe652284fb2d/materials/survxai-cheatsheet.png
--------------------------------------------------------------------------------
/misc/img/breakdown.png:
--------------------------------------------------------------------------------
https://raw.githubusercontent.com/MI2DataLab/survxai/ee5c7df52b347e422efcf028bf2afe652284fb2d/misc/img/breakdown.png
--------------------------------------------------------------------------------
/misc/img/ceteris_paribus.png:
--------------------------------------------------------------------------------
https://raw.githubusercontent.com/MI2DataLab/survxai/ee5c7df52b347e422efcf028bf2afe652284fb2d/misc/img/ceteris_paribus.png
--------------------------------------------------------------------------------
/misc/img/model_performance.png:
--------------------------------------------------------------------------------
https://raw.githubusercontent.com/MI2DataLab/survxai/ee5c7df52b347e422efcf028bf2afe652284fb2d/misc/img/model_performance.png
--------------------------------------------------------------------------------
/misc/img/variable_response.png:
--------------------------------------------------------------------------------
https://raw.githubusercontent.com/MI2DataLab/survxai/ee5c7df52b347e422efcf028bf2afe652284fb2d/misc/img/variable_response.png
--------------------------------------------------------------------------------
/misc/paper.bib:
--------------------------------------------------------------------------------
1 | @Manual{ceterisParibus,
2 | title = {ceterisParibus: Ceteris Paribus Plots (What-If Plots) for a Single Observation},
3 | author = {Biecek, Przemysław},
4 | year = {2018},
5 | note = {R package version 0.2.1},
6 | url = {http://CRAN.R-project.org/package=ceterisParibus}
7 | }
8 |
9 | @article{2018arXiv180608915B,
10 | author = {{Biecek}, Przemysław},
11 | title = "{DALEX: explainers for complex predictive models}",
12 | url = {http://arxiv.org/abs/1806.08915},
13 | eprint = {1806.08915},
14 | primaryClass = "stat.ML",
15 | keywords = {Statistics - Machine Learning, Computer Science - Artificial Intelligence, Computer Science - Machine Learning, Statistics - Applications},
16 | year = 2018,
17 | adsurl = {http://adsabs.harvard.edu/abs/2018arXiv180608915B},
18 | adsnote = {Provided by the SAO/NASA Astrophysics Data System}
19 | }
20 |
21 |
22 | @book{collett2015modelling,
23 | title={Modelling Survival Data in Medical Research, Third Edition},
24 | author={Collett, David},
25 | isbn={9781498731690},
26 | series={Chapman \& Hall/CRC Texts in Statistical Science},
27 | url={http://books.google.pl/books?id=Okf7CAAAQBAJ},
28 | year={2015},
29 | publisher={CRC Press}
30 | }
31 |
32 | @article{lu2003modeling,
33 | title={Modeling customer lifetime value using survival analysis—an application in the telecommunications industry},
34 | author={Lu, Junxiang and Park, O},
35 | journal={Data Mining Techniques},
36 | pages={120--128},
37 | year={2003},
38 | publisher={Citeseer}
39 | }
40 |
41 | @Article{randomForestSRC,
42 | title = {Random survival forests},
43 | author = {Ishwaran, Hemant and Kogalur, Udaya B. and Blackstone, Eugene H. and Lauer, Michael S.},
44 | journal = {The Annals of Applied Statistics},
45 | year = {2008},
46 | volume = {2},
47 | number = {3},
48 | pages = {841--860},
49 | doi = {doi:10.1214/08-AOAS169},
50 | url = {http://arXiv.org/abs/0811.1645v1},
51 | pdf = {http://arxiv.org/pdf/0811.1645},
52 | }
53 |
54 | @article{ELEUTERI2003855,
55 | title = {A novel neural network-based survival analysis model},
56 | journal = {Neural Networks},
57 | volume = {16},
58 | number = {5},
59 | pages = {855 - 864},
60 | year = {2003},
61 | note = {Advances in Neural Networks Research: IJCNN '03},
62 | issn = {0893-6080},
63 | doi = {10.1016/S0893-6080(03)00098-4},
64 | url = {http://doi.org/10.1016/S0893-6080(03)00098-4},
65 | author = {Eleuteri, Antonio and Tagliaferri, Roberto and Milano, Leopoldo and De Placido, Sabino and De Laurentiis, Michele},
66 | keywords = {Survival analysis, Conditioning probability estimation, Neural networks, Bayesian learning, MCMC methods}
67 | }
68 |
69 | @article{RJ-2017-016,
70 | author = {Greenwell, Brandon M.},
71 | title = {{pdp: An R Package for Constructing Partial Dependence Plots}},
72 | year = {2017},
73 | journal = {{The R Journal}},
74 | url = {http://journal.r-project.org/archive/2017/RJ-2017-016/index.html},
75 | pages = {421--436},
76 | volume = {9},
77 | number = {1}
78 | }
79 |
80 | @Article{BSScore,
81 | title = {Evaluating Random Forests for Survival Analysis Using
82 | Prediction Error Curves},
83 | author = {Mogensen, Ulla B. and Ishwaran, Hemant and Gerds, Thomas A.
84 | },
85 | journal = {Journal of Statistical Software},
86 | year = {2012},
87 | volume = {50},
88 | number = {11},
89 | pages = {1--23},
90 | url = {http://www.jstatsoft.org/v50/i11/},
91 | }
92 |
93 | @ARTICLE{2018arXiv180401955S,
94 | author = {Staniak, Mateusz and Biecek, Przemysław},
95 | title = "{Explanations of model predictions with live and breakDown packages}",
96 | eprint = {1804.01955},
97 | primaryClass = "stat.ML",
98 | keywords = {Statistics - Machine Learning, Computer Science - Learning, Statistics - Applications},
99 | year = 2018,
100 | url = {http://arxiv.org/abs/1804.01955},
101 | adsurl = {http://adsabs.harvard.edu/abs/2018arXiv180401955S},
102 | adsnote = {Provided by the SAO/NASA Astrophysics Data System}
103 | }
104 |
105 |
106 | @article{Molnar2018,
107 | doi = {10.21105/joss.00786},
108 | url = {http://doi.org/10.21105/joss.00786},
109 | year = {2018},
110 | month = {jun},
111 | publisher = {The Open Journal},
112 | volume = {3},
113 | number = {26},
114 | pages = {786},
115 | author = {Molnar, Christoph},
116 | title = {iml: An R package for Interpretable Machine Learning},
117 | journal = {Journal of Open Source Software}
118 | }
119 |
120 | @misc{pramit_choudhary_2018_1198885,
121 | author = {Choudhary, Pramit and
122 | Kramer, Aaron and
123 | datascience.com team, contributors},
124 | title = {{Skater: Model Interpretation Library}},
125 | month = mar,
126 | year = 2018,
127 | doi = {10.5281/zenodo.1198885},
128 | url = {http://doi.org/10.5281/zenodo.1198885}
129 | }
130 |
131 |
132 | @InProceedings{pmlr-v70-dempsey17a,
133 | title = {i{S}urvive: An Interpretable, Event-time Prediction Model for m{H}ealth},
134 | author = {Dempsey, Walter H. and Moreno, Alexander and Scott, Christy K. and Dennis, Michael L. and Gustafson, David H. and Murphy, Susan A. and Rehg, James M.},
135 | booktitle = {Proceedings of the 34th International Conference on Machine Learning},
136 | pages = {970--979},
137 | year = {2017},
138 | editor = {Doina Precup and Yee Whye Teh},
139 | volume = {70},
140 | series = {Proceedings of Machine Learning Research},
141 | address = {International Convention Centre, Sydney, Australia},
142 | month = {06--11 Aug},
143 | publisher = {PMLR},
144 | pdf = {http://proceedings.mlr.press/v70/dempsey17a/dempsey17a.pdf},
145 | url = {http://proceedings.mlr.press/v70/dempsey17a.html}
146 | }
147 |
148 |
149 |
150 | @article{doi:10.4155/fmc.11.23,
151 | author = {Johansson, Ulf and Sönströd, Cecilia and Norinder, Ulf and Boström, Henrik},
152 | title = {Trade-off between accuracy and interpretability for predictive in silico modeling},
153 | journal = {Future Medicinal Chemistry},
154 | volume = {3},
155 | number = {6},
156 | pages = {647-663},
157 | year = {2011},
158 | doi = {10.4155/fmc.11.23},
159 | note ={PMID: 21554073},
160 | URL = {http://doi.org/10.4155/fmc.11.23},
161 | eprint = {http://doi.org/10.4155/fmc.11.23}
162 | }
163 |
164 |
165 |
--------------------------------------------------------------------------------
/survxai.Rproj:
--------------------------------------------------------------------------------
1 | Version: 1.0
2 |
3 | RestoreWorkspace: Default
4 | SaveWorkspace: Default
5 | AlwaysSaveHistory: Default
6 |
7 | EnableCodeIndexing: Yes
8 | UseSpacesForTab: Yes
9 | NumSpacesForTab: 2
10 | Encoding: UTF-8
11 |
12 | RnwWeave: Sweave
13 | LaTeX: pdfLaTeX
14 |
15 | AutoAppendNewline: Yes
16 | StripTrailingWhitespace: Yes
17 |
18 | BuildType: Package
19 | PackageUseDevtools: Yes
20 | PackageInstallArgs: --no-multiarch --with-keep.source
21 |
--------------------------------------------------------------------------------
/tests/testthat.R:
--------------------------------------------------------------------------------
1 | library(testthat)
2 | library(survxai)
3 |
4 | test_check("survxai")
5 |
--------------------------------------------------------------------------------
/tests/testthat/objects_for_tests.R:
--------------------------------------------------------------------------------
1 | library(survxai)
2 | library(rms)
3 | library(randomForestSRC)
4 | library(prodlim)
5 | library(pec)
6 | library(tibble)
7 |
8 | data("pbcTest")
9 | data("pbcTrain")
10 | pbc2 <- as_tibble(pbcTest)
11 |
12 | predict_times <- function(object, newdata, times){
13 | prob <- rms::survest(object, newdata, times = times)$surv
14 | return(prob)
15 | }
16 |
17 | predict_times_rf<- function(object, newdata, times, ...){
18 | f <- sapply(newdata, is.integer)
19 | cols <- names(which(f))
20 | object$xvar[cols] <- lapply(object$xvar[cols], as.integer)
21 | ptemp <- predict(object,newdata=newdata,importance="none")$survival
22 | pos <- prodlim::sindex(jump.times=object$time.interest,eval.times=times)
23 | p <- cbind(1,ptemp)[,pos+1,drop=FALSE]
24 | if (NROW(p) != NROW(newdata) || NCOL(p) != length(times))
25 | stop(paste("\nPrediction matrix has wrong dimensions:\nRequested newdata x times: ",NROW(newdata)," x ",length(times),"\nProvided prediction matrix: ",NROW(p)," x ",NCOL(p),"\n\n",sep=""))
26 | p
27 | }
28 |
29 | rf_model <- rfsrc(Surv(years, status)~., data = pbcTrain, ntree = 100)
30 | cph_model <- cph(Surv(years, status)~sex + bili+stage, data=pbcTrain, surv=TRUE, x = TRUE, y=TRUE)
31 | cph_model2 <- cph(Surv(years, status)~sex+bili, data=pbcTrain, surv=TRUE, x = TRUE, y=TRUE)
32 |
33 | cph_model_different_class <- cph_model
34 | class(cph_model_different_class) <- "custom_model"
35 |
36 |
37 | surve_cph <- explain(model = cph_model,
38 | data = pbcTest[,-c(1,5)], y = Surv(pbcTest$years, pbcTest$status),
39 | predict_function = predict_times)
40 |
41 | surve_cph2 <- explain(model = cph_model2,
42 | data = pbcTest[,-c(1,5)], y = Surv(pbcTest$years, pbcTest$status),
43 | predict_function = predict_times, label = "2")
44 |
45 |
46 | predict_cph <- function(object, newdata, times){
47 | class(object) <- c("cph", "rms","coxph")
48 | p <- predictSurvProb(object, newdata, times)
49 | p
50 | }
51 |
52 | surve_cph_artificial <- explain(model = cph_model_different_class,
53 | data = pbcTest[,-c(1,5)], y = Surv(pbcTest$years, pbcTest$status),
54 | predict_function = predict_cph)
55 |
56 | surve_cph_tbl <- explain(model = cph_model2,
57 | data = pbc2[,-c(1,5)],y = Surv(pbcTest$years, pbcTest$status),
58 | predict_function = predict_times, label = "2")
59 |
60 | surve_rf <- explain(model = rf_model,
61 | data = pbcTest[,-c(1,5)], y = Surv(pbcTest$years, pbcTest$status),
62 | predict_function = predict_times_rf, label = "rf")
63 |
64 | surve_cph_null_data <- explain(model = cph_model, y = Surv(pbcTest$years, pbcTest$status),
65 | predict_function = predict_times)
66 | surve_cph_null_data$data <- NULL
67 |
68 | explainer <- surve_cph
69 | class(explainer) <- "explainer"
70 |
71 |
72 |
73 | broken_prediction <- prediction_breakdown(surve_cph, pbcTest[1,-c(1,5)])
74 | broken_prediction_prob <- prediction_breakdown(surve_cph, pbcTest[1,-c(1,5)], prob = 0.9)
75 | broken_prediction2 <- prediction_breakdown(surve_cph2, pbcTest[1,-c(1,5)])
76 | svr_cph <- variable_response(surve_cph, "sex")
77 | svr_cph2 <- variable_response(surve_cph2, "sex")
78 | svr_cph_group <- variable_response(surve_cph, "bili")
79 | cp_cph <- ceteris_paribus(surve_cph, pbcTest[1,-c(1,5)])
80 | mp_cph <- model_performance(surve_cph)
81 | mp_cph_artificial <- model_performance(surve_cph_artificial)
82 |
83 | mp_rf <- model_performance(surve_rf)
84 |
85 |
86 | plot_var_resp <- plot(svr_cph)
87 | plot_var_resp_levels <- plot(svr_cph, svr_cph2, split = "variable")
88 | plot_var_resp_default <- plot(svr_cph, svr_cph2)
89 | plot_cp <- plot(cp_cph)
90 | plot_mp <- plot(mp_cph)
91 |
92 |
--------------------------------------------------------------------------------
/tests/testthat/test_explainer.R:
--------------------------------------------------------------------------------
1 | context("surv_explainer")
2 |
3 | source("objects_for_tests.R")
4 |
5 | test_that("Creating surv_explainer", {
6 | expect_is(surve_cph, "surv_explainer")
7 | expect_is(surve_cph_null_data, "surv_explainer")
8 | expect_is(surve_cph_tbl, "surv_explainer")
9 | })
10 |
--------------------------------------------------------------------------------
/tests/testthat/test_plot_ceteris_paribus.R:
--------------------------------------------------------------------------------
1 | context("plot_ceteris_paribus")
2 |
3 | source("objects_for_tests.R")
4 |
5 | test_that("Output", {
6 | expect_is(plot(cp_cph), "ggplot")
7 | expect_is(plot(cp_cph, selected_variable = "sex"), "ggplot")
8 | })
9 |
10 | test_that("Wrong input",{
11 | expect_error(plot(cp_cph, selected_variable = "se"))
12 | })
--------------------------------------------------------------------------------
/tests/testthat/test_plot_explainer.R:
--------------------------------------------------------------------------------
1 | context("plot_explainer")
2 |
3 | source("objects_for_tests.R")
4 |
5 | test_that("Output", {
6 | expect_is(plot(x=surve_cph), "ggsurvplot")
7 | })
8 |
--------------------------------------------------------------------------------
/tests/testthat/test_plot_model_performance.R:
--------------------------------------------------------------------------------
1 | context("plot_model_performance")
2 |
3 | source("objects_for_tests.R")
4 |
5 | test_that("Output", {
6 | expect_is(plot(mp_cph), "gg")
7 | expect_is(plot(mp_cph, model_performance(surve_cph2)), "gg")
8 | expect_is(plot(mp_cph, mp_cph_artificial), "gg")
9 | })
--------------------------------------------------------------------------------
/tests/testthat/test_plot_prediction_breakdown.R:
--------------------------------------------------------------------------------
1 | context("plot_variable_response")
2 |
3 | source("objects_for_tests.R")
4 |
5 | test_that("Output", {
6 | expect_is(plot(broken_prediction), "ggplot")
7 | expect_is(plot(broken_prediction, broken_prediction2), "ggplot")
8 | expect_is(plot(broken_prediction_prob), "gg")
9 | })
10 |
--------------------------------------------------------------------------------
/tests/testthat/test_plot_variable_response.R:
--------------------------------------------------------------------------------
1 | context("plot_variable_response")
2 |
3 | source("objects_for_tests.R")
4 |
5 | test_that("Output", {
6 | expect_is(plot(svr_cph_group), "gg")
7 | expect_is(plot(svr_cph), "gg")
8 | expect_is(plot_var_resp_levels, "ggplot")
9 | expect_is(plot_var_resp_default, "ggplot")
10 | })
11 |
--------------------------------------------------------------------------------
/tests/testthat/test_prints.R:
--------------------------------------------------------------------------------
1 | context("print functions")
2 |
3 | source("objects_for_tests.R")
4 |
5 | test_that("Output explain", {
6 | expect_error(print(surve_cph), NA)
7 | })
8 |
9 |
10 | test_that("Output prediction_breakdown", {
11 | expect_error(print(broken_prediction), NA)
12 | })
13 |
14 | test_that("Output model_performance", {
15 | expect_error(print(mp_cph), NA)
16 | })
17 |
18 | test_that("Output variable_response", {
19 | expect_error(print(svr_cph), NA)
20 | })
21 |
22 | test_that("Output ceteris_paribus", {
23 | expect_error(print(cp_cph), NA)
24 | })
25 |
--------------------------------------------------------------------------------
/tests/testthat/test_surv_ceteris_paribus.R:
--------------------------------------------------------------------------------
1 | context("surv_ceteris_paribus")
2 |
3 | source("objects_for_tests.R")
4 |
5 | test_that("Creating surv_ceteris_paribus", {
6 | expect_is(cp_cph, "surv_ceteris_paribus_explainer")
7 | expect_is(cp_cph, "data.frame")
8 | expect_is(ceteris_paribus(surve_cph, pbcTest[1,-c(1,5)], selected_variables = "sex"), "data.frame")
9 | })
10 |
11 |
12 | test_that("Wrong input",{
13 | expect_error(ceteris_paribus(surve_cph))
14 | expect_error(ceteris_paribus(pbcTest[1,-c(1,5)]))
15 | expect_error(ceteris_paribus(surve_cph_null_data, pbcTest[1,-c(1,5)]))
16 | })
--------------------------------------------------------------------------------
/tests/testthat/test_surv_model_performance.R:
--------------------------------------------------------------------------------
1 | context("surv_model_performance")
2 |
3 | source("objects_for_tests.R")
4 |
5 | test_that("Creating surv_model_performance", {
6 | expect_is(mp_cph, "surv_model_performance_explainer")
7 | expect_is(mp_cph, "BS")
8 | expect_is(mp_cph_artificial, "surv_model_performance_explainer")
9 | })
10 |
11 | test_that("Wrong input",{
12 | expect_error(model_performance(cph_model))
13 | expect_error(model_performance(surve_cph_null_data))
14 | })
--------------------------------------------------------------------------------
/tests/testthat/test_surv_prediction_breakdown.R:
--------------------------------------------------------------------------------
1 | context("surv_prediction_breakdown")
2 |
3 | source("objects_for_tests.R")
4 |
5 | test_that("Creating surv_prediction_breakdown", {
6 | expect_is(broken_prediction, "surv_prediction_breakdown_explainer")
7 | expect_is(broken_prediction, "data.frame")
8 | })
9 |
10 |
11 | test_that("Wrong input",{
12 | expect_error(prediction_breakdown(surve_cph_null_data))
13 | expect_error(prediction_breakdown(explainer))
14 | })
--------------------------------------------------------------------------------
/tests/testthat/test_surv_variable_response.R:
--------------------------------------------------------------------------------
1 | context("surv_variable_response")
2 |
3 | source("objects_for_tests.R")
4 |
5 | test_that("Creating surv_variable_response", {
6 | expect_is(svr_cph, "surv_variable_response_explainer")
7 | expect_is(svr_cph, "pdp")
8 | expect_is(svr_cph, "data.frame")
9 | })
10 |
11 |
12 | test_that("Wrong input",{
13 | expect_error(variable_response(surve_cph_null_data))
14 | expect_error(variable_response(explainer))
15 | })
16 |
--------------------------------------------------------------------------------
/vignettes/Custom_predict_for_survival_models.Rmd:
--------------------------------------------------------------------------------
1 | ---
2 | title: "Custom predict function for survival models"
3 | author: "Alicja Gosiewska, Aleksandra Grudziąż"
4 | date: "`r Sys.Date()`"
5 | output:
6 | html_document:
7 | toc: true
8 | toc_float: true
9 | number_sections: true
10 | vignette: >
11 | %\VignetteEngine{knitr::knitr}
12 | %\VignetteIndexEntry{Custom predict function for survival models}
13 | %\usepackage[UTF-8]{inputenc}
14 | ---
15 |
16 | ```{r setup, include=FALSE}
17 | knitr::opts_chunk$set(echo = TRUE,
18 | message = FALSE,
19 | warning = FALSE)
20 | ```
21 |
22 | # Introduction
23 |
24 | This vignette contains example predict functions for survival models. Some functions are already implemented. Therefore, for some models there is no need to specify predict function.
25 |
26 | ```{r dataset}
27 | data(pbc, package = "randomForestSRC")
28 | pbc <- pbc[complete.cases(pbc),]
29 | pbc$sex <- as.factor(pbc$sex)
30 | pbc$stage <- as.factor(pbc$stage)
31 | ```
32 |
33 |
34 | # Implemented Models
35 |
36 | Currently implemented model classes. Objects listed below don't need specified predict function.
37 |
38 | * `aalen`
39 | * `riskRegression`
40 | * `cox.aalen`
41 | * `cph`
42 | * `coxph`
43 | * `matrix`
44 | * `selectCox`
45 | * `pecCforest`
46 | * `prodlim`
47 | * `psm`
48 | * `survfit`
49 | * `pecRpart`
50 | * `pecCtree`
51 |
52 | ```{r, models}
53 | set.seed(1024)
54 | library(rms)
55 | library(survxai)
56 | cph_model <- cph(Surv(days/365, status) ~ treatment + age + sex + ascites + hepatom + spiders + edema + bili + chol + albumin + copper + alk + sgot + trig + platelet + prothrombin + stage , data = pbc, surv = TRUE, x = TRUE, y=TRUE)
57 |
58 | surve_cph <- explain(model = cph_model,
59 | data = pbc[,-c(1,2)], y = Surv(pbc$days/365, pbc$status))
60 | ```
61 |
62 | # RandomForestSRC
63 |
64 | Predict function for class `rfsrc` is not implemented. Therefore, custom predict function should be provided.
65 |
66 | ```{r}
67 | library(prodlim)
68 | library(randomForestSRC)
69 |
70 | predict_rf <- function(object, newdata, times, ...){
71 | f <- sapply(newdata, is.integer)
72 | cols <- names(which(f))
73 | object$xvar[cols] <- lapply(object$xvar[cols], as.integer)
74 | ptemp <- predict(object,newdata=newdata,importance="none")$survival
75 | pos <- prodlim::sindex(jump.times=object$time.interest,eval.times=times)
76 | p <- cbind(1,ptemp)[,pos+1,drop=FALSE]
77 | return(p)
78 | }
79 | ```
80 |
81 | ```{r}
82 | pbc$year <- pbc$days/365
83 | rf_model <- rfsrc(Surv(year, status)~., data = pbc[,-1])
84 |
85 | surve_rf <- explain(model = rf_model,
86 | data = pbc[,-c(1,2,20)], y = Surv(pbc$year, pbc$status),
87 | predict_function = predict_rf)
88 | ```
89 |
90 |
91 |
92 | # survreg
93 |
94 |
95 | Predict function for class `survreg` is not implemented. Therefore, custom predict function should be provided.
96 |
97 |
98 | ```{r}
99 | library(survival)
100 |
101 | predict_reg <- function(model, newdata, times){
102 | times <- sort(times)
103 | vars <- all.vars(model$call[[2]][[2]])
104 | n_vars <- which(colnames(newdata) %in% vars)
105 | if(length(n_vars)>0){
106 | newdata <- newdata[,-c(n_vars)]
107 | }
108 | model$x <- model.matrix(~., newdata)
109 | res <- matrix(ncol = length(times), nrow = nrow(newdata))
110 | for(i in 1:nrow(newdata)) {
111 | res[i,] <- cfc.survreg.survprob(t = times, args = model, n = i)
112 | }
113 | return(res)
114 | }
115 |
116 | ```
117 |
118 | ```{r}
119 | reg_model <- survreg(Surv(year, status)~., data = pbc[,-1], x = TRUE)
120 |
121 | surve_reg <- explain(model = rf_model,
122 | data = pbc[,-c(1,2,20)],
123 | y = Surv(pbc$year, pbc$status),
124 | predict_function = predict_reg)
125 | ```
126 |
127 |
128 |
129 |
--------------------------------------------------------------------------------
/vignettes/Global_explanations.Rmd:
--------------------------------------------------------------------------------
1 | ---
2 | title: "Survival models - global explanations"
3 | author: "Alicja Gosiewska"
4 | date: "`r Sys.Date()`"
5 | output:
6 | html_document:
7 | toc: true
8 | toc_float: true
9 | number_sections: true
10 | vignette: >
11 | %\VignetteEngine{knitr::knitr}
12 | %\VignetteIndexEntry{Survival models - global explanations}
13 | %\usepackage[UTF-8]{inputenc}
14 | ---
15 |
16 | ```{r setup, include=FALSE}
17 | knitr::opts_chunk$set(echo = TRUE,
18 | message = FALSE,
19 | warning = FALSE)
20 | ```
21 |
22 | # Introduction
23 | Package *survxai* contains functions for creating a unified representation of a survival models. Such representations can be further processed by various survival explainers. Tools implemented in *survxai* help to understand how input variables are used in the model and what impact do they have on final model prediction.
24 |
25 | The analyses carried out using this package can be divided into two parts: local analyses of new observations and global analyses showing the structures of survival models. This vignette describes local explanations.
26 |
27 | Methods and functions in *survxai* package are based on [*DALEX* package](https://github.com/pbiecek/DALEX).
28 |
29 | # Use case - data
30 |
31 | ## Data set
32 | In our use case we will use the data from the Mayo Clinic trial in primary biliary cirrhosis (PBC) of the liver conducted between 1974 and 1984. A total of 424 PBC patients, referred to Mayo Clinic during that ten-year interval, met eligibility criteria for the randomized placebo controlled trial of the drug D-penicillamine. The
33 | first 312 cases in the data set participated in the randomized trial and contain largely complete data.
34 | The `pbc` data is included in the [*randomForestSRC* package](https://CRAN.R-project.org/package=randomForestSRC).
35 | ```{r dataset}
36 | data(pbc, package = "randomForestSRC")
37 | pbc <- pbc[complete.cases(pbc),]
38 |
39 | head(pbc)
40 | ```
41 |
42 | Our original data set contains only the numerical variables.
43 | For this usecase we convert variables `sex` and `stage` to factor variables.
44 |
45 | ```{r}
46 | pbc$sex <- as.factor(pbc$sex)
47 | pbc$stage <- as.factor(pbc$stage)
48 | ```
49 |
50 |
51 | ## Model
52 | We will create Cox proportional hazards model based on five variables from our data set: `age`, `treatment`, `status`, `sex` and `bili`.
53 | ```{r, models}
54 | set.seed(1024)
55 | library(rms)
56 | library(survxai)
57 |
58 | pbc_smaller <- pbc[,c("days", "status", "treatment", "sex", "age", "bili", "stage")]
59 | pbc_smaller$years <- pbc_smaller$days/356
60 | pbc_smaller <- pbc_smaller[,-1]
61 | head(pbc_smaller)
62 | cph_model <- cph(Surv(years, status) ~ treatment + sex + age + bili + stage, data = pbc_smaller, surv = TRUE, x = TRUE, y=TRUE)
63 | ```
64 |
65 | # Global explanations
66 | In this section we focus on explanations of the global and conditional model structure.
67 |
68 | ## Explainers
69 | First, we have to create survival explainers - objects to wrap-up the black-box model with meta-data. Explainers unify model interfacing.
70 |
71 | Some models require custom predict function. Examples are in [Explainations of different survival models vignette](https://mi2datalab.github.io/survxai/articles/Custom_predict_for_survival_models.html).
72 | ```{r, explainer}
73 |
74 | surve_cph <- explain(model = cph_model,
75 | data = pbc_smaller[,-c(1,7)],
76 | y = Surv(pbc_smaller$years, pbc_smaller$status))
77 | print(surve_cph)
78 | ```
79 |
80 | ## Model performance
81 | Currently, in the *survxai* package is implemented only the `BS` type of model performance.
82 | In this metod for each time point we compute the prediction error for our model.
83 | ```{r}
84 | mp_cph <- model_performance(surve_cph)
85 | print(mp_cph)
86 | ```
87 |
88 | After creating the `surv_model_prediction` object we can visualize it in a very convinient way using the generic `plot()` function.
89 | On our plot there are prediction error curves for model from the explainer.
90 | For more details about these curves see: [Mogensen, 2012](https://www.ncbi.nlm.nih.gov/pmc/articles/PMC4194196/)
91 |
92 | ```{r}
93 | plot(mp_cph)
94 | ```
95 |
96 |
97 | ## Variable response
98 | Variable response explainers are designed to better understand the relation between a variable and a model output.
99 | These types of explainers are inspired among others by *pdp* package [Greenwell, 2017](https://journal.r-project.org/archive/2017/RJ-2017-016/index.html).
100 | ```{r}
101 | vr_cph_sex <- variable_response(surve_cph, "sex")
102 | print(vr_cph_sex)
103 | vr_cph_bili <- variable_response(surve_cph, "bili")
104 | ```
105 |
106 |
107 | After creating the `surv_variable_response` objects we can visualize them in a very convinient way using the generic `plot()` function.
108 |
109 | Variable response plots for survival models are survival curves conditioned by one variable. Each curve represent different value of chosen variable. For factor variables curves covers all possible values, for numeric variables values are divided into quantiles.
110 |
111 | Variable response plot illustrates how will the mean survival curve change along with the changing variable value.
112 | ```{r}
113 | plot(vr_cph_sex)
114 | ```
115 |
116 | ```{r}
117 | plot(vr_cph_bili)
118 | ```
119 |
--------------------------------------------------------------------------------
/vignettes/How_to_compare_models_with_survxai_files/figure-html/unnamed-chunk-12-1.png:
--------------------------------------------------------------------------------
https://raw.githubusercontent.com/MI2DataLab/survxai/ee5c7df52b347e422efcf028bf2afe652284fb2d/vignettes/How_to_compare_models_with_survxai_files/figure-html/unnamed-chunk-12-1.png
--------------------------------------------------------------------------------
/vignettes/How_to_compare_models_with_survxai_files/figure-html/unnamed-chunk-13-1.png:
--------------------------------------------------------------------------------
https://raw.githubusercontent.com/MI2DataLab/survxai/ee5c7df52b347e422efcf028bf2afe652284fb2d/vignettes/How_to_compare_models_with_survxai_files/figure-html/unnamed-chunk-13-1.png
--------------------------------------------------------------------------------
/vignettes/How_to_compare_models_with_survxai_files/figure-html/unnamed-chunk-15-1.png:
--------------------------------------------------------------------------------
https://raw.githubusercontent.com/MI2DataLab/survxai/ee5c7df52b347e422efcf028bf2afe652284fb2d/vignettes/How_to_compare_models_with_survxai_files/figure-html/unnamed-chunk-15-1.png
--------------------------------------------------------------------------------
/vignettes/How_to_compare_models_with_survxai_files/figure-html/unnamed-chunk-16-1.png:
--------------------------------------------------------------------------------
https://raw.githubusercontent.com/MI2DataLab/survxai/ee5c7df52b347e422efcf028bf2afe652284fb2d/vignettes/How_to_compare_models_with_survxai_files/figure-html/unnamed-chunk-16-1.png
--------------------------------------------------------------------------------
/vignettes/How_to_compare_models_with_survxai_files/figure-html/unnamed-chunk-9-1.png:
--------------------------------------------------------------------------------
https://raw.githubusercontent.com/MI2DataLab/survxai/ee5c7df52b347e422efcf028bf2afe652284fb2d/vignettes/How_to_compare_models_with_survxai_files/figure-html/unnamed-chunk-9-1.png
--------------------------------------------------------------------------------
/vignettes/Local_explanations.Rmd:
--------------------------------------------------------------------------------
1 | ---
2 | title: "Survival models - local explanations"
3 | author: "Aleksandra Grudziaz"
4 | date: "`r Sys.Date()`"
5 | output:
6 | html_document:
7 | toc: true
8 | toc_float: true
9 | number_sections: true
10 | vignette: >
11 | %\VignetteEngine{knitr::knitr}
12 | %\VignetteIndexEntry{Survival models - local explanations}
13 | %\usepackage[UTF-8]{inputenc}
14 | ---
15 |
16 | ```{r setup, include=FALSE}
17 | knitr::opts_chunk$set(echo = TRUE,
18 | message = FALSE,
19 | warning = FALSE)
20 | ```
21 |
22 | # Introduction
23 | Package *survxai* contains functions for creating a unified representation of a survival models. Such representations can be further processed by various survival explainers. Tools implemented in *survxai* help to understand how input variables are used in the model and what impact do they have on final model prediction.
24 |
25 | The analyses carried out using this package can be divided into two parts: local analyses of new observations and global analyses showing the structures of survival models. This vignette describes local explanations.
26 |
27 | Methods and functions in *survxai* package are based on [*DALEX* package](https://github.com/pbiecek/DALEX).
28 |
29 | # Use case - data
30 |
31 | ## Data set
32 | In our use case we will use the data from the Mayo Clinic trial in primary biliary cirrhosis (PBC) of the liver conducted between 1974 and 1984. A total of 424 PBC patients, referred to Mayo Clinic during that ten-year interval, met eligibility criteria for the randomized placebo controlled trial of the drug D-penicillamine. The
33 | first 312 cases in the data set participated in the randomized trial and contain largely complete data.
34 | The `pbc` data is included in the [*randomForestSRC* package](https://CRAN.R-project.org/package=randomForestSRC).
35 | ```{r dataset}
36 | data(pbc, package = "randomForestSRC")
37 | pbc <- pbc[complete.cases(pbc),]
38 |
39 | head(pbc)
40 | ```
41 |
42 | Our original data set contains only the numerical variables.
43 | For this usecase we convert variables `sex` and `stage` to factor variables.
44 |
45 | ```{r}
46 | pbc$sex <- as.factor(pbc$sex)
47 | pbc$stage <- as.factor(pbc$stage)
48 | ```
49 |
50 |
51 | ## Models
52 | We will create Cox proportional hazards model based on five variables from our data set: `age`, `treatment`, `status`, `sex` and `bili`.
53 | ```{r, models}
54 | set.seed(1024)
55 | library(rms)
56 | library(survxai)
57 |
58 | pbc_smaller <- pbc[,c("days", "status", "treatment", "sex", "age", "bili", "stage")]
59 | head(pbc_smaller)
60 |
61 | cph_model <- cph(Surv(days/365, status) ~ treatment + sex + age + bili + stage , data = pbc_smaller, surv = TRUE, x = TRUE, y=TRUE)
62 | ```
63 |
64 | # Local explanations
65 | In this section we will focus on the local explanations - the explanations for chosen new observations.
66 |
67 | ## Explainers
68 | First, we have to create survival explainers - objects to wrap-up the black-box model with meta-data. Explainers unify model interfacing.
69 |
70 | We have to define custom predict function which takes three arguments: model, data and vector with time points. Predict funcions may vary depending on the model. Examples for some models are in [Explainations of different survival models vignette](https://github.com/MI2DataLab/survxai/blob/master/vignettes/Custom_predict_for_survival_models.Rmd).
71 | ```{r, explainer}
72 |
73 | predict_times <- function(model, data, times){
74 | prob <- rms::survest(model, data, times = times)$surv
75 | return(prob)
76 | }
77 |
78 | surve_cph <- explain(model = cph_model,
79 | data = pbc_smaller[,-c(1,2)], y = Surv(pbc_smaller$days/365, pbc_smaller$status),
80 | predict_function = predict_times)
81 |
82 | print(surve_cph)
83 | ```
84 |
85 | ## Ceteris paribus
86 | Ceteris Paribus Plots (What-If Plots) are designed to present model responses around a single point in the feature space.
87 | For more details for generalised models of machine learning see: https://github.com/pbiecek/ceterisParibus.
88 |
89 | Ceteris Paribus Plots for survival models are survival curves around one observation. Each curve represent observation with different value of chosen variable. For factor variables curves covers all possible values, for numeric variables values are divided into quantiles.
90 |
91 | Ceteris Paribus Plot illustrates how will the survival curve change along with the changing variable.
92 |
93 | Below, we plot Ceteris Paribus for one observation.
94 |
95 | ```{r, single observation}
96 | single_observation <- pbc_smaller[1,-c(1,2)]
97 | single_observation
98 | ```
99 |
100 | ```{r, ceteris paribus}
101 | cp_cph <- ceteris_paribus(surve_cph, single_observation)
102 | print(cp_cph)
103 | ```
104 |
105 | After creating the `surv_ceteris_paribus` object we can visualize it in a very convinient way using the generic `plot()` function. Black line represent prediction of original observation.
106 |
107 | ```{r, fig.height=6}
108 | plot(cp_cph, scale_type = "gradient", scale_col = c("red", "blue"), ncol = 2)
109 | ```
110 |
111 | We can see that there are differences for stages. Next, we will plot Ceteris Paribus for sigle variable `stage`.
112 |
113 | ```{r, fig.height=3}
114 | plot(cp_cph, selected_variable = "stage", scale_type = "gradient", scale_col = c("red", "blue"))
115 | ```
116 |
117 | We see a trend that a lower `stage` means a higher probability of survival for chosen observation.
118 |
119 |
120 | ## Prediction breakdown
121 | Break Down Plot presents variable contributions in final predictions.
122 | For more details for generalised models of machine learning see: https://github.com/pbiecek/breakDown.
123 |
124 | Break Down Plots for survival models compare differences in predictions for median of time.
125 |
126 | ```{r, prediction breakdown}
127 | broken_prediction_cph <- prediction_breakdown(surve_cph, pbc_smaller[1,-c(1,2)])
128 | print(broken_prediction_cph)
129 | ```
130 |
131 | After creating the `surv_prediction_breakdown` object we can visualize it in a very convinient way using the generic `plot()` function.
132 |
133 | ```{r}
134 | plot(broken_prediction_cph, scale_col = c("red", "blue"))
135 | ```
136 |
137 | This plot helps to understand the factors that drive survival probability for a single observation.
138 |
139 |
140 |
--------------------------------------------------------------------------------