├── README.md
├── demo.py
├── dfguik.py
└── docs
├── sc1.png
├── sc2.png
├── sc3.png
├── sc4.png
└── sc5.png
/README.md:
--------------------------------------------------------------------------------
1 | # DataframeGUIKivy
2 |
3 | Port of Dataframe GUI module to a Kivy widget. Original module can be found at this repository: https://github.com/bluenote10/PandasDataFrameGUI
4 |
5 | ## Demo Run Instructions
6 |
7 | ```sh
8 | $ python demo.py
9 | ```
10 |
11 | ## Demo Screenshots
12 |
13 |
14 | 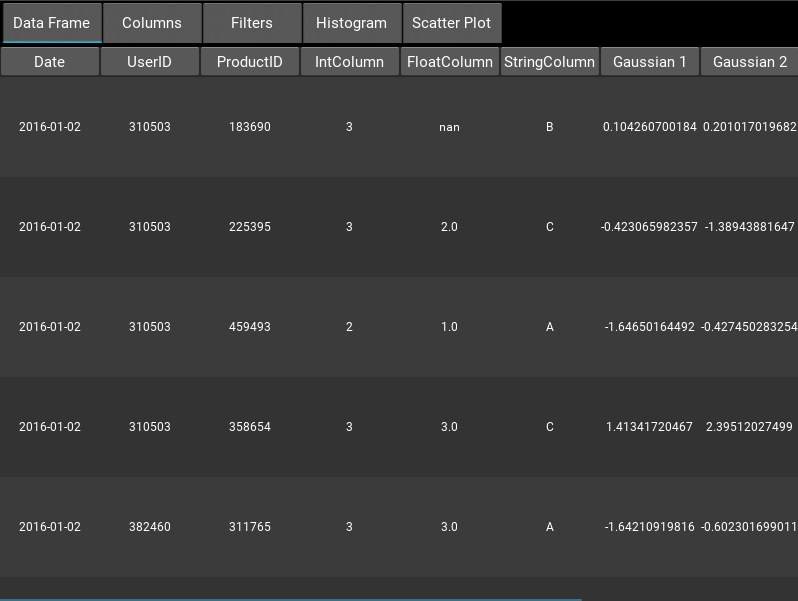 15 |
15 |
16 |
17 |
18 | 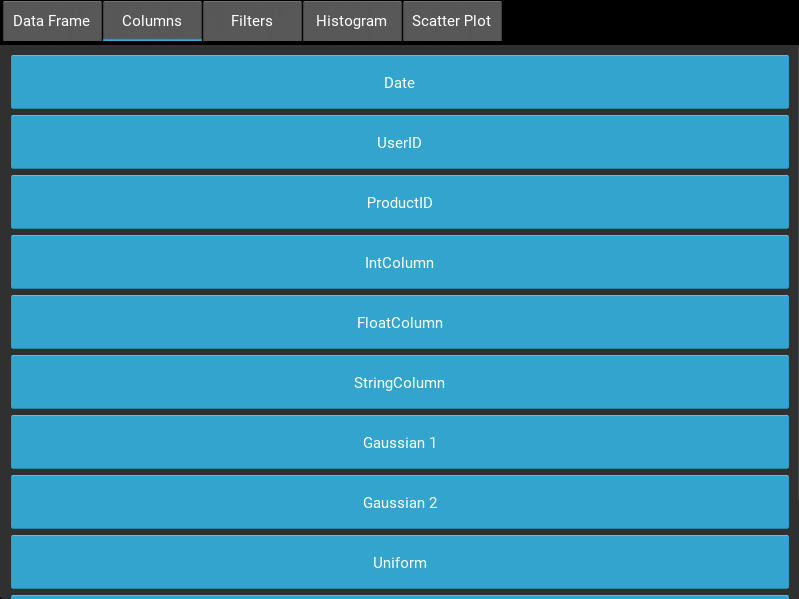 19 |
19 |
20 |
21 |
22 | 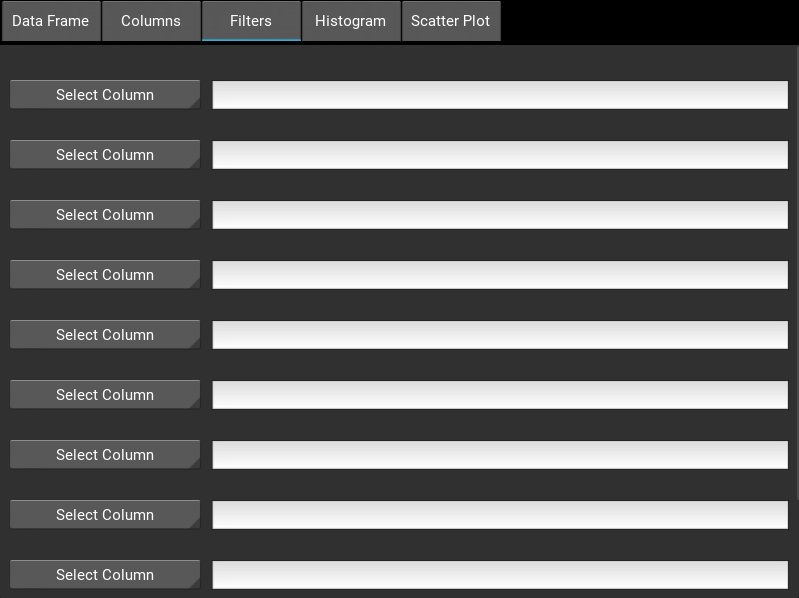 23 |
23 |
24 |
25 |
26 | 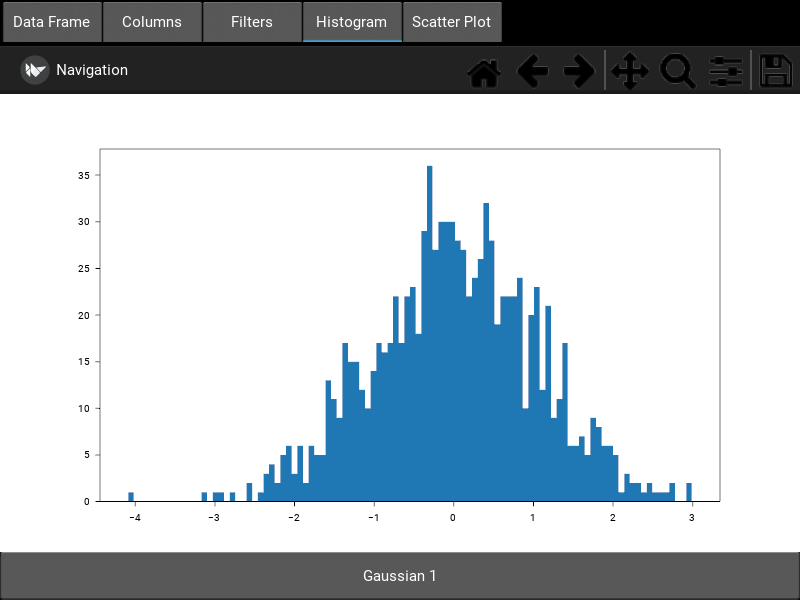 27 |
27 |
28 |
29 |
30 |  31 |
31 |
32 |
33 |
--------------------------------------------------------------------------------
/demo.py:
--------------------------------------------------------------------------------
1 | #!/usr/bin/env python
2 | # -*- encoding: utf-8
3 |
4 | from __future__ import absolute_import, division, print_function
5 |
6 | from kivy.app import App
7 |
8 | import datetime
9 | import numpy as np
10 | import pandas as pd
11 | from dfguik import DfguiWidget
12 |
13 |
14 | def create_dummy_data(size):
15 |
16 | user_ids = np.random.randint(1, 1000000, 10)
17 | product_ids = np.random.randint(1, 1000000, 100)
18 |
19 | def choice(*values):
20 | return np.random.choice(values, size)
21 |
22 | random_dates = [
23 | datetime.date(2016, 1, 1) + datetime.timedelta(days=int(delta))
24 | for delta in np.random.randint(1, 50, size)
25 | ]
26 | return pd.DataFrame.from_items([
27 | ("Date", random_dates),
28 | ("UserID", choice(*user_ids)),
29 | ("ProductID", choice(*product_ids)),
30 | ("IntColumn", choice(1, 2, 3)),
31 | ("FloatColumn", choice(np.nan, 1.0, 2.0, 3.0)),
32 | ("StringColumn", choice("A", "B", "C")),
33 | ("Gaussian 1", np.random.normal(0, 1, size)),
34 | ("Gaussian 2", np.random.normal(0, 1, size)),
35 | ("Uniform", np.random.uniform(0, 1, size)),
36 | ("Binomial", np.random.binomial(20, 0.1, size)),
37 | ("Poisson", np.random.poisson(1.0, size)),
38 | ])
39 |
40 | class DataFrameApp(App):
41 | def build(self):
42 | df = create_dummy_data(1000)
43 | return DfguiWidget(df)
44 |
45 | if __name__ == '__main__':
46 | DataFrameApp().run()
47 |
48 |
--------------------------------------------------------------------------------
/dfguik.py:
--------------------------------------------------------------------------------
1 | import kivy
2 | kivy.require('1.10.0')
3 | from kivy.lang import Builder
4 | from kivy.properties import ListProperty
5 | from kivy.uix.actionbar import ActionDropDown
6 | from kivy.uix.boxlayout import BoxLayout
7 | from kivy.uix.button import Button
8 | from kivy.uix.dropdown import DropDown
9 | from kivy.uix.label import Label
10 | from kivy.uix.popup import Popup
11 | from kivy.uix.tabbedpanel import TabbedPanel
12 | from kivy.uix.textinput import TextInput
13 | from kivy.uix.togglebutton import ToggleButton
14 | from kivy.uix.scrollview import ScrollView
15 | from kivy.uix.spinner import Spinner
16 | from kivy.uix.recycleview import RecycleView
17 | from kivy.properties import BooleanProperty,\
18 | ObjectProperty,\
19 | NumericProperty,\
20 | StringProperty
21 |
22 | import matplotlib
23 | matplotlib.use('module://kivy.garden.matplotlib.backend_kivy')
24 | from matplotlib.figure import Figure
25 | from kivy.garden.matplotlib.backend_kivyagg import FigureCanvas,\
26 | NavigationToolbar2Kivy
27 | import matplotlib.pyplot as plt
28 |
29 | from collections import OrderedDict
30 | import numpy as np
31 | import pandas as pd
32 |
33 | import datetime
34 | from datetime import date
35 |
36 |
37 | Builder.load_string("""
38 |
39 | size_hint: (None, None)
40 | text_size: self.size
41 | halign: "center"
42 | valign: "middle"
43 | height: '30dp'
44 | background_disabled_normal: ''
45 | disabled_color: (1, 1, 1, 1)
46 | canvas.before:
47 | Color:
48 | rgba: 0.165, 0.165, 0.165, 1
49 | Rectangle:
50 | pos: self.pos
51 | size: self.size
52 | on_release: root.parent.parent.parent.parent._generate_table(self.text)
53 |
54 | :
55 | header: header
56 | bar_width: 0
57 | do_scroll: False
58 | size_hint: (1, None)
59 | effect_cls: "ScrollEffect"
60 | height: '30dp'
61 | GridLayout:
62 | id: header
63 | rows: 1
64 | size_hint: (None, None)
65 | width: self.minimum_width
66 | height: self.minimum_height
67 |
68 | :
69 | canvas.before:
70 | Color:
71 | rgba: [0.23, 0.23, 0.23, 1] if root.is_even else [0.2, 0.2, 0.2, 1]
72 | Rectangle:
73 | pos: self.pos
74 | size: self.size
75 | text: root.text
76 | font_size: "12dp"
77 | halign: "center"
78 | valign: "middle"
79 | text_size: self.size
80 | size_hint: 1, 1
81 | height: 60
82 | width: 400
83 |
84 | :
85 | rgrid: rgrid
86 | scroll_type: ['bars', 'content']
87 | bar_color: [0.2, 0.7, 0.9, 1]
88 | bar_inactive_color: [0.2, 0.7, 0.9, .5]
89 | do_scroll_x: True
90 | do_scroll_y: True
91 | effect_cls: "ScrollEffect"
92 | viewclass: "ScrollCell"
93 | RecycleGridLayout:
94 | id: rgrid
95 | rows: root.nrows
96 | cols: root.ncols
97 | size_hint: (None, None)
98 | width: self.minimum_width
99 | height: self.minimum_height
100 |
101 |
102 | :
103 | panel1: data_frame_panel
104 | panel2: col_select_panel
105 | panel3: fil_select_panel
106 | panel4: hist_graph_panel
107 | panel5: scat_graph_panel
108 |
109 | do_default_tab: False
110 |
111 | TabbedPanelItem:
112 | text: 'Data Frame'
113 | on_release: root.open_panel1()
114 | DataframePanel:
115 | id: data_frame_panel
116 | TabbedPanelItem:
117 | text: 'Columns'
118 | ColumnSelectionPanel:
119 | id: col_select_panel
120 | TabbedPanelItem:
121 | text: 'Filters'
122 | FilterPanel:
123 | id: fil_select_panel
124 | TabbedPanelItem:
125 | text: 'Histogram'
126 | HistogramPlot:
127 | id: hist_graph_panel
128 | TabbedPanelItem:
129 | text: 'Scatter Plot'
130 | ScatterPlot:
131 | id: scat_graph_panel
132 |
133 | :
134 | orientation: 'vertical'
135 |
136 | :
137 | col_list: col_list
138 | orientation: 'vertical'
139 | ScrollView:
140 | do_scroll_x: False
141 | do_scroll_y: True
142 | size_hint: 1, 1
143 | scroll_timeout: 150
144 | GridLayout:
145 | id: col_list
146 | padding: "10sp"
147 | spacing: "5sp"
148 | cols:1
149 | row_default_height: '55dp'
150 | row_force_default: True
151 | size_hint_y: None
152 |
153 | :
154 | filter_list: filter_list
155 | orientation: 'vertical'
156 | ScrollView:
157 | do_scroll_x: False
158 | do_scroll_y: True
159 | size_hint: 1, 1
160 | scroll_timeout: 150
161 | GridLayout:
162 | id: filter_list
163 | padding: "10sp"
164 | spacing: "5sp"
165 | cols:1
166 | row_default_height: '55dp'
167 | row_force_default: True
168 | size_hint_y: None
169 |
170 | :
171 | select_btn: select_btn
172 | histogram: histogram
173 | orientation: 'vertical'
174 | Histogram:
175 | id: histogram
176 | BoxLayout:
177 | size_hint_y: None
178 | height: '48dp'
179 | Button:
180 | id: select_btn
181 | text: 'Select Column'
182 | on_release: root.dropdown.open(self)
183 | size_hint_y: None
184 | height: '48dp'
185 |
186 | :
187 | orientation: 'vertical'
188 |
189 | :
190 | select_btn1: select_btn1
191 | select_btn2: select_btn2
192 | scatter: scatter
193 | orientation: 'vertical'
194 | ScatterGraph:
195 | id: scatter
196 | BoxLayout:
197 | size_hint_y: None
198 | height: '48dp'
199 | Button:
200 | id: select_btn1
201 | text: 'Select Column 1'
202 | on_release: root.dropdown1.open(self)
203 | size_hint_y: None
204 | height: '48dp'
205 | Button:
206 | id: select_btn2
207 | text: 'Select Column 2'
208 | on_release: root.dropdown2.open(self)
209 | size_hint_y: None
210 | height: '48dp'
211 |
212 |
213 | :
214 | orientation: 'vertical'
215 |
216 |
217 | :
218 | #on_parent: self.dismiss()
219 | #on_select: btn.text = '{}'.format(args[1])
220 | """)
221 |
222 |
223 | ''' Table Code from https://stackoverflow.com/questions/44463773/kivy-recycleview-recyclegridlayout-scrollable-label-problems#comment75948118_44463773
224 | '''
225 |
226 | class HeaderCell(Button):
227 | pass
228 |
229 |
230 | class TableHeader(ScrollView):
231 | """Fixed table header that scrolls x with the data table"""
232 | header = ObjectProperty(None)
233 |
234 | def __init__(self, list_dicts=None, *args, **kwargs):
235 | super(TableHeader, self).__init__(*args, **kwargs)
236 |
237 | titles = list_dicts[0].keys()
238 |
239 | for title in titles:
240 | self.header.add_widget(HeaderCell(text=title))
241 |
242 |
243 | class ScrollCell(Label):
244 | text = StringProperty(None)
245 | is_even = BooleanProperty(None)
246 |
247 |
248 | class TableData(RecycleView):
249 | nrows = NumericProperty(None)
250 | ncols = NumericProperty(None)
251 | rgrid = ObjectProperty(None)
252 |
253 | def __init__(self, list_dicts=[], *args, **kwargs):
254 | self.nrows = len(list_dicts)
255 | self.ncols = len(list_dicts[0])
256 |
257 | super(TableData, self).__init__(*args, **kwargs)
258 |
259 | self.data = []
260 | for i, ord_dict in enumerate(list_dicts):
261 | is_even = i % 2 == 0
262 | row_vals = ord_dict.values()
263 | for text in row_vals:
264 | self.data.append({'text': text, 'is_even': is_even})
265 |
266 | def sort_data(self):
267 | #TODO: Use this to sort table, rather than clearing widget each time.
268 | pass
269 |
270 |
271 | class Table(BoxLayout):
272 |
273 | def __init__(self, list_dicts=[], *args, **kwargs):
274 |
275 | super(Table, self).__init__(*args, **kwargs)
276 | self.orientation = "vertical"
277 |
278 | self.header = TableHeader(list_dicts=list_dicts)
279 | self.table_data = TableData(list_dicts=list_dicts)
280 |
281 | self.table_data.fbind('scroll_x', self.scroll_with_header)
282 |
283 | self.add_widget(self.header)
284 | self.add_widget(self.table_data)
285 |
286 | def scroll_with_header(self, obj, value):
287 | self.header.scroll_x = value
288 |
289 |
290 | class DataframePanel(BoxLayout):
291 | """
292 | Panel providing the main data frame table view.
293 | """
294 |
295 | def populate_data(self, df):
296 | self.df_orig = df
297 | self.original_columns = self.df_orig.columns[:]
298 | self.current_columns = self.df_orig.columns[:]
299 | self._disabled = []
300 | self.sort_key = None
301 | self._reset_mask()
302 | self._generate_table()
303 |
304 | def _generate_table(self, sort_key=None, disabled=None):
305 | self.clear_widgets()
306 | df = self.get_filtered_df()
307 | data = []
308 | if disabled is not None:
309 | self._disabled = disabled
310 | keys = [x for x in df.columns[:] if x not in self._disabled]
311 | if sort_key is not None:
312 | self.sort_key = sort_key
313 | elif self.sort_key is None or self.sort_key in self._disabled:
314 | self.sort_key = keys[0]
315 | for i1 in range(len(df.iloc[:, 0])):
316 | row = OrderedDict.fromkeys(keys)
317 | for i2 in range(len(keys)):
318 | row[keys[i2]] = str(df.iloc[i1, i2])
319 | data.append(row)
320 | data = sorted(data, key=lambda k: k[self.sort_key])
321 | self.add_widget(Table(list_dicts=data))
322 |
323 | def apply_filter(self, conditions):
324 | """
325 | External interface to set a filter.
326 | """
327 | old_mask = self.mask.copy()
328 |
329 | if len(conditions) == 0:
330 | self._reset_mask()
331 |
332 | else:
333 | self._reset_mask() # set all to True for destructive conjunction
334 |
335 | no_error = True
336 | for column, condition in conditions:
337 | if condition.strip() == '':
338 | continue
339 | condition = condition.replace("_", "self.df_orig['{}']".format(column))
340 | print("Evaluating condition:", condition)
341 | try:
342 | tmp_mask = eval(condition)
343 | if isinstance(tmp_mask, pd.Series) and tmp_mask.dtype == np.bool:
344 | self.mask &= tmp_mask
345 | except Exception as e:
346 | print("Failed with:", e)
347 | no_error = False
348 |
349 | has_changed = any(old_mask != self.mask)
350 |
351 | def get_filtered_df(self):
352 | return self.df_orig.loc[self.mask, :]
353 |
354 | def _reset_mask(self):
355 | pass
356 | self.mask = pd.Series([True] *
357 | self.df_orig.shape[0],
358 | index=self.df_orig.index)
359 |
360 |
361 | class ColumnSelectionPanel(BoxLayout):
362 | """
363 | Panel for selecting and re-arranging columns.
364 | """
365 |
366 | def populate_columns(self, columns):
367 | """
368 | When DataFrame is initialized, fill the columns selection panel.
369 | """
370 | self.col_list.bind(minimum_height=self.col_list.setter('height'))
371 | for col in columns:
372 | self.col_list.add_widget(ToggleButton(text=col, state='down'))
373 |
374 | def get_disabled_columns(self):
375 | return [x.text for x in self.col_list.children if x.state != 'down']
376 |
377 |
378 | class FilterPanel(BoxLayout):
379 |
380 | def populate(self, columns):
381 | self.filter_list.bind(minimum_height=self.filter_list.setter('height'))
382 | for col in columns:
383 | self.filter_list.add_widget(FilterOption(columns))
384 |
385 | def get_filters(self):
386 | result=[]
387 | for opt_widget in self.filter_list.children:
388 | if opt_widget.is_option_set():
389 | result.append(opt_widget.get_filter())
390 | return [x.get_filter() for x in self.filter_list.children
391 | if x.is_option_set]
392 |
393 |
394 |
395 | class FilterOption(BoxLayout):
396 |
397 | def __init__(self, columns, **kwargs):
398 | super(FilterOption, self).__init__(**kwargs)
399 | self.height="30sp"
400 | self.size_hint=(0.9, None)
401 | self.spacing=10
402 | options = ["Select Column"]
403 | options.extend(columns)
404 | self.spinner = Spinner(text='Select Column',
405 | values= options,
406 | size_hint=(0.25, None),
407 | height="30sp",
408 | pos_hint={'center_x': .5, 'center_y': .5})
409 | self.txt = TextInput(multiline=False, size_hint=(0.75, None),\
410 | font_size="15sp")
411 | self.txt.bind(minimum_height=self.txt.setter('height'))
412 | self.add_widget(self.spinner)
413 | self.add_widget(self.txt)
414 |
415 | def is_option_set(self):
416 | return self.spinner.text != 'Select Column'
417 |
418 | def get_filter(self):
419 | return (self.spinner.text, self.txt.text)
420 |
421 |
422 | class ColDropDown(DropDown):
423 | pass
424 |
425 |
426 | class HistogramPlot(BoxLayout):
427 | """
428 | Panel providing a histogram plot.
429 | """
430 |
431 | def __init__(self, **kwargs):
432 | super(HistogramPlot, self).__init__(**kwargs)
433 | self.dropdown = ColDropDown()
434 | self.dropdown.bind(on_select=lambda instance, x:
435 | setattr(self.select_btn, 'text', x))
436 |
437 | def populate_options(self, options):
438 | for index, option in enumerate(options):
439 | button = Button(text=option, size_hint=(1,None), height='48dp')
440 | button.bind(on_release=lambda x, y=index, z=option:
441 | self.on_combo_box_select(y,z))
442 | self.dropdown.add_widget(button)
443 |
444 |
445 | def on_combo_box_select(self, index, text):
446 | self.dropdown.select(text)
447 | self.histogram.redraw(index)
448 |
449 |
450 | class Histogram(BoxLayout):
451 | """
452 | Histogram portion of the histogram panel.
453 | """
454 |
455 | def __init__(self, **kwargs):
456 | super(Histogram, self).__init__(**kwargs)
457 | self.figure, self.axes = plt.subplots()
458 | self.add_widget(NavigationToolbar2Kivy(self.figure.canvas).actionbar)
459 | self.add_widget(self.figure.canvas)
460 |
461 | def redraw(self, selection):
462 | column_index1 = selection
463 | df = self.parent.parent.parent.df # TODO: Do this more elegantly.
464 | if column_index1 < len(df.iloc[:]) and column_index1 >= 0 and len(df) > 0:
465 | # NOTE: The following code generates a Type error when attempting
466 | # to graph string data. The original code also generates this error,
467 | # but continues silently without alerting the user.
468 | self.axes.clear()
469 | try:
470 | self.axes.hist(np.array(df.iloc[:, column_index1].dropna().values), bins=100)
471 | except TypeError:
472 | self.warning("Invalid data type detected. Unable to generate graph.")
473 | except:
474 | self.warning("An unexpected error has occured.")
475 | finally:
476 | self.figure.canvas.draw()
477 |
478 | def warning(self, msg):
479 | layout = BoxLayout(orientation='vertical')
480 | layout.add_widget(Label(text=msg,
481 | size_hint_y=1,
482 | text_size=(250, None),
483 | halign='left',
484 | valign='middle'))
485 | button_layout = BoxLayout()
486 | close=Button(text="Close", size_hint=(0.8, 0.2))
487 | close.bind(on_release = lambda x : popup.dismiss())
488 | button_layout.add_widget(close)
489 | layout.add_widget(button_layout)
490 | popup = Popup(title='Histogram Error',
491 | content=layout,
492 | size_hint=(0.9, 0.9))
493 | popup.open()
494 |
495 | class ScatterPlot(BoxLayout):
496 | """
497 | Panel providing a histogram plot.
498 | """
499 |
500 | def __init__(self, **kwargs):
501 | super(ScatterPlot, self).__init__(**kwargs)
502 | self.dropdown1 = ColDropDown()
503 | self.dropdown2 = ColDropDown()
504 | self.dropdown1.bind(on_select=lambda instance, x:
505 | setattr(self.select_btn1, 'text', x))
506 | self.dropdown2.bind(on_select=lambda instance, x:
507 | setattr(self.select_btn2, 'text', x))
508 | self.index1=-1
509 | self.index2=-1
510 |
511 | def populate_options(self, options):
512 | for index, option in enumerate(options):
513 | button = Button(text=option, size_hint=(1,None), height='48dp')
514 | button.bind(on_release=lambda x, y=index, z=option:
515 | self.on_combo_box_select1(y,z))
516 | self.dropdown1.add_widget(button)
517 | for index, option in enumerate(options):
518 | button = Button(text=option, size_hint=(1,None), height='48dp')
519 | button.bind(on_release=lambda x, y=index, z=option:
520 | self.on_combo_box_select2(y,z))
521 | self.dropdown2.add_widget(button)
522 |
523 | def on_combo_box_select1(self, index, text):
524 | self.dropdown1.select(text)
525 | self.index1 = index
526 | if self.index1 >=0 and self.index2 >= 0:
527 | self.scatter.redraw(self.index1, self.index2)
528 |
529 | def on_combo_box_select2(self, index, text):
530 | self.dropdown2.select(text)
531 | self.index2 = index
532 | if self.index1 >=0 and self.index2 >= 0:
533 | self.scatter.redraw(self.index1, self.index2)
534 |
535 |
536 | class ScatterGraph(BoxLayout):
537 | """
538 | Histogram portion of the histogram panel.
539 | """
540 |
541 | def __init__(self, **kwargs):
542 | super(ScatterGraph, self).__init__(**kwargs)
543 | self.figure, self.axes = plt.subplots()
544 | self.add_widget(NavigationToolbar2Kivy(self.figure.canvas).actionbar)
545 | self.add_widget(self.figure.canvas)
546 |
547 | def redraw(self, selection1, selection2):
548 | column_index1 = selection1
549 | column_index2 = selection2
550 | df = self.parent.parent.parent.df # TODO: Do this more elegantly.
551 | if column_index1 < len(df.iloc[:]) and\
552 | column_index1 >= 0 and\
553 | column_index2 < len(df.iloc[:]) and\
554 | column_index2 >= 0 and len(df) > 0:
555 | # NOTE: The following code generates a Type error when attempting
556 | # to graph string data. The original code also generates this
557 | # error, but continues silently without alerting the user.
558 | self.axes.clear()
559 | try:
560 | self.axes.plot(df.iloc[:, column_index1].values,
561 | df.iloc[:, column_index2].values,
562 | 'o', clip_on=False)
563 | except TypeError:
564 | self.warning("Invalid data type detected. Unable to generate graph.")
565 | except:
566 | self.warning("An unexpected error has occured.")
567 | finally:
568 | self.figure.canvas.draw()
569 |
570 | def warning(self, msg):
571 | layout = BoxLayout(orientation='vertical')
572 | layout.add_widget(Label(text=msg,
573 | size_hint_y=1,
574 | text_size=(250, None),
575 | halign='left',
576 | valign='middle'))
577 | button_layout = BoxLayout()
578 | close=Button(text="Close", size_hint=(0.8, 0.2))
579 | close.bind(on_release = lambda x : popup.dismiss())
580 | button_layout.add_widget(close)
581 | layout.add_widget(button_layout)
582 | popup = Popup(title='Histogram Error',
583 | content=layout,
584 | size_hint=(0.9, 0.9))
585 | popup.open()
586 |
587 | class DfguiWidget(TabbedPanel):
588 |
589 | def __init__(self, df, **kwargs):
590 | super(DfguiWidget, self).__init__(**kwargs)
591 | self.df = df
592 | self.panel1.populate_data(df)
593 | self.panel2.populate_columns(df.columns[:])
594 | self.panel3.populate(df.columns[:])
595 | self.panel4.populate_options(df.columns[:])
596 | self.panel5.populate_options(df.columns[:])
597 |
598 | # This should be changed so that the table isn't rebuilt
599 | # each time settings change.
600 | def open_panel1(self):
601 | #arr = self.panel3.get_filters()
602 | #print(str(arr))
603 | self.panel1.apply_filter(self.panel3.get_filters())
604 | self.panel1._generate_table(disabled=
605 | self.panel2.get_disabled_columns())
606 |
607 |
608 |
--------------------------------------------------------------------------------
/docs/sc1.png:
--------------------------------------------------------------------------------
https://raw.githubusercontent.com/MichaelStott/PandasDataframeGUIKivy/2df89226539321f63a5c6fc13cd80120e8c99a84/docs/sc1.png
--------------------------------------------------------------------------------
/docs/sc2.png:
--------------------------------------------------------------------------------
https://raw.githubusercontent.com/MichaelStott/PandasDataframeGUIKivy/2df89226539321f63a5c6fc13cd80120e8c99a84/docs/sc2.png
--------------------------------------------------------------------------------
/docs/sc3.png:
--------------------------------------------------------------------------------
https://raw.githubusercontent.com/MichaelStott/PandasDataframeGUIKivy/2df89226539321f63a5c6fc13cd80120e8c99a84/docs/sc3.png
--------------------------------------------------------------------------------
/docs/sc4.png:
--------------------------------------------------------------------------------
https://raw.githubusercontent.com/MichaelStott/PandasDataframeGUIKivy/2df89226539321f63a5c6fc13cd80120e8c99a84/docs/sc4.png
--------------------------------------------------------------------------------
/docs/sc5.png:
--------------------------------------------------------------------------------
https://raw.githubusercontent.com/MichaelStott/PandasDataframeGUIKivy/2df89226539321f63a5c6fc13cd80120e8c99a84/docs/sc5.png
--------------------------------------------------------------------------------