6 |
--------------------------------------------------------------------------------
/SUPPORT.md:
--------------------------------------------------------------------------------
1 | # Support
2 |
3 | ## How to file issues and get help
4 |
5 | This project uses [GitHub Issues](https://github.com/MicrosoftEdge/DevTools/issues) to track questions, feedback, discussions, feature requests, or bugs.
6 | Please search the existing issues before filing a new one, this will help us avoid duplicates.
7 |
8 | If you have a new question, bug, feature idea, etc. please [create a new issue](https://github.com/MicrosoftEdge/DevTools/issues/new/choose) on the repository.
9 |
10 | ## Microsoft Support Policy
11 |
12 | Support for this **PROJECT or PRODUCT** is limited to the resources listed above.
13 |
--------------------------------------------------------------------------------
/.github/workflows/ado.yml:
--------------------------------------------------------------------------------
1 | name: Sync issue to Azure DevOps work item
2 |
3 | on:
4 | issues:
5 | types:
6 | [labeled]
7 |
8 | jobs:
9 | sync:
10 | runs-on: ubuntu-latest
11 | permissions:
12 | issues: write
13 | steps:
14 | - uses: MicrosoftEdge/action-issue-to-workitem@main
15 | env:
16 | ado_token: "${{ secrets.ADO_PERSONAL_ACCESS_TOKEN }}"
17 | github_token: "${{ secrets.GH_PERSONAL_ACCESS_TOKEN }}"
18 | with:
19 | label: 'tracked'
20 | ado_organization: 'microsoft'
21 | ado_project: 'Edge'
22 | ado_tags: 'DevToolsGitHubSync'
23 | ado_area_path: 'Edge\Web Experience\Developer Tools'
--------------------------------------------------------------------------------
/.github/workflows/score.yml:
--------------------------------------------------------------------------------
1 | name: Score issues in sync'd Azure DevOps work items
2 |
3 | on:
4 | # On issue changes and issue comments, the action will update the
5 | # corresponding issue.
6 | issue_comment:
7 | types: [created, edited, deleted]
8 | issues:
9 | types: [opened, edited, deleted, labeled, unlabeled]
10 | # But we also run once daily to update a bunch of random issues.
11 | # This way we can hopefully pick up issues that got new reactions
12 | # (reactions do not trigger issue changes).
13 | workflow_dispatch:
14 | schedule:
15 | - cron: '0 0 * * *'
16 |
17 | jobs:
18 | metrics:
19 | runs-on: ubuntu-latest
20 | steps:
21 | - uses: champnic/Porpoise@main
22 | env:
23 | GH_PAT: '${{ secrets.GH_PERSONAL_ACCESS_TOKEN }}'
24 | GH_OWNER: 'MicrosoftEdge'
25 | GH_REPO: 'DevTools'
26 | GH_TRACKED_LABELS: 'feature,tracked'
27 | ADO_PAT: '${{ secrets.ADO_PERSONAL_ACCESS_TOKEN }}'
28 | ADO_ORG: 'microsoft'
29 |
--------------------------------------------------------------------------------
/LICENSE:
--------------------------------------------------------------------------------
1 | MIT License
2 |
3 | Copyright (c) Microsoft Corporation.
4 |
5 | Permission is hereby granted, free of charge, to any person obtaining a copy
6 | of this software and associated documentation files (the "Software"), to deal
7 | in the Software without restriction, including without limitation the rights
8 | to use, copy, modify, merge, publish, distribute, sublicense, and/or sell
9 | copies of the Software, and to permit persons to whom the Software is
10 | furnished to do so, subject to the following conditions:
11 |
12 | The above copyright notice and this permission notice shall be included in all
13 | copies or substantial portions of the Software.
14 |
15 | THE SOFTWARE IS PROVIDED "AS IS", WITHOUT WARRANTY OF ANY KIND, EXPRESS OR
16 | IMPLIED, INCLUDING BUT NOT LIMITED TO THE WARRANTIES OF MERCHANTABILITY,
17 | FITNESS FOR A PARTICULAR PURPOSE AND NONINFRINGEMENT. IN NO EVENT SHALL THE
18 | AUTHORS OR COPYRIGHT HOLDERS BE LIABLE FOR ANY CLAIM, DAMAGES OR OTHER
19 | LIABILITY, WHETHER IN AN ACTION OF CONTRACT, TORT OR OTHERWISE, ARISING FROM,
20 | OUT OF OR IN CONNECTION WITH THE SOFTWARE OR THE USE OR OTHER DEALINGS IN THE
21 | SOFTWARE
22 |
--------------------------------------------------------------------------------
/README.md:
--------------------------------------------------------------------------------
1 | # Microsoft Edge DevTools
2 |
3 | **Welcome to the Microsoft Edge DevTools feedback repository.**
4 |
5 | This is a place for all users of DevTools to send ideas, feedback, suggestions, bugs, but also ask questions and have discussions about DevTools.
6 |
7 | * 📢 [Open a new issue](https://github.com/MicrosoftEdge/DevTools/issues/new/choose).
8 | * 🔎 [Search for existing issues](https://github.com/MicrosoftEdge/DevTools/issues).
9 | * 📗 [Learn how to use Microsoft Edge DevTools](https://docs.microsoft.com/microsoft-edge/devtools-guide-chromium/).
10 | * 💾 [Download Microsoft Edge](https://www.microsoft.com/edge).
11 |
12 |
13 |
14 |
15 |
16 | ## Code of conduct
17 |
18 | Note that this project has adopted the [Microsoft Open Source Code of Conduct](https://opensource.microsoft.com/codeofconduct/).
19 | For more information see the [Code of Conduct FAQ](https://opensource.microsoft.com/codeofconduct/faq/) or
20 | contact [opencode@microsoft.com](mailto:opencode@microsoft.com) with any additional questions or comments.
21 |
22 | ## Trademarks
23 |
24 | This project may contain trademarks or logos for projects, products, or services. Authorized use of Microsoft
25 | trademarks or logos is subject to and must follow
26 | [Microsoft's Trademark & Brand Guidelines](https://www.microsoft.com/legal/intellectualproperty/trademarks/usage/general).
27 | Use of Microsoft trademarks or logos in modified versions of this project must not cause confusion or imply Microsoft sponsorship.
28 | Any use of third-party trademarks or logos are subject to those third-party's policies.
29 |
--------------------------------------------------------------------------------
/explainers/README.md:
--------------------------------------------------------------------------------
1 | # Microsoft Edge DevTools Explainers
2 |
3 | This is the home of the "explainers" and related documents originating from the Microsoft Edge DevTools team.
4 |
5 | Explainers are documents focused on describing a user/ developer/ customer problem (at a high level) and exploring potential solutions to the problem. These documents are starting points for engaging in discussion with you and other members of the community. Explainers should address their stated problems in clear and easy to understand language. Proposed solutions should be easy to follow and not too deep in technical details. When you read an explainer, we hope the stated problem is compelling and you can form an opinion for whether the proposed solution would address the problem.
6 |
7 | Currently, the following explainers are available to read and provide feedback:
8 |
9 |
{%- for file in site.static_files -%}
10 | {% if file.path contains 'explainer.md' %}
11 | {% assign items = file.path | split: "/" %}
12 |
15 |
16 | ## Providing feedback
17 |
18 | We are looking for feedback! Are the stated problems relevant to you? How have they impacted your experience? Do the proposed solutions seem reasonable? Would they solve a problem you currently have? (We love to hear that; tell us more about your scenario!) Do you have related use-cases we hadn't considered?
19 |
20 | We appreciate you taking the time to offer feedback; it helps to improve the explainers, and validate the problem and solutions they describe.
21 |
22 | **[Start a new issue here](https://github.com/MicrosoftEdge/DevTools/issues/new/choose)**, or [join in the discussion](https://github.com/MicrosoftEdge/DevTools/issues) on existing issues. We also welcome PRs on the explainer documents themselves.
--------------------------------------------------------------------------------
/explainers/explainer-template.md:
--------------------------------------------------------------------------------
1 | # DevTools: Feature name here
2 |
3 | Authors:
4 | - *[Author name](link to GitHub user name)*, Microsoft Edge
5 | - *[Author name](link to GitHub user name)*, Microsoft Edge
6 |
7 | ## Status of this feature
8 | *Select one of the statements below that applies and delete the others.*
9 |
10 | This is a proposal for a new feature that is not yet in development.
11 |
12 | This feature is in active development. See [Changelog section](#changelog) for details.
13 |
14 | This feature is available as of Microsoft Edge *version.number.here.* This explainer is no longer active and is provided for reference only.
15 |
16 | This explainer is no longer active and is provided for reference only.
17 |
18 | ## Proposal
19 | *If feature proposal is brief (a paragraph or two), you can put it here and delete sub-sections below. Mockup images are recommended. If feature proposal is longer, you can summarize here but shift explanation to sub-sections*
20 |
21 | ### Introduction *(Optional: Delete section if not needed)*
22 | *For more complex proposals, describe the user problem to be solved or otherwise set the scene.*
23 |
24 | ### Goals *(Optional: Delete section if not needed)*
25 | *Pivot from problem space to solutions by listing goals of a feature.*
26 |
27 | ### Usage *(Optional: Delete section if not needed)*
28 | *Include step-by-step of how user would use the feature with mockups if available. If comparing multiple options, create subsections for each option.*
29 |
30 | ## Feedback
31 | Have feedback? We want to hear it! *[Issue #123](link to issue announcing explainer, which will need to be added after first commit)* tracks community feedback on this explainer.
32 |
33 | ## Changelog *(Optional: Delete section if feature has not shipped)*
34 |
35 | | Edge release | Changelog |
36 | |--------------|---------------------------------------------------------|
37 | | *version.number* | *Description of changes.* |
38 |
39 | *(Optional: you can include YouTube videos by ID with the following syntax)*
40 |
41 | {% include youtube.html id="JLMbpiywVxQ" %}
--------------------------------------------------------------------------------
/explainers/JSONViewer/explainer.md:
--------------------------------------------------------------------------------
1 | # DevTools: In-browser JSON viewer
2 |
3 | Authors:
4 | - *[Chris Heilmann](https://twitter.com/codepo8)*, PM, Microsoft Edge
5 |
6 | ## Status of this feature
7 |
8 | This is a proposal for a new feature that is not yet in development.
9 |
10 | ## Proposal
11 |
12 | Currently when you navigate to a JSON file in Microsoft Edge, you get a basic text display of the document.
13 |
14 | 
15 |
16 | When navigating to an HTML document, and selecting "view source" you get a colour-coded display with line numbers instead.
17 |
18 | 
19 |
20 | We propose to replace that basic JSON view with a colour-coded, collapsible and expandable one.
21 |
22 | 
23 |
24 | We are currently investigating the overall browser performance impact of this, which is why the first implementation is what is shown in the screencast above.
25 |
26 | ### Goals
27 |
28 | As JSON files are data structures and users want to drill down into the data and analyse it in detail. This is a first step in this direction. In subsequent iterations we want to add more functionality like displaying header data and a raw view, saving and copying data and filtering the information.
29 |
30 | ### Usage
31 |
32 | This functionality will trigger automatically when the browser navigates to a JSON file on the web or the user opens a local one. Once we add more features you will also be able to interact with the JSON data in more detail.
33 |
34 | ### Feature release plan
35 |
36 | **Current:** JSON is being displayed as a collapsible tree with line numbers and colour coding in dark and light themes
37 |
38 | Upcoming features in delivery order:
39 |
40 | * Get a "slow" warning when the JSON is too big to render and an option to show it as plain text instead
41 | * Get an "invalid" warning when the JSON payload is invalid
42 | * Switch between the expandable tree view and the raw text view
43 | * Copy the JSON payload with a button
44 | * Download the JSON payload with a button
45 | * Search/filter the JSON
46 | * Expand and collapse all the nodes in the document
47 | * Choose to display JSON in table format for array data that can be sorted/filtered
48 | * Large JSON payloads will load the first 500K and then offer to stream the rest
49 | * Choose to inherit themes from DevTools
50 | * Set Raw or Tree display as a default
51 | * Open JSON in Network Console
52 |
53 | ## Feedback
54 |
55 | Have feedback? We want to hear it! *[Issue #87](https://github.com/MicrosoftEdge/DevTools/issues/87)* tracks community feedback on this explainer.
56 |
--------------------------------------------------------------------------------
/explainers/LandmarksVisualisation/explainer.md:
--------------------------------------------------------------------------------
1 | # DevTools: Landmarks tree view with page overlays
2 |
3 | Authors:
4 | - *[Chris Heilmann](https://github.com/codepo8)*, Microsoft Edge, Program Manager
5 |
6 | Landmarks are an important accessibility feature of any web product as they allow users of assistive technology to navigate them quickly without a lot less noise and interaction. Currently there is no way to see in a visual manner what part of the document constitutes a landmark.
7 |
8 | ## Status of this feature
9 |
10 | This is a proposal for a new feature that is not yet in development.
11 |
12 | ## Proposal
13 |
14 | Currently the only way to verify the existence of landmarks is via manual testing or by checking the [Accessibility tree](https://learn.microsoft.com/microsoft-edge/devtools-guide-chromium/accessibility/accessibility-tab).
15 |
16 | 
17 |
18 | There is also an experimental, full accessibility tree view in the Elements tool.
19 |
20 | 
21 |
22 | Both these tools do not offer a visual overlay showing the user what part of the document is the landmark. You also need to know what constitutes a landmark.
23 |
24 | Therefore having a landmark tree with page overlays would be useful for spot checking accessibility. There are already Developer Tools extensions like the [Landmarks browser extension](http://matatk.agrip.org.uk/landmarks/) that offers this functionality. You can see the extension in action [watching this video](https://user-images.githubusercontent.com/13508/168231108-6c39335a-eb19-4e9f-be04-5fb35ea208ff.mp4) or in the following screenshot.
25 |
26 | 
27 |
28 | Currently the Accessibility tool already features a [Source Order Viewer](https://docs.microsoft.com/microsoft-edge/devtools-guide-chromium/accessibility/test-tab-key-source-order-viewer), that applies overlays to the document.
29 |
30 | 
31 |
32 | This proposal is to offer an own landmarks tree with similar overlays in the Accessibility tool and show overlays in the current document in the Accessibility tree. Furthermore, the full accessibility tree display should highlight landmarks in a more obvious manner.
33 |
34 | ### Goals
35 |
36 | 1. Give web content authors a simple way to verify that their landmarks syntax is correct.
37 | 1. Allow testers to verify the existence of landmarks in a web product in a fast and visual way.
38 |
39 | ## Feedback
40 | Have feedback? We want to hear it! *[Issue #56](https://github.com/MicrosoftEdge/DevTools/issues/56)* tracks community feedback on this explainer.
--------------------------------------------------------------------------------
/SECURITY.md:
--------------------------------------------------------------------------------
1 |
2 |
3 | ## Security
4 |
5 | Microsoft takes the security of our software products and services seriously, which includes all source code repositories managed through our GitHub organizations, which include [Microsoft](https://github.com/Microsoft), [Azure](https://github.com/Azure), [DotNet](https://github.com/dotnet), [AspNet](https://github.com/aspnet), [Xamarin](https://github.com/xamarin), and [our GitHub organizations](https://opensource.microsoft.com/).
6 |
7 | If you believe you have found a security vulnerability in any Microsoft-owned repository that meets [Microsoft's definition of a security vulnerability](https://learn.microsoft.com/previous-versions/tn-archive/cc751383(v=technet.10)), please report it to us as described below.
8 |
9 | ## Reporting Security Issues
10 |
11 | **Please do not report security vulnerabilities through public GitHub issues.**
12 |
13 | Instead, please report them to the Microsoft Security Response Center (MSRC) at [https://msrc.microsoft.com/create-report](https://msrc.microsoft.com/create-report).
14 |
15 | If you prefer to submit without logging in, send email to [secure@microsoft.com](mailto:secure@microsoft.com). If possible, encrypt your message with our PGP key; please download it from the [Microsoft Security Response Center PGP Key page](https://www.microsoft.com/msrc/pgp-key-msrc).
16 |
17 | You should receive a response within 24 hours. If for some reason you do not, please follow up via email to ensure we received your original message. Additional information can be found at [microsoft.com/msrc](https://www.microsoft.com/msrc).
18 |
19 | Please include the requested information listed below (as much as you can provide) to help us better understand the nature and scope of the possible issue:
20 |
21 | * Type of issue (e.g. buffer overflow, SQL injection, cross-site scripting, etc.)
22 | * Full paths of source file(s) related to the manifestation of the issue
23 | * The location of the affected source code (tag/branch/commit or direct URL)
24 | * Any special configuration required to reproduce the issue
25 | * Step-by-step instructions to reproduce the issue
26 | * Proof-of-concept or exploit code (if possible)
27 | * Impact of the issue, including how an attacker might exploit the issue
28 |
29 | This information will help us triage your report more quickly.
30 |
31 | If you are reporting for a bug bounty, more complete reports can contribute to a higher bounty award. Please visit our [Microsoft Bug Bounty Program](https://microsoft.com/msrc/bounty) page for more details about our active programs.
32 |
33 | ## Preferred Languages
34 |
35 | We prefer all communications to be in English.
36 |
37 | ## Policy
38 |
39 | Microsoft follows the principle of [Coordinated Vulnerability Disclosure](https://www.microsoft.com/msrc/cvd).
40 |
41 |
--------------------------------------------------------------------------------
/explainers/SearchConsole/explainer.md:
--------------------------------------------------------------------------------
1 | # Search the Console for Errors
2 |
3 | Authors: [Erica Draud](https://github.com/erdraud)
4 |
5 | ## Status of this Document
6 | * This document status: **Active**
7 | * **Current version: this document**
8 |
9 | ## Introduction
10 |
11 | One of the most common problems users that are new to the Developer Tools face is understanding Console messages. "Why are there errors and what does /error message/ mean?" We'd like to make it easier for users to answer these questions. We are experimenting on the error message workflow. We will start by adding a function to search for the Console error or warning directly from its banner. Further experimentation will be based on the response from the first experiment.
12 |
13 | ## Goals
14 |
15 | 1. To reduce context switching in Edge DevTools,
16 | 2. To make the Console less intimidating to inexperienced users, and
17 | 3. To learn more about the greatest pain points that our new developers face.
18 |
19 | ## Non-Goals
20 |
21 | * Integrate search experience throughought the Developer Tools
22 |
23 | ## Use Cases
24 |
25 | A new developer is using the DevTools Console, one of the most used tools we have. They see an error message they don’t understand. What’s their first instinct? Look it up. We’re going to make this experience easier and easier for them.
26 |
27 | A new developer clicks on the links in the error or warning message, which links them to tools they find even more confusing. They can instead turn to the familiar information icon for help.
28 |
29 | ## Proposed Solution
30 |
31 | We will add a search icon to the end of the error message, which will open a new tab with their default search browser with results for that error.
32 |
33 | 
34 |
35 | We will track the amount of usage for this feature. If it's less than 1%, we will try to address whether it's discovery or usability that is the problem. We'll track which error message types are most requested.
36 |
37 | Based on the number of searches and what error messages are most searched for, we will experiment with integrating documentation directly into the Developer Tools. Users will have a way to expand the error message or open a “documentation pane” within the DevTools to learn about the most popularly requested error messages without switching context.
38 |
39 |
40 | ## Alternative Solutions
41 |
42 | We were previously considering adding the search option to the context menu that appears when the user right-clicks an error message. This experience is similar to what a user would experience if they highlighted text in the error message and right-clicked their selection. The existing context menu search experience closely models that of the browser, where you can also highlight text, right-click your selection, and access a search tool. This shows that context menus might not be the expected location for such a feature for new developers.
43 | 
44 |
--------------------------------------------------------------------------------
/explainers/MediaExplorer/explainer.md:
--------------------------------------------------------------------------------
1 | # DevTools: Media Explorer
2 |
3 | Authors:
4 | - *[Chris Heilmann](https://github.com/codepo8)*, PM, Microsoft Edge
5 |
6 | ## Status of this feature
7 |
8 | This is a proposal for a new feature that is not yet in development.
9 |
10 | ## Proposal
11 |
12 | A common use case of the web is to download images and videos displayed in web products, either to consume offline or to re-use and share. Often this media is hard to get as web products don't make it easy to access it or only show a low quality preview and link to the full version. The media explorer tool would cut to the chase and display all the images and video sources in the current document as an easy to navigate, preview and download interface.
13 |
14 | ### Introduction
15 |
16 | There are numerous browser extensions and software packages that allow you to do grab and download media from web pages. Many come with a subscription and as this is a common demand there is also a fair share of malware in this area. As the media of any web site is already downloaded to the user's browser cache and DevTools can analyse the product's source for links to media this feature would make extensions like these obsolete and offer a safer option for users.
17 |
18 | All the functionality of the media explorer is available using existing tools in DevTools, but it needs developer skills to use them.
19 |
20 | * The Network Tool allows you to access and download media in the current document.
21 | * The Elements and Console tool to analyse the structure of a document and get a list of all the media in the current document and links to more.
22 |
23 | The media explorer tool makes this easier for users not familiar with the Network tool or how web sites are structured.
24 |
25 | ### Goals
26 |
27 | The media explorer helps users to:
28 |
29 | * Find, explore and download media in the current web site
30 | * Get access to the full size media on web sites with preview images
31 | * Consume videos in a native browser interface instead of players with annoying overlays and interstitials
32 | * Users on slower and flaky connections to try to download media instead of getting a buffering or time out experience
33 |
34 | ### Usage
35 |
36 | When opening DevTools on a document, the user can switch to the media explorer to see links to all the videos and images in the current document.
37 |
38 | 
39 |
40 | Clicking any of these will open a preview of the media with information about size and availability.
41 |
42 | 
43 |
44 | Users can download individual files or select more than one and get a zip file of all of them.
45 |
46 | Alternatively, the Media Explorer could also be used as part of the side bar experience without any need to open developer tools.
47 |
48 | 
49 |
50 | ## Feedback
51 |
52 | Have feedback? We want to hear it! *[Issue #107](https://github.com/MicrosoftEdge/DevTools/issues/103)* tracks community feedback on this explainer.
53 |
--------------------------------------------------------------------------------
/explainers/3DView/explainer.md:
--------------------------------------------------------------------------------
1 | # Update 3D View
2 |
3 | Authors: [Erica Draud](https://github.com/erdraud)
4 |
5 | ## Status of this Document
6 | * This document status: **Active**
7 | * **Current version: this document**
8 |
9 | ## Introduction
10 | We released [3D View](https://learn.microsoft.com/microsoft-edge/devtools-guide-chromium/3d-view/) as a comprehensive tool for debugging your web application in the 3D space. This document will cover enhancements and adjustments we're making based on feedback.
11 |
12 | ## Goals
13 | * Make the UI in the DOM and Z-index tabs consistent by updating the strings and their organization
14 | * Create a toolbar with the canvas and camera controls integrated
15 | * Adjust canvas controls for more intuitive use
16 | * Persistent settings after snapshot is taken
17 | * Remove the experiment since 3D View has already rolled out
18 | * Remove Layers pane, as it is now Composited Layers pane in 3D View
19 |
20 | ## Use Cases
21 | * A developer using both the DOM and Z-index tabs is confused about the difference between a `Heatmap` color and one without the `Heatmap` identifier. They waste time playing with the colors until they realize there is no difference.
22 | * A developer is debugging their application. They're used to the Layers pane and have started using 3D View, not realizing that they can just stay in the 3D View for the same experience without switching context.
23 | * A developer believes the left side of the mouse should be used for panning. The DOM rotates instead of panning. They do not realize that the functionality they need exists, so they give up and close out of 3D View.
24 |
25 | ## Proposed Solution
26 |
27 | ### 3D View UI
28 | We will be updating the DOM tab's UI to match that of the Z-index tab's for greater consistency. We will flip the `Show all elements` and `Isolate selected element` sections to match the order of the Z-index tab. We will also remove the `Heatmap` identifier for the color types in the DOM tab.
29 |
30 | The icons in the 3D canvas need to be updated to align with the DevTools UI. 3D View is getting even more discovery with the **+** button in DevTools, so it is particularly important that the UI is up to par. We are currently working with the design team to get the assets needed for this.
31 |
32 | A toolbar will be added at the top of the tool, which will be consistent between 3D View's different tabs, so that users can access and understand the functions of the canvas and camera better. The panning and rotate buttons in the toolbar will be highlighted when in use and can be selected directly with panning being the default option. Users will still be able to access these tools with the mouse and keyboard as usual.
33 |
34 | The zoom slider will swap directions, since users currently view it as being fully zoomed in. It will be updated to mimic the zoom sliders of common applications such as maps. The proposed changes are shown below:
35 |
36 | 
37 |
38 | 
39 |
40 | ### Persistent settings
41 | Users want 3D View pane settings to persist when taking a new snapshot. In the DevTools, taking a new snapshot is a way to refresh the canvas view. The settings currently refresh with the canvas, but users would like them to stay the same, leaving only the DOM to adjust. This would help make the 3D View feel more personalized to the user.
42 |
--------------------------------------------------------------------------------
/explainers/InBrowserEmulation/explainer.md:
--------------------------------------------------------------------------------
1 | # DevTools: In-browser responsive design and emulation tools
2 |
3 | Authors:
4 | - *[Chris Heilmann](https://github.com/codepo8)*, Microsoft Edge, PM
5 |
6 | ## Status of this feature
7 |
8 | This is a proposal for a new feature that is not yet in development.
9 |
10 | ## Proposal
11 |
12 | Responsive design tooling and device emulation should be available in main browser window without the DevTools being open.
13 |
14 | ### Introduction
15 |
16 | The current implementation of [device emulation and responsive design tooling](https://docs.microsoft.com/microsoft-edge/devtools-guide-chromium/device-mode/) requires DevTools to be open. This means that single screen users will have not much space in the browser to emulate high resolution devices without having to zoom out.
17 |
18 | 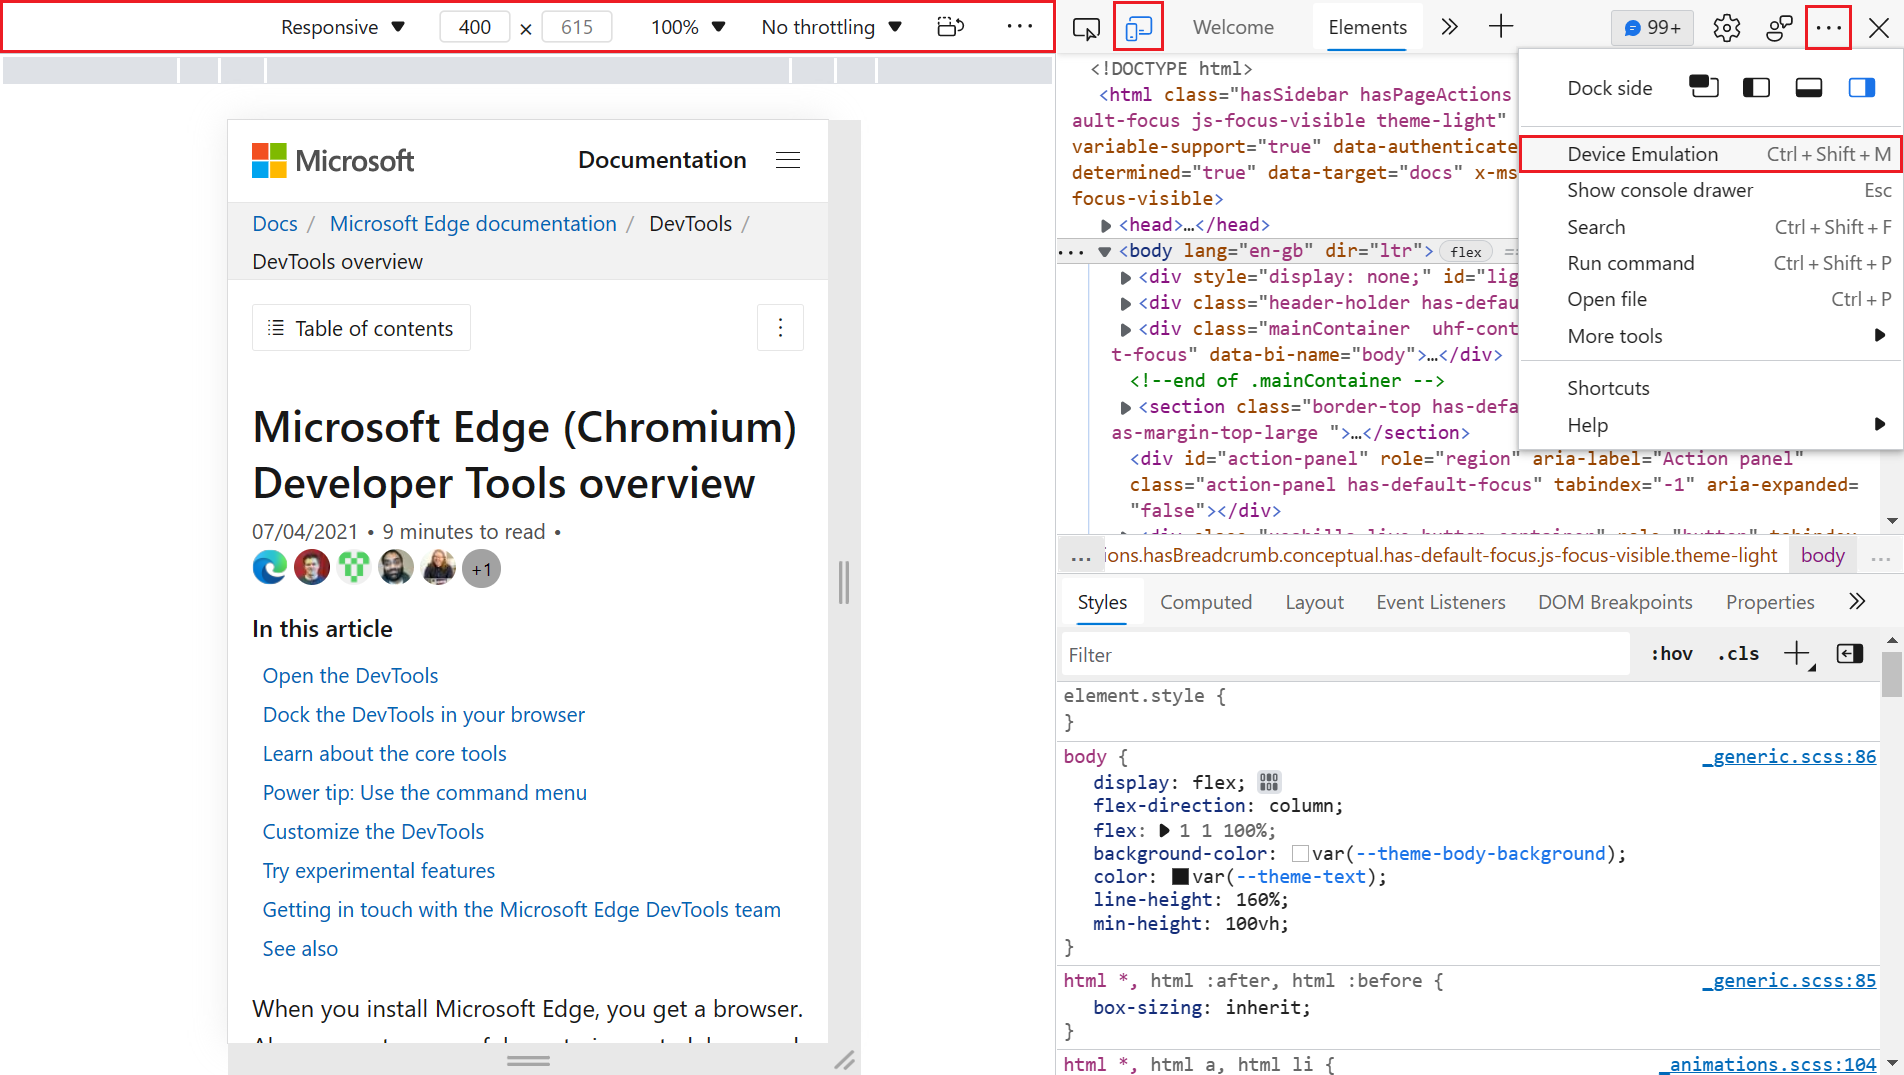
19 |
20 | Multi screen users can dock the developer tools to another screen, but will have a disconnect between using the elements picker and seeing the result on a different screen.
21 |
22 | The original tooling idea was to see an emulated device or resize the viewport and use the tools to debug and edit the product. This assumes that every user of this functionality will be a developer who works on the project. There is, however, a much larger group of designers, testers and power users who would benefit from being able to spot check products in different resolutions and emulated devices without having DevTools open as they are just wasted screen estate for them.
23 |
24 | ### Goals
25 |
26 | Enable all users to
27 |
28 | * see the current web product in different resolutions
29 | * see the product in various emulated devices
30 | * see the product in different media states (dark mode, light mode, high contrast)
31 | * see the product in various emulated vision states (colour deficiency, blurred)
32 |
33 | ### Existing implementations
34 |
35 | The [Microsoft Edge Extension for Visual Studio Code](https://aka.ms/devtools-for-code) currently features [a screencast with an own toolbar](https://docs.microsoft.com/microsoft-edge/visual-studio-code/microsoft-edge-devtools-extension#device-and-state-emulation) that offers similar functionality.
36 |
37 | 
38 |
39 | 
40 |
41 | 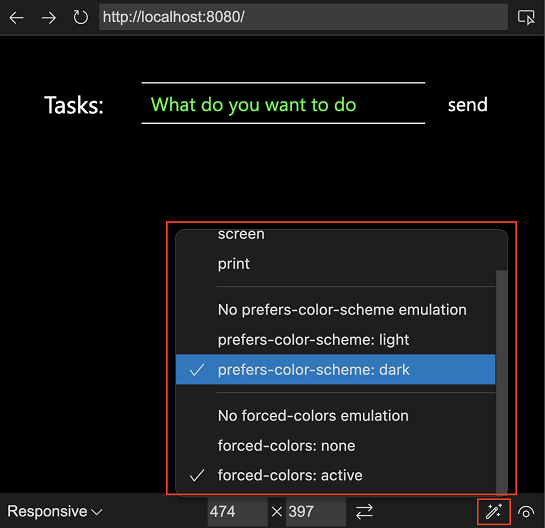
42 |
43 | Firefox also has an emulation bar that is available independent of Developer tools being open.
44 |
45 | 
46 |
47 | ## Discussion points
48 |
49 | The main question to answer now is one of discovery. How would users not familiar or interested in Developer Tools be able to find this functionality?
50 |
51 | ## Feedback
52 | Have feedback? We want to hear it! *[Issue #83](https://github.com/MicrosoftEdge/DevTools/issues/83)* tracks community feedback on this explainer.
--------------------------------------------------------------------------------
/explainers/webhint/explainer.md:
--------------------------------------------------------------------------------
1 | # DevTools: webhint integration in Issues
2 |
3 | Authors:
4 | - [Rachel Simone Weil](https://github.com/hxlnt), Program Manager
5 | - [Tony Ross](https://github.com/antross), Senior Software Engineer
6 | - [David Garcia Gomez](https://github.com/sarvaje), Software Engineer
7 | - [John Emau](https://github.com/johnemau), Software Engineer
8 | - Josephine Le, Designer
9 |
10 | ## Status of this feature
11 | This feature is experimental and in active development. See [Changelog section](#changelog) for details on progressive feature implementation starting with Edge 85.
12 |
13 | ## Introduction
14 | The [2019 MDN Web Developer Needs Assessment report](https://mdn-web-dna.s3-us-west-2.amazonaws.com/MDN-Web-DNA-Report-2019.pdf) illuminates a number of pain points that web developers face in their work. The report outlines challenges in implementing and testing cross-browser compatibility, security, performance, and accessibility. Web developers also note the difficulty of keeping up with documentation and the latest best practices.
15 |
16 | There are numerous tools that audit websites for problems in compatibility, security, etc. However, keeping up with these solutions, learning how to use and configure them, and integrating them into a web development workflow can require a great deal of time and effort. Additionally, these tools provide audits or reports that are generally run *after* a site is built—in a CI/CD pipeline, for example—when changes are more challenging or costly to make.
17 |
18 | To address these pain points, the Edge DevTools now offer *proactive* feedback on accessibility, cross-browser compatibility, performance, security, PWAs, and more that can be used in real-time during development and debugging. We achieve this through the inclusion of [webhint](https://webhint.io), a fully open-source best practices engine that uses industry-leading APIs from MDN, Deque University, and more.
19 |
20 | ## Goals
21 | Our goal in including webhint in DevTools is to help developers rapidly address known pain points around accessibility, cross-browser testing, etc. *during* development, rather than after. webhint is both open-source and highly customizable, meaning it reflects the best practices of web developers rather than browser vendors. Specifically, the recommendations that appear in the **Issues** tool in DevTools are:
22 |
23 | - **specific,** down to the line of code or HTTP request in question,
24 | - **trustworthy,** linking to relevant documentation when more context is needed,
25 | - **just in time,** conveniently updated in real-time like a code linter,
26 | - **customizable,** catering the feedback you see to your project's needs, and
27 | - **actionable,** with concrete recommendations on how to fix the issue.
28 |
29 | 
30 |
31 | ## Usage
32 |
33 | ### View feedback in **Issues**
34 |
35 | **Issues** can be opened in DevTools by selecting the blue dialog box in the top-right corner of DevTools. Alternatively, it can be opened by opening the ... menu and choosing More tools > Issues.
36 |
37 | Feedback is sorted into categories based on the type of feedback. Click a category to expanded or collapse it. Each recommendation includes documentation, affected code snippet (where applicable), a severity label (e.g., Warning, Error, Info), and links to other relevant information in the **Elements,** **Network,** or **Sources** tools.
38 |
39 |
40 | ### Preview issues in **Elements**
41 |
42 | With the Show issues in Elements experiment selected, wavy underlines will appear in the Elements pane to indicate code for which there is a warning or recommendation. These underlines match those you might see in web IDEs such as [VS Code](https://code.visualstudio.com).
43 |
44 | 
45 |
46 | To see the issue details, Shift + click on the underlined item. Or, use the context menu and select View issues.
47 |
48 | ### Roadmap for new features
49 |
50 | Additional features we are considering for upcoming releases include
51 |
52 | - more sort and filter capabilities, and
53 | - localization of feedback to match the language of your DevTools
54 |
55 | The team welcomes your feedback on this feature; please [file an issue](https://github.com/MicrosoftEdge/MSEdgeExplainers/issues/new?labels=DevTools&template=devtools.md&title=%5BDevTools%5D+%3CTITLE+HERE%3E) to share your thoughts.
56 |
57 | ## Changelog
58 |
59 | | Edge release | Changelog |
60 | |--------------|---------------------------------------------------------|
61 | | 85 | Initial integration of webhint feedback into Issues as an experimental feature. |
62 | | 88 | Added code snippets, documentation links, and links to other tools in DevTools. |
63 | | 91 | Added severity icons and underlines in Elements. |
64 |
--------------------------------------------------------------------------------
/explainers/StyleTracing/explainer.md:
--------------------------------------------------------------------------------
1 | # DevTools: Selector Performance Tracing for Style Calculations
2 |
3 | Authors:
4 |
5 | * *[Brandon Walderman](https://github.com/bwalderman)*, Senior Software Engineer, Microsoft Edge.
6 |
7 | ## Feedback
8 |
9 | Have feedback about this explainer? We want to hear it!
10 |
11 | **[Issue #98](https://github.com/MicrosoftEdge/DevTools/issues/98)** tracks community feedback on this explainer.
12 |
13 | ## Status of this feature
14 |
15 | This is a proposal for a new feature that is not yet in development.
16 |
17 | ## Introduction
18 |
19 | Style recalculation (or style recalc) is the process of iterating through DOM elements on a page, finding all of the CSS style rules that match a given element and then computing the element's actual style based on these rules.
20 | Style recalc needs to happen whenever the applicability of CSS rules may have changed. Some examples include:
21 |
22 | * Elements were inserted or removed from the DOM
23 | * An element's attributes (e.g. class, id) were changed
24 | * User input such as mouse move or focus change, which can affect `:hover` rules
25 |
26 | Style recalc can be an expensive operation and long-running recalc operations can become performance bottlenecks that web developers need to debug.
27 |
28 | The DevTools performance panel records a "Recalculate Style" trace event that shows when style recalculation occurs.
29 |
30 | 
31 |
32 | The event currently shows the elapsed time and total number of elements affected, but no information about which elements these are, or which style rules were involved.
33 | Although the JavaScript location that triggered the style recalc is sometimes included in the trace event, it may not always be obvious how the initiator is related to the affected elements, especially when there are a large number of them.
34 | Overall, this can make it difficult for web developers to understand how to fix long-running style recalc tasks with the information at hand.
35 |
36 | We'd like to offer web developers greater visibility into how time is being spent during style recalc to make it easier to root cause and mitigate performance issues due to recalc.
37 |
38 | ## Existing Solutions
39 |
40 | Developers can already see extra statistics from style recalc in the `edge://tracing` UI if the `"blink.debug"` tracing tag is enabled.
41 | The statistics show up as a `SelectorStats` trace event which includes a table of style rules with the following columns:
42 |
43 | * Elapsed CPU time spent evaluating the style rule (lower is better).
44 | * Number of "fast reject" elements that were cheap/efficient to eliminate from matching (higher portion of attempts is better).
45 | * Number of elements the Blink rendering engine attempted to match with the rule.
46 | * Number of elements that were actually matched.
47 | * CSS selector text.
48 |
49 | 
50 |
51 | This information can be valuable to web developers, but the `edge://tracing` UI can be daunting, especially for beginners, and the `"blink.debug"` tag needs to be enabled first.
52 |
53 | ## Proposed Solution
54 |
55 | The proposed solution is to display these same statistics in the details view for "Recalculate Style" events in DevTools performance traces, where it will be more visible to web developers who are already familiar with the DevTools Performance tool.
56 |
57 | Developers will be able to sort the table by any column, so that they can identify individual rules that take a longer time to process or have a high number of match attempts.
58 | If available, the CSS selector text will be enhanced with a link to the source location where the CSS rule is declared. This will let web developers quickly jump to the rule they are interested in so they can continue their investigation.
59 |
60 | Below is a mockup of the proposed design, with the new content highlighted in red. Note that links to source locations are not currently shown in this mockup but would be rendered similar to other source links found in DevTools.
61 |
62 | 
63 |
64 | ## Usage
65 |
66 | Selector statistics in DevTools performance traces will be disabled by default because the underlying `SelectorStats` trace event is expensive to record and can have a noticeable impact on page perf.
67 | While enabling this feature would impact raw timings captured throughout the trace, the timings would still be proportional to each other and can still yield useful information to developers.
68 | Developers will need to explicitly enable the feature through a checkbox in the performance panel settings.
69 |
70 | The DevTools performance panel already has a similar optional feature named "advanced paint instrumentation".
71 | The checkbox to enable the feature includes a warning about the performance overhead, both in the label and in the tooltip.
72 | The settings icon color is also changed to red to remind the user, even while the settings are hidden.
73 |
74 | 
75 |
76 | Instead of adding another checkbox to the settings view, we should consider merging the selector statistics and advanced paint instrumentation into a single checkbox named "enable advanced rendering instrumentation (slow)".
77 | This avoids the need for another checkbox in the settings view and allows us to re-use the existing UI for warning about the performance impact.
78 |
79 | When the checkbox is enabled, a table of selector statistics will be available in the details view for any "Recalculate Styles" events.
80 |
81 | ## Future Work
82 |
83 | We should provide web developers with resources to understand how to use this new tool effectively. Some patterns in the data worth exploring:
84 |
85 | * Expensive unused selectors.
86 | * Expensive broadly scoped selectors.
87 | * Underutilized selectors (low match count / match attempts).
88 |
89 | ## References
90 |
91 | * Blog post: [Reduce the scope and complexity of style calculations](https://web.dev/reduce-the-scope-and-complexity-of-style-calculations)
92 | * Chromium commit: [Collect statistics on selector matching during style recalc](https://chromium-review.googlesource.com/c/chromium/src/+/3582806)
93 |
--------------------------------------------------------------------------------
/explainers/FocusMode/explainer.md:
--------------------------------------------------------------------------------
1 | # DevTools: Focus Mode UI
2 |
3 | Authors:
4 | - [Rachel Simone Weil](https://github.com/hxlnt), Program Manager
5 | - [Jose Leal Chapa](https://github.com/joselea), Senior Software Engineer
6 | - [Patrick Brosset](https://github.com/captainbrosset), Senior Software Engineer
7 | - [Chait Pinnamaneni](https://github.com/noobtiger), Software Engineer
8 | - Ebou Jobe, Software Engineer
9 | - Josephine Le, Designer
10 |
11 | ## Status of this feature
12 | This feature is experimental and in active development. See [Changelog section](#changelog) for details on progressive feature implementation starting with Edge 90.0.810.0.
13 |
14 | The team welcomes your feedback on this feature; please [file an issue](https://github.com/MicrosoftEdge/MSEdgeExplainers/issues/new?labels=DevTools&template=devtools.md&title=%5BDevTools%5D+%3CTITLE+HERE%3E) to share your thoughts.
15 |
16 | ## Introduction
17 | Over the years, the Chromium DevTools have grown to include a large array of specialized tools—about 30 at time of writing—to help web developers troubleshoot web applications. Some, like **Elements** and **Console**, may be used daily, while others, like **Sensors** and **Performance monitor,** may have more specialized but infrequent use.
18 |
19 | DevTools users tell us that a side effect of having numerous tools is that the overall experience can be visually and conceptually overwhelming. New web developers may not have a clear idea of where to start and how to explore and use the DevTools. More experienced developers may find themselves in one or two familiar workflows that want to focus in on.
20 |
21 | To address these diverse needs, we're experimenting with new features that make it easier to learn and use the Edge DevTools, such as
22 | - A redesign of **What's New** (now called **Welcome**) that highlights documentation, resources, and new features in a user-friendly format,
23 | - New ways to customize tab layout, and
24 | - A tooltip help feature to help you learn what different parts of DevTools do.
25 |
26 | This document describes a fourth new feature to address the complexity of DevTools: Focus Mode. Focus Mode is an alternative, minimal UI option that lives alongside the "classic" Chromium DevTools UI. This interface will offer all the same functionality but with a cleaner, customizable interface, helping you put in focus your most important debugging tasks without extra clutter or distractions.
27 |
28 | 
29 |
30 | ## Goals
31 | 1. To lower the learning curve for new users of Edge DevTools,
32 | 2. To reduce the complexity of the Edge DevTools without compromising its feature set, and
33 | 3. To allow users to use predefined or custom layouts suited to certain debugging tasks and personal preference.
34 |
35 | Those of us creating this new interface acknowledge the responsibility that comes with changes of this magnitude. For this reason, we're limiting these new features to early adopters who wish to opt-in to trying them. The new UI can be turned on and off, so no commitment is required.
36 |
37 | We're also approaching the development of these features iteratively, gaining feedback, tweaking features, and learning as we go. (After all, our team is made up of web developers, too!) We expect the first few releases to be a little rough around the edges, but we think it's valuable to work out in the open to ensure these changes are ones that Edge DevTools users will love. Your feedback (via an [issue on this repo](https://github.com/MicrosoftEdge/MSEdgeExplainers/issues/new?labels=DevTools&template=devtools.md&title=%5BDevTools%5D+%3CTITLE+HERE%3E) or on [Twitter](https://twitter.com/EdgeDevTools)) is valued, especially in these early stages.
38 |
39 | ## Usage
40 |
41 | ### Switch to Focus Mode
42 | To try Focus Mode in Microsoft Edge 90.0.810.0 and later, open the Settings pane, then choose the Experiments section on the left side. Select the checkboxes next to "Focus Mode and DevTools Tooltips" and "Enable + button tab menus to open more tools," then restart DevTools. The Focus Mode experiment also enables DevTools Tooltips.
43 |
44 | To return to the default DevTools UI, repeat the process above, unchecking the checkboxes.
45 |
46 | Note that the "Enable + button tab menus to open more tools" experiment is an independent feature; however, we recommend turning this feature on when using Focus Mode for the best experience.
47 |
48 | ### Use DevTools in Focus Mode
49 |
50 | With this experiment selected, an activity bar will appear along the left side of DevTools. In top-to-bottom order, the menu contains shortcuts to the following:
51 |
52 | | | Menu shortcuts |
53 | |--------------|---------------------------------------------------------|
54 | |  |
Inspect tool
Device mode: Emulate alternative devices and responsive design changes.
Home: A collection of your favorite tools. By default, this will be populated with the tools you last had open.
Layout: A collection of front-end tools ideal for troubleshooting layouts, CSS, etc.
Testing: A collection of tools useful for debugging testing your web app against different network conditions, client configurations, and more.
Network: A collection of tools to help you monitor security features and network requests.
Optimization: A collection of tools to help you optimize your web app for performance, compatibility, and more.
Tooltips: The ? icon toggles tooltips, which show what each portion of the DevTools UI does and, where applicable, links to further documentation.
55 |
56 | When in Focus Mode, you still have access to all the tools that are available in the default UI. The tool groups (**Home**, **Layout**, **Testing**, **Network**, and **Optimization**) organize the tools based on common web development scenarios.
57 |
58 | ### Customize tool groups in Focus Mode
59 |
60 | Each tool group is customizable: Remove unwanted tools by selecting the X in the top corner of the tab, and add new tools by selecting the More Tools button (+).
61 |
62 | In an upcoming release, you will be able to further customize tool groups by removing default groups and adding your own.
63 |
64 |
65 | ## Changelog
66 |
67 | | Edge release | Changelog |
68 | |--------------|---------------------------------------------------------|
69 | | 90.0.810.0 | Initial release of Focus Mode as experimental feature. |
70 |
--------------------------------------------------------------------------------
/explainers/SourceHash/explainer.md:
--------------------------------------------------------------------------------
1 | # Source Hashes in Stack Traces
2 |
3 | Authors: [Rob Paveza](https://github.com/robpaveza)
4 |
5 | ## Status of this Document
6 | This document is a proposed enhancement to V8 in the area of JavaScript stack traces, which is today specifically not a Web Standard.
7 |
8 | * This document status: **Active** (One-pager)
9 | * Expected venue: [V8-dev](https://groups.google.com/g/v8-dev)
10 | * **Current version: this document**
11 | * Prototype [implementation](https://chromium-review.googlesource.com/c/v8/v8/+/3229957) in V8
12 |
13 | ## Introduction
14 |
15 | * Source URLs are often insufficient for uniquely identifying a file in post-hoc debugging scenarios, even when they contain a `# sourceMappingURL=` comment.
16 | * This presents a problem for debugging in production, especially when CI systems might automatically deploy new versions of a source file into a production environment. DevTools might incorrectly load a source map, and there is no way to verify that a source map corresponds to a particular version of a file
17 | * Web developers have come up with many clever ways to handle this - explicitly correlating versions of applications to source maps, or including a CRC as part of a file name - indicating that this is a difficult problem for them.
18 |
19 | ## Goals
20 |
21 | - Improve ability to resolve a source map from only the source file
22 |
23 | ## Non-Goals
24 |
25 | - Change the [Source Maps specification](https://sourcemaps.info/spec.html)
26 |
27 | ## Use Cases
28 |
29 | - Diagnostics in production
30 |
31 | ## Proposed Solution
32 |
33 | The hash of source scripts should be accessible when preparing a stack trace or in other locations in which a source file is referenced. This will include, but is not limited to:
34 |
35 | - `CallSite`, exposed in the callback `Error.prepareStackTrace`
36 | - Some CDP properties:
37 | - `Runtime.CallFrame`
38 | - `Debugger.CallFrame`
39 | - Performance trace embedders for function calls
40 |
41 | By leveraging the hash of the source file, a "fingerprint" can be generated which will allow developers to index their source maps according to the hash of the content actually running in the browser.
42 |
43 | One drawback of this solution is that non-code changes in source files (such as comments or whitespace) are likely to generate files with identical "result sources." For the most part, however, this should be a solvable problem.
44 |
45 | ### Appearance within `CallSite`
46 |
47 | The hash will be a [SHA-256](https://en.wikipedia.org/wiki/SHA-2) and encoded in base-16. The following code snippet would append a source hash to the end of each error stack frame:
48 |
49 | ```ts
50 | (() => {
51 | let canGetScriptHash = false;
52 | const oldPrepareStackTrace = Error.prepareStackTrace;
53 | Error.prepareStackTrace = (er, frames) => {
54 | if ('getScriptHash' in frames[0].constructor.prototype) {
55 | canGetScriptHash = true;
56 | }
57 | return er.stack;
58 | };
59 | const error = new Error();
60 | // This should invoke prepareStackTrace above.
61 | const stack = error.stack;
62 | console.log(`Was able to retrieve hash: ${canGetScriptHash}`);
63 | if (!canGetScriptHash) {
64 | Error.prepareStackTrace = oldPrepareStackTrace;
65 | }
66 | else {
67 | Error.prepareStackTrace = (er, frames) => {
68 | const originalStack = er.stack;
69 | const lines = originalStack.split('\n');
70 | let msg = er.name;
71 | if (er.message) {
72 | msg = `${er.name}: ${er.message}`;
73 | }
74 | const stackLines = lines.slice(1);
75 | const formattedLines = stackLines.map((f, i) => {
76 | const frame = frames[i];
77 | const hash = frame.getScriptHash();
78 | if (hash) {
79 | return `${f} [source hash ${hash}]`;
80 | }
81 | return f;
82 | });
83 | formattedLines.unshift(msg);
84 | return formattedLines.join('\n');
85 | };
86 | }
87 | })();
88 | ```
89 |
90 | This will produce a stack trace along the following lines:
91 |
92 | ```
93 | Error: This is an example error.
94 | at http://localhost:8080/test.js:6:11 [source hash ca119760926fbc8502b445d33dc94c4c34d4ef0f20103909e92f91b17c97f33d]
95 | at doWork (http://localhost:8080/additional-script.js:2:3) [source hash d91c151b875409add9cd0e19b20230e09610142727b11aa3873c54f0ae8de414]
96 | at scenario (http://localhost:8080/test.js:4:3) [source hash ca119760926fbc8502b445d33dc94c4c34d4ef0f20103909e92f91b17c97f33d]
97 | at HTMLButtonElement.btn.onclick (http://localhost:8080/main.js:44:5) [source hash 0a5df129f563bdd835347968a0eca78dbd8bb4b2fc7bc95a1ee243e0f5a3d7ac]
98 | ```
99 |
100 | This is computed entirely in userland, except for the source hash.
101 |
102 | ## Privacy and Security Considerations
103 |
104 | To avoid the possibility that a script might perform some malicious computation based on incoming third-party script hashes, scripts will determine whether they have been loaded as "opaque." "Opaque" is a term of art within V8 that means that details of errors within a script should not be computed due to risks of leaking privacy details. This information is determined by the embedder policy when the `ScriptOrigin` objects are created as part of compiling a script; if the script is loaded as "opaque," then the computation of the hash will opportunistically exit and return an empty string.
105 |
106 | For the browser, the result of this will be that classic scripts loaded with CORS can be computed, those loaded without CORS will not be able to be computed, and module scripts, which are always subject to CORS, will always be able to be computed.
107 |
108 | ## Alternative Solutions
109 |
110 | The original alternative explored here was to enable a property on the `Error` object, `stackTraceSourceHash`, to embed the hash directly in the line. This proposal was rejected because the `Error#stack` property is already not standardized, and adding another flag here would create an additional burden to standardize.
111 |
112 | Another alternative solution explored here was to enable a callback on the `Error` object, such as:
113 |
114 | ```ts
115 | Error.stackTraceComputeFingerprint = (sourceContents: Uint8Array) => Promise;
116 | ```
117 |
118 | Then, if at runtime the `stackTraceComputeFingerprint` function is not present, it can return to the present behavior.
119 |
120 | While this seems like a reasonable approach, it seems to be an excessive level of complexity that it's unlikely most customers would override; and, I am concerned that it might introduce cross-origin security issues.
121 |
--------------------------------------------------------------------------------
/explainers/DocumentationSearch/explainer.md:
--------------------------------------------------------------------------------
1 | # DevTools: Documentation Search
2 | Authors:
3 | - [Erica Draud](https://github.com/erdraud), Program Manager
4 | - [Sean Larkin](https://github.com/TheLarkInn), Technical Program Manager
5 |
6 | ## Status of this feature
7 | This feature is a proposed experiment.
8 |
9 | 
10 |
11 | ## Background
12 | This project was part of the Project Mallard effort to improve Bing searches for developers. Search and solution finding occupy most of a developer’s time on the web. On average, a developer may click 5-10 times until they have found the solution they are looking for. Developers use a variety of services and software that provide contextual hints as to what solutions they might look for, or what work they are assigned to on any given day. These services may include (but are not limited to) ADO, Jira, GitHub, or any other project management software that has their day-to-day work tracked. In combination with the Microsoft Developer Graph, information about the developer can be used to inform and suggest more intelligent and relevant searches.
13 |
14 | For example, a developer has 3 high priority work items on his current ADO sprint all referencing JavaScript animations. They also might have 2 websites bookmarked in Microsoft Edge on JavaScript animations. Prior to ever searching for a solution, Developer Search, leverages the intelligence from the Microsoft Developer Graph, and uses NTP real estate to highlight popular LinkedIn Learning courses on JavaScript and CSS Animations, previous pull requests merged in that project’s codebase, the developer’s bookmarked pages, and finally relevant and popular articles related to the topic. The results are then enriched by the developer’s own search query and are combined to provide a solution in half the time and clicks.
15 |
16 | Open Source developer Tobias Koppers commented on his challenge to find solutions across GitHub:
17 |
18 | > The webpack project consists of over 100 repositories across 2 GitHub projects. If I have to track down a particular issue, I would have to search for it across either all of GitHub or every one of the individual projects and repositories. It would save me hours a week to simply configure my Edge/Bing search to include search results across specific GitHub repositories/projects and return results from PR & Issues.
19 |
20 | ## Goals
21 | 1. Detect when a Microsoft Edge user is a Developer and
22 | 2. Collect all relevant solution areas based on criteria of assigned work items and tasks and
23 | 3. Leverage Bing’s search platform and Microsoft's documentation to create developer focused customer models and insights.
24 |
25 | ## Non-goals
26 | 1. Build a separate search, AI, ML model from Bing today
27 |
28 | ## Hypotheses
29 | * Users will find this valuable in that it will save them time by making it easier to access the developer resources they’re looking for; we'll know it's true if 20% of users are 1-month active users (returning users).
30 | * Users will research Elements and Console more than the other documentation combined; we'll know it's true if the number of documentation searches for Elements and Console are more than 100% of the other documentation searches.
31 | * Users will have trouble finding this feature without a tooltip/pop-up; we'll know it's true with overall usage (if people turn it on).
32 |
33 | This initial experiment will run as a flagged rollout especially since the UI may also affect users outside of DevTools. We will test all three hypotheses and focus on iterating for validating the feature’s value as well as which commands are most valuable.
34 |
35 | ## Solutions
36 |
37 | ### Solution 1: Omnibox Integration
38 | Our ideal option is to have the Documentation Search integrated into the address bar (called the omnibox from now on). We would use a unique character typed into the omnibox to trigger the feature. In the Omnibox experiment, there are other character like `?` and `#` that users can type before typing their command or selecting the command from the drop-down menu. We would find a character to access a similar experience to find the right documentation for the search. We could have a series of keywords that the user can type to access the appropriate documents.
39 |
40 | We would start by integrating into the Commander as an experiment like that of the original Omnibox experiment before the more technical and time-consuming work of integrating into the existing omnibox.
41 |
42 | ### Solution 2: Improved Bing searches
43 | Alternatively, we could detect developers and set up Bing filters that will provide the user with results from only the most relevant websites.
44 |
45 | As developers, we often go back to searching for the same solution 5-6 times before we have it memorized. Even after visiting the same solution page 5-6 times, we may never bookmark, favorite, or document the location of that solution. Microsoft Developer Search can create dictionaries of repeated “searched and found” solutions to quickly recall them in one step.
46 | Examples of this could be simple searches like:
47 | * slice() vs splice()
48 | * call() vs apply() vs bind()
49 | * getTimeout() vs getInterval()
50 | * lodash.map
51 |
52 | Searches like this could yield predictive answers to the exact page a developer “bounced” from (indicating their solution was found) the first 3-4 times. To save developers precious context switching and time, this “bounced” search could even be leveraged across other Microsoft developer products such as VS Code, VS, and VS Online to find answers right in the IDE and code editor. Or in short, the more a developer searches and finds solutions, the less time they will spend in the future needing to find those same solutions.
53 |
54 | ### Solution 3: DevTools Welcome tool integration
55 | We previously did a research study where users said that they would like a search bar for the Welcome tool, especially if it could help them find the documentation they need. In proposing this solution, it could be done in addition to Solution 1 or 2 or on its own.
56 |
57 | This search bar could have the UI pulled from the search bar on docs.microsoft.com, shown in the mockup under [Solutions](#solutions). Upon selecting the search result, it could open the documentation either within DevTools or in a new tab.
58 |
59 | ## Next steps
60 | * Design review
61 | * Flagged rollout
62 |
63 | ## Things to consider
64 | * Discoverability could be an issue
65 | * Searches shouldn't conflict with traditional search engine searches
66 | * Accessibility and privacy compliance needs work
67 | * Need to remove Chrome's petal suggestions for technical, localization, and business reasons
68 | * Commands are relatively easy to add, so we can always add more in the future
69 |
--------------------------------------------------------------------------------
/explainers/ClientHints/explainer.md:
--------------------------------------------------------------------------------
1 | # Edit Client Hint headers
2 |
3 | Authors: [Erica Draud](https://github.com/erdraud)
4 |
5 | ## Status of this Document
6 | * This document status: **Active**
7 | * **Current version: this document**
8 |
9 | ## Introduction
10 |
11 | [Client Hints](https://wicg.github.io/client-hints-infrastructure/) focus on securely enabling scalable content negotiation between the client and server through a collection of HTTP and user-agent features with a third-party delegation system. A new expansion to the Client Hints API, [User-Agent Client Hints](https://wicg.github.io/ua-client-hints/) enable developers to access information about a user's browser in a privacy-preserving and ergonomic way. The existing debugging experience for these client hints has been described as limited and “super painful” by our internal clients. Developers cannot easily modify UA Client Hints through an accessible UI, and currently the platform does not support testing custom UA Client Hints and [UA Strings](https://developer.mozilla.org/docs/Web/HTTP/Headers/User-Agent) simultaneously, an important use case for developers. This is a high priority for the Web Platform team; they want to encourage people to switch to using Client Hints over Strings as we hypothesize it will greatly improve site compatibility and code hygiene. They’ve gotten feedback that limited testing infrastructure is a large friction point in that migration, so we are taking on this work to support developers and to improve our existing UX.
12 |
13 | While there are many feature requests regarding UA Client Hints, the Web Platform and our team have worked together to focus on the higher impact items:
14 |
15 | - Address a high-impact bug: UA Client Hint headers are disappearing when custom UA strings are sent
16 |
17 | - Create a more intuitive experience for customizing Client Hints
18 |
19 | - Provide autofill for Client Hints headers to match UA string info and vice-versa
20 |
21 | ## Goals
22 |
23 | 1. To make it easier for users to ensure CH headers are still getting sent even if custom UA is used,
24 |
25 | 2. To limit the effort required in testing Client Hints, and
26 |
27 | 3. To support web developers and browser detection framework teams
28 |
29 | We are taking on the top pain points for developers working with UA Client Hints. Their workflows bleed into the Developer Tools, so we must do our part to support them. As the Client Hints move through Chromium, we will have more and more users that will require these tools, so it’s important that we start sooner rather than later. Once we accomplish these top requests, we can address other pain points as they come up.
30 |
31 | ## Use Cases
32 |
33 | ### Verify success of sent Client Hints headers
34 |
35 | The most desired feature for debugging Client Hints is ensuring CH headers are still getting sent even if custom UA is used. UA Client Hints were recently enabled in Chromium, which has resulted in some compatibility issues and some bugs. One inconsistency that directly impacts the UA Client Hint edit and send story is the Network Conditions UX.
36 |
37 | 
38 |
39 | In Network conditions > User agent, if you select a custom or pre-canned user agent, the UA Client Hints are no longer available; the headers are not sent, `navigator.userAgentData` is still present in the DOM but the brands property is of 0 size:
40 |
41 | 
42 |
43 |
44 | The expected behavior is that `sec-ua-ch headers` continue to get sent and that `navigator.userAgentData.brands` is not empty. The user also shared that “if the precanned values of “Chrome – Windows” also updated the Client Hints values to match that would substantially address [their] testing concerns.” This improvement could also benefit the associated XBOX UA experience.
45 |
46 | ### Customize UA Client Hints set-up
47 |
48 |
49 | In the DevTools Settings > Devices, there is a feature where users can add custom devices, which enables users to send user agent client hints. The current experience forces users to define every single value in the “User agent client hints” section to send any at all.
50 |
51 | 
52 |
53 | Users want the option to choose which hints to customize such that the remaining fields will just be the value that would have been sent.
54 |
55 | ## Proposed Solution
56 |
57 | ### Emulated Devices
58 |
59 | We will be re-working the User agent client hints UI to be cleaner and easier to use. The form will use grouping for both accessibility and clarity. and we'll use drop-downs to lessen the users burden. Users also won't have to submit every element and will have the guidance of default suggestions. These default will replace the gray text within the form elements shown below.
60 |
61 | 
62 |
63 | While the design does include changes in other parts of the Devices pane, that is out of scope. We will prioritize accessibility issues there and then investigate if other UI changes should be made there.
64 |
65 | ### Network conditions
66 |
67 | While investigating the [header bug](https://bugs.chromium.org/p/chromium/issues/detail?id=1174299), we also noticed that the UI was lacking. To enter a custom user agent, the developer must type it in a specific string format. To help users navigate this form, we will add the proposed UI for the Devices pane into the Network conditions tool, too.
68 |
69 | ## Q&A
70 |
71 | **Q: Will we need to make changes to the CDP (Chrome Dev Protocol)?**
72 |
73 | A: No
74 |
75 | **Q: Are the client hints displayed in the Emulated Devices pane the only hints available or are there other options that aren’t displayed?**
76 |
77 | A: The list in the device emulation view is the complete set of UA Client Hints
78 |
79 | **Q: Are all the hint inputs currently required because HTTP needs to be sent with all of the header items?**
80 |
81 | A: No, it's fine if some of the headers are undefined.
82 |
83 | **Q: For emulated devices (not the current device), where would auto-fill pull from?**
84 |
85 | A: For *emulated devices that are built-in*, ideally there would be an auto-mapping of characteristics. For example, an Android phone would use the same UA brands list as on desktop, but it would need a hardcoded value for model info (e.g. the UA string baked into DevTools might have been “Nexus 5 Build/MRA58N” but would now need to report a similar string in the Sec-CH-UA-Model hint). For iPhone emulation, it would ideally drop all of the hints by default since UA Client Hints aren’t available for iPhone at all.
86 |
87 | For a *custom device* (or an edited one…), ideally an empty string for one of the UA Clients Hints fields would map to “send whatever the browser would have done otherwise”.
88 |
89 | **Q: Do we need to add default client hints to the existing emulation library for this or for future use cases?**
90 |
91 | A: Yes, I think the emulation library should be upgraded to actually understand Client Hints.
92 |
--------------------------------------------------------------------------------
/explainers/MultiViewport/explainer.md:
--------------------------------------------------------------------------------
1 | # DevTools: Multiple viewports in Device Mode
2 |
3 | ## Authors
4 |
5 | - [Evelyn Chou](https://github.com/evelynchou02), Explorer Intern
6 | - [Hana Memon](https://github.com/hanamemon), Explorer Intern
7 | - [Jenna Sasson](https://github.com/jenna-sasson), Explorer Intern
8 | - Ryan Hayen, Designer
9 |
10 | ## Status of this feature
11 |
12 | This feature is experimental and in active development. See [Changelog section](#changelog) for details on progressive feature implementation.
13 |
14 | ## Introduction
15 |
16 | ### Current Device Mode
17 |
18 | The history of the Device Mode feature in DevTools predates the current, diverse device ecosystem and mobile emulation has only grown in scope and complexity. Device Mode is a popular tool that web developers use to test the responsiveness of their web contents. Currently, Device Mode allows you to view the webpage through the dimensions of a single device. In this explainer, we propose that handling one device is not enough. There is currently no solution to seeing multiple viewports simultaneously in the DevTools. The only solution is to use browser extensions/external tools.
19 |
20 | ### User Jobs-To-Be-Done (JTBD)
21 |
22 | - Find visual errors on a website in multiple layouts and sizes.
23 | - Test for functionality of the buttons and scrolling on the website.
24 | - Ensure the visual and functional aspects of the website are correct on different devices.
25 | - Compile a list of necessary bugs and changes to be fixed.
26 |
27 | ### Solution
28 |
29 | - Allow users working in Device Mode to be able to add multiple viewports for different devices at one time. Using the WebContents class, users will be able to add extra devices using Headless Mode. Users will be able to see multiple sizes (and different devices that use different operating systems, e.g., iPhone 11 & Galaxy Tab A7) side by side in DevTools. By adding multiple viewports, users can use Device Mode in a more streamlined way without negatively affecting the current experience.
30 | - Users will be more easily able to complete their JTBD if they can see multiple devices at once. They will make comparisons of the functionality and visual aspects of websites in multiple sizes more quickly, increasing overall productivity.
31 |
32 | ## Prior Art
33 |
34 | Already existing tools on the market include:
35 |
36 | - [Polypane](https://polypane.app/)
37 | - [Sizzy](http://sizzy.co/)
38 | - [Responsively](https://responsively.app/)
39 | - [Blisk](https://blisk.io/)
40 |
41 | Each of these applications allow users to add multiple (more than 2) devices through their external application/extension. All these applications allow for synchronization when scrolling and have a multitude of device options (which did not account for newer devices).
42 |
43 | ## Hypotheses
44 |
45 | - We believe that using DeviceMode with multiple viewports will increase efficiency in DevTools customers. Additionally, it will increase user engagement either in session length or number of sessions. Web Developers can be more efficient using DeviceMode if they can view their web pages in multiple screen sizes, dimensions, and device forms side-by-side in DevTools while they make changes as this avoids having to manually resize the viewport.
46 | - The current single viewport device mode has valuable screen real estate that is being underutilized and we think that we can bring in new functionality by adding multiple viewports without negatively changing the experience and functionality today. As of right now, multiple viewports are available but only when using extensions or multiple tools. Adding multiple viewports directly into DevTools will streamline the user experience.
47 |
48 | ### Trigger Conditions and Treatment
49 |
50 | - Opening Device Mode.
51 | - Showing the option within the dropdown menu to add a new viewport.
52 |
53 | ### Metrics
54 |
55 | - Through this experiment, session times will be analyzed.
56 | - Additionally, (for the treatment group) this experiment will provide further insight into how many screens are needed by users to be productive. This can be tracked by checking how many screens are activated in each working session.
57 |
58 | ## Usage
59 |
60 | ### Add a new viewport
61 |
62 | Users will be able to add a new device to the viewport by simply checking a box from the dropdown list of devices in the viewport toolbar. Once a device is added, it will appear either next to or underneath the existing viewport(s) with a toolbar on top of it. The devices will be re-centered to accommodate the new viewport. As more devices are added and the viewport fills up, the user will be able to vertically scroll down the viewport to look at all the devices.
63 |
64 | ### Open DevTools against a new viewport
65 |
66 | DevTools will remain the same, regardless of the number of devices in the viewport. As in the current version of DevTools the user will be able to choose the placement of DevTools on their screen and expand/shrink the DevTools window. Initial exection of the feature will attach DevTools to one (primary) viewport. The larger goal of this project is to synchronize all the viewports with the DevTools.
67 |
68 | ### Synchronize browsing and inspection across viewports
69 |
70 | Browsing will be synchronized across devices in the viewport, meaning that scrolling in one device would mean all other devices would be kept in sync so they are displaying as close to the same content as possible. The same will also be true for inspecting and selecting items across different devices in the viewport.
71 |
72 | ## Design
73 |
74 | We have two designs: one for the feature as a whole and one for our intern project implementation. While the implementation of our project will start with *only* adding a second device, the design we created is scalable to allow for a larger number of devices all in one viewport.
75 |
76 | The first design adds an entirely new viewport (almost like a new tab) for a second device. The second design allows users to add multiple devices into a grid formation in one viewport so users can more easily view a greater number of devices. Current user research suggets that 3-5 devices on the viewport would provide greater efficiency.
77 |
78 | 
79 |
80 | 
81 |
82 | ### Open Questions and Ideas
83 |
84 | - Zoom percentage (synchronized across devices?).
85 | - The user’s device is smaller than the screen they want to test (what would the default be?).
86 | - How many screens does user want to see all at once before they need to scroll (default vs user customization).
87 | - How would this be affected by placement of sidebar.
88 |
89 |
92 |
93 | ## Changelog
94 |
95 | | Edge release | Changelog |
96 | |--------------|---------------------------------------------------------|
97 | | N/A | N/A |
98 |
--------------------------------------------------------------------------------
/explainers/CommandPalette/explainer.md:
--------------------------------------------------------------------------------
1 | # DevTools:Command Palette
2 |
3 | Authors:
4 | - [Erica Draud](https://github.com/erdraud), Program Manager
5 |
6 | ## Feature status
7 | This feature is in Canary 105.
8 |
9 | ## Introduction
10 | We have evolved our [Omnibox Commands](https://github.com/MicrosoftEdge/DevTools/blob/main/explainers/Omnibox/explainer.md) experiment into the Command Palette, which is now available in Canary under a feature flag. We are excited to make DevTools and browser commands available to users in a streamlined and comprehensive platform. We've pulled some of the commands you can find in the [Command Menu]( https://docs.microsoft.com/microsoft-edge/devtools-guide-chromium/command-menu/) in DevTools, but why have these features in the browser? We know that users are often looking for ways to streamline their browsing or programming workflow, and the Command Palette enables users to do so without having to first open the Developer Tools or go down a long chain of settings or context menus.
11 |
12 | 
13 |
14 | To try it out today, head to [edge://flags](edge://flags) and enable the Command Palette experiment. Once it's enabled, use the keyboard shortcut `CTRL+SHIFT+SPACE` to turn it on. For more information, check out our [documentation](https://docs.microsoft.com/microsoft-edge/devtools-guide-chromium/experimental-features/edge-command-palette). Let us know what you think; your suggestions just might be in the next version!
15 |
16 | ## Goals
17 | 1. To simplify DevTools users’ workflow and
18 | 2. Identify opportunities for expansion
19 |
20 | ## Features
21 |
22 | ### Home menu
23 |
24 | 
25 |
26 | When the feature opens, there will be a search bar with text that prompts the user to try using different keywords to search for their command.
27 |
28 | ### DevTools
29 |
30 | 
31 |
32 | Typing `>` will pull up the available commands for DevTools. These commands were pulled from the DevTools Command Menu. Enable Device Mode was prioritized since we’ve had direct feedback for this functionality. Most of the commands are opening panels or changing the appearance or theme of the DevTools. To access the existing commands, you can find them in the [DevTools commands](#devtools-commands) section.
33 |
34 | ### Help
35 |
36 | 
37 |
38 | If the user types a question mark `?`, we will display a short text in the drop-down menu area explaining the feature and a link to the documentation page. It will include all the command segments they can type in in case they missed it the first time they opened it.
39 |
40 | ### Search
41 | By typing a keyword, the menu options will display all the possible commands with the string provided. The search results will be segmented by their related category, whether it's DevTools or one of the many browser categories.
42 | If an option is unavailable, `No command found` will appear in the UI meant for search results.
43 |
44 | ### URL
45 | To easily access internal URLs, you can type in `edge`. This will pull up a list of all the Edge internal URLs. To access the existing URLs, click [here](#available-urls).
46 |
47 | ## Next steps
48 | * Complete rollout
49 |
50 | ## Things to consider
51 | * Commands shouldn't conflict with search engine searches
52 |
53 | ## FAQ:
54 | Q: Does it have extensibility so other could add in additional commands?
55 |
56 | A: Not in scope for this experiment, but a great idea for the future.
57 |
58 | Q: Will this require a totally separate implementation vs. upstream? or hook into theirs?
59 |
60 | A: We will be integrating directly into the Omnibox, not hooking into the upstream Commander.
61 |
62 | Q: Is there an "all" option? Will customers know to use `?` and `>`?
63 |
64 | A: We will be working with the omnibox team to clarify the best characters or strings to trigger the DevTools commands.
65 |
66 | Q: If this is integrated into the address bar, will they know to type `?` to get help on the commands that are available?
67 |
68 | A: We recognize there will be discoverability challenges, and we will be exploring that as we go.
69 |
70 | Q: Are we planning to add a toggle or setting in browser settings that enable this feature after the rollout?
71 |
72 | A: That could be a future option, but it is not in scope.
73 |
74 | Q: Are these commands going to be available for puppeteer and/or playwright?
75 |
76 | A: That is out of scope for this project.
77 |
78 | Q: Some actions do trigger opening DevTools. Is it in or out of scope to be able to complete actions without opening DevTools?
79 |
80 | A: These commands will open DevTools and conduct the requested action. The benefit is that this will be done without the user having to open the DevTools first to speed up their workflow.
81 |
82 | ## Available URLs
83 | * edge://about/
84 | * edge://accessibility/
85 | * edge://appcache-internals/
86 | * edge://application-guard-internals/
87 | * edge://apps/
88 | * edge://autofill-internals/
89 | * edge://blob-internals/
90 | * edge://bluetooth-internals/
91 | * edge://collected-cookies-dialog/
92 | * edge://compat/
93 | * edge://components/
94 | * edge://conflicts/
95 | * edge://conversion-internals/
96 | * edge://crashes/
97 | * edge://credits/
98 | * edge://data-viewer
99 | * edge://device-log/
100 | * edge://discards/
101 | * edge://download-internals/
102 | * edge://downloads/
103 | * edge://edge-dip-internals/
104 | * edge://edge-urls/
105 | * edge://extensions/
106 | * edge://favorites/
107 | * edge://flags/
108 | * edge://floc-internals/
109 | * edge://gcm-internals/
110 | * edge://gpu/
111 | * edge://help/
112 | * edge://histograms/
113 | * edge://history/
114 | * edge://indexeddb-internals/
115 | * edge://inspect/
116 | * edge://interstitials/
117 | * edge://invalidations/
118 | * edge://local-state
119 | * edge://management/
120 | * edge://media-engagement/
121 | * edge://media-internals/
122 | * edge://net-export/
123 | * edge://net-internals/
124 | * edge://network-error/
125 | * edge://newtab/
126 | * edge://ntp-tiles-internals/
127 | * edge://omnibox
128 | * edge://password-manager-internals/
129 | * edge://policy/
130 | * edge://predictors/
131 | * edge://prefs-internals/
132 | * edge://print/
133 | * edge://process-internals/
134 | * edge://push-internals/
135 | * edge://quota-internals/
136 | * edge://sandbox/
137 | * edge://serviceworker-internals/
138 | * edge://settings/
139 | * edge://signin-internals/
140 | * edge://site-engagement/
141 | * edge://sync-internals/
142 | * edge://system/
143 | * edge://terms/
144 | * edge://tracing/
145 | * edge://translate-internals/
146 | * edge://ukm/
147 | * edge://usb-internals/
148 | * edge://user-actions/
149 | * edge://version/
150 | * edge://web-app-internals/
151 | * edge://webrtc-internals/
152 | * edge://webrtc-logs/
153 | * edge://whats-new/
154 |
155 | ## DevTools commands
156 | * Appearance: Show Welcome after each update
157 | * Appearance: Switch to system preferred color theme
158 | * Console: Clear console history
159 | * Debugger: Disable JavaScript
160 | * Drawer: Show Console
161 | * Mobile: Toggle device emulation
162 | * Open dedicated DevTools for Node
163 | * Panel: Show Console
164 | * Panel: Show Elements
165 | * Panel: Show Network
166 | * Panel: Show Sources
167 | * Sources: Show Snippets
168 |
--------------------------------------------------------------------------------
/.gitignore:
--------------------------------------------------------------------------------
1 | ## Ignore Visual Studio temporary files, build results, and
2 | ## files generated by popular Visual Studio add-ons.
3 | ##
4 | ## Get latest from https://github.com/github/gitignore/blob/master/VisualStudio.gitignore
5 |
6 | # User-specific files
7 | *.rsuser
8 | *.suo
9 | *.user
10 | *.userosscache
11 | *.sln.docstates
12 |
13 | # User-specific files (MonoDevelop/Xamarin Studio)
14 | *.userprefs
15 |
16 | # Mono auto generated files
17 | mono_crash.*
18 |
19 | # Build results
20 | [Dd]ebug/
21 | [Dd]ebugPublic/
22 | [Rr]elease/
23 | [Rr]eleases/
24 | x64/
25 | x86/
26 | [Aa][Rr][Mm]/
27 | [Aa][Rr][Mm]64/
28 | bld/
29 | [Bb]in/
30 | [Oo]bj/
31 | [Ll]og/
32 | [Ll]ogs/
33 |
34 | # Visual Studio 2015/2017 cache/options directory
35 | .vs/
36 | # Uncomment if you have tasks that create the project's static files in wwwroot
37 | #wwwroot/
38 |
39 | # Visual Studio 2017 auto generated files
40 | Generated\ Files/
41 |
42 | # MSTest test Results
43 | [Tt]est[Rr]esult*/
44 | [Bb]uild[Ll]og.*
45 |
46 | # NUnit
47 | *.VisualState.xml
48 | TestResult.xml
49 | nunit-*.xml
50 |
51 | # Build Results of an ATL Project
52 | [Dd]ebugPS/
53 | [Rr]eleasePS/
54 | dlldata.c
55 |
56 | # Benchmark Results
57 | BenchmarkDotNet.Artifacts/
58 |
59 | # .NET Core
60 | project.lock.json
61 | project.fragment.lock.json
62 | artifacts/
63 |
64 | # StyleCop
65 | StyleCopReport.xml
66 |
67 | # Files built by Visual Studio
68 | *_i.c
69 | *_p.c
70 | *_h.h
71 | *.ilk
72 | *.meta
73 | *.obj
74 | *.iobj
75 | *.pch
76 | *.pdb
77 | *.ipdb
78 | *.pgc
79 | *.pgd
80 | *.rsp
81 | *.sbr
82 | *.tlb
83 | *.tli
84 | *.tlh
85 | *.tmp
86 | *.tmp_proj
87 | *_wpftmp.csproj
88 | *.log
89 | *.vspscc
90 | *.vssscc
91 | .builds
92 | *.pidb
93 | *.svclog
94 | *.scc
95 |
96 | # Chutzpah Test files
97 | _Chutzpah*
98 |
99 | # Visual C++ cache files
100 | ipch/
101 | *.aps
102 | *.ncb
103 | *.opendb
104 | *.opensdf
105 | *.sdf
106 | *.cachefile
107 | *.VC.db
108 | *.VC.VC.opendb
109 |
110 | # Visual Studio profiler
111 | *.psess
112 | *.vsp
113 | *.vspx
114 | *.sap
115 |
116 | # Visual Studio Trace Files
117 | *.e2e
118 |
119 | # TFS 2012 Local Workspace
120 | $tf/
121 |
122 | # Guidance Automation Toolkit
123 | *.gpState
124 |
125 | # ReSharper is a .NET coding add-in
126 | _ReSharper*/
127 | *.[Rr]e[Ss]harper
128 | *.DotSettings.user
129 |
130 | # TeamCity is a build add-in
131 | _TeamCity*
132 |
133 | # DotCover is a Code Coverage Tool
134 | *.dotCover
135 |
136 | # AxoCover is a Code Coverage Tool
137 | .axoCover/*
138 | !.axoCover/settings.json
139 |
140 | # Visual Studio code coverage results
141 | *.coverage
142 | *.coveragexml
143 |
144 | # NCrunch
145 | _NCrunch_*
146 | .*crunch*.local.xml
147 | nCrunchTemp_*
148 |
149 | # MightyMoose
150 | *.mm.*
151 | AutoTest.Net/
152 |
153 | # Web workbench (sass)
154 | .sass-cache/
155 |
156 | # Installshield output folder
157 | [Ee]xpress/
158 |
159 | # DocProject is a documentation generator add-in
160 | DocProject/buildhelp/
161 | DocProject/Help/*.HxT
162 | DocProject/Help/*.HxC
163 | DocProject/Help/*.hhc
164 | DocProject/Help/*.hhk
165 | DocProject/Help/*.hhp
166 | DocProject/Help/Html2
167 | DocProject/Help/html
168 |
169 | # Click-Once directory
170 | publish/
171 |
172 | # Publish Web Output
173 | *.[Pp]ublish.xml
174 | *.azurePubxml
175 | # Note: Comment the next line if you want to checkin your web deploy settings,
176 | # but database connection strings (with potential passwords) will be unencrypted
177 | *.pubxml
178 | *.publishproj
179 |
180 | # Microsoft Azure Web App publish settings. Comment the next line if you want to
181 | # checkin your Azure Web App publish settings, but sensitive information contained
182 | # in these scripts will be unencrypted
183 | PublishScripts/
184 |
185 | # NuGet Packages
186 | *.nupkg
187 | # NuGet Symbol Packages
188 | *.snupkg
189 | # The packages folder can be ignored because of Package Restore
190 | **/[Pp]ackages/*
191 | # except build/, which is used as an MSBuild target.
192 | !**/[Pp]ackages/build/
193 | # Uncomment if necessary however generally it will be regenerated when needed
194 | #!**/[Pp]ackages/repositories.config
195 | # NuGet v3's project.json files produces more ignorable files
196 | *.nuget.props
197 | *.nuget.targets
198 |
199 | # Microsoft Azure Build Output
200 | csx/
201 | *.build.csdef
202 |
203 | # Microsoft Azure Emulator
204 | ecf/
205 | rcf/
206 |
207 | # Windows Store app package directories and files
208 | AppPackages/
209 | BundleArtifacts/
210 | Package.StoreAssociation.xml
211 | _pkginfo.txt
212 | *.appx
213 | *.appxbundle
214 | *.appxupload
215 |
216 | # Visual Studio cache files
217 | # files ending in .cache can be ignored
218 | *.[Cc]ache
219 | # but keep track of directories ending in .cache
220 | !?*.[Cc]ache/
221 |
222 | # Others
223 | ClientBin/
224 | ~$*
225 | *~
226 | *.dbmdl
227 | *.dbproj.schemaview
228 | *.jfm
229 | *.pfx
230 | *.publishsettings
231 | orleans.codegen.cs
232 |
233 | # Including strong name files can present a security risk
234 | # (https://github.com/github/gitignore/pull/2483#issue-259490424)
235 | #*.snk
236 |
237 | # Since there are multiple workflows, uncomment next line to ignore bower_components
238 | # (https://github.com/github/gitignore/pull/1529#issuecomment-104372622)
239 | #bower_components/
240 |
241 | # RIA/Silverlight projects
242 | Generated_Code/
243 |
244 | # Backup & report files from converting an old project file
245 | # to a newer Visual Studio version. Backup files are not needed,
246 | # because we have git ;-)
247 | _UpgradeReport_Files/
248 | Backup*/
249 | UpgradeLog*.XML
250 | UpgradeLog*.htm
251 | ServiceFabricBackup/
252 | *.rptproj.bak
253 |
254 | # SQL Server files
255 | *.mdf
256 | *.ldf
257 | *.ndf
258 |
259 | # Business Intelligence projects
260 | *.rdl.data
261 | *.bim.layout
262 | *.bim_*.settings
263 | *.rptproj.rsuser
264 | *- [Bb]ackup.rdl
265 | *- [Bb]ackup ([0-9]).rdl
266 | *- [Bb]ackup ([0-9][0-9]).rdl
267 |
268 | # Microsoft Fakes
269 | FakesAssemblies/
270 |
271 | # GhostDoc plugin setting file
272 | *.GhostDoc.xml
273 |
274 | # Node.js Tools for Visual Studio
275 | .ntvs_analysis.dat
276 | node_modules/
277 |
278 | # Visual Studio 6 build log
279 | *.plg
280 |
281 | # Visual Studio 6 workspace options file
282 | *.opt
283 |
284 | # Visual Studio 6 auto-generated workspace file (contains which files were open etc.)
285 | *.vbw
286 |
287 | # Visual Studio LightSwitch build output
288 | **/*.HTMLClient/GeneratedArtifacts
289 | **/*.DesktopClient/GeneratedArtifacts
290 | **/*.DesktopClient/ModelManifest.xml
291 | **/*.Server/GeneratedArtifacts
292 | **/*.Server/ModelManifest.xml
293 | _Pvt_Extensions
294 |
295 | # Paket dependency manager
296 | .paket/paket.exe
297 | paket-files/
298 |
299 | # FAKE - F# Make
300 | .fake/
301 |
302 | # CodeRush personal settings
303 | .cr/personal
304 |
305 | # Python Tools for Visual Studio (PTVS)
306 | __pycache__/
307 | *.pyc
308 |
309 | # Cake - Uncomment if you are using it
310 | # tools/**
311 | # !tools/packages.config
312 |
313 | # Tabs Studio
314 | *.tss
315 |
316 | # Telerik's JustMock configuration file
317 | *.jmconfig
318 |
319 | # BizTalk build output
320 | *.btp.cs
321 | *.btm.cs
322 | *.odx.cs
323 | *.xsd.cs
324 |
325 | # OpenCover UI analysis results
326 | OpenCover/
327 |
328 | # Azure Stream Analytics local run output
329 | ASALocalRun/
330 |
331 | # MSBuild Binary and Structured Log
332 | *.binlog
333 |
334 | # NVidia Nsight GPU debugger configuration file
335 | *.nvuser
336 |
337 | # MFractors (Xamarin productivity tool) working folder
338 | .mfractor/
339 |
340 | # Local History for Visual Studio
341 | .localhistory/
342 |
343 | # BeatPulse healthcheck temp database
344 | healthchecksdb
345 |
346 | # Backup folder for Package Reference Convert tool in Visual Studio 2017
347 | MigrationBackup/
348 |
349 | # Ionide (cross platform F# VS Code tools) working folder
350 | .ionide/
351 |
--------------------------------------------------------------------------------
/explainers/Sustainability/explainer.md:
--------------------------------------------------------------------------------
1 |
2 | # DevTools: Sustainable Web Development Feature
3 |
4 | Author:
5 | - [Taylore Givens](https://github.com/tayloregivens), Program Manager
6 |
7 | ## Status of this feature
8 |
9 | Proposal for a feature not yet in development. Please share your feedback [here](https://github.com/MicrosoftEdge/DevTools/issues/92).
10 |
11 | ## Definition
12 |
13 | web app sustainability – energy consumption and type of energy (i.e. fossil fuels/renewable) used for a web app
14 |
15 | ## Introduction
16 |
17 | The carbon impact of the internet, including the hardware, software, and systems that go into creating it, produces about [3.7%]( https://www.bbc.com/future/article/20200305-why-your-internet-habits-are-not-as-clean-as-you-think) of global carbon emissions. This is similar to the percentage of global emissions from the [airline industry](https://www.bbc.com/future/article/20200305-why-your-internet-habits-are-not-as-clean-as-you-think). Developers and the public are becoming increasingly more aware and concerned about this issue. Developers are increasingly interested in understanding **what factors impact a web app's sustainability and how to improve it's sustainability.** Consequently, tools such as [Website Carbon](https://www.websitecarbon.com/), [Ecograder](https://ecograder.com/), [EcoPing](https://ecoping.earth/blog/core-web-vitals-and-sustainability), and [Beacon](https://digitalbeacon.co/) have been created to calculate the amount of CO2 a web app emits and provide recommendations to improve the sustainability of a web app.
18 |
19 | ## Goals
20 |
21 | Adding sustainability features to DevTools will raise awareness about the alarming carbon impact of web apps and the internet and help developers measure and improve the sustainability of their web apps by
22 | - Providing proxy web app sustainability measurements
23 | - Highlighting common factors that reduce the sustainability of web apps by showing or explaining how these factors decrease performance and increase energy consumption
24 | - Indicating to developers what actions they’re currently taking, such as performance improvements, that also improve web app sustainability
25 | - Educating developers on new actions they can take that are purely beneficial for sustainability.
26 |
27 | ## Solution
28 |
29 | ### Summary
30 |
31 | - Label existing issues in the Issues panel that are beneficial to sustainability and energy efficiency
32 | - Create a “Sustainability” tab that is a hub for sustainability-related metrics and provides insights about web app energy consumption, the type of energy used to power a web app, third parties' impact on performance and energy, and best practices to improve sustainability.
33 |
34 | ### Sustainability Content Labeling in Issues Tab
35 |
36 | 
37 | Mockup is conceptual, not the final design
38 |
39 | #### Usage
40 |
41 | Once the user navigates to the Issues panel, any issue or category relevant to improving sustainability will have a sustainability label. Clicking this label will expand the category or issue dropdown window. The dropdown window will include a green banner describing how the category or issue is related to sustainability. The banner will also include a link to external documentation to learn more about why the category or issue is sustainability related. The banner will potentially also include a link to the DevTools Sustainability Tab (see next section).
42 |
43 | Sustainability labeling will be enabled by default but can be disabled with the checkbox to reduce noisiness. Categories or issues labeled as sustainable would be prioritized in the ordering of categories and issues.
44 |
45 | ### Sustainability Tab
46 |
47 | This tab will be a hub for sustainability-related metrics and provide insights about web app energy consumption, the type of energy used to power a web app, third parties' impact on performance and energy, and best practices to improve sustainability.
48 |
49 | Although developers requested a web app carbon calculator feature in DevTools, like [Website Carbon](https://www.websitecarbon.com/), these types of algorithms are underdeveloped and inaccurate because they often rely on inputting the byte size of a website and applying average ratios (i.e. kWh/byte and CO2 g/kWh) to get a carbon estimate. This type of algorithm is **better suited to estimate the carbon emitted from the energy used to transfer a web app over the network** rather than estimate the total carbon emissions associated with a web app.
50 |
51 | #### Content and Usage
52 |
53 | The Sustainability tab has three sections: Sustainability Analysis, Third Party Impact, and Best Practices.
54 |
55 | Sustainability Analysis
56 | > Energy Consumption
57 | > > The Client-Device Energy and Network Transfer Energy sub-sections display proxy metrics relevant to how much energy is used to render the web app on the client device and transfer it over the network to give the developer a sense of the energy consumed by the web app.
58 | > >
59 | > >Client-Device Energy
60 | > >- “Client-Device Energy Score“ is out of 100 and is based on the CPU utilization and GPU utilization of the web app's initialization compared to the average web app. The score will vary slightly depending on the client's device due to different hardware. The score should be used as a guideline metric to assess how incremental code changes affect the client device energy.
61 | > >- CPU metrics such as the average CPU utilization and the live CPU utilization
62 | > >- Link to Performance tab to further investigate CPU utilization
63 | > >
64 | > >Network Transfer Energy
65 | > >- Bytes transferred and number of network requests to give context to the amount of network activity the web app is generating
66 | > >- Use an open-source API, such as the [Green Web Foundation API](https://www.thegreenwebfoundation.org/co2-js/), to get a carbon estimate and display this value as the emissions from the energy required to transfer the web app bytes over the network.
67 | > >
68 | > Energy Type
69 | > > Display whether the web app runs on a green hosting service (i.e. service that runs on renewable energy) based on the Green Web Foundation's open source [dataset](https://www.thegreenwebfoundation.org/green-web-datasets/).
70 | > >
71 | Third-Party Impact
72 | > Third parties are often incorporated or added on top of web apps without much thought as to how they affect the weight and performance of the app. We will display the following data to help developers identify the potential negative impact third parties are having on their web app.
73 | > - number of requests made to third parties
74 | > - number of bytes transferred from these network requests/all bytes transferred
75 | > - time consumed by third-party requests/total load time for web app
76 |
77 | Best Practices
78 | > Sustainable web app design recommendations focus on making the web app as light and high-performant as possible by limiting unnecessary web app components.
79 | >
80 | > There are certain properties we recommend eliminating or adding to a web app to improve its sustainability, such as eliminating [inline CSS Styles](https://webhint.io/docs/user-guide/hints/hint-no-inline-styles/) because inline CSS can’t be cached or [minifying all your CSS and Javascript](https://webhint.io/docs/user-guide/hints/hint-minified-js/).
81 | >
82 | > However, for other properties that negatively impact sustainability, it's unreasonable to recommend that all web apps eliminate these properties such as [custom fonts or large photos](https://www.fastcompany.com/90605005/these-are-the-worlds-most-sustainable-fonts#:~:text=Arial%20and%20Times%20New%20Roman%20aren%E2%80%99t%20the%20only,custom-designed%20typefaces%2C%20this%20is%20slim%20pickings.%20%5BScreenshot%3A%20FormaFantasma%5D). Therefore, we will provide a table that shows the number of custom fonts, large photos, and other properties in a color-coded manner to indicate which counts are above or below average to give developers a sense of how sustainable their website is compared to other sites.
83 |
84 | We welcome community feedback on this concept and the content proposed.
85 |
--------------------------------------------------------------------------------
/explainers/Omnibox/explainer.md:
--------------------------------------------------------------------------------
1 |
2 | # DevTools: Omnibox Commands
3 |
4 | Authors:
5 | - [Erica Draud](https://github.com/erdraud), Program Manager
6 |
7 | ## Status of this feature
8 | Experiment has evolved and is now in Canary. See [Command Palette](https://github.com/MicrosoftEdge/DevTools/blob/main/explainers/CommandPalette/explainer.md) for more information.
9 |
10 | ## Introduction
11 | Earlier this year, the Chrome team released the [Commander]( https://bugs.chromium.org/p/chromium/issues/detail?id=1014639) as a text interface that provides a shortcut for common commands for browser users. The DevTools team used this as the framework for their Omnibar hackathon project. There’s some uncertainty around the usage and discoverability of the tool, so we’re starting with a flagged experiment.
12 |
13 | 
14 |
15 | You’ll notice that many of the commands in this feature can be found in the [Command Menu]( https://learn.microsoft.com/microsoft-edge/devtools-guide-chromium/command-menu/) in DevTools, so why have these features in the address bar (from this point forward referred to as the omnibox)? We know that users would like a faster way to complete their tasks in DevTools, and the Omnibox Commands feature enables users to do so without having to first open the Developer Tools. Additionally, we’ve included features that are specific to the browser window: Edge internal urls and last viewed pages.
16 |
17 | ## Goals
18 | 1. To simplify DevTools users’ workflow and
19 | 2. To test the following hypotheses:
20 | * Users will find this valuable in that it will save them time by minimizing the steps users need in their DevTools workflow; we'll know it's true if 20% of users are 2-week active users (returning users).
21 | * Users will use navigation commands more than action commands; we'll know it's true if the number of navigation commands is at least 20% more than the number of action commands.
22 | * Users will have trouble finding this feature without a tooltip/pop-up; we'll know it's true with overall usage (if people turn it on).
23 |
24 | This initial experiment will run as a flagged rollout especially since the UI may also affect users outside of DevTools. We will test all three hypotheses and focus on iterating for validating the feature’s value as well as which commands are most valuable.
25 |
26 | ## Features
27 |
28 | ### URL
29 | To easily access internal URLs, you can type in a question mark `?`. This will pull up a list of all the Edge internal URLs. To access the existing URLs, click [here](#available-urls).
30 |
31 | ### Command
32 | Typing `>` will pull up the available commands for DevTools. These commands were exported from those available in DevTools now. The only command added to the list that hasn’t already been added to the Commander experiment is *Device Mode: Enable Device Mode*, and we will omit this command if we don’t have time in the first iteration to add it. Most of these commands are opening panels or changing the appearance or theme of the DevTools. To access the existing commands, click [here](#available-commands).
33 |
34 | ### Search
35 | If you type something in that isn’t a command, the Omnibox will display an option to search the text typed in the user’s preferred search engine.
36 |
37 | ### Recently closed
38 | To get a list of the webpages you recently closed, type `#`.
39 |
40 | ## Next steps
41 | * Design review
42 | * Flagged rollout
43 | * Add Documentation Search
44 |
45 | ## Things to consider
46 | * Commands shouldn't conflict with search engine searches
47 | * Accessibility and privacy compliance needs work
48 | * Need to remove Chrome's petal suggestions for technical, localization, and business reasons.
49 | * Commands are relatively easy to add, so we can always add more in the future
50 |
51 | ## FAQ:
52 | Q: Does it have extensibility so other could add in additional commands?
53 | A: Not in scope for this experiment, but a great idea for the future.
54 | Q: Will this require a totally separate implementation vs. upstream? or hook into theirs?
55 | A: We will be integrating directly into the Omnibox, not hooking into the upstream Commander.
56 | Q: Is there an "all" option? Will customers know to use `?` and `>`?
57 | A: We will be working with the omnibox team to clarify the best characters or strings to trigger the DevTools commands.
58 | Q: If this is integrated into the address bar, will they know to type `?` to get help on the commands that are available?
59 | A: We recognize there will be discoverability challenges, and we will be exploring that as we go.
60 | Q: Are we planning to add a toggle or setting in browser settings that enable this feature after the rollout?
61 | A: That could be a future option, but it is not in scope.
62 | Q: Are these commands going to be available for puppeteer and/or playwright?
63 | A: That is out of scope for this project.
64 | Q: Some actions do trigger opening DevTools. Is it in or out of scope to be able to complete actions without opening DevTools?
65 | A: These commands will open DevTools and conduct the requested action. The benefit is that this will be done without the user having to open the DevTools first to speed up their workflow.
66 |
67 | ## Available URLs
68 | * edge://about/
69 | * edge://accessibility/
70 | * edge://appcache-internals/
71 | * edge://application-guard-internals/
72 | * edge://apps/
73 | * edge://autofill-internals/
74 | * edge://blob-internals/
75 | * edge://bluetooth-internals/
76 | * edge://collected-cookies-dialog/
77 | * edge://compat/
78 | * edge://components/
79 | * edge://conflicts/
80 | * edge://conversion-internals/
81 | * edge://crashes/
82 | * edge://credits/
83 | * edge://data-viewer
84 | * edge://device-log/
85 | * edge://discards/
86 | * edge://download-internals/
87 | * edge://downloads/
88 | * edge://edge-dip-internals/
89 | * edge://edge-urls/
90 | * edge://extensions/
91 | * edge://favorites/
92 | * edge://flags/
93 | * edge://floc-internals/
94 | * edge://gcm-internals/
95 | * edge://gpu/
96 | * edge://help/
97 | * edge://histograms/
98 | * edge://history/
99 | * edge://indexeddb-internals/
100 | * edge://inspect/
101 | * edge://interstitials/
102 | * edge://invalidations/
103 | * edge://local-state
104 | * edge://management/
105 | * edge://media-engagement/
106 | * edge://media-internals/
107 | * edge://net-export/
108 | * edge://net-internals/
109 | * edge://network-error/
110 | * edge://newtab/
111 | * edge://ntp-tiles-internals/
112 | * edge://omnibox
113 | * edge://password-manager-internals/
114 | * edge://policy/
115 | * edge://predictors/
116 | * edge://prefs-internals/
117 | * edge://print/
118 | * edge://process-internals/
119 | * edge://push-internals/
120 | * edge://quota-internals/
121 | * edge://sandbox/
122 | * edge://serviceworker-internals/
123 | * edge://settings/
124 | * edge://signin-internals/
125 | * edge://site-engagement/
126 | * edge://sync-internals/
127 | * edge://system/
128 | * edge://terms/
129 | * edge://tracing/
130 | * edge://translate-internals/
131 | * edge://ukm/
132 | * edge://usb-internals/
133 | * edge://user-actions/
134 | * edge://version/
135 | * edge://web-app-internals/
136 | * edge://webrtc-internals/
137 | * edge://webrtc-logs/
138 | * edge://whats-new/
139 |
140 | ## Available commands
141 | * Panel: Show Application
142 | * Panel: Show Console
143 | * Panel: Show Detached Elements
144 | * Panel: Show Elements
145 | * Panel: Show JavaScript Profiler
146 | * Panel: Show Layers
147 | * Panel: Show Lighthouse
148 | * Panel: Show Media
149 | * Panel: Show Memory
150 | * Panel: Show Network Drawer
151 | * Panel: Show Performance
152 | * Panel: Show Security
153 | * Panel: Show Sources
154 | * Panel: Show Welcome
155 | * Drawer: Focus debugger
156 | * Drawer: Show 3D View
157 | * Drawer: Show Animations
158 | * Drawer: Show Changes
159 | * Drawer: Show Console
160 | * Drawer: Show Coverage
161 | * Drawer: Show Developer Resources
162 | * Drawer: Show Issues
163 | * Drawer: Show Memory Inspector
164 | * Drawer: Show Network Console
165 | * Drawer: Show Network conditions
166 | * Drawer: Show Network request blocking
167 | * Drawer: Show Performance monitoring
168 | * Drawer: Show Quick source
169 | * Drawer: Show Rendering
170 | * Drawer: Show Search
171 | * Drawer: Show Sensors
172 | * Drawer: Show WebAudio
173 | * Drawer: Show WebAuthn
174 | * Drawer: Toggle drawer
175 | * Settings: Documentation
176 | * Settings: Settings
177 | * Settings: Shortcuts
178 | * Settings: Show Devices
179 | * Settings: Show Experiments
180 | * Settings: Show Library Code
181 | * Settings: Show Locations
182 | * Settings: Show Preferences
183 | * Settings: Show Shortcuts
184 | * Settings: Show Throttling
185 | * Appearance: Browser UI language
186 | * Appearance: Chinese (Simplified)
187 | * Appearance: Chinese (Traditional)
188 | * Appearance: Do not show Welcome after each update
189 | * Appearance: French
190 | * Appearance: German
191 | * Appearance: Italian
192 | * Appearance: Japanese
193 | * Appearance: Korean
194 | * Appearance: Portuguese
195 | * Appearance: Russian
196 | * Appearance: Set color format to HEX
197 | * Appearance: Set color format to HSL
198 | * Appearance: Set color format to RGB
199 | * Appearance: Spanish
200 | * Appearance: Switch to Abyss theme
201 | * Appearance: Switch to Chromium Dark theme
202 | * Appearance: Switch to Chromium Light theme
203 | * Appearance: Switch to Dark+ (Default) theme
204 | * Appearance: Switch to Kimbie Dark theme
205 | * Appearance: Switch to Light+ (Default) theme
206 | * Appearance: Switch to Monokai Dimmed theme
207 | * Appearance: Switch to Monokai theme
208 | * Appearance: Switch to Quiet Light theme
209 | * Appearance: Switch to Red theme
210 | * Appearance: Switch to Solarized Dark theme
211 | * Appearance: Switch to Solarized Light theme
212 | * Appearance: Switch to system preferred color theme
213 | * Appearance: Use horizontal pane layout
214 | * Appearance: Use vertical pane layout
215 | * Console: Clear console history
216 | * Console: Create live expression
217 | * Console: Do not autocomplete from history
218 | * Console: Do not eagerly evaluate console prompt text
219 | * Console: Do not group similar messages in console
220 | * Console: Do not treat evaluation as user activation
221 | * Console: Hide network messages
222 | * Console: Only show messages from the current context (top, iframe worke…
223 | * Console: Preserve log upon navigation
224 | * Console: Show Console
225 | * Console: Show timestamps
226 | * Debugger: Disable JavaScript
227 | * Debugger: Do not capture async stack traces
228 | * Debugger: Pause on exceptions
229 | * Device Mode: Enable Device Mode
230 | * Elements: Copy styles
231 | * Elements: Disable DOM word wrap
232 | * Elements: Duplicate element
233 | * Elements: Edit as HTML
234 | * Elements: Hide HTML comments
235 | * Elements: Hide element
236 | * Elements: Redo
237 | * Elements: Select an element in the page to inspect it
238 | * Elements: Show Accessibility
239 | * Elements: Show DOM Breakpoints
240 |
--------------------------------------------------------------------------------
 14 |
14 |