 13 |
14 |
--------------------------------------------------------------------------------
/.travis.yml:
--------------------------------------------------------------------------------
1 | language: R
2 | sudo: false
3 | cache: packages
4 | dist: trusty
5 |
6 | before_install:
7 | - sudo apt-get install --yes udunits-bin libproj-dev libgeos-dev libgdal-dev libgdal1-dev libudunits2-dev
8 |
9 | env:
10 | global:
11 | - R_CHECK_ARGS="--timings"
12 |
13 | notifications:
14 | email: false
15 |
16 | r_packages:
17 | - archivist
18 | - DALEX
19 | - ggplot2
20 | - covr
21 |
22 | after_success:
23 | - Rscript -e 'library(covr); codecov()'
24 |
--------------------------------------------------------------------------------
/EIX.Rproj:
--------------------------------------------------------------------------------
1 | Version: 1.0
2 |
3 | RestoreWorkspace: No
4 | SaveWorkspace: No
5 | AlwaysSaveHistory: Default
6 |
7 | EnableCodeIndexing: Yes
8 | UseSpacesForTab: Yes
9 | NumSpacesForTab: 2
10 | Encoding: UTF-8
11 |
12 | RnwWeave: Sweave
13 | LaTeX: pdfLaTeX
14 |
15 | AutoAppendNewline: Yes
16 | StripTrailingWhitespace: Yes
17 |
18 | BuildType: Package
19 | PackageUseDevtools: Yes
20 | PackageInstallArgs: --no-multiarch --with-keep.source
21 | PackageRoxygenize: rd,collate,namespace
22 |
--------------------------------------------------------------------------------
/man/tableOfTrees.Rd:
--------------------------------------------------------------------------------
1 | % Generated by roxygen2: do not edit by hand
2 | % Please edit documentation in R/calculateGain.R
3 | \name{tableOfTrees}
4 | \alias{tableOfTrees}
5 | \title{tableOfTrees}
6 | \usage{
7 | tableOfTrees(model, data)
8 | }
9 | \arguments{
10 | \item{model}{a xgboost or lightgbm model}
11 |
12 | \item{data}{a data table with data used to train the model}
13 | }
14 | \value{
15 | a data table
16 | }
17 | \description{
18 | tableOfTrees
19 | }
20 | \keyword{internal}
21 |
--------------------------------------------------------------------------------
/man/calculateGain.Rd:
--------------------------------------------------------------------------------
1 | % Generated by roxygen2: do not edit by hand
2 | % Please edit documentation in R/calculateGain.R
3 | \name{calculateGain}
4 | \alias{calculateGain}
5 | \title{calculateGain}
6 | \usage{
7 | calculateGain(xgb.model, data)
8 | }
9 | \arguments{
10 | \item{xgb.model}{a xgboost or lightgbm model}
11 |
12 | \item{data}{a data table with data used to train the model}
13 | }
14 | \value{
15 | a list
16 | }
17 | \description{
18 | List of trees with pairs of variable and other needed fields
19 | }
20 | \keyword{internal}
21 |
--------------------------------------------------------------------------------
/R/package.R:
--------------------------------------------------------------------------------
1 | #' EIX package
2 | #'
3 | #' Structure mining from 'XGBoost' and 'LightGBM' models.
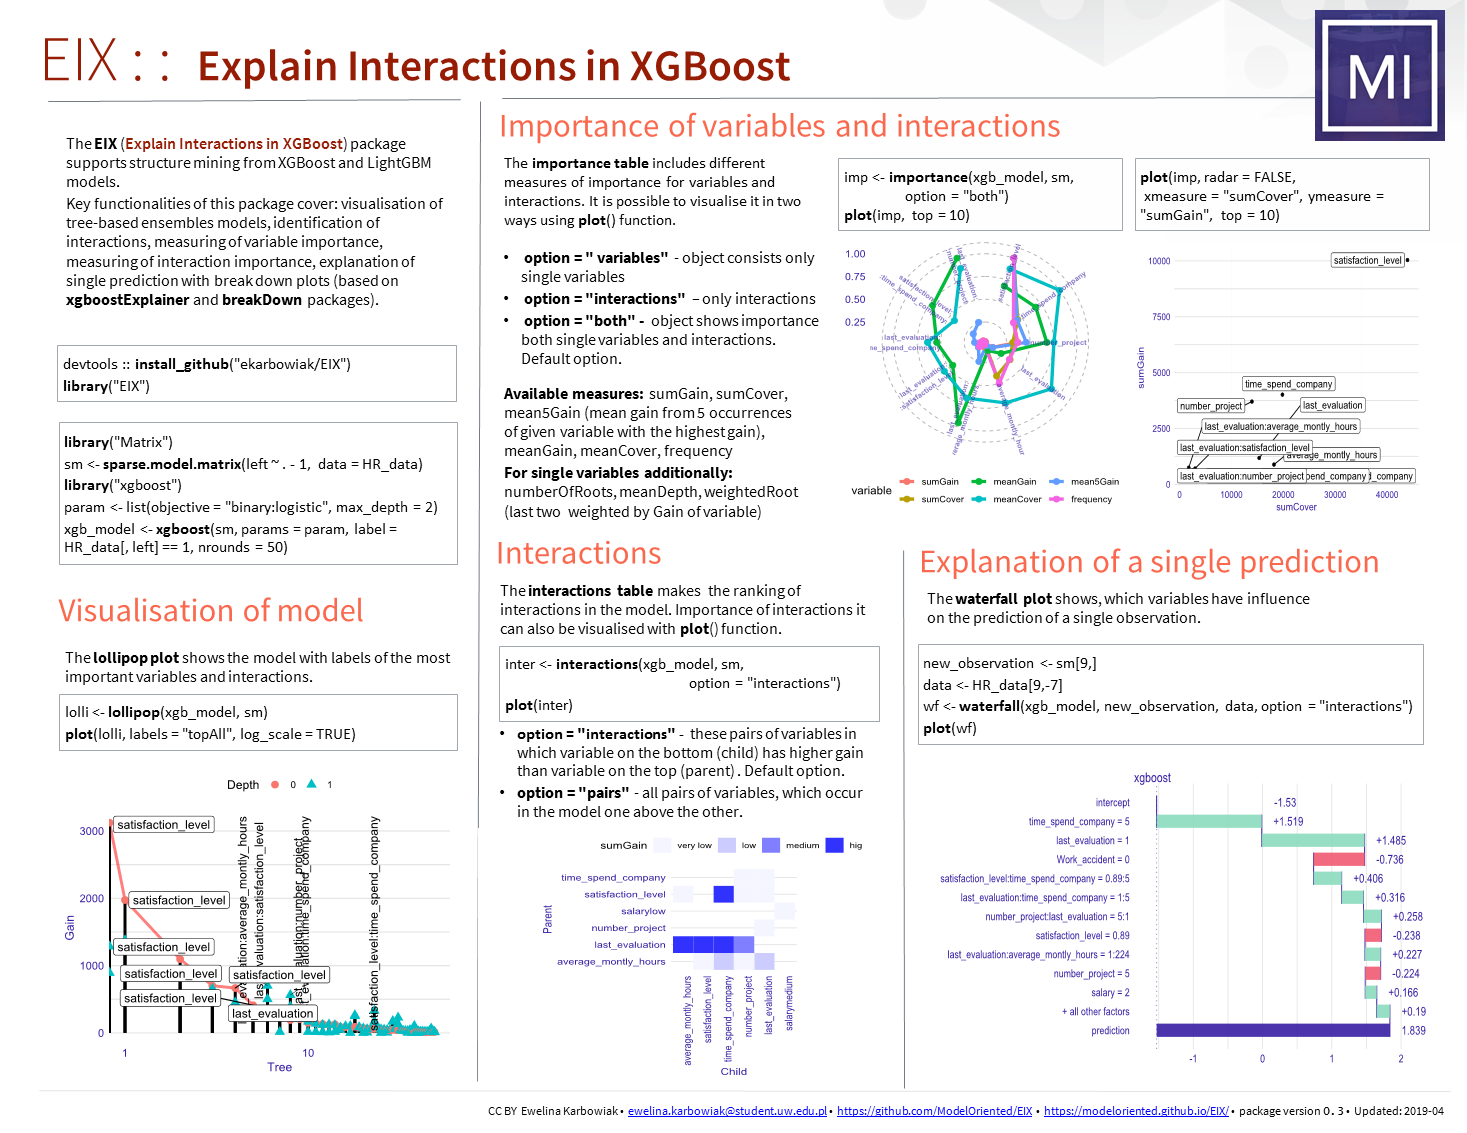
4 | #' Key functionalities of this package cover: visualisation of tree-based ensembles models,
5 | #' identification of interactions, measuring of variable importance,
6 | #' measuring of interaction importance, explanation of single prediction
7 | #' with break down plots (based on 'xgboostExplainer' and 'iBreakDown' packages).
8 | #' To download the 'LightGBM' use the following link:
13 |
14 |
--------------------------------------------------------------------------------
/.travis.yml:
--------------------------------------------------------------------------------
1 | language: R
2 | sudo: false
3 | cache: packages
4 | dist: trusty
5 |
6 | before_install:
7 | - sudo apt-get install --yes udunits-bin libproj-dev libgeos-dev libgdal-dev libgdal1-dev libudunits2-dev
8 |
9 | env:
10 | global:
11 | - R_CHECK_ARGS="--timings"
12 |
13 | notifications:
14 | email: false
15 |
16 | r_packages:
17 | - archivist
18 | - DALEX
19 | - ggplot2
20 | - covr
21 |
22 | after_success:
23 | - Rscript -e 'library(covr); codecov()'
24 |
--------------------------------------------------------------------------------
/EIX.Rproj:
--------------------------------------------------------------------------------
1 | Version: 1.0
2 |
3 | RestoreWorkspace: No
4 | SaveWorkspace: No
5 | AlwaysSaveHistory: Default
6 |
7 | EnableCodeIndexing: Yes
8 | UseSpacesForTab: Yes
9 | NumSpacesForTab: 2
10 | Encoding: UTF-8
11 |
12 | RnwWeave: Sweave
13 | LaTeX: pdfLaTeX
14 |
15 | AutoAppendNewline: Yes
16 | StripTrailingWhitespace: Yes
17 |
18 | BuildType: Package
19 | PackageUseDevtools: Yes
20 | PackageInstallArgs: --no-multiarch --with-keep.source
21 | PackageRoxygenize: rd,collate,namespace
22 |
--------------------------------------------------------------------------------
/man/tableOfTrees.Rd:
--------------------------------------------------------------------------------
1 | % Generated by roxygen2: do not edit by hand
2 | % Please edit documentation in R/calculateGain.R
3 | \name{tableOfTrees}
4 | \alias{tableOfTrees}
5 | \title{tableOfTrees}
6 | \usage{
7 | tableOfTrees(model, data)
8 | }
9 | \arguments{
10 | \item{model}{a xgboost or lightgbm model}
11 |
12 | \item{data}{a data table with data used to train the model}
13 | }
14 | \value{
15 | a data table
16 | }
17 | \description{
18 | tableOfTrees
19 | }
20 | \keyword{internal}
21 |
--------------------------------------------------------------------------------
/man/calculateGain.Rd:
--------------------------------------------------------------------------------
1 | % Generated by roxygen2: do not edit by hand
2 | % Please edit documentation in R/calculateGain.R
3 | \name{calculateGain}
4 | \alias{calculateGain}
5 | \title{calculateGain}
6 | \usage{
7 | calculateGain(xgb.model, data)
8 | }
9 | \arguments{
10 | \item{xgb.model}{a xgboost or lightgbm model}
11 |
12 | \item{data}{a data table with data used to train the model}
13 | }
14 | \value{
15 | a list
16 | }
17 | \description{
18 | List of trees with pairs of variable and other needed fields
19 | }
20 | \keyword{internal}
21 |
--------------------------------------------------------------------------------
/R/package.R:
--------------------------------------------------------------------------------
1 | #' EIX package
2 | #'
3 | #' Structure mining from 'XGBoost' and 'LightGBM' models.
4 | #' Key functionalities of this package cover: visualisation of tree-based ensembles models,
5 | #' identification of interactions, measuring of variable importance,
6 | #' measuring of interaction importance, explanation of single prediction
7 | #' with break down plots (based on 'xgboostExplainer' and 'iBreakDown' packages).
8 | #' To download the 'LightGBM' use the following link: Authors
100 |-
102 |
-
103 |
Ewelina Karbowiak. Author, maintainer. 104 |
105 |
106 | -
107 |
Przemyslaw Biecek. Author, thesis advisor. 108 |
109 |
110 |
Articles
100 |All vignettes
104 | 105 | 106 |-
107 |
- EIX: Explain Interactions in XGBoost 108 |
- EIX: Titanic data 109 |
tableOfTrees
100 |tableOfTrees
104 | 105 | 106 |tableOfTrees(model, data)107 | 108 |
Arguments
109 || model | 113 |a xgboost or lightgbm model |
114 |
|---|---|
| data | 117 |a data table with data used to train the model |
118 |
Value
122 | 123 |a data table
124 | 125 | 126 |calculateGain
100 |List of trees with pairs of variable and other needed fields
104 | 105 | 106 |calculateGain(xgb.model, data)107 | 108 |
Arguments
109 || xgb.model | 113 |a xgboost or lightgbm model |
114 |
|---|---|
| data | 117 |a data table with data used to train the model |
118 |
Value
122 | 123 |a list
124 | 125 | 126 |79 | EIX - Explain Interactions in Xgboost
80 |A set of tools to explain XGBoost and LightGBM models.
81 |84 | Installation
85 |Install from GitHub
86 |devtools::install_github("ModelOriented/EIX")Links
104 |-
105 |
- Browse source code at
https://github.com/ModelOriented/EIX 106 |
107 | - Report a bug at
https://github.com/ModelOriented/EIX/issues 108 |
109 |
License
113 |-
114 |
- GPL-2 115 |
Developers
119 |-
120 |
- Ewelina Karbowiak
Author, maintainer
121 | - Przemyslaw Biecek
Author, thesis advisor
122 |
Why are our best and most experienced employees leaving prematurely?
100 |A dataset from Kaggle competition Human Resources Analytics. 104 | https://www.kaggle.com/ludobenistant/hr-analytics/data
105 | 106 | 107 | 108 |Format
109 | 110 |A data table with 14999 rows and 10 variables
111 | 112 |Source
113 | 114 |https://www.kaggle.com/ludobenistant/hr-analytics/data, https://cran.r-project.org/package=breakDown
115 | 116 |Details
117 | 118 |The description of the dataset was copied from the breakDown package.
-
120 |
satisfaction_level Level of satisfaction (0-1)
121 | last_evaluation Time since last performance evaluation (in Years)
122 | number_project Number of projects completed while at work
123 | average_montly_hours Average monthly hours at workplace
124 | time_spend_company Number of years spent in the company
125 | Work_accident Whether the employee had a workplace accident
126 | left Whether the employee left the workplace or not (1 or 0) Factor
127 | promotion_last_5years Whether the employee was promoted in the last five years
128 | sales Department in which they work for
129 | salary Relative level of salary (high)
130 |
100 | Reference 101 | version 1.0 102 |
103 |Passengers and Crew on the RMS Titanic
95 |The titanic data is a complete list of passengers and crew members on the RMS Titanic.
99 | It includes a variable indicating whether a person did survive the sinking of the RMS
100 | Titanic on April 15, 1912.
data(titanic)104 | 105 |
Format
106 | 107 |a data frame with 2207 rows and 11 columns
108 | 109 |Source
110 | 111 |The description of dataset was copied from the DALEX package.
112 | This dataset was copied from the stablelearner package and went through few variable
113 | transformations. The complete list of persons on the RMS titanic was downloaded from
114 | https://www.encyclopedia-titanica.org on April 5, 2016. The information given
115 | in sibsp and parch was adopoted from a data set obtained from http://biostat.mc.vanderbilt.edu/DataSets.
Details
118 | 119 |The description of the dataset was copied from the DALEX package.
This dataset was copied from the stablelearner package and went through few variable
121 | transformations. Levels in embarked was replaced with full names, sibsp, parch and fare
122 | were converted to numerical variables and values for crew were replaced with 0.
123 | If you use this dataset please cite the original package.
From stablelearner: The website https://www.encyclopedia-titanica.org offers detailed information about passengers and crew
125 | members on the RMS Titanic. According to the website 1317 passengers and 890 crew member were abord.
126 | 8 musicians and 9 employees of the shipyard company are listed as passengers, but travelled with a
127 | free ticket, which is why they have NA values in fare. In addition to that, fare
128 | is truely missing for a few regular passengers.
-
130 |
gender a factor with levels
maleandfemale.
131 | age a numeric value with the persons age on the day of the sinking.
132 | class a factor specifying the class for passengers or the type of service aboard for crew members.
133 | embarked a factor with the persons place of of embarkment (Belfast/Cherbourg/Queenstown/Southampton).
134 | country a factor with the persons home country.
135 | fare a numeric value with the ticket price (
0for crew members, musicians and employees of the shipyard company).
136 | sibsp an ordered factor specifying the number if siblings/spouses aboard; adopted from Vanderbild data set (see below).
137 | parch an ordered factor specifying the number of parents/children aboard; adopted from Vanderbild data set (see below).
138 | survived a factor with two levels (
noandyes) specifying whether the person has survived the sinking.
139 |
References
142 | 143 |https://www.encyclopedia-titanica.org, http://biostat.mc.vanderbilt.edu/DataSets, 144 | https://CRAN.R-project.org/package=stablelearner, https://cran.r-project.org/web/packages/DALEX/index.html.
145 | 146 | 147 |Passengers and Crew on the RMS Titanic
100 |The titanic data is a complete list of passengers and crew members on the RMS Titanic.
104 | It includes a variable indicating whether a person did survive the sinking of the RMS
105 | Titanic on April 15, 1912.
data(titanic_data)109 | 110 |
Format
111 | 112 |a data frame with 2207 rows and 11 columns
113 | 114 |Source
115 | 116 |The description of dataset was copied from the DALEX package.
117 | This dataset was copied from the stablelearner package and went through few variable
118 | transformations. The complete list of persons on the RMS titanic was downloaded from
119 | https://www.encyclopedia-titanica.org on April 5, 2016. The information given
120 | in sibsp and parch was adopoted from a data set obtained from http://biostat.mc.vanderbilt.edu/DataSets.
Details
123 | 124 |The description of the dataset was copied from the DALEX package.
This dataset was copied from the stablelearner package and went through few variable
126 | transformations. Levels in embarked was replaced with full names, sibsp, parch and fare
127 | were converted to numerical variables and values for crew were replaced with 0.
128 | If you use this dataset please cite the original package.
From stablelearner: The website https://www.encyclopedia-titanica.org offers detailed information about passengers and crew
130 | members on the RMS Titanic. According to the website 1317 passengers and 890 crew member were abord.
131 | 8 musicians and 9 employees of the shipyard company are listed as passengers, but travelled with a
132 | free ticket, which is why they have NA values in fare. In addition to that, fare
133 | is truely missing for a few regular passengers.
-
135 |
gender a factor with levels
maleandfemale.
136 | age a numeric value with the persons age on the day of the sinking.
137 | class a factor specifying the class for passengers or the type of service aboard for crew members.
138 | embarked a factor with the persons place of of embarkment (Belfast/Cherbourg/Queenstown/Southampton).
139 | country a factor with the persons home country.
140 | fare a numeric value with the ticket price (
0for crew members, musicians and employees of the shipyard company).
141 | sibsp an ordered factor specifying the number if siblings/spouses aboard; adopted from Vanderbild data set (see below).
142 | parch an ordered factor specifying the number of parents/children aboard; adopted from Vanderbild data set (see below).
143 | survived a factor with two levels (
noandyes) specifying whether the person has survived the sinking.
144 |
References
147 | 148 |https://www.encyclopedia-titanica.org, http://biostat.mc.vanderbilt.edu/DataSets, 149 | https://CRAN.R-project.org/package=stablelearner, https://cran.r-project.org/package=DALEX.
150 | 151 | 152 |Table of occurancess number
107 | 108 |countPairs.RdTable containing occurancess number of variables' pairs in the model.
114 | 115 |countPairs(xgb.model, data)118 | 119 |
Arguments
120 || xgb.model | 124 |a xgboost or lightgbm model |
125 |
|---|---|
| data | 128 |a data table with data used to train the model |
129 |
Value
133 | 134 |a data table
135 | 136 | 137 |Examples
138 |148 |#> Warning: pakiet 'Matrix' został zbudowany w wersji R 3.4.4library("data.table")#> Warning: pakiet 'data.table' został zbudowany w wersji R 3.4.4library("xgboost")#> Warning: pakiet 'xgboost' został zbudowany w wersji R 3.4.4140 | dt_HR <- data.table(HR_data) 141 | sm <- sparse.model.matrix(left ~ . - 1, data = dt_HR) 142 | 143 | param <- list(objective = "binary:logistic", base_score = 0.5, max_depth = 2) 144 | xgb.model <- xgboost( param = param, data = sm, label = dt_HR[, left] == 1, nrounds = 50, verbose = FALSE) 145 | 146 | countPairs(xgb.model, sm)#> Error in countPairs(xgb.model, sm): nie udało się znaleźć funkcji 'countPairs'147 |
Tables needed for lollipop plot
100 |This function calculates two tables needed to generate lollipop plot, which visualise the model. 104 | The first table contains information about all nodes in the trees forming a model. 105 | It includes gain value, depth and ID of each nodes. 106 | The second table contains similarly information about roots in the trees.
107 | 108 | 109 |lollipop(xgb_model, data)110 | 111 |
Arguments
112 || xgb_model | 116 |a xgboost or lightgbm model. |
117 |
|---|---|
| data | 120 |a data table with data used to train the model. |
121 |
Value
125 | 126 |an object of the lollipop class
127 | 128 | 129 |Examples
130 |149 |library("EIX") 131 | library("Matrix") 132 | sm <- sparse.model.matrix(left ~ . - 1, data = HR_data) 133 | 134 | library("xgboost") 135 | param <- list(objective = "binary:logistic", max_depth = 2) 136 | xgb_model <- xgboost(sm, params = param, label = HR_data[, left] == 1, nrounds = 25, verbose = 0) 137 | 138 | lolli <- lollipop(xgb_model, sm) 139 | plot(lolli, labels = "topAll", log_scale = TRUE)140 |library(lightgbm) 141 | train_data <- lgb.Dataset(sm, label = HR_data[, left] == 1) 142 | params <- list(objective = "binary", max_depth = 2) 143 | lgb_model <- lgb.train(params, train_data, 25) 144 | 145 | lolli <- lollipop(lgb_model, sm) 146 | plot(lolli, labels = "topAll", log_scale = TRUE)147 |148 |


Tables needed for lollipop plot
80 |This function calculates two tables needed to generate lollipop plot, which visualise the model. 84 | The first table contains information about all nodes in the trees forming a model. 85 | It includes gain value, depth and ID of each nodes. 86 | The second table contains similarly information about roots in the trees.
87 | 88 | 89 |EIX_lollipop(xgb.model, data)90 | 91 |
Arguments
92 || xgb.model | 96 |a xgboost or lightgbm model. |
97 |
|---|---|
| data | 100 |a data table with data used to train the model. |
101 |
Value
105 | 106 |an object of the lollipop class
107 | 108 | 109 |Examples
110 |167 |#> Warning: pakiet 'Matrix' został zbudowany w wersji R 3.4.4#> Warning: pakiet 'xgboost' został zbudowany w wersji R 3.4.4param <- list(objective = "binary:logistic", max_depth = 2) 114 | xgb.model <- xgboost(sm, params = param, label = HR_data[, left] == 1, nrounds = 50)#> [1] train-error:0.150077 115 | #> [2] train-error:0.098007 116 | #> [3] train-error:0.098007 117 | #> [4] train-error:0.098007 118 | #> [5] train-error:0.098007 119 | #> [6] train-error:0.098007 120 | #> [7] train-error:0.098007 121 | #> [8] train-error:0.095873 122 | #> [9] train-error:0.095873 123 | #> [10] train-error:0.095606 124 | #> [11] train-error:0.095473 125 | #> [12] train-error:0.093406 126 | #> [13] train-error:0.061271 127 | #> [14] train-error:0.059404 128 | #> [15] train-error:0.055137 129 | #> [16] train-error:0.063271 130 | #> [17] train-error:0.043070 131 | #> [18] train-error:0.042670 132 | #> [19] train-error:0.039203 133 | #> [20] train-error:0.038536 134 | #> [21] train-error:0.037669 135 | #> [22] train-error:0.037869 136 | #> [23] train-error:0.036802 137 | #> [24] train-error:0.037336 138 | #> [25] train-error:0.036602 139 | #> [26] train-error:0.036402 140 | #> [27] train-error:0.036669 141 | #> [28] train-error:0.035802 142 | #> [29] train-error:0.035402 143 | #> [30] train-error:0.032202 144 | #> [31] train-error:0.031869 145 | #> [32] train-error:0.031469 146 | #> [33] train-error:0.030935 147 | #> [34] train-error:0.030602 148 | #> [35] train-error:0.030269 149 | #> [36] train-error:0.029402 150 | #> [37] train-error:0.029269 151 | #> [38] train-error:0.028802 152 | #> [39] train-error:0.028802 153 | #> [40] train-error:0.028535 154 | #> [41] train-error:0.028269 155 | #> [42] train-error:0.028202 156 | #> [43] train-error:0.027935 157 | #> [44] train-error:0.027669 158 | #> [45] train-error:0.027669 159 | #> [46] train-error:0.027402 160 | #> [47] train-error:0.028269 161 | #> [48] train-error:0.027268 162 | #> [49] train-error:0.026668 163 | #> [50] train-error:0.026335#> Warning: Transformation introduced infinite values in continuous x-axis#> Warning: Transformation introduced infinite values in continuous x-axis#> Warning: Transformation introduced infinite values in continuous x-axis#> Warning: Transformation introduced infinite values in continuous x-axis#> Warning: Transformation introduced infinite values in continuous x-axis#> Warning: Transformation introduced infinite values in continuous x-axis#> Warning: Removed 7 rows containing missing values (geom_text_repel).166 |

Visualiation of the model
100 |The lollipop plots the model with the most important interactions and variables in the roots.
104 | 105 | 106 |# S3 method for lollipop 107 | plot(x, ..., labels = "topAll", log_scale = TRUE, 108 | threshold = 0.1)109 | 110 |
Arguments
111 || x | 115 |a result from the |
116 |
|---|---|
| ... | 119 |other parameters. |
120 |
| labels | 123 |if "topAll" then labels for the most important interactions (vertical label) 124 | and variables in the roots (horizontal label) will be displayed, 125 | if "interactions" then labels for all interactions, 126 | if "roots" then labels for all variables in the root. |
127 |
| log_scale | 130 |TRUE/FALSE logarithmic scale on the plot. Default TRUE. |
131 |
| threshold | 134 |on the plot will occur only labels with Gain higher than `threshold` of the max Gain value in the model. 135 | The lower threshold, the more labels on the plot. Range from 0 to 1. Default 0.1. |
136 |
Value
140 | 141 |a ggplot object
142 | 143 | 144 |Examples
145 |163 |library("EIX") 146 | library("Matrix") 147 | sm <- sparse.model.matrix(left ~ . - 1, data = HR_data) 148 | 149 | library("xgboost") 150 | param <- list(objective = "binary:logistic", max_depth = 2) 151 | xgb_model <- xgboost(sm, params = param, label = HR_data[, left] == 1, nrounds = 25, verbose = 0) 152 | 153 | lolli <- lollipop(xgb_model, sm) 154 | plot(lolli, labels = "topAll", log_scale = TRUE)155 |library(lightgbm) 156 | train_data <- lgb.Dataset(sm, label = HR_data[, left] == 1) 157 | params <- list(objective = "binary", max_depth = 3) 158 | lgb_model <- lgb.train(params, train_data, 25) 159 | 160 | lolli <- lollipop(lgb_model, sm) 161 | plot(lolli, labels = "topAll", log_scale = TRUE)162 |


Explain prediction of a single observation
100 |This function calculates a table with influence of variables and interactions 104 | on the prediction of a given observation. It supports only xgboost models.
105 | 106 | 107 |waterfall(xgb_model, new_observation, data, type = "binary", 108 | option = "interactions", baseline = 0)109 | 110 |
Arguments
111 || xgb_model | 115 |a xgboost model. |
116 |
|---|---|
| new_observation | 119 |a new observation. |
120 |
| data | 123 |row from the original dataset with the new observation to explain (not one-hot-encoded).
124 | The param above has to be set to merge categorical features.
125 | If you dont wont to merge categorical features, set this parameter the same as |
126 |
| type | 129 |the learning task of the model. Available tasks: "binary" for binary classification or "regression" for linear regression. |
130 |
| option | 133 |if "variables", the plot includes only single variables, 134 | if "interactions", then only interactions. 135 | Default "interaction". |
136 |
| baseline | 139 |a number or a character "Intercept" (for model intercept). 140 | The baseline for the plot, where the rectangles should start. 141 | Default 0. |
142 |
Value
146 | 147 |an object of the broken class
148 | 149 |Details
150 | 151 |The function contains code or pieces of code
152 | from breakDown code created by Przemysław Biecek
153 | and xgboostExplainer code created by David Foster.
Examples
157 |188 |158 |library("EIX") 159 | library("Matrix") 160 | sm <- sparse.model.matrix(left ~ . - 1, data = HR_data) 161 | 162 | library("xgboost") 163 | param <- list(objective = "binary:logistic", max_depth = 2) 164 | xgb_model <- xgboost(sm, params = param, label = HR_data[, left] == 1, nrounds = 25, verbose=0) 165 | 166 | data <- HR_data[9,-7] 167 | new_observation <- sm[9,] 168 | 169 | wf <- waterfall(xgb_model, new_observation, data, option = "interactions") 170 | wf#> contribution 171 | #> xgboost: intercept -1.492 172 | #> xgboost: time_spend_company = 5 1.360 173 | #> xgboost: last_evaluation = 1 1.093 174 | #> xgboost: Work_accident = 0 -0.423 175 | #> xgboost: satisfaction_level = 0.89 -0.390 176 | #> xgboost: last_evaluation:time_spend_company = 1:5 0.297 177 | #> xgboost: last_evaluation:average_montly_hours = 1:224 0.227 178 | #> xgboost: satisfaction_level:time_spend_company = 0.89:5 0.223 179 | #> xgboost: number_project = 5 -0.211 180 | #> xgboost: average_montly_hours:last_evaluation = 224:1 -0.156 181 | #> xgboost: average_montly_hours = 224 -0.096 182 | #> xgboost: time_spend_company:last_evaluation = 5:1 0.095 183 | #> xgboost: salary = 2 0.074 184 | #> xgboost: satisfaction_level:number_project = 0.89:5 -0.003 185 | #> xgboost: prediction 0.597186 | plot(wf)187 |
