├── .gitignore
├── README.md
├── bower.json
├── css
└── style.css
├── examples.png
├── js
└── lib.js
└── test
├── test.html
└── test.js
/.gitignore:
--------------------------------------------------------------------------------
1 | node_modules
2 | bower_components
3 | */.DS_Store
4 | plot.html
--------------------------------------------------------------------------------
/README.md:
--------------------------------------------------------------------------------
1 | D3xter
2 | ======
3 | 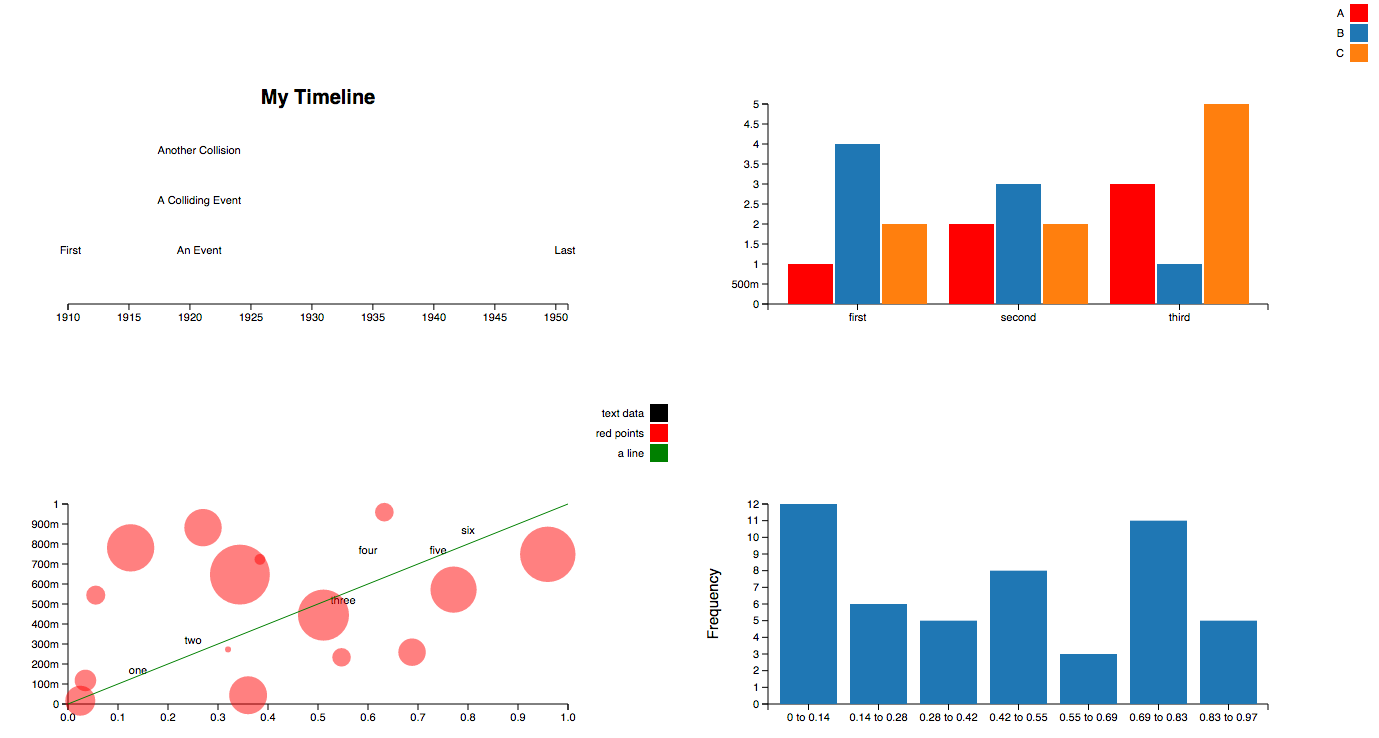
4 |
5 | ## About
6 |
7 | - Simple and powerful syntax to make common charts with minimal code.
8 | - Highly flexible plotting for deep customization.
9 | - Sensible defaults but easy to configure when desired.
10 | - Easily extendable via familiar D3.js syntax.
11 |
12 | ## Install
13 |
14 | `bower install d3xter`
15 |
16 | ## Documentation
17 |
18 | For full documentation complete with examples, visit this page.
19 |
20 | ## Testing and Contribution
21 |
22 | Run unit tests by opening test/test.html in the browser.
23 |
24 | Pull requests welcome!
25 |
26 | ## License
27 |
28 | **The MIT License (MIT)**
29 |
30 | > Copyright (c) 2014 Nathan Epstein
31 | >
32 | > Permission is hereby granted, free of charge, to any person obtaining a copy
33 | > of this software and associated documentation files (the "Software"), to deal
34 | > in the Software without restriction, including without limitation the rights
35 | > to use, copy, modify, merge, publish, distribute, sublicense, and/or sell
36 | > copies of the Software, and to permit persons to whom the Software is
37 | > furnished to do so, subject to the following conditions:
38 | >
39 | > The above copyright notice and this permission notice shall be included in
40 | > all copies or substantial portions of the Software.
41 | >
42 | > THE SOFTWARE IS PROVIDED "AS IS", WITHOUT WARRANTY OF ANY KIND, EXPRESS OR
43 | > IMPLIED, INCLUDING BUT NOT LIMITED TO THE WARRANTIES OF MERCHANTABILITY,
44 | > FITNESS FOR A PARTICULAR PURPOSE AND NONINFRINGEMENT. IN NO EVENT SHALL THE
45 | > AUTHORS OR COPYRIGHT HOLDERS BE LIABLE FOR ANY CLAIM, DAMAGES OR OTHER
46 | > LIABILITY, WHETHER IN AN ACTION OF CONTRACT, TORT OR OTHERWISE, ARISING FROM,
47 | > OUT OF OR IN CONNECTION WITH THE SOFTWARE OR THE USE OR OTHER DEALINGS IN
48 | > THE SOFTWARE.
49 |
50 |
51 |
52 |
53 |
54 |
55 |
56 |
--------------------------------------------------------------------------------
/bower.json:
--------------------------------------------------------------------------------
1 | {
2 | "name": "d3xter",
3 | "version": "2.0.2",
4 | "homepage": "https://github.com/NathanEpstein/D3xter",
5 | "authors": [
6 | "Nathan Epstein (ne2210@columbia.edu)"
7 | ],
8 | "description": "D3 wrapper for simply creating standard charts",
9 | "main": "js/lib.js",
10 | "keywords": [
11 | "D3",
12 | "Plotting",
13 | "Chart",
14 | "Histogram",
15 | "Scatterplot",
16 | "Graphs",
17 | "Bubbleplot"
18 | ],
19 | "license": "MIT",
20 | "dependencies": {
21 | "d3": "~3.4.13",
22 | "mocha": "~2.0.1",
23 | "assert": "https://github.com/Jxck/assert",
24 | "chai": "~1.9.2"
25 | },
26 | "devDependencies": {
27 | "mocha": "~2.0.1"
28 | }
29 | }
30 |
--------------------------------------------------------------------------------
/css/style.css:
--------------------------------------------------------------------------------
1 | svg .tick line, svg .domain {
2 | fill: none;
3 | stroke: black;
4 | }
5 |
6 | svg .title {
7 | font-size: 20;
8 | font-weight: bold;
9 | }
10 |
11 | svg .label {
12 | font-size: 15;
13 | }
14 |
15 | svg text {
16 | font-family: sans-serif;
17 | font-size: 11px;
18 | stroke: none;
19 | }
20 |
--------------------------------------------------------------------------------
/examples.png:
--------------------------------------------------------------------------------
https://raw.githubusercontent.com/NathanEpstein/D3xter/4030bdce6ba38641b2a9021975d7a653ae129988/examples.png
--------------------------------------------------------------------------------
/js/lib.js:
--------------------------------------------------------------------------------
1 | function D3xter(config) {
2 | var self = this,
3 | config = config || {};
4 |
5 | var height = config.height || 500,
6 | width = config.width || 700,
7 | margin = {
8 | top: 100,
9 | bottom: 100,
10 | left: 100,
11 | right: 100
12 | },
13 | innerHeight = height - margin.top - margin.bottom,
14 | innerWidth = width - margin.left - margin.right;
15 |
16 | self.plot = function(input) {
17 | buildPlot(input);
18 | renderPlot(input.datasets);
19 |
20 | return self;
21 | };
22 |
23 | self.pie = function(input) {
24 | buildPie(input);
25 | renderPie(input);
26 |
27 | return self;
28 | };
29 |
30 | self.bar = function(input) {
31 | buildBar(input);
32 | renderBar(input);
33 |
34 | return self;
35 | };
36 |
37 | self.hist = function(dataset) {
38 | var histData = buildHist(dataset);
39 |
40 | return self.bar({
41 | groups: histData.bins.map(function(bin) { return round2(bin) }),
42 | datasets: [ { values: histData.values } ]
43 | });
44 | };
45 |
46 | self.timeline = function(events) {
47 | var formattedEvents = formatEvents(events);
48 | buildTimeline(formattedEvents);
49 | renderTimeline(formattedEvents);
50 |
51 | return self;
52 | };
53 |
54 | function buildCanvas() {
55 | self.canvas = d3.select(config.selector || 'body')
56 | .append('svg')
57 | .attr('height', height)
58 | .attr('width', width);
59 | };
60 |
61 | function buildXMap(datasets) {
62 | var values = datasets.map(function(d) { return d.x }).reduce(function(a, b) { return a.concat(b) });
63 | var ordinalValues = (typeof values[0] == 'string');
64 |
65 | if (ordinalValues) {
66 | var xDomain = getUniqueValues(values);
67 | self.xMap = d3.scale.ordinal()
68 | .domain(xDomain)
69 | .rangePoints([margin.left, width - margin.right]);
70 | }
71 | else {
72 | var xDomain = getBoundaries(values);
73 | self.xMap = d3.scale.linear()
74 | .domain(xDomain)
75 | .range([margin.left, width - margin.right]);
76 | };
77 | };
78 |
79 | function buildYMap(datasets) {
80 | var values = datasets.map(
81 | function(d) { return d.y }
82 | ).reduce(function(a, b) { return a.concat(b) }, []);
83 |
84 | var yDomain = getBoundaries(values);
85 | self.yMap = d3.scale.linear()
86 | .domain(yDomain)
87 | .range([height - margin.bottom, margin.top]);
88 | };
89 |
90 | function buildZMap(datasets) {
91 | var basePointSize = 3;
92 | var values = datasets.map(function(d) { return d.z })
93 | .reduce(function(a, b) { return a.concat(b) }, [])
94 | .filter(function(a) { return (typeof a !== 'undefined') });
95 |
96 | if (values.length == 0) {
97 | self.zMap = function() { return basePointSize };
98 | }
99 | else {
100 | var zDomain = getBoundaries(values);
101 | self.zMap = function(value) {
102 | if (typeof value === 'undefined') return basePointSize;
103 | sizeBonus = 9 * (value - zDomain[0]) / (zDomain[1] - zDomain[0]);
104 | return basePointSize * (1 + sizeBonus);
105 | };
106 | };
107 | };
108 |
109 | function buildXAxis() {
110 | var xAxis = d3.svg.axis()
111 | .scale(self.xMap);
112 |
113 | self.canvas.append('g')
114 | .attr('transform','translate(0,' + (height - margin.bottom) + ')')
115 | .call(xAxis)
116 | .selectAll('text')
117 | .style("text-anchor", "end")
118 | .attr("dx", "-.8em")
119 | .attr("dy", "-0.5em")
120 | .attr("transform", "rotate(-90)" );
121 | };
122 |
123 | function buildYAxis() {
124 | var yAxis = d3.svg.axis()
125 | .tickFormat(d3.format('s'))
126 | .scale(self.yMap)
127 | .orient('left');
128 |
129 | self.canvas.append('g')
130 | .attr('transform','translate(' + margin.left + ', 0)')
131 | .call(yAxis);
132 | };
133 |
134 | function buildAxes() {
135 | buildXAxis();
136 | buildYAxis();
137 | };
138 |
139 | function buildLabels() {
140 | var xLabel = self.canvas.append('text')
141 | .attr('x', margin.left + innerWidth / 2)
142 | .attr('y', margin.top + innerHeight + margin.bottom / 2)
143 | .text(config.xLab)
144 | .attr('text-anchor', 'middle')
145 | .attr('class', 'label');
146 |
147 | var yLabel = self.canvas.append('text')
148 | .attr('x', - (margin.top + innerHeight / 2))
149 | .attr('y', margin.left / 2)
150 | .attr('transform', 'rotate(-90)')
151 | .text(config.yLab)
152 | .attr('text-anchor', 'middle')
153 | .attr('class', 'label');
154 |
155 | var title = self.canvas.append('text')
156 | .attr('x', margin.left + innerWidth / 2)
157 | .attr('y', margin.top / 2)
158 | .text(config.title)
159 | .attr('text-anchor', 'middle')
160 | .attr('class', 'title');
161 | };
162 |
163 | function buildPlot(input) {
164 | buildCanvas();
165 | buildXMap(input.datasets);
166 | buildYMap(input.datasets);
167 | buildZMap(input.datasets);
168 | buildAxes();
169 | buildLabels();
170 | buildLegend(input.datasets, input.labels);
171 | };
172 |
173 | function buildLegend(datasets, labels) {
174 | if (typeof labels === 'undefined' || config.legend == false) return;
175 |
176 | var colors = parseColors(datasets);
177 |
178 | var legend = self.canvas.append("g")
179 | .attr("class", "legend");
180 |
181 | colors.forEach(function(color, index) {
182 | legend.append("rect")
183 | .attr("x", width - 18)
184 | .attr("y", index * 20)
185 | .attr("width", 18)
186 | .attr("height", 18)
187 | .style("fill", color);
188 |
189 | legend.append("text")
190 | .attr("x", width - 24)
191 | .attr("y", index * 20 + 9)
192 | .attr("dy", ".35em")
193 | .style("text-anchor", "end")
194 | .text(labels[index]);
195 | });
196 | };
197 |
198 | function buildBar(input) {
199 | var structuredData = [
200 | {
201 | x: input.groups.map(String),
202 | y: input.datasets
203 | .map(function(dataset) { return dataset.values })
204 | .reduce(function(a, b) { return a.concat(b) }, [])
205 | .concat([0])
206 | }
207 | ];
208 |
209 | buildCanvas();
210 | buildYMap(structuredData);
211 | buildXMapBar(input);
212 | buildAxes();
213 | buildLabels();
214 | buildLegend(input.datasets, input.labels);
215 | };
216 |
217 | function buildXMapBar(input) {
218 | var datasetIndexes = input.datasets.map(function(dataset, index) { return index });
219 |
220 | self.xMap = d3.scale.ordinal()
221 | .domain(input.groups)
222 | .rangeRoundBands([margin.left, width - margin.right], .1);
223 |
224 | self.innerXMap = d3.scale.ordinal()
225 | .domain(datasetIndexes)
226 | .rangeRoundBands([0, self.xMap.rangeBand()], .05);
227 | };
228 |
229 | function buildHist(dataset) {
230 | var domain = getBoundaries(dataset),
231 | binCount = Math.round(Math.sqrt(dataset.length)),
232 | binSize = (domain[1] - domain[0]) / binCount,
233 | bins = [],
234 | values = [];
235 |
236 | for (var i = 0; i < binCount; i++) {
237 | bins.push(domain[0] + i * binSize);
238 | values.push(0);
239 | };
240 |
241 | dataset.forEach(function(value) { values[bindex(bins, value)] += 1 });
242 |
243 | return {
244 | binSize: binSize,
245 | bins: bins,
246 | values: values
247 | };
248 | };
249 |
250 | function buildArcs(input) {
251 | var radius = Math.min(innerWidth, innerHeight) / 2;
252 |
253 | self.arc = d3.svg.arc()
254 | .outerRadius(radius - 10)
255 | .innerRadius(0);
256 |
257 | var pie = d3.layout.pie()
258 | .sort(null)
259 | .value(function(d) { return d });
260 |
261 | self.arcGroup = self.canvas.selectAll('.arc')
262 | .data(pie(input.values))
263 | .enter().append('g')
264 | .attr('class', 'arc');
265 | };
266 |
267 | function buildPie(input) {
268 | buildCanvas();
269 | buildLabels();
270 | buildArcs(input);
271 | buildLegend(input.values, input.labels);
272 | };
273 |
274 | function buildYMapTimeline(maxFreq) {
275 | self.yMap = d3.scale.linear()
276 | .domain([0, maxFreq])
277 | .range([height - margin.bottom, margin.top]);
278 | };
279 |
280 | function buildXMapTimeline(formattedEvents) {
281 | var sortedDates = Object.keys(formattedEvents).sort(function(a, b) {
282 | return Date.parse(a) - Date.parse(b);
283 | });
284 |
285 | var minDate = sortedDates[0]
286 | maxDate = sortedDates[sortedDates.length - 1];
287 |
288 | self.xMap = d3.time.scale()
289 | .domain([
290 | Date.parse(minDate),
291 | Date.parse(maxDate)
292 | ])
293 | .nice(d3.time[timeScale(minDate, maxDate)])
294 | .range([margin.left, width - margin.right]);
295 | };
296 |
297 | function buildTimeline(formattedEvents) {
298 | var maxFreq = maxDateFreq(formattedEvents)
299 |
300 | formatTimelineCanvas(maxFreq);
301 | buildCanvas();
302 | buildLabels();
303 | buildYMapTimeline(maxFreq);
304 | buildXMapTimeline(formattedEvents);
305 | buildXAxis();
306 | };
307 |
308 | function renderPlot(datasets) {
309 | var colors = parseColors(datasets);
310 |
311 | datasets.forEach(function(dataset, index) {
312 | if (dataset.hasOwnProperty('labels')) {
313 | plotText(dataset, colors[index]);
314 | }
315 | else if (dataset.line) {
316 | plotLine(dataset, colors[index]);
317 | }
318 | else {
319 | plotPoints(dataset, colors[index]);
320 | };
321 | });
322 | };
323 |
324 | function renderBar(input) {
325 | var colors = parseColors(input.datasets);
326 |
327 | input.datasets.forEach(function(dataset, dataIndex) {
328 | dataset.values.forEach(function(value, labelIndex) {
329 | self.canvas.append('rect')
330 | .attr("width", self.innerXMap.rangeBand())
331 | .attr("x", self.xMap(input.groups[labelIndex]) + self.innerXMap(dataIndex))
332 | .attr("y", self.yMap(Math.max(value, 0)))
333 | .attr("height", Math.abs(self.yMap(value) - self.yMap(0)))
334 | .style("fill", colors[dataIndex]);
335 | });
336 | });
337 | };
338 |
339 | function renderPie(input) {
340 | var colors = parseColors(input.values);
341 | var total = input.values.reduce(function(a, b) {
342 | return a + b;
343 | });
344 |
345 | self.arcGroup.append('path')
346 | .attr('d', self.arc)
347 | .style('fill', function(d, i) { return colors[i] });
348 |
349 | self.arcGroup.append('text')
350 | .attr('transform', function(d) { return 'translate(' + self.arc.centroid(d) + ')' })
351 | .attr('dy', '.35em')
352 | .style('text-anchor', 'middle')
353 | .text(function(d, i) {
354 | return Math.round(100 * input.values[i] / total) + '%';
355 | });
356 |
357 | self.arcGroup.attr('transform', 'translate(' + width / 2 + ',' + height / 2 + ')');
358 | };
359 |
360 | function renderTimeline(formattedEvents) {
361 | Object.keys(formattedEvents).forEach(function(date) {
362 | formattedEvents[date].forEach(function(label, index) {
363 | self.canvas.append('text')
364 | .attr('class', 'timeline-text')
365 | .attr('x', self.xMap(Date.parse(date)))
366 | .attr('y', self.yMap(index + 1))
367 | .text(label)
368 | .attr('text-anchor', 'middle')
369 | .attr('stroke', 'black');
370 | });
371 | });
372 | };
373 |
374 | function plotPoints(dataset, color) {
375 | for (var i = 0; i < dataset.x.length; i++) {
376 | self.canvas.append('circle')
377 | .attr('class', 'plot-circle')
378 | .attr('cx', self.xMap(dataset.x[i]))
379 | .attr('cy', self.yMap(dataset.y[i]))
380 | .attr('r', function() {
381 | if (dataset.hasOwnProperty('z')) return self.zMap(dataset.z[i]);
382 | return self.zMap();
383 | })
384 | .attr('opacity', 0.5)
385 | .attr('fill', color);
386 | };
387 | };
388 |
389 | function plotLine(dataset, color) {
390 | for (var i = 1; i < dataset.x.length; i++) {
391 | self.canvas.append('line')
392 | .attr('class', 'plot-line')
393 | .attr('stroke-width', 1)
394 | .attr('stroke', color)
395 | .attr('x1', self.xMap(dataset.x[i - 1]))
396 | .attr('x2', self.xMap(dataset.x[i]))
397 | .attr('y1', self.yMap(dataset.y[i - 1]))
398 | .attr('y2', self.yMap(dataset.y[i]));
399 | };
400 | };
401 |
402 | function plotText(dataset, color) {
403 | for (var i = 0; i < dataset.x.length; i++) {
404 | self.canvas.append('text')
405 | .attr('class', 'plot-text')
406 | .attr('x', self.xMap(dataset.x[i]))
407 | .attr('y', self.yMap(dataset.y[i]))
408 | .text(dataset.labels[i])
409 | .attr('text-anchor', 'middle')
410 | .attr('fill', color)
411 | };
412 | };
413 |
414 | function getBoundaries(data) {
415 | var min = Math.min.apply(null, data);
416 | var max = Math.max.apply(null, data);
417 | return [min, max];
418 | };
419 |
420 | function getUniqueValues(data) {
421 | var seenValues = {}, uniques = [];
422 | data.forEach(function(val) {
423 | if (seenValues[val] != 1) {
424 | seenValues[val] = 1;
425 | uniques.push(val);
426 | };
427 | });
428 | return uniques;
429 | };
430 |
431 | function parseColors(datasets) {
432 | var defaultColor = d3.scale.category10();
433 |
434 | return datasets.map(function(dataset, index) {
435 | if (isNaN(dataset)) {
436 | return dataset.color || defaultColor(index);
437 | }
438 | else {
439 | return defaultColor(index);
440 | };
441 | });
442 | };
443 |
444 | function bindex(bins, value) {
445 | var bindex = 0;
446 | while (true) {
447 | if (bindex == bins.length - 1) return bindex;
448 | if (value < bins[bindex + 1]) {
449 | return bindex;
450 | }
451 | else {
452 | bindex++;
453 | };
454 | };
455 | };
456 |
457 | function round2(num) {
458 | return Math.round(num * 100) / 100;
459 | };
460 |
461 | function maxDateFreq(formattedEvents) {
462 | var maxFreq = Object.keys(formattedEvents).map(function(date) {
463 | return formattedEvents[date].length;
464 | }).reduce(function(a, b) { return Math.max(a, b) }, -Infinity);
465 |
466 | return maxFreq;
467 | };
468 |
469 | function timeScale(minDate, maxDate) {
470 | var periods = {
471 | second: 1000,
472 | minute: 60000,
473 | hour: 3600000,
474 | day: 86400000,
475 | week: 604800000,
476 | month: 2678400000,
477 | year: 31536000000
478 | };
479 |
480 | var range = Date.parse(maxDate) - Date.parse(minDate),
481 | scale = 'second';
482 | Object.keys(periods).forEach(function(period) {
483 | if (range > periods[period]) scale = period;
484 | });
485 |
486 | return scale;
487 | };
488 |
489 | function formatEvents(events) {
490 | var formattedEvents = {};
491 | events.forEach(function(ev) {
492 | formattedEvents[ev.date] = formattedEvents[ev.date] || [];
493 | formattedEvents[ev.date].push(ev.label);
494 | });
495 |
496 | return formattedEvents;
497 | };
498 |
499 | function formatTimelineCanvas(maxFreq) {
500 | if (!config.hasOwnProperty('height')) {
501 | height = 200 + maxFreq * 50;
502 | };
503 | };
504 |
505 | return self;
506 | };
--------------------------------------------------------------------------------
/test/test.html:
--------------------------------------------------------------------------------
1 |
2 |
3 |
4 | Mocha Tests
5 |
6 |
7 |
8 |
9 |
10 |
11 |
12 |
13 |
14 |
15 |
18 |
19 |
--------------------------------------------------------------------------------
/test/test.js:
--------------------------------------------------------------------------------
1 | var expect = chai.expect;
2 |
3 | describe('D3xter', function() {
4 | var x = [1, 2, 3, 4, 5, 6, 7, 8, 9];
5 | var y = [0, -1, 2, -2, 3, -3, 4, -4, 5];
6 | var words = ['one', 'two'];
7 |
8 | describe('plot', function(){
9 | var myPlot = new D3xter().plot({
10 | datasets: [
11 | { x: x, y: y, z: x },
12 | { x: x, y: y, line: true },
13 | { x: [1, 2], y: [1, 2], labels: words }
14 | ]
15 | });
16 |
17 | it('should have the correct number of circles', function() {
18 | var expectedCircles = x.length;
19 | var actualCircles = myPlot.canvas.selectAll('circle')[0].length;
20 |
21 | expect(actualCircles).to.eq(expectedCircles);
22 | });
23 |
24 | it('should have circles of correct radius', function() {
25 | var circles = myPlot.canvas.selectAll('circle')[0];
26 | var unsortedRadii = circles.map(function(circle) {
27 | return circle.getAttribute('r');
28 | });
29 | var sortedRadii = unsortedRadii.sort(function(a, b) {
30 | return a - b;
31 | });
32 |
33 | var increasingCircleSize = (sortedRadii == unsortedRadii);
34 |
35 | expect(increasingCircleSize).to.be.true;
36 | });
37 |
38 | it('should have the correct number of lines', function() {
39 | var expectedLines = x.length - 1;
40 | var actualLines = myPlot.canvas.selectAll('.plot-line')[0].length;
41 |
42 | expect(actualLines).to.eq(expectedLines);
43 | });
44 |
45 | it ('should contain the correct text', function() {
46 | var expectedText = words.length;
47 | var actualText = myPlot.canvas.selectAll('.plot-text')[0].length;
48 |
49 | expect(actualText).to.eq(expectedText);
50 | });
51 |
52 | myPlot.canvas.remove();
53 | });
54 |
55 | describe('pie', function() {
56 | var values = [1, 1, 1, 1];
57 | var myPie = new D3xter().pie({
58 | values: values
59 | });
60 |
61 | it('should have the correct number of slices', function() {
62 | var expectedSlices = values.length;
63 | var actualSlices = myPie.canvas.selectAll('path')[0].length;
64 |
65 | expect(actualSlices).to.equal(expectedSlices);
66 | });
67 |
68 | myPie.canvas.remove();
69 | });
70 |
71 | describe('bar', function() {
72 | var myBar = new D3xter().bar({
73 | groups: ['one', 'two', 'three'],
74 | datasets: [
75 | { values: [1, 4, 7] },
76 | { values: [2, 5, 8] },
77 | { values: [3, 6, 9] }
78 | ]
79 | });
80 |
81 | it('should have the correct number of bars', function() {
82 | var bars = myBar.canvas.selectAll('rect')[0].length;
83 |
84 | expect(bars).to.eq(9);
85 | });
86 |
87 | it('should have bars of the correct height', function() {
88 | var bars = myBar.canvas.selectAll('circle')[0];
89 | var unsortedBars = bars.map(function(bar) {
90 | return bar.getAttribute('height');
91 | });
92 | var sortedBars = unsortedBars.sort(function(a, b) {
93 | return a - b;
94 | });
95 |
96 | var increasingBarSize = (sortedBars == unsortedBars);
97 |
98 | expect(increasingBarSize).to.be.true;
99 | });
100 |
101 | myBar.canvas.remove();
102 | });
103 |
104 | describe('hist', function() {
105 | var myHist = new D3xter().hist(x);
106 |
107 | it('should have the correct number of bins', function() {
108 | var bins = myHist.canvas.selectAll('rect')[0].length;
109 |
110 | expect(bins).to.eq(3);
111 | });
112 |
113 | it('should have the correct bin size', function() {
114 | var bars = myHist.canvas.selectAll('circle')[0];
115 | var barSizes = bars.map(function(bar) {
116 | return bar.getAttribute('height');
117 | });
118 |
119 | var singleBarSize = barSizes.map(function(barSize) {
120 | return barSize == barSizes[0];
121 | }).reduce(function (a, b) {
122 | return (a && b);
123 | }, true);
124 |
125 | expect(singleBarSize).to.be.true;
126 | });
127 |
128 | myHist.canvas.remove();
129 | });
130 |
131 | describe('timeline', function() {
132 | var myFirstTimeline = new D3xter({ height: 700 }).timeline([
133 | { date: '2000-1-1', label: 'first' },
134 | ]);
135 |
136 | var myNextTimeline = new D3xter().timeline([
137 | { date: '2000-1-1', label: 'first' },
138 | { date: '2010-1-1', label: 'second' },
139 | { date: '2010-1-1', label: 'collision' }
140 | ]);
141 |
142 | it('should have the configured height if given', function() {
143 | var canvas = myFirstTimeline.canvas[0][0];
144 | var expectedHeight = 700;
145 | var actualHeight = Number(canvas.getAttribute('height'));
146 |
147 | expect(actualHeight).to.eq(expectedHeight);
148 | });
149 |
150 | it('should have default height if not given', function() {
151 | var canvas = myNextTimeline.canvas[0][0];
152 | var expectedHeight = 300;
153 | var actualHeight = Number(canvas.getAttribute('height'));
154 |
155 | expect(actualHeight).to.eq(expectedHeight);
156 | });
157 |
158 | it('should contain the correct text', function() {
159 | var textElements = myNextTimeline.canvas.selectAll('.timeline-text')[0];
160 | var strings = textElements.map(function(t) { return t.innerHTML });
161 | var expectedStrings = ['first', 'second', 'collision'];
162 |
163 | var includesExpectedStrings = expectedStrings.map(function(string) {
164 | return strings.indexOf(string) != -1;
165 | }).reduce(function(a, b) { return a && b }, true);
166 |
167 | expect(includesExpectedStrings).to.be.true;
168 | });
169 |
170 | myFirstTimeline.canvas.remove();
171 | myNextTimeline.canvas.remove();
172 | });
173 |
174 | describe('config', function() {
175 | describe('legend', function() {
176 | var myPie = new D3xter().pie({
177 | labels: ['one', 'two'],
178 | values: [1, 2]
179 | });
180 |
181 | var anotherPie = new D3xter({ legend: false }).pie({
182 | labels: ['one', 'two'],
183 | values: [1, 2]
184 | });
185 |
186 | it('should be present by default', function() {
187 | var legendPresent = myPie.canvas.selectAll('.legend')[0].length > 0;
188 |
189 | expect(legendPresent).to.be.true;
190 | });
191 |
192 | it('should not be present if configured accordingly', function() {
193 | var legendPresent = anotherPie.canvas.selectAll('.legend')[0].length > 0;
194 |
195 | expect(legendPresent).to.be.false;
196 | });
197 |
198 | myPie.canvas.remove();
199 | anotherPie.canvas.remove();
200 | });
201 |
202 | describe('title', function() {
203 | var myPie = new D3xter({ title: 'myPie' }).pie({
204 | labels: ['one', 'two'],
205 | values: [1, 2]
206 | });
207 |
208 | it('should have the correct title', function() {
209 | var title = myPie.canvas.select('.title')[0][0].innerHTML;
210 | expect(title).to.eq('myPie');
211 | });
212 |
213 | myPie.canvas.remove();
214 | });
215 |
216 | describe('axis labels', function() {
217 | var myPie = new D3xter({ xLab: 'xx', yLab: 'yy' }).pie({
218 | labels: ['one', 'two'],
219 | values: [1, 2]
220 | });
221 |
222 | it('should contain the correct labels', function() {
223 | var textElements = myPie.canvas.selectAll('.label')[0];
224 | var strings = textElements.map(function(t) { return t.innerHTML });
225 | var expectedStrings = ['xx', 'yy'];
226 |
227 | var includesExpectedStrings = expectedStrings.map(function(string) {
228 | return strings.indexOf(string) != -1;
229 | }).reduce(function(a, b) { return a && b }, true);
230 |
231 | expect(includesExpectedStrings).to.be.true;
232 | });
233 |
234 | myPie.canvas.remove();
235 | });
236 |
237 | describe('canvas', function() {
238 | var myPie = new D3xter({ width: 1000 }).pie({
239 | labels: ['one', 'two'],
240 | values: [1, 2]
241 | });
242 |
243 | it('should have the configured dimensions', function() {
244 | var expected = {
245 | height: 500,
246 | width: 1000
247 | };
248 |
249 | var height = Number(myPie.canvas[0][0].getAttribute('height'));
250 | var width = Number(myPie.canvas[0][0].getAttribute('width'));
251 |
252 | expect(height).to.eq(expected.height);
253 | expect(width).to.eq(expected.width);
254 | });
255 |
256 | myPie.canvas.remove();
257 | });
258 | });
259 | });
--------------------------------------------------------------------------------