├── .github
├── CONTRIBUTING.md
└── ISSUE_TEMPLATE.md
├── .gitignore
├── .npmignore
├── LICENSE
├── README.md
├── build
└── rollup.config.js
├── images
├── checkered.png
├── elevation-locate.png
├── elevation-poi.png
├── elevation-position.png
├── elevation-position.svg
├── elevation-pushpin.png
├── elevation-pushpin.svg
└── elevation.svg
├── libs
├── fullpage.css
├── leaflet-distance-marker.css
├── leaflet-distance-marker.js
├── leaflet-distance-marker.min.css
├── leaflet-distance-marker.min.js
├── leaflet-edgescale.js
├── leaflet-edgescale.min.js
├── leaflet-gpxgroup.js
├── leaflet-gpxgroup.min.js
├── leaflet-hotline.js
├── leaflet-hotline.min.js
├── leaflet-ruler.css
├── leaflet-ruler.js
├── leaflet-ruler.min.css
└── leaflet-ruler.min.js
├── package-lock.json
├── package.json
├── src
├── components
│ ├── chart.js
│ ├── d3.js
│ ├── marker.js
│ └── summary.js
├── control.js
├── handlers
│ ├── acceleration.js
│ ├── altitude.js
│ ├── cadence.js
│ ├── distance.js
│ ├── heart.js
│ ├── labels.js
│ ├── lineargradient.js
│ ├── pace.js
│ ├── runner.js
│ ├── slope.js
│ ├── speed.js
│ ├── temperature.js
│ └── time.js
├── index.css
├── index.js
├── options.js
├── utils.js
└── utils.spec.js
└── test
├── index.html
├── multi-2.gpx
├── multi.gpx
└── setup
├── http_server.js
└── jsdom.js
/.github/CONTRIBUTING.md:
--------------------------------------------------------------------------------
1 | ## Contributing
2 |
3 | [fork]: https://github.com/Raruto/leaflet-elevation/fork
4 | [pr]: https://github.com/Raruto/leaflet-elevation/compare
5 |
6 | Hi there! We're thrilled that you'd like to contribute to this project. Your help is essential for keeping it great.
7 |
8 | Contributions to this project are [released](https://help.github.com/articles/github-terms-of-service/#6-contributions-under-repository-license) to the public under the [project's open source license](LICENSE).
9 |
10 | By participating in this project you agree to abide by its terms.
11 |
12 | ## Developing locally
13 |
14 | For those wishing to try, clone this repository into your localhost folder and inside move to the leaflet-elevation folder
15 |
16 | 0. `git clone https://github.com/raruto/leaflet-elevation` (inside your localhost folder, eg. `/var/www`)
17 |
18 | 1. `cd leaflet-elevation`
19 |
20 | 2. `npm i`
21 |
22 | 3. `npm run dev`
23 |
24 | After that you can start developing inside the `src` and `test` folders (open "http://localhost/leaflet-elevation/test" in your browser to see your changes).
25 |
26 | ## Submitting a pull request
27 |
28 | 0. [Fork][fork] and clone the repository
29 | 0. Configure and install the dependencies: `npm i`
30 | 0. Make sure the tests pass on your machine: `npm t`
31 | 0. Create a new branch: `git checkout -b my-branch-name`
32 | 0. Make your change, add tests, and make sure the tests still pass
33 | 0. Push to your fork and [submit a pull request][pr]
34 | 0. Pat your self on the back and wait for your pull request to be reviewed and merged.
35 |
36 | Here are a few things you can do that will increase the likelihood of your pull request being accepted:
37 |
38 | - Write tests.
39 | - Keep your change as focused as possible. If there are multiple changes you would like to make that are not dependent upon each other, consider submitting them as separate pull requests.
40 | - Write a [good commit message](http://tbaggery.com/2008/04/19/a-note-about-git-commit-messages.html).
41 |
42 | ## Resources
43 |
44 | - [How to Contribute to Open Source](https://opensource.guide/how-to-contribute/)
45 | - [Using Pull Requests](https://help.github.com/articles/about-pull-requests/)
46 | - [GitHub Help](https://help.github.com)
47 |
--------------------------------------------------------------------------------
/.github/ISSUE_TEMPLATE.md:
--------------------------------------------------------------------------------
1 |
2 |
3 | ### Subject of the issue
4 | Describe your issue here.
5 |
6 | ### Your environment
7 | * leaflet-elevation: __version__
8 | * leaflet: __version__
9 | * browser: __name__
10 | * operating system: __name and version (desktop or mobile)__
11 | * link to your project: __url or screenshots__
12 |
13 | ### Steps to reproduce
14 | Tell everyone how to reproduce this issue. Please provide a working demo (you can use [this online template](https://jsfiddle.net/wgckfu03/) as a base), otherwise, you can edit the following in order to show other some portions of your code:
15 |
16 | ```js
17 | var map = new L.Map('map');
18 | var controlElevation = L.control.elevation(options).addTo(map);
19 | controlElevation.load("https://raruto.github.io/leaflet-elevation/examples/via-emilia.gpx");
20 | ```
21 |
22 | ### Expected behaviour
23 | Tell everyone what should happen
24 |
25 | ### Actual behaviour
26 | Tell everyone what happens instead
27 |
28 |
29 |
--------------------------------------------------------------------------------
/.gitignore:
--------------------------------------------------------------------------------
1 | node_modules/
2 | npm-debug.log
3 | build/**/*.min.js
4 | spec/**/*.min.js
5 | src/**/*.min.js
6 | src/**/*.min.css
7 | dist/
8 | e2e/results/
9 | e2e/reports/
10 | /playwright/.cache/
11 |
--------------------------------------------------------------------------------
/.npmignore:
--------------------------------------------------------------------------------
1 | /build
2 | /.github
3 | /examples
4 | /test
5 | /spec
6 | .jshintrc
7 | .gitattributes
8 | .babelrc
9 | _config.yml
10 | src/**/*.min.js
11 | src/**/*.min.css
12 |
--------------------------------------------------------------------------------
/README.md:
--------------------------------------------------------------------------------
1 | # leaflet-elevation.js
2 |
3 | [](https://www.npmjs.com/package/@raruto/leaflet-elevation)
4 | [](LICENSE)
5 |
6 | A Leaflet plugin that allows to add elevation profiles using d3js
7 |
8 |
9 | 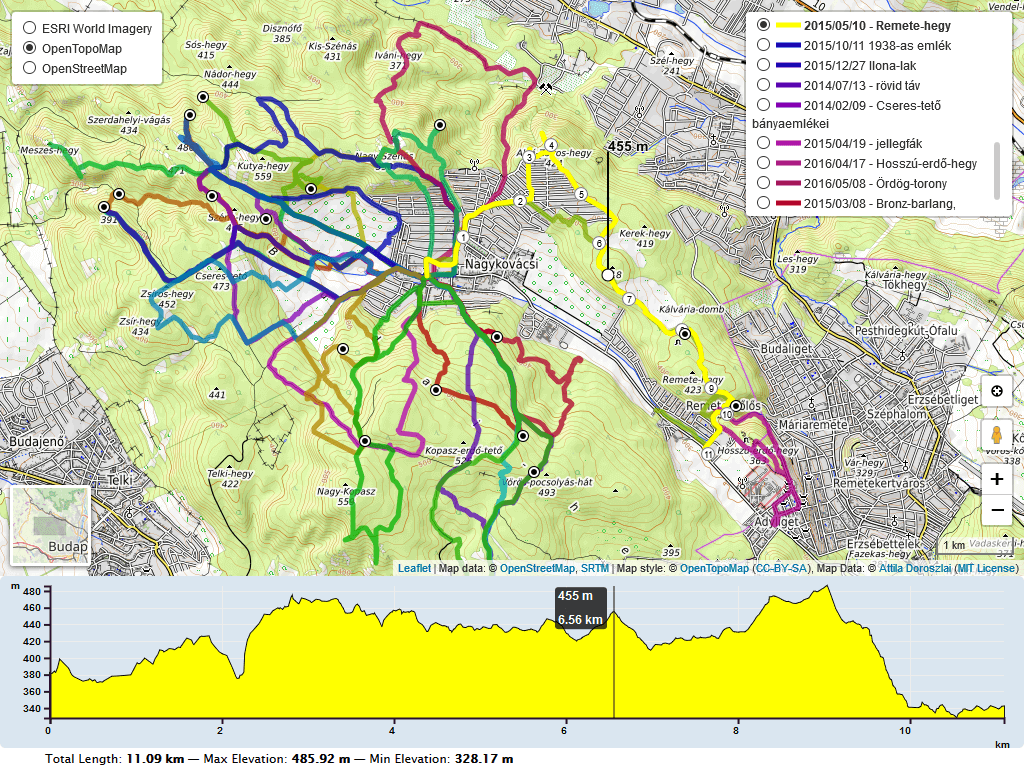 10 |
10 |
11 |
12 | ---
13 |
14 | _For a working example see one of the following demos:_
15 |
16 | - [loading .gpx file](https://raruto.github.io/leaflet-elevation/examples/leaflet-elevation.html)
17 | - [loading .geojson file](https://raruto.github.io/leaflet-elevation/examples/leaflet-elevation_geojson-data.html)
18 | - [loading .kml file](https://raruto.github.io/leaflet-elevation/examples/leaflet-elevation_kml-data.html)
19 | - [loading .tcx file](https://raruto.github.io/leaflet-elevation/examples/leaflet-elevation_tcx-data.html)
20 | - [loading a local .gpx file](https://raruto.github.io/leaflet-elevation/examples/leaflet-elevation_upload-gpx.html)
21 | - [loading data from a textarea](https://raruto.github.io/leaflet-elevation/examples/leaflet-elevation_string-data.html)
22 | - [loading individual .geojson tracks](https://raruto.github.io/leaflet-elevation/examples/leaflet-elevation_geojson-group.html)
23 | - [loading individual .gpx tracks](https://raruto.github.io/leaflet-elevation/examples/leaflet-elevation_toggable-tracks.html)
24 | - [loading multiple .gpx tracks (hover to toggle)](https://raruto.github.io/leaflet-elevation/examples/leaflet-elevation_hoverable-tracks.html)
25 | - [loading multiple .gpx tracks (click to toggle)](https://raruto.github.io/leaflet-elevation/examples/leaflet-elevation_toggable-charts.html)
26 | - [loading multiple maps](https://raruto.github.io/leaflet-elevation/examples/leaflet-elevation_multiple-maps.html)
27 | - [stacking multiple charts (elevation, slope, speed)](https://raruto.github.io/leaflet-elevation/examples/leaflet-elevation_multiple-charts.html)
28 | - [translating plugin labels](https://raruto.github.io/leaflet-elevation/examples/leaflet-elevation_i18n-strings.html)
29 | - [rotating chart labels](https://raruto.github.io/leaflet-elevation/examples/leaflet-elevation_chart_labels.html)
30 | - [using custom colors](https://raruto.github.io/leaflet-elevation/examples/leaflet-elevation_custom-theme.html)
31 | - [using .gpx extensions (cadence, heart, pace)](https://raruto.github.io/leaflet-elevation/examples/leaflet-elevation_extended-ui.html)
32 | - [using .gpx waypoint icons](https://raruto.github.io/leaflet-elevation/examples/leaflet-elevation_gpx-waypoints.html)
33 | - [using .geojson waypoint icons](https://raruto.github.io/leaflet-elevation/examples/leaflet-elevation_geojson-waypoints.html)
34 |
35 |
36 |
37 |
38 | - [autohide map](https://raruto.github.io/leaflet-elevation/examples/leaflet-elevation_hidden-map.html)
39 | - [autohide chart](https://raruto.github.io/leaflet-elevation/examples/leaflet-elevation_hidden-chart.html)
40 | - [clear button](https://raruto.github.io/leaflet-elevation/examples/leaflet-elevation_clear-button.html)
41 | - [collapsible button](https://raruto.github.io/leaflet-elevation/examples/leaflet-elevation_close-button.html)
42 | - [custom summary](https://raruto.github.io/leaflet-elevation/examples/leaflet-elevation_custom-summary.html)
43 | - [edge scale control](https://raruto.github.io/leaflet-elevation/examples/leaflet-elevation_edge-scale.html)
44 | - [follow marker](https://raruto.github.io/leaflet-elevation/examples/leaflet-elevation_follow-marker.html)
45 | - [layer almostover](https://raruto.github.io/leaflet-elevation/examples/leaflet-elevation_almost-over.html)
46 | - [linear gradient](https://raruto.github.io/leaflet-elevation/examples/leaflet-elevation_linear-gradient.html)
47 | - [slope chart](https://raruto.github.io/leaflet-elevation/examples/leaflet-elevation_slope-chart.html)
48 | - [speed chart](https://raruto.github.io/leaflet-elevation/examples/leaflet-elevation_speed-chart.html)
49 | - [temperature chart](https://raruto.github.io/leaflet-elevation/examples/leaflet-elevation_temperature-chart.html)
50 | - [walking marker](https://raruto.github.io/leaflet-elevation/examples/leaflet-elevation_dynamic-runner.html)
51 |
52 | ---
53 |
54 |
55 |
56 | Initially based on the work of Felix “MrMufflon” Bache
57 |
58 |
59 |
60 | ---
61 |
62 | ## How to use
63 |
64 | 1. **include CSS & JavaScript**
65 | ```html
66 |
67 | ...
68 |
69 |
70 |
71 |
72 |
73 |
74 |
75 |
76 |
77 | ...
78 |
79 | ```
80 | 2. **choose the div container used for the slippy map**
81 | ```html
82 |
83 | ...
84 |
85 | ...
86 |
87 | ```
88 | 3. **create your first simple “leaflet-elevation” slippy map**
89 | ```html
90 |
203 | ```
204 |
205 | ### Build Guide
206 |
207 | Within your local development environment:
208 |
209 | ```shell
210 | git clone git@github.com:Raruto/leaflet-elevation.git
211 | cd ./leaflet-elevation
212 |
213 | npm i # install dependencies
214 | npm run dev # start dev server at: http://localhost:8080
215 | npm run build # generate "dist" files (once)
216 | npm run test # test all "*.spec.js" files (once)
217 | ```
218 |
219 | After that you can start developing inside the `src` and `test` folders (eg. open "http://localhost:8080/test" in your browser to preview changes). Check also [CONTRIBUTING.md](.github/CONTRIBUTING.md) file for some information about it.
220 |
221 | ### FAQ
222 |
223 |
224 | 1. How can I change the color of the elevation plot?
225 |
226 | There are multiple options to achieve this:
227 |
228 | * You could either use some default presets (see: theme: "lightblue-theme" option in readme file and the following file `leaflet-elevation.css` for some other default "*-theme" names).
229 | * check out [this example](https://raruto.github.io/leaflet-elevation/examples/leaflet-elevation_custom-theme.html)
230 | * Or add the following lines for custom colors.
231 | ```css
232 | .elevation-control .area {
233 | fill: red;
234 | }
235 | .elevation-control .background {
236 | background-color: white;
237 | ```
238 |
239 |
240 |
241 | 2. How to enable/disable the leaflet user interface customizations?
242 |
243 | These customizations are actually part of the [leaflet-ui](https://github.com/Raruto/leaflet-ui) and can be toggled on/off using e.g. the following options:
244 | ```js
245 | var map = L.map('map', {
246 | center: [41.4583, 12.7059], // needs value to initialize
247 | zoom: 5, // needs value to initialize
248 | mapTypeId: 'topo',
249 | mapTypeIds: ['osm', 'terrain', 'satellite', 'topo'],
250 | gestureHandling: false, // zoom with Cmd + Scroll
251 | zoomControl: true, // plus minus buttons
252 | pegmanControl: false,
253 | locateControl: false,
254 | fullscreenControl: true,
255 | layersControl: true,
256 | minimapControl: false,
257 | editInOSMControl: false,
258 | loadingControl: false,
259 | searchControl: false,
260 | disableDefaultUI: false,
261 | printControl: false,
262 | });
263 | ```
264 |
265 |
266 | 3. How can I import this library as ES module?
267 |
268 | Usually, when working with a js bundler like [Vite](https://vitest.dev/) or [Webpack](https://webpack.js.org/), you need to provide to this library the full path to some dynamically imported files from the [`srcFolder`](./src/):
269 |
270 | ```js
271 | import './your-custom-style.css';
272 | import 'leaflet/dist/leaflet.css';
273 | import L from 'leaflet';
274 | import '@raruto/leaflet-elevation/src/index.js';
275 | import '@raruto/leaflet-elevation/src/index.css';
276 |
277 | const map = L.map('map', {
278 | center: [41.4583, 12.7059]
279 | zoom: 5,
280 | });
281 |
282 | const controlElevation = L.control.elevation({
283 | // CHANGE ME: with your own http server folder (eg. "http://custom-server/public/path/to/leaflet-elevation/src/")
284 | srcFolder: 'http://unpkg.com/@raruto/leaflet-elevation/src/'
285 | }).addTo(map);
286 |
287 | // Load track from url (allowed data types: "*.geojson", "*.gpx", "*.tcx")
288 | controlElevation.load("https://raruto.github.io/leaflet-elevation/examples/via-emilia.gpx");
289 | ```
290 |
291 |
292 |
293 |
294 | 4. Some real world projects based on this plugin?
295 |
296 | - https://parcours.scasb.org/
297 | - https://velocat.ru/velo/phpBB3/map.php
298 | - https://plugins.qgis.org/plugins/track_profile_2_web/
299 | - https://wordpress.org/plugins/os-datahub-maps/
300 | - https://wordpress.org/plugins/extensions-leaflet-map/
301 | - https://github.com/der-stefan/OpenTopoMap
302 | - https://gpx.n-peloton.fr/
303 | - https://walkaholic.me/map
304 |
305 |
306 |
307 | _Related: [Leaflet-UI presets](https://github.com/raruto/leaflet-ui), [QGIS Integration](https://github.com/faunalia/trackprofile2web)_
308 |
309 | ### Changelog
310 |
311 | All notable changes to this project are documented in the [releases](https://github.com/Raruto/leaflet-elevation/releases) page.
312 |
313 | ---
314 |
315 | **Compatibile with:**
316 | [](http://leafletjs.com/reference.html)
317 | [](https://www.npmjs.com/package/d3)
318 | [](https://www.npmjs.com/package/@tmcw/togeojson)
319 |
320 |
321 | ---
322 |
323 | **Contributors:** [MrMufflon](https://github.com/MrMufflon/Leaflet.Elevation), [HostedDinner](https://github.com/HostedDinner/Leaflet.Elevation), [ADoroszlai](http://ADoroszlai.github.io/joebed/), [Raruto](https://github.com/Raruto/leaflet-elevation)
324 |
325 | ---
326 |
327 | **License:** GPL-3.0+
328 |
--------------------------------------------------------------------------------
/build/rollup.config.js:
--------------------------------------------------------------------------------
1 | import terser from '@rollup/plugin-terser';
2 | import resolve from '@rollup/plugin-node-resolve';
3 | import commonJS from '@rollup/plugin-commonjs';
4 | import postcss from 'rollup-plugin-postcss';
5 | import postcssImport from 'postcss-import';
6 |
7 | // import postcssCopy from 'postcss-copy';
8 | // import rollupGitVersion from 'rollup-plugin-git-version';
9 |
10 | import plugin from '../package.json' assert { type: "json" };
11 |
12 | let plugin_name = plugin.name.replace("@raruto/", "");
13 |
14 | let input = plugin.module;
15 | let output = {
16 | file: "dist/" + plugin_name + ".js",
17 | format: "umd",
18 | sourcemap: true,
19 | name: plugin_name,
20 | freeze: false,
21 | };
22 |
23 | let plugins = [
24 | resolve(),
25 | commonJS({
26 | include: '../node_modules/**'
27 | }),
28 | // rollupGitVersion(),
29 | ];
30 |
31 | export default [
32 | //** "leaflet-elevation.js" **//
33 | {
34 | input: input,
35 | output: output,
36 | plugins: plugins,
37 | },
38 |
39 | //** "leaflet-elevation.min.js" **//
40 | {
41 | input: input,
42 | output: Object.assign({}, output, {
43 | file: "dist/" + plugin_name + ".min.js"
44 | }),
45 | plugins: plugins.concat(terser()),
46 | },
47 |
48 | //** "leaflet-elevation.css" **//
49 | {
50 | input: input.replace(".js", ".css"),
51 | output: {
52 | file: "dist/" + plugin_name + ".css",
53 | format: 'es'
54 | },
55 | plugins: [
56 | postcss({
57 | extract: true,
58 | inject: false,
59 | minimize: false,
60 | plugins: [
61 | postcssImport({}),
62 | // postcssCopy({
63 | // basePath: 'node_modules',
64 | // dest: "dist",
65 | // template: "images/[path][name].[ext]",
66 | // })
67 | ]
68 | })
69 | ]
70 | },
71 |
72 | //** "leaflet-elevation.min.css" **//
73 | {
74 | input: input.replace(".js", ".css"),
75 | output: {
76 | file: "dist/" + plugin_name + ".min.css",
77 | format: 'es'
78 | },
79 | plugins: [
80 | postcss({
81 | extract: true,
82 | inject: false,
83 | minimize: true,
84 | plugins: [
85 | postcssImport({}),
86 | // postcssCopy({
87 | // basePath: 'node_modules',
88 | // dest: "dist",
89 | // template: "images/[path][name].[ext]",
90 | // })
91 | ]
92 | })
93 | ]
94 | },
95 |
96 | ];
97 |
--------------------------------------------------------------------------------
/images/checkered.png:
--------------------------------------------------------------------------------
https://raw.githubusercontent.com/Raruto/leaflet-elevation/8658bfad0ee00ede92bdf4b6d130cc959e90cdd7/images/checkered.png
--------------------------------------------------------------------------------
/images/elevation-locate.png:
--------------------------------------------------------------------------------
https://raw.githubusercontent.com/Raruto/leaflet-elevation/8658bfad0ee00ede92bdf4b6d130cc959e90cdd7/images/elevation-locate.png
--------------------------------------------------------------------------------
/images/elevation-poi.png:
--------------------------------------------------------------------------------
https://raw.githubusercontent.com/Raruto/leaflet-elevation/8658bfad0ee00ede92bdf4b6d130cc959e90cdd7/images/elevation-poi.png
--------------------------------------------------------------------------------
/images/elevation-position.png:
--------------------------------------------------------------------------------
https://raw.githubusercontent.com/Raruto/leaflet-elevation/8658bfad0ee00ede92bdf4b6d130cc959e90cdd7/images/elevation-position.png
--------------------------------------------------------------------------------
/images/elevation-position.svg:
--------------------------------------------------------------------------------
1 |
2 |
--------------------------------------------------------------------------------
/images/elevation-pushpin.png:
--------------------------------------------------------------------------------
https://raw.githubusercontent.com/Raruto/leaflet-elevation/8658bfad0ee00ede92bdf4b6d130cc959e90cdd7/images/elevation-pushpin.png
--------------------------------------------------------------------------------
/images/elevation-pushpin.svg:
--------------------------------------------------------------------------------
1 |
2 |
--------------------------------------------------------------------------------
/images/elevation.svg:
--------------------------------------------------------------------------------
1 |
2 |
--------------------------------------------------------------------------------
/libs/fullpage.css:
--------------------------------------------------------------------------------
1 | html,
2 | body,
3 | .leaflet-map {
4 | height: 100%;
5 | width: 100%;
6 | padding: 0px;
7 | margin: 0px;
8 | }
9 |
10 | body {
11 | display: flex;
12 | flex-direction: column;
13 | }
14 |
--------------------------------------------------------------------------------
/libs/leaflet-distance-marker.css:
--------------------------------------------------------------------------------
1 | .dist-marker {
2 | font-size: 9px;
3 | border: 1px solid #777;
4 | border-radius: 10px;
5 | text-align: center;
6 | color: #000;
7 | background: #fff;
8 | }
9 |
--------------------------------------------------------------------------------
/libs/leaflet-distance-marker.js:
--------------------------------------------------------------------------------
1 | /*
2 | * Copyright (c) 2022, GPL-3.0+ Project, Raruto
3 | *
4 | * This file is free software: you may copy, redistribute and/or modify it
5 | * under the terms of the GNU General Public License as published by the
6 | * Free Software Foundation, either version 2 of the License, or (at your
7 | * option) any later version.
8 | *
9 | * This file is distributed in the hope that it will be useful, but
10 | * WITHOUT ANY WARRANTY; without even the implied warranty of
11 | * MERCHANTABILITY or FITNESS FOR A PARTICULAR PURPOSE. See the GNU
12 | * General Public License for more details.
13 | *
14 | * You should have received a copy of the GNU General Public License
15 | * along with this program. If not, see .
16 | *
17 | * This file incorporates work covered by the following copyright and
18 | * permission notice:
19 | *
20 | * Copyright (c) 2014- Doroszlai Attila, 2016- Phil Whitehurst
21 | *
22 | * Permission to use, copy, modify, and/or distribute this software
23 | * for any purpose with or without fee is hereby granted, provided
24 | * that the above copyright notice and this permission notice appear
25 | * in all copies.
26 | *
27 | * THE SOFTWARE IS PROVIDED "AS IS" AND THE AUTHOR DISCLAIMS ALL
28 | * WARRANTIES WITH REGARD TO THIS SOFTWARE INCLUDING ALL IMPLIED
29 | * WARRANTIES OF MERCHANTABILITY AND FITNESS. IN NO EVENT SHALL THE
30 | * AUTHOR BE LIABLE FOR ANY SPECIAL, DIRECT, INDIRECT, OR
31 | * CONSEQUENTIAL DAMAGES OR ANY DAMAGES WHATSOEVER RESULTING FROM LOSS
32 | * OF USE, DATA OR PROFITS, WHETHER IN AN ACTION OF CONTRACT,
33 | * NEGLIGENCE OR OTHER TORTIOUS ACTION, ARISING OUT OF OR IN
34 | * CONNECTION WITH THE USE OR PERFORMANCE OF THIS SOFTWARE.
35 | */
36 |
37 | // TODO: the "L.DistanceMarker" (canvas marker) class could be alternatively provided by "leaflet-rotate"?
38 |
39 | L.DistanceMarker = L.CircleMarker.extend({
40 | _updatePath: function () {
41 | let ctx = this._renderer._ctx;
42 | let p = this._point;
43 |
44 | // Calculate image direction (rotation)
45 | this.options.rotation = this.options.rotation || 0;
46 |
47 | // Draw circle marker (canvas point)
48 | if (this.options.radius && this._renderer._updateCircle) {
49 | this._renderer._updateCircle(this);
50 | }
51 |
52 | // Draw image over circle (distance marker)
53 | if (this.options.icon && this.options.icon.url) {
54 | if (!this.options.icon.element) {
55 | const icon = document.createElement('img');
56 | this.options.icon = L.extend({ rotate: 0, size: [40, 40], offset: { x: 0, y: 0 } }, this.options.icon);
57 | this.options.icon.rotate += this.options.rotation;
58 | this.options.icon.element = icon;
59 | icon.src = this.options.icon.url;
60 | icon.onload = () => this.redraw();
61 | icon.onerror = () => this.options.icon = null;
62 | } else {
63 | const icon = this.options.icon;
64 | let cx = p.x + icon.offset.x;
65 | let cy = p.y + icon.offset.y;
66 | ctx.save();
67 | if (icon.rotate) {
68 | ctx.translate(p.x, p.y);
69 | ctx.rotate(icon.rotate);
70 | cx = 0;
71 | cy = 0;
72 | }
73 | ctx.drawImage(icon.element, cx - icon.size[0] / 2, cy - icon.size[1] / 2, icon.size[0], icon.size[1]);
74 | ctx.restore();
75 | }
76 | }
77 |
78 | // Add a label inside the circle (distance marker)
79 | if (this.options.label) {
80 | let cx = p.x, cy = p.y;
81 | ctx.save();
82 |
83 | ctx.font = this.options.font || 'normal 7pt "Helvetica Neue", Arial, Helvetica, sans-serif';
84 | ctx.textAlign = "center";
85 | ctx.textBaseline = "middle";
86 | ctx.fillStyle = this.options.fillStyle || 'black';
87 |
88 | // TODO rescale circle to fit text
89 | // let fontSize = Number(/[0-9\.]+/.exec(ctx.font)[0]);
90 | // let fontWidth = ctx.measureText(this.options.html).width;
91 |
92 | if (this.options.rotation) {
93 | ctx.translate(p.x, p.y);
94 | ctx.rotate(this.options.rotation);
95 | cx = 0;
96 | cy = 0;
97 | }
98 |
99 | // Temporary fix to prevent stroke blurs at higher zoom levels
100 | if (this._map.getZoom() > 17) {
101 | ctx.fillStyle = this.options.strokeStyle || 'black';
102 | }
103 |
104 | ctx.fillText(this.options.label, cx, cy);
105 |
106 | if (this.options.strokeStyle && this._map.getZoom() <= 17) {
107 | ctx.strokeStyle = this.options.strokeStyle;
108 | ctx.strokeText(this.options.label, cx, cy);
109 | }
110 |
111 | ctx.restore();
112 | }
113 | }
114 | });
115 |
116 | L.DistanceMarkers = L.LayerGroup.extend({
117 | options: {
118 | cssClass: 'dist-marker',
119 | iconSize: [12, 12],
120 | arrowSize: [10, 10],
121 | arrowUrl: "data:image/svg+xml,%3Csvg transform='rotate(90)' xmlns='http://www.w3.org/2000/svg' width='560px' height='560px' viewBox='0 0 560 560'%3E%3Cpath stroke-width='35' fill='%23000' stroke='%23FFF' d='M280,40L522,525L280,420L38,525z'/%3E%3C/svg%3E",
122 | offset: 1000,
123 | showAll: 12,
124 | textFunction: (distance, i, offset) => i,
125 | distance: true,
126 | direction: true,
127 | },
128 | initialize: function (line, map, options) {
129 |
130 | this._layers = {};
131 | this._zoomLayers = {};
132 |
133 | options = L.setOptions(this, options);
134 |
135 | let preferCanvas = map.options.preferCanvas;
136 | let showAll = Math.min(map.getMaxZoom(), options.showAll);
137 |
138 | // You should use "leaflet-rotate" to show rotated arrow markers (preferCanvas: false)
139 | if (!preferCanvas && !map.options.rotate) {
140 | console.warn('Missing dependency: "leaflet-rotate"');
141 | }
142 |
143 | // Get line coords as an array
144 | let coords = typeof line.getLatLngs == 'function' ? line.getLatLngs() : line;
145 |
146 | // Handle "MultiLineString" features
147 | coords = L.LineUtil.isFlat(coords) ? [coords] : coords;
148 |
149 | coords.forEach(latlngs => {
150 | // Get accumulated line lengths as well as overall length
151 | let accumulated = L.GeometryUtil.accumulatedLengths(latlngs);
152 | let length = accumulated.length > 0 ? accumulated[accumulated.length - 1] : 0;
153 |
154 | // count = Number of distance markers to be added
155 | // j = Position in accumulated line length array
156 | for (let i = 1, count = Math.floor(length / options.offset), j = 0; i <= count; ++i) {
157 |
158 | let distance = options.offset * i;
159 |
160 | // Find the first accumulated distance that is greater than the distance of this marker
161 | while (j < accumulated.length - 1 && accumulated[j] < distance) ++j;
162 |
163 | // Grab two nearest points either side marker position
164 | let p1 = latlngs[j - 1];
165 | let p2 = latlngs[j];
166 | let m_line = L.polyline([p1, p2]);
167 |
168 | // and create a simple line to interpolate on
169 | let ratio = (distance - accumulated[j - 1]) / (accumulated[j] - accumulated[j - 1]);
170 | let position = L.GeometryUtil.interpolateOnLine(map, m_line, ratio);
171 | let delta = map.project(p2).subtract(map.project(p1));
172 | let angle = Math.atan2(delta.y, delta.x);
173 |
174 | // Generate distance marker label
175 | let text = options.textFunction.call(this, distance, i, options.offset);
176 |
177 | // Grouping layer of visible layers at zoom level (arrow + distance)
178 | let zoom = this._minimumZoomLevelForItem(i, showAll);
179 | let markers = this._zoomLayers[zoom] = this._zoomLayers[zoom] || L.layerGroup()
180 |
181 | // create arrow markers
182 | if (options.direction && ((options.distance && i % 2 == 1) || !options.distance)) {
183 | if (preferCanvas) {
184 | markers.addLayer(
185 | new L.DistanceMarker(p1, {
186 | radius: 0,
187 | icon: {
188 | url: options.arrowUrl, //image link
189 | size: options.arrowSize, //image size ( default [40, 40] )
190 | rotate: 0, //image base rotate ( default 0 )
191 | offset: { x: 0, y: 0 }, //image offset ( default { x: 0, y: 0 } )
192 | },
193 | rotation: angle,
194 | interactive: false,
195 | // label: '⮞', //'➜',
196 | // font: 'normal 20pt "Helvetica Neue", Arial, Helvetica, sans-serif',
197 | // fillStyle: 'white',//'#3366CC',
198 | // strokeStyle: 'black',
199 | })
200 | );
201 | } else {
202 | markers.addLayer(
203 | L.marker(position.latLng, {
204 | icon: L.icon({
205 | iconUrl: options.arrowUrl,
206 | iconSize: options.arrowSize,
207 | }),
208 | // NB the following option is added by "leaflet-rotate"
209 | rotation: angle,
210 | interactive: false,
211 | })
212 | );
213 | }
214 | }
215 |
216 | // create distance markers
217 | if (options.distance && i % 2 == 0) {
218 | if (preferCanvas) {
219 | markers.addLayer(
220 | new L.DistanceMarker(position.latLng, {
221 | label: text, // TODO: handle text rotation (leaflet-rotate)
222 | radius: 7,
223 | fillColor: '#fff',
224 | fillOpacity: 1,
225 | fillStyle: 'black',
226 | color: '#777',
227 | weight: 1,
228 | interactive: false,
229 | })
230 | );
231 | } else {
232 | markers.addLayer(
233 | L.marker(position.latLng, {
234 | title: text,
235 | icon: L.divIcon({
236 | className: options.cssClass,
237 | html: text,
238 | iconSize: options.iconSize
239 | }),
240 | interactive: false,
241 | })
242 | );
243 | }
244 | }
245 | }
246 | });
247 |
248 | const updateMarkerVisibility = () => {
249 | let oldZoom = this._lastZoomLevel || 0;
250 | let newZoom = map.getZoom();
251 | if (newZoom > oldZoom) {
252 | for (let i = oldZoom + 1; i <= newZoom; ++i) {
253 | if (this._zoomLayers[i] !== undefined) {
254 | this.addLayer(this._zoomLayers[i]);
255 | }
256 | }
257 | } else if (newZoom < oldZoom) {
258 | for (let i = oldZoom; i > newZoom; --i) {
259 | if (this._zoomLayers[i] !== undefined) {
260 | this.removeLayer(this._zoomLayers[i]);
261 | }
262 | }
263 | }
264 | this._lastZoomLevel = newZoom;
265 | };
266 | map.on('zoomend', updateMarkerVisibility);
267 | updateMarkerVisibility();
268 | },
269 |
270 | _minimumZoomLevelForItem: function (i, zoom) {
271 | while (i > 0 && i % 2 === 0) {
272 | --zoom;
273 | i = Math.floor(i / 2);
274 | }
275 | return zoom;
276 | },
277 |
278 | });
279 |
280 | L.Polyline.include({
281 |
282 | _originalOnAdd: L.Polyline.prototype.onAdd,
283 | _originalOnRemove: L.Polyline.prototype.onRemove,
284 |
285 | addDistanceMarkers: function () {
286 | if (this._map && this._distanceMarkers) {
287 | this._map.addLayer(this._distanceMarkers);
288 | }
289 | },
290 |
291 | removeDistanceMarkers: function () {
292 | if (this._map && this._distanceMarkers) {
293 | this._map.removeLayer(this._distanceMarkers);
294 | }
295 | },
296 |
297 | onAdd: function (map) {
298 | this._originalOnAdd(map);
299 |
300 | let opts = this.options.distanceMarkers || {};
301 | if (this.options.distanceMarkers) {
302 | this._distanceMarkers = this._distanceMarkers || new L.DistanceMarkers(this, map, opts);
303 | }
304 | if (opts.lazy === undefined || opts.lazy === false) {
305 | this.addDistanceMarkers();
306 | }
307 | },
308 |
309 | onRemove: function (map) {
310 | this.removeDistanceMarkers();
311 | this._originalOnRemove(map);
312 | }
313 |
314 | });
315 |
--------------------------------------------------------------------------------
/libs/leaflet-distance-marker.min.css:
--------------------------------------------------------------------------------
1 | .dist-marker{font-size:9px;border:1px solid #777;border-radius:10px;text-align:center;color:#000;background:#fff}
--------------------------------------------------------------------------------
/libs/leaflet-distance-marker.min.js:
--------------------------------------------------------------------------------
1 | L.DistanceMarker=L.CircleMarker.extend({_updatePath:function(){let ctx=this._renderer._ctx,p=this._point;if(this.options.rotation=this.options.rotation||0,this.options.radius&&this._renderer._updateCircle&&this._renderer._updateCircle(this),this.options.icon&&this.options.icon.url)if(this.options.icon.element){const icon=this.options.icon;let cx=p.x+icon.offset.x,cy=p.y+icon.offset.y;ctx.save(),icon.rotate&&(ctx.translate(p.x,p.y),ctx.rotate(icon.rotate),cx=0,cy=0),ctx.drawImage(icon.element,cx-icon.size[0]/2,cy-icon.size[1]/2,icon.size[0],icon.size[1]),ctx.restore()}else{const icon=document.createElement("img");this.options.icon=L.extend({rotate:0,size:[40,40],offset:{x:0,y:0}},this.options.icon),this.options.icon.rotate+=this.options.rotation,this.options.icon.element=icon,icon.src=this.options.icon.url,icon.onload=()=>this.redraw(),icon.onerror=()=>this.options.icon=null}if(this.options.label){let cx=p.x,cy=p.y;ctx.save(),ctx.font=this.options.font||'normal 7pt "Helvetica Neue", Arial, Helvetica, sans-serif',ctx.textAlign="center",ctx.textBaseline="middle",ctx.fillStyle=this.options.fillStyle||"black",this.options.rotation&&(ctx.translate(p.x,p.y),ctx.rotate(this.options.rotation),cx=0,cy=0),this._map.getZoom()>17&&(ctx.fillStyle=this.options.strokeStyle||"black"),ctx.fillText(this.options.label,cx,cy),this.options.strokeStyle&&this._map.getZoom()<=17&&(ctx.strokeStyle=this.options.strokeStyle,ctx.strokeText(this.options.label,cx,cy)),ctx.restore()}}}),L.DistanceMarkers=L.LayerGroup.extend({options:{cssClass:"dist-marker",iconSize:[12,12],arrowSize:[10,10],arrowUrl:"data:image/svg+xml,%3Csvg transform='rotate(90)' xmlns='http://www.w3.org/2000/svg' width='560px' height='560px' viewBox='0 0 560 560'%3E%3Cpath stroke-width='35' fill='%23000' stroke='%23FFF' d='M280,40L522,525L280,420L38,525z'/%3E%3C/svg%3E",offset:1e3,showAll:12,textFunction:(distance,i,offset)=>i,distance:!0,direction:!0},initialize:function(line,map,options){this._layers={},this._zoomLayers={},options=L.setOptions(this,options);let preferCanvas=map.options.preferCanvas,showAll=Math.min(map.getMaxZoom(),options.showAll);preferCanvas||map.options.rotate||console.warn('Missing dependency: "leaflet-rotate"');let coords="function"==typeof line.getLatLngs?line.getLatLngs():line;coords=L.LineUtil.isFlat(coords)?[coords]:coords,coords.forEach(latlngs=>{let accumulated=L.GeometryUtil.accumulatedLengths(latlngs),length=accumulated.length>0?accumulated[accumulated.length-1]:0;for(let i=1,count=Math.floor(length/options.offset),j=0;i<=count;++i){let distance=options.offset*i;for(;j{let oldZoom=this._lastZoomLevel||0,newZoom=map.getZoom();if(newZoom>oldZoom)for(let i=oldZoom+1;i<=newZoom;++i)void 0!==this._zoomLayers[i]&&this.addLayer(this._zoomLayers[i]);else if(newZoomnewZoom;--i)void 0!==this._zoomLayers[i]&&this.removeLayer(this._zoomLayers[i]);this._lastZoomLevel=newZoom};map.on("zoomend",updateMarkerVisibility),updateMarkerVisibility()},_minimumZoomLevelForItem:function(i,zoom){for(;i>0&&i%2==0;)--zoom,i=Math.floor(i/2);return zoom}}),L.Polyline.include({_originalOnAdd:L.Polyline.prototype.onAdd,_originalOnRemove:L.Polyline.prototype.onRemove,addDistanceMarkers:function(){this._map&&this._distanceMarkers&&this._map.addLayer(this._distanceMarkers)},removeDistanceMarkers:function(){this._map&&this._distanceMarkers&&this._map.removeLayer(this._distanceMarkers)},onAdd:function(map){this._originalOnAdd(map);let opts=this.options.distanceMarkers||{};this.options.distanceMarkers&&(this._distanceMarkers=this._distanceMarkers||new L.DistanceMarkers(this,map,opts)),void 0!==opts.lazy&&!1!==opts.lazy||this.addDistanceMarkers()},onRemove:function(map){this.removeDistanceMarkers(),this._originalOnRemove(map)}});
--------------------------------------------------------------------------------
/libs/leaflet-edgescale.min.js:
--------------------------------------------------------------------------------
1 | L.Control.EdgeScale=L.Control.extend({options:{position:"bottomleft",icon:!0,coords:!0,bar:!0,onMove:!0,template:"{y} | {x}",projected:!1,formatProjected:"#.##0,000",latlngFormat:"DD",latlngDesignators:!0,latLngFormatter:void 0,iconStyle:{background:"url(\"data:image/svg+xml,%3Csvg xmlns='http://www.w3.org/2000/svg' xml:space='preserve' viewBox='0 0 100 100'%3E%3Cg stroke='%23fff'%3E%3Ccircle cx='50' cy='50.2' r='3.9' stroke-width='2' /%3E%3Cpath stroke-width='3' d='M5 54h32a4 4 0 1 0 0-8H5a4 4 0 1 0 0 8z M54 5a4 4 0 1 0-8 0v32a4 4 0 1 0 8 0V5z M99 50c0-2-2-4-4-4H63a4 4 0 1 0 0 8h32c2 0 4-1 4-4zM46 95a4 4 0 1 0 8 0V64a4 4 0 1 0-8 0v31z'/%3E%3C/g%3E%3C/svg%3E%0A\")",width:"24px",height:"24px",left:"calc(50% - 12px)",top:"calc(50% - 12px)",content:"",display:"block",position:"absolute",zIndex:999,pointerEvents:"none"},containerStyle:{backgroundColor:"rgba(255, 255, 255, 0.7)",boxShadow:"0 0 5px #bbb",borderRadius:"3px",padding:"3px 2px",color:"#333",font:"11px/1.5 Consolas, monaco, monospace",writingMode:"vertical-lr"}},initialize:function(options){L.setOptions(this,options)},onAdd:function(map){return this.options.bar&&(this._scaleBar=new L.Control.EdgeScale.Layer(!0===this.options.bar?{}:this.options.bar).addTo(map)),this.options.icon&&(this._icon=L.DomUtil.create("div","leaflet-crosshair"),Object.assign(this._icon.style,this.options.iconStyle),map.getContainer().insertBefore(this._icon,map.getContainer().firstChild)),this._container=L.DomUtil.create("div","leaflet-control-mapcentercoord"),Object.assign(this._container.style,this.options.containerStyle),this.options.coords||(this._container.style.display="none"),L.DomEvent.disableClickPropagation(this._container),this._container.innerHTML=this._getMapCenterCoord(),map.on("move",this._onMapMove,this),map.on("moveend",this._onMapMove,this),this._container},onRemove:function(map){this.options.bar&&this._scaleBar.remove(),this.options.icon&&map.getContainer().removeChild(this._icon),map.off("move",this._onMapMove,this),map.off("moveend",this._onMapMove,this)},_onMapMove:function(e){(this.options.onMove||"moveend"===e.type)&&(this._container.innerHTML=this._getMapCenterCoord())},_getMapCenterCoord:function(){const center=this._map.getCenter();return this.options.projected?this._getProjectedCoord(this._map.options.crs.project(center)):this._getLatLngCoord(center)},_getProjectedCoord:function(center){return L.Util.template(this.options.template,{x:this._format(this.options.formatProjected,center.x),y:this._format(this.options.formatProjected,center.y)})},_getLatLngCoord:function(latLng){const{latLngFormatter:latLngFormatter,latlngFormat:latlngFormat,latlngDesignators:designators}=this.options;if(void 0!==latLngFormatter)return latLngFormatter(latLng.lat,latLng.lng);let lat,lng,deg,min,center={lat:latLng.lat,lng:latLng.lng,lng_neg:latLng.lng<0,lat_neg:latLng.lat<0};return center.lng<0&&(center.lng=Math.abs(center.lng)),center.lng>180&&(center.lng=360-center.lng,center.lng_neg=!center.lng_neg),center.lat<0&&(center.lat=Math.abs(center.lat)),"DM"===latlngFormat?(deg=parseInt(center.lng),lng=deg+"º "+this._format("00.000",60*(center.lng-deg))+"'",deg=parseInt(center.lat),lat=deg+"º "+this._format("00.000",60*(center.lat-deg))+"'"):"DMS"===latlngFormat?(deg=parseInt(center.lng),min=60*(center.lng-deg),lng=deg+"º "+this._format("00",parseInt(min))+"' "+this._format("00.0",60*(min-parseInt(min)))+"''",deg=parseInt(center.lat),min=60*(center.lat-deg),lat=deg+"º "+this._format("00",parseInt(min))+"' "+this._format("00.0",60*(min-parseInt(min)))+"''"):(lng=this._format("#0.00000",center.lng)+"º",lat=this._format("##0.00000",center.lat)+"º"),L.Util.template(this.options.template,{x:(!designators&¢er.lng_neg?"-":"")+lng+(designators?center.lng_neg?" W":" E":""),y:(!designators&¢er.lat_neg?"-":"")+lat+(designators?center.lat_neg?" S":" N":"")})},_format:function(m,v){if(!m||isNaN(+v))return v;let isNegative=(v="-"==m.charAt(0)?-v:+v)<0?v=-v:0,result=m.match(/[^\d\-\+#]/g),Decimal=result&&result[result.length-1]||".",Group=result&&result[1]&&result[0]||",";m=m.split(Decimal),v=+(v=v.toFixed(m[1]&&m[1].length))+"";let pos_trail_zero=m[1]&&m[1].lastIndexOf("0"),part=v.split(".");(!part[1]||part[1]&&part[1].length<=pos_trail_zero)&&(v=(+v).toFixed(pos_trail_zero+1));let szSep=m[0].split(Group);m[0]=szSep.join("");let pos_lead_zero=m[0]&&m[0].indexOf("0");if(pos_lead_zero>-1)for(;part[0].length=zoom){this._interval=dict.interval;break}}else this._interval=L.Control.Scale.prototype._getRoundNum(this._map.containerPointToLatLng([0,this._map.getSize().y/2]).distanceTo(this._map.containerPointToLatLng([L.Control.Scale.prototype.options.maxWidth,this._map.getSize().y/2])));this._currZoom=zoom},_draw:function(){this._ctx.strokeStyle=this.options.color,this._create_lat_ticks(),this._create_lon_ticks(),this._ctx.fillStyle=this.options.color,this._ctx.font=this.options.font;const size=this._map.getSize(),text=this._interval>=1e3?this._interval/1e3+" km":this._interval+" m";this._ctx.textAlign="left",this._ctx.textBaseline="middle",this._ctx.fillText(text,12,size.y/2),this._ctx.textAlign="center",this._ctx.textBaseline="top",this._ctx.fillText(text,size.x/2,12)},_create_lat_ticks:function(){const{weight:weight}=this.options,size=this._map.getSize(),to_rad=Math.PI/180,center=this._merLength(this._map.containerPointToLatLng(L.point(0,size.y/2)).lat*to_rad),top=this._merLength(this._map.containerPointToLatLng(L.point(0,0)).lat*to_rad),bottom=this._merLength(this._map.containerPointToLatLng(L.point(0,size.y)).lat*to_rad);for(let i=center+this._interval/2;i-this._LIMIT_PHI&&this._draw_lat_tick(phi,10,1.5*weight)}for(let i=center-this._interval/2;i>bottom;i-=this._interval){const phi=this._invmerLength(i);phi>-this._LIMIT_PHI&&phi-this._LIMIT_PHI&&this._draw_lat_tick(phi,4,weight)}for(let i=center-this._interval/10;i>bottom;i-=this._interval/10){const phi=this._invmerLength(i);phi>-this._LIMIT_PHI&&phileft.lng;i-=dl)this._draw_lon_tick(i,10,1.5*weight);for(let i=center.lng;ileft.lng;i-=dl/10)this._draw_lon_tick(i,4,weight)},_setCanvasPosition:function(){let lt=this._map.containerPointToLayerPoint([0,0]);this._map._bearing&&(lt=this._map.rotatedPointToMapPanePoint(this._map.containerPointToLayerPoint(L.point(this._map._container.getBoundingClientRect())))),L.DomUtil.setPosition(this._canvas,lt)},_latLngToCanvasPoint:function(latlng){return L.point(this._map.project(L.latLng(latlng))._subtract(this._map.getPixelOrigin())).add(this._map._getMapPanePos())},_draw_lat_tick:function(phi,lenght,weight){const to_deg=180/Math.PI,size=this._map.getSize(),y=this._latLngToCanvasPoint(L.latLng(phi*to_deg,0)).y;this._ctx.lineWidth=weight,this._ctx.beginPath(),this._ctx.moveTo(0,y),this._ctx.lineTo(+lenght,y),this._ctx.stroke()},_draw_lon_tick:function(lam,lenght,weight){const x=this._latLngToCanvasPoint(L.latLng(0,lam)).x;this._ctx.lineWidth=weight,this._ctx.beginPath(),this._ctx.moveTo(x,0),this._ctx.lineTo(x,lenght),this._ctx.stroke()},_merLength:function(phi){const cos2=Math.cos(2*phi),sin2=Math.sin(2*phi);return this._A*(phi+sin2*(this._c1+(this._c2+(this._c3+(this._c4+this._c5*cos2)*cos2)*cos2)*cos2))},_invmerLength:function(s){const psi=s/this._A,cos2=Math.cos(2*psi),sin2=Math.sin(2*psi);return psi+sin2*(this._ic1+(this._ic2+(this._ic3+(this._ic4+this._ic5*cos2)*cos2)*cos2)*cos2)}}),L.control.edgeScale=function(options){return new L.Control.EdgeScale(options)},L.Map.mergeOptions({edgeScaleControl:!1}),L.Map.addInitHook((function(){this.options.edgeScaleControl&&(this.edgeScaleControl=new L.Control.EdgeScale,this.addControl(this.edgeScaleControl))}));
--------------------------------------------------------------------------------
/libs/leaflet-gpxgroup.js:
--------------------------------------------------------------------------------
1 | /*
2 | * https://github.com/adoroszlai/joebed/tree/gh-pages
3 | *
4 | * The MIT License (MIT)
5 | *
6 | * Copyright (c) 2014- Doroszlai Attila, 2019- Raruto
7 | *
8 | * Permission is hereby granted, free of charge, to any person obtaining a copy of
9 | * this software and associated documentation files (the "Software"), to deal in
10 | * the Software without restriction, including without limitation the rights to
11 | * use, copy, modify, merge, publish, distribute, sublicense, and/or sell copies of
12 | * the Software, and to permit persons to whom the Software is furnished to do so,
13 | * subject to the following conditions:
14 | *
15 | * The above copyright notice and this permission notice shall be included in all
16 | * copies or substantial portions of the Software.
17 | *
18 | * THE SOFTWARE IS PROVIDED "AS IS", WITHOUT WARRANTY OF ANY KIND, EXPRESS OR
19 | * IMPLIED, INCLUDING BUT NOT LIMITED TO THE WARRANTIES OF MERCHANTABILITY, FITNESS
20 | * FOR A PARTICULAR PURPOSE AND NONINFRINGEMENT. IN NO EVENT SHALL THE AUTHORS OR
21 | * COPYRIGHT HOLDERS BE LIABLE FOR ANY CLAIM, DAMAGES OR OTHER LIABILITY, WHETHER
22 | * IN AN ACTION OF CONTRACT, TORT OR OTHERWISE, ARISING FROM, OUT OF OR IN
23 | * CONNECTION WITH THE SOFTWARE OR THE USE OR OTHER DEALINGS IN THE SOFTWARE.
24 | */
25 |
26 | L.Mixin.Selectable = {
27 | includes: L.Mixin.Events,
28 |
29 | setSelected: function(s) {
30 | var selected = !!s;
31 | if (this._selected !== selected) {
32 | this._selected = selected;
33 | this.fire('selected');
34 | }
35 | },
36 |
37 | isSelected: function() {
38 | return !!this._selected;
39 | },
40 | };
41 |
42 | L.Mixin.Selection = {
43 | includes: L.Mixin.Events,
44 |
45 | getSelection: function() {
46 | return this._selected;
47 | },
48 |
49 | setSelection: function(item) {
50 | if (this._selected === item) {
51 | if (item !== null) {
52 | item.setSelected(!item.isSelected());
53 | if (!item.isSelected()) {
54 | this._selected = null;
55 | }
56 | }
57 | } else {
58 | if (this._selected) {
59 | this._selected.setSelected(false);
60 | }
61 | this._selected = item;
62 | if (this._selected) {
63 | this._selected.setSelected(true);
64 | }
65 | }
66 | this.fire('selection_changed');
67 | },
68 | };
69 |
70 | L.Control.LayersLegend = L.Control.Layers.extend({
71 | _onInputClick: function() {
72 | this._handlingClick = true;
73 |
74 | this._layerControlInputs.reduceRight((_,input) => {
75 | if (input.checked) {
76 | this._map.fireEvent("legend_selected", {
77 | layer: this._getLayer(input.layerId).layer,
78 | input: input,
79 | }, true);
80 | return input;
81 | }
82 | }, 0);
83 |
84 | this._handlingClick = false;
85 |
86 | this._refocusOnMap();
87 | }
88 | });
89 |
90 | L.control.layersLegend = (baseLayers, overlays, options) => new L.Control.LayersLegend(baseLayers, overlays, options);
91 |
92 | L.GeoJSON.include(L.Mixin.Selectable);
93 |
94 | L.GpxGroup = L.Class.extend({
95 | options: {
96 | highlight: {
97 | color: '#ff0',
98 | opacity: 1,
99 | },
100 | points: [],
101 | points_options: {
102 | icon: {
103 | iconUrl: '../images/elevation-poi.png',
104 | iconSize: [12, 12],
105 | }
106 | },
107 | flyToBounds: true,
108 | legend: false,
109 | legend_options: {
110 | position: "topright",
111 | collapsed: false,
112 | },
113 | elevation: true,
114 | elevation_options: {
115 | theme: 'yellow-theme',
116 | detached: true,
117 | elevationDiv: '#elevation-div',
118 | },
119 | distanceMarkers: true,
120 | distanceMarkers_options: {
121 | lazy: true
122 | },
123 | },
124 |
125 | initialize: function(tracks, options) {
126 |
127 | L.Util.setOptions(this, options);
128 |
129 | this._count = 0;
130 | this._loadedCount = 0;
131 | this._tracks = tracks;
132 | this._layers = L.featureGroup();
133 | this._markers = L.featureGroup();
134 | this._elevation = L.control.elevation(this.options.elevation_options);
135 | this._legend = L.control.layersLegend(null, null, this.options.legend_options);
136 |
137 | this.options.points.forEach((poi) =>
138 | L
139 | .marker(poi.latlng, { icon: L.icon(this.options.points_options.icon) })
140 | .bindTooltip(poi.name, { direction: 'auto' }).addTo(this._markers)
141 | );
142 |
143 | },
144 |
145 | getBounds: function() {
146 | return this._layers.getBounds();
147 | },
148 |
149 | addTo: function(map) {
150 | this._layers.addTo(map);
151 | this._markers.addTo(map);
152 |
153 | this._map = map;
154 |
155 | this.on('selection_changed', this._onSelectionChanged, this);
156 | this._map.on('legend_selected', this._onLegendSelected, this);
157 | this._tracks.forEach(this.addTrack, this);
158 |
159 | },
160 |
161 | addTrack: function(track) {
162 | if (track instanceof Object) {
163 | this._loadGeoJSON(track);
164 | } else {
165 | fetch(track)
166 | .then(response => response.ok && response.text())
167 | .then(text => this._elevation._parseFromString(text))
168 | .then(geojson => this._loadGeoJSON(geojson, track.split('/').pop().split('#')[0].split('?')[0]));
169 | }
170 | },
171 |
172 | _loadGeoJSON: function(geojson, fallbackName) {
173 | if (geojson) {
174 | geojson.name = geojson.name || (geojson[0] && geojson[0].properties.name) || fallbackName;
175 | this._loadRoute(geojson);
176 | }
177 | },
178 |
179 | _loadRoute: function(data) {
180 | if (!data) return;
181 |
182 | var line_style = {
183 | color: this._uniqueColors(this._tracks.length)[this._count++],
184 | opacity: 0.75,
185 | weight: 5,
186 | distanceMarkers: this.options.distanceMarkers_options,
187 | };
188 |
189 | var route = L.geoJson(data, {
190 | name: data.name || '',
191 | style: (feature) => line_style,
192 | distanceMarkers: line_style.distanceMarkers,
193 | originalStyle: line_style,
194 | filter: feature => feature.geometry.type != "Point",
195 | });
196 |
197 |
198 | this._elevation.import(this._elevation.__LGEOMUTIL).then(() => {
199 | route.addTo(this._layers);
200 |
201 | route.eachLayer((layer) => this._onEachRouteLayer(route, layer));
202 | this._onEachRouteLoaded(route);
203 | });
204 |
205 | },
206 |
207 | _onEachRouteLayer: function(route, layer) {
208 | var polyline = layer;
209 |
210 | route.on('selected', L.bind(this._onRouteSelected, this, route, polyline));
211 |
212 | polyline.on('mouseover', L.bind(this._onRouteMouseOver, this, route, polyline));
213 | polyline.on('mouseout', L.bind(this._onRouteMouseOut, this, route, polyline));
214 | polyline.on('click', L.bind(this._onRouteClick, this, route, polyline));
215 |
216 | polyline.bindTooltip(route.options.name, { direction: 'auto', sticky: true, });
217 | },
218 |
219 | _onEachRouteLoaded: function(route) {
220 | if (this.options.legend) {
221 | this._legend.addBaseLayer(route, '' + ' ' + route.options.name);
222 | }
223 |
224 | this.fire('route_loaded', { route: route });
225 |
226 | if (++this._loadedCount === this._tracks.length) {
227 | this.fire('loaded');
228 | if (this.options.flyToBounds) {
229 | this._map.flyToBounds(this.getBounds(), { duration: 0.25, easeLinearity: 0.25, noMoveStart: true });
230 | }
231 | if (this.options.legend) {
232 | this._legend.addTo(this._map);
233 | }
234 | }
235 | },
236 |
237 | highlight: function(route, polyline) {
238 | polyline.setStyle(this.options.highlight);
239 | if (this.options.distanceMarkers) {
240 | polyline.addDistanceMarkers();
241 | }
242 | },
243 |
244 | unhighlight: function(route, polyline) {
245 | polyline.setStyle(route.options.originalStyle);
246 | if (this.options.distanceMarkers) {
247 | polyline.removeDistanceMarkers();
248 | }
249 | },
250 |
251 | _onRouteMouseOver: function(route, polyline) {
252 | if (!route.isSelected()) {
253 | this.highlight(route, polyline);
254 | if (this.options.legend) {
255 | this.setSelection(route);
256 | L.DomUtil.get('legend_' + route._leaflet_id).parentNode.previousSibling.click();
257 | }
258 | }
259 | this.fire('route_mouseover', { route: route, polyline: polyline });
260 | },
261 |
262 | _onRouteMouseOut: function(route, polyline) {
263 | if (!route.isSelected()) {
264 | this.unhighlight(route, polyline);
265 | }
266 | this.fire('route_mouseout', { route: route, polyline: polyline });
267 | },
268 |
269 | _onRouteClick: function(route, polyline) {
270 | this.setSelection(route);
271 | },
272 |
273 | _onRouteSelected: function(route, polyline) {
274 | if (!route.isSelected()) {
275 | this.unhighlight(route, polyline);
276 | }
277 | },
278 |
279 | _onSelectionChanged: function(e) {
280 | var elevation = this._elevation;
281 | var eleDiv = elevation.getContainer();
282 | var route = this.getSelection();
283 |
284 | elevation.clear();
285 |
286 | if (route && route.isSelected()) {
287 | if (!eleDiv) {
288 | elevation.addTo(this._map);
289 | }
290 | route.getLayers().forEach(function(layer) {
291 | if (layer instanceof L.Polyline) {
292 | elevation.addData(layer, false);
293 | layer.bringToFront();
294 | }
295 | });
296 | } else {
297 | if (eleDiv) {
298 | elevation.remove();
299 | }
300 | }
301 | },
302 |
303 | _onLegendSelected: function(e) {
304 | var parent = e.input.closest('.leaflet-control-layers-list');
305 | var route = e.layer;
306 |
307 | if (!route.isSelected()) {
308 | this.setSelection(route);
309 | for (var i in route._layers) {
310 | this.highlight(route, route._layers[i]);
311 | }
312 | this._map.flyToBounds(e.layer.getBounds());
313 | }
314 |
315 | parent.scroll({ top: (e.input.offsetTop - parent.offsetTop) || 0, behavior: 'smooth' });
316 |
317 | this._layers.eachLayer(layer => {
318 | var legend = L.DomUtil.get('legend_' + layer._leaflet_id);
319 | legend.querySelector("line").style.stroke = layer.isSelected() ? this.options.highlight.color : "";
320 | legend.parentNode.style.fontWeight = layer.isSelected() ? "700" : "";
321 | });
322 | },
323 |
324 | _uniqueColors: function(count) {
325 | return count === 1 ? ['#0000ff'] : new Array(count).fill(null).map((_,i) => this._hsvToHex(i * (1 / count), 1, 0.7));
326 | },
327 |
328 | _hsvToHex: function(h, s, v) {
329 | var i = Math.floor(h * 6);
330 | var f = h * 6 - i;
331 | var p = v * (1 - s);
332 | var q = v * (1 - f * s);
333 | var t = v * (1 - (1 - f) * s);
334 | var rgb = { 0: [v, t, p], 1: [q, v, p], 2: [p, v, t], 3: [p, q, v], 4: [t, p, v], 5: [v, p, q] }[i % 6];
335 | return rgb.map(d => d * 255).reduce((hex, byte) => hex + ((byte >> 4) & 0x0F).toString(16) + (byte & 0x0F).toString(16), "#");
336 | },
337 |
338 | removeFrom: function(map) {
339 | this._layers.removeFrom(map);
340 | },
341 |
342 | });
343 |
344 | L.GpxGroup.include(L.Mixin.Events);
345 | L.GpxGroup.include(L.Mixin.Selection);
346 |
347 | L.gpxGroup = (tracks, options) => new L.GpxGroup(tracks, options);
--------------------------------------------------------------------------------
/libs/leaflet-gpxgroup.min.js:
--------------------------------------------------------------------------------
1 | L.Mixin.Selectable={includes:L.Mixin.Events,setSelected:function(s){var selected=!!s;this._selected!==selected&&(this._selected=selected,this.fire("selected"))},isSelected:function(){return!!this._selected}},L.Mixin.Selection={includes:L.Mixin.Events,getSelection:function(){return this._selected},setSelection:function(item){this._selected===item?null!==item&&(item.setSelected(!item.isSelected()),item.isSelected()||(this._selected=null)):(this._selected&&this._selected.setSelected(!1),this._selected=item,this._selected&&this._selected.setSelected(!0)),this.fire("selection_changed")}},L.Control.LayersLegend=L.Control.Layers.extend({_onInputClick:function(){this._handlingClick=!0,this._layerControlInputs.reduceRight((_,input)=>{if(input.checked)return this._map.fireEvent("legend_selected",{layer:this._getLayer(input.layerId).layer,input:input},!0),input},0),this._handlingClick=!1,this._refocusOnMap()}}),L.control.layersLegend=(baseLayers,overlays,options)=>new L.Control.LayersLegend(baseLayers,overlays,options),L.GeoJSON.include(L.Mixin.Selectable),L.GpxGroup=L.Class.extend({options:{highlight:{color:"#ff0",opacity:1},points:[],points_options:{icon:{iconUrl:"../images/elevation-poi.png",iconSize:[12,12]}},flyToBounds:!0,legend:!1,legend_options:{position:"topright",collapsed:!1},elevation:!0,elevation_options:{theme:"yellow-theme",detached:!0,elevationDiv:"#elevation-div"},distanceMarkers:!0,distanceMarkers_options:{lazy:!0}},initialize:function(tracks,options){L.Util.setOptions(this,options),this._count=0,this._loadedCount=0,this._tracks=tracks,this._layers=L.featureGroup(),this._markers=L.featureGroup(),this._elevation=L.control.elevation(this.options.elevation_options),this._legend=L.control.layersLegend(null,null,this.options.legend_options),this.options.points.forEach(poi=>L.marker(poi.latlng,{icon:L.icon(this.options.points_options.icon)}).bindTooltip(poi.name,{direction:"auto"}).addTo(this._markers))},getBounds:function(){return this._layers.getBounds()},addTo:function(map){this._layers.addTo(map),this._markers.addTo(map),this._map=map,this.on("selection_changed",this._onSelectionChanged,this),this._map.on("legend_selected",this._onLegendSelected,this),this._tracks.forEach(this.addTrack,this)},addTrack:function(track){track instanceof Object?this._loadGeoJSON(track):fetch(track).then(response=>response.ok&&response.text()).then(text=>this._elevation._parseFromString(text)).then(geojson=>this._loadGeoJSON(geojson,track.split("/").pop().split("#")[0].split("?")[0]))},_loadGeoJSON:function(geojson,fallbackName){geojson&&(geojson.name=geojson.name||geojson[0]&&geojson[0].properties.name||fallbackName,this._loadRoute(geojson))},_loadRoute:function(data){if(data){var line_style={color:this._uniqueColors(this._tracks.length)[this._count++],opacity:.75,weight:5,distanceMarkers:this.options.distanceMarkers_options},route=L.geoJson(data,{name:data.name||"",style:feature=>line_style,distanceMarkers:line_style.distanceMarkers,originalStyle:line_style,filter:feature=>"Point"!=feature.geometry.type});this._elevation.import(this._elevation.__LGEOMUTIL).then(()=>{route.addTo(this._layers),route.eachLayer(layer=>this._onEachRouteLayer(route,layer)),this._onEachRouteLoaded(route)})}},_onEachRouteLayer:function(route,layer){var polyline=layer;route.on("selected",L.bind(this._onRouteSelected,this,route,polyline)),polyline.on("mouseover",L.bind(this._onRouteMouseOver,this,route,polyline)),polyline.on("mouseout",L.bind(this._onRouteMouseOut,this,route,polyline)),polyline.on("click",L.bind(this._onRouteClick,this,route,polyline)),polyline.bindTooltip(route.options.name,{direction:"auto",sticky:!0})},_onEachRouteLoaded:function(route){this.options.legend&&this._legend.addBaseLayer(route,' '+route.options.name),this.fire("route_loaded",{route:route}),++this._loadedCount===this._tracks.length&&(this.fire("loaded"),this.options.flyToBounds&&this._map.flyToBounds(this.getBounds(),{duration:.25,easeLinearity:.25,noMoveStart:!0}),this.options.legend&&this._legend.addTo(this._map))},highlight:function(route,polyline){polyline.setStyle(this.options.highlight),this.options.distanceMarkers&&polyline.addDistanceMarkers()},unhighlight:function(route,polyline){polyline.setStyle(route.options.originalStyle),this.options.distanceMarkers&&polyline.removeDistanceMarkers()},_onRouteMouseOver:function(route,polyline){route.isSelected()||(this.highlight(route,polyline),this.options.legend&&(this.setSelection(route),L.DomUtil.get("legend_"+route._leaflet_id).parentNode.previousSibling.click())),this.fire("route_mouseover",{route:route,polyline:polyline})},_onRouteMouseOut:function(route,polyline){route.isSelected()||this.unhighlight(route,polyline),this.fire("route_mouseout",{route:route,polyline:polyline})},_onRouteClick:function(route,polyline){this.setSelection(route)},_onRouteSelected:function(route,polyline){route.isSelected()||this.unhighlight(route,polyline)},_onSelectionChanged:function(e){var elevation=this._elevation,eleDiv=elevation.getContainer(),route=this.getSelection();elevation.clear(),route&&route.isSelected()?(eleDiv||elevation.addTo(this._map),route.getLayers().forEach((function(layer){layer instanceof L.Polyline&&(elevation.addData(layer,!1),layer.bringToFront())}))):eleDiv&&elevation.remove()},_onLegendSelected:function(e){var parent=e.input.closest(".leaflet-control-layers-list"),route=e.layer;if(!route.isSelected()){for(var i in this.setSelection(route),route._layers)this.highlight(route,route._layers[i]);this._map.flyToBounds(e.layer.getBounds())}parent.scroll({top:e.input.offsetTop-parent.offsetTop||0,behavior:"smooth"}),this._layers.eachLayer(layer=>{var legend=L.DomUtil.get("legend_"+layer._leaflet_id);legend.querySelector("line").style.stroke=layer.isSelected()?this.options.highlight.color:"",legend.parentNode.style.fontWeight=layer.isSelected()?"700":""})},_uniqueColors:function(count){return 1===count?["#0000ff"]:new Array(count).fill(null).map((_,i)=>this._hsvToHex(i*(1/count),1,.7))},_hsvToHex:function(h,s,v){var i=Math.floor(6*h),f=6*h-i,p=v*(1-s),q=v*(1-f*s),t=v*(1-(1-f)*s),rgb;return{0:[v,t,p],1:[q,v,p],2:[p,v,t],3:[p,q,v],4:[t,p,v],5:[v,p,q]}[i%6].map(d=>255*d).reduce((hex,byte)=>hex+(byte>>4&15).toString(16)+(15&byte).toString(16),"#")},removeFrom:function(map){this._layers.removeFrom(map)}}),L.GpxGroup.include(L.Mixin.Events),L.GpxGroup.include(L.Mixin.Selection),L.gpxGroup=(tracks,options)=>new L.GpxGroup(tracks,options);
--------------------------------------------------------------------------------
/libs/leaflet-hotline.js:
--------------------------------------------------------------------------------
1 | /*
2 | (c) 2017, iosphere GmbH
3 | Leaflet.hotline, a Leaflet plugin for drawing gradients along polylines.
4 | https://github.com/iosphere/Leaflet.hotline/
5 | */
6 |
7 | (function (root, plugin) {
8 | /**
9 | * UMD wrapper.
10 | * When used directly in the Browser it expects Leaflet to be globally
11 | * available as `L`. The plugin then adds itself to Leaflet.
12 | * When used as a CommonJS module (e.g. with browserify) only the plugin
13 | * factory gets exported, so one hast to call the factory manually and pass
14 | * Leaflet as the only parameter.
15 | * @see {@link https://github.com/umdjs/umd}
16 | */
17 | if (typeof define === 'function' && define.amd) {
18 | define(['leaflet'], plugin);
19 | } else if (typeof exports === 'object') {
20 | module.exports = plugin;
21 | } else {
22 | plugin(root.L);
23 | }
24 | }(window, function (L) {
25 | // Plugin is already added to Leaflet
26 | if (L.Hotline) {
27 | return L;
28 | }
29 |
30 | /**
31 | * Core renderer.
32 | * @constructor
33 | * @param {HTMLElement | string} canvas - <canvas> element or its id
34 | * to initialize the instance on.
35 | */
36 | var Hotline = function (canvas) {
37 | if (!(this instanceof Hotline)) { return new Hotline(canvas); }
38 |
39 | var defaultPalette = {
40 | 0.0: 'green',
41 | 0.5: 'yellow',
42 | 1.0: 'red'
43 | };
44 |
45 | this._canvas = canvas = ('string' === typeof canvas)
46 | ? document.getElementById(canvas)
47 | : canvas;
48 |
49 | this._ctx = canvas.getContext('2d');
50 | this._width = canvas.width;
51 | this._height = canvas.height;
52 |
53 | this._weight = 5;
54 | this._outlineWidth = 1;
55 | this._outlineColor = 'black';
56 |
57 | this._min = 0;
58 | this._max = 1;
59 |
60 | this._data = [];
61 |
62 | this.palette(defaultPalette);
63 | };
64 |
65 | Hotline.prototype = {
66 | /**
67 | * Sets the width of the canvas. Used when clearing the canvas.
68 | * @param {number} width - Width of the canvas.
69 | */
70 | width: function (width) {
71 | this._width = width;
72 | return this;
73 | },
74 |
75 | /**
76 | * Sets the height of the canvas. Used when clearing the canvas.
77 | * @param {number} height - Height of the canvas.
78 | */
79 | height: function (height) {
80 | this._height = height;
81 | return this;
82 | },
83 |
84 | /**
85 | * Sets the weight of the path.
86 | * @param {number} weight - Weight of the path in px.
87 | */
88 | weight: function (weight) {
89 | this._weight = weight;
90 | return this;
91 | },
92 |
93 | /**
94 | * Sets the width of the outline around the path.
95 | * @param {number} outlineWidth - Width of the outline in px.
96 | */
97 | outlineWidth: function (outlineWidth) {
98 | this._outlineWidth = outlineWidth;
99 | return this;
100 | },
101 |
102 | /**
103 | * Sets the color of the outline around the path.
104 | * @param {string} outlineColor - A CSS color value.
105 | */
106 | outlineColor: function (outlineColor) {
107 | this._outlineColor = outlineColor;
108 | return this;
109 | },
110 |
111 | /**
112 | * Sets the palette gradient.
113 | * @param {Object.} palette - Gradient definition.
114 | * e.g. { 0.0: 'white', 1.0: 'black' }
115 | */
116 | palette: function (palette) {
117 | var canvas = document.createElement('canvas'),
118 | ctx = canvas.getContext('2d'),
119 | gradient = ctx.createLinearGradient(0, 0, 0, 256);
120 |
121 | canvas.width = 1;
122 | canvas.height = 256;
123 |
124 | for (var i in palette) {
125 | gradient.addColorStop(i, palette[i]);
126 | }
127 |
128 | ctx.fillStyle = gradient;
129 | ctx.fillRect(0, 0, 1, 256);
130 |
131 | this._palette = ctx.getImageData(0, 0, 1, 256).data;
132 |
133 | return this;
134 | },
135 |
136 | /**
137 | * Sets the value used at the start of the palette gradient.
138 | * @param {number} min
139 | */
140 | min: function (min) {
141 | this._min = min;
142 | return this;
143 | },
144 |
145 | /**
146 | * Sets the value used at the end of the palette gradient.
147 | * @param {number} max
148 | */
149 | max: function (max) {
150 | this._max = max;
151 | return this;
152 | },
153 |
154 | /**
155 | * A path to rander as a hotline.
156 | * @typedef Array.<{x:number, y:number, z:number}> Path - Array of x, y and z coordinates.
157 | */
158 |
159 | /**
160 | * Sets the data that gets drawn on the canvas.
161 | * @param {(Path|Path[])} data - A single path or an array of paths.
162 | */
163 | data: function (data) {
164 | this._data = data;
165 | return this;
166 | },
167 |
168 | /**
169 | * Adds a path to the list of paths.
170 | * @param {Path} path
171 | */
172 | add: function (path) {
173 | this._data.push(path);
174 | return this;
175 | },
176 |
177 | /**
178 | * Draws the currently set paths.
179 | */
180 | draw: function () {
181 | var ctx = this._ctx;
182 |
183 | ctx.globalCompositeOperation = 'source-over';
184 | ctx.lineCap = 'round';
185 |
186 | this._drawOutline(ctx);
187 | this._drawHotline(ctx);
188 |
189 | return this;
190 | },
191 |
192 | /**
193 | * Gets the RGB values of a given z value of the current palette.
194 | * @param {number} value - Value to get the color for, should be between min and max.
195 | * @returns {Array.} The RGB values as an array [r, g, b]
196 | */
197 | getRGBForValue: function (value) {
198 | var valueRelative = Math.min(Math.max((value - this._min) / (this._max - this._min), 0), 0.999);
199 | var paletteIndex = Math.floor(valueRelative * 256) * 4;
200 |
201 | return [
202 | this._palette[paletteIndex],
203 | this._palette[paletteIndex + 1],
204 | this._palette[paletteIndex + 2]
205 | ];
206 | },
207 |
208 | /**
209 | * Draws the outline of the graphs.
210 | * @private
211 | */
212 | _drawOutline: function (ctx) {
213 | var i, j, dataLength, path, pathLength, pointStart, pointEnd;
214 |
215 | if (this._outlineWidth) {
216 | for (i = 0, dataLength = this._data.length; i < dataLength; i++) {
217 | path = this._data[i];
218 | ctx.lineWidth = this._weight + 2 * this._outlineWidth;
219 |
220 | for (j = 1, pathLength = path.length; j < pathLength; j++) {
221 | pointStart = path[j - 1];
222 | pointEnd = path[j];
223 |
224 | ctx.strokeStyle = this._outlineColor;
225 | ctx.beginPath();
226 | ctx.moveTo(pointStart.x, pointStart.y);
227 | ctx.lineTo(pointEnd.x, pointEnd.y);
228 | ctx.stroke();
229 | }
230 | }
231 | }
232 | },
233 |
234 | /**
235 | * Draws the color encoded hotline of the graphs.
236 | * @private
237 | */
238 | _drawHotline: function (ctx) {
239 | var i, j, dataLength, path, pathLength, pointStart, pointEnd,
240 | gradient, gradientStartRGB, gradientEndRGB;
241 |
242 | ctx.lineWidth = this._weight;
243 |
244 | for (i = 0, dataLength = this._data.length; i < dataLength; i++) {
245 | path = this._data[i];
246 |
247 | for (j = 1, pathLength = path.length; j < pathLength; j++) {
248 | pointStart = path[j - 1];
249 | pointEnd = path[j];
250 |
251 | // Create a gradient for each segment, pick start end end colors from palette gradient
252 | gradient = ctx.createLinearGradient(pointStart.x, pointStart.y, pointEnd.x, pointEnd.y);
253 | gradientStartRGB = this.getRGBForValue(pointStart.z);
254 | gradientEndRGB = this.getRGBForValue(pointEnd.z);
255 | gradient.addColorStop(0, 'rgb(' + gradientStartRGB.join(',') + ')');
256 | gradient.addColorStop(1, 'rgb(' + gradientEndRGB.join(',') + ')');
257 |
258 | ctx.strokeStyle = gradient;
259 | ctx.beginPath();
260 | ctx.moveTo(pointStart.x, pointStart.y);
261 | ctx.lineTo(pointEnd.x, pointEnd.y);
262 | ctx.stroke();
263 | }
264 | }
265 | }
266 | };
267 |
268 |
269 | var Renderer = L.Canvas.extend({
270 | _initContainer: function () {
271 | L.Canvas.prototype._initContainer.call(this);
272 | this._hotline = new Hotline(this._container);
273 | },
274 |
275 | _update: function () {
276 | L.Canvas.prototype._update.call(this);
277 | this._hotline.width(this._container.width);
278 | this._hotline.height(this._container.height);
279 | },
280 |
281 | _updatePoly: function (layer) {
282 | if (!this._drawing) { return; }
283 |
284 | var parts = layer._parts;
285 |
286 | if (!parts.length) { return; }
287 |
288 | this._updateOptions(layer);
289 |
290 | this._hotline
291 | .data(parts)
292 | .draw();
293 | },
294 |
295 | _updateOptions: function (layer) {
296 | if (layer.options.min != null) {
297 | this._hotline.min(layer.options.min);
298 | }
299 | if (layer.options.max != null) {
300 | this._hotline.max(layer.options.max);
301 | }
302 | if (layer.options.weight != null) {
303 | this._hotline.weight(layer.options.weight);
304 | }
305 | if (layer.options.outlineWidth != null) {
306 | this._hotline.outlineWidth(layer.options.outlineWidth);
307 | }
308 | if (layer.options.outlineColor != null) {
309 | this._hotline.outlineColor(layer.options.outlineColor);
310 | }
311 | if (layer.options.palette) {
312 | this._hotline.palette(layer.options.palette);
313 | }
314 | }
315 | });
316 |
317 | var renderer = function (options) {
318 | return L.Browser.canvas ? new Renderer(options) : null;
319 | };
320 |
321 |
322 | var Util = {
323 | /**
324 | * This is just a copy of the original Leaflet version that support a third z coordinate.
325 | * @see {@link http://leafletjs.com/reference.html#lineutil-clipsegment|Leaflet}
326 | */
327 | clipSegment: function (a, b, bounds, useLastCode, round) {
328 | var codeA = useLastCode ? this._lastCode : L.LineUtil._getBitCode(a, bounds),
329 | codeB = L.LineUtil._getBitCode(b, bounds),
330 | codeOut, p, newCode;
331 |
332 | // save 2nd code to avoid calculating it on the next segment
333 | this._lastCode = codeB;
334 |
335 | while (true) {
336 | // if a,b is inside the clip window (trivial accept)
337 | if (!(codeA | codeB)) {
338 | return [a, b];
339 | // if a,b is outside the clip window (trivial reject)
340 | } else if (codeA & codeB) {
341 | return false;
342 | // other cases
343 | } else {
344 | codeOut = codeA || codeB;
345 | p = L.LineUtil._getEdgeIntersection(a, b, codeOut, bounds, round);
346 | newCode = L.LineUtil._getBitCode(p, bounds);
347 |
348 | if (codeOut === codeA) {
349 | p.z = a.z;
350 | a = p;
351 | codeA = newCode;
352 | } else {
353 | p.z = b.z;
354 | b = p;
355 | codeB = newCode;
356 | }
357 | }
358 | }
359 | }
360 | };
361 |
362 |
363 | L.Hotline = L.Polyline.extend({
364 | statics: {
365 | Renderer: Renderer,
366 | renderer: renderer
367 | },
368 |
369 | options: {
370 | renderer: renderer(),
371 | min: 0,
372 | max: 1,
373 | palette: {
374 | 0.0: 'green',
375 | 0.5: 'yellow',
376 | 1.0: 'red'
377 | },
378 | weight: 5,
379 | outlineColor: 'black',
380 | outlineWidth: 1
381 | },
382 |
383 | getRGBForValue: function (value) {
384 | return this._renderer._hotline.getRGBForValue(value);
385 | },
386 |
387 | /**
388 | * Just like the Leaflet version, but with support for a z coordinate.
389 | */
390 | _projectLatlngs: function (latlngs, result, projectedBounds) {
391 | var flat = latlngs[0] instanceof L.LatLng,
392 | len = latlngs.length,
393 | i, ring;
394 |
395 | if (flat) {
396 | ring = [];
397 | for (i = 0; i < len; i++) {
398 | ring[i] = this._map.latLngToLayerPoint(latlngs[i]);
399 | // Add the altitude of the latLng as the z coordinate to the point
400 | ring[i].z = latlngs[i].alt;
401 | projectedBounds.extend(ring[i]);
402 | }
403 | result.push(ring);
404 | } else {
405 | for (i = 0; i < len; i++) {
406 | this._projectLatlngs(latlngs[i], result, projectedBounds);
407 | }
408 | }
409 | },
410 |
411 | /**
412 | * Just like the Leaflet version, but uses `Util.clipSegment()`.
413 | */
414 | _clipPoints: function () {
415 | if (this.options.noClip) {
416 | this._parts = this._rings;
417 | return;
418 | }
419 |
420 | this._parts = [];
421 |
422 | var parts = this._parts,
423 | bounds = this._renderer._bounds,
424 | i, j, k, len, len2, segment, points;
425 |
426 | for (i = 0, k = 0, len = this._rings.length; i < len; i++) {
427 | points = this._rings[i];
428 |
429 | for (j = 0, len2 = points.length; j < len2 - 1; j++) {
430 | segment = Util.clipSegment(points[j], points[j + 1], bounds, j, true);
431 |
432 | if (!segment) { continue; }
433 |
434 | parts[k] = parts[k] || [];
435 | parts[k].push(segment[0]);
436 |
437 | // if segment goes out of screen, or it's the last one, it's the end of the line part
438 | if ((segment[1] !== points[j + 1]) || (j === len2 - 2)) {
439 | parts[k].push(segment[1]);
440 | k++;
441 | }
442 | }
443 | }
444 | },
445 |
446 | _clickTolerance: function () {
447 | return this.options.weight / 2 + this.options.outlineWidth + (L.Browser.touch ? 10 : 0);
448 | }
449 | });
450 |
451 | L.hotline = function (latlngs, options) {
452 | return new L.Hotline(latlngs, options);
453 | };
454 |
455 |
456 | return L;
457 | }));
--------------------------------------------------------------------------------
/libs/leaflet-hotline.min.js:
--------------------------------------------------------------------------------
1 | !function(root,plugin){"function"==typeof define&&define.amd?define(["leaflet"],plugin):"object"==typeof exports?module.exports=plugin:plugin(root.L)}(window,(function(L){if(L.Hotline)return L;var Hotline=function(canvas){if(!(this instanceof Hotline))return new Hotline(canvas);var defaultPalette={0:"green",.5:"yellow",1:"red"};this._canvas=canvas="string"==typeof canvas?document.getElementById(canvas):canvas,this._ctx=canvas.getContext("2d"),this._width=canvas.width,this._height=canvas.height,this._weight=5,this._outlineWidth=1,this._outlineColor="black",this._min=0,this._max=1,this._data=[],this.palette(defaultPalette)};Hotline.prototype={width:function(width){return this._width=width,this},height:function(height){return this._height=height,this},weight:function(weight){return this._weight=weight,this},outlineWidth:function(outlineWidth){return this._outlineWidth=outlineWidth,this},outlineColor:function(outlineColor){return this._outlineColor=outlineColor,this},palette:function(palette){var canvas=document.createElement("canvas"),ctx=canvas.getContext("2d"),gradient=ctx.createLinearGradient(0,0,0,256);for(var i in canvas.width=1,canvas.height=256,palette)gradient.addColorStop(i,palette[i]);return ctx.fillStyle=gradient,ctx.fillRect(0,0,1,256),this._palette=ctx.getImageData(0,0,1,256).data,this},min:function(min){return this._min=min,this},max:function(max){return this._max=max,this},data:function(data){return this._data=data,this},add:function(path){return this._data.push(path),this},draw:function(){var ctx=this._ctx;return ctx.globalCompositeOperation="source-over",ctx.lineCap="round",this._drawOutline(ctx),this._drawHotline(ctx),this},getRGBForValue:function(value){var valueRelative=Math.min(Math.max((value-this._min)/(this._max-this._min),0),.999),paletteIndex=4*Math.floor(256*valueRelative);return[this._palette[paletteIndex],this._palette[paletteIndex+1],this._palette[paletteIndex+2]]},_drawOutline:function(ctx){var i,j,dataLength,path,pathLength,pointStart,pointEnd;if(this._outlineWidth)for(i=0,dataLength=this._data.length;iIcons made by Freepik from www.flaticon.com is licensed by CC 3.0 BY */
5 | background-repeat: no-repeat;
6 | background-position: center;
7 | }
8 | .leaflet-ruler-clicked,
9 | .leaflet-ruler:hover {
10 | background-image: url("data:image/png;base64,iVBORw0KGgoAAAANSUhEUgAAABgAAAAYCAYAAADgdz34AAAE/ElEQVRIS6WVeWwUVRzHfzOzs7Pdi+7Rdq/ubrH0sNaKBFMCSEvBQLivFkhAE8GDYAyHATWgETUoMZ7BGCMBNKYiQbTKpYQKBqKlWmBbadmW7bbbFjv0mu2eM298M5SlpS3U+LL/zL6Zz/f7vr/3e4+AsQ6j80EgxTkKhGwkQRqQiLp5UtEOSDwOXf660TDEPfkGR75RTT8VF1EpJRJ6LsbrVuaZg2YtrWND8WD5FVajV9IcTyCOoYhv2QgcgE5fzWDmaAKU0eHa3RMStszNMqIdM+zUY3YdPFvRCG+VOCFFQ0N3mIfNJ3ywb3Em/BHgYNeZFnTc20OOU1Efd7eZtwBUxyWh4QLJGS6jFv04MU2bNWeCQRnoi8L7czPuG+RLJ31g0Smhsqk3dqGVa7wZZOZBb/31oQKm8ZMZRbxyU6FV9XaJmyQGZsNxBD/Ud8FXNWy/rzci9ER4Spqa5tYrit3jmNI8M2DnCRNvnm1Bu35tjcR4lH1HIDtbp+2NNuSmqCyTrBr4dMEDuH4A754LCLvOtQo44zouKp7hQagGIK+CIFgoipqPEHru6OocWJhtlAWk6GZ8cSXs64sd49qbSxMCaenu7+ZkGuftW5JJSy/FBARlh+vDF1tDfWEerYWullNDcjK5c9Q0Or/jcad++3SbbP8ueBn+S7glkOIsNTDUQf+mRxmtkoIIj6Bgb024hYtVhGPK9dDl7RsJvhPDtw3AcWzYuSd8vTcqOS8DrcUIKsUiWcDgyKghRLFgZ1E6vFhohfXfN8YP1bFVfW3N0/E0Ggu8CMNxfY9z7b5SCU4o6dMkhc4RYM61aulwU8fWSSqaIqEqEIRZBzzBSCg+HoIdncPglHgBG9ENdj4inEAXhZuBdQSYXBuWZOnfOLI61yTB1ld4Y1/+xe6Ndvo33Q+ON5Rc0GHOB+DS6gmF2XF6dkZy0eeLM8lU3EDGd6qiQRAnQnvz3wkBXFANdr5jkHMJXrS/NtTIRk5yN3wrErEMgsuNpkp13ViRZ0zdOtUOWiUJ2R/WxPibfmYk+Mp8E/XCT01y4y0/1HBfuCygMDljVzYW0DnmJKhuC8Lsg7WB7kCzQxa4y7nUF08euQblHlZMoqij93J+2yBBpzgjlzcUMJLAmeu9sOjrq+1cR7PtNvzVYrv+5WkOUvpAiqUYx+JlI6cwfPlosQyuHcGYnYECq9r2AV62O5mB9PcuItxjj2ho6uz/hcsRESbH4TX5qQv3LsigNbjJ7Huq+tkIT75enM4Mdx76mbvhXzYW54mIwOBeNd2l+eTs03nyYYIPqrhaSVGbC213xfLf4fIKAB9yqp4IW/VMvtKqVYJJrUhEeCdzGS5lbki22Wu5btYg0IwV2hrYIb0ywoN8VCTbXadDUTRz/9IJsCrfLL82CP7LQCyGcVab56HColQkCKL3ctWxTs/5+WMSAHwPGBih0rNxotqGL42R4DqLpebhKTNta7fvgWBfN7yybIoQjYdzoLPVey+RxHFtdrhfy05J2laxKjep5EAd3oqhhHNtqrm6YOoT6RKcIOXSwEdb1ojXLv35fDRQ99mYBKR6GOyu3zBhcowXTvR3+JdCWhqjVhk9FEW7Z5Wtw1vuFlwatb9XQmuD51J/MFQ+qgAheIdemSl5FoDgOuhs3o0/4vWOKcZkh/4bEJFKxAMA/6QhgsjzAvrH3+SXn0YZAinU/wuTosgK53+p+wAAAABJRU5ErkJggg=="); /* */
11 | }
12 | .leaflet-ruler-clicked {
13 | height: 35px;
14 | width: 35px;
15 | background-repeat: no-repeat;
16 | background-position: center;
17 | border-color: chartreuse !important;
18 | }
19 | .leaflet-bar.leaflet-ruler {
20 | background-color: #ffffff;
21 | }
22 | .leaflet-control.leaflet-ruler {
23 | cursor: pointer;
24 | }
25 | .result-tooltip {
26 | background-color: white;
27 | border-width: medium;
28 | border-color: #de0000;
29 | font-size: smaller;
30 | }
31 | .moving-tooltip {
32 | background-color: rgba(255, 255, 255, .7);
33 | background-clip: padding-box;
34 | opacity: 0.5;
35 | border: dotted;
36 | border-color: red;
37 | font-size: smaller;
38 | }
39 | .plus-length {
40 | padding-left: 45px;
41 | }
42 |
--------------------------------------------------------------------------------
/libs/leaflet-ruler.js:
--------------------------------------------------------------------------------
1 | /*
2 | * Copyright (c) 2022, GPL-3.0+ Project, Raruto
3 | *
4 | * This file is free software: you may copy, redistribute and/or modify it
5 | * under the terms of the GNU General Public License as published by the
6 | * Free Software Foundation, either version 2 of the License, or (at your
7 | * option) any later version.
8 | *
9 | * This file is distributed in the hope that it will be useful, but
10 | * WITHOUT ANY WARRANTY; without even the implied warranty of
11 | * MERCHANTABILITY or FITNESS FOR A PARTICULAR PURPOSE. See the GNU
12 | * General Public License for more details.
13 | *
14 | * You should have received a copy of the GNU General Public License
15 | * along with this program. If not, see .
16 | *
17 | * This file incorporates work covered by the following copyright and
18 | * permission notice:
19 | *
20 | * Copyright (c) 2017 Goker Tanrisever
21 | *
22 | * Permission to use, copy, modify, and/or distribute this software
23 | * for any purpose with or without fee is hereby granted, provided
24 | * that the above copyright notice and this permission notice appear
25 | * in all copies.
26 | *
27 | * THE SOFTWARE IS PROVIDED "AS IS" AND THE AUTHOR DISCLAIMS ALL
28 | * WARRANTIES WITH REGARD TO THIS SOFTWARE INCLUDING ALL IMPLIED
29 | * WARRANTIES OF MERCHANTABILITY AND FITNESS. IN NO EVENT SHALL THE
30 | * AUTHOR BE LIABLE FOR ANY SPECIAL, DIRECT, INDIRECT, OR
31 | * CONSEQUENTIAL DAMAGES OR ANY DAMAGES WHATSOEVER RESULTING FROM LOSS
32 | * OF USE, DATA OR PROFITS, WHETHER IN AN ACTION OF CONTRACT,
33 | * NEGLIGENCE OR OTHER TORTIOUS ACTION, ARISING OUT OF OR IN
34 | * CONNECTION WITH THE USE OR PERFORMANCE OF THIS SOFTWARE.
35 | */
36 |
37 | L.Control.Ruler = L.Control.extend({
38 | options: {
39 | position: 'topright',
40 | circleMarker: {
41 | color: 'red',
42 | radius: 2,
43 | },
44 | lineStyle: {
45 | color: 'red',
46 | dashArray: '1,6'
47 | },
48 | lengthUnit: {
49 | display: 'km',
50 | decimal: 2,
51 | factor: 0.001, // meters -> kilometers
52 | label: 'Distance:'
53 | },
54 | angleUnit: {
55 | display: '°',
56 | decimal: 2,
57 | factor: 360,
58 | label: 'Bearing:'
59 | }
60 | },
61 | initialize: function (options) {
62 | L.setOptions(this, options);
63 | this._layers = L.layerGroup();
64 | this._enabled = false;
65 | },
66 | onAdd: function (map) {
67 | this._defaultCursor = map._container.style.cursor;
68 | this._map = map;
69 | let container = L.DomUtil.create('div', 'leaflet-bar');
70 | container.classList.add('leaflet-ruler');
71 | L.DomEvent.disableClickPropagation(container);
72 | L.DomEvent.on(container, 'click', this._toggleMeasure, this);
73 | return this._container = container;
74 | },
75 | onRemove: function () {
76 | L.DomEvent.off(this._container, 'click', this._toggleMeasure, this);
77 | },
78 | _attachMouseEvents: function () {
79 | let map = this._map;
80 | map.doubleClickZoom.disable();
81 | L.DomEvent.on(map._container, 'keydown', this._escape, this);
82 | L.DomEvent.on(map._container, 'dblclick', this._closePath, this);
83 | map._container.style.cursor = 'crosshair';
84 | map.on('click', this._addPoint, this);
85 | map.on('mousemove', this._moving, this);
86 | },
87 | _removeMouseEvents: function () {
88 | let map = this._map;
89 | map.doubleClickZoom.enable();
90 | L.DomEvent.off(map._container, 'keydown', this._escape, this);
91 | L.DomEvent.off(map._container, 'dblclick', this._closePath, this);
92 | map._container.style.cursor = this._defaultCursor;
93 | map.off('click', this._addPoint, this);
94 | map.off('mousemove', this._moving, this);
95 | },
96 | _disable: function () {
97 | this._enabled = false;
98 | this._container.classList.remove("leaflet-ruler-clicked");
99 | this._layers.remove().clearLayers();
100 | this._latlngs = [];
101 | this._totalLength = 0;
102 | this._removeMouseEvents();
103 | },
104 | _enable: function () {
105 | this._enabled = true;
106 | this._container.classList.add("leaflet-ruler-clicked");
107 | this._circles = L.featureGroup().addTo(this._layers);
108 | this._polyline = L.polyline([], this.options.lineStyle).addTo(this._layers);
109 | this._layers.addTo(this._map);
110 | this._latlngs = [];
111 | this._totalLength = 0;
112 | this._attachMouseEvents();
113 | },
114 | _toggleMeasure: function () {
115 | this._enabled ? this._disable() : this._enable();
116 | },
117 | _drawTooltip: function (latlng, layer, incremental) {
118 | let lastClick = this._latlngs[this._latlngs.length - 1] ?? latlng;
119 | let bearing = this._calculateBearing(lastClick, latlng);
120 | let distance = lastClick.distanceTo(latlng) * this.options.lengthUnit.factor;
121 | let accumulated = this._totalLength + distance;
122 | let totalLength = accumulated.toFixed(this.options.lengthUnit.decimal);
123 | let plusLength = incremental ? '
(+' + distance.toFixed(this.options.lengthUnit.decimal) + ')
' : '';
124 | this._totalLength = incremental ? this._totalLength : accumulated;
125 | if (!layer.getTooltip()) layer.bindTooltip('', incremental ? { direction: "auto", sticky: true, offset: L.point(0, -40), className: 'moving-tooltip' } : { permanent: true, className: 'result-tooltip' }).openTooltip();
126 | layer.setLatLng(latlng).setTooltipContent('' + this.options.angleUnit.label + ' ' + bearing.toFixed(this.options.angleUnit.decimal) + ' ' + this.options.angleUnit.display + '
' + this.options.lengthUnit.label + ' ' + totalLength + ' ' + this.options.lengthUnit.display + plusLength);
127 | },
128 | _addPoint: function (e) {
129 | let latlng = e.latlng || e;
130 | let point = L.circleMarker(latlng, this.options.circleMarker).addTo(this._circles);
131 | this._polyline.addLatLng(latlng);
132 | if(this._latlngs.length && !latlng.equals(this._latlngs[this._latlngs.length - 1])){
133 | this._drawTooltip(latlng, point, false);
134 | }
135 | this._latlngs.push(latlng);
136 | },
137 | _moving: function (e) {
138 | if (this._latlngs.length) {
139 | let lastCLick = this._latlngs[this._latlngs.length - 1];
140 | if (!this._tempLine) this._tempLine = L.polyline([], this.options.lineStyle).addTo(this._map);
141 | if (!this._tempPoint) this._tempPoint = L.circleMarker(e.latlng, this.options.circleMarker).addTo(this._map);
142 | this._tempLine.setLatLngs([lastCLick, e.latlng]);
143 | this._drawTooltip(e.latlng, this._tempPoint, true);
144 | L.DomEvent.off(this._container, 'click', this._toggleMeasure, this);
145 | }
146 | },
147 | _escape: function (e) {
148 | if (e.keyCode === 27) {
149 | if (this._latlngs.length) {
150 | this._closePath();
151 | } else {
152 | this._enabled = true;
153 | this._toggleMeasure();
154 | }
155 | }
156 | },
157 | _calculateBearing: function (start, end) {
158 | const toRad = L.DomUtil.DEG_TO_RAD;
159 | const toDeg = (this.options.angleUnit.factor / 2) / Math.PI;
160 | let y = Math.sin((end.lng - start.lng) * toRad) * Math.cos(end.lat * toRad);
161 | let x = Math.cos(start.lat * toRad) * Math.sin(end.lat * toRad) - Math.sin(start.lat * toRad) * Math.cos(end.lat * toRad) * Math.cos((end.lng - start.lng) * toRad);
162 | return (Math.atan2(y, x) * toDeg + this.options.angleUnit.factor) % this.options.angleUnit.factor;
163 | },
164 | _closePath: function () {
165 | if (this._tempLine) {
166 | this._tempLine.remove();
167 | this._tempLine = null;
168 | }
169 | if (this._tempPoint) {
170 | this._tempPoint.remove();
171 | this._tempLine = null;
172 | }
173 | if (this._latlngs.length <= 1) {
174 | this._circles.remove();
175 | }
176 | this._enabled = false;
177 | L.DomEvent.on(this._container, 'click', this._toggleMeasure, this);
178 | this._toggleMeasure();
179 | },
180 | });
181 | L.control.ruler = function (options) {
182 | return new L.Control.Ruler(options);
183 | };
--------------------------------------------------------------------------------
/libs/leaflet-ruler.min.css:
--------------------------------------------------------------------------------
1 | .leaflet-ruler{height:35px;width:35px;background-image:url(data:image/png;base64,iVBORw0KGgoAAAANSUhEUgAAABgAAAAYCAYAAADgdz34AAACx0lEQVRIS52VWahOURTHXRSJzBkiJcpYxgeS4oUi90GR4VK6DzcUD3gQIQ8UCXkwlCJRkjJEpqT7oGTMeHONmacyRRl/v9ve2n2d7/vOtevXPmefff5r7bXXXruiSf42gKkToTu0hY/wEk7CnWIyFWX0B/N9OkyF1tANdsEz6AIL4Sl8h8NwEK6nmsUMNGPSalgePFxLfwl2hrG39O1hM8yFobAKpsAGWAE/NJRloBfj++ErnIYesDj1qsjzRsYN2VhwdTPgUaGBkUF0e/D0TxDrRD8ehsFw6AcP4FrgCL17EpsrWAKDUgNtwuQP9FehJsyeSb8FbsOV8O0efVeYHOZV0h8N8w3dWXBOVWpgDwO/oBqc1BxciV7Pg3OJhz66ivPB+PoM8TnqRQPTeNkKfeALtAQ39QYsgE85xNsFz+voFe8AldFALS8DYU3waAd9b5gAv3OKn2HefagK4q64VgPm9k0we0wtN9pN6w+mY9qywqLnWeKXGa/WwHwYFSwrZtw/w9Ic4p5oxesLPG8Qd/UacMf13IE38ArGwN3EQJbnintOHsJsMOaG5Z+4/2vAY282eALd4FvQqoj4Aca3gQfPw1hSPBr4xoNH3bz1EO0D428r9LwpY3vB+nSolOfRQVeg1yOCgXH01pu+GeL+Y1hOwWOYBZlhieJxBU94eA2Lwo9WRw+X8fUEx0PUaPFowKW6Cg+UBc6M6AzrMsR1xtJR1vO4CkNk1TMLJoXBlcHQpvAePW+0eFyBRe45jAbL7fskhqm4MbdGmYruUU94l8zNfIyl4hhfLQteHqaiLYq7J4YlipvnXkgWRotgyRYNWB4st6bpizLiHsiO4H1gMrhnRVtarpcxy0vd+9eLPMvzhuMf1E7QmyC78xrQmDk+BC6Am98CLoKXi/dvWll1xjvjeAkD9YVXpkJ6ae7/BOPus4b+p9X9BdB/zv8zawwXAAAAAElFTkSuQmCC);background-repeat:no-repeat;background-position:center}.leaflet-ruler-clicked,.leaflet-ruler:hover{background-image:url(data:image/png;base64,iVBORw0KGgoAAAANSUhEUgAAABgAAAAYCAYAAADgdz34AAAE/ElEQVRIS6WVeWwUVRzHfzOzs7Pdi+7Rdq/ubrH0sNaKBFMCSEvBQLivFkhAE8GDYAyHATWgETUoMZ7BGCMBNKYiQbTKpYQKBqKlWmBbadmW7bbbFjv0mu2eM298M5SlpS3U+LL/zL6Zz/f7vr/3e4+AsQ6j80EgxTkKhGwkQRqQiLp5UtEOSDwOXf660TDEPfkGR75RTT8VF1EpJRJ6LsbrVuaZg2YtrWND8WD5FVajV9IcTyCOoYhv2QgcgE5fzWDmaAKU0eHa3RMStszNMqIdM+zUY3YdPFvRCG+VOCFFQ0N3mIfNJ3ywb3Em/BHgYNeZFnTc20OOU1Efd7eZtwBUxyWh4QLJGS6jFv04MU2bNWeCQRnoi8L7czPuG+RLJ31g0Smhsqk3dqGVa7wZZOZBb/31oQKm8ZMZRbxyU6FV9XaJmyQGZsNxBD/Ud8FXNWy/rzci9ER4Spqa5tYrit3jmNI8M2DnCRNvnm1Bu35tjcR4lH1HIDtbp+2NNuSmqCyTrBr4dMEDuH4A754LCLvOtQo44zouKp7hQagGIK+CIFgoipqPEHru6OocWJhtlAWk6GZ8cSXs64sd49qbSxMCaenu7+ZkGuftW5JJSy/FBARlh+vDF1tDfWEerYWullNDcjK5c9Q0Or/jcad++3SbbP8ueBn+S7glkOIsNTDUQf+mRxmtkoIIj6Bgb024hYtVhGPK9dDl7RsJvhPDtw3AcWzYuSd8vTcqOS8DrcUIKsUiWcDgyKghRLFgZ1E6vFhohfXfN8YP1bFVfW3N0/E0Ggu8CMNxfY9z7b5SCU4o6dMkhc4RYM61aulwU8fWSSqaIqEqEIRZBzzBSCg+HoIdncPglHgBG9ENdj4inEAXhZuBdQSYXBuWZOnfOLI61yTB1ld4Y1/+xe6Ndvo33Q+ON5Rc0GHOB+DS6gmF2XF6dkZy0eeLM8lU3EDGd6qiQRAnQnvz3wkBXFANdr5jkHMJXrS/NtTIRk5yN3wrErEMgsuNpkp13ViRZ0zdOtUOWiUJ2R/WxPibfmYk+Mp8E/XCT01y4y0/1HBfuCygMDljVzYW0DnmJKhuC8Lsg7WB7kCzQxa4y7nUF08euQblHlZMoqij93J+2yBBpzgjlzcUMJLAmeu9sOjrq+1cR7PtNvzVYrv+5WkOUvpAiqUYx+JlI6cwfPlosQyuHcGYnYECq9r2AV62O5mB9PcuItxjj2ho6uz/hcsRESbH4TX5qQv3LsigNbjJ7Huq+tkIT75enM4Mdx76mbvhXzYW54mIwOBeNd2l+eTs03nyYYIPqrhaSVGbC213xfLf4fIKAB9yqp4IW/VMvtKqVYJJrUhEeCdzGS5lbki22Wu5btYg0IwV2hrYIb0ywoN8VCTbXadDUTRz/9IJsCrfLL82CP7LQCyGcVab56HColQkCKL3ctWxTs/5+WMSAHwPGBih0rNxotqGL42R4DqLpebhKTNta7fvgWBfN7yybIoQjYdzoLPVey+RxHFtdrhfy05J2laxKjep5EAd3oqhhHNtqrm6YOoT6RKcIOXSwEdb1ojXLv35fDRQ99mYBKR6GOyu3zBhcowXTvR3+JdCWhqjVhk9FEW7Z5Wtw1vuFlwatb9XQmuD51J/MFQ+qgAheIdemSl5FoDgOuhs3o0/4vWOKcZkh/4bEJFKxAMA/6QhgsjzAvrH3+SXn0YZAinU/wuTosgK53+p+wAAAABJRU5ErkJggg==)}.leaflet-ruler-clicked{height:35px;width:35px;background-repeat:no-repeat;background-position:center;border-color:#7fff00!important}.leaflet-bar.leaflet-ruler{background-color:#fff}.leaflet-control.leaflet-ruler{cursor:pointer}.result-tooltip{background-color:#fff;border-width:medium;border-color:#de0000;font-size:smaller}.moving-tooltip{background-color:rgba(255,255,255,.7);background-clip:padding-box;opacity:.5;border:dotted;border-color:red;font-size:smaller}.plus-length{padding-left:45px}
--------------------------------------------------------------------------------
/libs/leaflet-ruler.min.js:
--------------------------------------------------------------------------------
1 | L.Control.Ruler=L.Control.extend({options:{position:"topright",circleMarker:{color:"red",radius:2},lineStyle:{color:"red",dashArray:"1,6"},lengthUnit:{display:"km",decimal:2,factor:.001,label:"Distance:"},angleUnit:{display:"°",decimal:2,factor:360,label:"Bearing:"}},initialize:function(options){L.setOptions(this,options),this._layers=L.layerGroup(),this._enabled=!1},onAdd:function(map){this._defaultCursor=map._container.style.cursor,this._map=map;let container=L.DomUtil.create("div","leaflet-bar");return container.classList.add("leaflet-ruler"),L.DomEvent.disableClickPropagation(container),L.DomEvent.on(container,"click",this._toggleMeasure,this),this._container=container},onRemove:function(){L.DomEvent.off(this._container,"click",this._toggleMeasure,this)},_attachMouseEvents:function(){let map=this._map;map.doubleClickZoom.disable(),L.DomEvent.on(map._container,"keydown",this._escape,this),L.DomEvent.on(map._container,"dblclick",this._closePath,this),map._container.style.cursor="crosshair",map.on("click",this._addPoint,this),map.on("mousemove",this._moving,this)},_removeMouseEvents:function(){let map=this._map;map.doubleClickZoom.enable(),L.DomEvent.off(map._container,"keydown",this._escape,this),L.DomEvent.off(map._container,"dblclick",this._closePath,this),map._container.style.cursor=this._defaultCursor,map.off("click",this._addPoint,this),map.off("mousemove",this._moving,this)},_disable:function(){this._enabled=!1,this._container.classList.remove("leaflet-ruler-clicked"),this._map.removeLayer(this._layers),this._layers=L.layerGroup(),this._latlngs=[],this._totalLength=0,this._removeMouseEvents()},_enable:function(){this._enabled=!0,this._container.classList.add("leaflet-ruler-clicked"),this._circles=L.featureGroup().addTo(this._layers),this._polyline=L.polyline([],this.options.lineStyle).addTo(this._layers),this._layers.addTo(this._map),this._latlngs=[],this._totalLength=0,this._attachMouseEvents()},_toggleMeasure:function(){this._enabled?this._disable():this._enable()},_drawTooltip:function(latlng,layer,incremental){let clickCount=this._latlngs.length,lastClick=clickCount?this._latlngs[clickCount-1]:latlng,bearing=this._calculateBearing(lastClick,latlng),distance=lastClick.distanceTo(latlng)*this.options.lengthUnit.factor,totalLength,plusLength;incremental?(totalLength=(clickCount?distance+this._totalLength||0:distance).toFixed(this.options.lengthUnit.decimal),plusLength=clickCount?'
(+'+distance.toFixed(this.options.lengthUnit.decimal)+")
":""):(this._totalLength+=distance,totalLength=(clickCount?this._totalLength:distance).toFixed(this.options.lengthUnit.decimal),plusLength="");var text=""+this.options.angleUnit.label+" "+bearing.toFixed(this.options.angleUnit.decimal)+" "+this.options.angleUnit.display+"
"+this.options.lengthUnit.label+" "+totalLength+" "+this.options.lengthUnit.display+plusLength;layer.setLatLng(latlng);let tooltip=layer.getTooltip();return tooltip?tooltip.setTooltipContent(text):layer.bindTooltip(text,incremental?{direction:"auto",sticky:!0,offset:L.point(0,-40),className:"moving-tooltip"}:{permanent:!0,className:"result-tooltip"}).openTooltip(),layer},_addPoint:function(e){let latlng=e.latlng||e,point=L.circleMarker(latlng,this.options.circleMarker).addTo(this._circles);this._polyline.addLatLng(latlng),this._latlngs.length&&!latlng.equals(this._latlngs[this._latlngs.length-1])&&this._drawTooltip(latlng,point,!1),this._latlngs.push(latlng)},_moving:function(e){if(this._latlngs.length){let lastCLick=this._latlngs[this._latlngs.length-1];this._tempLine||(this._tempLine=L.polyline([],this.options.lineStyle).addTo(this._map)),this._tempPoint||(this._tempPoint=L.circleMarker(e.latlng,this.options.circleMarker).addTo(this._map)),this._tempLine.setLatLngs([lastCLick,e.latlng]),this._drawTooltip(e.latlng,this._tempPoint,!0),L.DomEvent.off(this._container,"click",this._toggleMeasure,this)}},_escape:function(e){27===e.keyCode&&(this._latlngs.length?this._closePath():(this._enabled=!0,this._toggleMeasure()))},_calculateBearing:function(start,end){const toRad=L.DomUtil.DEG_TO_RAD,toDeg=this.options.angleUnit.factor/2/Math.PI;let y=Math.sin((end.lng-start.lng)*toRad)*Math.cos(end.lat*toRad),x=Math.cos(start.lat*toRad)*Math.sin(end.lat*toRad)-Math.sin(start.lat*toRad)*Math.cos(end.lat*toRad)*Math.cos((end.lng-start.lng)*toRad);return(Math.atan2(y,x)*toDeg+this.options.angleUnit.factor)%this.options.angleUnit.factor},_closePath:function(){this._tempLine&&(this._map.removeLayer(this._tempLine),this._tempLine=null),this._tempPoint&&(this._map.removeLayer(this._tempPoint),this._tempLine=null),this._latlngs.length<=1&&this._map.removeLayer(this._circles),this._enabled=!1,L.DomEvent.on(this._container,"click",this._toggleMeasure,this),this._toggleMeasure()}}),L.control.ruler=function(options){return new L.Control.Ruler(options)};
--------------------------------------------------------------------------------
/package.json:
--------------------------------------------------------------------------------
1 | {
2 | "name": "@raruto/leaflet-elevation",
3 | "version": "2.5.1",
4 | "description": "A Leaflet plugin that allows to add elevation profiles using d3js",
5 | "type": "module",
6 | "main": "dist/leaflet-elevation.min.js",
7 | "browser": "dist/leaflet-elevation.min.js",
8 | "module": "src/index.js",
9 | "scripts": {
10 | "test": "uvu . \"(examples|src)[\\\\/].*\\.spec\\.js$\"",
11 | "build": "rollup -c build/rollup.config.js",
12 | "watch": "rollup -c build/rollup.config.js --watch",
13 | "dev": "npm-run-all --print-label --parallel serve watch",
14 | "serve": "http-server",
15 | "version": "npm run build && git add -A"
16 | },
17 | "repository": {
18 | "type": "git",
19 | "url": "https://github.com/Raruto/leaflet-elevation.git"
20 | },
21 | "keywords": [
22 | "leaflet",
23 | "d3js",
24 | "javascript",
25 | "elevation",
26 | "highchart",
27 | "kml",
28 | "altitude",
29 | "gpx",
30 | "gps-visualizer",
31 | "tcx"
32 | ],
33 | "author": {
34 | "name": "Felix “MrMufflon” Bache",
35 | "url": "https: //github.com/MrMufflon/Leaflet.Elevation"
36 | },
37 | "contributors": [
38 | {
39 | "name": "Raruto",
40 | "url": "https://github.com/Raruto/leaflet-elevation"
41 | },
42 | {
43 | "name": "Felix Bache",
44 | "web": "https://github.com/HostedDinner/Leaflet.Elevation"
45 | }
46 | ],
47 | "license": "GPL-3.0",
48 | "bugs": {
49 | "url": "https://github.com/Raruto/leaflet-elevation/issues"
50 | },
51 | "homepage": "https://github.com/Raruto/leaflet-elevation#readme",
52 | "devDependencies": {
53 | "@rollup/plugin-commonjs": "^24.1.0",
54 | "@rollup/plugin-node-resolve": "^15.0.2",
55 | "@rollup/plugin-terser": "^0.4.1",
56 | "http-server": "^14.1.1",
57 | "jsdom": "^21.1.1",
58 | "leaflet": "^1.7.1",
59 | "npm-run-all": "^4.1.5",
60 | "playwright": "^1.32.3",
61 | "postcss": "^8.4.23",
62 | "postcss-copy": "^7.1.0",
63 | "postcss-import": "^15.1.0",
64 | "rollup": "^3.21.0",
65 | "rollup-plugin-postcss": "^4.0.2",
66 | "uvu": "^0.5.6"
67 | },
68 | "peerDependencies": {
69 | "@tmcw/togeojson": "5.6.2",
70 | "d3": "7.8.4",
71 | "leaflet": "^1.7.0",
72 | "leaflet-i18n": "^0.3.1"
73 | }
74 | }
75 |
--------------------------------------------------------------------------------
/src/components/d3.js:
--------------------------------------------------------------------------------
1 | export const Area = ({
2 | width,
3 | height,
4 | xAttr,
5 | yAttr,
6 | scaleX,
7 | scaleY,
8 | interpolation = "curveLinear"
9 | }) => {
10 | return d3.area()
11 | .curve(typeof interpolation === 'string' ? d3[interpolation] : interpolation)
12 | .x(d => (d.xDiagCoord = scaleX(d[xAttr])))
13 | .y0(height)
14 | .y1(d => scaleY(d[yAttr]));
15 | };
16 |
17 | export const Path = ({
18 | name,
19 | color,
20 | strokeColor,
21 | strokeOpacity,
22 | fillOpacity,
23 | className = ''
24 | }) => {
25 | let path = d3.create('svg:path')
26 |
27 | if (name) path.classed(name + ' ' + className, true);
28 |
29 | path.style("pointer-events", "none");
30 |
31 | path
32 | .attr("fill", color || '#3366CC')
33 | .attr("stroke", strokeColor || '#000')
34 | .attr("stroke-opacity", strokeOpacity || '1')
35 | .attr("fill-opacity", fillOpacity || '0.8');
36 |
37 | return path;
38 | };
39 |
40 | export const Axis = ({
41 | type = "axis",
42 | tickSize = 6,
43 | tickPadding = 3,
44 | position,
45 | height,
46 | width,
47 | axis,
48 | scale,
49 | ticks,
50 | tickFormat,
51 | label,
52 | labelX,
53 | labelY,
54 | name = "",
55 | onAxisMount,
56 | }) => {
57 | return g => {
58 | let [w, h] = [0, 0];
59 | if (position == "bottom") h = height;
60 | if (position == "right") w = width;
61 |
62 | if (axis == "x" && type == "grid") {
63 | tickSize = -height;
64 | } else if (axis == "y" && type == "grid") {
65 | tickSize = -width;
66 | }
67 |
68 | let axisScale = d3["axis" + position.replace(/\b\w/g, l => l.toUpperCase())]()
69 | .scale(scale)
70 | .ticks(typeof ticks === 'function' ? ticks() : ticks)
71 | .tickPadding(tickPadding)
72 | .tickSize(tickSize)
73 | .tickFormat(tickFormat);
74 |
75 | let axisGroup = g.append("g")
76 | .attr("class", [axis, type, position, name].join(" "))
77 | .attr("transform", "translate(" + w + "," + h + ")")
78 | .call(axisScale);
79 |
80 | if (label) {
81 | axisGroup.append("svg:text")
82 | .attr("x", labelX)
83 | .attr("y", labelY)
84 | .text(label);
85 | }
86 |
87 | if (onAxisMount) {
88 | axisGroup.call(onAxisMount);
89 | }
90 |
91 | return axisGroup;
92 | };
93 | };
94 |
95 | export const Grid = (props) => {
96 | props.type = "grid";
97 | return Axis(props);
98 | };
99 |
100 | export const PositionMarker = ({
101 | theme,
102 | xCoord = 0,
103 | yCoord = 0,
104 | labels = {},
105 | item = {},
106 | length = 0,
107 | }) => {
108 | return g => {
109 |
110 | g.attr("class", "height-focus-group");
111 |
112 | let line = g.select('.height-focus.line');
113 | let circle = g.select('.height-focus.circle-lower');
114 | let text = g.select('.height-focus-label');
115 |
116 | if (!line.node()) line = g.append('svg:line');
117 | if (!circle.node()) circle = g.append('svg:circle');
118 | if (!text.node()) text = g.append('svg:text');
119 |
120 | if (isNaN(xCoord) || isNaN(yCoord)) return g;
121 |
122 | circle
123 | .attr("class", theme + " height-focus circle-lower")
124 | .attr("transform", "translate(" + xCoord + "," + yCoord + ")")
125 | .attr("r", 6)
126 | .attr("cx", 0)
127 | .attr("cy", 0);
128 |
129 | line
130 | .attr("class", theme + " height-focus line")
131 | .attr("x1", xCoord)
132 | .attr("x2", xCoord)
133 | .attr("y1", yCoord)
134 | .attr("y2", length);
135 |
136 | text
137 | .attr("class", theme + " height-focus-label")
138 | .style("pointer-events", "none")
139 | .attr("x", xCoord + 5)
140 | .attr("y", length);
141 |
142 | let label;
143 |
144 | Object
145 | .keys(labels)
146 | .sort((a, b) => labels[a].order - labels[b].order) // TODO: any performance issues?
147 | .forEach((i)=> {
148 | label = text.select(".height-focus-" + labels[i].name);
149 |
150 | if (!label.size()) {
151 | label = text.append("svg:tspan")
152 | .attr("class", "height-focus-" + labels[i].name /*+ " " + "order-" + labels[i].order*/)
153 | .attr("dy", "1.5em");
154 | }
155 |
156 | label.text(typeof labels[i].value !== "function" ? labels[i].value : labels[i].value(item));
157 |
158 | });
159 |
160 | text.select('tspan').attr("dy", text.selectAll('tspan').size() > 1 ? "-1.5em" : "0em" );
161 | text.selectAll('tspan').attr("x", xCoord + 5);
162 |
163 | return g;
164 | }
165 | };
166 |
167 | export const LegendItem = ({
168 | name,
169 | label,
170 | width,
171 | height,
172 | margins = {},
173 | color,
174 | path,
175 | className = ''
176 | }) => {
177 | return g => {
178 | g
179 | .attr("class", "legend-item legend-" + name.toLowerCase())
180 | .attr("data-name", name);
181 |
182 | g.on('click.legend', () => d3.select(g.node().ownerSVGElement || g)
183 | .dispatch("legend_clicked", {
184 | detail: {
185 | path: path.node(),
186 | name: name,
187 | legend: g.node(),
188 | enabled: !path.classed('leaflet-hidden'),
189 | }
190 | })
191 | );
192 |
193 | g.append("svg:rect")
194 | .attr("x", (width / 2) - 50)
195 | .attr("y", height + margins.bottom / 2)
196 | .attr("width", 50)
197 | .attr("height", 10)
198 | .attr("fill", color)
199 | .attr("stroke", "#000")
200 | .attr("stroke-opacity", "0.5")
201 | .attr("fill-opacity", "0.25")
202 | .attr("class", className);
203 |
204 | g.append('svg:text')
205 | .text(L._(label || name))
206 | .attr("x", (width / 2) + 5)
207 | .attr("font-size", 10)
208 | .style("font-weight", "700")
209 | .attr('y', height + margins.bottom / 2)
210 | .attr('dy', "0.75em");
211 |
212 | return g;
213 | }
214 | };
215 |
216 | export const LegendSmall = ({
217 | width,
218 | height,
219 | items,
220 | onClick
221 | }) => {
222 | return g => {
223 | let idx = 0;
224 |
225 | g.data([{
226 | x: width,
227 | y: height + 40
228 | }]).attr("transform", d => "translate(" + d.x + "," + d.y + ")").classed('legend-switcher');
229 |
230 | // let label = g.selectAll(".legend-switcher-label") .data([{ idx: 0 }]);
231 | let label = g.append('svg:text')
232 | .attr("class", "legend-switcher-label")
233 | .attr("text-anchor", "end")
234 | .attr("x", -25)
235 | .attr("y", 5)
236 | .on("mousedown", (e, d) => setIdx(L.Util.wrapNum((idx + 1), [0, items.length])));
237 |
238 | let symbol = g.selectAll(".legend-switcher-symbol").data([
239 | { type: d3.symbolTriangle, x: 0, y: 3, angle: 0, size: 50, id: "down" },
240 | { type: d3.symbolTriangle, x: -13, y: 0, angle: 180, size: 50, id: "up" }
241 | ]);
242 |
243 | symbol.exit().remove();
244 | label.exit().remove();
245 |
246 | symbol.enter()
247 | .append("svg:path")
248 | .attr("class", "legend-switcher-symbol")
249 | .attr("cursor", 'pointer')
250 | .attr("fill", "#000")
251 | .merge(symbol)
252 | .attr("d",
253 | d3.symbol()
254 | .type(d => d.type)
255 | .size(d => d.size)
256 | )
257 | .attr("transform", d => "translate(" + d.x + "," + d.y + ") rotate(" + d.angle + ")")
258 | .on("mousedown", (e, d) => setIdx(L.Util.wrapNum((d.id === "up" ? idx + 1 : idx - 1), [0, items.length])));
259 |
260 | const setIdx = (id) => {
261 | idx = id;
262 | // label.enter()
263 | // .append('text')
264 | // .attr("class", "legend-switcher-label")
265 | // .attr("text-anchor", "end")
266 | // .attr("x", -25)
267 | // .attr("y", 5)
268 | // .merge(label.data([{ idx: id }]))
269 | // .text(d => items.length ? (items[idx][0].toUpperCase() + items[idx].slice(1)) : '')
270 | // .on("mousedown", (e, d) => setIdx(L.Util.wrapNum((idx + 1), [0, items.length])));
271 | label.text(items.length ? L._((items[idx][0].toUpperCase() + items[idx].slice(1))) : '');
272 | onClick(items[idx]);
273 | };
274 | setIdx(0);
275 |
276 | return g;
277 | };
278 | };
279 |
280 | export const Tooltip = ({
281 | xCoord,
282 | yCoord,
283 | width,
284 | height,
285 | labels = {},
286 | item = {},
287 | }) => {
288 | return g => {
289 |
290 | let line = g.select('.mouse-focus-line');
291 | let box = g.select('.mouse-focus-label');
292 |
293 | if (!line.node()) line = g.append('svg:line');
294 | if (!box.node()) box = g.append("g");
295 |
296 | let rect = box.select(".mouse-focus-label-rect");
297 | let text = box.select(".mouse-focus-label-text");
298 |
299 | if (!rect.node()) rect = box.append("svg:rect");
300 | if (!text.node()) text = box.append("svg:text");
301 |
302 | // Sets focus-label-text position to the left / right of the mouse-focus-line
303 | let xAlign = 0;
304 | let yAlign = 0;
305 | let bbox = { width: 0, height: 0 };
306 | try { bbox = text.node().getBBox(); } catch (e) { return g; }
307 |
308 | if (xCoord) xAlign = xCoord + (xCoord < width / 2 ? 10 : -bbox.width - 10);
309 | if (yCoord) yAlign = Math.max(yCoord - bbox.height, L.Browser.webkit ? 0 : -Infinity);
310 |
311 | line
312 | .attr('class', 'mouse-focus-line')
313 | .attr('x2', xCoord)
314 | .attr('y2', 0)
315 | .attr('x1', xCoord)
316 | .attr('y1', height);
317 |
318 | box
319 | .attr('class', 'mouse-focus-label');
320 |
321 | rect
322 | .attr("class", "mouse-focus-label-rect")
323 | .attr("x", xAlign - 5)
324 | .attr("y", yAlign - 5)
325 | .attr("width", bbox.width + 10)
326 | .attr("height", bbox.height + 10)
327 | .attr("rx", 3)
328 | .attr("ry", 3);
329 |
330 | text
331 | .attr("class", "mouse-focus-label-text")
332 | .style("font-weight", "700")
333 | .attr("y", yAlign);
334 |
335 | let label;
336 |
337 | Object
338 | .keys(labels)
339 | .sort((a, b) => labels[a].order - labels[b].order) // TODO: any performance issues?
340 | .forEach((i)=> {
341 | label = text.select(".mouse-focus-label-" + labels[i].name);
342 |
343 | if (!label.size()) {
344 | label = text.append("svg:tspan", ".mouse-focus-label-x")
345 | .attr("class", "mouse-focus-label-" + labels[i].name /*+ " " + "order-" + labels[i].order*/)
346 | .attr("dy", "1.5em");
347 | }
348 |
349 | label.text(typeof labels[i].value !== "function" ? labels[i].value : labels[i].value(item));
350 | });
351 |
352 | text.select('tspan').attr("dy", "1em");
353 | text.selectAll('tspan').attr("x", xAlign);
354 |
355 | return g;
356 | };
357 | };
358 |
359 | export const Ruler = ({
360 | height,
361 | width,
362 | }) => {
363 | return g => {
364 |
365 | g.data([{
366 | x: 0,
367 | y: height,
368 | }])
369 | .attr("transform", d => "translate(" + d.x + "," + d.y + ")");
370 |
371 | let rect = g.selectAll('.horizontal-drag-rect').data([{ w: width }]);
372 | let line = g.selectAll('.horizontal-drag-line').data([{ w: width }]);
373 | let label = g.selectAll('.horizontal-drag-label').data([{ w: width - 8 }]);
374 | let symbol = g.selectAll('.horizontal-drag-symbol')
375 | .data([{
376 | type: d3.symbolTriangle,
377 | x: width + 7,
378 | y: 0,
379 | angle: -90,
380 | size: 50
381 | }]);
382 |
383 | rect.exit().remove();
384 | line.exit().remove();
385 | label.exit().remove();
386 | symbol.exit().remove();
387 |
388 | rect.enter()
389 | .append("svg:rect")
390 | .attr("class", "horizontal-drag-rect")
391 | .attr("x", 0)
392 | .attr("y", -8)
393 | .attr("height", 8)
394 | .attr('fill', 'none')
395 | .attr('pointer-events', 'all')
396 | .merge(rect)
397 | .attr("width", d => d.w);
398 |
399 | line.enter()
400 | .append("svg:line")
401 | .attr("class", "horizontal-drag-line")
402 | .attr("x1", 0)
403 | .merge(line)
404 | .attr("x2", d => d.w);
405 |
406 | label.enter()
407 | .append("svg:text")
408 | .attr("class", "horizontal-drag-label")
409 | .attr("text-anchor", "end")
410 | .attr("y", -8)
411 | .merge(label)
412 | .attr("x", d => d.w)
413 |
414 | symbol
415 | .enter()
416 | .append("svg:path")
417 | .attr("class", "horizontal-drag-symbol")
418 | .merge(symbol)
419 | .attr("d",
420 | d3.symbol()
421 | .type(d => d.type)
422 | .size(d => d.size)
423 | )
424 | .attr("transform", d => "translate(" + d.x + "," + d.y + ") rotate(" + d.angle + ")");
425 |
426 | return g;
427 | }
428 | };
429 |
430 | export const CheckPoint = ({
431 | point,
432 | height,
433 | width,
434 | x,
435 | y
436 | }) => {
437 | return g => {
438 |
439 | if (isNaN(x) || isNaN(y)) return g;
440 |
441 | if (!point.item || !point.item.property('isConnected')) {
442 | point.position = point.position || "bottom";
443 |
444 | point.item = g.append('g');
445 |
446 | point.item.append("svg:line")
447 | .attr("y1", 0)
448 | .attr("x1", 0)
449 | .attr("style","stroke: rgb(51, 51, 51); stroke-width: 0.5; stroke-dasharray: 2, 2;");
450 |
451 | point.item
452 | .append("svg:circle")
453 | .attr("class", " height-focus circle-lower")
454 | .attr("r", 3);
455 |
456 | if (point.label) {
457 | point.item.append("svg:text")
458 | .attr("dx", "4px")
459 | .attr("dy", "-4px");
460 | }
461 | }
462 |
463 | point.item
464 | .datum({
465 | pos: point.position,
466 | x: x,
467 | y: y
468 | })
469 | .attr("class", d => "point " + d.pos)
470 | .attr("transform", d => "translate(" + d.x + "," + d.y + ")");
471 |
472 | point.item.select('line')
473 | .datum({
474 | y2: ({'top': -y, 'bottom': height - y})[point.position],
475 | x2: ({'left': -x, 'right': width - x})[point.position] || 0
476 | })
477 | .attr("y2", d => d.y2)
478 | .attr("x2", d => d.x2)
479 |
480 | if (point.label) {
481 | point.item.select('text')
482 | .text(point.label);
483 | }
484 |
485 | return g;
486 | }
487 | };
488 |
489 | export const Domain = ({
490 | min,
491 | max,
492 | attr,
493 | name,
494 | forceBounds,
495 | scale
496 | }) => function(data) {
497 | attr = (scale && scale.attr) || attr || name;
498 | let domain = data && data.length ? d3.extent(data, d => d[attr]) : [0, 1];
499 | if (typeof min !== "undefined" && (min < domain[0] || forceBounds)) {
500 | domain[0] = min;
501 | }
502 | if (typeof max !== "undefined" && (max > domain[1] || forceBounds)) {
503 | domain[1] = max;
504 | }
505 | return domain;
506 | };
507 |
508 | export const Range = ({
509 | axis
510 | }) => function(width, height) {
511 | if (axis == 'x') return [0, width];
512 | else if (axis == 'y') return [height, 0];
513 | };
514 |
515 | export const Scale = ({
516 | data,
517 | attr,
518 | min,
519 | max,
520 | forceBounds,
521 | range,
522 | }) => {
523 | return d3.scaleLinear()
524 | .range(range)
525 | .domain(Domain({min, max, attr, forceBounds})(data));
526 | };
527 |
528 | export const Bisect = ({
529 | data = [0, 1],
530 | scale,
531 | x,
532 | attr
533 | }) => {
534 | return d3
535 | .bisector(d => d[attr])
536 | .left(data, scale.invert(x));
537 | };
538 |
539 | export const Chart = ({
540 | width,
541 | height,
542 | margins = {},
543 | ruler,
544 | }) => {
545 |
546 | const w = width - margins.left - margins.right;
547 | const h = height - margins.top - margins.bottom;
548 |
549 | // SVG Container
550 | const svg = d3.create("svg:svg").attr("class", "background");
551 |
552 | const defs = svg.append("svg:defs");
553 |
554 | // SVG Groups
555 | const g = svg.append("g");
556 | const panes = {
557 | grid : g.append("g").attr("class", "grid"),
558 | area : g.append('g').attr("class", "area"),
559 | axis : g.append('g').attr("class", "axis"),
560 | point : g.append('g').attr("class", "point"),
561 | brush : g.append("g").attr("class", "brush"),
562 | tooltip: g.append("g").attr("class", "tooltip").attr('display', 'none'),
563 | ruler : g.append('g').attr('class', 'ruler'),
564 | legend : g.append('g').attr("class", "legend"),
565 | };
566 |
567 | // SVG Paths
568 | const mask = panes.area .append("svg:mask") .attr("id", 'elevation-clipper-' + Math.random().toString(36).substr(2, 9)).attr('fill-opacity', 1);
569 | const maskRect = mask .append("svg:rect") .attr('class', 'zoom') .attr('fill', 'white'); // white = transparent
570 |
571 | // Canvas Paths
572 | const foreignObject = panes.area .append('svg:foreignObject').attr('mask', 'url(#' + mask.attr('id') + ')');
573 | const canvas = foreignObject.append('xhtml:canvas') .attr('class', 'canvas-plot');
574 | const context = canvas.node().getContext('2d');
575 |
576 | // Add tooltip
577 | panes.tooltip.call(Tooltip({ xCoord: 0, yCoord: 0, height: h, width : w, labels: {} }));
578 |
579 | // Add the brushing
580 | let brush = d3.brushX().on('start.cursor end.cursor brush.cursor', () => panes.brush.select(".overlay").attr('cursor', null));
581 |
582 | // Scales
583 | const scale = (opts) => ({ x: Scale(opts.x), y: Scale(opts.y)});
584 |
585 | let utils = {
586 | defs,
587 | mask,
588 | canvas,
589 | context,
590 | brush,
591 | };
592 |
593 | let chart = {
594 | svg,
595 | g,
596 | panes,
597 | utils,
598 | scale,
599 | };
600 |
601 | // Resize
602 | chart._resize = ({
603 | width,
604 | height,
605 | margins = {},
606 | ruler,
607 | }) => {
608 |
609 | const w = width - margins.left - margins.right;
610 | const h = height - margins.top - margins.bottom;
611 |
612 | svg .attr("width", width).attr("height", height).attr("viewBox", `0 0 ${width} ${height}`);
613 | g .attr("transform", "translate(" + margins.left + "," + margins.top + ")");
614 |
615 | // Fix: https://github.com/Raruto/leaflet-elevation/issues/123
616 | // Fix: https://github.com/Raruto/leaflet-elevation/issues/232
617 | if (
618 | /Mac|iPod|iPhone|iPad/.test(navigator.platform) &&
619 | /AppleWebkit/i.test(navigator.userAgent) &&
620 | !/Chrome/.test(navigator.userAgent)
621 | ) {
622 | canvas .style("transform", "translate(" + margins.left + "px," + margins.top + "px)");
623 | }
624 |
625 | maskRect .attr("width", w).attr("height", h).attr("x", 0).attr("y", 0);
626 | foreignObject.attr('width', w).attr('height', h);
627 | canvas .attr('width', w).attr('height', h);
628 |
629 | if (ruler) {
630 | panes.ruler.call(Ruler({ height: h, width: w }));
631 | }
632 |
633 | panes.brush.call(brush.extent( [ [0,0], [w, h] ] ));
634 | panes.brush.select(".overlay").attr('cursor', null);
635 |
636 | chart._width = w;
637 | chart._height = h;
638 |
639 | chart.svg.dispatch('resize', { detail: { width: w, height: h } } );
640 |
641 | };
642 |
643 | chart.pane = (name) => (panes[name] || (panes[name] = g.append('g').attr("class", name)));
644 | chart.get = (name) => utils[name];
645 |
646 | chart._resize({ width, height, margins});
647 |
648 | return chart;
649 | };
650 |
--------------------------------------------------------------------------------
/src/components/marker.js:
--------------------------------------------------------------------------------
1 | import * as D3 from './d3.js';
2 |
3 | const _ = L.Control.Elevation.Utils;
4 |
5 | export var Marker = L.Class.extend({
6 |
7 | initialize(options, control) {
8 | this.options = options;
9 | this.control = control
10 |
11 | switch(this.options.marker) {
12 | case 'elevation-line':
13 | // this._container = d3.create("g").attr("class", "height-focus-group");
14 | break;
15 | case 'position-marker':
16 | // this._marker = L.circleMarker([0, 0], { pane: 'overlayPane', radius: 6, fillColor: '#fff', fillOpacity:1, color: '#000', weight:1, interactive: false });
17 | this._marker = L.marker([0, 0], { icon: this.options.markerIcon, zIndexOffset: 1000000, interactive: false });
18 | break;
19 | }
20 |
21 | this._labels = {};
22 |
23 | return this;
24 | },
25 |
26 | addTo(map) {
27 | this._map = map;
28 | switch(this.options.marker) {
29 | case 'elevation-line': this._container = d3.select(map.getPane('elevationPane')).select("svg > g").call(D3.PositionMarker({})); break;
30 | case 'position-marker': this._marker.addTo(map, { pane: 'overlayPane' }); break;
31 | }
32 | return this;
33 | },
34 |
35 | /**
36 | * Update position marker ("leaflet-marker").
37 | */
38 | update(props) {
39 | if (props) this._props = props;
40 | else props = this._props;
41 |
42 | if (!props) return;
43 |
44 | if (props.options) this.options = props.options;
45 | if (!this._map) this.addTo(props.map);
46 |
47 | this._latlng = props.item.latlng;
48 |
49 | switch(this.options.marker) {
50 | case 'elevation-line':
51 | if (this._container) {
52 | let point = this._map.latLngToLayerPoint(this._latlng);
53 | point = L.extend({}, props.item, this._map._rotate ? this._map.rotatedPointToMapPanePoint(point) : point);
54 |
55 | let yMax = (this.control._height() / props.yCoordMax * point[this.options.yAttr]);
56 |
57 | if (!isFinite(yMax) || isNaN(yMax)) yMax = 0;
58 |
59 | this._container.classed("leaflet-hidden", false);
60 | this._container.call(D3.PositionMarker({
61 | theme : this.options.theme,
62 | xCoord: point.x,
63 | yCoord: point.y,
64 | length: point.y - yMax, // normalized Y
65 | labels: this._labels,
66 | item: point,
67 | }));
68 | }
69 | break;
70 | case 'position-marker':
71 | _.removeClass(this._marker.getElement(), 'leaflet-hidden');
72 | this._marker.setLatLng(this._latlng);
73 | break;
74 | }
75 | },
76 |
77 | /*
78 | * Hides the position/height indicator marker drawn onto the map
79 | */
80 | remove() {
81 | this._props = null;
82 | switch(this.options.marker) {
83 | case 'elevation-line': this._container && this._container.classed("leaflet-hidden", true); break;
84 | case 'position-marker': _.addClass(this._marker.getElement(), 'leaflet-hidden'); break;
85 | }
86 | },
87 |
88 | getLatLng() {
89 | return this._latlng;
90 | },
91 |
92 | _registerTooltip(props) {
93 | this._labels[props.name] = props;
94 | }
95 |
96 | });
97 |
--------------------------------------------------------------------------------
/src/components/summary.js:
--------------------------------------------------------------------------------
1 | const _ = L.Control.Elevation.Utils;
2 |
3 | export var Summary = L.Class.extend({
4 | initialize(opts, control) {
5 | this.options = opts;
6 | this.control = control;
7 | this.labels = {};
8 |
9 | let summary = this._container = _.create("div", "elevation-summary " + (opts.summary ? opts.summary + "-summary" : ''));
10 | _.style(summary, 'max-width', opts.width ? opts.width + 'px' : '');
11 | },
12 |
13 | render() {
14 | return container => container.append(() => this._container);
15 | },
16 |
17 | reset() {
18 | this._container.innerHTML = '';
19 | },
20 |
21 | append(className, label, value) {
22 | this._container.innerHTML += `${label}${value}`;
23 | return this;
24 | },
25 |
26 | update() {
27 | Object
28 | .keys(this.labels)
29 | .sort((a, b) => this.labels[a].order - this.labels[b].order) // TODO: any performance issues?
30 | .forEach((i)=> {
31 | let value = typeof this.labels[i].value !== "function" ? this.labels[i].value : this.labels[i].value(this.control.track_info, this.labels[i].unit || '');
32 | this.append(i /*+ " order-" + this.labels[i].order*/, L._(this.labels[i].label), value, this.labels[i].order);
33 | });
34 | },
35 |
36 | _registerSummary(data) {
37 | for (let i in data) {
38 | data[i].order = data[i].order ?? 1000;
39 | this.labels[i] = data[i];
40 | }
41 | }
42 |
43 | });
44 |
--------------------------------------------------------------------------------
/src/handlers/acceleration.js:
--------------------------------------------------------------------------------
1 | export function Acceleration() {
2 |
3 | const _ = L.Control.Elevation.Utils;
4 |
5 | let opts = this.options;
6 | let acceleration = {};
7 |
8 | acceleration.label = opts.accelerationLabel || L._(opts.imperial ? 'ft/s²' : 'm/s²');
9 | opts.accelerationFactor = opts.accelerationFactor || 1;
10 |
11 | return {
12 | name: 'acceleration',
13 | unit: acceleration.label,
14 | deltaMax: this.options.accelerationDeltaMax,
15 | clampRange: this.options.accelerationRange,
16 | decimals: 2,
17 | pointToAttr: (_, i) => {
18 | let dv = (this._data[i].speed - this._data[i > 0 ? i - 1 : i].speed) * (1000 / opts.timeFactor);
19 | let dt = (this._data[i].time - this._data[i > 0 ? i - 1 : i].time) / 1000;
20 | return dt > 0 ? Math.abs((dv / dt)) * opts.accelerationFactor : NaN;
21 | },
22 | stats: { max: _.iMax, min: _.iMin, avg: _.iAvg },
23 | scale: {
24 | axis : "y",
25 | position : "right",
26 | scale : { min: 0, max: +1 },
27 | tickPadding: 16,
28 | labelX : 25,
29 | labelY : -8,
30 | },
31 | path: {
32 | label : 'Acceleration',
33 | yAttr : 'acceleration',
34 | scaleX : 'distance',
35 | scaleY : 'acceleration',
36 | color : '#050402',
37 | strokeColor : '#000',
38 | strokeOpacity: "0.5",
39 | fillOpacity : "0.25",
40 | },
41 | tooltip: {
42 | chart: (item) => L._("a: ") + item.acceleration + " " + acceleration.label,
43 | marker: (item) => Math.round(item.acceleration) + " " + acceleration.label,
44 | order: 60,
45 | },
46 | summary: {
47 | "minacceleration" : {
48 | label: "Min Acceleration: ",
49 | value: (track, unit) => Math.round(track.acceleration_min || 0) + ' ' + unit,
50 | order: 60
51 | },
52 | "maxacceleration" : {
53 | label: "Max Acceleration: ",
54 | value: (track, unit) => Math.round(track.acceleration_max || 0) + ' ' + unit,
55 | order: 61
56 | },
57 | "avgacceleration": {
58 | label: "Avg Acceleration: ",
59 | value: (track, unit) => Math.round(track.acceleration_avg || 0) + ' ' + unit,
60 | order: 62
61 | },
62 | }
63 | };
64 | }
65 |
--------------------------------------------------------------------------------
/src/handlers/altitude.js:
--------------------------------------------------------------------------------
1 | export function Altitude() {
2 |
3 | const _ = L.Control.Elevation.Utils;
4 |
5 | let opts = this.options;
6 | let altitude = {};
7 |
8 | let theme = opts.theme.split(' ')[0].replace('-theme', '');
9 | let color = _.Colors[theme] || {};
10 |
11 | opts.altitudeFactor = opts.imperial ? this.__footFactor : (opts.altitudeFactor || 1); // 1 m = (1 m)
12 | altitude.label = opts.imperial ? "ft" : opts.yLabel;
13 |
14 | return {
15 | name: 'altitude',
16 | required: this.options.slope,
17 | meta: 'z',
18 | unit: altitude.label,
19 | statsName: 'elevation',
20 | deltaMax: this.options.altitudeDeltaMax,
21 | clampRange: this.options.altitudeRange,
22 | // init: ({point}) => {
23 | // // "alt" property is generated inside "leaflet"
24 | // if ("alt" in point) point.meta.ele = point.alt;
25 | // },
26 | pointToAttr: (point, i) => {
27 | if ("alt" in point) point.meta.ele = point.alt; // "alt" property is generated inside "leaflet"
28 | return this._data[i].z *= opts.altitudeFactor;
29 | },
30 | stats: { max: _.iMax, min: _.iMin, avg: _.iAvg },
31 | grid: {
32 | axis : "y",
33 | position : "left",
34 | scale : "y" // this._chart._y,
35 | },
36 | scale: {
37 | axis : "y",
38 | position: "left",
39 | scale : "y", // this._chart._y,
40 | labelX : -3,
41 | labelY : -8,
42 | },
43 | path: {
44 | label : 'Altitude',
45 | scaleX : 'distance',
46 | scaleY : 'altitude',
47 | className : 'area',
48 | color : color.area || theme,
49 | strokeColor : opts.detached ? color.stroke : '#000',
50 | strokeOpacity: "1",
51 | fillOpacity : opts.detached ? (color.alpha || '0.8') : 1,
52 | preferCanvas : opts.preferCanvas,
53 | },
54 | tooltip: {
55 | name: 'y',
56 | chart: (item) => L._("y: ") + _.round(item[opts.yAttr], opts.decimalsY) + " " + altitude.label,
57 | marker: (item) => _.round(item[opts.yAttr], opts.decimalsY) + " " + altitude.label,
58 | order: 10,
59 | },
60 | summary: {
61 | "minele" : {
62 | label: "Min Elevation: ",
63 | value: (track, unit) => (track.elevation_min || 0).toFixed(2) + ' ' + unit,
64 | order: 30,
65 | },
66 | "maxele" : {
67 | label: "Max Elevation: ",
68 | value: (track, unit) => (track.elevation_max || 0).toFixed(2) + ' ' + unit,
69 | order: 31,
70 | },
71 | "avgele" : {
72 | label: "Avg Elevation: ",
73 | value: (track, unit) => (track.elevation_avg || 0).toFixed(2) + ' ' + unit,
74 | order: 32,
75 | },
76 | }
77 | };
78 | }
79 |
--------------------------------------------------------------------------------
/src/handlers/cadence.js:
--------------------------------------------------------------------------------
1 | export function Cadence() {
2 |
3 | const _ = L.Control.Elevation.Utils;
4 |
5 | return {
6 | name: 'cadence', // <-- Your custom option name (eg. "cadence: true")
7 | unit: 'rpm',
8 | meta: 'cad', // <-- point.meta.cad
9 | coordinateProperties: ["cads", "cadences", "cad", "cadence"], // List of GPX Extensions ("coordinateProperties") to be handled by "@tmcw/toGeoJSON"
10 | pointToAttr: (point, i) => (point.cad ?? point.meta.cad ?? point.prev('cadence')) || 0,
11 | stats: { max: _.iMax, min: _.iMin, avg: _.iAvg },
12 | scale: {
13 | axis : "y",
14 | position : "right",
15 | scale : { min: -1, max: +1 },
16 | tickPadding: 16,
17 | labelX : 25,
18 | labelY : -8,
19 | },
20 | path: {
21 | label : 'RPM',
22 | yAttr : 'cadence',
23 | scaleX : 'distance',
24 | scaleY : 'cadence',
25 | color : '#FFF',
26 | strokeColor : 'blue',
27 | strokeOpacity: "0.85",
28 | fillOpacity : "0.1",
29 | },
30 | tooltip: {
31 | name: 'cadence',
32 | chart: (item) => L._("cad: ") + item.cadence + " " + 'rpm',
33 | marker: (item) => Math.round(item.cadence) + " " + 'rpm',
34 | order: 1
35 | },
36 | summary: {
37 | "minrpm": {
38 | label: "Min RPM: ",
39 | value: (track, unit) => Math.round(track.cadence_min || 0) + ' ' + unit,
40 | // order: 30
41 | },
42 | "maxrpm": {
43 | label: "Max RPM: ",
44 | value: (track, unit) => Math.round(track.cadence_max || 0) + ' ' + unit,
45 | // order: 30
46 | },
47 | "avgrpm": {
48 | label: "Avg RPM: ",
49 | value: (track, unit) => Math.round(track.cadence_avg || 0) + ' ' + unit,
50 | // order: 20
51 | },
52 | }
53 | };
54 | }
--------------------------------------------------------------------------------
/src/handlers/distance.js:
--------------------------------------------------------------------------------
1 | export function Distance() {
2 |
3 | const _ = L.Control.Elevation.Utils;
4 |
5 | let opts = this.options;
6 | let distance = {};
7 |
8 | opts.distanceFactor = opts.imperial ? this.__mileFactor : (opts.distanceFactor || 1); // 1 km = (1000 m)
9 | distance.label = opts.imperial ? "mi" : opts.xLabel;
10 |
11 | return {
12 | name: 'distance',
13 | required: true,
14 | attr: 'dist',
15 | unit: distance.label,
16 | decimals: 5,
17 | pointToAttr: (_, i) => (i > 0 ? this._data[i - 1].dist : 0) + (this._data[i].latlng.distanceTo(this._data[i > 0 ? i - 1 : i].latlng) * opts.distanceFactor) / 1000, // convert back km to meters
18 | // stats: { total: _.iSum },
19 | onPointAdded: (distance, i) => this.track_info.distance = distance,
20 | scale: opts.distance && {
21 | axis : "x",
22 | position: "bottom",
23 | scale : "x", // this._chart._x,
24 | labelY : 25,
25 | labelX : () => this._width() + 6,
26 | ticks : () => _.clamp(this._chart._xTicks() / 2, [4, +Infinity]),
27 | },
28 | grid: opts.distance && {
29 | axis : "x",
30 | position : "bottom",
31 | scale : "x" // this._chart._x,
32 | },
33 | tooltip: opts.distance && {
34 | name: 'x',
35 | chart: (item) => L._("x: ") + _.round(item[opts.xAttr], opts.decimalsX) + " " + distance.label,
36 | order: 20
37 | },
38 | summary: opts.distance && {
39 | "totlen" : {
40 | label: "Total Length: ",
41 | value: (track) => (track.distance || 0).toFixed(2) + ' ' + distance.label,
42 | order: 10
43 | }
44 | }
45 | };
46 | }
47 |
--------------------------------------------------------------------------------
/src/handlers/heart.js:
--------------------------------------------------------------------------------
1 | export function Heart() {
2 |
3 | const _ = L.Control.Elevation.Utils;
4 |
5 | return {
6 | name: 'heart', // <-- Your custom option name (eg. "heart: true")
7 | unit: 'bpm',
8 | meta: 'hr', // <-- point.meta.hr
9 | coordinateProperties: ["heart", "heartRates", "heartRate"], // List of GPX Extensions ("coordinateProperties") to be handled by "@tmcw/toGeoJSON"
10 | pointToAttr: (point, i) => (point.hr ?? point.meta.hr ?? point.prev('heart')) || 0,
11 | stats: { max: _.iMax, min: _.iMin, avg: _.iAvg },
12 | scale: {
13 | axis : "y",
14 | position : "left",
15 | scale : { min: -1, max: +1 },
16 | tickPadding: 25,
17 | labelX : -30,
18 | labelY : -8,
19 | },
20 | path: {
21 | label : 'ECG',
22 | yAttr : 'heart',
23 | scaleX : 'distance',
24 | scaleY : 'heart',
25 | color : 'white',
26 | strokeColor : 'red',
27 | strokeOpacity: "0.85",
28 | fillOpacity : "0.1",
29 | },
30 | tooltip: {
31 | chart: (item) => L._("hr: ") + item.heart + " " + 'bpm',
32 | marker: (item) => Math.round(item.heart) + " " + 'bpm',
33 | order: 1
34 | },
35 | summary: {
36 | "minbpm": {
37 | label: "Min BPM: ",
38 | value: (track, unit) => Math.round(track.heart_min || 0) + ' ' + unit,
39 | // order: 30
40 | },
41 | "maxbpm": {
42 | label: "Max BPM: ",
43 | value: (track, unit) => Math.round(track.heart_max || 0) + ' ' + unit,
44 | // order: 30
45 | },
46 | "avgbpm": {
47 | label: "Avg BPM: ",
48 | value: (track, unit) => Math.round(track.heart_avg || 0) + ' ' + unit,
49 | // order: 20
50 | },
51 | }
52 | };
53 | };
--------------------------------------------------------------------------------
/src/handlers/labels.js:
--------------------------------------------------------------------------------
1 | /**
2 | * @see https://github.com/Raruto/leaflet-elevation/issues/211
3 | *
4 | * @example
5 | * ```js
6 | * L.control.Elevation({ handlers: [ 'Labels' ], labelsRotation: 25, labelsAlign: 'start' })
7 | * ```
8 | */
9 | export function Labels() {
10 |
11 | this.on('elechart_updated', function(e) {
12 |
13 | const pointG = this._chart._chart.pane('point');
14 |
15 | const textRotation = this.options.labelsRotation ?? -90;
16 | const textAnchor = this.options.labelsAlign;
17 |
18 | if (90 == Math.abs(textRotation)) {
19 |
20 | pointG.selectAll('text')
21 | .attr('dy', '4px')
22 | .attr("dx", (d, i, el) => Math.sign(textRotation) * (this._height() - d3.select(el[i].parentElement).datum().y - 8) + 'px')
23 | .attr('text-anchor', textRotation > 0 ? 'end' : 'start')
24 | .attr('transform', 'rotate(' + textRotation + ')')
25 |
26 | pointG.selectAll('circle')
27 | .attr('r', '2.5')
28 | .attr('fill', '#fff')
29 | .attr("stroke", '#000')
30 | .attr("stroke-width", '1.1');
31 |
32 | } else if (!isNaN(textRotation)) {
33 |
34 | pointG.selectAll('text')
35 | .attr("dx", "4px")
36 | .attr("dy", "-9px")
37 | .attr('text-anchor', textAnchor ?? (0 == textRotation ? 'start' : 'middle'))
38 | .attr('transform', 'rotate('+ -textRotation +')')
39 |
40 | }
41 |
42 | });
43 |
44 | return { };
45 | }
46 |
--------------------------------------------------------------------------------
/src/handlers/lineargradient.js:
--------------------------------------------------------------------------------
1 | /**
2 | * @see https://github.com/Raruto/leaflet-elevation/issues/251
3 | *
4 | * @example
5 | * ```js
6 | * L.control.Elevation({
7 | * altitude: true,
8 | * distance: true,
9 | * handlers: [ 'Altitude', 'Distance', 'LinearGradient', ],
10 | * linearGradient: {
11 | * attr: 'z',
12 | * path: 'altitude',
13 | * range: { 0.0: '#008800', 0.5: '#ffff00', 1.0: '#ff0000' },
14 | * min: 'elevation_min',
15 | * max: 'elevation_max',
16 | * },
17 | * })
18 | * ```
19 | */
20 | export function LinearGradient() {
21 |
22 | if (!this.options.linearGradient) {
23 | return {};
24 | }
25 |
26 | const _ = L.Control.Elevation.Utils;
27 |
28 | /**
29 | * Initialize gradient color palette.
30 | */
31 | const get_palette = function ({range, min, max, depth = 256}) {
32 | const canvas = document.createElement('canvas'),
33 | ctx = canvas.getContext('2d'),
34 | gradient = ctx.createLinearGradient(0, 0, 0, depth);
35 |
36 | canvas.width = 1;
37 | canvas.height = depth;
38 |
39 | for (let i in range) {
40 | gradient.addColorStop(i, range[i]);
41 | }
42 |
43 | ctx.fillStyle = gradient;
44 | ctx.fillRect(0, 0, 1, depth);
45 |
46 | const { data } = ctx.getImageData(0, 0, 1, depth);
47 |
48 | return {
49 | /**
50 | * Gets the RGB values of a given z value of the current palette.
51 | *
52 | * @param {number} value - Value to get the color for, should be between min and max.
53 | * @returns {string} The RGB values as `rgb(r, g, b)` string
54 | */
55 | getRGBColor(value) {
56 | const idx = Math.floor(Math.min(Math.max((value - min) / (max - min), 0), 0.999) * depth) * 4;
57 | return 'rgb(' + [data[idx], data[idx + 1], data[idx + 2]].join(',') + ')';
58 | }
59 | };
60 | };
61 |
62 | const { preferCanvas } = this.options;
63 | const { attr, path: path_name, range, min, max } = L.extend({
64 | attr: 'z',
65 | path: 'altitude',
66 | range: { 0.0: '#008800', 0.5: '#ffff00', 1.0: '#ff0000' },
67 | min: 'elevation_min',
68 | max: 'elevation_max',
69 | }, (true === this.options.linearGradient) ? {} : this.options.linearGradient);
70 |
71 | const gradient_id = path_name + '-gradient-' + _.randomId();
72 | const legend_id = 'legend-' + gradient_id;
73 |
74 | // Charte profile gradient
75 | this.on('elechart_axis', () => {
76 | if (!this._data.length) return;
77 |
78 | const chart = this._chart;
79 | const path = chart._paths[path_name];
80 | const { defs } = chart._chart.utils;
81 |
82 | const palette = get_palette({
83 | min: isFinite(this.track_info[min]) ? this.track_info[min] : 0,
84 | max: isFinite(this.track_info[max]) ? this.track_info[max] : 1,
85 | range,
86 | });
87 |
88 | let gradient;
89 |
90 | if (preferCanvas) {
91 | /** ref: `path.__fillStyle` within L.Control.Elevation.Utils::drawCanvas(ctx, path) */
92 | path.__fillStyle = gradient = chart._context.createLinearGradient(0, 0, chart._width(), 0);
93 | } else {
94 | defs.select('#' + gradient_id).remove();
95 | gradient = defs.append('svg:linearGradient').attr('id', gradient_id);
96 | gradient.addColorStop = function(offset, color) { gradient.append('svg:stop').attr('offset', offset).attr('stop-color', color) };
97 | path.attr('fill', 'url(#' + gradient_id + ')').classed('area', false);
98 | }
99 |
100 | // Generate gradient for each segment picking colors from palette
101 | for (let i = 0, data = this._data; i < data.length; i++) {
102 | gradient.addColorStop((i) / data.length, palette.getRGBColor(data[i][attr]));
103 | }
104 |
105 | });
106 |
107 | // Legend item gradient
108 | this.on('elechart_updated', () => {
109 | const chart = this._chart;
110 | const { defs } = chart._chart.utils;
111 | defs.select('#' + legend_id).remove();
112 | const legendGradient = defs.append('svg:linearGradient').attr('id', legend_id);
113 | Object.keys(range).sort().forEach(i => legendGradient.append('svg:stop').attr('offset', i).attr('stop-color', range[i]));
114 |
115 | chart._container
116 | .select('.legend-' + path_name + ' > rect')
117 | .attr('fill', 'url(#' + legend_id + ')')
118 | .classed('area', false);
119 | });
120 |
121 | return { };
122 | }
--------------------------------------------------------------------------------
/src/handlers/pace.js:
--------------------------------------------------------------------------------
1 | export function Pace() {
2 |
3 | const _ = L.Control.Elevation.Utils;
4 |
5 | let opts = this.options;
6 | let pace = {};
7 |
8 | pace.label = opts.paceLabel || L._(opts.imperial ? 'min/mi' : 'min/km');
9 | opts.paceFactor = opts.paceFactor || 60; // 1 min = 60 sec
10 |
11 | return {
12 | name: 'pace',
13 | unit: pace.label,
14 | deltaMax: this.options.paceDeltaMax,
15 | clampRange: this.options.paceRange,
16 | decimals: 2,
17 | pointToAttr: (_, i) => {
18 | let dx = (this._data[i].dist - this._data[i > 0 ? i - 1 : i].dist) * 1000;
19 | let dt = this._data[i].time - this._data[ i > 0 ? i - 1 : i].time;
20 | return dx > 0 ? Math.abs((dt / dx) / opts.paceFactor) : NaN;
21 | },
22 | stats: { max: _.iMax, min: _.iMin, avg: _.iAvg },
23 | scale : (this.options.pace && this.options.pace != "summary") && {
24 | axis : "y",
25 | position : "right",
26 | scale : { min : 0, max : +1 },
27 | tickPadding: 16,
28 | labelX : 25,
29 | labelY : -8,
30 | },
31 | path: (this.options.pace && this.options.pace != "summary") && {
32 | // name : 'pace',
33 | label : 'Pace',
34 | yAttr : "pace",
35 | scaleX : 'distance',
36 | scaleY : 'pace',
37 | color : '#03ffff',
38 | strokeColor : '#000',
39 | strokeOpacity: "0.5",
40 | fillOpacity : "0.25",
41 | },
42 | tooltip: (this.options.pace) && {
43 | chart: (item) => L._('pace: ') + item.pace + " " + pace.label,
44 | marker: (item) => Math.round(item.pace) + " " + pace.label,
45 | order: 50,
46 | },
47 | summary: (this.options.pace) && {
48 | "minpace" : {
49 | label: "Min Pace: ",
50 | value: (track, unit) => Math.round(track.pace_min || 0) + ' ' + unit,
51 | order: 51
52 | },
53 | "maxpace" : {
54 | label: "Max Pace: ",
55 | value: (track, unit) => Math.round(track.pace_max || 0) + ' ' + unit,
56 | order: 51
57 | },
58 | "avgpace": {
59 | label: "Avg Pace: ",
60 | value: (track, unit) => Math.round(track.pace_avg || 0) + ' ' + unit,
61 | order: 52
62 | },
63 | }
64 | };
65 | }
66 |
--------------------------------------------------------------------------------
/src/handlers/runner.js:
--------------------------------------------------------------------------------
1 | /**
2 | * @see https://github.com/Igor-Vladyka/leaflet.motion
3 | *
4 | * @example
5 | * ```js
6 | * L.control.Elevation({ handlers: [ 'Runner' ], runnerOptions: { polyline: {..}, motion: {..}, marker {..} } })
7 | * ```
8 | */
9 | export async function Runner() {
10 |
11 | await this.import(this.__LMOTION || 'https://unpkg.com/leaflet.motion@0.3.2/dist/leaflet.motion.min.js', typeof L.Motion !== 'object')
12 |
13 | let { runnerOptions } = this.options;
14 |
15 | runnerOptions = L.extend(
16 | { polyline: {}, motion: {}, marker: undefined },
17 | 'object' === typeof runnerOptions ? runnerOptions : {}
18 | );
19 |
20 | // Custom tooltips
21 | this._registerTooltip({
22 | name: 'here',
23 | marker: (item) => L._("You are here: "),
24 | order: 1,
25 | });
26 |
27 | this._registerTooltip({
28 | name: 'distance',
29 | marker: (item) => Math.round(item.dist) + " " + this.options.xLabel,
30 | order: 2,
31 | });
32 |
33 | this.addCheckpoint = function (checkpoint) {
34 | return this._registerCheckPoint({ // <-- NB these are private functions use them at your own risk!
35 | latlng: this._findItemForX(this._x(checkpoint.dist)).latlng,
36 | label: checkpoint.label || ''
37 | });
38 | }
39 |
40 | this.addRunner = function (runner) {
41 | let x = this._x(runner.dist);
42 | let y = this._y(this._findItemForX(x).z)
43 | let g = d3.select(this._container)
44 | .select('svg > g')
45 | .append("svg:circle")
46 | .attr("class", "runner " + this.options.theme + " height-focus circle-lower")
47 | .attr("r", 6)
48 | .attr("cx", x)
49 | .attr("cy", y);
50 | return g;
51 | }
52 |
53 | this.setPositionFromLatLng = function (latlng) {
54 | this._onMouseMoveLayer({ latlng: latlng }); // Update map and chart "markers" from latlng
55 | };
56 |
57 | this.tick = function (runner, dist = 0, inc = 0.1) {
58 | dist = (dist <= this.track_info.distance - inc) ? dist + inc : 0;
59 | this.updateRunnerPos(runner, dist);
60 | setTimeout(() => this.tick(runner, dist), 150);
61 | };
62 |
63 | this.updateRunnerPos = function (runner, pos) {
64 | let curr, x;
65 |
66 | if (pos instanceof L.LatLng) {
67 | curr = this._findItemForLatLng(pos);
68 | x = this._x(curr.dist);
69 | } else {
70 | x = this._x(pos);
71 | curr = this._findItemForX(x);
72 | }
73 |
74 | runner
75 | .attr("cx", x)
76 | .attr("cy", this._y(curr.z));
77 | this.setPositionFromLatLng(curr.latlng);
78 | };
79 |
80 | this.animate = function (layer, speed = 1500) {
81 |
82 | if (this._runner) {
83 | this._runner.remove();
84 | }
85 |
86 | layer.setStyle({ opacity: 0.5 });
87 |
88 | const geo = L.geoJson(layer.toGeoJSON(), { coordsToLatLng: (coords) => L.latLng(coords[0], coords[1], coords[2] * (this.options.altitudeFactor || 1)) });
89 | this._runner = L.motion.polyline(
90 | geo.toGeoJSON().features[0].geometry.coordinates,
91 | L.extend({}, { color: 'red', pane: 'elevationPane', attribution: '' }, runnerOptions.polyline),
92 | L.extend({}, { auto: true, speed: speed, }, runnerOptions.motion),
93 | runnerOptions.marker || undefined
94 | );
95 |
96 | // Override default function behavior: `L.Motion.Polyline::_drawMarker()`
97 | this._runner._drawMarker = new Proxy(this._runner._drawMarker, {
98 | apply: (target, thisArg, argArray) => {
99 | thisArg._runner = thisArg._runner || this.addRunner({ dist: 0 });
100 | this.updateRunnerPos(thisArg._runner, argArray[0]);
101 | return target.apply(thisArg, argArray);
102 | }
103 | });
104 |
105 | this._runner.addTo(this._map);
106 | };
107 |
108 | return {};
109 | }
110 |
--------------------------------------------------------------------------------
/src/handlers/slope.js:
--------------------------------------------------------------------------------
1 | export function Slope() {
2 |
3 | const _ = L.Control.Elevation.Utils;
4 |
5 | let opts = this.options;
6 | let slope = {};
7 |
8 | slope.label = opts.slopeLabel || '%';
9 |
10 | return {
11 | name: 'slope',
12 | meta: 'slope',
13 | unit: slope.label,
14 | deltaMax: this.options.slopedDeltaMax,
15 | clampRange: this.options.slopeRange,
16 | decimals: 2,
17 | pointToAttr: (_, i) => { // slope in % = ( dy / dx ) * 100;
18 | let dx = (this._data[i].dist - this._data[i > 0 ? i - 1 : i].dist) * 1000;
19 | let dy = this._data[i][this.options.yAttr] - this._data[i > 0 ? i - 1 : i][this.options.yAttr];
20 | return dx !== 0 ? (dy / dx) * 100 : NaN;
21 | },
22 | onPointAdded: (_, i) => {
23 | let dz = this._data[i][this.options.yAttr] - this._data[i > 0 ? i - 1 : i][this.options.yAttr];
24 | if (dz > 0) this.track_info.ascent = (this.track_info.ascent || 0) + dz; // Total Ascent
25 | else if (dz < 0) this.track_info.descent = (this.track_info.descent || 0) - dz; // Total Descent
26 | },
27 | stats: { max: _.iMax, min: _.iMin, avg: _.iAvg, },
28 | scale: {
29 | axis : "y",
30 | position : "right",
31 | scale : { min: -1, max: +1 },
32 | tickPadding: 16,
33 | labelX : 25,
34 | labelY : -8,
35 | },
36 | path: {
37 | label : 'Slope',
38 | yAttr : 'slope',
39 | scaleX : 'distance',
40 | scaleY : 'slope',
41 | color : '#F00',
42 | strokeColor : '#000',
43 | strokeOpacity: "0.5",
44 | fillOpacity : "0.25",
45 | },
46 | tooltip: {
47 | chart: (item) => L._("m: ") + item.slope + slope.label,
48 | marker: (item) => Math.round(item.slope) + slope.label,
49 | order: 40,
50 | },
51 | summary: {
52 | "minslope": {
53 | label: "Min Slope: ",
54 | value: (track, unit) => Math.round(track.slope_min || 0) + ' ' + unit,
55 | order: 40
56 | },
57 | "maxslope": {
58 | label: "Max Slope: ",
59 | value: (track, unit) => Math.round(track.slope_max || 0) + ' ' + unit,
60 | order: 41
61 | },
62 | "avgslope": {
63 | label: "Avg Slope: ",
64 | value: (track, unit) => Math.round(track.slope_avg || 0) + ' ' + unit,
65 | order: 42
66 | },
67 | "ascent" : {
68 | label: "Total Ascent: ",
69 | value: (track, unit) => Math.round(track.ascent || 0) + ' ' + (this.options.imperial ? 'ft' : 'm'),
70 | order: 43
71 | },
72 | "descent" : {
73 | label: "Total Descent: ",
74 | value: (track, unit) => Math.round(track.descent || 0) + ' ' + (this.options.imperial ? 'ft' : 'm'),
75 | order: 45
76 | },
77 | }
78 | };
79 | }
80 |
--------------------------------------------------------------------------------
/src/handlers/speed.js:
--------------------------------------------------------------------------------
1 | export function Speed() {
2 |
3 | const _ = L.Control.Elevation.Utils;
4 |
5 | let opts = this.options;
6 | let speed = {};
7 |
8 | speed.label = opts.speedLabel || L._(opts.imperial ? 'mph' : 'km/h');
9 | opts.speedFactor = opts.speedFactor || 1;
10 |
11 | return {
12 | name: 'speed',
13 | required: (this.options.acceleration),
14 | unit: speed.label,
15 | deltaMax: this.options.speedDeltaMax,
16 | clampRange: this.options.speedRange,
17 | decimals: 2,
18 | pointToAttr: (_, i) => {
19 | let dx = (this._data[i].dist - this._data[i > 0 ? i - 1 : i].dist) * 1000;
20 | let dt = this._data[i].time - this._data[ i > 0 ? i - 1 : i].time;
21 | return dt > 0 ? Math.abs((dx / dt) * opts.timeFactor) * opts.speedFactor : NaN;
22 | },
23 | stats: { max: _.iMax, min: _.iMin, avg: _.iAvg },
24 | scale : (this.options.speed && this.options.speed != "summary") && {
25 | axis : "y",
26 | position : "right",
27 | scale : { min : 0, max : +1 },
28 | tickPadding: 16,
29 | labelX : 25,
30 | labelY : -8,
31 | },
32 | path: (this.options.speed && this.options.speed != "summary") && {
33 | // name : 'speed',
34 | label : 'Speed',
35 | yAttr : "speed",
36 | scaleX : 'distance',
37 | scaleY : 'speed',
38 | color : '#03ffff',
39 | strokeColor : '#000',
40 | strokeOpacity: "0.5",
41 | fillOpacity : "0.25",
42 | },
43 | tooltip: (this.options.speed) && {
44 | chart: (item) => L._('v: ') + item.speed + " " + speed.label,
45 | marker: (item) => Math.round(item.speed) + " " + speed.label,
46 | order: 50,
47 | },
48 | summary: (this.options.speed) && {
49 | "minspeed" : {
50 | label: "Min Speed: ",
51 | value: (track, unit) => Math.round(track.speed_min || 0) + ' ' + unit,
52 | order: 51
53 | },
54 | "maxspeed" : {
55 | label: "Max Speed: ",
56 | value: (track, unit) => Math.round(track.speed_max || 0) + ' ' + unit,
57 | order: 51
58 | },
59 | "avgspeed": {
60 | label: "Avg Speed: ",
61 | value: (track, unit) => Math.round(track.speed_avg || 0) + ' ' + unit,
62 | order: 52
63 | },
64 | }
65 | };
66 | }
67 |
--------------------------------------------------------------------------------
/src/handlers/temperature.js:
--------------------------------------------------------------------------------
1 | export function Temperature() {
2 |
3 | const _ = L.Control.Elevation.Utils;
4 |
5 | let temperature = {};
6 | let opts = this.options;
7 | temperature.label = opts.label || L._(opts.imperial ? '°F' : '°C');
8 |
9 | // Fahrenheit = (Celsius * 9/5) + 32
10 | opts.temperatureFactor1 = opts.temperatureFactor1 ?? (opts.imperial ? 1.8 : 1);
11 | opts.temperatureFactor2 = opts.temperatureFactor2 ?? (opts.imperial ? 32 : 0);
12 |
13 | return {
14 | name: 'temperature', // <-- Your custom option name (eg. "temperature: true")
15 | unit: temperature.label,
16 | meta: 'atemps', // <-- point.meta.atemps
17 | coordinateProperties: ["atemps"], // List of GPX Extensions ("coordinateProperties") to be handled by "@tmcw/toGeoJSON"
18 | deltaMax: this.options.temperatureDeltaMax,
19 | clampRange: this.options.temperatureRange,
20 | decimals: 2,
21 | pointToAttr: (point, i) => (point.meta.atemps ?? point.meta.atemps ?? point.prev('temperature')) * opts.temperatureFactor1 + opts.temperatureFactor2,
22 | stats: { max: _.iMax, min: _.iMin, avg: _.iAvg },
23 | scale: {
24 | axis : "y",
25 | position : "right",
26 | scale : { min: -1, max: +1 },
27 | tickPadding: 16,
28 | labelX : +18,
29 | labelY : -8,
30 | },
31 | path: {
32 | label : temperature.label,
33 | yAttr : 'temperature',
34 | scaleX : 'distance',
35 | scaleY : 'temperature',
36 | color : 'transparent',
37 | strokeColor : '#000',
38 | strokeOpacity: "0.85",
39 | // fillOpacity : "0.1",
40 | },
41 | tooltip: {
42 | name: 'temperature',
43 | chart: (item) => L._("Temp: ") + Math.round(item.temperature).toLocaleString() + " " + temperature.label,
44 | marker: (item) => Math.round(item.temperature).toLocaleString() + " " + temperature.label,
45 | order: 1
46 | },
47 | summary: {
48 | "mintemp": {
49 | label: "Min Temp: ",
50 | value: (track, unit) => Math.round(track.temperature_min || 0) + ' ' + unit,
51 | },
52 | "maxtemp": {
53 | label: "Max Temp: ",
54 | value: (track, unit) => Math.round(track.temperature_max || 0) + ' ' + unit,
55 | },
56 | "avgtemp": {
57 | label: "Avg Temp: ",
58 | value: (track, unit) => Math.round(track.temperature_avg || 0) + ' ' + unit,
59 | },
60 | }
61 | };
62 | }
63 |
--------------------------------------------------------------------------------
/src/handlers/time.js:
--------------------------------------------------------------------------------
1 | export function Time() {
2 |
3 | const _ = L.Control.Elevation.Utils;
4 |
5 | let opts = this.options;
6 | let time = {};
7 |
8 | time.label = opts.timeLabel || 't';
9 | opts.timeFactor = opts.timeFactor || 3600;
10 |
11 | /**
12 | * Common AVG speeds:
13 | * ----------------------
14 | * slow walk = 1.8 km/h
15 | * walking = 3.6 km/h <-- default: 3.6
16 | * running = 10.8 km/h
17 | * cycling = 18 km/h
18 | * driving = 72 km/h
19 | * ----------------------
20 | */
21 | this._timeAVGSpeed = (opts.timeAVGSpeed || 3.6) * (opts.speedFactor || 1);
22 |
23 | if (!opts.timeFormat) {
24 | opts.timeFormat = (time) => (new Date(time)).toLocaleString().replaceAll('/', '-').replaceAll(',', ' ');
25 | } else if (opts.timeFormat == 'time') {
26 | opts.timeFormat = (time) => (new Date(time)).toLocaleTimeString();
27 | } else if (opts.timeFormat == 'date') {
28 | opts.timeFormat = (time) => (new Date(time)).toLocaleDateString();
29 | }
30 |
31 | opts.xTimeFormat = opts.xTimeFormat || ((t) => _.formatTime(t).split("'")[0]);
32 |
33 | return {
34 | name: 'time',
35 | required: (this.options.speed || this.options.acceleration || this.options.timestamps),
36 | coordinateProperties: ["coordTimes", "times", "time"],
37 | coordPropsToMeta: _.parseDate,
38 | pointToAttr: function(point, i) {
39 | // Add missing timestamps (see: options.timeAVGSpeed)
40 | if (!point.meta || !point.meta.time) {
41 | point.meta = point.meta || {};
42 | if (i > 0) {
43 | let dx = (this._data[i].dist - this._data[i - 1].dist);
44 | let t0 = this._data[i - 1].time.getTime();
45 | point.meta.time = new Date(t0 + ( dx / this._timeAVGSpeed) * this.options.timeFactor * 1000);
46 | } else {
47 | point.meta.time = new Date(Date.now())
48 | }
49 | }
50 | // Handle timezone offset
51 | let time = (point.meta.time.getTime() - point.meta.time.getTimezoneOffset() * 60 * 1000 !== 0) ? point.meta.time : 0;
52 | // Update duration
53 | this._data[i].duration = i > 0 ? (this._data[i - 1].duration || 0) + Math.abs(time - this._data[i - 1].time) : 0;
54 | return time;
55 | },
56 | onPointAdded: (_, i) => this.track_info.time = this._data[i].duration,
57 | scale: (opts.time && opts.time != "summary" && !L.Browser.mobile) && {
58 | axis : "x",
59 | position : "top",
60 | scale : {
61 | attr : "duration",
62 | min : 0,
63 | },
64 | label : time.label,
65 | labelY : -10,
66 | labelX : () => this._width(),
67 | name : "time",
68 | ticks : () => _.clamp(this._chart._xTicks() / 2, [4, +Infinity]),
69 | tickFormat : (d) => (d == 0 ? '' : opts.xTimeFormat(d)),
70 | onAxisMount: axis => {
71 | axis.select(".domain")
72 | .remove();
73 | axis.selectAll("text")
74 | .attr('opacity', 0.65)
75 | .style('font-family', 'Monospace')
76 | .style('font-size', '110%');
77 | axis.selectAll(".tick line")
78 | .attr('y2', this._height())
79 | .attr('stroke-dasharray', 2)
80 | .attr('opacity', 0.75);
81 | }
82 | },
83 | tooltips: [
84 | (this.options.time) && {
85 | name: 'time',
86 | chart: (item) => L._("T: ") + _.formatTime(item.duration || 0),
87 | order: 20
88 | },
89 | (this.options.timestamps) && {
90 | name: 'date',
91 | chart: (item) => L._("t: ") + this.options.timeFormat(item.time),
92 | order: 21,
93 | }
94 | ],
95 | summary: (this.options.time) && {
96 | "tottime" : {
97 | label: "Total Time: ",
98 | value: (track) => _.formatTime(track.time || 0),
99 | order: 20
100 | }
101 | }
102 | };
103 | }
--------------------------------------------------------------------------------
/src/index.css:
--------------------------------------------------------------------------------
1 | .leaflet-hidden {
2 | visibility: hidden;
3 | }
4 |
5 | .legend {
6 | cursor: pointer;
7 | }
8 |
9 | .leaflet-container {
10 | z-index: 0;
11 | /* prevent overlapping the .elevation-detached chart */
12 | }
13 |
14 | .elevation-control .background {
15 | background-color: var(--ele-bg, rgba(70, 130, 180, 0.2));
16 | border-radius: 5px;
17 | overflow: visible;
18 | display: block;
19 | touch-action: none;
20 | user-select: none;
21 | max-width: 100%;
22 | }
23 |
24 | .elevation-control .grid,
25 | .elevation-control .area > foreignObject,
26 | .elevation-control .axis,
27 | .elevation-control .tooltip,
28 | .height-focus.line {
29 | pointer-events: none;
30 | }
31 |
32 | .elevation-control .axis line,
33 | .elevation-control .axis path {
34 | stroke: var(--ele-axis, #2D1130);
35 | stroke-width: 1;
36 | fill: none;
37 | }
38 |
39 | .elevation-control .grid .tick line {
40 | stroke: var(--ele-grid, #EEE);
41 | stroke-width: 1px;
42 | shape-rendering: crispEdges;
43 | }
44 |
45 | .elevation-control .grid path {
46 | stroke-width: 0;
47 | }
48 |
49 | .elevation-control .axis text,
50 | .elevation-control .legend text,
51 | .elevation-control .point text {
52 | fill: #000;
53 | font-weight: 700;
54 | paint-order: stroke fill;
55 | stroke: #fff;
56 | stroke-width: 2px
57 | }
58 |
59 | .elevation-control .y.axis text {
60 | text-anchor: end;
61 | }
62 |
63 | .elevation-control .area {
64 | fill: var(--ele-area, #4682B4);
65 | stroke: var(--ele-stroke, #000);
66 | stroke-width: 1.2;
67 | paint-order: stroke fill;
68 | }
69 |
70 | .elevation-control .horizontal-drag-line {
71 | cursor: row-resize;
72 | stroke: transparent;
73 | stroke-dasharray: 5;
74 | stroke-width: 1.1;
75 | }
76 |
77 | .elevation-control .active .horizontal-drag-line {
78 | stroke: #000;
79 | }
80 |
81 | .elevation-control .horizontal-drag-label {
82 | fill: #000;
83 | font-weight: 700;
84 | paint-order: stroke;
85 | stroke: #FFF;
86 | stroke-width: 2px;
87 | }
88 |
89 | .elevation-control .ruler {
90 | color: #000;
91 | cursor: row-resize;
92 | }
93 |
94 | .elevation-control .mouse-focus-line {
95 | stroke: #000;
96 | stroke-width: 1;
97 | }
98 |
99 | .elevation-control .mouse-focus-label-rect {
100 | fill: #000;
101 | fill-opacity: 0.75;
102 | stroke-width: 1;
103 | stroke: #444;
104 | }
105 |
106 | .elevation-control .mouse-focus-label-text {
107 | fill: #FFF;
108 | font-size: 10px;
109 | }
110 |
111 | .elevation-control .brush .overlay {
112 | cursor: unset;
113 | }
114 |
115 | .elevation-control .brush .selection {
116 | fill: var(--ele-brush, rgba(23, 74, 117, 0.4));
117 | stroke: none;
118 | fill-opacity: unset;
119 | }
120 |
121 | .elevation-summary {
122 | font-family: "Lucida Grande", "Lucida Sans Unicode", Verdana, Arial, Helvetica, sans-serif;
123 | font-size: 12px;
124 | margin: var(--ele-sum-margin, 0 auto);
125 | text-shadow: var(--ele-sum-shadow, 1px 0 0 #FFF, -1px 0 0 #FFF, 0 1px 0 #FFF, 0 -1px 0 #FFF, 1px 1px #FFF, -1px -1px 0 #FFF, 1px -1px 0 #FFF, -1px 1px 0 #FFF);
126 | }
127 |
128 | .elevation-summary>span:not(:last-child):after {
129 | content: var(--ele-sum-sep, '');
130 | }
131 |
132 | .multiline-summary>span {
133 | display: block;
134 | }
135 |
136 | .multiline-summary .download {
137 | float: right;
138 | margin-top: -3em;
139 | margin-right: 2em;
140 | font-weight: bold;
141 | font-size: 1.2em;
142 | }
143 |
144 | .elevation-summary .summaryvalue {
145 | font-weight: bold;
146 | }
147 |
148 | .elevation-toggle-icon {
149 | background-color: #fff;
150 | right: 5px;
151 | top: 5px;
152 | height: var(--ele-toggle-size, 36px);
153 | width: var(--ele-toggle-size, 36px);
154 | cursor: pointer;
155 | box-shadow: 0 1px 7px rgba(0, 0, 0, 0.4);
156 | border-radius: 5px;
157 | display: inline-block;
158 | position: var(--ele-toggle-pos, relative);
159 | }
160 |
161 | .elevation-toggle-icon:before {
162 | content: '\2716';
163 | display: var(--ele-close-btn, none);
164 | color: #000;
165 | width: 100%;
166 | line-height: 20px;
167 | text-align: center;
168 | font-weight: bold;
169 | font-size: 15px;
170 | }
171 |
172 | .leaflet-elevation-pane .height-focus,
173 | .leaflet-overlay-pane .height-focus {
174 | stroke: #000;
175 | fill: var(--ele-circle, var(--ele-area, #FFF));
176 | }
177 |
178 | .leaflet-elevation-pane .height-focus.line,
179 | .leaflet-overlay-pane .height-focus.line {
180 | stroke-width: 2;
181 | }
182 |
183 | .leaflet-elevation-pane .height-focus-label,
184 | .leaflet-overlay-pane .height-focus-label {
185 | font-size: 12px;
186 | font-weight: 600;
187 | fill: #000;
188 | paint-order: stroke;
189 | stroke: #FFF;
190 | stroke-width: 2px;
191 | }
192 |
193 | .elevation-waypoint-icon:before,
194 | .elevation-position-icon:before {
195 | content: "";
196 | width: 100%;
197 | height: 100%;
198 | display: inline-block;
199 | background: var(--ele-marker) no-repeat center center / contain;
200 | }
201 |
202 | .elevation-polyline {
203 | stroke: var(--ele-poly, var(--ele-area, #000));
204 | filter: drop-shadow(1px 1px 0 #FFF) drop-shadow(-1px -1px 0 #FFF) drop-shadow(1px -1px 0 #FFF) drop-shadow(-1px 1px 0 #FFF);
205 | }
206 |
207 | /* CHART STATES /////////////////////////////////////////////////// */
208 |
209 | .elevation-detached {
210 | font: 12px/1.5 "Helvetica Neue", Arial, Helvetica, sans-serif;
211 | height: auto;
212 | width: 100%;
213 | position: relative;
214 | z-index: 0;
215 | }
216 |
217 | .elevation-detached .area {
218 | fill-opacity: var(--ele-alpha, 0.8);
219 | }
220 |
221 | .elevation-detached.elevation-collapsed .elevation-summary {
222 | display: block;
223 | }
224 |
225 | .elevation-detached.elevation-collapsed .elevation-toggle-icon {
226 | top: 5px;
227 | right: 9px;
228 | bottom: 5px;
229 | margin: auto;
230 | }
231 |
232 | .elevation-control.elevation-collapsed > * {
233 | display: none;
234 | }
235 |
236 | .elevation-control.elevation-collapsed > .elevation-toggle-icon {
237 | display: inline-block;
238 | }
239 |
240 | .elevation-detached {
241 | --ele-sum-margin: 12px 35px;
242 | --ele-sum-shadow: none;
243 | --ele-toggle-pos: absolute;
244 | }
245 |
246 | .elevation-expanded {
247 | --ele-close-btn: inline-block;
248 | --ele-toggle-bg: none;
249 | --ele-toggle-pos: absolute;
250 | --ele-toggle-size: 20px;
251 | }
252 |
253 | .inline-summary {
254 | --ele-sum-sep: "\0020\2014\0020";
255 | }
256 |
257 | .elevation-waypoint-icon {
258 | --ele-marker: url(../images/elevation-pushpin.svg);
259 | }
260 |
261 | .elevation-position-icon {
262 | --ele-marker: url(../images/elevation-position.svg);
263 | }
264 |
265 | /* LIME THEME ///////////////////////////////////////////////////// */
266 | .lime-theme {
267 | --ele-bg: rgba(156, 194, 34, 0.2);
268 | --ele-axis: #566B13;
269 | --ele-area: #9CC222;
270 | --ele-grid: #CCC;
271 | --ele-brush: rgba(99, 126, 11, 0.4);
272 | --ele-poly: #566B13;
273 | --ele-line: #70ab00;
274 | }
275 |
276 | /* STEELBLUE THEME //////////////////////////////////////////////// */
277 | .steelblue-theme {
278 | --ele-axis: #0D1821;
279 | --ele-area: #4682B4;
280 | --ele-brush: rgba(23, 74, 117, 0.4);
281 | --ele-line: #174A75;
282 | }
283 |
284 | /* PURPLE THEME /////////////////////////////////////////////////// */
285 | .purple-theme {
286 | --ele-bg: rgba(115, 44, 123, 0.2);
287 | --ele-area: #732C7B;
288 | --ele-brush: rgba(74, 14, 80, 0.4);
289 | --ele-line: #732c7b;
290 | }
291 |
292 | /* YELLOW THEME /////////////////////////////////////////////////// */
293 | .yellow-theme {
294 | --ele-area: #FF0;
295 | }
296 |
297 | /* RED THEME ////////////////////////////////////////////////////// */
298 | .red-theme {
299 | --ele-area: #F00;
300 | }
301 |
302 | /* MAGENTA THEME ////////////////////////////////////////////////// */
303 | .magenta-theme {
304 | --ele-bg: rgba(255, 255, 255, 0.47);
305 | --ele-area: #FF005E;
306 | }
307 |
308 | /* LIGHTBLUE THEME //////////////////////////////////////////////// */
309 | .lightblue-theme {
310 | --ele-area: #3366CC;
311 | --ele-alpha: 0.45;
312 | --ele-stroke: #4682B4;
313 | --ele-circle: #fff;
314 | --ele-line: #000;
315 | }
316 |
317 | .elevation-detached.lightblue-theme .area {
318 | stroke: #3366CC;
319 | }
320 |
321 | /* leaflet-distance-markers */
322 | .dist-marker {
323 | font-size: 0.5rem;
324 | border: 1px solid #777;
325 | border-radius: 10px;
326 | text-align: center;
327 | color: #000;
328 | background: #fff;
329 | }
330 |
--------------------------------------------------------------------------------
/src/index.js:
--------------------------------------------------------------------------------
1 | /*
2 | * Copyright (c) 2019, GPL-3.0+ Project, Raruto
3 | *
4 | * This file is free software: you may copy, redistribute and/or modify it
5 | * under the terms of the GNU General Public License as published by the
6 | * Free Software Foundation, either version 2 of the License, or (at your
7 | * option) any later version.
8 | *
9 | * This file is distributed in the hope that it will be useful, but
10 | * WITHOUT ANY WARRANTY; without even the implied warranty of
11 | * MERCHANTABILITY or FITNESS FOR A PARTICULAR PURPOSE. See the GNU
12 | * General Public License for more details.
13 | *
14 | * You should have received a copy of the GNU General Public License
15 | * along with this program. If not, see .
16 | *
17 | * This file incorporates work covered by the following copyright and
18 | * permission notice:
19 | *
20 | * Copyright (c) 2013-2016, MIT License, Felix “MrMufflon” Bache
21 | *
22 | * Permission to use, copy, modify, and/or distribute this software
23 | * for any purpose with or without fee is hereby granted, provided
24 | * that the above copyright notice and this permission notice appear
25 | * in all copies.
26 | *
27 | * THE SOFTWARE IS PROVIDED "AS IS" AND THE AUTHOR DISCLAIMS ALL
28 | * WARRANTIES WITH REGARD TO THIS SOFTWARE INCLUDING ALL IMPLIED
29 | * WARRANTIES OF MERCHANTABILITY AND FITNESS. IN NO EVENT SHALL THE
30 | * AUTHOR BE LIABLE FOR ANY SPECIAL, DIRECT, INDIRECT, OR
31 | * CONSEQUENTIAL DAMAGES OR ANY DAMAGES WHATSOEVER RESULTING FROM LOSS
32 | * OF USE, DATA OR PROFITS, WHETHER IN AN ACTION OF CONTRACT,
33 | * NEGLIGENCE OR OTHER TORTIOUS ACTION, ARISING OUT OF OR IN
34 | * CONNECTION WITH THE USE OR PERFORMANCE OF THIS SOFTWARE.
35 | */
36 |
37 | import * as _ from './utils';
38 | import { Elevation } from './control';
39 |
40 | Elevation.Utils = _;
41 |
42 | L.control.elevation = (options) => new Elevation(options);
43 |
--------------------------------------------------------------------------------
/src/options.js:
--------------------------------------------------------------------------------
1 | import * as _ from './utils';
2 |
3 | export var Options = {
4 | autofitBounds: true,
5 | autohide: false,
6 | autohideMarker: true,
7 | almostover: true,
8 | altitude: true,
9 | closeBtn: true,
10 | collapsed: false,
11 | detached: true,
12 | distance: true,
13 | distanceMarkers: { lazy: true, distance: true, direction: true },
14 | dragging: !L.Browser.mobile,
15 | downloadLink: 'link',
16 | elevationDiv: "#elevation-div",
17 | edgeScale: { bar: true, icon: false, coords: false },
18 | followMarker: true,
19 | imperial: false,
20 | legend: true,
21 | handlers: ["Distance", "Time", "Altitude", "Slope", "Speed", "Acceleration"],
22 | hotline: 'elevation',
23 | marker: 'elevation-line',
24 | markerIcon: L.divIcon({
25 | className: 'elevation-position-marker',
26 | html: '',
27 | iconSize: [32, 32],
28 | iconAnchor: [16, 16],
29 | }),
30 | position: "topright",
31 | polyline: {
32 | className: 'elevation-polyline',
33 | color: '#000',
34 | opacity: 0.75,
35 | weight: 5,
36 | lineCap: 'round'
37 | },
38 | polylineSegments: {
39 | className: 'elevation-polyline-segments',
40 | color: '#F00',
41 | interactive: false,
42 | },
43 | preferCanvas: false,
44 | reverseCoords: false,
45 | ruler: true,
46 | theme: "lightblue-theme",
47 | summary: 'inline',
48 | slope: false,
49 | speed: false,
50 | time: true,
51 | timeFactor: 3600,
52 | timestamps: false,
53 | trkStart: { className: 'start-marker', radius: 6, weight: 2, color: '#fff', fillColor: '#00d800', fillOpacity: 1, interactive: false },
54 | trkEnd: { className: 'end-marker', radius: 6, weight: 2, color: '#fff', fillColor: '#ff0606', fillOpacity: 1, interactive: false },
55 | waypoints: true,
56 | wptIcons: {
57 | '': L.divIcon({
58 | className: 'elevation-waypoint-marker',
59 | html: '',
60 | iconSize: [30, 30],
61 | iconAnchor: [8, 30],
62 | }),
63 | },
64 | wptLabels: true,
65 | xAttr: "dist",
66 | xLabel: "km",
67 | yAttr: "z",
68 | yLabel: "m",
69 | zFollow: false,
70 | zooming: !L.Browser.Mobile,
71 |
72 | // Quite uncommon and undocumented options
73 | margins: { top: 30, right: 30, bottom: 30, left: 40 },
74 | height: (screen.height * 0.3) || 200,
75 | width: (screen.width * 0.6) || 600,
76 | xTicks: undefined,
77 | yTicks: undefined,
78 |
79 | decimalsX: 2,
80 | decimalsY: 0,
81 | forceAxisBounds: false,
82 | interpolation: "curveLinear",
83 | yAxisMax: undefined,
84 | yAxisMin: undefined,
85 |
86 | // Prevent CORS issues for relative locations (dynamic import)
87 | srcFolder: ((document.currentScript && document.currentScript.src) || (import.meta && import.meta.url)).split("/").slice(0,-1).join("/") + '/',
88 | };
89 |
--------------------------------------------------------------------------------
/src/utils.js:
--------------------------------------------------------------------------------
1 | /**
2 | * TODO: exget computed styles of theese values from actual "CSS vars"
3 | **/
4 | export const Colors = {
5 | 'lightblue': { area: '#3366CC', alpha: 0.45, stroke: '#3366CC' },
6 | 'magenta' : { area: '#FF005E' },
7 | 'yellow' : { area: '#FF0' },
8 | 'purple' : { area: '#732C7B' },
9 | 'steelblue': { area: '#4682B4' },
10 | 'red' : { area: '#F00' },
11 | 'lime' : { area: '#9CC222', line: '#566B13' }
12 | };
13 |
14 | const SEC = 1000;
15 | const MIN = SEC * 60;
16 | const HOUR = MIN * 60;
17 | const DAY = HOUR * 24;
18 |
19 | export function resolveURL(src, baseUrl) {
20 | return (new URL(src, (src.startsWith('../') || src.startsWith('./')) ? baseUrl : undefined)).toString()
21 | };
22 |
23 | /**
24 | * Convert a time (millis) to a human readable duration string (%Dd %H:%M'%S")
25 | */
26 | export function formatTime(t) {
27 | let d = Math.floor(t / DAY);
28 | let h = Math.floor( (t - d * DAY) / HOUR);
29 | let m = Math.floor( (t - d * DAY - h * HOUR) / MIN);
30 | let s = Math.round( (t - d * DAY - h * HOUR - m * MIN) / SEC);
31 | if ( s === 60 ) { m++; s = 0; }
32 | if ( m === 60 ) { h++; m = 0; }
33 | if ( h === 24 ) { d++; h = 0; }
34 | return (d ? d + "d " : '') + h.toString().padStart(2, 0) + ':' + m.toString().padStart(2, 0) + "'" + s.toString().padStart(2, 0) + '"';
35 | }
36 |
37 | /**
38 | * Convert a time (millis) to human readable date string (dd-mm-yyyy hh:mm:ss)
39 | */
40 | export function formatDate(format) {
41 | if (!format) {
42 | return (time) => (new Date(time)).toLocaleString().replaceAll('/', '-').replaceAll(',', ' ');
43 | } else if (format == 'time') {
44 | return (time) => (new Date(time)).toLocaleTimeString();
45 | } else if (format == 'date') {
46 | return (time) => (new Date(time)).toLocaleDateString();
47 | }
48 | return (time) => format(time);
49 | }
50 |
51 | /**
52 | * Generate download data event.
53 | */
54 | export function saveFile(dataURI, fileName) {
55 | let a = create('a', '', { href: dataURI, target: '_new', download: fileName || "", style: "display:none;" });
56 | let b = document.body;
57 | b.appendChild(a);
58 | a.click();
59 | b.removeChild(a);
60 | }
61 |
62 |
63 | /**
64 | * Convert SVG Path into Path2D and then update canvas
65 | */
66 | export function drawCanvas(ctx, path) {
67 | path.classed('canvas-path', true);
68 |
69 | ctx.beginPath();
70 | ctx.moveTo(0, 0);
71 | let p = new Path2D(path.attr('d'));
72 |
73 | ctx.strokeStyle = path.__strokeStyle || path.attr('stroke');
74 | ctx.fillStyle = path.__fillStyle || path.attr('fill');
75 | ctx.lineWidth = 1.25;
76 | ctx.globalCompositeOperation = 'source-over';
77 |
78 | // stroke opacity
79 | ctx.globalAlpha = path.attr('stroke-opacity') || 0.3;
80 | ctx.stroke(p);
81 |
82 | // fill opacity
83 | ctx.globalAlpha = path.attr('fill-opacity') || 0.45;
84 | ctx.fill(p);
85 |
86 | ctx.globalAlpha = 1;
87 |
88 | ctx.closePath();
89 | }
90 |
91 | /**
92 | * Loop and extract GPX Extensions handled by "@tmcw/toGeoJSON" (eg. "coordinateProperties" > "times")
93 | */
94 | export function coordPropsToMeta(coordProps, name, parser) {
95 | return coordProps && (({props, point, id, isMulti }) => {
96 | if (props) {
97 | for (const key of coordProps) {
98 | if (key in props) {
99 | point.meta[name] = (parser || parseNumeric).call(this, (isMulti ? props[key][isMulti] : props[key]), id);
100 | break;
101 | }
102 | }
103 | }
104 | });
105 | }
106 |
107 | /**
108 | * Extract numeric property (id) from GeoJSON object
109 | */
110 | export const parseNumeric = (property, id) => parseInt((typeof property === 'object' ? property[id] : property));
111 |
112 | /**
113 | * Extract datetime property (id) from GeoJSON object
114 | */
115 | export const parseDate = (property, id) => new Date(Date.parse((typeof property === 'object' ? property[id] : property)));
116 |
117 | /**
118 | * A little bit shorter than L.DomUtil
119 | */
120 | export const addClass = (n, str) => n && str.split(" ").every(s => s && L.DomUtil.addClass(n, s));
121 | export const removeClass = (n, str) => n && str.split(" ").every(s => s && L.DomUtil.removeClass(n, s));
122 | export const toggleClass = (n, str, cond) => (cond ? addClass : removeClass)(n, str);
123 | export const replaceClass = (n, rem, add) => (rem && removeClass(n, rem)) || (add && addClass(n, add));
124 | export const style = (n, k, v) => (typeof v === "undefined" && L.DomUtil.getStyle(n, k)) || n.style.setProperty(k, v);
125 | export const toggleStyle = (n, k, v, cond) => style(n, k, cond ? v : '');
126 | export const setAttributes = (n, attrs) => { for (let k in attrs) { n.setAttribute(k, attrs[k]); } };
127 | export const toggleEvent = (el, e, fn, cond) => el[cond ? 'on' : 'off'](e, fn);
128 | export const create = (tag, str, attrs, n) => { let elem = L.DomUtil.create(tag, str || ""); if (attrs) setAttributes(elem, attrs); if (n) append(n, elem); return elem; };
129 | export const append = (n, c) => n.appendChild(c);
130 | export const insert = (n, c, pos) => n.insertAdjacentElement(pos, c);
131 | export const select = (str, n) => (n || document).querySelector(str);
132 | export const each = (obj, fn) => { for (let i in obj) fn(obj[i], i); };
133 | export const randomId = () => Math.random().toString(36).substr(2, 9);
134 |
135 | /**
136 | * TODO: use generators instead? (ie. "yield")
137 | */
138 | export const iMax = (iVal, max = -Infinity) => (iVal > max ? iVal : max);
139 | export const iMin = (iVal, min = +Infinity) => (iVal < min ? iVal : min);
140 | export const iAvg = (iVal, avg = 0, idx = 1) => (iVal + avg * (idx - 1)) / idx;
141 | export const iSum = (iVal, sum = 0) => iVal + sum;
142 |
143 | /**
144 | * Alias for some leaflet core functions
145 | */
146 | export const { on, off } = L.DomEvent;
147 | export const { throttle, wrapNum } = L.Util;
148 | export const { hasClass } = L.DomUtil;
149 |
150 | /**
151 | * Limit floating point precision
152 | */
153 | export const round = L.Util.formatNum;
154 |
155 | /**
156 | * Limit a number between min / max values
157 | */
158 | export const clamp = (val, range) => range ? (val < range[0] ? range[0] : val > range[1] ? range[1] : val) : val;
159 |
160 | /**
161 | * Limit a delta difference between two values
162 | */
163 | export const wrapDelta = (curr, prev, deltaMax) => Math.abs(curr - prev) > deltaMax ? prev + deltaMax * Math.sign(curr - prev) : curr;
164 |
165 | /**
166 | * A deep copy implementation that takes care of correct prototype chain and cycles, references
167 | *
168 | * @see https://web.dev/structured-clone/#features-and-limitations
169 | */
170 | export function cloneDeep(o, skipProps = [], cache = []) {
171 | switch(!o || typeof o) {
172 | case 'object':
173 | const hit = cache.filter(c => o === c.original)[0];
174 | if (hit) return hit.copy; // handle circular structures
175 | const copy = Array.isArray(o) ? [] : Object.create(Object.getPrototypeOf(o));
176 | cache.push({ original: o, copy });
177 | Object
178 | .getOwnPropertyNames(o)
179 | .forEach(function (prop) {
180 | const propdesc = Object.getOwnPropertyDescriptor(o, prop);
181 | Object.defineProperty(
182 | copy,
183 | prop,
184 | propdesc.get || propdesc.set
185 | ? propdesc // just copy accessor properties
186 | : { // deep copy data properties
187 | writable: propdesc.writable,
188 | configurable: propdesc.configurable,
189 | enumerable: propdesc.enumerable,
190 | value: skipProps.includes(prop) ? propdesc.value : cloneDeep(propdesc.value, skipProps, cache),
191 | }
192 | );
193 | });
194 | return copy;
195 | case 'function':
196 | case 'symbol':
197 | console.warn('cloneDeep: ' + typeof o + 's not fully supported:', o);
198 | case true:
199 | // null, undefined or falsy primitive
200 | default:
201 | return o;
202 | }
203 | }
--------------------------------------------------------------------------------
/src/utils.spec.js:
--------------------------------------------------------------------------------
1 | /**
2 | * src/utils.js
3 | */
4 |
5 | import { suite } from 'uvu';
6 | import * as assert from 'uvu/assert';
7 | import '../test/setup/jsdom.js'
8 | import { iAvg, iMin, iMax, iSum } from "../src/utils.js";
9 |
10 | const toFixed = (n) => +n.toFixed(2);
11 |
12 | const test = suite('src/utils.js');
13 |
14 | test('iAvg()', () => {
15 | let avg;
16 | avg = iAvg(100, undefined, 1); assert.is(toFixed(avg), 100); // average for [100] is 100
17 | avg = iAvg(100, avg, 2); assert.is(toFixed(avg), 100); // average for [100, 100] is 100
18 | avg = iAvg(200, avg, 3); assert.is(toFixed(avg), 133.33); // average for [100, 100, 200] is 133.33
19 | avg = iAvg(200, avg, 4); assert.is(toFixed(avg), 150); // average for [100, 100, 200, 200] is 150
20 | avg = iAvg(NaN, avg, 5); assert.ok(isNaN(avg)); // average for [100, 100, 200, 200, NaN] is NaN
21 | });
22 |
23 | test('iMin()', () => {
24 | let min;
25 | min = iMin(100, undefined); assert.is(toFixed(min), 100); // min for [100] is 100
26 | min = iMin(NaN, min); assert.is(toFixed(min), 100); // min for [100, NaN] is 100
27 | min = iMin(0, min); assert.is(toFixed(min), 0); // min for [100, NaN, 0] is 100
28 | min = iMin(-200, min); assert.is(toFixed(min), -200); // min for [100, NaN, 0, -200] is -200
29 | min = iMin(200, min); assert.is(toFixed(min), -200); // min for [100, NaN, -100, -200, 200] is -200
30 | });
31 |
32 | test('iMax()', () => {
33 | let max;
34 | max = iMax(100, undefined); assert.is(toFixed(max), 100); // max for [100] is 100
35 | max = iMax(NaN, max); assert.is(toFixed(max), 100); // max for [100, NaN] is 100
36 | max = iMax(0, max); assert.is(toFixed(max), 100); // max for [100, NaN, 0] is 100
37 | max = iMax(-200, max); assert.is(toFixed(max), 100); // max for [100, NaN, 0, -200] is 100
38 | max = iMax(200, max); assert.is(toFixed(max), 200); // max for [100, NaN, -100, -200, 200] is 200
39 | });
40 |
41 | test('iSum()', () => {
42 | let sum;
43 | sum = iSum(10.25, undefined); assert.is(toFixed(sum), 10.25); // sum for [10.25] is 10.25
44 | sum = iSum(0, sum); assert.is(toFixed(sum), 10.25); // sum for [10.25, 0] is 10.25
45 | sum = iSum(-0.25, sum); assert.is(toFixed(sum), 10); // sum for [10.25, 0, -0.25] is 10
46 | sum = iSum(-10, sum); assert.is(toFixed(sum), 0); // sum for [10.25, 0, -0.25, -10] is 0
47 | sum = iSum(NaN, sum); assert.ok(isNaN(sum)); // sum for [10.25, 0, -0.25, -10, NaN] is NaN
48 | });
49 |
50 | test.run();
--------------------------------------------------------------------------------
/test/index.html:
--------------------------------------------------------------------------------
1 |
2 |
3 |
4 |
5 | leaflet-elevation.js
6 |
7 |
8 |
9 |
10 |
11 |
12 |
13 |
14 |
15 |
24 |
25 |
26 |
27 |
28 |
29 |
30 |
31 |
32 |
33 |
34 |
35 |
36 |
37 |
38 |
39 |
101 |
102 |
103 |
104 |
284 |
285 |
319 |
320 |  321 |
322 |
323 |
324 |
325 |
--------------------------------------------------------------------------------
/test/setup/http_server.js:
--------------------------------------------------------------------------------
1 | import { suite as uvu_suite } from 'uvu';
2 | import { exec } from 'child_process';
3 | import { chromium } from 'playwright';
4 |
5 | process.on('exit', async () => {
6 | await globalThis.server.kill('SIGTERM');
7 | })
8 |
9 | /**
10 | * Start HTTP server
11 | */
12 | export async function setup(ctx) {
13 | if (!globalThis.server) {
14 | await new Promise((resolve) => {
15 | globalThis.server = exec('http-server');
16 | globalThis.server.stdout.on('data', (msg) => {
17 | // console.log(msg);
18 | // if (msg.toString().match(/Starting up/)) {
19 | if (msg.toString().indexOf('Hit CTRL-C to stop the server')) {
20 | resolve();
21 | // setTimeout(resolve, 1500);
22 | }
23 | });
24 | });
25 | }
26 | ctx.localhost = 'http://localhost:8080';
27 | ctx.browser = await chromium.launch();
28 | ctx.context = await ctx.browser.newContext();
29 | ctx.context.route(/.html$/, await mock_cdn_urls);
30 | ctx.page = await ctx.context.newPage();
31 | }
32 |
33 | /**
34 | * Stop HTTP server
35 | */
36 | export async function reset(ctx) {
37 | await ctx.context.close();
38 | await ctx.browser.close();
39 | }
40 |
41 | /**
42 | * Sample wrapper for uvu `suite`
43 | *
44 | * @example start a new test session at: http://localhost:8080/examples/leaflet-elevation.html
45 | *
46 | * ```js
47 | * const test = suite('examples/leaflet-elevation.html');
48 | *
49 | * test('eledata_loaded', async ({ page }) => {
50 | * const gpx = await page.evaluate(() => new Promise(resolve => {
51 | * controlElevation.on('eledata_loaded', (gpx) => resolve(gpx));
52 | * }));
53 | * assert.is(gpx.name, 'via-emilia.gpx');
54 | * });
55 | * ```
56 | *
57 | * @see https://github.com/lukeed/uvu
58 | */
59 | export function suite() {
60 | const test = uvu_suite(...arguments);
61 | test.before(setup);
62 | test.after(reset);
63 | test.before.each(async ({ localhost, page }) => {
64 | page.on('console', msg => console.log(msg.text()));
65 | page.on('requestfailed', request => { console.log(request.failure().errorText, request.url()); });
66 | page.on('pageerror', exception => { console.log(exception); });
67 | await page.goto((new URL(arguments[0], localhost)).toString());
68 | await page.waitForLoadState('domcontentloaded');
69 | });
70 | // augment uvu `test` function with a third parameter `timeout`
71 | return new Proxy(test, {
72 | apply: (object, _, argsList) => {
73 | return object(argsList[0], timeout(argsList[1], argsList[2]));
74 | }
75 | });
76 | }
77 |
78 | /**
79 | * Sets maximum execution time for a function
80 | *
81 | * @see https://github.com/lukeed/uvu/issues/33#issuecomment-879870292
82 | */
83 | function timeout(handler, ms = 10000) {
84 | return (ctx) => {
85 | let timer
86 | return Promise.race([
87 | handler(ctx),
88 | new Promise((_, reject) => { timer = setTimeout(() => reject(new Error('[TIMEOUT] Maximum execution time exceeded: ' + ms + 'ms')), ms) })
89 | ]).finally(() => { clearTimeout(timer) })
90 | }
91 | }
92 |
93 | /**
94 | * Replace CDN URLs with locally developed files within Network response.
95 | *
96 | * @requires playwright
97 | */
98 | async function mock_cdn_urls(route) {
99 | const response = await route.fetch();
100 | let body = await response.text();
101 | body = body.replace(new RegExp('https://unpkg.com/@raruto/leaflet-elevation@(.*?)/', 'g'), '../');
102 | body = body.replace(new RegExp('@raruto/leaflet-elevation@(.*?)/', 'g'), '../');
103 | route.fulfill({ response, body, headers: response.headers() });
104 | }
--------------------------------------------------------------------------------
/test/setup/jsdom.js:
--------------------------------------------------------------------------------
1 | import { JSDOM } from 'jsdom';
2 |
3 | const { window } = new JSDOM('');
4 |
5 | global.window = window;
6 | global.document = window.document;
7 | global.navigator = window.navigator;
8 | global.getComputedStyle = window.getComputedStyle;
9 | global.requestAnimationFrame = null;
10 |
11 | global.L = {
12 | DomEvent: {
13 | on: () => {},
14 | off: () => {}
15 | },
16 | Util: {
17 | throttle: () => {},
18 | wrapNum: () => {},
19 | formatNum: () => {}
20 | },
21 | DomUtil: {
22 | hasClass: () => {}
23 | }
24 | };
--------------------------------------------------------------------------------
321 |
322 |
323 |
324 |
325 |
--------------------------------------------------------------------------------
/test/setup/http_server.js:
--------------------------------------------------------------------------------
1 | import { suite as uvu_suite } from 'uvu';
2 | import { exec } from 'child_process';
3 | import { chromium } from 'playwright';
4 |
5 | process.on('exit', async () => {
6 | await globalThis.server.kill('SIGTERM');
7 | })
8 |
9 | /**
10 | * Start HTTP server
11 | */
12 | export async function setup(ctx) {
13 | if (!globalThis.server) {
14 | await new Promise((resolve) => {
15 | globalThis.server = exec('http-server');
16 | globalThis.server.stdout.on('data', (msg) => {
17 | // console.log(msg);
18 | // if (msg.toString().match(/Starting up/)) {
19 | if (msg.toString().indexOf('Hit CTRL-C to stop the server')) {
20 | resolve();
21 | // setTimeout(resolve, 1500);
22 | }
23 | });
24 | });
25 | }
26 | ctx.localhost = 'http://localhost:8080';
27 | ctx.browser = await chromium.launch();
28 | ctx.context = await ctx.browser.newContext();
29 | ctx.context.route(/.html$/, await mock_cdn_urls);
30 | ctx.page = await ctx.context.newPage();
31 | }
32 |
33 | /**
34 | * Stop HTTP server
35 | */
36 | export async function reset(ctx) {
37 | await ctx.context.close();
38 | await ctx.browser.close();
39 | }
40 |
41 | /**
42 | * Sample wrapper for uvu `suite`
43 | *
44 | * @example start a new test session at: http://localhost:8080/examples/leaflet-elevation.html
45 | *
46 | * ```js
47 | * const test = suite('examples/leaflet-elevation.html');
48 | *
49 | * test('eledata_loaded', async ({ page }) => {
50 | * const gpx = await page.evaluate(() => new Promise(resolve => {
51 | * controlElevation.on('eledata_loaded', (gpx) => resolve(gpx));
52 | * }));
53 | * assert.is(gpx.name, 'via-emilia.gpx');
54 | * });
55 | * ```
56 | *
57 | * @see https://github.com/lukeed/uvu
58 | */
59 | export function suite() {
60 | const test = uvu_suite(...arguments);
61 | test.before(setup);
62 | test.after(reset);
63 | test.before.each(async ({ localhost, page }) => {
64 | page.on('console', msg => console.log(msg.text()));
65 | page.on('requestfailed', request => { console.log(request.failure().errorText, request.url()); });
66 | page.on('pageerror', exception => { console.log(exception); });
67 | await page.goto((new URL(arguments[0], localhost)).toString());
68 | await page.waitForLoadState('domcontentloaded');
69 | });
70 | // augment uvu `test` function with a third parameter `timeout`
71 | return new Proxy(test, {
72 | apply: (object, _, argsList) => {
73 | return object(argsList[0], timeout(argsList[1], argsList[2]));
74 | }
75 | });
76 | }
77 |
78 | /**
79 | * Sets maximum execution time for a function
80 | *
81 | * @see https://github.com/lukeed/uvu/issues/33#issuecomment-879870292
82 | */
83 | function timeout(handler, ms = 10000) {
84 | return (ctx) => {
85 | let timer
86 | return Promise.race([
87 | handler(ctx),
88 | new Promise((_, reject) => { timer = setTimeout(() => reject(new Error('[TIMEOUT] Maximum execution time exceeded: ' + ms + 'ms')), ms) })
89 | ]).finally(() => { clearTimeout(timer) })
90 | }
91 | }
92 |
93 | /**
94 | * Replace CDN URLs with locally developed files within Network response.
95 | *
96 | * @requires playwright
97 | */
98 | async function mock_cdn_urls(route) {
99 | const response = await route.fetch();
100 | let body = await response.text();
101 | body = body.replace(new RegExp('https://unpkg.com/@raruto/leaflet-elevation@(.*?)/', 'g'), '../');
102 | body = body.replace(new RegExp('@raruto/leaflet-elevation@(.*?)/', 'g'), '../');
103 | route.fulfill({ response, body, headers: response.headers() });
104 | }
--------------------------------------------------------------------------------
/test/setup/jsdom.js:
--------------------------------------------------------------------------------
1 | import { JSDOM } from 'jsdom';
2 |
3 | const { window } = new JSDOM('');
4 |
5 | global.window = window;
6 | global.document = window.document;
7 | global.navigator = window.navigator;
8 | global.getComputedStyle = window.getComputedStyle;
9 | global.requestAnimationFrame = null;
10 |
11 | global.L = {
12 | DomEvent: {
13 | on: () => {},
14 | off: () => {}
15 | },
16 | Util: {
17 | throttle: () => {},
18 | wrapNum: () => {},
19 | formatNum: () => {}
20 | },
21 | DomUtil: {
22 | hasClass: () => {}
23 | }
24 | };
--------------------------------------------------------------------------------