├── plot.gplt
└── README.md
/plot.gplt:
--------------------------------------------------------------------------------
1 | set term png truecolor size 800,600
2 | set output "data.png"
3 | set xlabel "Domains"
4 | set ylabel "Queries"
5 | set title "DNS DH Usage"
6 | set grid
7 | set xtics rotate by -45 axis out offset 0,1.5
8 | set boxwidth 1 relative
9 | set style fill transparent solid 0.5 border rgb"black"
10 | plot "dns-data" u 1:xtic(2) w boxes lc rgb"blue"
11 |
--------------------------------------------------------------------------------
/README.md:
--------------------------------------------------------------------------------
1 | # Bind log Graphs
2 | ## with GNUplot
3 |
4 | 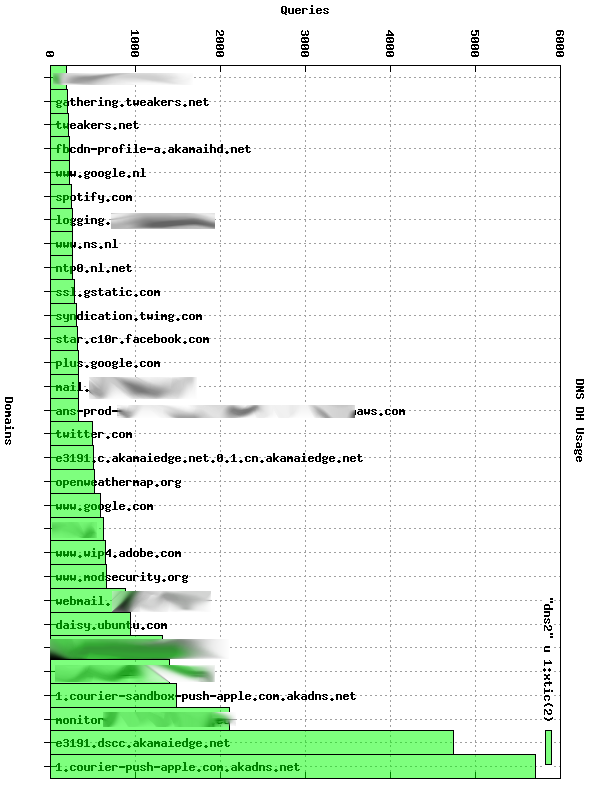 5 |
6 | This is a very simple script which uses GNUplot to create graphs of Bind Query logs.
7 |
8 | ## Bind logging
9 | Enable query logging in Bind:
10 |
11 | # /etc/bind/named.conf.options
12 | logging{
13 | channel system_log {
14 | file "/var/log/named/sys.log" versions unlimited size 2g;
15 | severity warning;
16 | print-time yes;
17 | print-severity yes;
18 | print-category yes;
19 | };
20 | channel queries_log {
21 | file "/var/log/named/queries.log" versions unlimited size 2g;
22 | severity info;
23 | print-time no;
24 | };
25 | category default{
26 | system_log;
27 | };
28 | category queries{
29 | queries_log;
30 | };
31 | };
32 |
33 | Remember to create the `/var/log/named/` folder (where in Ubuntu 12.04 Apparmor allows the bind user to write by default):
34 |
35 | mkdir /var/log/named
36 | chown bind:bind /var/log/named
37 |
38 | ## Bind log parsing
39 |
40 | Use the following command line to get the 20 most queries domains
41 |
42 | awk '{ print $4 }' /var/log/named/queries.log | sort | uniq -c | sort -n | tail -n 20 > dns-data
43 |
44 | Example data:
45 |
46 | 83094 metrics-api.librato.com
47 | 83689 collector-2.newrelic.com
48 | 84165 puppetmaster.int
49 | 82445 ntp0.nl.net
50 |
51 | The use the gnuplot script to create the graph:
52 |
53 | gnuplot < plot.gplt
54 |
55 | And there you go.
56 |
57 | Because GNUplot has no easy support for horizotal bar graphs, if you want it horizontal, rotate it with Imagemagick:
58 |
59 | convert data.png -rotate 90 data-90.png
60 |
61 | And thats it, you now have a nice image overview of DNS queries.
62 |
63 | ## Links
64 |
65 | - [Raymii.org](https://raymii.org/s/software/Bind-GNUPlot-DNS-Bar-Graph.html)
66 | - [Github](https://github.com/RaymiiOrg/bind-gnuplot-reports)
67 |
68 | ## License
69 |
70 | Copyright (C) Remy van Elst 2013
71 |
72 | This program is free software: you can redistribute it and/or modify
73 | it under the terms of the GNU General Public License as published by
74 | the Free Software Foundation, either version 3 of the License, or
75 | (at your option) any later version.
76 |
77 | This program is distributed in the hope that it will be useful,
78 | but WITHOUT ANY WARRANTY; without even the implied warranty of
79 | MERCHANTABILITY or FITNESS FOR A PARTICULAR PURPOSE. See the
80 | GNU General Public License for more details.
81 |
82 | You should have received a copy of the GNU General Public License
83 | along with this program. If not, see .
84 |
--------------------------------------------------------------------------------
5 |
6 | This is a very simple script which uses GNUplot to create graphs of Bind Query logs.
7 |
8 | ## Bind logging
9 | Enable query logging in Bind:
10 |
11 | # /etc/bind/named.conf.options
12 | logging{
13 | channel system_log {
14 | file "/var/log/named/sys.log" versions unlimited size 2g;
15 | severity warning;
16 | print-time yes;
17 | print-severity yes;
18 | print-category yes;
19 | };
20 | channel queries_log {
21 | file "/var/log/named/queries.log" versions unlimited size 2g;
22 | severity info;
23 | print-time no;
24 | };
25 | category default{
26 | system_log;
27 | };
28 | category queries{
29 | queries_log;
30 | };
31 | };
32 |
33 | Remember to create the `/var/log/named/` folder (where in Ubuntu 12.04 Apparmor allows the bind user to write by default):
34 |
35 | mkdir /var/log/named
36 | chown bind:bind /var/log/named
37 |
38 | ## Bind log parsing
39 |
40 | Use the following command line to get the 20 most queries domains
41 |
42 | awk '{ print $4 }' /var/log/named/queries.log | sort | uniq -c | sort -n | tail -n 20 > dns-data
43 |
44 | Example data:
45 |
46 | 83094 metrics-api.librato.com
47 | 83689 collector-2.newrelic.com
48 | 84165 puppetmaster.int
49 | 82445 ntp0.nl.net
50 |
51 | The use the gnuplot script to create the graph:
52 |
53 | gnuplot < plot.gplt
54 |
55 | And there you go.
56 |
57 | Because GNUplot has no easy support for horizotal bar graphs, if you want it horizontal, rotate it with Imagemagick:
58 |
59 | convert data.png -rotate 90 data-90.png
60 |
61 | And thats it, you now have a nice image overview of DNS queries.
62 |
63 | ## Links
64 |
65 | - [Raymii.org](https://raymii.org/s/software/Bind-GNUPlot-DNS-Bar-Graph.html)
66 | - [Github](https://github.com/RaymiiOrg/bind-gnuplot-reports)
67 |
68 | ## License
69 |
70 | Copyright (C) Remy van Elst 2013
71 |
72 | This program is free software: you can redistribute it and/or modify
73 | it under the terms of the GNU General Public License as published by
74 | the Free Software Foundation, either version 3 of the License, or
75 | (at your option) any later version.
76 |
77 | This program is distributed in the hope that it will be useful,
78 | but WITHOUT ANY WARRANTY; without even the implied warranty of
79 | MERCHANTABILITY or FITNESS FOR A PARTICULAR PURPOSE. See the
80 | GNU General Public License for more details.
81 |
82 | You should have received a copy of the GNU General Public License
83 | along with this program. If not, see .
84 |
--------------------------------------------------------------------------------