`
72 | - 其中常用的`type`包括 docs(文档、日志修改)、feat(新功能)、fix(问题修复)、refactor(代码重构)等,请根据实际情况选择。
73 | - 请用简短精确的英文描述编写 description
74 |
75 | ### Step4:合并修改
76 |
77 | - 一个常见的问题是远程的 upstream (@visactor/py-vchart) 有了新的更新, 从而会导致我们提交的 Pull Request 时会导致冲突。 因此我们可以在提交前先把远程其他开发者的 commit 和我们的 commit 合并。使用以下代码切换到 develop 分支:
78 |
79 | ```
80 | git checkout develop
81 | ```
82 |
83 | - 使用以下代码拉出远程的最新代码:
84 |
85 | ```
86 | git pull upstream develop
87 | ```
88 |
89 | - 切换回自己的开发分支:
90 |
91 | ```
92 | git checkout docs/add-funnel-demo
93 | ```
94 |
95 | - 把 develop 的 commit 合并到自己分支:
96 |
97 | ```
98 | git rebase develop
99 | ```
100 |
101 | - 把更新代码提交到自己的分支中:
102 |
103 | ```
104 | git push origin docs/add-funnel-demo
105 | ```
106 |
107 | ### Step5:提交 Pull Request
108 |
109 | 你可以在你的 github 代码仓库页面点击 `Compare & pull request` 按钮。
110 |
111 | 
112 |
113 | 或通过 `contribute` 按钮创建:
114 |
115 |
116 |
117 |
123 |
124 |
129 |
130 |
135 |
136 |
2 |
4 | pyvchart
5 |
6 | Python ❤️ VChart = pyvchart
7 |
8 |
9 |
10 |
12 |
13 |
15 |
16 |
17 |
18 |
20 |
21 |
23 |
24 |
25 | [中文 README](README.md) | [English README](README.en.md) | [日本語(にほんご)README](README.jp.md)
26 |
27 | ## 📣 Introduction
28 |
29 | [VisActor/VChart](https://github.com/VisActor/VChart) is a core chart component library of the open-source visualization solution VisActor by ByteDance. It is based on the visualization grammar library VGrammar and the rendering engine VRender, providing not only data presentation but also support for animation orchestration for narrative scenarios, rich interaction capabilities, and customizable chart styles. The simple and easy-to-use configuration greatly reduces the learning cost for users. Python, with its expressive syntax, is well-suited for data processing and AI scenarios. When data analysis and modeling meet data visualization, [pyecharts](https://github.com/pyecharts/pyecharts) and [py-vchart](https://github.com/VisActor/py-vchart) were born.
30 |
31 | ## ✨ Features
32 |
33 | * API design similar to [pyecharts](https://github.com/pyecharts/pyecharts), smooth and fluent usage, supports method chaining
34 | * Includes all charts from VChart, everything you need
35 | * Supports mainstream Notebook environments, Jupyter Notebook, JupyterLab (**Coming soon...**)
36 | * Can be easily integrated into mainstream Web frameworks such as Flask, Sanic, Django (**Coming soon...**)
37 | * Highly flexible configuration options, allowing for the creation of beautiful charts with ease
38 | * Detailed documentation and examples to help developers get started quickly
39 |
40 | ## 🔰 Installation
41 |
42 | **pip installation**
43 | ```shell
44 | # Install
45 | $ pip install py-vchart -U
46 | ```
47 |
48 |
49 | **Source code installation**
50 | ```shell
51 | # Install
52 | $ git clone https://github.com/VisActor/py-vchart.git
53 | $ cd py-vchart
54 | $ pip install -r requirements.txt
55 | $ python setup.py install
56 | ```
57 |
58 |
59 | ## 📝 Usage
60 |
61 | Usage examples are here:[Examples](https://github.com/pyvchart/chart-examples)
62 |
63 | ## ⛏ Code Quality
64 |
65 | ### Unit Testing
66 |
67 | ```shell
68 | $ pip install -r test/requirements.txt
69 | $ make
70 | ```
71 |
72 |
73 | ### Integration Testing
74 |
75 | Using GitHub Actions for continuous integration.
76 |
77 | ### Code Style
78 |
79 | Using [flake8](http://flake8.pycqa.org/en/latest/index.html), [Codecov](https://codecov.io/), and [pylint](https://www.pylint.org/) to improve code quality.
80 |
81 | ## 😉 Author
82 |
83 | pyvchart is mainly developed and maintained by the following developers
84 |
85 | * [@sunhailin-Leo](https://github.com/sunhailin-Leo)
86 | * [@FunctionRun](https://github.com/FunctionRun)
87 |
88 | More contributor information can be found at [pyvchart/graphs/contributors](https://github.com/pyvchart/pyvchart/graphs/contributors)
89 |
90 | ## 💡 Contribution [](https://github.com/VisActor/py-vchart/blob/main/CONTRIBUTING.md#your-first-pull-request)
91 |
92 | If you wish to contribute, please read the [Code of Conduct](./CODE_OF_CONDUCT.md) and [Contribution Guidelines](./CONTRIBUTING.md).
93 |
94 | A small stream can become a vast ocean!
95 |
96 | We look forward to more developers joining the development of pyvchart. We will ensure that PRs are reviewed promptly and replies are timely. However, when submitting a PR, please ensure:
97 |
98 | 1. All unit tests pass. If it's a new feature, please add corresponding unit tests.
99 | 2. Follow the development guidelines and format the code using black and isort (`$ pip install -r requirements-dev.txt`).
100 | 3. Update relevant documentation if necessary.
101 |
102 | We also warmly welcome developers to provide more examples and help improve the documentation. ~~The documentation project is located at [pyvchart/website](https://github.com/pyvchart/website)~~ (Documentation is in preparation...)
103 |
104 |
2 |
4 | pyvchart
5 |
6 | Python ❤️ VChart = pyvchart
7 |
8 |
9 |
10 |
12 |
13 |
15 |
16 |
17 |
18 |
20 |
21 |
23 |
24 |
25 | [日本語 README](README.md) | [英語 README](README.en.md) | [日本語(にほんご)README](README.jp.md)
26 |
27 | ## 📣 はじめに
28 |
29 | [VisActor/VChart](https://github.com/VisActor/VChart) は、字節ジャンプトがオープンソース化したビジュアル化ソリューション VisActor のコアチャートコンポーネントライブラリです。これはビジュアル化文法ライブラリ VGrammar とレンダリングエンジン VRender を基に構築されており、データの表示だけでなく、ナレーシナリオ向けのアニメーション編成、豊富なインタラクティブ機能、カスタマイズ可能なチャートスタイルもサポートしています。シンプルで使いやすい設定により、ユーザーの学習コストが大幅に削減されます。一方、Python は表現力豊かな言語であり、データ処理やAIなどの分野で非常に適しています。データ分析やモデリングがデータビジュアライゼーションと組み合わさったときに、[pyecharts](https://github.com/pyecharts/pyecharts) と [py-vchart](https://github.com/VisActor/py-vchart) が生まれました。
30 |
31 | ## ✨ 特徴
32 |
33 | * [pyecharts](https://github.com/pyecharts/pyecharts) に似た API 設計、スムーズでフローリングした使用感、メソッドチェーンのサポート
34 | * VChart のすべてのチャートを含む、必要なものが揃っている
35 | * Jupyter Notebook、JupyterLab (**近日公開予定**) などの主流の Notebook 環境をサポート
36 | * Flask、Sanic、Django (**近日公開予定**) などの主流の Web フレームワークへの容易な統合
37 | * 高度に柔軟な設定オプション、美しいチャートを簡単に作成できる
38 | * 開発者を手助けするための詳細なドキュメントと例
39 |
40 | ## 🔰 インストール
41 |
42 | **pip インストール**
43 | ```shell
44 | # インストール
45 | $ pip install py-vchart -U
46 | ```
47 |
48 |
49 | **ソースコードインストール**
50 | ```shell
51 | # バージョン
52 | $ git clone https://github.com/VisActor/py-vchart.git
53 | $ cd py-vchart
54 | $ pip install -r requirements.txt
55 | $ python setup.py install
56 | ```
57 |
58 |
59 | ## 📝 使用方法
60 |
61 | 使用例はここにあります:[Examples](https://github.com/pyvchart/chart-examples)
62 |
63 | ## ⛏ コード品質
64 |
65 | ### ユニットテスト
66 |
67 | ```shell
68 | $ pip install -r test/requirements.txt
69 | $ make
70 | ```
71 |
72 |
73 | ### 統合テスト
74 |
75 | GitHub Actions を使用して継続的インテグレーション環境を構築しています。
76 |
77 | ### コードスタイル
78 |
79 | [flake8](http://flake8.pycqa.org/en/latest/index.html), [Codecov](https://codecov.io/), [pylint](https://www.pylint.org/) を使用してコード品質を向上させています。
80 |
81 | ## 😉 作者
82 |
83 | pyvchart は以下の開発者が開発およびメンテナンスを行っています
84 |
85 | * [@sunhailin-Leo](https://github.com/sunhailin-Leo)
86 | * [@FunctionRun](https://github.com/FunctionRun)
87 |
88 | 他の貢献者の情報は [pyvchart/graphs/contributors](https://github.com/pyvchart/pyvchart/graphs/contributors) で確認できます
89 |
90 | ## 💡 コントリビューション [](https://github.com/VisActor/py-vchart/blob/main/CONTRIBUTING.md#your-first-pull-request)
91 |
92 | コントリビュートを希望する場合は、[行動規範](./CODE_OF_CONDUCT.md) と [コントリビューションガイドライン](./CONTRIBUTING.ja-JP.md) をお読みください。
93 |
94 | 細流は大海となる!
95 |
96 | より多くの開発者が pyvchart の開発に参加することを楽しみにしています。PR は迅速にレビューされ、タイムリーな返信が行われます。ただし、PR を提出する際には以下の点にご注意ください:
97 |
98 | 1. 全てのユニットテストがパスすること。新機能の場合、対応するユニットテストを追加してください。
99 | 2. 開発ガイドラインに従い、black および isort を使用してコードをフォーマットしてください(`$ pip install -r requirements-dev.txt`)。
100 | 3. 必要であれば、関連ドキュメントを更新してください。
101 |
102 | また、開発者の方々には、より多くのサンプルを提供し、ドキュメントの改善に協力していただくことを歓迎します。~~ドキュメントプロジェクトは [pyvchart/website](https://github.com/pyvchart/website) にあります~~ (ドキュメントは準備中...)
103 |
104 |
2 |
4 | pyvchart
5 |
6 | Python ❤️ VChart = pyvchart
7 |
8 |
9 |
10 |
12 |
13 |
15 |
16 |
17 |
18 |
20 |
21 |
23 |
24 |
25 | [中文 README](README.md) | [English README](README.en.md) | [日本語(にほんご)README](README.jp.md)
26 |
27 | ## 📣 简介
28 |
29 | [VisActor/VChart](https://github.com/VisActor/VChart) 是一个由字节跳动开源可视化解决方案 VisActor 的核心图表组件库。它基于它基于可视化语法库 VGrammar 和渲染引擎 VRender 进行封装,在满足数据呈现的同时,还支持面向叙事场景的动画编排、丰富的交互能力和定制化的图表风格,简单易用的配置大大降低了用户的学习成本。而 Python 是一门富有表达力的语言,非常适合用于数据处理、AI 等场景。当数据分析,建模遇上数据可视化时,[pyecharts](https://github.com/pyecharts/pyecharts) 和 [py-vchart](https://github.com/VisActor/py-vchart) 诞生了。
30 |
31 | ## ✨ 特性
32 |
33 | * [pyecharts](https://github.com/pyecharts/pyecharts) like 的 API 设计,使用如丝滑般流畅,支持链式调用
34 | * 囊括了 VChart 的所有图表,应有尽有
35 | * 支持主流 Notebook 环境,Jupyter Notebook、JupyterLab (**Coming soon...**)
36 | * 可轻松集成至 Flask,Sanic,Django 等主流 Web 框架 (**Coming soon...**)
37 | * 高度灵活的配置项,可轻松搭配出精美的图表
38 | * 详细的文档和示例,帮助开发者更快的上手项目
39 |
40 | ## 🔰 安装
41 |
42 | **pip 安装**
43 | ```shell
44 | # 安装
45 | $ pip install py-vchart -U
46 |
47 | ```
48 |
49 | **源码安装**
50 | ```shell
51 | # 源码安装
52 | $ git clone https://github.com/VisActor/py-vchart.git
53 | $ cd py-vchart
54 | $ pip install -r requirements.txt
55 | $ python setup.py install
56 | ```
57 |
58 | ## 📝 使用
59 |
60 | 使用案例在此处:[Examples](https://github.com/pyvchart/chart-examples)
61 |
62 | ## ⛏ 代码质量
63 |
64 | ### 单元测试
65 |
66 | ```shell
67 | $ pip install -r test/requirements.txt
68 | $ make
69 | ```
70 |
71 | ### 集成测试
72 |
73 | 使用 Github Actions 持续集成环境。
74 |
75 | ### 代码规范
76 |
77 | 使用 [flake8](http://flake8.pycqa.org/en/latest/index.html), [Codecov](https://codecov.io/) 以及 [pylint](https://www.pylint.org/) 提升代码质量。
78 |
79 | ## 😉 Author
80 |
81 | pyvchart 主要由以下几位开发者开发维护
82 |
83 | * [@sunhailin-Leo](https://github.com/sunhailin-Leo)
84 | * [@FunctionRun](https://github.com/FunctionRun)
85 |
86 | 更多贡献者信息可以访问 [pyvchart/graphs/contributors](https://github.com/pyvchart/pyvchart/graphs/contributors)
87 |
88 | ## 💡 贡献 [](https://github.com/VisActor/py-vchart/blob/main/CONTRIBUTING.md#your-first-pull-request)
89 |
90 | 如想参与贡献,请先阅读[行为准则](./CODE_OF_CONDUCT.md) 和[贡献指南](./CONTRIBUTING.zh-CN.md)。
91 |
92 | 细流成河,终成大海!
93 |
94 | 期待能有更多的开发者参与到 pyvchart 的开发中来,我们会保证尽快 Reivew PR 并且及时回复。但提交 PR 请确保
95 |
96 | 1. 通过所有单元测试,如若是新功能,请为其新增单元测试
97 | 2. 遵守开发规范,使用 black 以及 isort 格式化代码($ pip install -r requirements-dev.txt)
98 | 3. 如若需要,请更新相对应的文档
99 |
100 | 我们也非常欢迎开发者能为 pyvchart 提供更多的示例,共同来完善文档,~~文档项目位于 [pyvchart/website](https://github.com/pyvchart/website)~~ (文档在准备中...)
101 |
102 |
3 |
21 | {%- endmacro %}
22 |
23 | {%- macro render_notebook_charts(charts, libraries) -%}
24 |
41 | {%- endmacro %}
42 |
43 | {%- macro render_chart_dependencies(c) -%}
44 | {% if 'javascript' in c._render_cache -%}
45 | {% set _javascript = c._render_cache.javascript %}
46 | {% for dep in c.dependencies %}
47 |
50 | {% endfor %}
51 | {%- else -%}
52 | {% for dep in c.dependencies %}
53 |
54 | {% endfor %}
55 | {%- endif %}
56 | {%- endmacro %}
57 |
58 | {%- macro render_chart_css(c) -%}
59 | {% for dep in c.css_libs %}
60 |
13 | {% endfor %}
14 |
15 | {{ macro.render_notebook_charts(charts, libraries) }}
16 |
--------------------------------------------------------------------------------
/pyvchart/render/templates/nb_nteract.html:
--------------------------------------------------------------------------------
1 | {% import 'macro' as macro %}
2 |
3 |
4 |
5 | {{ chart.page_title }}
7 | {{ macro.render_chart_dependencies(chart) }}
8 | {{ macro.render_chart_css(chart) }}
9 |
10 |
11 | {{ macro.render_chart_content(chart) }}
12 |
13 |
14 |
--------------------------------------------------------------------------------
/pyvchart/types.py:
--------------------------------------------------------------------------------
1 | from typing import (
2 | Any,
3 | Callable,
4 | Iterable,
5 | List,
6 | Mapping,
7 | Optional,
8 | Sequence,
9 | Tuple,
10 | Union,
11 | )
12 |
13 | from . import options as opts
14 | from .options.series_options import JsCode, JSFunc, Numeric
15 |
16 | BaseData = Union[opts.BaseDataOpts, dict]
17 | BaseHtmlOrReact = Union[opts.BaseHtmlOrReactOpts, dict]
18 | BaseBorder = Union[opts.BaseBorderOpts, dict]
19 | BaseTitleTextStyle = Union[opts.BaseTitleTextStyleOpts, dict]
20 | Color = Union[opts.ColorOpts, dict]
21 | Indicator = Union[opts.IndicatorOpts, dict]
22 | IndicatorTitle = Union[opts.IndicatorTitleOpts, dict]
23 | IndicatorContent = Union[opts.IndicatorContentOpts, dict]
24 | Init = Union[opts.InitOpts, dict]
25 | Interaction = Union[opts.InteractionOpts, dict]
26 | Padding = Union[opts.PaddingOpts, dict]
27 | Region = Union[opts.RegionOpts, dict]
28 | RenderInit = Union[opts.RenderOpts, dict]
29 | Title = Union[opts.TitleOpts, dict]
30 | LegendTitle = Union[opts.LegendTitleOpts, dict]
31 | BaseLegend = Union[opts.BaseLegendOpts, dict]
32 | DiscreteLegend = Union[opts.DiscreteLegendOpts, dict]
33 | DiscreteLegendItem = Union[opts.DiscreteLegendItemOpts, dict]
34 | DiscreteLegendPager = Union[opts.DiscreteLegendPagerOpts, dict]
35 | ColorLegend = Union[opts.ColorLegendOpts, dict]
36 | SizeLegend = Union[opts.SizeLegendOpts, dict]
37 | Legend = Union[DiscreteLegend, ColorLegend, SizeLegend]
38 | BaseMark = Union[opts.BaseMarkOpts, dict]
39 | MarkCoordinates = Union[opts.MarkCoordinatesOpts, dict]
40 | MarkLine = Union[opts.MarkLineOpts, dict]
41 | MarkArea = Union[opts.MarkAreaOpts, dict]
42 | MarkPoint = Union[opts.MarkPointOpts, dict]
43 | CrossHairField = Union[opts.CrossHairFieldOpts, dict]
44 | CrossHair = Union[opts.CrossHairOpts, dict]
45 | AxesTick = Union[opts.AxesTickOpts, dict]
46 | AxesSubTick = Union[opts.AxesSubTickOpts, dict]
47 | AxesGrid = Union[opts.AxesGridOpts, dict]
48 | AxesBackground = Union[opts.AxesBackgroundOpts, dict]
49 | AxesLabel = Union[opts.AxesLabelOpts, dict]
50 | AxesDomainLine = Union[opts.AxesDomainLineOpts, dict]
51 | BaseAxes = Union[opts.BaseAxesOpts, dict]
52 | AxesBreak = Union[opts.AxesBreakOpts, dict]
53 | AxesLayer = Union[opts.AxesLayerOpts, dict]
54 | AxesLinear = Union[opts.AxesLinearOpts, dict]
55 | AxesBand = Union[opts.AxesBandOpts, dict]
56 | AxesTime = Union[opts.AxesTimeOpts, dict]
57 | AxesLog = Union[opts.AxesLogOpts, dict]
58 | AxesSymlog = Union[opts.AxesSymlogOpts, dict]
59 | Axes = Union[AxesLinear, AxesBand, AxesTime, AxesLog, AxesSymlog]
60 | Tooltip = Union[opts.TooltipOpts, dict]
61 | LayoutColRow = Union[opts.LayoutColRowOpts, dict]
62 | LayoutElement = Union[opts.LayoutElementOpts, dict]
63 | Layout = Union[opts.LayoutOpts, dict]
64 | Player = Union[opts.PlayerOpts, dict]
65 | PlayerSlider = Union[opts.PlayerSliderOpts, dict]
66 | PlayerController = Union[opts.PlayerControllerOpts, dict]
67 | PlayerControllerPosition = Union[opts.PlayerControllerPositionOpts, dict]
68 | ScrollBar = Union[opts.ScrollBarOpts, dict]
69 | DataZoom = Union[opts.DataZoomOpts, dict]
70 | Brush = Union[opts.BrushOpts, dict]
71 | ZoomWhenEmpty = Union[opts.ZoomWhenEmptyOpts, dict]
72 | Scales = Union[opts.ScalesOpts, dict]
73 | BaseCustomMark = Union[opts.BaseCustomMarkOpts, dict]
74 | CustomMarkSymbol = Union[opts.CustomMarkSymbolOpts, dict]
75 | CustomMarkRule = Union[opts.CustomMarkRuleOpts, dict]
76 | CustomMarkText = Union[opts.CustomMarkTextOpts, dict]
77 | CustomMarkRect = Union[opts.CustomMarkRectOpts, dict]
78 | CustomMarkPath = Union[opts.CustomMarkPathOpts, dict]
79 | CustomMarkArc = Union[opts.CustomMarkArcOpts, dict]
80 | CustomMarkPolygon = Union[opts.CustomMarkPolygonOpts, dict]
81 | CustomMarkImage = Union[opts.CustomMarkImageOpts, dict]
82 | CustomMarkGroup = Union[opts.CustomMarkGroupOpts, dict]
83 | CustomMark = Union[
84 | CustomMarkSymbol,
85 | CustomMarkText,
86 | CustomMarkRect,
87 | CustomMarkPath,
88 | CustomMarkArc,
89 | CustomMarkPolygon,
90 | CustomMarkImage,
91 | CustomMarkGroup,
92 | ]
93 | Theme = Union[opts.ThemeOpts, dict]
94 | Hover = Union[opts.HoverOpts, dict]
95 | Select = Union[opts.SelectOpts, dict]
96 | WaterfallTotal = Union[
97 | opts.WaterfallTotalCustomOpts,
98 | opts.WaterfallTotalEndOpts,
99 | opts.WaterfallTotalFieldOpts,
100 | ]
101 |
--------------------------------------------------------------------------------
/requirements-dev.txt:
--------------------------------------------------------------------------------
1 | black==25.1.0
2 | isort==4.3.16
--------------------------------------------------------------------------------
/requirements.txt:
--------------------------------------------------------------------------------
1 | jinja2>=2.11.3
2 | simplejson
3 |
--------------------------------------------------------------------------------
/setup.py:
--------------------------------------------------------------------------------
1 | import os
2 | import sys
3 | from shutil import rmtree
4 |
5 | from setuptools import Command, find_packages, setup
6 |
7 | # RELEASE STEPS
8 | # $ python setup.py upload
9 |
10 |
11 | __title__ = "py-vchart"
12 | __folder_title__ = "pyvchart"
13 | __description__ = "python visualization sdk for @visactor/vchart"
14 | __url__ = "https://github.com/VisActor/py-vchart"
15 | __author_email__ = "shjkfld379978424@gmail.com"
16 | __license__ = "MIT"
17 |
18 | __requires__ = [
19 | "setuptools>=38.3",
20 | "jinja2>=2.11.3",
21 | "simplejson"
22 | ]
23 |
24 | __keywords__ = ["VChart", "charts", "plotting-tool"]
25 | # Load the package's _version.py module as a dictionary.
26 | here = os.path.abspath(os.path.dirname(__file__))
27 | about = {}
28 | with open(os.path.join(here, __folder_title__, "_version.py")) as f:
29 | exec(f.read(), about)
30 |
31 |
32 | __version__ = about["__version__"]
33 |
34 |
35 | class UploadCommand(Command):
36 | description = "Build and publish the package."
37 | user_options = []
38 |
39 | @staticmethod
40 | def status(s):
41 | print("✨✨ {0}".format(s))
42 |
43 | def initialize_options(self):
44 | pass
45 |
46 | def finalize_options(self):
47 | pass
48 |
49 | def run(self):
50 | try:
51 | self.status("Removing previous builds…")
52 | rmtree(os.path.join(here, "dist"))
53 | rmtree(os.path.join(here, "build"))
54 | rmtree(os.path.join(here, "{0}.egg-info".format(__title__)))
55 | except OSError:
56 | pass
57 |
58 | self.status("Building Source and Wheel distribution…")
59 | os.system("{0} setup.py sdist bdist_wheel".format(sys.executable))
60 |
61 | self.status("Uploading the package to PyPI via Twine…")
62 | os.system("twine upload dist/*")
63 |
64 | self.status("Pushing git tags…")
65 | os.system('git tag -a v{0} -m "release version v{0}"'.format(__version__))
66 | os.system("git push origin v{0}".format(__version__))
67 |
68 | sys.exit()
69 |
70 |
71 | setup(
72 | name=__title__,
73 | version=__version__,
74 | description=__description__,
75 | url=__url__,
76 | author=about["__author__"],
77 | author_email=__author_email__,
78 | license=__license__,
79 | packages=find_packages(exclude=("test",)),
80 | keywords=__keywords__,
81 | install_requires=__requires__,
82 | zip_safe=False,
83 | include_package_data=True,
84 | classifiers=[
85 | "Development Status :: 5 - Production/Stable",
86 | "Environment :: Console",
87 | "Intended Audience :: Developers",
88 | "License :: OSI Approved :: MIT License",
89 | "Operating System :: OS Independent",
90 | "Programming Language :: Python",
91 | "Programming Language :: Python :: 3.6",
92 | "Programming Language :: Python :: 3.7",
93 | "Programming Language :: Python :: 3.8",
94 | "Programming Language :: Python :: 3.9",
95 | "Programming Language :: Python :: 3.10",
96 | "Programming Language :: Python :: 3.11",
97 | "Programming Language :: Python :: 3.12",
98 | "Programming Language :: Python :: 3.13",
99 | "Topic :: Software Development :: Libraries",
100 | ],
101 | cmdclass={"upload": UploadCommand},
102 | )
103 |
--------------------------------------------------------------------------------
/test.py:
--------------------------------------------------------------------------------
1 | import os
2 |
3 | # nose2
4 | os.system(
5 | "nose2 --with-coverage --coverage pyvchart " "--coverage-config .coveragerc -s test"
6 | )
7 |
8 | # pytest
9 | os.system("pytest --cov-branch --cov-report=xml -cov-config=.coveragerc --cov=./ test/")
10 |
11 | # flake8 for code linting
12 | os.system("flake8 --exclude=build,example,images --max-line-length=89 --ignore=F401")
13 |
--------------------------------------------------------------------------------
/test/__init__.py:
--------------------------------------------------------------------------------
1 | import sys
2 | from unittest.mock import patch
3 |
4 | from pyvchart.charts.chart import Base
5 |
6 |
7 | class ConsoleOutputRedirect:
8 | """Wrapper to redirect stdout or stderr"""
9 |
10 | def __init__(self, fp):
11 | self.fp = fp
12 |
13 | def write(self, s):
14 | self.fp.write(s)
15 |
16 | def writelines(self, lines):
17 | self.fp.writelines(lines)
18 |
19 | def flush(self):
20 | self.fp.flush()
21 |
22 |
23 | stdout_redirect = ConsoleOutputRedirect(sys.stdout)
24 |
25 |
26 | def chart_base_test(chart_type: str):
27 | """decorator for chart base tests"""
28 |
29 | def decorator(test_func):
30 |
31 | @patch("pyvchart.render.engine.write_utf8_html_file")
32 | def wrapper(self, fake_writer):
33 | chart: Base = test_func(self)
34 | chart.render()
35 | _, content = fake_writer.call_args[0]
36 |
37 | self.assertGreater(len(content), 1000)
38 | self.assertEqual(chart.options.get("type"), chart_type)
39 |
40 | return None
41 |
42 | return wrapper
43 |
44 | return decorator
45 |
--------------------------------------------------------------------------------
/test/fixtures/registry.json:
--------------------------------------------------------------------------------
1 | {
2 | "JUPYTER_URL": "/nbextensions/china-cities-js",
3 | "GITHUB_URL": "https://vchart-maps.github.io/china-cities-js",
4 | "JUPYTER_ENTRY": "china-cities-js/index",
5 | "JS_FOLDER": "js",
6 | "GEOJSON_FOLDER": "geojson",
7 | "PINYIN_MAP": {
8 | "安庆": "an1_qing4"
9 | },
10 | "FILE_MAP": {
11 | "an1_qing4": "shape-with-internal-borders/an1_hui1_an1_qing4",
12 | "English Name": "shape-with-internal-borders/an1_hui1_an1_qing4"
13 | }
14 | }
15 |
--------------------------------------------------------------------------------
/test/fixtures/registry_1.json:
--------------------------------------------------------------------------------
1 | {
2 | "JUPYTER_URL": "/nbextensions/china-cities-js",
3 | "GITHUB_URL": "https://vchart-maps.github.io/china-cities-js",
4 | "JUPYTER_ENTRY": "china-cities-js/index",
5 | "JS_FOLDER": "/",
6 | "GEOJSON_FOLDER": "geojson",
7 | "PINYIN_MAP": {
8 | "安庆": "an1_qing4"
9 | },
10 | "FILE_MAP": {
11 | "an1_qing4": "shape-with-internal-borders/an1_hui1_an1_qing4",
12 | "English Name": "shape-with-internal-borders/an1_hui1_an1_qing4"
13 | }
14 | }
15 |
--------------------------------------------------------------------------------
/test/requirements.txt:
--------------------------------------------------------------------------------
1 | nose2
2 | codecov
3 | coverage
4 | flake8
5 | mccabe
6 | pytest
7 | pytest-cov
8 | numpy
9 | pandas
--------------------------------------------------------------------------------
/test/test_bar.py:
--------------------------------------------------------------------------------
1 | import unittest
2 |
3 | from pyvchart import options as opts
4 | from pyvchart.charts import Bar
5 | from pyvchart.globals import ChartType
6 |
7 | from test import chart_base_test
8 |
9 |
10 | TEST_BAR_DATA = [
11 | {"month": "Monday", "sales": 22},
12 | {"month": "Tuesday", "sales": 13},
13 | {"month": "Wednesday", "sales": 25},
14 | {"month": "Thursday", "sales": 29},
15 | {"month": "Friday", "sales": 38},
16 | ]
17 |
18 |
19 | class TestBarChart(unittest.TestCase):
20 |
21 | @chart_base_test(chart_type=ChartType.BAR)
22 | def test_bar_base(self):
23 | c = (
24 | Bar()
25 | .set_bar_spec()
26 | .set_data(data=[opts.BaseDataOpts(values=TEST_BAR_DATA)])
27 | .set_xy_field(
28 | x_field_name="time",
29 | y_field_name="value",
30 | )
31 | )
32 | return c
33 |
--------------------------------------------------------------------------------
/test/test_bar3d.py:
--------------------------------------------------------------------------------
1 | import unittest
2 |
3 | from pyvchart import options as opts
4 | from pyvchart.charts import Bar3D
5 | from pyvchart.globals import ChartType
6 |
7 | from test import chart_base_test
8 |
9 | TEST_BAR3D_DATA = [
10 | {"month": "Monday", "sales": 22},
11 | {"month": "Tuesday", "sales": 13},
12 | {"month": "Wednesday", "sales": 25},
13 | {"month": "Thursday", "sales": 29},
14 | {"month": "Friday", "sales": 38},
15 | ]
16 |
17 |
18 | class TestBar3DChart(unittest.TestCase):
19 |
20 | @chart_base_test(chart_type=ChartType.BAR3D)
21 | def test_bar3d_base(self):
22 | c = (
23 | Bar3D()
24 | .set_data(
25 | data=[
26 | opts.BaseDataOpts(
27 | id_="bar3DData",
28 | values=TEST_BAR3D_DATA,
29 | )
30 | ]
31 | )
32 | .set_bar3d_spec(
33 | bar3d_opts=opts.Bar3DOpts(
34 | style=opts.BaseStyleOpts(
35 | length=20,
36 | ),
37 | state=opts.BaseStateOpts(
38 | selected_opts=opts.BaseStyleOpts(
39 | stroke="#000",
40 | ),
41 | ),
42 | ),
43 | )
44 | .set_xy_field(x_field_name="month", y_field_name="sales")
45 | .set_global_options(
46 | axes_opts=[
47 | opts.AxesBandOpts(
48 | base_axes_opts=opts.BaseAxesOpts(
49 | orient="bottom",
50 | tick=opts.AxesTickOpts(tick_size=20),
51 | mode="3d",
52 | ),
53 | ),
54 | opts.AxesLinearOpts(
55 | base_axes_opts=opts.BaseAxesOpts(
56 | orient="left",
57 | tick=opts.AxesTickOpts(tick_size=20),
58 | mode="3d",
59 | ),
60 | ),
61 | ]
62 | )
63 | )
64 |
65 | return c
66 |
--------------------------------------------------------------------------------
/test/test_base.py:
--------------------------------------------------------------------------------
1 | import unittest
2 | from datetime import datetime
3 | from unittest.mock import patch
4 |
5 | from pyvchart import options as opts
6 | from pyvchart.charts import Bar
7 | from pyvchart.options import InitOpts, RenderOpts
8 | from pyvchart.globals import CurrentConfig
9 | from pyvchart.commons.utils import JsCode
10 | from pyvchart.charts.base import Base, default
11 | from pyvchart.options.series_options import AnimationOpts
12 |
13 |
14 | class TestBaseClass(unittest.TestCase):
15 |
16 | def test_base_add_functions(self):
17 | c = Base()
18 | c.add_js_funcs("console.log('hello')", "console.log('hello')")
19 | self.assertEqual(1, len(c.js_functions.items))
20 | self.assertEqual(["console.log('hello')"], c.js_functions.items)
21 |
22 | def test_base_add_events(self):
23 | c = Base()
24 | c.add_js_events("console.log('hello')", "console.log('hello')")
25 | self.assertEqual(1, len(c.js_events.items))
26 | self.assertEqual(["console.log('hello')"], c.js_events.items)
27 |
28 | def test_base_init_funcs(self):
29 | c0 = Base({"width": "100px", "height": "200px"})
30 | self.assertEqual(c0.width, "100px")
31 | self.assertEqual(c0.height, "200px")
32 |
33 | c1 = Base(dict(width="110px", height="210px"))
34 | self.assertEqual(c1.width, "110px")
35 | self.assertEqual(c1.height, "210px")
36 | self.assertNotIn(c1.js_host, ["", None])
37 |
38 | @patch("pyvchart.render.engine.write_utf8_html_file")
39 | def test_render(self, fake_writer):
40 | my_render_content = "my_render_content"
41 | bar = Bar()
42 | bar.set_data(data=[opts.BaseDataOpts(values=[{"x": 1, "y": 2}])])
43 | bar.set_xy_field(x_field_name="x", y_field_name="y")
44 | bar.render(my_render_content=my_render_content)
45 | assert "test ok" == "test ok"
46 |
47 | @patch("pyvchart.render.engine.write_utf8_html_file")
48 | def test_render_js_host_none(self, fake_writer):
49 | my_render_content = "my_render_content"
50 | bar = Bar()
51 | bar.set_data(data=[opts.BaseDataOpts(values=[{"x": 1, "y": 2}])])
52 | bar.set_xy_field(x_field_name="x", y_field_name="y")
53 | # Hack to test
54 | bar.js_host = None
55 | # Render
56 | bar.render(my_render_content=my_render_content)
57 | self.assertEqual(bar.js_host, CurrentConfig.ONLINE_HOST)
58 |
59 | @patch("pyvchart.render.engine.write_utf8_html_file")
60 | def test_render_embed_js(self, _):
61 | c = Base(init_opts=InitOpts(is_embed_js=True))
62 | # Embedded JavaScript
63 | content = c.render_embed()
64 | self.assertNotIn(
65 | CurrentConfig.ONLINE_HOST, content, "Embedding JavaScript fails"
66 | )
67 | # No embedded JavaScript
68 | c._embed_js = False
69 | content = c.render_embed()
70 | self.assertIn(
71 | CurrentConfig.ONLINE_HOST, content, "Embedded JavaScript cannot be closed"
72 | )
73 |
74 | def test_base_render_options(self):
75 | c0 = Base(init_opts=InitOpts(is_embed_js=True))
76 | self.assertEqual(c0._embed_js, True)
77 |
78 | def test_base_iso_format(self):
79 | mock_time_str = "2022-04-14 14:42:00"
80 | mock_time = datetime.strptime(mock_time_str, "%Y-%m-%d %H:%M:%S")
81 | assert default(mock_time) == "2022-04-14T14:42:00"
82 |
83 | def test_base_animation_option(self):
84 | c0 = AnimationOpts(easing="cubicInOut")
85 | self.assertEqual(c0.get("easing"), "cubicInOut")
86 |
87 | c0.update(easing=None)
88 | self.assertEqual(c0.get("easing"), None)
89 |
90 | def test_base_chart_id(self):
91 | c0 = Base(render_opts=RenderOpts(dom="1234567"))
92 | self.assertEqual(c0.chart_id, "1234567")
93 |
94 | c1 = Base(render_opts=RenderOpts(dom="1234567"))
95 | self.assertEqual(c1.get_chart_id(), "1234567")
96 |
97 | def test_dump_options_with_quotes(self):
98 | bar = Bar()
99 | bar.set_data(data=[opts.BaseDataOpts(values=[{"x": 1, "y": 2}])])
100 | bar.set_xy_field(x_field_name="x", y_field_name="y")
101 | bar.set_bar_spec(
102 | label_opts=opts.LabelOpts(
103 | format_method=JsCode(
104 | "(value, datum, ctx) => { return datum['State']; }"
105 | ),
106 | )
107 | )
108 | formatter = """formatMethod": "(value, datum, ctx) => { return datum['State']; }""" # noqa
109 | self.assertIn(formatter, bar.dump_options_with_quotes())
110 |
--------------------------------------------------------------------------------
/test/test_boxplot.py:
--------------------------------------------------------------------------------
1 | import unittest
2 |
3 | from pyvchart import options as opts
4 | from pyvchart.charts import Boxplot
5 | from pyvchart.globals import ChartType
6 |
7 | from test import chart_base_test
8 |
9 | TEST_BOXPLOT_DATA = [
10 | {
11 | "x": "Sub-Saharan Africa",
12 | "y1": 8.72,
13 | "y2": 9.73,
14 | "y3": 10.17,
15 | "y4": 10.51,
16 | "y5": 11.64,
17 | },
18 | {"x": "South Asia", "y1": 9.4, "y2": 10.06, "y3": 10.75, "y4": 11.56, "y5": 12.5},
19 | {
20 | "x": "Middle East & North Africa",
21 | "y1": 9.54,
22 | "y2": 10.6,
23 | "y3": 11.05,
24 | "y4": 11.5,
25 | "y5": 11.92,
26 | },
27 | {
28 | "x": "Latin America & Caribbean",
29 | "y1": 8.74,
30 | "y2": 9.46,
31 | "y3": 10.35,
32 | "y4": 10.94,
33 | "y5": 12.21,
34 | },
35 | {
36 | "x": "East Asia & Pacific",
37 | "y1": 7.8,
38 | "y2": 8.95,
39 | "y3": 10.18,
40 | "y4": 11.57,
41 | "y5": 13.25,
42 | },
43 | {
44 | "x": "Europe & Central Asia",
45 | "y1": 9.52,
46 | "y2": 10.39,
47 | "y3": 10.93,
48 | "y4": 11.69,
49 | "y5": 12.63,
50 | },
51 | ]
52 |
53 |
54 | class TestBoxplotChart(unittest.TestCase):
55 |
56 | @chart_base_test(chart_type=ChartType.BOXPLOT)
57 | def test_boxplot_base(self):
58 | c = (
59 | Boxplot()
60 | .set_data(data=[opts.BaseDataOpts(values=TEST_BOXPLOT_DATA)])
61 | .set_boxplot_spec(
62 | min_field="y1",
63 | q1_field="y2",
64 | median_field="y3",
65 | q3_field="y4",
66 | max_field="y5",
67 | direction="vertical",
68 | boxplot_opts=opts.BoxplotOpts(style=opts.BaseStyleOpts(line_width=2)),
69 | )
70 | .set_xy_field(
71 | x_field_name="x",
72 | y_field_name=None,
73 | )
74 | )
75 | return c
76 |
--------------------------------------------------------------------------------
/test/test_circular_progress.py:
--------------------------------------------------------------------------------
1 | import unittest
2 |
3 | from pyvchart import options as opts
4 | from pyvchart.charts import CircularProgress
5 | from pyvchart.globals import ChartType
6 |
7 | from test import chart_base_test
8 |
9 |
10 | TEST_CIRCLE_PROGRESS_DATA = [
11 | {"type": "Tradition Industries", "value": 0.795, "text": "79.5%"},
12 | {"type": "Business Companies", "value": 0.25, "text": "25%"},
13 | {"type": "Customer-facing Companies", "value": 0.065, "text": "6.5%"},
14 | ]
15 |
16 |
17 | class TestCircularProgressChart(unittest.TestCase):
18 |
19 | @chart_base_test(chart_type=ChartType.CIRCULAR_PROGRESS)
20 | def test_circular_progress_base(self):
21 | c = (
22 | CircularProgress()
23 | .set_data(
24 | data=[opts.BaseDataOpts(id_="id0", values=TEST_CIRCLE_PROGRESS_DATA)]
25 | )
26 | .set_circular_progress_spec(
27 | value_field="value",
28 | category_field="type",
29 | radius=0.8,
30 | inner_radius=0.5,
31 | is_round_cap=True,
32 | corner_radius=20,
33 | progress_opts=opts.ProgressOpts(
34 | style=opts.BaseStyleOpts(
35 | inner_padding=5,
36 | outer_padding=5,
37 | )
38 | ),
39 | )
40 | .set_global_options(
41 | series_field="type",
42 | axes_opts=[
43 | opts.AxesLinearOpts(
44 | is_visible=False,
45 | base_axes_opts=opts.BaseAxesOpts(orient="angle"),
46 | ),
47 | opts.AxesBandOpts(
48 | base_axes_opts=opts.BaseAxesOpts(
49 | is_visible=False, orient="radius"
50 | )
51 | ),
52 | ],
53 | indicator_opts=opts.IndicatorOpts(
54 | is_visible=True,
55 | trigger="hover",
56 | title_opts=opts.IndicatorTitleOpts(
57 | is_visible=True,
58 | field="type",
59 | is_auto_limit=True,
60 | style=opts.BaseStyleOpts(font_size=20, fill="black"),
61 | ),
62 | content_opts=[
63 | opts.IndicatorContentOpts(
64 | is_visible=True,
65 | field="text",
66 | style=opts.BaseStyleOpts(font_size=16, fill="gray"),
67 | )
68 | ],
69 | ),
70 | legend_opts=opts.BaseLegendOpts(
71 | is_visible=True,
72 | orient="right",
73 | title_opts=opts.LegendTitleOpts(is_visible=False),
74 | ),
75 | )
76 | )
77 | return c
78 |
--------------------------------------------------------------------------------
/test/test_correlation.py:
--------------------------------------------------------------------------------
1 | import unittest
2 |
3 | from pyvchart import options as opts
4 | from pyvchart.charts import Correlation
5 | from pyvchart.globals import ChartType
6 |
7 | from test import chart_base_test
8 |
9 |
10 | TEST_CORRELATION_DATA = [
11 | {"word": "输入法哪个好用", "pv": 15952, "ratio": 94, "sim": 3932},
12 | {"word": "谷歌拼音输入法", "pv": 11032, "ratio": 97, "sim": 2799},
13 | {"word": "讯飞输入法", "pv": 107908, "ratio": 102, "sim": 2645},
14 | {"word": "QQ输入法", "pv": 74912, "ratio": 99, "sim": 2189},
15 | {"word": "百度输入法", "pv": 193624, "ratio": 121, "sim": 2100},
16 | {"word": "搜狗输入法", "pv": 835168, "ratio": 88, "sim": 2050},
17 | {"word": "谷歌输入法", "pv": 14140, "ratio": 96, "sim": 1953},
18 | {"word": "手心输入法", "pv": 19236, "ratio": 97, "sim": 1870},
19 | {"word": "输入法不见了", "pv": 1968, "ratio": 109, "sim": 1705},
20 | {"word": "输入法哪个最好用", "pv": 812, "ratio": 150, "sim": 1567},
21 | {"word": "必应输入法", "pv": 4602, "ratio": 91, "sim": 1522},
22 | {"word": "章鱼输入法", "pv": 18262, "ratio": 97, "sim": 1486},
23 | {"word": "输入法下载", "pv": 34186, "ratio": 91, "sim": 1278},
24 | {"word": "拼音输入法", "pv": 7186, "ratio": 86, "sim": 1009},
25 | {"word": "SHURUFA", "pv": 13418, "ratio": 102, "sim": 924},
26 | {"word": "微软输入法", "pv": 4680, "ratio": 88, "sim": 804},
27 | {"word": "GOOGLE输入法", "pv": 2206, "ratio": 97, "sim": 800},
28 | {"word": "输入法切换不出来", "pv": 15112, "ratio": 85, "sim": 764},
29 | {"word": "章鱼输入法下载", "pv": 8204, "ratio": 135, "sim": 754},
30 | {"word": "讯飞输入法下载", "pv": 5590, "ratio": 106, "sim": 609},
31 | {"word": "输入法搜狗", "pv": 352, "ratio": 132, "sim": 593},
32 | {"word": "输入法皮肤", "pv": 2476, "ratio": 103, "sim": 540},
33 | {"word": "紫光输入法", "pv": 1582, "ratio": 86, "sim": 538},
34 | {"word": "输入法设置", "pv": 1298, "ratio": 75, "sim": 527},
35 | {"word": "搜狗输入法下载安装", "pv": 126182, "ratio": 102, "sim": 521},
36 | {"word": "微软拼音输入法", "pv": 3442, "ratio": 88, "sim": 510},
37 | {"word": "QQ拼音输入法", "pv": 24912, "ratio": 98, "sim": 478},
38 | {"word": "输入发", "pv": 150, "ratio": 125, "sim": 465},
39 | {"word": "SOUGOU输入法", "pv": 264, "ratio": 89, "sim": 452},
40 | {"word": "微软拼音", "pv": 2772, "ratio": 93, "sim": 443},
41 | ]
42 |
43 |
44 | class TestCorrelationChart(unittest.TestCase):
45 |
46 | @chart_base_test(chart_type=ChartType.CORRELATION)
47 | def test_correlation_base(self):
48 | c = (
49 | Correlation()
50 | .set_data(data=[opts.BaseDataOpts(values=TEST_CORRELATION_DATA)])
51 | .set_correlation_spec(
52 | category_field="word",
53 | value_field="sim",
54 | size_field="pv",
55 | size_range=[12, 30],
56 | inner_radius="25%",
57 | outer_radius="95%",
58 | node_point_opts=opts.CorrelationNodePointOpts(
59 | state=opts.BaseStateOpts(
60 | hover_opts=opts.BaseStyleOpts(
61 | line_width=8,
62 | stroke_opacity=0.2,
63 | ),
64 | ),
65 | ),
66 | center_point_opts=opts.CorrelationCenterPointOpts(
67 | state=opts.BaseStateOpts(
68 | hover_opts=opts.BaseStyleOpts(
69 | line_width=8,
70 | stroke_opacity=0.2,
71 | ),
72 | ),
73 | ),
74 | center_label_opts=opts.LabelOpts(
75 | is_visible=True,
76 | position="center",
77 | style_opts=opts.BaseStyleOpts(fill="white", text="输入法"),
78 | ),
79 | label_opts=opts.LabelOpts(
80 | is_visible=True,
81 | position="bottom",
82 | style_opts=opts.BaseStyleOpts(fill="black"),
83 | ),
84 | )
85 | )
86 | return c
87 |
--------------------------------------------------------------------------------
/test/test_datasets.py:
--------------------------------------------------------------------------------
1 | import os
2 | import unittest
3 | from unittest.mock import patch
4 |
5 | from pyvchart.datasets import (
6 | EXTRA,
7 | FuzzyDict,
8 | register_url,
9 | register_files,
10 | )
11 |
12 |
13 | class TestDatasets(unittest.TestCase):
14 |
15 | @patch("pyvchart.datasets.urllib.request.urlopen")
16 | def test_register_url(self, fake):
17 | current_path = os.path.dirname(__file__)
18 | fake_registry = os.path.join(current_path, "fixtures", "registry.json")
19 | file_name = ["shape-with-internal-borders/an1_hui1_an1_qing4", "js"]
20 | with open(fake_registry, encoding="utf8") as f:
21 | fake.return_value = f
22 | register_url("http://register.url/is/used")
23 | # set maxDiff
24 | self.assertEqual.__self__.maxDiff = None
25 | self.assertEqual(
26 | EXTRA["http://register.url/is/used/js/"],
27 | {
28 | "安庆": file_name,
29 | "English Name": file_name,
30 | },
31 | )
32 |
33 | fake_registry_1 = os.path.join(current_path, "fixtures", "registry_1.json")
34 | with open(fake_registry_1, encoding="utf8") as f:
35 | fake.return_value = f
36 | register_url("http://register.url/is/used")
37 | self.assertEqual(
38 | EXTRA["http://register.url/is/used/"],
39 | {
40 | "安庆": file_name,
41 | "English Name": file_name,
42 | },
43 | )
44 |
45 | def test_register_url_error(self):
46 | try:
47 | register_url("error_asset_url")
48 | except ValueError as err:
49 | self.assertIn(type(err), [ValueError])
50 |
51 | def test_fuzzy_search_dict(self):
52 | fd = FuzzyDict()
53 | fd.update({"我是北京市": [1, 2]})
54 | self.assertEqual(fd["我是北京"], [1, 2])
55 |
56 | def test_fuzzy_search_key_error(self):
57 | with self.assertRaises(KeyError):
58 | fd = FuzzyDict()
59 | fd.cutoff = 0.9
60 | _ = fd["我是北京"]
61 |
62 | def test_register_files(self):
63 | register_files(asset_files={"x": 1})
64 |
65 | def test_type_error_with_non_string_key(self):
66 | fd = FuzzyDict()
67 | fd[1] = "one"
68 | fd[2] = "two"
69 |
70 | result = fd._search("1")
71 | self.assertFalse(result[0]) # Ensure no match found
72 |
73 | def test_type_error_with_non_string_lookfor(self):
74 | fd = FuzzyDict()
75 | fd["one"] = 1
76 | fd["two"] = 2
77 |
78 | with self.assertRaises(KeyError):
79 | _ = fd[1]
80 |
81 | def test_search_stop_on_first_true_highMatch(self):
82 | fuzzy_dict = FuzzyDict()
83 | fuzzy_dict["apple"] = 1
84 | fuzzy_dict["banana"] = 2
85 | fuzzy_dict["banana"] = 3
86 | fuzzy_dict.cutoff = 0.6 # 设置一个默认的截止值用于模糊匹配
87 |
88 | result = fuzzy_dict._search("aple", stop_on_first=True)
89 | self.assertTrue(result[0]) # 找到匹配
90 | self.assertEqual(result[1], "apple") # 最佳匹配的键
91 | self.assertEqual(result[2], 1) # 匹配的值
92 | self.assertGreater(result[3], fuzzy_dict.cutoff) # 匹配度高于截止值
93 |
--------------------------------------------------------------------------------
/test/test_display.py:
--------------------------------------------------------------------------------
1 | import unittest
2 |
3 | from pyvchart.render.display import HTML, Javascript
4 |
5 |
6 | class TestDisplay(unittest.TestCase):
7 |
8 | def test_display_html(self):
9 | html_content = "hello world
"
10 | obj = HTML(html_content)
11 | self.assertEqual(obj.data, html_content)
12 | self.assertEqual(obj.__html__(), html_content)
13 |
14 | def test_display_javascript(self):
15 | js_content = "console.log('hello world')"
16 | obj = Javascript(js_content)
17 | self.assertEqual(obj.data, js_content)
18 | self.assertEqual(obj._repr_javascript_(), js_content)
19 |
20 | def test_display_javascript_v1(self):
21 | js_content = "console.log('hello world')"
22 | obj = Javascript(js_content, lib="test lib", css="test css")
23 | self.assertEqual(obj.data, js_content)
24 |
25 | obj_1 = Javascript(
26 | data=js_content,
27 | lib=["lib1", "lib2"],
28 | css=["css1", "css2"],
29 | )
30 | self.assertEqual(obj_1.data, js_content)
31 | self.assertIn(js_content, obj_1._repr_javascript_())
32 |
33 | def test_display_javascript_v2(self):
34 | import ssl
35 |
36 | # ssl._create_default_https_context = ssl._create_unverified_context
37 |
38 | obj = Javascript(
39 | lib=["https://unpkg.com/@visactor/vchart@1.13.5/build/index.min.js"]
40 | )
41 | obj.load_javascript_contents()
42 | self.assertIn(
43 | "vchart",
44 | obj.javascript_contents[
45 | "https://unpkg.com/@visactor/vchart@1.13.5/build/index.min.js"
46 | ],
47 | )
48 |
49 | obj_1 = Javascript(lib=["https://unpkg.com/@visactor/build/index.min.js"])
50 | try:
51 | obj_1.load_javascript_contents()
52 | except RuntimeError:
53 | pass
54 |
--------------------------------------------------------------------------------
/test/test_engine.py:
--------------------------------------------------------------------------------
1 | import os
2 | import unittest
3 |
4 | from pyvchart import render_chart
5 | from pyvchart.charts import Bar
6 | from pyvchart.render.engine import RenderEngine, write_utf8_html_file
7 | from pyvchart.datasets import EXTRA, FILENAMES
8 | from pyvchart.globals import CurrentConfig, ChartType
9 |
10 |
11 | class TestEngine(unittest.TestCase):
12 |
13 | def setUp(self):
14 | self.test_file_name = "test_file.html"
15 |
16 | def test_generate_js_link(self):
17 | FILENAMES.update({"existing_dep": ("file_path", "ext")})
18 | EXTRA.update(
19 | {
20 | "https://extra_host.com": {
21 | "dep": ("extra_file_path", "extra_ext"),
22 | },
23 | "https://extra_host.com/css": {
24 | "dep1": ("extra_file_path", "css"),
25 | },
26 | }
27 | )
28 |
29 | # Bar 图
30 | chart = Bar()
31 | chart.js_host = None
32 | chart.js_dependencies.items = [
33 | "existing_dep",
34 | "dep",
35 | "dep1",
36 | ]
37 |
38 | RenderEngine.generate_js_link(chart)
39 |
40 | assert chart.js_host == CurrentConfig.ONLINE_HOST
41 |
42 | # expected_links = [
43 | # "{}file_path.ext".format(CurrentConfig.ONLINE_HOST),
44 | # "https://extra_host.comextra_file_path.extra_ext",
45 | # ]
46 | # assert chart.dependencies == expected_links
47 | #
48 | # expected_css_links = [
49 | # "https://extra_host.com/cssextra_file_path.css",
50 | # ]
51 | # assert chart.css_libs == expected_css_links
52 |
53 | def test_write_utf8_html_file(self):
54 | html_content = "Hello, World! "
55 | write_utf8_html_file(self.test_file_name, html_content)
56 |
57 | with open(self.test_file_name, "r", encoding="utf-8") as file:
58 | written_content = file.read()
59 |
60 | self.assertEqual(written_content, html_content)
61 |
62 | def test_render_chart(self):
63 | spec = {
64 | "type": 'bar',
65 | "data": [
66 | {
67 | "id": 'barData',
68 | "values": [
69 | {"month": 'Monday', "sales": 22},
70 | {"month": 'Tuesday', "sales": 13},
71 | {"month": 'Wednesday', "sales": 25},
72 | {"month": 'Thursday', "sales": 29},
73 | {"month": 'Friday', "sales": 38}
74 | ]
75 | }
76 | ],
77 | "xField": 'month',
78 | "yField": 'sales',
79 | "crosshair": {
80 | "xField": {"visible": True}
81 | }
82 | }
83 | content = render_chart(spec).__html__()
84 | self.assertIn(ChartType.BAR, content)
85 |
86 | def tearDown(self):
87 | if os.path.exists(self.test_file_name):
88 | os.remove(self.test_file_name)
89 |
--------------------------------------------------------------------------------
/test/test_funnel.py:
--------------------------------------------------------------------------------
1 | import unittest
2 |
3 | from pyvchart import options as opts
4 | from pyvchart.charts import Funnel
5 | from pyvchart.globals import ChartType
6 |
7 | from test import chart_base_test
8 |
9 |
10 | TEST_FUNNEL_DATA = [
11 | {"value": 100, "name": "Step1"},
12 | {"value": 80, "name": "Step2"},
13 | {"value": 60, "name": "Step3"},
14 | {"value": 40, "name": "Step4"},
15 | {"value": 20, "name": "Step5"},
16 | ]
17 |
18 |
19 | class TestFunnelChart(unittest.TestCase):
20 |
21 | @chart_base_test(chart_type=ChartType.FUNNEL)
22 | def test_funnel_base(self):
23 | c = (
24 | Funnel()
25 | .set_data(data=[opts.BaseDataOpts(values=TEST_FUNNEL_DATA)])
26 | .set_funnel_spec(
27 | category_field="name",
28 | value_field="value",
29 | label_opts=opts.LabelOpts(is_visible=True),
30 | )
31 | .set_global_options(
32 | legend_opts=opts.BaseLegendOpts(
33 | is_visible=True,
34 | orient="bottom",
35 | ),
36 | )
37 | )
38 | return c
39 |
--------------------------------------------------------------------------------
/test/test_funnel3d.py:
--------------------------------------------------------------------------------
1 | import unittest
2 |
3 | from pyvchart import options as opts
4 | from pyvchart.charts import Funnel3D
5 | from pyvchart.commons.utils import JsCode
6 | from pyvchart.globals import ChartType
7 |
8 | from test import chart_base_test
9 |
10 |
11 | TEST_FUNNEL3D_DATA = [
12 | {"value": 100, "name": "Step1"},
13 | {"value": 80, "name": "Step2"},
14 | {"value": 60, "name": "Step3"},
15 | {"value": 40, "name": "Step4"},
16 | {"value": 20, "name": "Step5"},
17 | ]
18 |
19 |
20 | class TestFunnel3DChart(unittest.TestCase):
21 |
22 | @chart_base_test(chart_type=ChartType.FUNNEL3D)
23 | def test_funnel3d_base(self):
24 | c = (
25 | Funnel3D(
26 | render_opts=opts.RenderOpts(
27 | is_disable_dirty_bounds=True,
28 | options3d_opts=opts.Render3DOpts(
29 | is_enable=True,
30 | center={"dx": 100, "dy": 100},
31 | ),
32 | ),
33 | )
34 | .set_data(data=[opts.BaseDataOpts(id_="data", values=TEST_FUNNEL3D_DATA)])
35 | .set_funnel3d_spec(
36 | category_field="name",
37 | value_field="value",
38 | min_size=50,
39 | max_size=400,
40 | label_opts=opts.LabelOpts(is_visible=True, is_support3d=True),
41 | )
42 | .set_global_options(
43 | padding_opts=opts.PaddingOpts(pos_top=30),
44 | legend_opts=opts.BaseLegendOpts(is_visible=True, orient="bottom"),
45 | )
46 | )
47 | return c
48 |
--------------------------------------------------------------------------------
/test/test_gauge.py:
--------------------------------------------------------------------------------
1 | import unittest
2 |
3 | from pyvchart import options as opts
4 | from pyvchart.charts import Gauge
5 | from pyvchart.globals import ChartType
6 |
7 | from test import chart_base_test
8 |
9 | TEST_GAUGE_DATA = [{"type": "目标A", "value": 0.6}]
10 |
11 |
12 | class TestGaugeChart(unittest.TestCase):
13 |
14 | @chart_base_test(chart_type=ChartType.GAUGE)
15 | def test_gauge_base(self):
16 | c = (
17 | Gauge()
18 | .set_data(data=[opts.BaseDataOpts(id_="id0", values=TEST_GAUGE_DATA)])
19 | .set_gauge_spec(
20 | category_field="type",
21 | value_field="value",
22 | outer_radius=0.8,
23 | inner_radius=0.5,
24 | start_angle=-180,
25 | end_angle=0,
26 | )
27 | )
28 | return c
29 |
--------------------------------------------------------------------------------
/test/test_histogram.py:
--------------------------------------------------------------------------------
1 | import unittest
2 |
3 | from pyvchart import options as opts
4 | from pyvchart.charts import Histogram
5 | from pyvchart.commons.utils import JsCode
6 | from pyvchart.globals import ChartType
7 |
8 | from test import chart_base_test
9 |
10 |
11 | TEST_HISTOGRAM_DATA = [
12 | {"x0": -400, "x1": -380, "frequency": 0},
13 | {"x0": -380, "x1": -360, "frequency": 4},
14 | {"x0": -360, "x1": -340, "frequency": 7},
15 | {"x0": -340, "x1": -320, "frequency": 7},
16 | {"x0": -320, "x1": -300, "frequency": 18},
17 | {"x0": -300, "x1": -280, "frequency": 30},
18 | {"x0": -280, "x1": -260, "frequency": 33},
19 | {"x0": -260, "x1": -240, "frequency": 80},
20 | {"x0": -240, "x1": -220, "frequency": 98},
21 | {"x0": -220, "x1": -200, "frequency": 124},
22 | {"x0": -200, "x1": -180, "frequency": 161},
23 | {"x0": -180, "x1": -160, "frequency": 176},
24 | {"x0": -160, "x1": -140, "frequency": 227},
25 | {"x0": -140, "x1": -120, "frequency": 276},
26 | {"x0": -120, "x1": -100, "frequency": 321},
27 | {"x0": -100, "x1": -80, "frequency": 452},
28 | {"x0": -80, "x1": -60, "frequency": 441},
29 | {"x0": -60, "x1": -40, "frequency": 505},
30 | {"x0": -40, "x1": -20, "frequency": 521},
31 | {"x0": -20, "x1": 0, "frequency": 733},
32 | {"x0": 0, "x1": 20, "frequency": 892},
33 | {"x0": 20, "x1": 40, "frequency": 362},
34 | {"x0": 40, "x1": 60, "frequency": 267},
35 | {"x0": 60, "x1": 80, "frequency": 223},
36 | {"x0": 80, "x1": 100, "frequency": 157},
37 | {"x0": 100, "x1": 120, "frequency": 170},
38 | {"x0": 120, "x1": 140, "frequency": 124},
39 | {"x0": 140, "x1": 160, "frequency": 112},
40 | {"x0": 160, "x1": 180, "frequency": 73},
41 | {"x0": 180, "x1": 200, "frequency": 80},
42 | {"x0": 200, "x1": 220, "frequency": 49},
43 | {"x0": 220, "x1": 240, "frequency": 33},
44 | {"x0": 240, "x1": 260, "frequency": 30},
45 | {"x0": 260, "x1": 280, "frequency": 21},
46 | {"x0": 280, "x1": 300, "frequency": 9},
47 | {"x0": 300, "x1": 320, "frequency": 13},
48 | {"x0": 320, "x1": 340, "frequency": 11},
49 | {"x0": 340, "x1": 360, "frequency": 5},
50 | {"x0": 360, "x1": 380, "frequency": 4},
51 | {"x0": 380, "x1": 400, "frequency": 4},
52 | {"x0": 400, "x1": 420, "frequency": 2},
53 | {"x0": 420, "x1": 440, "frequency": 8},
54 | {"x0": 440, "x1": 460, "frequency": 2},
55 | {"x0": 460, "x1": 480, "frequency": 3},
56 | {"x0": 480, "x1": 500, "frequency": 10},
57 | {"x0": 500, "x1": 520, "frequency": 7},
58 | {"x0": 520, "x1": 540, "frequency": 14},
59 | {"x0": 540, "x1": 560, "frequency": 6},
60 | {"x0": 560, "x1": 580, "frequency": 1},
61 | {"x0": 580, "x1": 600, "frequency": 3},
62 | {"x0": 600, "x1": 620, "frequency": 0},
63 | {"x0": 620, "x1": 640, "frequency": 6},
64 | {"x0": 640, "x1": 660, "frequency": 5},
65 | {"x0": 660, "x1": 680, "frequency": 3},
66 | {"x0": 680, "x1": 700, "frequency": 2},
67 | {"x0": 700, "x1": 720, "frequency": 0},
68 | ]
69 |
70 |
71 | class TestHistogramChart(unittest.TestCase):
72 |
73 | @chart_base_test(chart_type=ChartType.HISTOGRAM)
74 | def test_histogram_base(self):
75 | c = (
76 | Histogram()
77 | .set_data(data=[opts.BaseDataOpts(values=TEST_HISTOGRAM_DATA)])
78 | .set_histogram_spec(
79 | x2_field="x1",
80 | bar_opts=opts.BarOpts(
81 | style=opts.BaseStyleOpts(stroke="white", line_width=1)
82 | ),
83 | )
84 | .set_xy_field(x_field_name="x0", y_field_name="frequency")
85 | .set_global_options(
86 | title_opts=opts.TitleOpts(text="Arrival Time Histogram"),
87 | tooltip_opts=opts.TooltipOpts(
88 | is_visible=True,
89 | mark_opts=opts.TooltipCustomOpts(
90 | title_value="frequency",
91 | content=[
92 | opts.TooltipCustomStyleOpts(
93 | key=JsCode("datum => datum['x0'] + '~' + datum['x1']"),
94 | value=JsCode("datum => datum['frequency']"),
95 | )
96 | ],
97 | ),
98 | ),
99 | )
100 | )
101 | return c
102 |
--------------------------------------------------------------------------------
/test/test_line.py:
--------------------------------------------------------------------------------
1 | import unittest
2 |
3 | from pyvchart import options as opts
4 | from pyvchart.charts import Line
5 | from pyvchart.globals import ChartType
6 |
7 | from test import chart_base_test
8 |
9 |
10 | TEST_LINE_DATA = [
11 | {"date": "2023-01-01", "type": "Product A", "value": 99.9},
12 | {"date": "2023-01-01", "type": "Product B", "value": 96.6},
13 | {"date": "2023-01-01", "type": "Product C", "value": 96.2},
14 | {"date": "2023-01-02", "type": "Product A", "value": 96.7},
15 | {"date": "2023-01-02", "type": "Product B", "value": 91.1},
16 | {"date": "2023-01-02", "type": "Product C", "value": 93.4},
17 | {"date": "2023-01-03", "type": "Product A", "value": 100.2},
18 | {"date": "2023-01-03", "type": "Product B", "value": 99.4},
19 | {"date": "2023-01-03", "type": "Product C", "value": 91.7},
20 | {"date": "2023-01-04", "type": "Product A", "value": 104.7},
21 | {"date": "2023-01-04", "type": "Product B", "value": 108.1},
22 | {"date": "2023-01-04", "type": "Product C", "value": 93.1},
23 | {"date": "2023-01-05", "type": "Product A", "value": 95.6},
24 | {"date": "2023-01-05", "type": "Product B", "value": 96},
25 | {"date": "2023-01-05", "type": "Product C", "value": 92.3},
26 | {"date": "2023-01-06", "type": "Product A", "value": 95.6},
27 | {"date": "2023-01-06", "type": "Product B", "value": 89.1},
28 | {"date": "2023-01-06", "type": "Product C", "value": 92.5},
29 | {"date": "2023-01-07", "type": "Product A", "value": 95.3},
30 | {"date": "2023-01-07", "type": "Product B", "value": 89.2},
31 | {"date": "2023-01-07", "type": "Product C", "value": 95.7},
32 | {"date": "2023-01-08", "type": "Product A", "value": 96.1},
33 | {"date": "2023-01-08", "type": "Product B", "value": 97.6},
34 | {"date": "2023-01-08", "type": "Product C", "value": 99.9},
35 | {"date": "2023-01-09", "type": "Product A", "value": 96.1},
36 | {"date": "2023-01-09", "type": "Product B", "value": 100.6},
37 | {"date": "2023-01-09", "type": "Product C", "value": 103.8},
38 | {"date": "2023-01-10", "type": "Product A", "value": 101.6},
39 | {"date": "2023-01-10", "type": "Product B", "value": 108.3},
40 | {"date": "2023-01-10", "type": "Product C", "value": 108.9},
41 | ]
42 |
43 |
44 | class TestLineChart(unittest.TestCase):
45 |
46 | @chart_base_test(chart_type=ChartType.LINE)
47 | def test_line_base(self):
48 | c = (
49 | Line()
50 | .set_data(data=[opts.BaseDataOpts(values=TEST_LINE_DATA)])
51 | .set_line_spec(point_opts=opts.PointOpts(is_visible=False))
52 | .set_xy_field(x_field_name="date", y_field_name="date")
53 | .set_global_options(series_field="type")
54 | )
55 | return c
56 |
--------------------------------------------------------------------------------
/test/test_linear_progress.py:
--------------------------------------------------------------------------------
1 | import unittest
2 |
3 | from pyvchart import options as opts
4 | from pyvchart.charts import LinearProgress
5 | from pyvchart.globals import ChartType
6 |
7 | from test import chart_base_test
8 |
9 |
10 | TEST_LINEAR_PROGRESS_DATA = [
11 | {"type": "Tradition Industries", "value": 0.795, "text": "79.5%"},
12 | {"type": "Business Companies", "value": 0.25, "text": "25%"},
13 | {"type": "Customer-facing Companies", "value": 0.065, "text": "6.5%"},
14 | ]
15 |
16 |
17 | class TestLinearProgressChart(unittest.TestCase):
18 |
19 | @chart_base_test(chart_type=ChartType.LINEAR_PROGRESS)
20 | def test_linear_progress_base(self):
21 | c = (
22 | LinearProgress()
23 | .set_data(
24 | data=[opts.BaseDataOpts(id_="id0", values=TEST_LINEAR_PROGRESS_DATA)]
25 | )
26 | .set_xy_field(x_field_name="value", y_field_name="type")
27 | .set_linear_progress_spec(
28 | direction="horizontal",
29 | corner_radius=20,
30 | band_width=30,
31 | )
32 | .set_global_options(
33 | series_field="type",
34 | axes_opts=[
35 | opts.AxesBandOpts(
36 | base_axes_opts=opts.BaseAxesOpts(
37 | orient="left",
38 | label=opts.AxesLabelOpts(is_visible=True),
39 | domain_line=opts.AxesDomainLineOpts(is_visible=False),
40 | tick=opts.AxesTickOpts(is_visible=False),
41 | )
42 | ),
43 | opts.AxesLinearOpts(
44 | base_axes_opts=opts.BaseAxesOpts(
45 | orient="bottom",
46 | label=opts.AxesLabelOpts(is_visible=True),
47 | ),
48 | is_visible=False,
49 | ),
50 | ],
51 | )
52 | )
53 | return c
54 |
--------------------------------------------------------------------------------
/test/test_liquid.py:
--------------------------------------------------------------------------------
1 | import unittest
2 |
3 | from pyvchart import options as opts
4 | from pyvchart.charts import Liquid
5 | from pyvchart.globals import ChartType
6 |
7 | from test import chart_base_test
8 |
9 |
10 | TEST_LIQUID_DATA = [{"value": 0.3}]
11 |
12 |
13 | class TestLiquidChart(unittest.TestCase):
14 |
15 | @chart_base_test(chart_type=ChartType.LIQUID)
16 | def test_liquid_base(self):
17 | c = (
18 | Liquid()
19 | .set_data(data=[opts.BaseDataOpts(id_="data", values=TEST_LIQUID_DATA)])
20 | .set_liquid_spec(value_field="value")
21 | .set_global_options(
22 | indicator_opts=opts.IndicatorOpts(
23 | is_visible=True,
24 | title_opts=opts.IndicatorTitleOpts(
25 | is_visible=True,
26 | style=opts.BaseTitleTextStyleOpts(text="进度"),
27 | ),
28 | content_opts=opts.IndicatorContentOpts(
29 | is_visible=True,
30 | style=opts.BaseTitleTextStyleOpts(
31 | text="30%",
32 | base_style_opts=opts.BaseStyleOpts(fill="black"),
33 | ),
34 | ),
35 | ),
36 | )
37 | )
38 | return c
39 |
--------------------------------------------------------------------------------
/test/test_mosaic.py:
--------------------------------------------------------------------------------
1 | import unittest
2 |
3 | from pyvchart import options as opts
4 | from pyvchart.charts import Mosaic
5 | from pyvchart.commons.utils import JsCode
6 | from pyvchart.globals import ChartType
7 |
8 | from test import chart_base_test
9 |
10 |
11 | TEST_MOSAIC_DATA = [
12 | {"State": "WY", "Age": "Under 5 Years", "Population": 25635},
13 | {"State": "WY", "Age": "5 to 13 Years", "Population": 1890},
14 | {"State": "WY", "Age": "14 to 17 Years", "Population": 9314},
15 | {"State": "DC", "Age": "Under 5 Years", "Population": 30352},
16 | {"State": "DC", "Age": "5 to 13 Years", "Population": 20439},
17 | {"State": "DC", "Age": "14 to 17 Years", "Population": 10225},
18 | {"State": "VT", "Age": "Under 5 Years", "Population": 38253},
19 | {"State": "VT", "Age": "5 to 13 Years", "Population": 42538},
20 | {"State": "VT", "Age": "14 to 17 Years", "Population": 15757},
21 | {"State": "ND", "Age": "Under 5 Years", "Population": 51896},
22 | {"State": "ND", "Age": "5 to 13 Years", "Population": 67358},
23 | {"State": "ND", "Age": "14 to 17 Years", "Population": 18794},
24 | {"State": "AK", "Age": "Under 5 Years", "Population": 72083},
25 | {"State": "AK", "Age": "5 to 13 Years", "Population": 85640},
26 | {"State": "AK", "Age": "14 to 17 Years", "Population": 22153},
27 | ]
28 |
29 |
30 | class TestMosaicChart(unittest.TestCase):
31 |
32 | @chart_base_test(chart_type=ChartType.MOSAIC)
33 | def test_mosaic_base(self):
34 | c = (
35 | Mosaic()
36 | .set_data(data=[opts.BaseDataOpts(id_="barData", values=TEST_MOSAIC_DATA)])
37 | .set_xy_field(x_field_name="State", y_field_name="Population")
38 | .set_mosaic_spec(
39 | label_opts=[
40 | opts.LabelOpts(
41 | is_visible=True,
42 | position="bottom",
43 | style_opts=opts.BaseStyleOpts(fill="#333"),
44 | filter_by_group_opts=opts.LabelFilterByGroupOpts(
45 | field="State",
46 | type_="min",
47 | ),
48 | format_method=JsCode(
49 | "(value, datum, ctx) => { return datum['State']; }"
50 | ),
51 | overlap_opts=False,
52 | ),
53 | opts.LabelOpts(
54 | is_visible=True,
55 | position="top",
56 | style_opts=opts.BaseStyleOpts(fill="#333"),
57 | filter_by_group_opts=opts.LabelFilterByGroupOpts(
58 | field="State",
59 | type_="max",
60 | ),
61 | format_method=JsCode(
62 | "(value, datum, ctx) => {"
63 | "return `${datum['__VCHART_STACK_END']} "
64 | "(${((datum['__VCHART_MOSAIC_CAT_END_PERCENT'] - "
65 | "datum['__VCHART_MOSAIC_CAT_START_PERCENT']) * 100"
66 | ").toFixed(0)}% )`;}"
67 | ),
68 | overlap_opts=False,
69 | ),
70 | opts.LabelOpts(
71 | is_visible=True,
72 | position="center",
73 | smart_invert=True,
74 | ),
75 | ]
76 | )
77 | .set_global_options(
78 | series_field="Age",
79 | is_percent=True,
80 | legend_opts=[opts.BaseLegendOpts(is_visible=True)],
81 | axes_opts=[
82 | opts.BaseAxesOpts(
83 | orient="left",
84 | label=opts.AxesLabelOpts(
85 | format_method=JsCode(
86 | "val => { return `${(val * 100).toFixed(2)}%`; }",
87 | ),
88 | ),
89 | ),
90 | opts.BaseAxesOpts(
91 | orient="right",
92 | label=opts.AxesLabelOpts(is_visible=False),
93 | ),
94 | ],
95 | )
96 | )
97 | return c
98 |
--------------------------------------------------------------------------------
/test/test_pictogram.py:
--------------------------------------------------------------------------------
1 | import unittest
2 | import urllib.request
3 |
4 | from pyvchart import options as opts
5 | from pyvchart.charts import Pictogram
6 | from pyvchart.commons.utils import JsCode
7 | from pyvchart.globals import ChartType
8 |
9 | from test import chart_base_test
10 |
11 |
12 | TEST_PICTOGRAM_DATA = [
13 | {"name": "Yes", "value": "Love This"},
14 | {"name": "So-so"},
15 | {"name": "Forbidden"},
16 | {"name": "Horror"},
17 | ]
18 |
19 | req = urllib.request.Request(
20 | url="https://lf9-dp-fe-cms-tos.byteorg.com/obj/bit-cloud/pictogram/cat.svg"
21 | )
22 | resp = urllib.request.urlopen(req)
23 | TEST_SVG_CONTENT = resp.read().decode("utf-8")
24 |
25 |
26 | class TestPictogramChart(unittest.TestCase):
27 |
28 | @chart_base_test(chart_type=ChartType.PICTOGRAM)
29 | def test_pictogram_base(self):
30 | c = (
31 | Pictogram()
32 | .set_data(data=[opts.BaseDataOpts(id_="data", values=TEST_PICTOGRAM_DATA)])
33 | .register_svg(name="cat", svg_path=TEST_SVG_CONTENT)
34 | .set_pictogram_spec(
35 | name_field="name",
36 | value_field="value",
37 | svg="cat",
38 | pictogram_opts=opts.PictogramOpts(
39 | style=opts.BaseStyleOpts(
40 | fill={
41 | "scale": "color",
42 | "field": "name",
43 | },
44 | ),
45 | state=opts.BaseStateOpts(
46 | active_opts=opts.BaseStyleOpts(
47 | fill_opacity=0.8,
48 | stroke={
49 | "scale": "color",
50 | "field": "name",
51 | },
52 | line_width=2,
53 | ),
54 | hover_opts=opts.BaseStyleOpts(
55 | fill_opacity=0.8,
56 | stroke={
57 | "scale": "color",
58 | "field": "name",
59 | },
60 | line_width=2,
61 | ),
62 | ),
63 | ),
64 | )
65 | .set_global_options(
66 | series_field="name",
67 | color_opts=opts.ColorOpts(
68 | specified={
69 | "Yes": "#009A00",
70 | "So-so": "#FEB202",
71 | "Forbidden": "#FE3E00",
72 | "Horror": "#FE2B09",
73 | "undefined": "white",
74 | }
75 | ),
76 | interaction_opts=[
77 | opts.InteractionOpts(
78 | type_="element-active-by-legend",
79 | filter_field="name",
80 | )
81 | ],
82 | region_opts=[
83 | opts.RegionOpts(roam={"blank": True}),
84 | ],
85 | title_opts=opts.TitleOpts(text="Cat Stroking For Beginners"),
86 | legend_opts=opts.BaseLegendOpts(orient="top", is_filter=False),
87 | )
88 | )
89 | return c
90 |
--------------------------------------------------------------------------------
/test/test_pie.py:
--------------------------------------------------------------------------------
1 | import unittest
2 |
3 | from pyvchart import options as opts
4 | from pyvchart.charts import Pie
5 | from pyvchart.commons.utils import JsCode
6 | from pyvchart.globals import ChartType
7 |
8 | from test import chart_base_test
9 |
10 | TEST_PIE_DATA = [
11 | {"type": "oxygen", "value": "46.60"},
12 | {"type": "silicon", "value": "27.72"},
13 | {"type": "aluminum", "value": "8.13"},
14 | {"type": "iron", "value": "5"},
15 | {"type": "calcium", "value": "3.63"},
16 | {"type": "sodium", "value": "2.83"},
17 | {"type": "potassium", "value": "2.59"},
18 | {"type": "others", "value": "3.5"},
19 | ]
20 |
21 |
22 | class TestPieChart(unittest.TestCase):
23 |
24 | @chart_base_test(chart_type=ChartType.PIE)
25 | def test_pie_base(self):
26 | c = (
27 | Pie()
28 | .set_data(data=[opts.BaseDataOpts(values=TEST_PIE_DATA)])
29 | .set_pie_spec(
30 | outer_radius=0.8,
31 | value_field="value",
32 | category_field="type",
33 | label_opts=opts.LabelOpts(is_visible=True),
34 | )
35 | .set_global_options(
36 | title_opts=opts.TitleOpts(
37 | is_visible=True,
38 | text="Statistics of Surface Element Content",
39 | ),
40 | legend_opts=opts.BaseLegendOpts(
41 | is_visible=True,
42 | orient="left",
43 | ),
44 | tooltip_opts=opts.TooltipOpts(
45 | mark_opts=opts.TooltipCustomOpts(
46 | content=[
47 | opts.TooltipCustomStyleOpts(
48 | key=JsCode("datum => datum['type']"),
49 | value=JsCode("datum => datum['value'] + '%'"),
50 | )
51 | ]
52 | )
53 | ),
54 | )
55 | )
56 | return c
57 |
--------------------------------------------------------------------------------
/test/test_radar.py:
--------------------------------------------------------------------------------
1 | import unittest
2 |
3 | from pyvchart import options as opts
4 | from pyvchart.charts import Radar
5 | from pyvchart.globals import ChartType
6 |
7 | from test import chart_base_test
8 |
9 |
10 | TEST_RADAR_DATA = [
11 | {"key": "Strength", "value": 5},
12 | {"key": "Speed", "value": 5},
13 | {"key": "Shooting", "value": 3},
14 | {"key": "Endurance", "value": 5},
15 | {"key": "Precision", "value": 5},
16 | {"key": "Growth", "value": 5},
17 | ]
18 |
19 |
20 | class TestRadarChart(unittest.TestCase):
21 |
22 | @chart_base_test(chart_type=ChartType.RADAR)
23 | def test_radar_base(self):
24 | c = (
25 | Radar()
26 | .set_data(data=[opts.BaseDataOpts(values=TEST_RADAR_DATA)])
27 | .set_radar_spec(
28 | category_field="key",
29 | value_field="value",
30 | point_opts=opts.PointOpts(is_visible=False),
31 | area_opts=opts.AreaOpts(
32 | is_visible=True,
33 | state=opts.BaseStateOpts(
34 | hover_opts=opts.BaseStyleOpts(fill_opacity=0.5)
35 | ),
36 | ),
37 | line_opts=opts.LineOpts(style=opts.BaseStyleOpts(line_width=4)),
38 | )
39 | .set_global_options(
40 | axes_opts=[
41 | opts.AxesLinearOpts(
42 | min_=0,
43 | max_=8,
44 | base_axes_opts=opts.BaseAxesOpts(
45 | orient="radius",
46 | z_index=100,
47 | domain_line=opts.AxesDomainLineOpts(is_visible=False),
48 | label=opts.AxesLabelOpts(
49 | is_visible=True,
50 | space=0,
51 | style_opts=opts.BaseStyleOpts(
52 | stroke="#fff",
53 | line_width=4,
54 | ),
55 | ),
56 | grid=opts.AxesGridOpts(
57 | is_smooth=False,
58 | style_opts=opts.BaseStyleOpts(
59 | line_dash=[0],
60 | ),
61 | ),
62 | ),
63 | ),
64 | opts.AxesBandOpts(
65 | base_axes_opts=opts.BaseAxesOpts(
66 | orient="angle",
67 | z_index=50,
68 | tick=opts.AxesTickOpts(is_visible=False),
69 | domain_line=opts.AxesDomainLineOpts(is_visible=False),
70 | label=opts.AxesLabelOpts(space=20),
71 | grid=opts.AxesGridOpts(
72 | style_opts=opts.BaseStyleOpts(
73 | line_dash=[0],
74 | )
75 | ),
76 | ),
77 | ),
78 | ]
79 | )
80 | )
81 | return c
82 |
--------------------------------------------------------------------------------
/test/test_range_area.py:
--------------------------------------------------------------------------------
1 | import unittest
2 |
3 | from pyvchart import options as opts
4 | from pyvchart.charts import RangeArea
5 | from pyvchart.globals import ChartType
6 |
7 | from test import chart_base_test
8 |
9 |
10 | TEST_RANGE_AREA_DATA = [
11 | {"type": "Category One", "min": 76, "max": 100},
12 | {"type": "Category Two", "min": 56, "max": 108},
13 | {"type": "Category Three", "min": 38, "max": 129},
14 | {"type": "Category Four", "min": 58, "max": 155},
15 | {"type": "Category Five", "min": 45, "max": 120},
16 | {"type": "Category Six", "min": 23, "max": 99},
17 | {"type": "Category Seven", "min": 18, "max": 56},
18 | {"type": "Category Eight", "min": 18, "max": 34},
19 | ]
20 |
21 |
22 | class TestRangeAreaChart(unittest.TestCase):
23 |
24 | @chart_base_test(chart_type=ChartType.RANGE_AREA)
25 | def test_range_area_base(self):
26 | c = (
27 | RangeArea()
28 | .set_data(data=[opts.BaseDataOpts(values=TEST_RANGE_AREA_DATA)])
29 | .set_xy_field(x_field_name="type", y_field_name=["min", "max"])
30 | .set_range_area_spec(
31 | area_opts=opts.AreaOpts(style=opts.BaseStyleOpts(fill_opacity=0.15)),
32 | )
33 | .set_global_options(
34 | is_stack=False,
35 | axes_opts=[
36 | opts.AxesLinearOpts(
37 | base_axes_opts=opts.BaseAxesOpts(
38 | orient="left",
39 | label=opts.AxesLabelOpts(is_visible=True),
40 | ),
41 | ),
42 | ],
43 | crosshair_opts=opts.CrossHairOpts(
44 | x_field=opts.CrossHairFieldOpts(is_visible=True),
45 | ),
46 | )
47 | )
48 | return c
49 |
--------------------------------------------------------------------------------
/test/test_range_column.py:
--------------------------------------------------------------------------------
1 | import unittest
2 |
3 | from pyvchart import options as opts
4 | from pyvchart.charts import RangeColumn
5 | from pyvchart.globals import ChartType
6 |
7 | from test import chart_base_test
8 |
9 |
10 | TEST_RANGE_COLUMN_DATA = [
11 | {"type": "Category One", "min": 76, "max": 100},
12 | {"type": "Category Two", "min": 56, "max": 108},
13 | {"type": "Category Three", "min": 38, "max": 129},
14 | {"type": "Category Four", "min": 58, "max": 155},
15 | {"type": "Category Five", "min": 45, "max": 120},
16 | {"type": "Category Six", "min": 23, "max": 99},
17 | {"type": "Category Seven", "min": 18, "max": 56},
18 | {"type": "Category Eight", "min": 18, "max": 34},
19 | ]
20 |
21 |
22 | class TestRangeColumnChart(unittest.TestCase):
23 |
24 | @chart_base_test(chart_type=ChartType.RANGE_COLUMN)
25 | def test_range_column_base(self):
26 | c = (
27 | RangeColumn()
28 | .set_data(data=[opts.BaseDataOpts(values=TEST_RANGE_COLUMN_DATA)])
29 | .set_range_column_spec(
30 | direction="horizontal",
31 | label_opts=opts.LabelOpts(is_visible=True),
32 | )
33 | .set_xy_field(x_field_name=["min", "max"], y_field_name="type")
34 | )
35 | return c
36 |
--------------------------------------------------------------------------------
/test/test_rose.py:
--------------------------------------------------------------------------------
1 | import unittest
2 |
3 | from pyvchart import options as opts
4 | from pyvchart.charts import Rose
5 | from pyvchart.globals import ChartType
6 |
7 | from test import chart_base_test
8 |
9 |
10 | TEST_ROSE_DATA = [
11 | {"value": "159", "type": "Tradition Industries"},
12 | {"value": "50", "type": "Business Companies"},
13 | {"value": "13", "type": "Customer-facing Companies"},
14 | ]
15 |
16 |
17 | class TestRoseChart(unittest.TestCase):
18 |
19 | @chart_base_test(chart_type=ChartType.ROSE)
20 | def test_rose_base(self):
21 | c = (
22 | Rose()
23 | .set_data(data=[opts.BaseDataOpts(values=TEST_ROSE_DATA)])
24 | .set_rose_spec(
25 | outer_radius=0.8,
26 | inner_radius=0.2,
27 | category_field="type",
28 | value_field="value",
29 | label_opts=opts.LabelOpts(
30 | is_visible=True,
31 | ),
32 | )
33 | .set_global_options(
34 | series_field="type",
35 | )
36 | )
37 | return c
38 |
--------------------------------------------------------------------------------
/test/test_utils.py:
--------------------------------------------------------------------------------
1 | import unittest
2 |
3 | from pyvchart.commons import utils
4 | from pyvchart.datasets import EXTRA
5 |
6 |
7 | class TestUtils(unittest.TestCase):
8 |
9 | def test_utils_produce_require_dict_with_extra(self):
10 | global EXTRA
11 | EXTRA["https://api.baidu.com"] = {
12 | "https://api.baidu.com/test.min": ["https://api.baidu.com/test.min", "css"]
13 | }
14 | cfg_0 = utils.produce_require_dict(
15 | utils.OrderedSet("https://api.baidu.com/test.min"),
16 | "https://example.com",
17 | )
18 | self.assertEqual(cfg_0["libraries"], ["'https://api.baidu.com/test.min'"])
19 |
20 | def test_js_code(self):
21 | fn = "function() { console.log('test_js_code') }"
22 | js_code = utils.JsCode(fn)
23 | self.assertEqual(js_code.js_code, "--x_x--0_0--{}--x_x--0_0--".format(fn))
24 |
25 | def test_ordered_set(self):
26 | s = utils.OrderedSet()
27 | s.add("a", "b", "c")
28 | self.assertEqual(s.items, ["a", "b", "c"])
29 |
30 | def test_utils_remove_key_with_none_value(self):
31 | mock_data = [1, 2, 3]
32 | list_res = utils.remove_key_with_none_value(mock_data)
33 | assert list_res == mock_data
34 |
35 | mock_data_none = None
36 | none_res = utils.remove_key_with_none_value(mock_data_none)
37 | assert none_res == mock_data_none
38 |
39 | def test_utils_remove_key_with_none_value_raise_value_error(self):
40 | import numpy as np
41 | import pandas as pd
42 |
43 | mock_data = [1, 2, 3, 4, 5, 6, 7, 8, 9, 10, 11]
44 | mock_numpy_data = np.array(mock_data)
45 | tmp_df = pd.DataFrame({"x": mock_data})
46 | mock_series_data = tmp_df["x"]
47 | try:
48 | utils.remove_key_with_none_value({"data": mock_numpy_data})
49 | except ValueError:
50 | pass
51 |
52 | try:
53 | utils.remove_key_with_none_value({"data": mock_series_data})
54 | except ValueError:
55 | pass
56 |
57 | def test_clean_dict_empty_string_removes_key(self):
58 | input_dict = {"key": ""}
59 | result = dict(utils.remove_key_with_none_value(input_dict))
60 | self.assertNotIn("key", result)
61 |
62 | def test_clean_array_value_is_list_tuple_set(self):
63 | input_ = {"x": [[1, 2, 3]]}
64 | result = utils.remove_key_with_none_value(input_)
65 | self.assertEqual(result["x"], [[1, 2, 3]])
66 |
67 | input_ = {"x": [(1, 2, 3)]}
68 | result = utils.remove_key_with_none_value(input_)
69 | self.assertEqual(result["x"], [[1, 2, 3]])
70 |
71 | input_ = {"x": [{1, 2, 3}]}
72 | result = utils.remove_key_with_none_value(input_)
73 | self.assertEqual(result["x"], [[1, 2, 3]])
74 |
--------------------------------------------------------------------------------
/test/test_venn.py:
--------------------------------------------------------------------------------
1 | import unittest
2 |
3 | from pyvchart import options as opts
4 | from pyvchart.charts import Venn
5 | from pyvchart.commons.utils import JsCode
6 | from pyvchart.globals import ChartType
7 |
8 | from test import chart_base_test
9 |
10 |
11 | TEST_VENN_DATA = [
12 | {"sets": ["A"], "value": 8},
13 | {"sets": ["B"], "value": 10},
14 | {"sets": ["C"], "value": 12},
15 | {"sets": ["A", "B"], "value": 4},
16 | {"sets": ["A", "C"], "value": 4},
17 | {"sets": ["B", "C"], "value": 4},
18 | {"sets": ["A", "B", "C"], "value": 2},
19 | ]
20 |
21 |
22 | class TestVennChart(unittest.TestCase):
23 |
24 | @chart_base_test(chart_type=ChartType.VENN)
25 | def test_venn_chart(self):
26 | c = (
27 | Venn()
28 | .set_data(data=[opts.BaseDataOpts(values=TEST_VENN_DATA)])
29 | .set_venn_spec(
30 | category_field="sets",
31 | value_field="value",
32 | )
33 | .set_global_options(
34 | series_field="sets",
35 | legend_opts=[
36 | opts.BaseLegendOpts(
37 | is_visible=True, position="middle", orient="bottom"
38 | ),
39 | ],
40 | )
41 | )
42 | return c
43 |
--------------------------------------------------------------------------------
/test/test_waterfall.py:
--------------------------------------------------------------------------------
1 | import unittest
2 |
3 | from pyvchart import options as opts
4 | from pyvchart.charts import Waterfall
5 | from pyvchart.commons.utils import JsCode
6 | from pyvchart.globals import ChartType
7 |
8 | from test import chart_base_test
9 |
10 |
11 | TEST_WATERFALL_DATA = [
12 | {"x": "Feb.4", "total": True, "value": 45},
13 | {"x": "Feb.11", "y": -5},
14 | {"x": "Feb.20", "y": 2},
15 | {"x": "Feb.25", "y": -2},
16 | {"x": "Mar.4", "y": 2},
17 | {"x": "Mar.11", "y": 2},
18 | {"x": "Mar.19", "y": -2},
19 | {"x": "Mar.26", "y": 1},
20 | {"x": "Apr.1", "y": 1},
21 | {"x": "Apr.8", "y": 1},
22 | {"x": "Apr.15", "y": 2},
23 | {"x": "Apr.22", "y": 1},
24 | {"x": "Apr.29", "y": -2},
25 | {"x": "May.6", "y": -1},
26 | {"x": '"total"', "total": True},
27 | ]
28 |
29 |
30 | class TestWaterfallChart(unittest.TestCase):
31 |
32 | @chart_base_test(chart_type=ChartType.WATERFALL)
33 | def test_waterfall_base(self):
34 | c = (
35 | Waterfall()
36 | .set_data(data=[opts.BaseDataOpts(id_="id0", values=TEST_WATERFALL_DATA)])
37 | .set_xy_field(x_field_name="x", y_field_name="y")
38 | .set_waterfall_spec(
39 | stack_label_opts=opts.LabelOpts(
40 | value_type="absolute",
41 | format_method=JsCode("text => { return text + '%'; }"),
42 | ),
43 | total_opts=opts.WaterfallTotalFieldOpts(
44 | tag_field="total",
45 | value_field="value",
46 | ),
47 | )
48 | .set_global_options(
49 | legend_opts=opts.BaseLegendOpts(is_visible=True, orient="bottom"),
50 | axes_opts=[
51 | opts.AxesLinearOpts(
52 | min_=30,
53 | max_=50,
54 | base_axes_opts=opts.BaseAxesOpts(
55 | orient="left",
56 | title=opts.TitleOpts(is_visible=True, text="favorability"),
57 | label=opts.AxesLabelOpts(
58 | format_method=JsCode("v => { return v + '%'; }")
59 | ),
60 | ),
61 | ),
62 | opts.AxesBandOpts(
63 | base_axes_opts=opts.BaseAxesOpts(
64 | orient="bottom",
65 | label=opts.AxesLabelOpts(is_visible=True),
66 | title=opts.TitleOpts(is_visible=True, text="data"),
67 | ),
68 | padding_inner=0.4,
69 | ),
70 | ],
71 | )
72 | )
73 | return c
74 |
--------------------------------------------------------------------------------
/test/test_wordcloud3d.py:
--------------------------------------------------------------------------------
1 | import unittest
2 |
3 | from pyvchart import options as opts
4 | from pyvchart.charts import WordCloud3D
5 | from pyvchart.commons.utils import JsCode
6 | from pyvchart.globals import ChartType
7 |
8 | from test import chart_base_test
9 |
10 |
11 | TEST_WORDCLOUD3D_DATA = [
12 | {"challenge_name": "刘浩存", "sum_count": 957},
13 | {"challenge_name": "刘昊然", "sum_count": 942},
14 | {"challenge_name": "喜欢", "sum_count": 842},
15 | {"challenge_name": "真的", "sum_count": 828},
16 | {"challenge_name": "四海", "sum_count": 665},
17 | {"challenge_name": "好看", "sum_count": 627},
18 | {"challenge_name": "评论", "sum_count": 574},
19 | {"challenge_name": "好像", "sum_count": 564},
20 | {"challenge_name": "沈腾", "sum_count": 554},
21 | {"challenge_name": "不像", "sum_count": 540},
22 | {"challenge_name": "多少钱", "sum_count": 513},
23 | {"challenge_name": "韩寒", "sum_count": 513},
24 | {"challenge_name": "不知道", "sum_count": 499},
25 | {"challenge_name": "感觉", "sum_count": 499},
26 | {"challenge_name": "尹正", "sum_count": 495},
27 | {"challenge_name": "不看", "sum_count": 487},
28 | {"challenge_name": "奥特之父", "sum_count": 484},
29 | {"challenge_name": "阿姨", "sum_count": 482},
30 | {"challenge_name": "支持", "sum_count": 482},
31 | {"challenge_name": "父母", "sum_count": 479},
32 | {"challenge_name": "一条", "sum_count": 462},
33 | {"challenge_name": "女主", "sum_count": 456},
34 | {"challenge_name": "确实", "sum_count": 456},
35 | {"challenge_name": "票房", "sum_count": 456},
36 | {"challenge_name": "无语", "sum_count": 443},
37 | {"challenge_name": "干干净净", "sum_count": 443},
38 | {"challenge_name": "为啥", "sum_count": 426},
39 | {"challenge_name": "爱情", "sum_count": 425},
40 | {"challenge_name": "喜剧", "sum_count": 422},
41 | {"challenge_name": "春节", "sum_count": 414},
42 | {"challenge_name": "剧情", "sum_count": 414},
43 | {"challenge_name": "人生", "sum_count": 409},
44 | {"challenge_name": "风格", "sum_count": 408},
45 | {"challenge_name": "演员", "sum_count": 403},
46 | {"challenge_name": "成长", "sum_count": 403},
47 | {"challenge_name": "玩意", "sum_count": 402},
48 | {"challenge_name": "文学", "sum_count": 397},
49 | ]
50 |
51 | TEST_MASK_SHAPE = "https://lf9-dp-fe-cms-tos.byteorg.com/obj/bit-cloud/log.jpeg"
52 |
53 |
54 | class TestWordCloud3DChart(unittest.TestCase):
55 |
56 | @chart_base_test(chart_type=ChartType.WORDCLOUD3D)
57 | def test_wordcloud3d_base(self):
58 | c = (
59 | WordCloud3D(
60 | render_opts=opts.RenderOpts(
61 | is_disable_dirty_bounds=True,
62 | options3d_opts=opts.Render3DOpts(is_enable=True),
63 | )
64 | )
65 | .set_data(
66 | data=[opts.BaseDataOpts(id_="data", values=TEST_WORDCLOUD3D_DATA)]
67 | )
68 | .set_wordcloud3d_spec(
69 | name_field="challenge_name",
70 | value_field="sum_count",
71 | mask_shape=TEST_MASK_SHAPE,
72 | wordcloud_opts=opts.WordCloudOpts(
73 | style=opts.BaseStyleOpts(is_keep_dir_in_3d=False),
74 | ),
75 | filling_word_opts=opts.WordCloud3DFillingWordOpts(
76 | style=opts.BaseStyleOpts(is_keep_dir_in_3d=False),
77 | ),
78 | depth_3d=1000,
79 | )
80 | .set_global_options(
81 | series_field="challenge_name",
82 | )
83 | )
84 | return c
85 |
--------------------------------------------------------------------------------
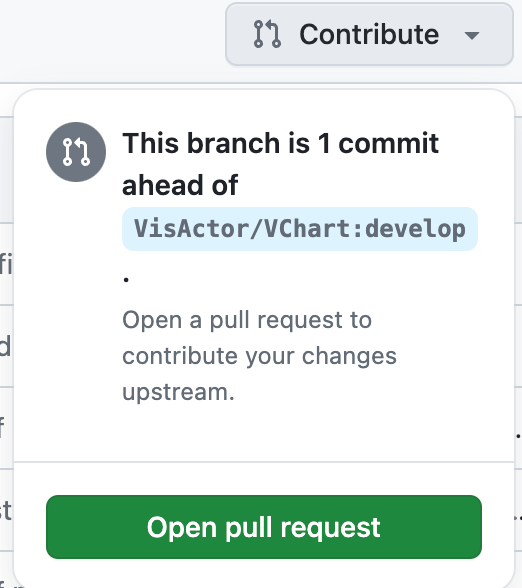 117 |
117 | 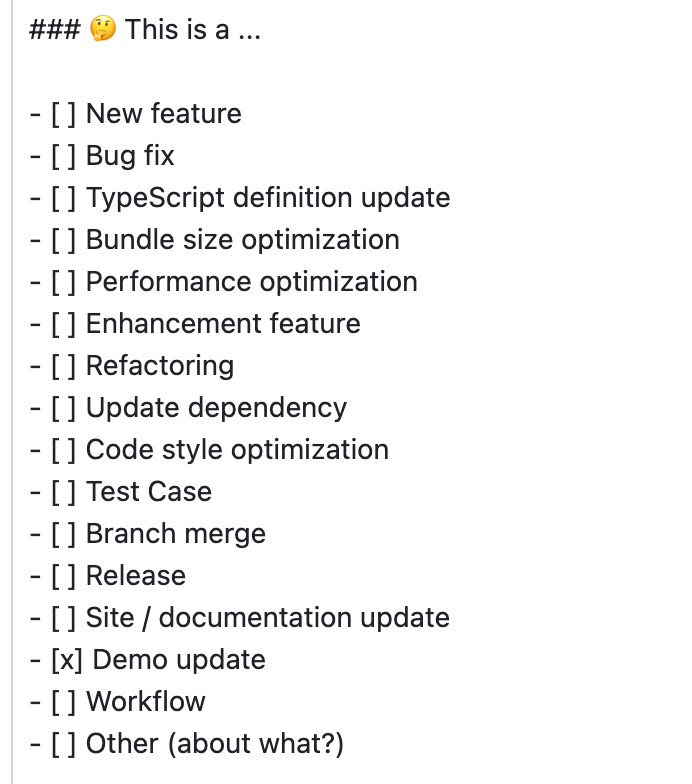 124 |
124 |  130 |
130 |  136 |
136 |