├── img
├── schema.png
├── counter_1.png
├── formula_std.png
├── counter_2_top.png
├── formula_idf_1.png
├── formula_mean.png
├── formula_pmi_1.png
├── formula_pmi_2.png
├── formula_rmse.png
├── sql_4_example.png
├── sql_5_example.png
├── sql_6_example.png
├── sql_7_example.png
├── sql_8_example.png
├── sql_9_example.png
├── flip_binary_tree.png
├── formula_jaccard.png
├── sql_10_example.png
└── sql_11_example.png
├── README.md
├── awesome.md
├── technical.md
└── theory.md
/img/schema.png:
--------------------------------------------------------------------------------
https://raw.githubusercontent.com/bexxmodd/data-science-interviews/master/img/schema.png
--------------------------------------------------------------------------------
/img/counter_1.png:
--------------------------------------------------------------------------------
https://raw.githubusercontent.com/bexxmodd/data-science-interviews/master/img/counter_1.png
--------------------------------------------------------------------------------
/img/formula_std.png:
--------------------------------------------------------------------------------
https://raw.githubusercontent.com/bexxmodd/data-science-interviews/master/img/formula_std.png
--------------------------------------------------------------------------------
/img/counter_2_top.png:
--------------------------------------------------------------------------------
https://raw.githubusercontent.com/bexxmodd/data-science-interviews/master/img/counter_2_top.png
--------------------------------------------------------------------------------
/img/formula_idf_1.png:
--------------------------------------------------------------------------------
https://raw.githubusercontent.com/bexxmodd/data-science-interviews/master/img/formula_idf_1.png
--------------------------------------------------------------------------------
/img/formula_mean.png:
--------------------------------------------------------------------------------
https://raw.githubusercontent.com/bexxmodd/data-science-interviews/master/img/formula_mean.png
--------------------------------------------------------------------------------
/img/formula_pmi_1.png:
--------------------------------------------------------------------------------
https://raw.githubusercontent.com/bexxmodd/data-science-interviews/master/img/formula_pmi_1.png
--------------------------------------------------------------------------------
/img/formula_pmi_2.png:
--------------------------------------------------------------------------------
https://raw.githubusercontent.com/bexxmodd/data-science-interviews/master/img/formula_pmi_2.png
--------------------------------------------------------------------------------
/img/formula_rmse.png:
--------------------------------------------------------------------------------
https://raw.githubusercontent.com/bexxmodd/data-science-interviews/master/img/formula_rmse.png
--------------------------------------------------------------------------------
/img/sql_4_example.png:
--------------------------------------------------------------------------------
https://raw.githubusercontent.com/bexxmodd/data-science-interviews/master/img/sql_4_example.png
--------------------------------------------------------------------------------
/img/sql_5_example.png:
--------------------------------------------------------------------------------
https://raw.githubusercontent.com/bexxmodd/data-science-interviews/master/img/sql_5_example.png
--------------------------------------------------------------------------------
/img/sql_6_example.png:
--------------------------------------------------------------------------------
https://raw.githubusercontent.com/bexxmodd/data-science-interviews/master/img/sql_6_example.png
--------------------------------------------------------------------------------
/img/sql_7_example.png:
--------------------------------------------------------------------------------
https://raw.githubusercontent.com/bexxmodd/data-science-interviews/master/img/sql_7_example.png
--------------------------------------------------------------------------------
/img/sql_8_example.png:
--------------------------------------------------------------------------------
https://raw.githubusercontent.com/bexxmodd/data-science-interviews/master/img/sql_8_example.png
--------------------------------------------------------------------------------
/img/sql_9_example.png:
--------------------------------------------------------------------------------
https://raw.githubusercontent.com/bexxmodd/data-science-interviews/master/img/sql_9_example.png
--------------------------------------------------------------------------------
/img/flip_binary_tree.png:
--------------------------------------------------------------------------------
https://raw.githubusercontent.com/bexxmodd/data-science-interviews/master/img/flip_binary_tree.png
--------------------------------------------------------------------------------
/img/formula_jaccard.png:
--------------------------------------------------------------------------------
https://raw.githubusercontent.com/bexxmodd/data-science-interviews/master/img/formula_jaccard.png
--------------------------------------------------------------------------------
/img/sql_10_example.png:
--------------------------------------------------------------------------------
https://raw.githubusercontent.com/bexxmodd/data-science-interviews/master/img/sql_10_example.png
--------------------------------------------------------------------------------
/img/sql_11_example.png:
--------------------------------------------------------------------------------
https://raw.githubusercontent.com/bexxmodd/data-science-interviews/master/img/sql_11_example.png
--------------------------------------------------------------------------------
/README.md:
--------------------------------------------------------------------------------
1 | # Data Science Interview Questions
2 |
3 | Data science interview questions - with answers
4 |
5 | The answers are given by the community
6 |
7 | * If you know how to answer a question - please create a PR with the answer
8 | * If you see a mistake - please create a PR with a fix
9 |
10 | For updates, follow me on Twitter ([@Al_Grigor](https://twitter.com/Al_Grigor)) and on LinkedIn ([agrigorev](https://www.linkedin.com/in/agrigorev))
11 |
12 |
13 | ## Questions by category
14 |
15 | * Theoretical questions: [theory.md](theory.md) (linear models, trees, neural networks and others)
16 | * Technical questions: [technical.md](technical.md) (SQL, Python, coding)
17 | * More to come
18 |
19 | ## Other useful things
20 |
21 | * Awesome data science interview questions and other resources: [awesome.md](awesome.md)
22 |
--------------------------------------------------------------------------------
/awesome.md:
--------------------------------------------------------------------------------
1 | ## Awesome Data Science Inteview Resources
2 |
3 | A list of links with data science interview questions and other userful resources.
4 |
5 | Contributions are welcome!
6 |
7 | ### Questions and answers
8 |
9 | * This repository: https://github.com/alexeygrigorev/data-science-interviews
10 | * [Data science interview questions and answers](https://github.com/iamtodor/data-science-interview-questions-and-answers) by [iamtodor](https://github.com/iamtodor)
11 | * [120+ data science interview questions](https://github.com/kojino/120-Data-Science-Interview-Questions) by [kojino](https://github.com/kojino/)
12 | * [40 Interview Questions asked at Startups in Machine Learning / Data Science](https://www.analyticsvidhya.com/blog/2016/09/40-interview-questions-asked-at-startups-in-machine-learning-data-science/)
13 | * [The Most Comprehensive Data Science & Machine Learning Interview Guide You’ll Ever Need](https://www.analyticsvidhya.com/blog/2018/06/comprehensive-data-science-machine-learning-interview-guide/)
14 | * [Data Science Recruitment Challenges](https://github.com/alexeygrigorev/datascience-recruitment-challenges) - take-home assignments for data science positions
15 |
16 | ### Questions
17 |
18 | * [The toughest data scince interview](https://www.linkedin.com/posts/agrigorev_datascience-machinelearning-ml-activity-6630138658219409409-bTWh) - a post on LinkedIn
19 | * [Data Science Interview Questions](https://www.itshared.org/2015/10/data-science-interview-questions.html) from [ITShared](https://www.itshared.org/) - from 2015, but many of them are still valid
20 |
21 |
22 | ### Other useful links
23 |
24 | * [How does a technical screening for data science positions look like?](https://www.linkedin.com/posts/agrigorev_datascience-machinelearning-ml-activity-6631245015718866944-Vb87) - a post on LinkedIn
25 | * [How to prepare for Research Engineer (ML) interview?](https://www.linkedin.com/posts/agrigorev_machinelearning-ml-interviews-activity-6622232556311990272-_dAN) - a post on LinkedIn
26 | * [How to prepare for a data science interview?](https://www.quora.com/How-do-I-prepare-for-a-data-scientist-interview) - 100+ answers on Quora
27 | * [How to Get a Data Science Job: A Ridiculously Specific Guide](http://brohrer.github.io/get_data_science_job.html)
28 | * [How to Succeed in A Data Science Interview](https://blog.pramp.com/how-to-succeed-in-a-data-science-interview-27553ab69d8a)
29 | * [Machine Learning Systems Design](https://github.com/chiphuyen/machine-learning-systems-design)
30 | * [I interviewed at five top companies in Silicon Valley in five days, and luckily got five job offers](https://medium.com/@XiaohanZeng/i-interviewed-at-five-top-companies-in-silicon-valley-in-five-days-and-luckily-got-five-job-offers-25178cf74e0f)
31 |
32 |
33 | ### Negotiation
34 |
35 | * [Ten Rules for Negotiating a Job Offer](https://haseebq.com/my-ten-rules-for-negotiating-a-job-offer/)
36 | * [Career Advice and Salary Negotiations: Move Early and Move Often](https://thehftguy.com/2017/01/23/career-advice-and-salary-negotiations-move-early-and-move-often/)
37 |
--------------------------------------------------------------------------------
/technical.md:
--------------------------------------------------------------------------------
1 | # Technical interview questions
2 |
3 | The list is based on this post: https://hackernoon.com/technical-data-science-interview-questions-sql-and-coding-jv1k32bf
4 |
5 | Categories:
6 |
7 | * SQL
8 | * Coding
9 | * Algorithmic
10 |
11 |
12 | ## SQL
13 |
14 | Suppose we have the following schema with two tables: Ads and Events
15 |
16 | * Ads(ad_id, campaign_id, status)
17 | * status cound be active or inactive
18 | * Events(event_id, ad_id, source, event_type, date, hour)
19 | * event_type could be impression, click, conversion
20 |
21 |  22 |
23 |
24 | Write SQL queries to extract the following information:
25 |
26 | **1)** The number of active ads.
27 |
28 | ```sql
29 | SELECT count(*) FROM Ads WHERE status = 'active';
30 | ```
31 |
32 |
22 |
23 |
24 | Write SQL queries to extract the following information:
25 |
26 | **1)** The number of active ads.
27 |
28 | ```sql
29 | SELECT count(*) FROM Ads WHERE status = 'active';
30 | ```
31 |
32 |
33 |
34 |
35 | **2)** All active campaigns. A campaign is active if there’s at least one active ad.
36 |
37 | ```sql
38 | SELECT DISTINCT a.campaign_id
39 | FROM Ads AS a
40 | WHERE a.status = 'active';
41 | ```
42 |
43 |
44 |
45 | **3)** The number of active campaigns.
46 |
47 | ```sql
48 | SELECT COUNT(DISTINCT a.campaign_id)
49 | FROM Ads AS a
50 | WHERE a.status = 'active';
51 | ```
52 |
53 |
54 |
55 | **4)** The number of events per each ad — broken down by event type.
56 |
57 |  58 |
59 | ```sql
60 | SELECT a.ad_id, e.event_type, count(*) as "count"
61 | FROM Ads AS a
62 | JOIN Events AS e
63 | ON a.ad_id = e.ad_id
64 | GROUP BY a.ad_id, e.event_type
65 | ORDER BY a.ad_id, "count" DESC;
66 | ```
67 |
68 |
58 |
59 | ```sql
60 | SELECT a.ad_id, e.event_type, count(*) as "count"
61 | FROM Ads AS a
62 | JOIN Events AS e
63 | ON a.ad_id = e.ad_id
64 | GROUP BY a.ad_id, e.event_type
65 | ORDER BY a.ad_id, "count" DESC;
66 | ```
67 |
68 |
69 |
70 | **5)** The number of events over the last week per each active ad — broken down by event type and date (most recent first).
71 |
72 |  73 |
74 | ```sql
75 | SELECT a.ad_id, e.event_type, e.date, count(*) as "count"
76 | FROM Ads AS a
77 | JOIN Events AS e
78 | ON a.ad_id = e.ad_id
79 | WHERE a.status = 'active'
80 | GROUP BY a.ad_id, e.event_type, e.date
81 | ORDER BY e.date ASC, "count" DESC;
82 | ```
83 |
84 |
73 |
74 | ```sql
75 | SELECT a.ad_id, e.event_type, e.date, count(*) as "count"
76 | FROM Ads AS a
77 | JOIN Events AS e
78 | ON a.ad_id = e.ad_id
79 | WHERE a.status = 'active'
80 | GROUP BY a.ad_id, e.event_type, e.date
81 | ORDER BY e.date ASC, "count" DESC;
82 | ```
83 |
84 |
85 |
86 | **6)** The number of events per campaign — by event type.
87 |
88 |  89 |
90 |
91 | Answer here
92 |
93 |
89 |
90 |
91 | Answer here
92 |
93 |
94 |
95 | **7)** The number of events over the last week per each campaign — broken down by date (most recent first).
96 |
97 |  98 |
99 | Answer here
100 |
101 |
98 |
99 | Answer here
100 |
101 |
102 |
103 | **8)** CTR (click-through rate) for each ad. CTR = number of impressions / number of clicks.
104 |
105 |  106 |
107 | Answer here
108 |
109 |
106 |
107 | Answer here
108 |
109 |
110 |
111 | **9)** CVR (conversion rate) for each ad. CVR = number of clicks / number of installs.
112 |
113 |  114 |
115 | Answer here
116 |
117 |
114 |
115 | Answer here
116 |
117 |
118 |
119 | **10)** CTR and CVR for each ad broken down by day and hour (most recent first).
120 |
121 |  122 |
123 | Answer here
124 |
125 |
122 |
123 | Answer here
124 |
125 |
126 |
127 | **11)** CTR for each ad broken down by source and day
128 |
129 |  130 |
131 | Answer here
132 |
133 |
130 |
131 | Answer here
132 |
133 |
134 |
135 |
136 | ## Coding (Python)
137 |
138 | **1) FizzBuzz.** Print numbers from 1 to 100
139 |
140 | * If it’s a multiplier of 3, print “Fizz”
141 | * If it’s a multiplier of 5, print “Buzz”
142 | * If both 3 and 5 — “Fizz Buzz"
143 | * Otherwise, print the number itself
144 |
145 | Example of output: 1, 2, Fizz, 4, Buzz, Fizz, 7, 8, Fizz, Buzz, 11, Fizz, 13, 14, Fizz Buzz, 16, 17, Fizz, 19, Buzz, Fizz, 22, 23, Fizz, Buzz, 26, Fizz, 28, 29, Fizz Buzz, 31, 32, Fizz, 34, Buzz, Fizz, ...
146 |
147 | ```python
148 | for i in range(1, 101):
149 | if i % 3 == 0 and i % 5 == 0:
150 | print('Fizz Buzz')
151 | elif i % 3 == 0:
152 | print('Fizz')
153 | elif i % 5 == 0:
154 | print('Buzz')
155 | else:
156 | print(i)
157 | ```
158 |
159 |
160 |
161 | **2) Factorial**. Calculate a factorial of a number
162 |
163 | * `factorial(5)` = 5! = 1 * 2 * 3 * 4 * 5 = 120
164 | * `factorial(10)` = 10! = 1 * 2 * 3 * 4 * 5 * 6 * 7 * 8 * 9 * 10 = 3628800
165 |
166 | ```python
167 | def factorial(n):
168 | result = 1
169 | for i in range(2, n + 1):
170 | result *= i
171 | return result
172 | ```
173 |
174 | We can also write this function using recursion:
175 |
176 | ```python
177 | def factorial(n: int):
178 | if n == 0 or n == 1:
179 | return 1
180 | else:
181 | return n * factorial(n - 1)
182 | ```
183 |
184 |
185 |
186 |
187 | **3) Mean**. Compute the mean of number in a list
188 |
189 | * `mean([4, 36, 45, 50, 75]) = 42`
190 | * `mean([]) = NaN` (use `float('NaN')`)
191 |
192 |  193 |
194 | ```python
195 | def mean(numbers):
196 | if len(numbers) > 0:
197 | return sum(numbers) / len(numbers)
198 | return float('NaN')
199 | ```
200 |
201 |
193 |
194 | ```python
195 | def mean(numbers):
196 | if len(numbers) > 0:
197 | return sum(numbers) / len(numbers)
198 | return float('NaN')
199 | ```
200 |
201 |
202 |
203 | **4) STD**. Calculate the standard deviation of elements in a list.
204 |
205 | * `std([1, 2, 3, 4]) = 1.29`
206 | * `std([1]) = NaN`
207 | * `std([]) = NaN`
208 |
209 |  210 |
211 | ```python
212 | from math import sqrt
213 |
214 | def std_dev(numbers):
215 | if len(numbers) > 0:
216 | avg = mean(numbers)
217 | var = sum([(i - avg) ** 2 for i in numbers]) / len(numbers)
218 | ans = sqrt(var)
219 | return ans
220 | return float('NaN')
221 | ```
222 |
223 |
210 |
211 | ```python
212 | from math import sqrt
213 |
214 | def std_dev(numbers):
215 | if len(numbers) > 0:
216 | avg = mean(numbers)
217 | var = sum([(i - avg) ** 2 for i in numbers]) / len(numbers)
218 | ans = sqrt(var)
219 | return ans
220 | return float('NaN')
221 | ```
222 |
223 |
224 |
225 | **5) RMSE**. Calculate the RMSE (root mean squared error) of a model. The function takes in two lists: one with actual values, one with predictions.
226 |
227 | * `rmse([1, 2], [1, 2]) = 0`
228 | * `rmse([1, 2, 3], [3, 2, 1]) = 1.63`
229 |
230 |  231 |
232 | ```python
233 | import math
234 |
235 | def rmse(y_true, y_pred):
236 | assert len(y_true) == len(y_pred), 'different sizes of the arguments'
237 | squares = sum((x - y)**2 for x, y in zip(y_true, y_pred))
238 | return math.sqrt(squares / len(y_true))
239 | ```
240 |
241 |
231 |
232 | ```python
233 | import math
234 |
235 | def rmse(y_true, y_pred):
236 | assert len(y_true) == len(y_pred), 'different sizes of the arguments'
237 | squares = sum((x - y)**2 for x, y in zip(y_true, y_pred))
238 | return math.sqrt(squares / len(y_true))
239 | ```
240 |
241 |
242 |
243 | **6) Remove duplicates**. Remove duplicates in list. The list is not sorted and the order of elements from the original list should be preserved.
244 |
245 | * `[1, 2, 3, 1]` ⇒ `[1, 2, 3]`
246 | * `[1, 3, 2, 1, 5, 3, 5, 1, 4]` ⇒ `[1, 3, 2, 5, 4]`
247 |
248 | ```python
249 | def remove_duplicates(lst):
250 | new_list = []
251 | mentioned_values = set()
252 | for elem in lst:
253 | if elem not in mentioned_values:
254 | new_list.append(elem)
255 | mentioned_values.add(elem)
256 | return new_list
257 | ```
258 |
259 |
260 |
261 | **7) Count**. Count how many times each element in a list occurs.
262 |
263 | `[1, 3, 2, 1, 5, 3, 5, 1, 4]` ⇒
264 | * 1: 3 times
265 | * 2: 1 time
266 | * 3: 2 times
267 | * 4: 1 time
268 | * 5: 2 times
269 |
270 | ```python
271 | numbers = [1, 3, 2, 1, 5, 3, 5, 1, 4]
272 | counter = dict()
273 | for elem in numbers:
274 | counter[elem] = counter.get(elem, 0) + 1
275 | ```
276 | or
277 | ```python
278 | from collections import Counter
279 |
280 | numbers = [1, 3, 2, 1, 5, 3, 5, 1, 4]
281 | counter = Counter(numbers)
282 | ```
283 |
284 |
285 |
286 | **8) Palindrome**. Is string a palindrome? A palindrome is a word which reads the same backward as forwards.
287 |
288 | * “ololo” ⇒ Yes
289 | * “cafe” ⇒ No
290 |
291 | ```python
292 | def is_palindrome(s):
293 | return s == s[::-1]
294 | ```
295 | or
296 | ```python
297 | def is_palindrome(s):
298 | for i in range(len(s) // 2):
299 | if s[i] != s[-i - 1]:
300 | return False
301 | return True
302 | ```
303 |
304 |
305 |
306 | **9) Counter**. We have a list with identifiers of form “id-SITE”. Calculate how many ids we have per site.
307 |
308 |  309 |
310 | ```python
311 | def counter(lst):
312 | ans = {}
313 | for i in lst:
314 | site = i[-2:]
315 | ans[site] = ans.get(site, 0) + 1
316 | return ans
317 | ```
318 |
319 |
309 |
310 | ```python
311 | def counter(lst):
312 | ans = {}
313 | for i in lst:
314 | site = i[-2:]
315 | ans[site] = ans.get(site, 0) + 1
316 | return ans
317 | ```
318 |
319 |
320 |
321 | **10) Top counter**. We have a list with identifiers of form “id-SITE”. Show the top 3 sites. You can break ties in any way you want.
322 |
323 |  324 |
325 | ```python
326 | def top_counter(lst):
327 | site_dict = counter(lst) # using last problem's solution
328 | ans = sorted(site_dict, key=site_dict.get)[:3]
329 | return ans
330 | ```
331 |
332 |
324 |
325 | ```python
326 | def top_counter(lst):
327 | site_dict = counter(lst) # using last problem's solution
328 | ans = sorted(site_dict, key=site_dict.get)[:3]
329 | return ans
330 | ```
331 |
332 |
333 |
334 | **11) RLE**. Implement RLE (run-length encoding): encode each character by the number of times it appears consecutively.
335 |
336 | * `'aaaabbbcca'` ⇒ `[('a', 4), ('b', 3), ('c', 2), ('a', 1)]`
337 | * (note that there are two groups of 'a')
338 |
339 | ```python
340 | def rle(s):
341 | ans, cur, num = [], None, 0
342 | for i in range(len(s)):
343 | if i == 0:
344 | cur, num = s[i], 1
345 | elif cur != s[i]:
346 | ans.append((cur, num))
347 | cur, num = s[i], 1
348 | else:
349 | num += 1
350 | if i == len(s) - 1:
351 | ans.append((cur, num))
352 | return ans
353 | ```
354 |
355 |
356 |
357 | **12) Jaccard**. Calculate the Jaccard similarity between two sets: the size of intersection divided by the size of union.
358 |
359 | * `jaccard({'a', 'b', 'c'}, {'a', 'd'}) = 1 / 4`
360 |
361 |  362 |
363 | ```python
364 | def jaccard(a, b):
365 | return len(a & b) / len(a | b)
366 | ```
367 |
368 |
362 |
363 | ```python
364 | def jaccard(a, b):
365 | return len(a & b) / len(a | b)
366 | ```
367 |
368 |
369 |
370 | **13) IDF**. Given a collection of already tokenized texts, calculate the IDF (inverse document frequency) of each token.
371 |
372 | * input example: `[['interview', 'questions'], ['interview', 'answers']]`
373 |
374 |  375 |
376 | Where:
377 |
378 | * t is the token,
379 | * n(t) is the number of documents that t occurs in,
380 | * N is the total number of documents
381 |
382 | ```python
383 | from math import log10
384 |
385 | def idf(lst):
386 | n_tokens = {}
387 | for doc in lst:
388 | for token in doc:
389 | n_tokens[token] = n_tokens.get(token, 0) + 1
390 | ans = {}
391 | for token in n_tokens:
392 | ans[token] = log10(len(lst) / (1 + n_tokens[token]))
393 | return ans
394 | ```
395 |
396 |
375 |
376 | Where:
377 |
378 | * t is the token,
379 | * n(t) is the number of documents that t occurs in,
380 | * N is the total number of documents
381 |
382 | ```python
383 | from math import log10
384 |
385 | def idf(lst):
386 | n_tokens = {}
387 | for doc in lst:
388 | for token in doc:
389 | n_tokens[token] = n_tokens.get(token, 0) + 1
390 | ans = {}
391 | for token in n_tokens:
392 | ans[token] = log10(len(lst) / (1 + n_tokens[token]))
393 | return ans
394 | ```
395 |
396 |
397 |
398 | **14) PMI**. Given a collection of already tokenized texts, find the PMI (pointwise mutual information) of each pair of tokens. Return top 10 pairs according to PMI.
399 |
400 | * input example: `[['interview', 'questions'], ['interview', 'answers']]`
401 |
402 | PMI is used for finding collocations in text — things like “New York” or “Puerto Rico”. For two consecutive words, the PMI between them is:
403 |
404 |  405 |
406 | The higher the PMI, the more likely these two tokens form a collection. We can estimate PMI by counting:
407 |
408 |
405 |
406 | The higher the PMI, the more likely these two tokens form a collection. We can estimate PMI by counting:
407 |
408 |  409 |
410 | Where:
411 | * N is the total number of tokens in the text,
412 | * c(t1, t2) is the number of times t1 and t2 appear together,
413 | * c(t1) and c(t2) — the number of times they appear separately.
414 |
415 |
416 | Answer here
417 |
418 |
409 |
410 | Where:
411 | * N is the total number of tokens in the text,
412 | * c(t1, t2) is the number of times t1 and t2 appear together,
413 | * c(t1) and c(t2) — the number of times they appear separately.
414 |
415 |
416 | Answer here
417 |
418 |
419 |
420 | ## Algorithmic Questions
421 |
422 | **1) Two sum**. Given an array and a number N, return True if there are numbers A, B in the array such that A + B = N. Otherwise, return False.
423 |
424 | * `[1, 2, 3, 4], 5` ⇒ `True`
425 | * `[3, 4, 6], 6` ⇒ `False`
426 |
427 | Brute force, O(n2):
428 |
429 | ```python
430 | def two_sum(numbers, target):
431 | n = len(numbers)
432 |
433 | for i in range(n):
434 | for j in range(i + 1, n):
435 | if numbers[i] + numbers[j] == target:
436 | return True
437 |
438 | return False
439 | ```
440 |
441 | Linear, O(n):
442 |
443 | ```python
444 | def two_sum(numbers, target):
445 | index = {num: i for (i, num) in enumerate(numbers)}
446 |
447 | n = len(numbers)
448 |
449 | for i in range(n):
450 | a = numbers[i]
451 | b = target - a
452 |
453 | if b in index:
454 | j = index[b]
455 | if i != j:
456 | return True
457 |
458 | return False
459 | ```
460 |
461 |
462 |
463 |
464 | **2) Fibonacci**. Return the n-th Fibonacci number, which is computed using this formula:
465 |
466 | * F(0) = 0
467 | * F(1) = 1
468 | * F(n) = F(n-1) + F(n-2)
469 | * The sequence is: 0, 1, 1, 2, 3, 5, 8, 13, 21, 34, 55, 89, ...
470 |
471 | ```python
472 | def fibonacci1(n):
473 | '''naive, complexity = O(2 ** n)'''
474 | if n == 0 or n == 1:
475 | return n
476 | else:
477 | return fibonacci1(n - 1) + fibonacci1(n - 2)
478 | ```
479 |
480 | ```python
481 | def fibonacci2(n):
482 | '''dynamic programming, complexity = O(n)'''
483 | base1, base2 = 0, 1
484 | for i in range(n):
485 | base1, base2 = base2, base1 + base2
486 | return base1
487 | ```
488 |
489 | ```python
490 | def fibonacci3(n):
491 | '''matrix multiplication, complexity = O(log(n))'''
492 | def mx_mul(m1, m2):
493 | ans = [[0 for i in range(len(m2[0]))] for j in range(len(m1))]
494 | for i in range(len(m1)):
495 | for j in range(len(m2[0])):
496 | for k in range(len(m2)):
497 | ans[i][j] += m1[i][k] * m2[k][j]
498 | return ans
499 | def pow(a, b):
500 | ans = [[1, 0], [0, 1]]
501 | while b > 0:
502 | if b % 2 == 1:
503 | ans = mx_mul(ans, a)
504 | a = mx_mul(a, a)
505 | b //= 2
506 | return ans
507 | ans = mx_mul(pow([[1, 1], [1, 0]], n), [[1], [0]])[1][0]
508 | return ans
509 | ```
510 |
511 |
512 |
513 | **3) Most frequent outcome**. We have two dice of different sizes (D1 and D2). We roll them and sum their face values. What are the most probable outcomes?
514 |
515 | * 6, 6 ⇒ [7]
516 | * 2, 4 ⇒ [3, 4, 5]
517 |
518 | ```python
519 | def most_frequent_outcome(d1, d2):
520 | len_ans = abs(d1 - d2) + 1
521 | mi = min(d1, d2)
522 | ans = [mi + i for i in range(1, len_ans + 1)]
523 | return ans
524 | ```
525 |
526 |
527 |
528 | **4) Reverse a linked list**. Write a function for reversing a linked list.
529 |
530 | * The definition of a list node: `Node(value, next)`
531 | * Example: `a -> b -> c` ⇒ `c -> b -> a`
532 |
533 | ```python
534 | def reverse_ll(head):
535 | if head.next is not None:
536 | last = None
537 | point = head
538 | while point is not None:
539 | point.next, point, last = last, point.next, point
540 | ```
541 |
542 |
543 |
544 | **5) Flip a binary tree**. Write a function for rotating a binary tree.
545 |
546 | * The definition of a tree node: `Node(value, left, right)`
547 |
548 |  549 |
550 | ```python
551 | def flip_bt(head):
552 | if head is not None:
553 | head.left, head.right = head.right, head.left
554 | flip_bt(head.left)
555 | flip_bt(head.right)
556 | ```
557 |
558 |
549 |
550 | ```python
551 | def flip_bt(head):
552 | if head is not None:
553 | head.left, head.right = head.right, head.left
554 | flip_bt(head.left)
555 | flip_bt(head.right)
556 | ```
557 |
558 |
559 |
560 | **6) Binary search**. Return the index of a given number in a sorted array or -1 if it’s not there.
561 |
562 | * `[1, 4, 6, 10], 4` ⇒ `1`
563 | * `[1, 4, 6, 10], 3` ⇒ `-1`
564 |
565 | ```python
566 | def binary_search(lst, num):
567 | left, right = -1, len(lst)
568 | while right - left > 1:
569 | mid = (left + right) // 2
570 | if lst[mid] >= num:
571 | right = mid
572 | else:
573 | left = mid
574 | if right < 0 or right >= len(lst) or lst[right] != num:
575 | return -1
576 | else:
577 | return right
578 | ```
579 |
580 |
581 |
582 | **7) Deduplication**. Remove duplicates from a sorted array.
583 |
584 | * `[1, 1, 1, 2, 3, 4, 4, 4, 5, 6, 6]` ⇒ `[1, 2, 3, 4, 5, 6]`
585 |
586 | ```python
587 | def deduplication1(lst):
588 | '''manual'''
589 | ans = []
590 | last = None
591 | for i in lst:
592 | if last != i:
593 | ans.append(i)
594 | last = i
595 | return ans
596 |
597 | def deduplication2(lst):
598 | return list(set(lst))
599 | ```
600 |
601 |
602 |
603 | **8) Intersection**. Return the intersection of two sorted arrays.
604 |
605 | * `[1, 2, 4, 6, 10], [2, 4, 5, 7, 10]` ⇒ `[2, 4, 10]`
606 |
607 | ```python
608 | def intersection1(lst1, lst2):
609 | '''reserves duplicates'''
610 | ans = []
611 | p1, p2 = 0, 0
612 | while p1 < len(lst1) and p2 < len(lst2):
613 | if lst1[p1] == lst2[p2]:
614 | ans.append(lst1[p1])
615 | p1, p2 = p1 + 1, p2 + 1
616 | elif lst1[p1] < lst2[p2]:
617 | p1 += 1
618 | else:
619 | p2 += 1
620 | return ans
621 |
622 | def intersection2(lst1, lst2):
623 | '''removes duplicates'''
624 | return list(set(lst1) & set(lst2))
625 | ```
626 |
627 |
628 |
629 | **9) Union**. Return the union of two sorted arrays.
630 |
631 | * `[1, 2, 4, 6, 10], [2, 4, 5, 7, 10]` ⇒ `[1, 2, 4, 5, 6, 7, 10]`
632 |
633 | ```python
634 | def union1(lst1, lst2):
635 | '''reserves duplicates'''
636 | ans = []
637 | p1, p2 = 0, 0
638 | while p1 < len(lst1) or p2 < len(lst2):
639 | if lst1[p1] == lst2[p2]:
640 | ans.append(lst1[p1])
641 | p1, p2 = p1 + 1, p2 + 1
642 | elif lst1[p1] < lst2[p2]:
643 | ans.append(lst1[p1])
644 | p1 += 1
645 | else:
646 | ans.append(lst2[p2])
647 | p2 += 1
648 | return ans
649 |
650 | def union2(lst1, lst2):
651 | '''removes duplicates'''
652 | return list(set(lst1) | set(lst2))
653 | ```
654 |
655 |
656 |
657 | **10) Addition**. Implement the addition algorithm from school. Suppose we represent numbers by a list of integers from 0 to 9:
658 |
659 | * 12 is `[1, 2]`
660 | * 1000 is `[1, 0, 0, 0]`
661 |
662 | Implement the “+” operation for this representation
663 |
664 | * `[1, 1] + [1]` ⇒ `[1, 2]`
665 | * `[9, 9] + [2]` ⇒ `[1, 0, 1]`
666 |
667 | ```python
668 | def addition(lst1, lst2):
669 | def list_to_int(lst):
670 | ans, base = 0, 1
671 | for i in lst[::-1]:
672 | ans += i * base
673 | base *= 10
674 | return ans
675 | val = list_to_int(lst1) + list_to_int(lst2)
676 | ans = [int(i) for i in str(val)]
677 | return ans
678 | ```
679 |
680 |
681 |
682 | **11) Sort by custom alphabet**. You’re given a list of words and an alphabet (e.g. a permutation of Latin alphabet). You need to use this alphabet to order words in the list.
683 |
684 | Example:
685 |
686 | * Words: `['home', 'oval', 'cat', 'egg', 'network', 'green']`
687 | * Dictionary: `'bcdfghijklmnpqrstvwxzaeiouy'`
688 |
689 | Output:
690 |
691 | * `['cat', 'green', 'home', 'network', 'egg', 'oval']`
692 |
693 | Answer here
694 |
695 |
696 |
697 | **12) Check if a tree is a binary search tree**. In BST, the element in the root is:
698 |
699 | * Greater than or equal to the numbers on the left
700 | * Less than or equal to the number on the right
701 | * The definition of a tree node: `Node(value, left, right)`
702 |
703 | ```python
704 | def check_is_bst(head, min_val=None, max_val=None):
705 | """Check whether binary tree is binary search tree
706 |
707 | Aside of the obvious node.left.val <= node.val <= node.right.val have to be
708 | fulfilled, we also have to make sure that there is NO SINGLE leaves in the
709 | left part of node have more value than the current node.
710 | """
711 | check_val = True
712 | check_left = True
713 | check_right = True
714 |
715 | if min_val:
716 | check_val = check_val and (head.val >= min_val)
717 | min_new = min(min_val, head.val)
718 | else:
719 | min_new = head.val
720 |
721 | if max_val:
722 | check_val = check_val and (head.val <= max_val)
723 | max_new = max(max_val, head.val)
724 | else:
725 | max_new = head.val
726 |
727 | if head.left:
728 | check_left = check_is_bst(head.left, min_val, max_new)
729 |
730 | if head.right:
731 | check_right = check_is_bst(head.right, min_new, max_val)
732 |
733 | return check_val and check_left and check_right
734 | ```
735 |
736 |
737 |
--------------------------------------------------------------------------------
/theory.md:
--------------------------------------------------------------------------------
1 | # Theoretical interview questions
2 |
3 | * The list of questions is based on this post: https://hackernoon.com/160-data-science-interview-questions-415s3y2a
4 | * Legend: 👶 easy ⭐️ medium 🚀 expert
5 | * Do you know how to answer questions without answers? Please create a PR
6 | * See an error? Please create a PR with fix
7 |
8 | ## Supervised machine learning
9 |
10 | **What is supervised machine learning? 👶**
11 |
12 | A case when we have both features (the matrix X) and the labels (the vector y)
13 |
14 |
15 |
16 | ## Linear regression
17 |
18 | **What is regression? Which models can you use to solve a regression problem? 👶**
19 |
20 | Regression is a part of supervised ML. Regression models investigate the relationship between a dependent (target) and independent variable (s) (predictor).
21 | Here are some common regression models:
22 | - *Linear Regression* establishes a linear relationship between target and predictor (s). It predicts a numeric value and has a shape of a straight line.
23 | - *Polynomial Regression* has a regression equation with the power of independent variable more than 1. It is a curve that fits into the data points.
24 | - *Ridge Regression* helps when predictors are highly correlated (multicollinearity problem). It penalizes the squares of regression coefficients but doesn’t allow to reach zeros (uses l2 regularization).
25 | - *Lasso Regression* penalizes the absolute values of regression coefficients and allow reach absolute zero for some coefficient (allow feature selection).
26 |
27 |
28 |
29 | **What is linear regression? When do we use it? 👶**
30 |
31 | Linear regression is a model that assumes a linear relationship between the input variables (X) and the single output variable (y).
32 |
33 | With a simple equation:
34 |
35 | ```
36 | y = B0 + B1*x1 + ... + Bn * xN
37 | ```
38 |
39 | B is regression coefficients, x values are the independent (explanatory) variables and y is dependent variable.
40 |
41 | The case of one explanatory variable is called simple linear regression. For more than one explanatory variable, the process is called multiple linear regression.
42 |
43 | Simple linear regression:
44 |
45 | ```
46 | y = B0 + B1*x1
47 | ```
48 |
49 | Multiple linear regression:
50 |
51 | ```
52 | y = B0 + B1*x1 + ... + Bn * xN
53 | ```
54 |
55 |
56 |
57 | **What are the main assumptions of linear regression? (⭐)**
58 |
59 | There are several assumptions of linear regression. If any of them is violated, model predictions and interpretation may be worthless or misleading.
60 |
61 | 1. **Linear relationship** between features and target variable.
62 | 2. **Additivity** means that the effect of changes in one of the features on the target variable does not depend on values of other features. For example, a model for predicting revenue of a company have of two features - the number of items _a_ sold and the number of items _b_ sold. When company sells more items _a_ the revenue increases and this is independent of the number of items _b_ sold. But, if customers who buy _a_ stop buying _b_, the additivity assumption is violated.
63 | 3. Features are not correlated (no **collinearity**) since it can be difficult to separate out the individual effects of collinear features on the target variable.
64 | 4. Errors are independently and identically normally distributed (yi = B0 + B1*x1i + ... + errori):
65 | 1. No correlation between errors (consecutive errors in the case of time series data).
66 | 2. Constant variance of errors - **homoscedasticity**. For example, in case of time series, seasonal patterns can increase errors in seasons with higher activity.
67 | 3. Errors are normaly distributed, otherwise some features will have more influence on the target variable than to others. If the error distribution is significantly non-normal, confidence intervals may be too wide or too narrow.
68 |
69 |
70 |
71 | **What’s the normal distribution? Why do we care about it? 👶**
72 |
73 | The normal distribution is a continuous probability distribution whose probability density function takes the following formula:
74 |
75 | 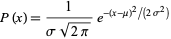
76 |
77 | where μ is the mean and σ is the standard deviation of the distribution.
78 |
79 | The normal distribution derives its importance from the **Central Limit Theorem**, which states that if we draw a large enough number of samples, their mean will follow a normal distribution regardless of the initial distribution of the sample, i.e **the distribution of the mean of the samples is normal**. It is important that each sample is independent from the other.
80 |
81 | This is powerful because it helps us study processes whose population distribution is unknown to us.
82 |
83 |
84 |
85 |
86 | **How do we check if a variable follows the normal distribution? ⭐️**
87 |
88 | 1. Plot a histogram out of the sampled data. If you can fit the bell-shaped "normal" curve to the histogram, then the hypothesis that the underlying random variable follows the normal distribution can not be rejected.
89 | 2. Check Skewness and Kurtosis of the sampled data. Zero-skewness and zero-kurtosis are typical for a normal distribution, so the farther away from 0, the more non-normal the distribution.
90 | 3. Use Kolmogorov-Smirnov or/and Shapiro-Wilk tests for normality. They take into account both Skewness and Kurtosis simultaneously.
91 | 4. Check for Quantile-Quantile plot. It is a scatterplot created by plotting two sets of quantiles against one another. Normal Q-Q plot place the data points in a roughly straight line.
92 |
93 |
94 |
95 | **What if we want to build a model for predicting prices? Are prices distributed normally? Do we need to do any pre-processing for prices? ⭐️**
96 |
97 | Answer here
98 |
99 |
100 |
101 | **What are the methods for solving linear regression do you know? ⭐️**
102 |
103 | Answer here
104 |
105 |
106 |
107 | **What is gradient descent? How does it work? ⭐️**
108 |
109 | Gradient descent is an algorithm that uses calculus concept of gradient to try and reach local or global minima. It works by taking the negative of the gradient in a point of a given function, and updating that point repeatedly using the calculated negative gradient, until the algorithm reaches a local or global minimum, which will cause future iterations of the algorithm to return values that are equal or too close to the current point. It is widely used in machine learning applications.
110 |
111 |
112 |
113 | **What is the normal equation? ⭐️**
114 |
115 | Normal equations are equations obtained by setting equal to zero the partial derivatives of the sum of squared errors (least squares); normal equations allow one to estimate the parameters of a multiple linear regression.
116 |
117 |
118 |
119 | **What is SGD — stochastic gradient descent? What’s the difference with the usual gradient descent? ⭐️**
120 |
121 | In both gradient descent (GD) and stochastic gradient descent (SGD), you update a set of parameters in an iterative manner to minimize an error function.
122 |
123 | While in GD, you have to run through ALL the samples in your training set to do a single update for a parameter in a particular iteration, in SGD, on the other hand, you use ONLY ONE or SUBSET of training sample from your training set to do the update for a parameter in a particular iteration. If you use SUBSET, it is called Minibatch Stochastic gradient Descent.
124 |
125 |
126 |
127 | **Which metrics for evaluating regression models do you know? 👶**
128 |
129 | 1. Mean Squared Error(MSE)
130 | 2. Root Mean Squared Error(RMSE)
131 | 3. Mean Absolute Error(MAE)
132 | 4. R² or Coefficient of Determination
133 | 5. Adjusted R²
134 |
135 |
136 |
137 | **What are MSE and RMSE? 👶**
138 |
139 | MSE stands for Mean Square Error while RMSE stands for Root Mean Square Error. They are metrics with which we can evaluate models.
140 |
141 |
142 |
143 | **What is the bias-variance trade-off? 👶**
144 |
145 | **Bias** is the error introduced by approximating the true underlying function, which can be quite complex, by a simpler model. **Variance** is a model sensitivity to changes in the training dataset.
146 |
147 | **Bias-variance trade-off** is a relationship between the expected test error and the variance and the bias - both contribute to the level of the test error and ideally should be as small as possible:
148 |
149 | ```
150 | ExpectedTestError = Variance + Bias² + IrreducibleError
151 | ```
152 |
153 | But as a model complexity increases, the bias decreases and the variance increases which leads to *overfitting*. And vice versa, model simplification helps to decrease the variance but it increases the bias which leads to *underfitting*.
154 |
155 |
156 |
157 |
158 | ## Validation
159 |
160 | **What is overfitting? 👶**
161 |
162 | When your model perform very well on your training set but can't generalize the test set, because it adjusted a lot to the training set.
163 |
164 |
165 |
166 | **How to validate your models? 👶**
167 |
168 | One of the most common approaches is splitting data into train, validation and test parts.
169 | Models are trained on train data, hyperparameters (for example early stopping) are selected based on the validation data, the final measurement is done on test dataset.
170 | Another approach is cross-validation: split dataset into K folds and each time train models on training folds and measure the performance on the validation folds.
171 | Also you could combine these approaches: make a test/holdout dataset and do cross-validation on the rest of the data. The final quality is measured on test dataset.
172 |
173 |
174 |
175 | **Why do we need to split our data into three parts: train, validation, and test? 👶**
176 |
177 | The training set is used to fit the model, i.e. to train the model with the data. The validation set is then used to provide an unbiased evaluation of a model while fine-tuning hyperparameters. This improves the generalization of the model. Finally, a test data set which the model has never "seen" before should be used for the final evaluation of the model. This allows for an unbiased evaluation of the model. The evaluation should never be performed on the same data that is used for training. Otherwise the model performance would not be representative.
178 |
179 |
180 |
181 | **Can you explain how cross-validation works? 👶**
182 |
183 | Cross-validation is the process to separate your total training set into two subsets: training and validation set, and evaluate your model to choose the hyperparameters. But you do this process iteratively, selecting differents training and validation set, in order to reduce the bias that you would have by selecting only one validation set.
184 |
185 |
186 |
187 | **What is K-fold cross-validation? 👶**
188 |
189 | K fold cross validation is a method of cross validation where we select a hyperparameter k. The dataset is now divided into k parts. Now, we take the 1st part as validation set and remaining k-1 as training set. Then we take the 2nd part as validation set and remaining k-1 parts as training set. Like this, each part is used as validation set once and the remaining k-1 parts are taken together and used as training set.
190 | It should not be used in a time series data.
191 |
192 |
193 |
194 | **How do we choose K in K-fold cross-validation? What’s your favorite K? 👶**
195 |
196 | There are two things to consider while deciding K: the number of models we get and the size of validation set. We do not want the number of models to be too less, like 2 or 3. At least 4 models give a less biased decision on the metrics. On the other hand, we would want the dataset to be at least 20-25% of the entire data. So that at least a ratio of 3:1 between training and validation set is maintained.
197 | I tend to use 4 for small datasets and 5 for large ones as K.
198 |
199 |
200 |
201 |
202 | ## Classification
203 |
204 | **What is classification? Which models would you use to solve a classification problem? 👶**
205 |
206 | Classification problems are problems in which our prediction space is discrete, i.e. there is a finite number of values the output variable can be. Some models which can be used to solve classification problems are: logistic regression, decision tree, random forests, multi-layer perceptron, one-vs-all, amongst others.
207 |
208 |
209 |
210 | **What is logistic regression? When do we need to use it? 👶**
211 |
212 | Logistic regression is a Machine Learning algorithm that is used for binary classification classification. You should use logistic regression when your Y variable takes only two values, e.g. True and False, "spam" and "not spam", "churn" and "not churn" and so on. The variable is said to be a "binary" or "dichotomous".
213 |
214 |
215 |
216 | **Is logistic regression a linear model? Why? 👶**
217 |
218 | Yes, Logistic Regression is considered a generalized linear model because the outcome always depends on the sum of the inputs and parameters. Or in other words, the output cannot depend on the product (or quotient, etc.) of its parameters.
219 |
220 |
221 |
222 | **What is sigmoid? What does it do? 👶**
223 |
224 | A sigmoid function is a type of activation function, and more specifically defined as a squashing function. Squashing functions limit the output to a range between 0 and 1, making these functions useful in the prediction of probabilities.
225 |
226 |
227 |
228 | **How do we evaluate classification models? 👶**
229 |
230 | Depending on the classification problem, we can use the following evaluation metrics:
231 |
232 | 1. Accuracy
233 | 2. Precision
234 | 3. Recall
235 | 4. F1 Score
236 | 5. Logistic loss (also known as Cross-entropy loss)
237 | 6. Jaccard similarity coefficient score
238 |
239 |
240 |
241 | **What is accuracy? 👶**
242 |
243 | Accuracy is a metric for evaluating classification models. It is calculated by dividing the number of correct predictions by the number of total predictions.
244 |
245 |
246 |
247 | **Is accuracy always a good metric? 👶**
248 |
249 | Accuracy is not a good performance metric when there is imbalance in the dataset. For example, in binary classification with 95% of A class and 5% of B class, prediction accuracy can be 95%. In case of imbalance dataset, we need to choose Precision, recall, or F1 Score depending on the problem we are trying to solve.
250 |
251 |
252 |
253 | **What is the confusion table? What are the cells in this table? 👶**
254 |
255 | Confusion table (or confusion matrix) shows how many True positives (TP), True Negative (TN), False Positive (FP) and False Negative (FN) model has made.
256 |
257 | || | Actual | Actual |
258 | |:---:| :---: | :---: |:---: |
259 | || | Positive (1) | Negative (0) |
260 | |Predicted| Positive (1) | TP | FP |
261 | |Predicted| Negative (0) | FN | TN |
262 |
263 | * True Positives (TP): When the actual class of the observation is 1 (True) and the prediction is 1 (True)
264 | * True Negative (TN): When the actual class of the observation is 0 (False) and the prediction is 0 (False)
265 | * False Positive (FP): When the actual class of the observation is 0 (False) and the prediction is 1 (True)
266 | * False Negative (FN): When the actual class of the observation is 1 (True) and the prediction is 0 (False)
267 |
268 | Most of the performance metrics for classification models are based on the values of the confusion matrix.
269 |
270 |
271 |
272 | **What are precision, recall, and F1-score? 👶**
273 |
274 | * Precision and recall are classification evaluation metrics:
275 | * P = TP / (TP + FP) and R = TP / (TP + FN).
276 | * Where TP is true positives, FP is false positives and FN is false negatives
277 | * In both cases the score of 1 is the best: we get no false positives or false negatives and only true positives.
278 | * F1 is a combination of both precision and recall in one score (harmonic mean):
279 | * F1 = 2 * PR / (P + R).
280 | * Max F score is 1 and min is 0, with 1 being the best.
281 |
282 |
283 |
284 | **Precision-recall trade-off ⭐️**
285 |
286 | Answer here
287 |
288 |
289 |
290 | **What is the ROC curve? When to use it? ⭐️**
291 |
292 | ROC stands for *Receiver Operating Characteristics*. The diagrammatic representation that shows the contrast between true positive rate vs true negative rate. It is used when we need to predict the probability of the binary outcome.
293 |
294 |
295 |
296 | **What is AUC (AU ROC)? When to use it? ⭐️**
297 |
298 | AUC stands for *Area Under the ROC Curve*. ROC is a probability curve and AUC represents degree or measure of separability. It's used when we need to value how much model is capable of distinguishing between classes. The value is between 0 and 1, the higher the better.
299 |
300 |
301 |
302 | **How to interpret the AU ROC score? ⭐️**
303 |
304 | AUC score is the value of *Area Under the ROC Curve*.
305 |
306 | If we assume ROC curve consists of dots, $\{(x_1, y_1), (x_2, y_2), \cdots, (x_m,y_m)\}$, then
307 | $$
308 | AUC = \frac{1}{2} \sum_{i=1}^{m-1}(x_{i+1}-x_i)\cdot (y_i+y_{i+1})
309 | $$
310 | An excellent model has AUC near to the 1 which means it has good measure of separability. A poor model has AUC near to the 0 which means it has worst measure of separability. When AUC score is 0.5, it means model has no class separation capacity whatsoever.
311 |
312 |
313 |
314 | **What is the PR (precision-recall) curve? ⭐️**
315 |
316 | Answer here
317 |
318 |
319 |
320 | **What is the area under the PR curve? Is it a useful metric? ⭐️I**
321 |
322 | Answer here
323 |
324 |
325 |
326 | **In which cases AU PR is better than AU ROC? ⭐️**
327 |
328 | Answer here
329 |
330 |
331 |
332 | **What do we do with categorical variables? ⭐️**
333 |
334 | Categorical variables must be encoded before they can be used as features to train a machine learning model. There are various encoding techniques, including:
335 | - One-hot encoding
336 | - Label encoding
337 | - Ordinal encoding
338 | - Target encoding
339 |
340 |
341 |
342 | **Why do we need one-hot encoding? ⭐️**
343 |
344 | If we simply encode categorical variables with a Label encoder, they become ordinal which can lead to undesirable consequences. In this case, linear models will treat category with id 4 as twice better than a category with id 2. One-hot encoding allows us to represent a categorical variable in a numerical vector space which ensures that vectors of each category have equal distances between each other. This approach is not suited for all situations, because by using it with categorical variables of high cardinality (e.g. customer id) we will encounter problems that come into play because of the curse of dimensionality.
345 |
346 |
347 |
348 |
349 | ## Regularization
350 |
351 | **What happens to our linear regression model if we have three columns in our data: x, y, z — and z is a sum of x and y? ⭐️**
352 |
353 | Answer here
354 |
355 |
356 |
357 | **What happens to our linear regression model if the column z in the data is a sum of columns x and y and some random noise? ⭐️**
358 |
359 | Answer here
360 |
361 |
362 |
363 | **What is regularization? Why do we need it? 👶**
364 |
365 | Regularization is used to reduce overfitting in machine learning models. It helps the models to generalize well and make them robust to outliers and noise in the data.
366 |
367 |
368 |
369 | **Which regularization techniques do you know? ⭐️**
370 |
371 | There are mainly two types of regularization,
372 | 1. L1 Regularization (Lasso regularization) - Adds the sum of absolute values of the coefficients to the cost function. $\lambda\sum_{i=1}^{n} \left | w_i \right |$
373 | 2. L2 Regularization (Ridge regularization) - Adds the sum of squares of coefficients to the cost function. $\lambda\sum_{i=1}^{n} {w_{i}}^{2}$
374 |
375 | * Where $\lambda$ determines the amount of regularization.
376 |
377 |
378 |
379 | **What kind of regularization techniques are applicable to linear models? ⭐️**
380 |
381 | Answer here
382 |
383 |
384 |
385 | **How does L2 regularization look like in a linear model? ⭐️**
386 |
387 | L2 regularization adds a penalty term to our cost function which is equal to the sum of squares of models coefficients multiplied by a lambda hyperparameter. This technique makes sure that the coefficients are close to zero and is widely used in cases when we have a lot of features that might correlate with each other.
388 |
389 |
390 |
391 | **How do we select the right regularization parameters? 👶**
392 |
393 | Answer here
394 |
395 |
396 |
397 | **What’s the effect of L2 regularization on the weights of a linear model? ⭐️**
398 |
399 | Answer here
400 |
401 |
402 |
403 | **How L1 regularization looks like in a linear model? ⭐️**
404 |
405 | Answer here
406 |
407 |
408 |
409 | **What’s the difference between L2 and L1 regularization? ⭐️**
410 |
411 | Answer here
412 |
413 |
414 |
415 | **Can we have both L1 and L2 regularization components in a linear model? ⭐️**
416 |
417 | Answer here
418 |
419 |
420 |
421 | **What’s the interpretation of the bias term in linear models? ⭐️**
422 |
423 | Answer here
424 |
425 |
426 |
427 | **How do we interpret weights in linear models? ⭐️**
428 |
429 | If the variables are normalized, we can interpret weights in linear models like the importance of this variable in the predicted result.
430 |
431 |
432 |
433 | **If a weight for one variable is higher than for another — can we say that this variable is more important? ⭐️**
434 |
435 | Answer here
436 |
437 |
438 |
439 | **When do we need to perform feature normalization for linear models? When it’s okay not to do it? ⭐️**
440 |
441 | Answer here
442 |
443 |
444 |
445 |
446 | ## Feature selection
447 |
448 | **What is feature selection? Why do we need it? 👶**
449 |
450 | Answer Feature Selection is a method used to select the relevant features for the model to train on. We need feature selection to remove the irrelevant features which leads the model to under-perform.
451 |
452 |
453 |
454 | **Is feature selection important for linear models? ⭐️**
455 |
456 | Answer here
457 |
458 |
459 |
460 | **Which feature selection techniques do you know? ⭐️**
461 |
462 | Here are some of the feature selections:
463 | - Principal Component Analysis
464 | - Neighborhood Component Analysis
465 | - ReliefF Algorithm
466 |
467 |
468 |
469 | **Can we use L1 regularization for feature selection? ⭐️**
470 |
471 | Yes, because the nature of L1 regularization will lead to sparse coefficients of features. Feature selection can be done by keeping only features with non-zero coefficients.
472 |
473 |
474 |
475 | **Can we use L2 regularization for feature selection? ⭐️**
476 |
477 | Answer here
478 |
479 |
480 |
481 |
482 | ## Decision trees
483 |
484 | **What are the decision trees? 👶**
485 |
486 | A decision tree is a flowchart-like tree structure, where each internal node (non-leaf node) denotes a test on an attribute, each branch represents an outcome of the test, and each leaf node (or terminal node) holds a value for the target variable.
487 |
488 |
489 |
490 | **How do we train decision trees? ⭐️**
491 |
492 | 1. Start at the root node.
493 | 2. For each variable X, find the set S_1 that minimizes the sum of the node impurities in the two child nodes and choose the split {X*,S*} that gives the minimum over all X and S.
494 | 3. If a stopping criterion is reached, exit. Otherwise, apply step 2 to each child node in turn.
495 |
496 |
497 |
498 | **What are the main parameters of the decision tree model? 👶**
499 |
500 | * maximum tree depth
501 | * minimum samples per leaf node
502 | * impurity criterion
503 |
504 |
505 |
506 | **How do we handle categorical variables in decision trees? ⭐️**
507 |
508 | Some decision tree algorithms can handle categorical variables out of the box, others cannot. However, we can transform categorical variables, e.g. with a binary or a one-hot encoder.
509 |
510 |
511 |
512 | **What are the benefits of a single decision tree compared to more complex models? ⭐️**
513 |
514 | * easy to implement
515 | * fast training
516 | * fast inference
517 | * good explainability
518 |
519 |
520 |
521 | **How can we know which features are more important for the decision tree model? ⭐️**
522 |
523 | Often, we want to find a split such that it minimizes the sum of the node impurities. The impurity criterion is a parameter of decision trees. Popular methods to measure the impurity are the Gini impurity and the entropy describing the information gain.
524 |
525 |
526 |
527 |
528 | ## Random forest
529 |
530 | **What is random forest? 👶**
531 |
532 | Random Forest is a machine learning method for regression and classification which is composed of many decision trees. RF belongs to a larger class of ML algorithms called ensemble methods (in other words, it involves the combination of several models to solve a single prediction problem).
533 |
534 |
535 |
536 | **Why do we need randomization in random forest? ⭐️**
537 |
538 | Random forest in an extention of the **bagging** algorithm which takes *random data samples from the training dataset* (with replacement), trains several models and averages predictions. In addition to that, each time a split in a tree is considered, random forest takes a *random sample of m features from full set of n features* (with replacement) and uses this subset of features as candidates for the split (for example, `m = sqrt(n)`).
539 |
540 | Training decision trees on random data samples from the training dataset *reduces variance*. Sampling features for each split in a decision tree *decorrelates trees*.
541 |
542 |
543 |
544 | **What are the main parameters of the random forest model? ⭐️**
545 |
546 | Answer here
547 |
548 |
549 |
550 | **How do we select the depth of the trees in random forest? ⭐️**
551 |
552 | Answer here
553 |
554 |
555 |
556 | **How do we know how many trees we need in random forest? ⭐️**
557 |
558 | Answer here
559 |
560 |
561 |
562 | **Is it easy to parallelize training of a random forest model? How can we do it? ⭐️**
563 |
564 | Answer here
565 |
566 |
567 |
568 | **What are the potential problems with many large trees? ⭐️**
569 |
570 | Answer here
571 |
572 |
573 |
574 | **What if instead of finding the best split, we randomly select a few splits and just select the best from them. Will it work? 🚀**
575 |
576 | Answer here
577 |
578 |
579 |
580 | **What happens when we have correlated features in our data? ⭐️**
581 |
582 | Answer here
583 |
584 |
585 |
586 |
587 | ## Gradient boosting
588 |
589 | **What is gradient boosting trees? ⭐️**
590 |
591 | Answer here
592 |
593 |
594 |
595 | **What’s the difference between random forest and gradient boosting? ⭐️**
596 |
597 | Answer here
598 |
599 |
600 |
601 | **Is it possible to parallelize training of a gradient boosting model? How to do it? ⭐️**
602 |
603 | Answer here
604 |
605 |
606 |
607 | **Feature importance in gradient boosting trees — what are possible options? ⭐️**
608 |
609 | Answer here
610 |
611 |
612 |
613 | **Are there any differences between continuous and discrete variables when it comes to feature importance of gradient boosting models? 🚀**
614 |
615 | Answer here
616 |
617 |
618 |
619 | **What are the main parameters in the gradient boosting model? ⭐️**
620 |
621 | Answer here
622 |
623 |
624 |
625 | **How do you approach tuning parameters in XGBoost or LightGBM? 🚀**
626 |
627 | Answer here
628 |
629 |
630 |
631 | **How do you select the number of trees in the gradient boosting model? ⭐️**
632 |
633 | Answer here
634 |
635 |
636 |
637 |
638 |
639 | ## Parameter tuning
640 |
641 | **Which hyper-parameter tuning strategies (in general) do you know? ⭐️**
642 |
643 | There are several strategies for hyper-tuning but I would argue that the three most popular nowadays are the following:
644 | * Grid Search is an exhaustive approach such that for each hyper-parameter, the user needs to manually give a list of values for the algorithm to try. After these values are selected, grid search then evaluates the algorithm using each and every combination of hyper-parameters and returns the combination that gives the optimal result (i.e. lowest MAE). Because grid search evaluates the given algorithm using all combinations, it's easy to see that this can be quite computationally expensive and can lead to sub-optimal results specifically since the user needs to specify specific values for these hyper-parameters, which is prone for error and requires domain knowledge.
645 |
646 | * Random Search is similar to grid search but differs in the sense that rather than specifying which values to try for each hyper-parameter, an upper and lower bound of values for each hyper-parameter is given instead. With uniform probability, random values within these bounds are then chosen and similarly, the best combination is returned to the user. Although this seems less intuitive, no domain knowledge is necessary and theoretically much more of the parameter space can be explored.
647 |
648 | * In a completely different framework, Bayesian Optimization is thought of as a more statistical way of optimization and is commonly used when using neural networks, specifically since one evaluation of a neural network can be computationally costly. In numerous research papers, this method heavily outperforms Grid Search and Random Search and is currently used on the Google Cloud Platform as well as AWS. Because an in-depth explanation requires a heavy background in bayesian statistics and gaussian processes (and maybe even some game theory), a "simple" explanation is that a much simpler/faster acquisition function intelligently chooses (using a surrogate function such as probability of improvement or GP-UCB) which hyper-parameter values to try on the computationally expensive, original algorithm. Using the result of the initial combination of values on the expensive/original function, the acquisition function takes the result of the expensive/original algorithm into account and uses it as its prior knowledge to again come up with another set of hyper-parameters to choose during the next iteration. This process continues either for a specified number of iterations or for a specified amount of time and similarly the combination of hyper-parameters that performs the best on the expensive/original algorithm is chosen.
649 |
650 |
651 |
652 |
653 | **What’s the difference between grid search parameter tuning strategy and random search? When to use one or another? ⭐️**
654 | For specifics, refer to the above answer.
655 |
656 |
657 |
658 |
659 | ## Neural networks
660 |
661 | **What kind of problems neural nets can solve? 👶**
662 |
663 | Answer here
664 |
665 |
666 |
667 | **How does a usual fully-connected feed-forward neural network work? ⭐️**
668 |
669 | Answer here
670 |
671 |
672 |
673 | **Why do we need activation functions? 👶**
674 |
675 | The main idea of using neural networks is to learn complex nonlinear functions. If we are not using an activation function in between different layers of a neural network, we are just stacking up multiple linear layers one on top of another and this leads to learning a linear function. The Nonlinearity comes only with the activation function, this is the reason we need activation functions.
676 |
677 |
678 |
679 | **What are the problems with sigmoid as an activation function? ⭐️**
680 |
681 | The output of the sigmoid function for large positive or negative numbers is almost zero. From this comes the problem of vanishing gradient — during the backpropagation our net will not learn (or will learn drastically slow). One possible way to solve this problem is to use ReLU activation function.
682 |
683 |
684 |
685 | **What is ReLU? How is it better than sigmoid or tanh? ⭐️**
686 |
687 | Answer here
688 |
689 |
690 |
691 | **How we can initialize the weights of a neural network? ⭐️**
692 |
693 | Answer here
694 |
695 |
696 |
697 | **What if we set all the weights of a neural network to 0? ⭐️**
698 |
699 | If all the weights of a neural network are set to zero, the output of each connection is same (W*x = 0). This means the gradients which are backpropagated to each connection in a layer is same. This means all the connections/weights learn the same thing, and the model never converges.
700 |
701 |
702 |
703 | **What regularization techniques for neural nets do you know? ⭐️**
704 |
705 | Answer here
706 |
707 |
708 |
709 | **What is dropout? Why is it useful? How does it work? ⭐️**
710 |
711 | Dropout is a technique that at each training step turns off each neuron with a certain probability of *p*. This way at each iteration we train only *1-p* of neurons, which forces the network not to rely only on the subset of neurons for feature representation. This leads to regularizing effects that are controlled by the hyperparameter *p*.
712 |
713 |
714 |
715 |
716 | ## Optimization in neural networks
717 |
718 | **What is backpropagation? How does it work? Why do we need it? ⭐️**
719 |
720 | Answer here
721 |
722 |
723 |
724 | **Which optimization techniques for training neural nets do you know? ⭐️**
725 |
726 | Answer here
727 |
728 |
729 |
730 | **How do we use SGD (stochastic gradient descent) for training a neural net? ⭐️**
731 |
732 | Answer here
733 |
734 |
735 |
736 | **What’s the learning rate? 👶**
737 |
738 | The learning rate is an important hyperparameter that controls how quickly the model is adapted to the problem during the training. It can be seen as the "step width" during the parameter updates, i.e. how far the weights are moved into the direction of the minimum of our optimization problem.
739 |
740 |
741 |
742 | **What happens when the learning rate is too large? Too small? 👶**
743 |
744 | A large learning rate can accelerate the training. However, it is possible that we "shoot" too far and miss the minimum of the function that we want to optimize, which will not result in the best solution. On the other hand, training with a small learning rate takes more time but it is possible to find a more precise minimum. The downside can be that the solution is stuck in a local minimum, and the weights won't update even if it is not the best possible global solution.
745 |
746 |
747 |
748 | **How to set the learning rate? ⭐️**
749 |
750 | Answer here
751 |
752 |
753 |
754 | **What is Adam? What’s the main difference between Adam and SGD? ⭐️**
755 |
756 | Answer here
757 |
758 |
759 |
760 | **When would you use Adam and when SGD? ⭐️**
761 |
762 | Answer here
763 |
764 |
765 |
766 | **Do we want to have a constant learning rate or we better change it throughout training? ⭐️**
767 |
768 | Answer here
769 |
770 |
771 |
772 | **How do we decide when to stop training a neural net? 👶**
773 |
774 | Answer here
775 |
776 |
777 |
778 | **What is model checkpointing? ⭐️**
779 |
780 | Answer here
781 |
782 |
783 |
784 | **Can you tell us how you approach the model training process? ⭐️**
785 |
786 | Answer here
787 |
788 |
789 |
790 |
791 | ## Neural networks for computer vision
792 |
793 | **How we can use neural nets for computer vision? ⭐️**
794 |
795 | Answer here
796 |
797 |
798 |
799 | **What’s a convolutional layer? ⭐️**
800 |
801 | Answer here
802 |
803 |
804 |
805 | **Why do we actually need convolutions? Can’t we use fully-connected layers for that? ⭐️**
806 |
807 | Answer here
808 |
809 |
810 |
811 | **What’s pooling in CNN? Why do we need it? ⭐️**
812 |
813 | Answer here
814 |
815 |
816 |
817 | **How does max pooling work? Are there other pooling techniques? ⭐️**
818 |
819 | Answer here
820 |
821 |
822 |
823 | **Are CNNs resistant to rotations? What happens to the predictions of a CNN if an image is rotated? 🚀**
824 |
825 | Answer here
826 |
827 |
828 |
829 | **What are augmentations? Why do we need them? 👶What kind of augmentations do you know? 👶How to choose which augmentations to use? ⭐️**
830 |
831 | Answer here
832 |
833 |
834 |
835 | **What kind of CNN architectures for classification do you know? 🚀**
836 |
837 | Answer here
838 |
839 |
840 |
841 | **What is transfer learning? How does it work? ⭐️**
842 |
843 | Given a source domain D_S and learning task T_S, a target domain D_T and learning task T_T, transfer learning aims to help improve the learning of the target predictive function f_T in D_T using the knowledge in D_S and T_S, where D_S ≠ D_T,or T_S ≠ T_T. In other words, transfer learning enables to reuse knowledge coming from other domains or learning tasks.
844 |
845 | In the context of CNNs, we can use networks that were pre-trained on popular datasets such as ImageNet. We then can use the weights of the layers that learn to represent features and combine them with a new set of layers that learns to map the feature representations to the given classes. Two popular strategies are either to freeze the layers that learn the feature representations completely, or to give them a smaller learning rate.
846 |
847 |
848 |
849 | **What is object detection? Do you know any architectures for that? 🚀**
850 |
851 | Answer here
852 |
853 |
854 |
855 | **What is object segmentation? Do you know any architectures for that? 🚀**
856 |
857 | Answer here
858 |
859 |
860 |
861 |
862 | ## Text classification
863 |
864 | **How can we use machine learning for text classification? ⭐️**
865 |
866 | Answer here
867 |
868 |
869 |
870 | **What is bag of words? How we can use it for text classification? ⭐️**
871 |
872 | Bag of Words is a representation of text that describes the occurrence of words within a document. The order or structure of the words is not considered. For text classification, we look at the histogram of the words within the text and consider each word count as a feature.
873 |
874 |
875 |
876 | **What are the advantages and disadvantages of bag of words? ⭐️**
877 |
878 | Advantages:
879 | 1. Simple to understand and implement.
880 |
881 | Disadvantages:
882 | 1. The vocabulary requires careful design, most specifically in order to manage the size, which impacts the sparsity of the document representations.
883 | 2. Sparse representations are harder to model both for computational reasons (space and time complexity) and also for information reasons
884 | 3. Discarding word order ignores the context, and in turn meaning of words in the document. Context and meaning can offer a lot to the model, that if modeled could tell the difference between the same words differently arranged (“this is interesting” vs “is this interesting”), synonyms (“old bike” vs “used bike”).
885 |
886 |
887 |
888 | **What are N-grams? How can we use them? ⭐️**
889 |
890 | The function to tokenize into consecutive sequences of words is called n-grams. It can be used to find out N most co-occurring words (how often word X is followed by word Y) in a given sentence.
891 |
892 |
893 |
894 | **How large should be N for our bag of words when using N-grams? ⭐️**
895 |
896 | Answer here
897 |
898 |
899 |
900 | **What is TF-IDF? How is it useful for text classification? ⭐️**
901 |
902 | Term Frequency (TF) is a scoring of the frequency of the word in the current document. Inverse Document Frequency(IDF) is a scoring of how rare the word is across documents. It is used in scenario where highy recurring words may not contain as much informational content
903 | as the domain specific words. For example, words like “the” that are frequent across all documents therefore need to be less weighted. The Tf-IDF score highlights words that are distinct (contain useful information) in a given document.
904 |
905 |
906 |
907 | **Which model would you use for text classification with bag of words features? ⭐️**
908 |
909 | Answer here
910 |
911 |
912 |
913 | **Would you prefer gradient boosting trees model or logistic regression when doing text classification with bag of words? ⭐️**
914 |
915 | Usually logistic regression is better because bag of words creates a matrix with large number of columns. For a huge number of columns logistic regression is usually faster than gradient boosting trees.
916 |
917 |
918 |
919 | **What are word embeddings? Why are they useful? Do you know Word2Vec? ⭐️**
920 |
921 | Answer here
922 |
923 |
924 |
925 | **Do you know any other ways to get word embeddings? 🚀**
926 |
927 | Answer here
928 |
929 |
930 |
931 | **If you have a sentence with multiple words, you may need to combine multiple word embeddings into one. How would you do it? ⭐️**
932 |
933 | Approaches ranked from simple to more complex:
934 |
935 | 1. Take an average over all words
936 | 2. Take a weighted average over all words. Weighting can be done by inverse document frequency (idf part of tf-idf).
937 | 3. Use ML model like LSTM or Transformer.
938 |
939 |
940 |
941 | **Would you prefer gradient boosting trees model or logistic regression when doing text classification with embeddings? ⭐️**
942 |
943 | Answer here
944 |
945 |
946 |
947 | **How can you use neural nets for text classification? 🚀**
948 |
949 | Answer here
950 |
951 |
952 |
953 | **How can we use CNN for text classification? 🚀**
954 |
955 | Answer here
956 |
957 |
958 |
959 |
960 | ## Clustering
961 |
962 | **What is unsupervised learning? 👶**
963 |
964 | Unsupervised learning aims to detect paterns in data where no labels are given.
965 |
966 |
967 |
968 | **What is clustering? When do we need it? 👶**
969 |
970 | Clustering algorithms group objects such that similar feature points are put into the same groups (clusters) and dissimilar feature points are put into different clusters.
971 |
972 |
973 |
974 | **Do you know how K-means works? ⭐️**
975 |
976 | 1. Partition points into k subsets.
977 | 2. Compute the seed points as the new centroids of the clusters of the current partitioning.
978 | 3. Assign each point to the cluster with the nearest seed point.
979 | 4. Go back to step 2 or stop when the assignment does not change.
980 |
981 |
982 |
983 | **How to select K for K-means? ⭐️**
984 |
985 | * Domain knowledge, i.e. an expert knows the value of k
986 | * Elbow method: compute the clusters for different values of k, for each k, calculate the total within-cluster sum of square, plot the sum according to the number of clusters and use the band as the number of clusters.
987 | * Average silhouette method: compute the clusters for different values of k, for each k, calculate the average silhouette of observations, plot the silhouette according to the number of clusters and select the maximum as the number of clusters.
988 |
989 |
990 |
991 | **What are the other clustering algorithms do you know? ⭐️**
992 |
993 | * k-medoids: Takes the most central point instead of the mean value as the center of the cluster. This makes it more robust to noise.
994 | * Agglomerative Hierarchical Clustering (AHC): hierarchical clusters combining the nearest clusters starting with each point as its own cluster.
995 | * DIvisive ANAlysis Clustering (DIANA): hierarchical clustering starting with one cluster containing all points and splitting the clusters until each point describes its own cluster.
996 | * Density-Based Spatial Clustering of Applications with Noise (DBSCAN): Cluster defined as maximum set of density-connected points.
997 |
998 |
999 |
1000 | **Do you know how DBScan works? ⭐️**
1001 |
1002 | * Two input parameters epsilon (neighborhood radius) and minPts (minimum number of points in an epsilon-neighborhood)
1003 | * Cluster defined as maximum set of density-connected points.
1004 | * Points p_j and p_i are density-connected w.r.t. epsilon and minPts if there is a point o such that both, i and j are density-reachable from o w.r.t. epsilon and minPts.
1005 | * p_j is density-reachable from p_i w.r.t. epsilon, minPts if there is a chain of points p_i -> p_i+1 -> p_i+x = p_j such that p_i+x is directly density-reachable from p_i+x-1.
1006 | * p_j is a directly density-reachable point of the neighborhood of p_i if dist(p_i,p_j) <= epsilon.
1007 |
1008 |
1009 |
1010 | **When would you choose K-means and when DBScan? ⭐️**
1011 |
1012 | * DBScan is more robust to noise.
1013 | * DBScan is better when the amount of clusters is difficult to guess.
1014 | * K-means has a lower complexity, i.e. it will be much faster, especially with a larger amount of points.
1015 |
1016 |
1017 |
1018 |
1019 | ## Dimensionality reduction
1020 | **What is the curse of dimensionality? Why do we care about it? ⭐️**
1021 |
1022 | Data in only one dimension is relatively tightly packed. Adding a dimension stretches the points across that dimension, pushing them further apart. Additional dimensions spread the data even further making high dimensional data extremely sparse. We care about it, because it is difficult to use machine learning in sparse spaces.
1023 |
1024 |
1025 |
1026 | **Do you know any dimensionality reduction techniques? ⭐️**
1027 |
1028 | * Singular Value Decomposition (SVD)
1029 | * Principal Component Analysis (PCA)
1030 | * Linear Discriminant Analysis (LDA)
1031 | * T-distributed Stochastic Neighbor Embedding (t-SNE)
1032 | * Autoencoders
1033 | * Fourier and Wavelet Transforms
1034 |
1035 |
1036 |
1037 | **What’s singular value decomposition? How is it typically used for machine learning? ⭐️**
1038 |
1039 | * Singular Value Decomposition (SVD) is a general matrix decomposition method that factors a matrix X into three matrices L (left singular values), Σ (diagonal matrix) and R^T (right singular values).
1040 | * For machine learning, Principal Component Analysis (PCA) is typically used. It is a special type of SVD where the singular values correspond to the eigenvectors and the values of the diagonal matrix are the squares of the eigenvalues. We use these features as they are statistically descriptive.
1041 | * Having calculated the eigenvectors and eigenvalues, we can use the Kaiser-Guttman criterion, a scree plot or the proportion of explained variance to determine the principal components (i.e. the final dimensionality) that are useful for dimensionality reduction.
1042 |
1043 |
1044 |
1045 |
1046 | ## Ranking and search
1047 |
1048 | **What is the ranking problem? Which models can you use to solve them? ⭐️**
1049 |
1050 | Answer here
1051 |
1052 |
1053 |
1054 | **What are good unsupervised baselines for text information retrieval? ⭐️**
1055 |
1056 | Answer here
1057 |
1058 |
1059 |
1060 | **How would you evaluate your ranking algorithms? Which offline metrics would you use? ⭐️**
1061 |
1062 | Answer here
1063 |
1064 |
1065 |
1066 | **What is precision and recall at k? ⭐️**
1067 |
1068 | Precision at k and recall at k are evaluation metrics for ranking algorithms. Precision at k shows the share of relevant items in the first *k* results of the ranking algorithm. And Recall at k indicates the share of relevant items returned in top *k* results out of all correct answers for a given query.
1069 |
1070 | Example:
1071 | For a search query "Car" there are 3 relevant products in your shop. Your search algorithm returns 2 of those relevant products in the first 5 search results.
1072 | Precision at 5 = # num of relevant products in search result / k = 2/5 = 40%
1073 | Recall at 5 = # num of relevant products in search result / # num of all relevant products = 2/3 = 66.6%
1074 |
1075 |
1076 |
1077 | **What is mean average precision at k? ⭐️**
1078 |
1079 | Answer here
1080 |
1081 |
1082 |
1083 | **How can we use machine learning for search? ⭐️**
1084 |
1085 | Answer here
1086 |
1087 |
1088 |
1089 | **How can we get training data for our ranking algorithms? ⭐️**
1090 |
1091 | Answer here
1092 |
1093 |
1094 |
1095 | **Can we formulate the search problem as a classification problem? How? ⭐️**
1096 |
1097 | Answer here
1098 |
1099 |
1100 |
1101 | **How can we use clicks data as the training data for ranking algorithms? 🚀**
1102 |
1103 | Answer here
1104 |
1105 |
1106 |
1107 | **Do you know how to use gradient boosting trees for ranking? 🚀**
1108 |
1109 | Answer here
1110 |
1111 |
1112 |
1113 | **How do you do an online evaluation of a new ranking algorithm? ⭐️**
1114 |
1115 | Answer here
1116 |
1117 |
1118 |
1119 |
1120 | ## Recommender systems
1121 |
1122 | **What is a recommender system? 👶**
1123 |
1124 | Recommender systems are software tools and techniques that provide suggestions for items that are most likely of interest to a particular user.
1125 |
1126 |
1127 |
1128 | **What are good baselines when building a recommender system? ⭐️**
1129 |
1130 | * A good recommer system should give relevant and personalized information.
1131 | * It should not recommend items the user knows well or finds easily.
1132 | * It should make diverse suggestions.
1133 | * A user should explore new items.
1134 |
1135 |
1136 |
1137 | **What is collaborative filtering? ⭐️**
1138 |
1139 | * Collaborative filtering is the most prominent approach to generate recommendations.
1140 | * It uses the wisdom of the crowd, i.e. it gives recommendations based on the experience of others.
1141 | * A recommendation is calculated as the average of other experiences.
1142 | * Say we want to give a score that indicates how much user u will like an item i. Then we can calculate it with the experience of N other users U as r_ui = 1/N * sum(v in U) r_vi.
1143 | * In order to rate similar experiences with a higher weight, we can introduce a similarity between users that we use as a multiplier for each rating.
1144 | * Also, as users have an individual profile, one user may have an average rating much larger than another user, so we use normalization techniques (e.g. centering or Z-score normalization) to remove the users' biases.
1145 | * Collaborative filtering does only need a rating matrix as input and improves over time. However, it does not work well on sparse data, does not work for cold starts (see below) and usually tends to overfit.
1146 |
1147 |
1148 |
1149 | **How we can incorporate implicit feedback (clicks, etc) into our recommender systems? ⭐️**
1150 |
1151 | In comparison to explicit feedback, implicit feedback datasets lack negative examples. For example, explicit feedback can be a positive or a negative rating, but implicit feedback may be the number of purchases or clicks. One popular approach to solve this problem is named weighted alternating least squares (wALS) [Hu, Y., Koren, Y., & Volinsky, C. (2008, December). Collaborative filtering for implicit feedback datasets. In Data Mining, 2008. ICDM'08. Eighth IEEE International Conference on (pp. 263-272). IEEE.]. Instead of modeling the rating matrix directly, the numbers (e.g. amount of clicks) describe the strength in observations of user actions. The model tries to find latent factors that can be used to predict the expected preference of a user for an item.
1152 |
1153 |
1154 |
1155 | **What is the cold start problem? ⭐️**
1156 |
1157 | Collaborative filterung incorporates crowd knowledge to give recommendations for certain items. Say we want to recommend how much a user will like an item, we then will calculate the score using the recommendations of other users for this certain item. We can distinguish between two different ways of a cold start problem now. First, if there is a new item that has not been rated yet, we cannot give any recommendation. Also, when there is a new user, we cannot calculate a similarity to any other user.
1158 |
1159 |
1160 |
1161 | **Possible approaches to solving the cold start problem? ⭐️🚀**
1162 |
1163 | * Content-based filtering incorporates features about items to calculate a similarity between them. In this way, we can recommend items that have a high similarity to items that a user liked already. In this way, we are not dependant on the ratings of other users for a given item anymore and solve the cold start problem for new items.
1164 | * Demographic filtering incorporates user profiles to calculate a similarity between them and solves the cold start problem for new users.
1165 |
1166 |
1167 |
1168 |
1169 | ## Time series
1170 |
1171 | **What is a time series? 👶**
1172 |
1173 | A time series is a set of observations ordered in time usually collected at regular intervals.
1174 |
1175 |
1176 |
1177 | **How is time series different from the usual regression problem? 👶**
1178 |
1179 | The principle behind causal forecasting is that the value that has to be predicted is dependant on the input features (causal factors). In time series forecasting, the to be predicted value is expected to follow a certain pattern over time.
1180 |
1181 |
1182 |
1183 | **Which models do you know for solving time series problems? ⭐️**
1184 |
1185 | * Simple Exponential Smoothing: approximate the time series with an exponentional function
1186 | * Trend-Corrected Exponential Smoothing (Holt‘s Method): exponential smoothing that also models the trend
1187 | * Trend- and Seasonality-Corrected Exponential Smoothing (Holt-Winter‘s Method): exponential smoothing that also models trend and seasonality
1188 | * Time Series Decomposition: decomposed a time series into the four components trend, seasonal variation, cycling varation and irregular component
1189 | * Autoregressive models: similar to multiple linear regression, except that the dependent variable y_t depends on its own previous values rather than other independent variables.
1190 | * Deep learning approaches (RNN, LSTM, etc.)
1191 |
1192 |
1193 |
1194 | **If there’s a trend in our series, how we can remove it? And why would we want to do it? ⭐️**
1195 |
1196 | We can explicitly model the trend (and/or seasonality) with approaches such as Holt's Method or Holt-Winter's Method. We want to explicitly model the trend to reach the stationarity property for the data. Many time series approaches require stationarity. Without stationarity,the interpretation of the results of these analyses is problematic [Manuca, Radu & Savit, Robert. (1996). Stationarity and nonstationarity in time series analysis. Physica D: Nonlinear Phenomena. 99. 134-161. 10.1016/S0167-2789(96)00139-X. ].
1197 |
1198 |
1199 |
1200 | **You have a series with only one variable “y” measured at time t. How do predict “y” at time t+1? Which approaches would you use? ⭐️**
1201 |
1202 | We want to look at the correlation between different observations of y. This measure of correlation is called autocorrelation. Autoregressive models are multiple regression models where the time-lag series of the original time series are treated like multiple independent variables.
1203 |
1204 |
1205 |
1206 | **You have a series with a variable “y” and a set of features. How do you predict “y” at t+1? Which approaches would you use? ⭐️**
1207 |
1208 | Given the assumption that the set of features gives a meaningful causation to y, a causal forecasting approach such as linear regression or multiple nonlinear regression might be useful. In case there is a lot of data and the explanability of the results is not a high priority, we can also consider deep learning approaches.
1209 |
1210 |
1211 |
1212 | **What are the problems with using trees for solving time series problems? ⭐️**
1213 |
1214 | Random Forest models are not able to extrapolate time series data and understand increasing/decreasing trends. It will provide us with average data points if the validation data has values greater than the training data points.
1215 |
1216 |
1217 |
--------------------------------------------------------------------------------