├── data
└── .gitkeep
├── binder
├── install.R
└── Dockerfile
├── assets
├── cbind.png
├── boxplot.png
├── date_formats.png
└── datacamp.svg
├── template-r-project.Rproj
├── .gitignore
├── LICENSE
├── webinar.yml
├── README.md
└── notebooks
├── cleaning_data_in_r.ipynb
├── cleaning_data_in_r_solution.ipynb
└── cleaning_data_in_r_annotated.ipynb
/data/.gitkeep:
--------------------------------------------------------------------------------
1 |
--------------------------------------------------------------------------------
/binder/install.R:
--------------------------------------------------------------------------------
1 | # Install additional packages
2 |
--------------------------------------------------------------------------------
/assets/cbind.png:
--------------------------------------------------------------------------------
https://raw.githubusercontent.com/datacamp/cleaning-data-in-r-live-training/master/assets/cbind.png
--------------------------------------------------------------------------------
/assets/boxplot.png:
--------------------------------------------------------------------------------
https://raw.githubusercontent.com/datacamp/cleaning-data-in-r-live-training/master/assets/boxplot.png
--------------------------------------------------------------------------------
/assets/date_formats.png:
--------------------------------------------------------------------------------
https://raw.githubusercontent.com/datacamp/cleaning-data-in-r-live-training/master/assets/date_formats.png
--------------------------------------------------------------------------------
/template-r-project.Rproj:
--------------------------------------------------------------------------------
1 | Version: 1.0
2 |
3 | RestoreWorkspace: Default
4 | SaveWorkspace: Default
5 | AlwaysSaveHistory: Default
6 |
7 | EnableCodeIndexing: Yes
8 | UseSpacesForTab: Yes
9 | NumSpacesForTab: 2
10 | Encoding: UTF-8
11 |
12 | RnwWeave: Sweave
13 | LaTeX: pdfLaTeX
14 |
15 | AutoAppendNewline: Yes
16 | StripTrailingWhitespace: Yes
17 |
--------------------------------------------------------------------------------
/binder/Dockerfile:
--------------------------------------------------------------------------------
1 | FROM rocker/binder:3.6.2
2 |
3 | ## Declares build arguments
4 | ARG NB_USER
5 | ARG NB_UID
6 |
7 | ## Copies your repo files into the Docker Container
8 | USER root
9 | COPY . ${HOME}
10 | ## Enable this to copy files from the binder subdirectory
11 | ## to the home, overriding any existing files.
12 | ## Useful to create a setup on binder that is different from a
13 | ## clone of your repository
14 | COPY binder ${HOME}
15 | RUN chown -R ${NB_USER} ${HOME}
16 |
17 | ## Become normal user again
18 | USER ${NB_USER}
19 |
20 | ## Run an install.R script, if it exists.
21 | RUN if [ -f install.R ]; then R --quiet -f install.R; fi
22 |
--------------------------------------------------------------------------------
/.gitignore:
--------------------------------------------------------------------------------
1 | # History files
2 | .Rhistory
3 | .Rapp.history
4 |
5 | # Session Data files
6 | .RData
7 |
8 | # User-specific files
9 | .Ruserdata
10 |
11 | # Example code in package build process
12 | *-Ex.R
13 |
14 | # Output files from R CMD build
15 | /*.tar.gz
16 |
17 | # Output files from R CMD check
18 | /*.Rcheck/
19 |
20 | # RStudio files
21 | .Rproj.user/
22 |
23 | # produced vignettes
24 | vignettes/*.html
25 | vignettes/*.pdf
26 |
27 | # OAuth2 token, see https://github.com/hadley/httr/releases/tag/v0.3
28 | .httr-oauth
29 |
30 | # knitr and R markdown default cache directories
31 | *_cache/
32 | /cache/
33 |
34 | # Temporary files created by R markdown
35 | *.utf8.md
36 | *.knit.md
37 |
38 | # R Environment Variables
39 | .Renviron
40 |
41 | # Mac OS
42 | .DS_Store
43 |
--------------------------------------------------------------------------------
/LICENSE:
--------------------------------------------------------------------------------
1 | MIT License
2 |
3 | Copyright (c) 2020 Ramnath Vaidyanathan
4 |
5 | Permission is hereby granted, free of charge, to any person obtaining a copy
6 | of this software and associated documentation files (the "Software"), to deal
7 | in the Software without restriction, including without limitation the rights
8 | to use, copy, modify, merge, publish, distribute, sublicense, and/or sell
9 | copies of the Software, and to permit persons to whom the Software is
10 | furnished to do so, subject to the following conditions:
11 |
12 | The above copyright notice and this permission notice shall be included in all
13 | copies or substantial portions of the Software.
14 |
15 | THE SOFTWARE IS PROVIDED "AS IS", WITHOUT WARRANTY OF ANY KIND, EXPRESS OR
16 | IMPLIED, INCLUDING BUT NOT LIMITED TO THE WARRANTIES OF MERCHANTABILITY,
17 | FITNESS FOR A PARTICULAR PURPOSE AND NONINFRINGEMENT. IN NO EVENT SHALL THE
18 | AUTHORS OR COPYRIGHT HOLDERS BE LIABLE FOR ANY CLAIM, DAMAGES OR OTHER
19 | LIABILITY, WHETHER IN AN ACTION OF CONTRACT, TORT OR OTHERWISE, ARISING FROM,
20 | OUT OF OR IN CONNECTION WITH THE SOFTWARE OR THE USE OR OTHER DEALINGS IN THE
21 | SOFTWARE.
22 |
--------------------------------------------------------------------------------
/webinar.yml:
--------------------------------------------------------------------------------
1 | # A catch and descriptive title for the webinar.
2 | title: Building Web Apps with Shiny
3 | # The technology used [r / python/ sql]
4 | technology: r
5 | # The url slug to be used for the webinar
6 | slug: building-web-apps-withs-shiny
7 | # The registration link on GotoWebinar
8 | registerLink: https://attendee.gotowebinar.com/register/
9 | # The date and time for the webinar in the same format
10 | time: 'Wednesday 15 April, 11 AM EST, 4 PM BST'
11 | # A description of the webinar
12 | description: >
13 | Join us for this live, hands-on training where you will learn how to apply
14 | the power of shiny to build web applications with R. This session will run
15 | for three hours, allowing you time to really immerse yourself in the subject,
16 | and includes short breaks and opportunities to ask the expert questions
17 | throughout the training.
18 | # A list of key learning objectives
19 | whatWillILearn:
20 | - Apply your DataCamp knowledge to new data
21 | - Identify and transform data to create common graphics with ggplot2
22 | - Create and use plots to answer common data questions
23 | - Share visualizations to answer business questions
24 | # A description of how to prepare for the webinar
25 | whatShouldIPrepare: >
26 | You can join the webinar from your web browser following the instructions
27 | you receive in your registration email. All required data/resources will be
28 | provided in the training.
29 | # A description of who should attend the webinar and what courses are prereqs.
30 | whoShouldAttend:
31 | text: >
32 | This course is open to all DataCamp Premium learners, looking to improve
33 | their data visualization skills. We recommend that you have taken at least
34 | one of the following courses before attending:
35 | courses:
36 | - title: Introduction to Data Visualization with ggplot2
37 | path: /courses/introduction-to-data-visualization-with-ggplot2
38 | - title: Data Visualization with ggplot2 (part 1)
39 | path: /courses/data-visualization-with-ggplot2-1
40 | - title: Introduction to the Tidyverse
41 | path: /courses/introduction-to-the-tidyverse
42 | # Some details about the instructor
43 | instructor:
44 | name: Ramnath Vaidyanathan
45 | title: VP of Product Research
46 | image:
47 | description: >
48 | Ramnath is the VP of Product Research at DataCamp, where he helps drive
49 | product innovation and data-driven development. Ramnath has a PhD in
50 | Operations Management from the Wharton School, and has worked as an
51 | Assistant Professor at the Desautels Faculty of Management, McGill
52 | University
53 | linkedIn: https://www.linkedin.com/in/ramnathv
54 |
--------------------------------------------------------------------------------
/assets/datacamp.svg:
--------------------------------------------------------------------------------
1 |
--------------------------------------------------------------------------------
/README.md:
--------------------------------------------------------------------------------
1 | # **Cleaning Data in R** by **Maggie Matsui**
2 |
3 | Live training sessions are designed to mimic the flow of how a real data scientist would address a problem or a task. As such, a session needs to have some “narrative” where learners are achieving stated learning objectives in the form of a real-life data science task or project. For example, a data visualization live session could be around analyzing a dataset and creating a report with a specific business objective in mind _(ex: analyzing and visualizing churn)_, a data cleaning live session could be about preparing a dataset for analysis etc ...
4 |
5 | As part of the 'Live training Spec' process, you will need to complete the following tasks:
6 |
7 | Edit this README by filling in the information for steps 1 - 4.
8 |
9 | ## Step 1: Foundations
10 |
11 | This part of the 'Live training Spec' process is designed to help guide you through session design by having you think through several key questions. Please make sure to delete the examples provided here for you.
12 |
13 | ### A. What problem(s) will students learn how to solve? (minimum of 5 problems)
14 |
15 | > _Here's an example from the Python for Spreadsheeets Users live session_
16 | >
17 | > - Key considerations to take in when transitioning from spreadsheets to Python.
18 | > - The Data Scientist mindset and keys to success in transitioning to Python.
19 | > - How to import `.xlsx` and `.csv` files into Python using `pandas`.
20 | > - How to filter a DataFrame using `pandas`.
21 | > - How to create new columns out of your DataFrame for more interesting features.
22 | > - Perform exploratory analysis of a DataFrame in `pandas`.
23 | > - How to clean a DataFrame using `pandas` to make it ready for analysis.
24 | > - Apply common spreadsheets operations such as pivot tables and vlookups in Python using `pandas`.
25 | > - Create simple, interesting visualizations using `matplotlib`.
26 |
27 |
28 | ### B. What technologies, packages, or functions will students use? Please be exhaustive.
29 |
30 | > - pandas
31 | > - matplotlib
32 | > - seaborn
33 |
34 | ### C. What terms or jargon will you define?
35 |
36 | _Whether during your opening and closing talk or your live training, you might have to define some terms and jargon to walk students through a problem you’re solving. Intuitive explanations using analogies are encouraged._
37 |
38 | > _Here's an example from the [Python for Spreadsheeets Users live session](https://www.datacamp.com/resources/webinars/live-training-python-for-spreadsheet-users)._
39 | >
40 | > - Packages: Packages are pieces of software we can import to Python. Similar to how we download, install Excel on MacOs, we import pandas on Python. (You can find it at minute 6:30)
41 |
42 | ### D. What mistakes or misconceptions do you expect?
43 |
44 | _To help minimize the amount of Q&As and make your live training re-usable, list out some mistakes and misconceptions you think students might encounter along the way._
45 |
46 | > _Here's an example from the [Data Visualization in Python live session](https://www.datacamp.com/resources/webinars/data-visualization-in-python)_
47 | >
48 | > - Anatomy of a matplotlib figure: When calling a matplotlib plot, a figure, axes and plot is being created behind the background. (You can find it at minute 11)
49 | > - As long as you do understand how plots work behind the scenes, you don't need to memorize syntax to customize your plot.
50 |
51 | ### E. What datasets will you use?
52 |
53 | Live training sessions are designed to walk students through something closer to a real-life data science workflow. Accordingly, the dataset needs to accommodate that user experience.
54 | As a rule of thumb, your dataset should always answer yes to the following question:
55 | > Is the dataset/problem I’m working on, something an industry data scientist/analyst could work on?
56 |
57 | Check our [datasets to avoid](https://instructor-support.datacamp.com/en/articles/2360699-datasets-to-avoid) list.
58 |
59 | ## Step 2: Who is this session for?
60 |
61 | Terms like "beginner" and "expert" mean different things to different people, so we use personas to help instructors clarify a live training's audience. When designing a specific live training, instructors should explain how it will or won't help these people, and what extra skills or prerequisite knowledge they are assuming their students have above and beyond what's included in the persona.
62 |
63 | - [ ] Please select the roles and industries that align with your live training.
64 | - [ ] Include an explanation describing your reasoning and any other relevant information.
65 |
66 | ### What roles would this live training be suitable for?
67 |
68 | *Check all that apply.*
69 |
70 | - [ ] Data Consumer
71 | - [ ] Leader
72 | - [ ] Data Analyst
73 | - [ ] Citizen Data Scientist
74 | - [ ] Data Scientist
75 | - [ ] Data Engineer
76 | - [ ] Database Administrator
77 | - [ ] Statistician
78 | - [ ] Machine Learning Scientist
79 | - [ ] Programmer
80 | - [ ] Other (please describe)
81 |
82 | ### What industries would this apply to?
83 |
84 | *List one or more industries that the content would be appropriate for.*
85 |
86 |
87 | ### What level of expertise should learners have before beginning the live training?
88 |
89 | *List three or more examples of skills that you expect learners to have before beginning the live training*
90 |
91 | > - Can draw common plot types (scatter, bar, histogram) using matplotlib and interpret them
92 | > - Can run a linear regression, use it to make predictions, and interpret the coefficients.
93 | > - Can calculate grouped summary statistics using SELECT queries with GROUP BY clauses.
94 |
95 |
96 | ## Step 3: Prerequisites
97 |
98 | List any prerequisite courses you think your live training could use from. This could be the live session’s companion course or a course you think students should take before the session. Prerequisites act as a guiding principle for your session and will set the topic framework, but you do not have to limit yourself in the live session to the syntax used in the prerequisite courses.
99 |
100 |
101 | ## Step 4: Session Outline
102 |
103 | A live training session usually begins with an introductory presentation, followed by the live training itself, and an ending presentation. Your live session is expected to be around 2h30m-3h long (including Q&A) with a hard-limit at 3h30m. You can check out our live training content guidelines [here](_LINK_).
104 |
105 |
106 | > _Example from [Python for Spreadsheet Users](https://www.datacamp.com/resources/webinars/live-training-python-for-spreadsheet-users)_
107 | >
108 | > ### Introduction Slides
109 | > - Introduction to the webinar and instructor (led by DataCamp TA)
110 | > - Introduction to the topics
111 | > - Discuss need to become data fluent
112 | > - Define data fluency
113 | > - Discuss how learning Python fits into that and go over session outline
114 | > - Set expectations about Q&A
115 | >
116 | > ### Live Training
117 | > #### Exploratory Data Analysis
118 | > - Import data and print header of DataFrame `pd.read_excel()`, `.head()`
119 | > - Glimpse at the data to
120 | > - Get column types using `.dtypes`
121 | > - Use `.describe()`, `.info()`
122 | > - **Q&A**
123 | > #### Data Cleaning and making it ready for analysis
124 | > - Convert date columns to datetime `pd.to_datetime()`
125 | > - Change column names
126 | > - Extract year, month from datetime `.strftime()`
127 | > - Drop an irrelevant column `.drop()`
128 | > - Fill missing values with `.fillna()`
129 | > #### Creating a report
130 | > - First report question: What is our overall sales performance this year? `.groupby()`, `.plt.plot()`
131 | > - Second report question: What is our overall sales performance this year? `.merge()`, `.groupby()`, `plt.plot()`
132 | > - Third report question: What is our overall sales performance this year? `.merge()`, `.groupby()`, `plt.plot()`
133 | > - **Q&A**
134 | >
135 | > ### Ending slides
136 | > - Recap of what we learned
137 | > - The data science mindset
138 | > - Call to action and course recommendations
139 |
140 | ## Authoring your session
141 |
142 | To get yourself started with setting up your live session, follow the steps below:
143 |
144 | 1. Download and install the "Open in Colabs" extension from [here](https://chrome.google.com/webstore/detail/open-in-colab/iogfkhleblhcpcekbiedikdehleodpjo?hl=en). This will let you take any jupyter notebook you see in a GitHub repository and open it as a **temporary** Colabs link.
145 | 2. Upload your dataset(s) to the `data` folder.
146 | 3. Upload your images, gifs, or any other assets you want to use in the notebook in the `assets` folder.
147 | 4. Check out the notebooks templates in the `notebooks` folder, and keep the template you want for your session while deleting all remaining ones.
148 | 5. Preview your desired notebook, press on "Open in Colabs" extension - and start developing your content in colabs _(which will act as the solution code to the session)_. :warning: **Important** :warning: Your progress will **not** be saved on Google Colabs since it's a temporary link. To save your progress, make sure to press on `File`, `Save a copy in GitHub` and follow remaining prompts. You can also download the notebook locally and develop the content there as long you test out that the syntax works on Colabs as well.
149 | 6. Once your notebooks is ready to go, give it the name `session_name_solution.ipynb` create an empty version of the Notebook to be filled out by you and learners during the session, end the file name with `session_name_learners.ipynb`.
150 | 7. Create Colabs links for both sessions and save them in notebooks :tada:
151 |
--------------------------------------------------------------------------------
/notebooks/cleaning_data_in_r.ipynb:
--------------------------------------------------------------------------------
1 | {
2 | "nbformat": 4,
3 | "nbformat_minor": 0,
4 | "metadata": {
5 | "colab": {
6 | "name": "cleaning_data_in_R.ipynb",
7 | "provenance": []
8 | },
9 | "kernelspec": {
10 | "name": "ir",
11 | "display_name": "R"
12 | }
13 | },
14 | "cells": [
15 | {
16 | "cell_type": "markdown",
17 | "metadata": {
18 | "id": "OJYbvo8eV-Rd",
19 | "colab_type": "text"
20 | },
21 | "source": [
22 | "
\n",
23 | "\n",
24 | " \n",
25 | "
Cleaning Data in R Live Training
\n",
26 | "\n",
27 | " \n",
28 | "\n",
29 | "\n",
30 | "Welcome to this hands-on training where you'll identify issues in a dataset and clean it from start to finish using R. It's often said that data scientists spend 80% of their time cleaning and manipulating data and only about 20% of their time analyzing it, so cleaning data is an important skill to master!\n",
31 | "\n",
32 | "In this session, you will:\n",
33 | "\n",
34 | "- Examine a dataset and identify its problem areas, and what needs to be done to fix them.\n",
35 | "-Convert between data types to make analysis easier.\n",
36 | "- Correct inconsistencies in categorical data.\n",
37 | "- Deal with missing data.\n",
38 | "- Perform data validation to ensure every value makes sense.\n",
39 | "\n",
40 | "## **The Dataset**\n",
41 | "\n",
42 | "The dataset we'll use is a CSV file named `nyc_airbnb.csv`, which contains data on [*Airbnb*](https://www.airbnb.com/) listings in New York City. It contains the following columns:\n",
43 | "\n",
44 | "- `listing_id`: The unique identifier for a listing\n",
45 | "- `name`: The description used on the listing\n",
46 | "- `host_id`: Unique identifier for a host\n",
47 | "- `host_name`: Name of host\n",
48 | "- `nbhood_full`: Name of borough and neighborhood\n",
49 | "- `coordinates`: Coordinates of listing _(latitude, longitude)_\n",
50 | "- `room_type`: Type of room \n",
51 | "- `price`: Price per night for listing\n",
52 | "- `nb_reviews`: Number of reviews received \n",
53 | "- `last_review`: Date of last review\n",
54 | "- `reviews_per_month`: Average number of reviews per month\n",
55 | "- `availability_365`: Number of days available per year\n",
56 | "- `avg_rating`: Average rating (from 0 to 5)\n",
57 | "- `avg_stays_per_month`: Average number of stays per month\n",
58 | "- `pct_5_stars`: Percent of reviews that were 5-stars\n",
59 | "- `listing_added`: Date when listing was added\n"
60 | ]
61 | },
62 | {
63 | "cell_type": "code",
64 | "metadata": {
65 | "id": "KUKG6fNMV_zf",
66 | "colab_type": "code",
67 | "cellView": "both",
68 | "colab": {}
69 | },
70 | "source": [
71 | "# Install non-tidyverse packages\n",
72 | "install.packages(\"visdat\")"
73 | ],
74 | "execution_count": 0,
75 | "outputs": []
76 | },
77 | {
78 | "cell_type": "code",
79 | "metadata": {
80 | "id": "brr08aZX9Wss",
81 | "colab_type": "code",
82 | "colab": {}
83 | },
84 | "source": [
85 | "# Load packages\n",
86 | "library(readr)\n",
87 | "library(dplyr)\n",
88 | "library(stringr)\n",
89 | "library(visdat)\n",
90 | "library(tidyr)\n",
91 | "library(ggplot2)\n",
92 | "library(forcats)"
93 | ],
94 | "execution_count": 0,
95 | "outputs": []
96 | },
97 | {
98 | "cell_type": "code",
99 | "metadata": {
100 | "id": "9VJyZeEo9M4O",
101 | "colab_type": "code",
102 | "colab": {}
103 | },
104 | "source": [
105 | "# Load dataset\n",
106 | "airbnb <- read_csv(\"https://raw.githubusercontent.com/datacamp/cleaning-data-in-r-live-training/master/assets/nyc_airbnb.csv\")"
107 | ],
108 | "execution_count": 0,
109 | "outputs": []
110 | },
111 | {
112 | "cell_type": "code",
113 | "metadata": {
114 | "id": "89DXT3Xl1SQ8",
115 | "colab_type": "code",
116 | "colab": {}
117 | },
118 | "source": [
119 | "# Examine the first few rows\n"
120 | ],
121 | "execution_count": 0,
122 | "outputs": []
123 | },
124 | {
125 | "cell_type": "markdown",
126 | "metadata": {
127 | "id": "kNE3y9ug1Zo5",
128 | "colab_type": "text"
129 | },
130 | "source": [
131 | "## **Diagnosing data cleaning problems**\n",
132 | "\n",
133 | "\n",
134 | "We'll need to get a good look at the data frame in order to identify any problems that may cause issues during an analysis. There are a variety of functions (both from base R and `dplyr`) that can help us with this:\n",
135 | "\n",
136 | "- `head()` to look at the first few rows of the data\n",
137 | "- `glimpse()` to get a summary of the variables' data types\n",
138 | "- `summary()` to compute summary statistics of each variable and display the number of missing values\n",
139 | "- `duplicated()` to find duplicates\n"
140 | ]
141 | },
142 | {
143 | "cell_type": "code",
144 | "metadata": {
145 | "id": "uaC2Q_Gm3m1I",
146 | "colab_type": "code",
147 | "colab": {}
148 | },
149 | "source": [
150 | "# Print the first few rows of data\n"
151 | ],
152 | "execution_count": 0,
153 | "outputs": []
154 | },
155 | {
156 | "cell_type": "code",
157 | "metadata": {
158 | "id": "ZO_jlHc74J62",
159 | "colab_type": "code",
160 | "colab": {}
161 | },
162 | "source": [
163 | "# Inspect data types\n"
164 | ],
165 | "execution_count": 0,
166 | "outputs": []
167 | },
168 | {
169 | "cell_type": "code",
170 | "metadata": {
171 | "id": "ewCibkuE4NP-",
172 | "colab_type": "code",
173 | "colab": {}
174 | },
175 | "source": [
176 | "# Examine summary statistics and missing values\n"
177 | ],
178 | "execution_count": 0,
179 | "outputs": []
180 | },
181 | {
182 | "cell_type": "code",
183 | "metadata": {
184 | "id": "6Kwp6THl4SIV",
185 | "colab_type": "code",
186 | "colab": {}
187 | },
188 | "source": [
189 | "# Count data with duplicated listing_id\n"
190 | ],
191 | "execution_count": 0,
192 | "outputs": []
193 | },
194 | {
195 | "cell_type": "markdown",
196 | "metadata": {
197 | "id": "P-4i_B1kvfM6",
198 | "colab_type": "text"
199 | },
200 | "source": [
201 | "*A note on the `%>%` operator:*\n",
202 | "\n",
203 | "This is an operator commonly used in the Tidyverse to make code more readable. The `%>%` takes the result of whatever is before it and inserts it as the first argument in the subsequent function.\n",
204 | "\n",
205 | "We could do this exact same counting operation using the following, but the function calls aren't in the order they're being executed, which makes it difficult to understand what's going on. The `%>%` allows us to write the functions in the order that they're executed.\n",
206 | "```r\n",
207 | "count(filter(airbnb, duplicated(listing_id)))\n",
208 | "```"
209 | ]
210 | },
211 | {
212 | "cell_type": "markdown",
213 | "metadata": {
214 | "id": "eeNuwD5-4lAJ",
215 | "colab_type": "text"
216 | },
217 | "source": [
218 | "## **What do we need to do?**\n",
219 | "\n",
220 | "**Data type issues**\n",
221 | "- **Task 1:** Split `coordinates` into latitude and longitude and convert `numeric` data type.\n",
222 | "- **Task 2:** Remove `$`s from `price` column and convert to `numeric`.\n",
223 | "- **Task 3:** Convert `last_review` and `listing_added` to `Date`.\n",
224 | "\n",
225 | "**Text & categorical data issues**\n",
226 | "- **Task 4:** Split `nbhood_full` into separate neighborhood and borough columns.\n",
227 | "- **Task 5:** Collapse the categories of `room_type` so that they're consistent.\n",
228 | "\n",
229 | "**Data range issues**\n",
230 | "- **Task 6:** Fix the `avg_rating` column so it doesn't exceed `5`.\n",
231 | "\n",
232 | "**Missing data issues**\n",
233 | "- **Task 7:** Further investigate the missing data and decide how to handle them.\n",
234 | "\n",
235 | "**Duplicate data issues**\n",
236 | "- **Task 8:** Further investigate duplicate data points and decide how to handle them.\n",
237 | "\n",
238 | "***But also...***\n",
239 | "- We need to validate our data using various sanity checks"
240 | ]
241 | },
242 | {
243 | "cell_type": "markdown",
244 | "metadata": {
245 | "id": "yvQmADZn4oxm",
246 | "colab_type": "text"
247 | },
248 | "source": [
249 | "---\n",
250 | "
Q&A
\n",
251 | "\n",
252 | "---"
253 | ]
254 | },
255 | {
256 | "cell_type": "markdown",
257 | "metadata": {
258 | "id": "TqqGD4jk4zRr",
259 | "colab_type": "text"
260 | },
261 | "source": [
262 | "## **Cleaning the data**\n"
263 | ]
264 | },
265 | {
266 | "cell_type": "markdown",
267 | "metadata": {
268 | "id": "nTZAQnQc4128",
269 | "colab_type": "text"
270 | },
271 | "source": [
272 | "### **Data type issues**\n"
273 | ]
274 | },
275 | {
276 | "cell_type": "code",
277 | "metadata": {
278 | "id": "WM0EhIT-4izJ",
279 | "colab_type": "code",
280 | "colab": {}
281 | },
282 | "source": [
283 | "# Reminder: what does the data look like?\n"
284 | ],
285 | "execution_count": 0,
286 | "outputs": []
287 | },
288 | {
289 | "cell_type": "markdown",
290 | "metadata": {
291 | "id": "Uv34mfrn5ER-",
292 | "colab_type": "text"
293 | },
294 | "source": [
295 | "#### **Task 1:** Split `coordinates` into latitude and longitude and convert `numeric` data type.\n"
296 | ]
297 | },
298 | {
299 | "cell_type": "markdown",
300 | "metadata": {
301 | "id": "mbtP0UPt2cwP",
302 | "colab_type": "text"
303 | },
304 | "source": [
305 | "- `str_remove_all()` removes all instances of a substring from a string.\n",
306 | "- `str_split()` will split a string into multiple pieces based on a separation string.\n",
307 | "- `as.data.frame()` converts an object into a data frame. It automatically converts any strings to `factor`s, which is not what we want in this case, so we'll stop this behavior using `stringsAsFactors = FALSE`.\n",
308 | "- `rename()` takes arguments of the format `new_col_name = old_col_name` and renames the columns as such."
309 | ]
310 | },
311 | {
312 | "cell_type": "code",
313 | "metadata": {
314 | "id": "i6YA6Mcq5FAO",
315 | "colab_type": "code",
316 | "colab": {}
317 | },
318 | "source": [
319 | "# Create lat_lon columns\n"
320 | ],
321 | "execution_count": 0,
322 | "outputs": []
323 | },
324 | {
325 | "cell_type": "markdown",
326 | "metadata": {
327 | "id": "SZ4rjulf3c1U",
328 | "colab_type": "text"
329 | },
330 | "source": [
331 | "- `cbind()` stands for column bind, which sticks two data frames together horizontally.\n",
332 | "\n",
333 | ""
334 | ]
335 | },
336 | {
337 | "cell_type": "code",
338 | "metadata": {
339 | "id": "nLoVV0wx5HY0",
340 | "colab_type": "code",
341 | "colab": {}
342 | },
343 | "source": [
344 | "# Assign it to dataset\n"
345 | ],
346 | "execution_count": 0,
347 | "outputs": []
348 | },
349 | {
350 | "cell_type": "markdown",
351 | "metadata": {
352 | "id": "cTyOqtuf5MKA",
353 | "colab_type": "text"
354 | },
355 | "source": [
356 | "#### **Task 2:** Remove `$`s from `price` column and convert to `numeric`."
357 | ]
358 | },
359 | {
360 | "cell_type": "code",
361 | "metadata": {
362 | "id": "c7bo2KI65MuC",
363 | "colab_type": "code",
364 | "colab": {}
365 | },
366 | "source": [
367 | "# Remove $ and convert to numeric\n"
368 | ],
369 | "execution_count": 0,
370 | "outputs": []
371 | },
372 | {
373 | "cell_type": "markdown",
374 | "metadata": {
375 | "id": "GZLstAby5OU6",
376 | "colab_type": "text"
377 | },
378 | "source": [
379 | "Notice we get a warning here that values are being converted to `NA`, so before we move on, we need to look into this further to ensure that the values are actually missing and we're not losing data by mistake.\n",
380 | "\n",
381 | "Let's take a look at the values of `price`.\n"
382 | ]
383 | },
384 | {
385 | "cell_type": "code",
386 | "metadata": {
387 | "id": "UPuE0iPw5U9h",
388 | "colab_type": "code",
389 | "colab": {}
390 | },
391 | "source": [
392 | "# Look at values of price\n"
393 | ],
394 | "execution_count": 0,
395 | "outputs": []
396 | },
397 | {
398 | "cell_type": "markdown",
399 | "metadata": {
400 | "id": "EajADDBt57-C",
401 | "colab_type": "text"
402 | },
403 | "source": [
404 | "It looks like we have a non-standard representation of `NA` here, `$NA`, so these are getting coerced to `NA`s. This is the behavior we want, so we can ignore the warning."
405 | ]
406 | },
407 | {
408 | "cell_type": "code",
409 | "metadata": {
410 | "id": "Fpi0jcHn5zD1",
411 | "colab_type": "code",
412 | "colab": {}
413 | },
414 | "source": [
415 | "# Add to data frame\n"
416 | ],
417 | "execution_count": 0,
418 | "outputs": []
419 | },
420 | {
421 | "cell_type": "markdown",
422 | "metadata": {
423 | "id": "anggnvoK8pvK",
424 | "colab_type": "text"
425 | },
426 | "source": [
427 | "#### **Task 3:** Convert `last_review` and `listing_added` to `Date`.\n",
428 | "\n",
429 | "Conversion to `Date` is done using `as.Date()`, which takes in a `format` argument. The `format` argument allows us to convert lots of different formats of dates to a `Date` type, like \"January 1, 2020\" or \"01-01-2020\". There are special symbols that we use to specify this. Here are a few of them, but you can find all the possible ones by typing `?strptime` into your console.\n",
430 | "\n",
431 | "\n",
432 | "\n",
433 | "A date like \"21 Oct 2020\" would be in the format `\"%d %b %Y\"`.\n"
434 | ]
435 | },
436 | {
437 | "cell_type": "code",
438 | "metadata": {
439 | "id": "c7BN8s568rKZ",
440 | "colab_type": "code",
441 | "colab": {}
442 | },
443 | "source": [
444 | "# Look up date formatting symbols\n"
445 | ],
446 | "execution_count": 0,
447 | "outputs": []
448 | },
449 | {
450 | "cell_type": "code",
451 | "metadata": {
452 | "id": "Gkgzb9FOrKpF",
453 | "colab_type": "code",
454 | "colab": {}
455 | },
456 | "source": [
457 | "# Examine first rows of date columns\n"
458 | ],
459 | "execution_count": 0,
460 | "outputs": []
461 | },
462 | {
463 | "cell_type": "code",
464 | "metadata": {
465 | "id": "fa_9REcc8tGr",
466 | "colab_type": "code",
467 | "colab": {}
468 | },
469 | "source": [
470 | "# Convert strings to Dates\n",
471 | "\n"
472 | ],
473 | "execution_count": 0,
474 | "outputs": []
475 | },
476 | {
477 | "cell_type": "markdown",
478 | "metadata": {
479 | "id": "-qmBgol6siVn",
480 | "colab_type": "text"
481 | },
482 | "source": [
483 | "---\n",
484 | "
\n",
26 | "\n",
27 | " \n",
28 | "\n",
29 | "\n",
30 | "Welcome to this hands-on training where you'll identify issues in a dataset and clean it from start to finish using R. It's often said that data scientists spend 80% of their time cleaning and manipulating data and only about 20% of their time analyzing it, so cleaning data is an important skill to master!\n",
31 | "\n",
32 | "In this session, you will:\n",
33 | "\n",
34 | "- Examine a dataset and identify its problem areas, and what needs to be done to fix them.\n",
35 | "-Convert between data types to make analysis easier.\n",
36 | "- Correct inconsistencies in categorical data.\n",
37 | "- Deal with missing data.\n",
38 | "- Perform data validation to ensure every value makes sense.\n",
39 | "\n",
40 | "## **The Dataset**\n",
41 | "\n",
42 | "The dataset we'll use is a CSV file named `nyc_airbnb.csv`, which contains data on [*Airbnb*](https://www.airbnb.com/) listings in New York City. It contains the following columns:\n",
43 | "\n",
44 | "- `listing_id`: The unique identifier for a listing\n",
45 | "- `name`: The description used on the listing\n",
46 | "- `host_id`: Unique identifier for a host\n",
47 | "- `host_name`: Name of host\n",
48 | "- `nbhood_full`: Name of borough and neighborhood\n",
49 | "- `coordinates`: Coordinates of listing _(latitude, longitude)_\n",
50 | "- `room_type`: Type of room \n",
51 | "- `price`: Price per night for listing\n",
52 | "- `nb_reviews`: Number of reviews received \n",
53 | "- `last_review`: Date of last review\n",
54 | "- `reviews_per_month`: Average number of reviews per month\n",
55 | "- `availability_365`: Number of days available per year\n",
56 | "- `avg_rating`: Average rating (from 0 to 5)\n",
57 | "- `avg_stays_per_month`: Average number of stays per month\n",
58 | "- `pct_5_stars`: Percent of reviews that were 5-stars\n",
59 | "- `listing_added`: Date when listing was added\n"
60 | ]
61 | },
62 | {
63 | "cell_type": "code",
64 | "metadata": {
65 | "id": "FztEix7-3-9n",
66 | "colab_type": "code",
67 | "colab": {}
68 | },
69 | "source": [
70 | "### Explain Google Colabs\n",
71 | "### Explain Jupyter notebook format - originally for writing and running Python code, \n",
72 | "##### but you can use lots of different languages, so today we'll be using R inside of this Jupyter notebook\n",
73 | "\n",
74 | "### Run a cell using shift+enter or command/ctrl+enter\n",
75 | "### Add a new cell using +Code button in top left"
76 | ],
77 | "execution_count": 0,
78 | "outputs": []
79 | },
80 | {
81 | "cell_type": "code",
82 | "metadata": {
83 | "id": "KUKG6fNMV_zf",
84 | "colab_type": "code",
85 | "cellView": "both",
86 | "colab": {}
87 | },
88 | "source": [
89 | "### Co-labs already has many Tidyverse packages pre-installed, so we only need to install the non-tidyverse packages we'll be using.\n",
90 | "\n",
91 | "# Install non-tidyverse packages\n",
92 | "install.packages(\"visdat\")"
93 | ],
94 | "execution_count": 0,
95 | "outputs": []
96 | },
97 | {
98 | "cell_type": "code",
99 | "metadata": {
100 | "id": "brr08aZX9Wss",
101 | "colab_type": "code",
102 | "colab": {}
103 | },
104 | "source": [
105 | "# Load packages\n",
106 | "library(readr)\n",
107 | "library(dplyr)\n",
108 | "library(stringr)\n",
109 | "library(visdat)\n",
110 | "library(tidyr)\n",
111 | "library(ggplot2)\n",
112 | "library(forcats)"
113 | ],
114 | "execution_count": 0,
115 | "outputs": []
116 | },
117 | {
118 | "cell_type": "code",
119 | "metadata": {
120 | "id": "9VJyZeEo9M4O",
121 | "colab_type": "code",
122 | "colab": {}
123 | },
124 | "source": [
125 | "# Load dataset\n",
126 | "airbnb <- read_csv(\"https://raw.githubusercontent.com/datacamp/cleaning-data-in-r-live-training/master/assets/nyc_airbnb.csv\")"
127 | ],
128 | "execution_count": 0,
129 | "outputs": []
130 | },
131 | {
132 | "cell_type": "code",
133 | "metadata": {
134 | "id": "89DXT3Xl1SQ8",
135 | "colab_type": "code",
136 | "colab": {}
137 | },
138 | "source": [
139 | "# Examine the first few rows\n",
140 | "head(airbnb)"
141 | ],
142 | "execution_count": 0,
143 | "outputs": []
144 | },
145 | {
146 | "cell_type": "markdown",
147 | "metadata": {
148 | "id": "kNE3y9ug1Zo5",
149 | "colab_type": "text"
150 | },
151 | "source": [
152 | "## **Diagnosing data cleaning problems**\n",
153 | "\n",
154 | "\n",
155 | "We'll need to get a good look at the data frame in order to identify any problems that may cause issues during an analysis. There are a variety of functions (both from base R and `dplyr`) that can help us with this:\n",
156 | "\n",
157 | "- `head()` to look at the first few rows of the data\n",
158 | "- `glimpse()` to get a summary of the variables' data types\n",
159 | "- `summary()` to compute summary statistics of each variable and display the number of missing values\n",
160 | "- `duplicated()` to find duplicates\n"
161 | ]
162 | },
163 | {
164 | "cell_type": "code",
165 | "metadata": {
166 | "id": "uaC2Q_Gm3m1I",
167 | "colab_type": "code",
168 | "colab": {}
169 | },
170 | "source": [
171 | "# Print the first few rows of data\n",
172 | "head(airbnb)"
173 | ],
174 | "execution_count": 0,
175 | "outputs": []
176 | },
177 | {
178 | "cell_type": "markdown",
179 | "metadata": {
180 | "id": "L96ZwAjBunsI",
181 | "colab_type": "text"
182 | },
183 | "source": [
184 | "- **Observation 1:** The `coordinates` column contains multiple pieces of information: both latitude and longitude.\n",
185 | "- **Observation 2:** The `price` column is formatted with an unnecessary `$`."
186 | ]
187 | },
188 | {
189 | "cell_type": "code",
190 | "metadata": {
191 | "id": "ZO_jlHc74J62",
192 | "colab_type": "code",
193 | "colab": {}
194 | },
195 | "source": [
196 | "# Inspect data types\n",
197 | "glimpse(airbnb)"
198 | ],
199 | "execution_count": 0,
200 | "outputs": []
201 | },
202 | {
203 | "cell_type": "markdown",
204 | "metadata": {
205 | "id": "5-1VcTFC4JpI",
206 | "colab_type": "text"
207 | },
208 | "source": [
209 | "- **Observation 3:** Columns like `coordinates` and `price` are factors instead of numeric values.\n",
210 | "- **Observation 4:** Columns with dates like `last_review` and `listing_added` are factors instead of the `Date` data type."
211 | ]
212 | },
213 | {
214 | "cell_type": "code",
215 | "metadata": {
216 | "id": "ewCibkuE4NP-",
217 | "colab_type": "code",
218 | "colab": {}
219 | },
220 | "source": [
221 | "# Examine summary statistics and missing values\n",
222 | "summary(airbnb)"
223 | ],
224 | "execution_count": 0,
225 | "outputs": []
226 | },
227 | {
228 | "cell_type": "markdown",
229 | "metadata": {
230 | "id": "z-17MT7M4UbL",
231 | "colab_type": "text"
232 | },
233 | "source": [
234 | "- **Observation 5:** There are 2075 missing values in `reviews_per_month`, `avg_rating`, `nb_stays`, and `pct_5_stars`.\n",
235 | "- **Observation 6:** The max of `avg_rating` is above 5 (out of range value)\n",
236 | "- **Observation 7:** There are inconsistencies in the categories of `room_type`, i.e. `\"Private\"`, `\"Private room\"`, and `\"PRIVATE ROOM\"`."
237 | ]
238 | },
239 | {
240 | "cell_type": "code",
241 | "metadata": {
242 | "id": "6Kwp6THl4SIV",
243 | "colab_type": "code",
244 | "colab": {}
245 | },
246 | "source": [
247 | "# Count data with duplicated listing_id\n",
248 | "airbnb %>%\n",
249 | " filter(duplicated(listing_id)) %>%\n",
250 | " count()"
251 | ],
252 | "execution_count": 0,
253 | "outputs": []
254 | },
255 | {
256 | "cell_type": "markdown",
257 | "metadata": {
258 | "id": "P-4i_B1kvfM6",
259 | "colab_type": "text"
260 | },
261 | "source": [
262 | "*A note on the `%>%` operator:*\n",
263 | "\n",
264 | "This is an operator commonly used in the Tidyverse to make code more readable. The `%>%` takes the result of whatever is before it and inserts it as the first argument in the subsequent function.\n",
265 | "\n",
266 | "We could do this exact same counting operation using the following, but the function calls aren't in the order they're being executed, which makes it difficult to understand what's going on. The `%>%` allows us to write the functions in the order that they're executed.\n",
267 | "```r\n",
268 | "count(filter(airbnb, duplicated(listing_id)))\n",
269 | "```"
270 | ]
271 | },
272 | {
273 | "cell_type": "markdown",
274 | "metadata": {
275 | "id": "h9A2KkvJ4hQO",
276 | "colab_type": "text"
277 | },
278 | "source": [
279 | "- **Observation 8:** There are 20 rows whose `listing_id` already appeared earlier in the dataset (duplicates)."
280 | ]
281 | },
282 | {
283 | "cell_type": "markdown",
284 | "metadata": {
285 | "id": "eeNuwD5-4lAJ",
286 | "colab_type": "text"
287 | },
288 | "source": [
289 | "## **What do we need to do?**\n",
290 | "\n",
291 | "**Data type issues**\n",
292 | "- **Task 1:** Split `coordinates` into latitude and longitude and convert `numeric` data type.\n",
293 | "- **Task 2:** Remove `$`s from `price` column and convert to `numeric`.\n",
294 | "- **Task 3:** Convert `last_review` and `listing_added` to `Date`.\n",
295 | "\n",
296 | "**Text & categorical data issues**\n",
297 | "- **Task 4:** Split `nbhood_full` into separate neighborhood and borough columns.\n",
298 | "- **Task 5:** Collapse the categories of `room_type` so that they're consistent.\n",
299 | "\n",
300 | "**Data range issues**\n",
301 | "- **Task 6:** Fix the `avg_rating` column so it doesn't exceed `5`.\n",
302 | "\n",
303 | "**Missing data issues**\n",
304 | "- **Task 7:** Further investigate the missing data and decide how to handle them.\n",
305 | "\n",
306 | "**Duplicate data issues**\n",
307 | "- **Task 8:** Further investigate duplicate data points and decide how to handle them.\n",
308 | "\n",
309 | "***But also...***\n",
310 | "- We need to validate our data using various sanity checks"
311 | ]
312 | },
313 | {
314 | "cell_type": "markdown",
315 | "metadata": {
316 | "id": "yvQmADZn4oxm",
317 | "colab_type": "text"
318 | },
319 | "source": [
320 | "---\n",
321 | "
Q&A
\n",
322 | "\n",
323 | "---"
324 | ]
325 | },
326 | {
327 | "cell_type": "markdown",
328 | "metadata": {
329 | "id": "TqqGD4jk4zRr",
330 | "colab_type": "text"
331 | },
332 | "source": [
333 | "## **Cleaning the data**\n"
334 | ]
335 | },
336 | {
337 | "cell_type": "markdown",
338 | "metadata": {
339 | "id": "nTZAQnQc4128",
340 | "colab_type": "text"
341 | },
342 | "source": [
343 | "### **Data type issues**\n"
344 | ]
345 | },
346 | {
347 | "cell_type": "code",
348 | "metadata": {
349 | "id": "WM0EhIT-4izJ",
350 | "colab_type": "code",
351 | "colab": {}
352 | },
353 | "source": [
354 | "# Reminder: what does the data look like?\n",
355 | "head(airbnb)"
356 | ],
357 | "execution_count": 0,
358 | "outputs": []
359 | },
360 | {
361 | "cell_type": "markdown",
362 | "metadata": {
363 | "id": "Uv34mfrn5ER-",
364 | "colab_type": "text"
365 | },
366 | "source": [
367 | "#### **Task 1:** Split `coordinates` into latitude and longitude and convert `numeric` data type.\n"
368 | ]
369 | },
370 | {
371 | "cell_type": "markdown",
372 | "metadata": {
373 | "id": "mbtP0UPt2cwP",
374 | "colab_type": "text"
375 | },
376 | "source": [
377 | "- `str_remove_all()` removes all instances of a substring from a string.\n",
378 | "- `str_split()` will split a string into multiple pieces based on a separation string.\n",
379 | "- `as.data.frame()` converts an object into a data frame. It automatically converts any strings to `factor`s, which is not what we want in this case, so we'll stop this behavior using `stringsAsFactors = FALSE`.\n",
380 | "- `rename()` takes arguments of the format `new_col_name = old_col_name` and renames the columns as such."
381 | ]
382 | },
383 | {
384 | "cell_type": "code",
385 | "metadata": {
386 | "id": "i6YA6Mcq5FAO",
387 | "colab_type": "code",
388 | "colab": {}
389 | },
390 | "source": [
391 | "# Create lat_lon columns\n",
392 | "\n",
393 | "lat_lon <- airbnb$coordinates %>%\n",
394 | " # Remove left parentheses\n",
395 | " str_remove_all(fixed(\"(\")) %>% # Why do we use fixed()?\n",
396 | " # Remove right parentheses\n",
397 | " str_remove_all(fixed(\")\")) %>% ########\n",
398 | " # Split latitude and longitude # simplify = TRUE turns it into a matrix instead of a list\n",
399 | " str_split(\", \", simplify = TRUE) %>% #########\n",
400 | " # Convert from matrix to data frame\n",
401 | " as.data.frame(stringsAsFactors = FALSE) %>% ########\n",
402 | " # Rename columns\n",
403 | " rename(latitude = V1, longitude = V2) ######\n",
404 | "\n",
405 | " # Then assign to lat_lon"
406 | ],
407 | "execution_count": 0,
408 | "outputs": []
409 | },
410 | {
411 | "cell_type": "markdown",
412 | "metadata": {
413 | "id": "SZ4rjulf3c1U",
414 | "colab_type": "text"
415 | },
416 | "source": [
417 | "- `cbind()` stands for column bind, which sticks two data frames together horizontally.\n",
418 | "\n",
419 | "(***ROWS MUST BE IN SAME ORDER***)\n",
420 | "\n",
421 | "\n",
422 | ""
423 | ]
424 | },
425 | {
426 | "cell_type": "code",
427 | "metadata": {
428 | "id": "nLoVV0wx5HY0",
429 | "colab_type": "code",
430 | "colab": {}
431 | },
432 | "source": [
433 | "# Assign it to dataset\n",
434 | "\n",
435 | "airbnb <- airbnb %>%\n",
436 | " # Combine lat_lon with original data frame\n",
437 | " cbind(lat_lon) %>% ######\n",
438 | " # Convert to numeric\n",
439 | " mutate(latitude = as.numeric(latitude),\n",
440 | " longitude = as.numeric(longitude)) %>%\n",
441 | " # Remove coordinates column\n",
442 | " select(-coordinates)"
443 | ],
444 | "execution_count": 0,
445 | "outputs": []
446 | },
447 | {
448 | "cell_type": "markdown",
449 | "metadata": {
450 | "id": "cTyOqtuf5MKA",
451 | "colab_type": "text"
452 | },
453 | "source": [
454 | "#### **Task 2:** Remove `$`s from `price` column and convert to `numeric`."
455 | ]
456 | },
457 | {
458 | "cell_type": "code",
459 | "metadata": {
460 | "id": "c7bo2KI65MuC",
461 | "colab_type": "code",
462 | "colab": {}
463 | },
464 | "source": [
465 | "# Remove $ and convert to numeric\n",
466 | "### We can use the same functions we just used!\n",
467 | "price_clean <- airbnb$price %>%\n",
468 | " str_remove_all(fixed(\"$\")) %>%\n",
469 | " as.numeric()"
470 | ],
471 | "execution_count": 0,
472 | "outputs": []
473 | },
474 | {
475 | "cell_type": "markdown",
476 | "metadata": {
477 | "id": "GZLstAby5OU6",
478 | "colab_type": "text"
479 | },
480 | "source": [
481 | "Notice we get a warning here that values are being converted to `NA`, so before we move on, we need to look into this further to ensure that the values are actually missing and we're not losing data by mistake.\n",
482 | "\n",
483 | "Let's take a look at the values of `price`.\n"
484 | ]
485 | },
486 | {
487 | "cell_type": "code",
488 | "metadata": {
489 | "id": "UPuE0iPw5U9h",
490 | "colab_type": "code",
491 | "colab": {}
492 | },
493 | "source": [
494 | "# Look at values of price\n",
495 | "airbnb %>%\n",
496 | " count(price, sort = TRUE)"
497 | ],
498 | "execution_count": 0,
499 | "outputs": []
500 | },
501 | {
502 | "cell_type": "markdown",
503 | "metadata": {
504 | "id": "EajADDBt57-C",
505 | "colab_type": "text"
506 | },
507 | "source": [
508 | "It looks like we have a non-standard representation of `NA` here, `$NA`, so these are getting coerced to `NA`s. This is the behavior we want, so we can ignore the warning."
509 | ]
510 | },
511 | {
512 | "cell_type": "code",
513 | "metadata": {
514 | "id": "Fpi0jcHn5zD1",
515 | "colab_type": "code",
516 | "colab": {}
517 | },
518 | "source": [
519 | "# Add to data frame\n",
520 | "airbnb <- airbnb %>%\n",
521 | " mutate(price = price_clean)"
522 | ],
523 | "execution_count": 0,
524 | "outputs": []
525 | },
526 | {
527 | "cell_type": "markdown",
528 | "metadata": {
529 | "id": "anggnvoK8pvK",
530 | "colab_type": "text"
531 | },
532 | "source": [
533 | "#### **Task 3:** Convert `last_review` and `listing_added` to `Date`.\n",
534 | "\n",
535 | "Conversion to `Date` is done using `as.Date()`, which takes in a `format` argument. The `format` argument allows us to convert lots of different formats of dates to a `Date` type, like \"January 1, 2020\" or \"01-01-2020\". There are special symbols that we use to specify this. Here are a few of them, but you can find all the possible ones by typing `?strptime` into your console.\n",
536 | "\n",
537 | "\n",
538 | "\n",
539 | "A date like \"21 Oct 2020\" would be in the format `\"%d %b %Y\"`.\n"
540 | ]
541 | },
542 | {
543 | "cell_type": "code",
544 | "metadata": {
545 | "id": "c7BN8s568rKZ",
546 | "colab_type": "code",
547 | "colab": {}
548 | },
549 | "source": [
550 | "# Look up date formatting symbols\n",
551 | "?strptime\n"
552 | ],
553 | "execution_count": 0,
554 | "outputs": []
555 | },
556 | {
557 | "cell_type": "code",
558 | "metadata": {
559 | "id": "ARia6FBkrZ3G",
560 | "colab_type": "code",
561 | "colab": {}
562 | },
563 | "source": [
564 | "# Examine first rows of date columns\n",
565 | "airbnb %>%\n",
566 | " select(last_review, listing_added) %>%\n",
567 | " head()"
568 | ],
569 | "execution_count": 0,
570 | "outputs": []
571 | },
572 | {
573 | "cell_type": "code",
574 | "metadata": {
575 | "id": "fa_9REcc8tGr",
576 | "colab_type": "code",
577 | "colab": {}
578 | },
579 | "source": [
580 | "# Convert strings to Dates\n",
581 | "airbnb <- airbnb %>%\n",
582 | " mutate(last_review = as.Date(last_review, format = \"%m/%d/%Y\"),\n",
583 | " listing_added = as.Date(listing_added, format = \"%m/%d/%Y\"))"
584 | ],
585 | "execution_count": 0,
586 | "outputs": []
587 | },
588 | {
589 | "cell_type": "markdown",
590 | "metadata": {
591 | "id": "-qmBgol6siVn",
592 | "colab_type": "text"
593 | },
594 | "source": [
595 | "---\n",
596 | "
 \n",
24 | "
\n",
24 | " "
334 | ]
335 | },
336 | {
337 | "cell_type": "code",
338 | "metadata": {
339 | "id": "nLoVV0wx5HY0",
340 | "colab_type": "code",
341 | "colab": {}
342 | },
343 | "source": [
344 | "# Assign it to dataset\n"
345 | ],
346 | "execution_count": 0,
347 | "outputs": []
348 | },
349 | {
350 | "cell_type": "markdown",
351 | "metadata": {
352 | "id": "cTyOqtuf5MKA",
353 | "colab_type": "text"
354 | },
355 | "source": [
356 | "#### **Task 2:** Remove `$`s from `price` column and convert to `numeric`."
357 | ]
358 | },
359 | {
360 | "cell_type": "code",
361 | "metadata": {
362 | "id": "c7bo2KI65MuC",
363 | "colab_type": "code",
364 | "colab": {}
365 | },
366 | "source": [
367 | "# Remove $ and convert to numeric\n"
368 | ],
369 | "execution_count": 0,
370 | "outputs": []
371 | },
372 | {
373 | "cell_type": "markdown",
374 | "metadata": {
375 | "id": "GZLstAby5OU6",
376 | "colab_type": "text"
377 | },
378 | "source": [
379 | "Notice we get a warning here that values are being converted to `NA`, so before we move on, we need to look into this further to ensure that the values are actually missing and we're not losing data by mistake.\n",
380 | "\n",
381 | "Let's take a look at the values of `price`.\n"
382 | ]
383 | },
384 | {
385 | "cell_type": "code",
386 | "metadata": {
387 | "id": "UPuE0iPw5U9h",
388 | "colab_type": "code",
389 | "colab": {}
390 | },
391 | "source": [
392 | "# Look at values of price\n"
393 | ],
394 | "execution_count": 0,
395 | "outputs": []
396 | },
397 | {
398 | "cell_type": "markdown",
399 | "metadata": {
400 | "id": "EajADDBt57-C",
401 | "colab_type": "text"
402 | },
403 | "source": [
404 | "It looks like we have a non-standard representation of `NA` here, `$NA`, so these are getting coerced to `NA`s. This is the behavior we want, so we can ignore the warning."
405 | ]
406 | },
407 | {
408 | "cell_type": "code",
409 | "metadata": {
410 | "id": "Fpi0jcHn5zD1",
411 | "colab_type": "code",
412 | "colab": {}
413 | },
414 | "source": [
415 | "# Add to data frame\n"
416 | ],
417 | "execution_count": 0,
418 | "outputs": []
419 | },
420 | {
421 | "cell_type": "markdown",
422 | "metadata": {
423 | "id": "anggnvoK8pvK",
424 | "colab_type": "text"
425 | },
426 | "source": [
427 | "#### **Task 3:** Convert `last_review` and `listing_added` to `Date`.\n",
428 | "\n",
429 | "Conversion to `Date` is done using `as.Date()`, which takes in a `format` argument. The `format` argument allows us to convert lots of different formats of dates to a `Date` type, like \"January 1, 2020\" or \"01-01-2020\". There are special symbols that we use to specify this. Here are a few of them, but you can find all the possible ones by typing `?strptime` into your console.\n",
430 | "\n",
431 | "
"
334 | ]
335 | },
336 | {
337 | "cell_type": "code",
338 | "metadata": {
339 | "id": "nLoVV0wx5HY0",
340 | "colab_type": "code",
341 | "colab": {}
342 | },
343 | "source": [
344 | "# Assign it to dataset\n"
345 | ],
346 | "execution_count": 0,
347 | "outputs": []
348 | },
349 | {
350 | "cell_type": "markdown",
351 | "metadata": {
352 | "id": "cTyOqtuf5MKA",
353 | "colab_type": "text"
354 | },
355 | "source": [
356 | "#### **Task 2:** Remove `$`s from `price` column and convert to `numeric`."
357 | ]
358 | },
359 | {
360 | "cell_type": "code",
361 | "metadata": {
362 | "id": "c7bo2KI65MuC",
363 | "colab_type": "code",
364 | "colab": {}
365 | },
366 | "source": [
367 | "# Remove $ and convert to numeric\n"
368 | ],
369 | "execution_count": 0,
370 | "outputs": []
371 | },
372 | {
373 | "cell_type": "markdown",
374 | "metadata": {
375 | "id": "GZLstAby5OU6",
376 | "colab_type": "text"
377 | },
378 | "source": [
379 | "Notice we get a warning here that values are being converted to `NA`, so before we move on, we need to look into this further to ensure that the values are actually missing and we're not losing data by mistake.\n",
380 | "\n",
381 | "Let's take a look at the values of `price`.\n"
382 | ]
383 | },
384 | {
385 | "cell_type": "code",
386 | "metadata": {
387 | "id": "UPuE0iPw5U9h",
388 | "colab_type": "code",
389 | "colab": {}
390 | },
391 | "source": [
392 | "# Look at values of price\n"
393 | ],
394 | "execution_count": 0,
395 | "outputs": []
396 | },
397 | {
398 | "cell_type": "markdown",
399 | "metadata": {
400 | "id": "EajADDBt57-C",
401 | "colab_type": "text"
402 | },
403 | "source": [
404 | "It looks like we have a non-standard representation of `NA` here, `$NA`, so these are getting coerced to `NA`s. This is the behavior we want, so we can ignore the warning."
405 | ]
406 | },
407 | {
408 | "cell_type": "code",
409 | "metadata": {
410 | "id": "Fpi0jcHn5zD1",
411 | "colab_type": "code",
412 | "colab": {}
413 | },
414 | "source": [
415 | "# Add to data frame\n"
416 | ],
417 | "execution_count": 0,
418 | "outputs": []
419 | },
420 | {
421 | "cell_type": "markdown",
422 | "metadata": {
423 | "id": "anggnvoK8pvK",
424 | "colab_type": "text"
425 | },
426 | "source": [
427 | "#### **Task 3:** Convert `last_review` and `listing_added` to `Date`.\n",
428 | "\n",
429 | "Conversion to `Date` is done using `as.Date()`, which takes in a `format` argument. The `format` argument allows us to convert lots of different formats of dates to a `Date` type, like \"January 1, 2020\" or \"01-01-2020\". There are special symbols that we use to specify this. Here are a few of them, but you can find all the possible ones by typing `?strptime` into your console.\n",
430 | "\n",
431 | " \n",
432 | "\n",
433 | "A date like \"21 Oct 2020\" would be in the format `\"%d %b %Y\"`.\n"
434 | ]
435 | },
436 | {
437 | "cell_type": "code",
438 | "metadata": {
439 | "id": "c7BN8s568rKZ",
440 | "colab_type": "code",
441 | "colab": {}
442 | },
443 | "source": [
444 | "# Look up date formatting symbols\n"
445 | ],
446 | "execution_count": 0,
447 | "outputs": []
448 | },
449 | {
450 | "cell_type": "code",
451 | "metadata": {
452 | "id": "Gkgzb9FOrKpF",
453 | "colab_type": "code",
454 | "colab": {}
455 | },
456 | "source": [
457 | "# Examine first rows of date columns\n"
458 | ],
459 | "execution_count": 0,
460 | "outputs": []
461 | },
462 | {
463 | "cell_type": "code",
464 | "metadata": {
465 | "id": "fa_9REcc8tGr",
466 | "colab_type": "code",
467 | "colab": {}
468 | },
469 | "source": [
470 | "# Convert strings to Dates\n",
471 | "\n"
472 | ],
473 | "execution_count": 0,
474 | "outputs": []
475 | },
476 | {
477 | "cell_type": "markdown",
478 | "metadata": {
479 | "id": "-qmBgol6siVn",
480 | "colab_type": "text"
481 | },
482 | "source": [
483 | "---\n",
484 | "
\n",
432 | "\n",
433 | "A date like \"21 Oct 2020\" would be in the format `\"%d %b %Y\"`.\n"
434 | ]
435 | },
436 | {
437 | "cell_type": "code",
438 | "metadata": {
439 | "id": "c7BN8s568rKZ",
440 | "colab_type": "code",
441 | "colab": {}
442 | },
443 | "source": [
444 | "# Look up date formatting symbols\n"
445 | ],
446 | "execution_count": 0,
447 | "outputs": []
448 | },
449 | {
450 | "cell_type": "code",
451 | "metadata": {
452 | "id": "Gkgzb9FOrKpF",
453 | "colab_type": "code",
454 | "colab": {}
455 | },
456 | "source": [
457 | "# Examine first rows of date columns\n"
458 | ],
459 | "execution_count": 0,
460 | "outputs": []
461 | },
462 | {
463 | "cell_type": "code",
464 | "metadata": {
465 | "id": "fa_9REcc8tGr",
466 | "colab_type": "code",
467 | "colab": {}
468 | },
469 | "source": [
470 | "# Convert strings to Dates\n",
471 | "\n"
472 | ],
473 | "execution_count": 0,
474 | "outputs": []
475 | },
476 | {
477 | "cell_type": "markdown",
478 | "metadata": {
479 | "id": "-qmBgol6siVn",
480 | "colab_type": "text"
481 | },
482 | "source": [
483 | "---\n",
484 | "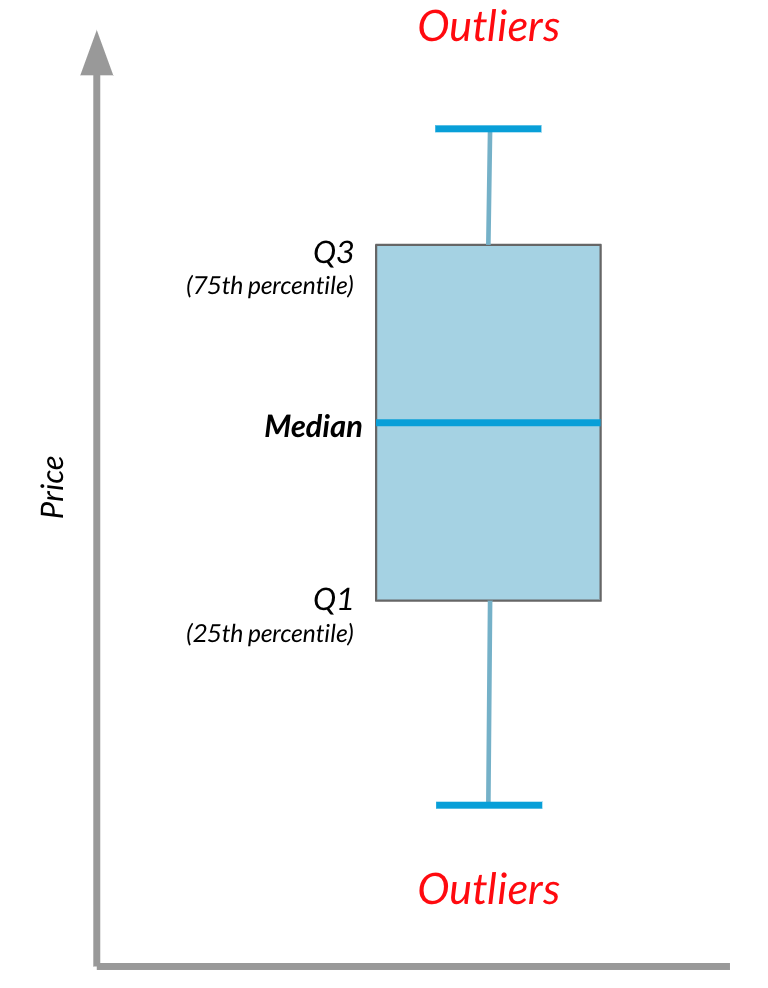 "
771 | ]
772 | },
773 | {
774 | "cell_type": "code",
775 | "metadata": {
776 | "id": "7gL-HXtyn5NA",
777 | "colab_type": "code",
778 | "colab": {}
779 | },
780 | "source": [
781 | "# Create a boxplot showing the distribution of price for each room_type\n"
782 | ],
783 | "execution_count": 0,
784 | "outputs": []
785 | },
786 | {
787 | "cell_type": "markdown",
788 | "metadata": {
789 | "id": "56R9HHVHzTtB",
790 | "colab_type": "text"
791 | },
792 | "source": [
793 | "We'll use *median* to summarize the `price` for each `room_type` since the distributions have a number of outliers, and median is more robust to outliers than mean.\n",
794 | "\n",
795 | "We'll use `ifelse()`, which takes arguments of the form: `ifelse(condition, value if true, value if false)`."
796 | ]
797 | },
798 | {
799 | "cell_type": "code",
800 | "metadata": {
801 | "id": "p9WXsu8VATVB",
802 | "colab_type": "code",
803 | "colab": {}
804 | },
805 | "source": [
806 | "# Use a grouped mutate to fill in missing prices with median of their room_type\n"
807 | ],
808 | "execution_count": 0,
809 | "outputs": []
810 | },
811 | {
812 | "cell_type": "code",
813 | "metadata": {
814 | "id": "81Nz4NgKp4dA",
815 | "colab_type": "code",
816 | "colab": {}
817 | },
818 | "source": [
819 | "# Overwrite price column in original data frame\n"
820 | ],
821 | "execution_count": 0,
822 | "outputs": []
823 | },
824 | {
825 | "cell_type": "markdown",
826 | "metadata": {
827 | "id": "q0VKNaqevJj5",
828 | "colab_type": "text"
829 | },
830 | "source": [
831 | "### **Duplicate data issues**\n",
832 | "\n",
833 | "\n",
834 | "#### **Task 8:** Further investigate duplicate data points and decide how to handle them."
835 | ]
836 | },
837 | {
838 | "cell_type": "code",
839 | "metadata": {
840 | "id": "M7xKT9BmvJB6",
841 | "colab_type": "code",
842 | "colab": {}
843 | },
844 | "source": [
845 | "# Find duplicated listing_ids\n"
846 | ],
847 | "execution_count": 0,
848 | "outputs": []
849 | },
850 | {
851 | "cell_type": "code",
852 | "metadata": {
853 | "id": "QJ9-GIlCwTHS",
854 | "colab_type": "code",
855 | "colab": {}
856 | },
857 | "source": [
858 | "# Look at duplicated data\n"
859 | ],
860 | "execution_count": 0,
861 | "outputs": []
862 | },
863 | {
864 | "cell_type": "markdown",
865 | "metadata": {
866 | "id": "NzS7pD1oH8xt",
867 | "colab_type": "text"
868 | },
869 | "source": [
870 | "***Full duplicates***: All values match.\n",
871 | "- To handle these, we can just remove all copies but one\n",
872 | "\n",
873 | "***Partial duplicates***: Identifying values (like `listing_id`) match, but one or more of the others don't. Here, we have inconsistent values in `price`, `avg_rating`, and `listing_added`.\n",
874 | "- We can remove them, pick a random copy to keep, or aggregate any inconsistent values. We'll aggregate using `mean()` for `price` and `avg_rating`, and `max()` for `listing_added`."
875 | ]
876 | },
877 | {
878 | "cell_type": "code",
879 | "metadata": {
880 | "id": "dm1orY71FasD",
881 | "colab_type": "code",
882 | "colab": {}
883 | },
884 | "source": [
885 | "# Remove full duplicates\n"
886 | ],
887 | "execution_count": 0,
888 | "outputs": []
889 | },
890 | {
891 | "cell_type": "code",
892 | "metadata": {
893 | "id": "5cL8XRLTJLlp",
894 | "colab_type": "code",
895 | "colab": {}
896 | },
897 | "source": [
898 | "# Aggregate partial duplicates using grouped mutate\n"
899 | ],
900 | "execution_count": 0,
901 | "outputs": []
902 | },
903 | {
904 | "cell_type": "code",
905 | "metadata": {
906 | "id": "97ZBCGtRKln5",
907 | "colab_type": "code",
908 | "colab": {}
909 | },
910 | "source": [
911 | "# Check that no duplicates remain\n"
912 | ],
913 | "execution_count": 0,
914 | "outputs": []
915 | },
916 | {
917 | "cell_type": "markdown",
918 | "metadata": {
919 | "id": "-68kSoZ-K97W",
920 | "colab_type": "text"
921 | },
922 | "source": [
923 | "### Take-home practice: **Sanity Checks**\n",
924 | "*The data should be consistent both with itself, as well as with what we know about the world.*\n",
925 | "\n",
926 | "- **Is the data consistent with itself?**\n",
927 | " - Are there any `last_review` dates before `listing_added` dates?\n",
928 | "- **Is the data consistent with what we know about the world?**\n",
929 | " - Are there any `last_review` dates in the future?\n",
930 | " - Are there any `listing_added` dates in the future?\n",
931 | "\n"
932 | ]
933 | },
934 | {
935 | "cell_type": "markdown",
936 | "metadata": {
937 | "id": "n8_8P2fXNbxZ",
938 | "colab_type": "text"
939 | },
940 | "source": [
941 | "---\n",
942 | "
"
771 | ]
772 | },
773 | {
774 | "cell_type": "code",
775 | "metadata": {
776 | "id": "7gL-HXtyn5NA",
777 | "colab_type": "code",
778 | "colab": {}
779 | },
780 | "source": [
781 | "# Create a boxplot showing the distribution of price for each room_type\n"
782 | ],
783 | "execution_count": 0,
784 | "outputs": []
785 | },
786 | {
787 | "cell_type": "markdown",
788 | "metadata": {
789 | "id": "56R9HHVHzTtB",
790 | "colab_type": "text"
791 | },
792 | "source": [
793 | "We'll use *median* to summarize the `price` for each `room_type` since the distributions have a number of outliers, and median is more robust to outliers than mean.\n",
794 | "\n",
795 | "We'll use `ifelse()`, which takes arguments of the form: `ifelse(condition, value if true, value if false)`."
796 | ]
797 | },
798 | {
799 | "cell_type": "code",
800 | "metadata": {
801 | "id": "p9WXsu8VATVB",
802 | "colab_type": "code",
803 | "colab": {}
804 | },
805 | "source": [
806 | "# Use a grouped mutate to fill in missing prices with median of their room_type\n"
807 | ],
808 | "execution_count": 0,
809 | "outputs": []
810 | },
811 | {
812 | "cell_type": "code",
813 | "metadata": {
814 | "id": "81Nz4NgKp4dA",
815 | "colab_type": "code",
816 | "colab": {}
817 | },
818 | "source": [
819 | "# Overwrite price column in original data frame\n"
820 | ],
821 | "execution_count": 0,
822 | "outputs": []
823 | },
824 | {
825 | "cell_type": "markdown",
826 | "metadata": {
827 | "id": "q0VKNaqevJj5",
828 | "colab_type": "text"
829 | },
830 | "source": [
831 | "### **Duplicate data issues**\n",
832 | "\n",
833 | "\n",
834 | "#### **Task 8:** Further investigate duplicate data points and decide how to handle them."
835 | ]
836 | },
837 | {
838 | "cell_type": "code",
839 | "metadata": {
840 | "id": "M7xKT9BmvJB6",
841 | "colab_type": "code",
842 | "colab": {}
843 | },
844 | "source": [
845 | "# Find duplicated listing_ids\n"
846 | ],
847 | "execution_count": 0,
848 | "outputs": []
849 | },
850 | {
851 | "cell_type": "code",
852 | "metadata": {
853 | "id": "QJ9-GIlCwTHS",
854 | "colab_type": "code",
855 | "colab": {}
856 | },
857 | "source": [
858 | "# Look at duplicated data\n"
859 | ],
860 | "execution_count": 0,
861 | "outputs": []
862 | },
863 | {
864 | "cell_type": "markdown",
865 | "metadata": {
866 | "id": "NzS7pD1oH8xt",
867 | "colab_type": "text"
868 | },
869 | "source": [
870 | "***Full duplicates***: All values match.\n",
871 | "- To handle these, we can just remove all copies but one\n",
872 | "\n",
873 | "***Partial duplicates***: Identifying values (like `listing_id`) match, but one or more of the others don't. Here, we have inconsistent values in `price`, `avg_rating`, and `listing_added`.\n",
874 | "- We can remove them, pick a random copy to keep, or aggregate any inconsistent values. We'll aggregate using `mean()` for `price` and `avg_rating`, and `max()` for `listing_added`."
875 | ]
876 | },
877 | {
878 | "cell_type": "code",
879 | "metadata": {
880 | "id": "dm1orY71FasD",
881 | "colab_type": "code",
882 | "colab": {}
883 | },
884 | "source": [
885 | "# Remove full duplicates\n"
886 | ],
887 | "execution_count": 0,
888 | "outputs": []
889 | },
890 | {
891 | "cell_type": "code",
892 | "metadata": {
893 | "id": "5cL8XRLTJLlp",
894 | "colab_type": "code",
895 | "colab": {}
896 | },
897 | "source": [
898 | "# Aggregate partial duplicates using grouped mutate\n"
899 | ],
900 | "execution_count": 0,
901 | "outputs": []
902 | },
903 | {
904 | "cell_type": "code",
905 | "metadata": {
906 | "id": "97ZBCGtRKln5",
907 | "colab_type": "code",
908 | "colab": {}
909 | },
910 | "source": [
911 | "# Check that no duplicates remain\n"
912 | ],
913 | "execution_count": 0,
914 | "outputs": []
915 | },
916 | {
917 | "cell_type": "markdown",
918 | "metadata": {
919 | "id": "-68kSoZ-K97W",
920 | "colab_type": "text"
921 | },
922 | "source": [
923 | "### Take-home practice: **Sanity Checks**\n",
924 | "*The data should be consistent both with itself, as well as with what we know about the world.*\n",
925 | "\n",
926 | "- **Is the data consistent with itself?**\n",
927 | " - Are there any `last_review` dates before `listing_added` dates?\n",
928 | "- **Is the data consistent with what we know about the world?**\n",
929 | " - Are there any `last_review` dates in the future?\n",
930 | " - Are there any `listing_added` dates in the future?\n",
931 | "\n"
932 | ]
933 | },
934 | {
935 | "cell_type": "markdown",
936 | "metadata": {
937 | "id": "n8_8P2fXNbxZ",
938 | "colab_type": "text"
939 | },
940 | "source": [
941 | "---\n",
942 | "