├── docs
├── robots.txt
├── 31-ml-intro_files
│ └── figure-html
│ │ ├── roc-3-1.png
│ │ ├── f_1-vs-cutoff-1.png
│ │ ├── accuracy-vs-cutoff-1.png
│ │ └── precision-recall-1-1.png
├── site_libs
│ ├── bootstrap
│ │ └── bootstrap-icons.woff
│ ├── kePrint-0.0.1
│ │ └── kePrint.js
│ ├── quarto-html
│ │ ├── tippy.css
│ │ ├── quarto-syntax-highlighting.css
│ │ └── anchor.min.js
│ ├── quarto-nav
│ │ └── headroom.min.js
│ ├── lightable-0.0.1
│ │ └── lightable.css
│ └── clipboard
│ │ └── clipboard.min.js
├── 33-smoothing_files
│ └── figure-html
│ │ ├── loess-1.png
│ │ ├── final-loess-1.png
│ │ ├── loess-final-1.png
│ │ ├── gaussian-kernel-1.png
│ │ ├── polls-2008-data-1.png
│ │ ├── regression-p-hat-1.png
│ │ ├── triweight-kernel-1.png
│ │ ├── unnamed-chunk-5-1.png
│ │ ├── unnamed-chunk-7-1.png
│ │ ├── unnamed-chunk-8-1.png
│ │ ├── unnamed-chunk-9-1.png
│ │ ├── binsmoother-final-1.png
│ │ ├── binsmoother-expained-1.png
│ │ ├── ggplot-loess-default-1.png
│ │ ├── ggplot-loess-degree-1-1.png
│ │ ├── true-p-better-colors-1.png
│ │ ├── two-or-seven-scatter-1.png
│ │ ├── signal-plus-noise-example-1.png
│ │ ├── final-ksmooth-normal-kernel-1.png
│ │ ├── two-or-seven-images-large-x1-1.png
│ │ ├── linear-regression-not-flexible-1.png
│ │ └── polls-2008-parabola-line-loess-1.png
├── 04-r-basics_files
│ └── figure-html
│ │ ├── co2-plot-1.png
│ │ └── wrong-co2-plot-1.png
├── 10-distributions_files
│ └── figure-html
│ │ ├── ecdf-1.png
│ │ ├── first-boxplot-1.png
│ │ ├── boxplot-exercise-1.png
│ │ ├── height-histogram-1.png
│ │ ├── female-male-boxplots-1.png
│ │ ├── hist-non-normal-data-1.png
│ │ ├── two-densities-one-plot-1.png
│ │ ├── data-and-normal-densities-1.png
│ │ ├── state-region-distribution-1.png
│ │ ├── example-of-smoothed-density-1.png
│ │ ├── normal-distribution-density-1.png
│ │ └── histogram-qqplot-female-heights-1.png
├── 11-ggplot2_files
│ └── figure-html
│ │ ├── ggplot-qq-1.png
│ │ ├── barplot-geom-1.png
│ │ ├── ggplot-density-1.png
│ │ ├── ggplot-example-2-1.png
│ │ ├── ggplot-example-3-1.png
│ │ ├── ggplot-example-4-1.png
│ │ ├── ggplot-example-5-1.png
│ │ ├── ggplot-example-6-1.png
│ │ ├── ggplot-example-7-1.png
│ │ ├── ggplot-example-8-1.png
│ │ ├── ggplot-example-9-1.png
│ │ ├── unnamed-chunk-14-1.png
│ │ ├── unnamed-chunk-16-1.png
│ │ ├── unnamed-chunk-17-1.png
│ │ ├── unnamed-chunk-18-1.png
│ │ ├── unnamed-chunk-19-1.png
│ │ ├── unnamed-chunk-20-1.png
│ │ ├── ggplot-example-10-1.png
│ │ ├── ggplot-example-11-1.png
│ │ ├── ggplot-example-12-1.png
│ │ ├── ggplot-example-13-1.png
│ │ ├── gridExtra-example-1.png
│ │ ├── final-ggplot-example-1.png
│ │ ├── ggplot-example-plot-1.png
│ │ ├── height-histogram-geom-1.png
│ │ ├── region-freq-barplot-1.png
│ │ ├── female-male-boxplots-geom-1.png
│ │ └── ggplot2-image-new-colors-1.png
├── 13-wrangling_files
│ └── figure-html
│ │ ├── caribbean-1.png
│ │ ├── ev-vs-population-1.png
│ │ ├── unnamed-chunk-18-1.png
│ │ └── caribbean-with-nicknames-1.png
├── pset1_files
│ └── figure-html
│ │ ├── unnamed-chunk-10-1.png
│ │ ├── unnamed-chunk-11-1.png
│ │ ├── unnamed-chunk-13-1.png
│ │ ├── unnamed-chunk-15-1.png
│ │ ├── unnamed-chunk-16-1.png
│ │ ├── unnamed-chunk-18-1.png
│ │ ├── unnamed-chunk-19-1.png
│ │ ├── unnamed-chunk-2-1.png
│ │ ├── unnamed-chunk-21-1.png
│ │ ├── unnamed-chunk-22-1.png
│ │ ├── unnamed-chunk-23-1.png
│ │ ├── unnamed-chunk-3-1.png
│ │ ├── unnamed-chunk-4-1.png
│ │ └── unnamed-chunk-9-1.png
├── pset2_files
│ └── figure-html
│ │ ├── unnamed-chunk-10-1.png
│ │ ├── unnamed-chunk-22-1.png
│ │ ├── unnamed-chunk-24-1.png
│ │ ├── unnamed-chunk-25-1.png
│ │ ├── unnamed-chunk-26-1.png
│ │ ├── unnamed-chunk-27-1.png
│ │ ├── unnamed-chunk-28-1.png
│ │ ├── unnamed-chunk-33-1.png
│ │ ├── unnamed-chunk-34-1.png
│ │ ├── unnamed-chunk-35-1.png
│ │ ├── unnamed-chunk-5-1.png
│ │ ├── unnamed-chunk-7-1.png
│ │ └── unnamed-chunk-9-1.png
├── 19-models_files
│ └── figure-html
│ │ ├── poll-spread-qq-1.png
│ │ ├── pollster-bias-1.png
│ │ ├── simulated-polls-1.png
│ │ ├── unnamed-chunk-2-1.png
│ │ ├── time-trend-estimate-1.png
│ │ ├── time-trend-variability-1.png
│ │ ├── pollster-bias-histogram-1.png
│ │ ├── simulated-pollster-data-1.png
│ │ ├── t-distribution-examples-1.png
│ │ ├── fivethirtyeight-densities-1.png
│ │ ├── polls-2016-spread-histogram-1.png
│ │ ├── simulated-data-without-bias-1.png
│ │ ├── trend-estimate-for-all-pollsters-1.png
│ │ ├── confidence-coverage-2008-election-1.png
│ │ ├── posterior-versus-original-estimates-1.png
│ │ ├── time-trend-estimate-several-pollsters-1.png
│ │ └── comparison-forecast-with-and-without-bias-1.png
├── 20-regression_files
│ └── figure-html
│ │ ├── boxplot-1-1.png
│ │ ├── scatterplot-1.png
│ │ ├── ascombe-quartet-1.png
│ │ ├── regression-line-1.png
│ │ ├── unnamed-chunk-4-1.png
│ │ ├── unnamed-chunk-9-1.png
│ │ ├── lse-distributions-1.png
│ │ ├── qqnorm-of-strata-1.png
│ │ ├── regression-fallacy-1.png
│ │ ├── rss-versus-estimate-1.png
│ │ ├── two-regression-lines-1.png
│ │ ├── father-son-regression-1.png
│ │ ├── what-correlation-looks-like-1.png
│ │ ├── regression-line-standard-units-1.png
│ │ ├── conditional-averages-follow-line-1.png
│ │ ├── sample-correlation-distribution-1.png
│ │ ├── sample-correlation-distribution-2-1.png
│ │ └── small-sample-correlation-not-normal-1.png
├── 22-linear-models_files
│ └── figure-html
│ │ ├── gravity-1.png
│ │ ├── unnamed-chunk-17-1.png
│ │ ├── unnamed-chunk-18-1.png
│ │ ├── falling-object-fit-1.png
│ │ ├── lm-diagnostic-plot-1.png
│ │ ├── lm-residual-boxplots-1.png
│ │ ├── weight-by-diet-boxplots-1.png
│ │ └── weight-by-sex-diet-boxplots-1.png
├── 35-caret_files
│ └── figure-html
│ │ ├── caret-highlight-1.png
│ │ ├── train-knn-plot-1.png
│ │ └── cv-10-fold-accuracy-estimate-1.png
├── 36-algorithms_files
│ └── figure-html
│ │ ├── olive-eda-1.png
│ │ ├── olive-tree-1.png
│ │ ├── best-knn-fit-1.png
│ │ ├── cond-prob-rf-1.png
│ │ ├── curse-of-dim-1.png
│ │ ├── lda-estimate-1.png
│ │ ├── lda-explained-1.png
│ │ ├── qda-estimate-1.png
│ │ ├── qda-explained-1.png
│ │ ├── rf-cond-prob-1.png
│ │ ├── curse-of-dim-2-1.png
│ │ ├── curse-of-dim-4-1.png
│ │ ├── logistic-p-hat-1.png
│ │ ├── polls-2008-tree-1.png
│ │ ├── cond-prob-final-rf-1.png
│ │ ├── polls-2008-again-1.png
│ │ ├── polls-2008-rf-fit-1.png
│ │ ├── qda-does-not-fit-1.png
│ │ ├── olive-two-predictors-1.png
│ │ ├── polls-2008-final-fit-1.png
│ │ ├── polls-2008-tree-fit-1.png
│ │ ├── more-trees-better-fit-1.png
│ │ ├── polls-2008-tree-over-fit-1.png
│ │ ├── conditional-prob-glm-fit-2-1.png
│ │ └── naive-with-good-prevalence-1.png
├── 01-quarto_files
│ └── figure-html
│ │ └── unnamed-chunk-4-1.png
├── 34-cross-validation_files
│ └── figure-html
│ │ ├── knn-fit-1.png
│ │ ├── knn-1-overfit-1.png
│ │ ├── accuracy-vs-k-knn-1.png
│ │ ├── median-is-normal-1.png
│ │ ├── mnist-27-glm-est-1.png
│ │ └── income-distribution-1.png
├── 06-tidyverse_files
│ └── figure-html
│ │ └── unnamed-chunk-37-1.png
├── 12-dataviz-principles_files
│ └── figure-html
│ │ ├── donutchart-1.png
│ │ ├── piechart-1.png
│ │ ├── slope-plot-1.png
│ │ ├── bland-altman-1.png
│ │ ├── show-data-1-1.png
│ │ ├── show-data-2-1.png
│ │ ├── two-barplots-1.png
│ │ ├── area-not-radius-1.png
│ │ ├── excel-barplot-1.png
│ │ ├── available-shapes-1.png
│ │ ├── measels-exercise-1.png
│ │ ├── no-transformation-1.png
│ │ ├── barplot-from-zero-1-1.png
│ │ ├── barplot-from-zero-2-1.png
│ │ ├── barplot-from-zero-3-1.png
│ │ ├── pseud-3d-exercise-2-1.png
│ │ ├── pseudo-3d-exercise-1.png
│ │ ├── r-color-brewer-div-1.png
│ │ ├── r-color-brewer-seq-1.png
│ │ ├── us-murders-barplot-1.png
│ │ ├── boxplot-adjacent-comps-1.png
│ │ ├── boxplots-not-adjacent-1.png
│ │ ├── correct-transformation-1.png
│ │ ├── barplot-better-than-area-1.png
│ │ ├── encoding-third-variable-1.png
│ │ ├── points-plot-not-from-zero-1.png
│ │ ├── reorder-boxplot-example-1.png
│ │ ├── show-points-with-jitter-1.png
│ │ ├── show-the-data-comparison-1.png
│ │ ├── color-blind-friendly-colors-1.png
│ │ ├── colors-for-different-lines-1.png
│ │ ├── do-not-order-alphabetically-1.png
│ │ ├── baplot-not-from-zero-exercises-1.png
│ │ ├── barplot-plot-exercise-example-1.png
│ │ ├── common-axes-histograms-right-1.png
│ │ ├── common-axes-histograms-right-2-1.png
│ │ ├── common-axes-histograms-wrong-1.png
│ │ ├── scatter-plot-instead-of-slope-1.png
│ │ ├── boxplot-with-points-with-jitter-1.png
│ │ ├── boxplot-adjacent-comps-with-color-1.png
│ │ └── no-transformations-wrong-use-of-barplot-1.png
├── 17-probability_files
│ └── figure-html
│ │ ├── unnamed-chunk-11-1.png
│ │ ├── unnamed-chunk-17-1.png
│ │ ├── unnamed-chunk-19-1.png
│ │ ├── unnamed-chunk-20-1.png
│ │ ├── unnamed-chunk-4-1.png
│ │ └── unnamed-chunk-5-1.png
├── 25-matrices-in-R_files
│ └── figure-html
│ │ ├── example-images-1.png
│ │ ├── unnamed-chunk-20-1.png
│ │ ├── unnamed-chunk-21-1.png
│ │ ├── unnamed-chunk-28-1.png
│ │ ├── unnamed-chunk-33-1.png
│ │ ├── unnamed-chunk-33-2.png
│ │ ├── unnamed-chunk-45-1.png
│ │ ├── digit-images-example-1.png
│ │ └── boxplot-of-digit-averages-1.png
├── 27-dimension-reduction_files
│ └── figure-html
│ │ ├── iris-pca-1.png
│ │ ├── dist-approx-4-1.png
│ │ ├── max-rotation-1.png
│ │ ├── mnist-pca-1-4-1.png
│ │ ├── mnist-pca-last,-1.png
│ │ ├── unnamed-chunk-16-1.png
│ │ ├── unnamed-chunk-21-1.png
│ │ ├── unnamed-chunk-28-1.png
│ │ ├── unnamed-chunk-6-1.png
│ │ ├── unnamed-chunk-7-1.png
│ │ ├── unnamed-chunk-8-1.png
│ │ ├── distance-approx-2-1.png
│ │ ├── distance-illustration-1.png
│ │ ├── mnist-pca-1-2-scatter-1.png
│ │ ├── illustrate-pca-twin-heights-1.png
│ │ ├── mnist-pca-variance-explained-1.png
│ │ └── illustrate-pca-twin-heights-iris-1.png
├── 29-regularization_files
│ └── figure-html
│ │ ├── best-penalty-1.png
│ │ ├── movie-effects-1.png
│ │ ├── unnamed-chunk-31-1.png
│ │ ├── user-effect-hist-1.png
│ │ ├── movie-id-and-user-hists-1.png
│ │ ├── regularization-shrinkage-1.png
│ │ └── sparsity-of-movie-recs-1.png
├── 18-inference_files
│ └── figure-html
│ │ ├── first-simulated-poll-1.png
│ │ ├── confidence-interval-coverage-1.png
│ │ ├── normal-approximation-for-polls-1.png
│ │ └── standard-error-versus-sample-size-1.png
├── 26-linear-algebra_files
│ └── figure-html
│ │ ├── unnamed-chunk-15-1.png
│ │ ├── unnamed-chunk-19-1.png
│ │ ├── unnamed-chunk-20-1.png
│ │ ├── unnamed-chunk-7-1.png
│ │ └── unnamed-chunk-8-1.png
├── 30-matrix-factorization_files
│ └── figure-html
│ │ └── movie-cor-1.png
├── 07-dates-and-times_files
│ └── figure-html
│ │ ├── unnamed-chunk-26-1.png
│ │ ├── unnamed-chunk-27-1.png
│ │ ├── unnamed-chunk-28-1.png
│ │ └── unnamed-chunk-31-1.png
├── 16-text-mining_files
│ └── figure-html
│ │ ├── percent-diff-by-word-1.png
│ │ └── tweets-by-time-by-device-1.png
├── 21-multivariate-regression_files
│ └── figure-html
│ │ ├── bb-vs-hrs-1.png
│ │ ├── r-hat-hist-1.png
│ │ ├── runs-vs-bb-1.png
│ │ ├── runs-vs-sb-1.png
│ │ ├── runs-vs-hrs-1.png
│ │ ├── hr-by-runs-qq-1.png
│ │ ├── mlb-2002-payroll-1.png
│ │ ├── model-predicts-runs-1.png
│ │ ├── hr-versus-runs-regression-1.png
│ │ ├── predicted-runs-vs-salary-1.png
│ │ ├── runs-vs-bb-by-hr-strata-1.png
│ │ └── hr-versus-runs-regression-easy-1.png
├── 24-corrleation-not-causation_files
│ └── figure-html
│ │ ├── dredging-1.png
│ │ ├── outlier-1.png
│ │ ├── confounding-1.png
│ │ ├── null-corr-hist-1.png
│ │ ├── admission-by-major-1.png
│ │ ├── simpsons-paradox-1.png
│ │ ├── uc-berkeley-majors-1.png
│ │ ├── scatter-plot-of-ranks-1.png
│ │ ├── divorce-versus-margarine-1.png
│ │ └── simpsons-paradox-explained-1.png
├── 28-gene-expression-case-study_files
│ └── figure-html
│ │ ├── unnamed-chunk-10-1.png
│ │ ├── unnamed-chunk-11-1.png
│ │ ├── unnamed-chunk-11-2.png
│ │ ├── unnamed-chunk-11-3.png
│ │ ├── unnamed-chunk-11-4.png
│ │ ├── unnamed-chunk-11-5.png
│ │ ├── unnamed-chunk-12-1.png
│ │ └── unnamed-chunk-8-1.png
└── sitemap.xml
├── data
├── home.zip
├── population.rds
├── santoslozada-howard-2017-preprint.pdf
└── covid19-tests.txt
├── .gitignore
├── test_files
├── figure-markdown
│ └── unnamed-chunk-1-1.png
└── figure-commonmark
│ └── unnamed-chunk-1-1.png
├── README.md
├── test.md
├── 2023.Rproj
├── midterm-analysis.R
├── intro.qmd
├── r4ds.scss
├── _quarto.yml
├── 15-locales.qmd
├── 38-making-webpage.qmd
├── 28-gene-expression-case-study.qmd
├── 05-vectorization.qmd
├── 32-conditional-expectations.qmd
├── 35-caret.qmd
├── project-ideas.md
├── index.qmd
├── 01-quarto.qmd
├── 07-dates-and-times.qmd
├── 10-distributions.qmd
└── 08-importing-data.qmd
/docs/robots.txt:
--------------------------------------------------------------------------------
1 | Sitemap: http://datasciencelabs.github.io/2023/sitemap.xml
2 |
--------------------------------------------------------------------------------
/data/home.zip:
--------------------------------------------------------------------------------
https://raw.githubusercontent.com/datasciencelabs/2023/HEAD/data/home.zip
--------------------------------------------------------------------------------
/data/population.rds:
--------------------------------------------------------------------------------
https://raw.githubusercontent.com/datasciencelabs/2023/HEAD/data/population.rds
--------------------------------------------------------------------------------
/.gitignore:
--------------------------------------------------------------------------------
1 | /.quarto/
2 | .Rproj.user
3 | *notes*
4 | /*_cache
5 | /*_files
6 | *.sh
7 | .DS_Store
8 | *with-solutions*
9 | census-key.R
--------------------------------------------------------------------------------
/data/santoslozada-howard-2017-preprint.pdf:
--------------------------------------------------------------------------------
https://raw.githubusercontent.com/datasciencelabs/2023/HEAD/data/santoslozada-howard-2017-preprint.pdf
--------------------------------------------------------------------------------
/docs/31-ml-intro_files/figure-html/roc-3-1.png:
--------------------------------------------------------------------------------
https://raw.githubusercontent.com/datasciencelabs/2023/HEAD/docs/31-ml-intro_files/figure-html/roc-3-1.png
--------------------------------------------------------------------------------
/docs/site_libs/bootstrap/bootstrap-icons.woff:
--------------------------------------------------------------------------------
https://raw.githubusercontent.com/datasciencelabs/2023/HEAD/docs/site_libs/bootstrap/bootstrap-icons.woff
--------------------------------------------------------------------------------
/docs/33-smoothing_files/figure-html/loess-1.png:
--------------------------------------------------------------------------------
https://raw.githubusercontent.com/datasciencelabs/2023/HEAD/docs/33-smoothing_files/figure-html/loess-1.png
--------------------------------------------------------------------------------
/test_files/figure-markdown/unnamed-chunk-1-1.png:
--------------------------------------------------------------------------------
https://raw.githubusercontent.com/datasciencelabs/2023/HEAD/test_files/figure-markdown/unnamed-chunk-1-1.png
--------------------------------------------------------------------------------
/docs/04-r-basics_files/figure-html/co2-plot-1.png:
--------------------------------------------------------------------------------
https://raw.githubusercontent.com/datasciencelabs/2023/HEAD/docs/04-r-basics_files/figure-html/co2-plot-1.png
--------------------------------------------------------------------------------
/docs/10-distributions_files/figure-html/ecdf-1.png:
--------------------------------------------------------------------------------
https://raw.githubusercontent.com/datasciencelabs/2023/HEAD/docs/10-distributions_files/figure-html/ecdf-1.png
--------------------------------------------------------------------------------
/docs/11-ggplot2_files/figure-html/ggplot-qq-1.png:
--------------------------------------------------------------------------------
https://raw.githubusercontent.com/datasciencelabs/2023/HEAD/docs/11-ggplot2_files/figure-html/ggplot-qq-1.png
--------------------------------------------------------------------------------
/docs/13-wrangling_files/figure-html/caribbean-1.png:
--------------------------------------------------------------------------------
https://raw.githubusercontent.com/datasciencelabs/2023/HEAD/docs/13-wrangling_files/figure-html/caribbean-1.png
--------------------------------------------------------------------------------
/docs/pset1_files/figure-html/unnamed-chunk-10-1.png:
--------------------------------------------------------------------------------
https://raw.githubusercontent.com/datasciencelabs/2023/HEAD/docs/pset1_files/figure-html/unnamed-chunk-10-1.png
--------------------------------------------------------------------------------
/docs/pset1_files/figure-html/unnamed-chunk-11-1.png:
--------------------------------------------------------------------------------
https://raw.githubusercontent.com/datasciencelabs/2023/HEAD/docs/pset1_files/figure-html/unnamed-chunk-11-1.png
--------------------------------------------------------------------------------
/docs/pset1_files/figure-html/unnamed-chunk-13-1.png:
--------------------------------------------------------------------------------
https://raw.githubusercontent.com/datasciencelabs/2023/HEAD/docs/pset1_files/figure-html/unnamed-chunk-13-1.png
--------------------------------------------------------------------------------
/docs/pset1_files/figure-html/unnamed-chunk-15-1.png:
--------------------------------------------------------------------------------
https://raw.githubusercontent.com/datasciencelabs/2023/HEAD/docs/pset1_files/figure-html/unnamed-chunk-15-1.png
--------------------------------------------------------------------------------
/docs/pset1_files/figure-html/unnamed-chunk-16-1.png:
--------------------------------------------------------------------------------
https://raw.githubusercontent.com/datasciencelabs/2023/HEAD/docs/pset1_files/figure-html/unnamed-chunk-16-1.png
--------------------------------------------------------------------------------
/docs/pset1_files/figure-html/unnamed-chunk-18-1.png:
--------------------------------------------------------------------------------
https://raw.githubusercontent.com/datasciencelabs/2023/HEAD/docs/pset1_files/figure-html/unnamed-chunk-18-1.png
--------------------------------------------------------------------------------
/docs/pset1_files/figure-html/unnamed-chunk-19-1.png:
--------------------------------------------------------------------------------
https://raw.githubusercontent.com/datasciencelabs/2023/HEAD/docs/pset1_files/figure-html/unnamed-chunk-19-1.png
--------------------------------------------------------------------------------
/docs/pset1_files/figure-html/unnamed-chunk-2-1.png:
--------------------------------------------------------------------------------
https://raw.githubusercontent.com/datasciencelabs/2023/HEAD/docs/pset1_files/figure-html/unnamed-chunk-2-1.png
--------------------------------------------------------------------------------
/docs/pset1_files/figure-html/unnamed-chunk-21-1.png:
--------------------------------------------------------------------------------
https://raw.githubusercontent.com/datasciencelabs/2023/HEAD/docs/pset1_files/figure-html/unnamed-chunk-21-1.png
--------------------------------------------------------------------------------
/docs/pset1_files/figure-html/unnamed-chunk-22-1.png:
--------------------------------------------------------------------------------
https://raw.githubusercontent.com/datasciencelabs/2023/HEAD/docs/pset1_files/figure-html/unnamed-chunk-22-1.png
--------------------------------------------------------------------------------
/docs/pset1_files/figure-html/unnamed-chunk-23-1.png:
--------------------------------------------------------------------------------
https://raw.githubusercontent.com/datasciencelabs/2023/HEAD/docs/pset1_files/figure-html/unnamed-chunk-23-1.png
--------------------------------------------------------------------------------
/docs/pset1_files/figure-html/unnamed-chunk-3-1.png:
--------------------------------------------------------------------------------
https://raw.githubusercontent.com/datasciencelabs/2023/HEAD/docs/pset1_files/figure-html/unnamed-chunk-3-1.png
--------------------------------------------------------------------------------
/docs/pset1_files/figure-html/unnamed-chunk-4-1.png:
--------------------------------------------------------------------------------
https://raw.githubusercontent.com/datasciencelabs/2023/HEAD/docs/pset1_files/figure-html/unnamed-chunk-4-1.png
--------------------------------------------------------------------------------
/docs/pset1_files/figure-html/unnamed-chunk-9-1.png:
--------------------------------------------------------------------------------
https://raw.githubusercontent.com/datasciencelabs/2023/HEAD/docs/pset1_files/figure-html/unnamed-chunk-9-1.png
--------------------------------------------------------------------------------
/docs/pset2_files/figure-html/unnamed-chunk-10-1.png:
--------------------------------------------------------------------------------
https://raw.githubusercontent.com/datasciencelabs/2023/HEAD/docs/pset2_files/figure-html/unnamed-chunk-10-1.png
--------------------------------------------------------------------------------
/docs/pset2_files/figure-html/unnamed-chunk-22-1.png:
--------------------------------------------------------------------------------
https://raw.githubusercontent.com/datasciencelabs/2023/HEAD/docs/pset2_files/figure-html/unnamed-chunk-22-1.png
--------------------------------------------------------------------------------
/docs/pset2_files/figure-html/unnamed-chunk-24-1.png:
--------------------------------------------------------------------------------
https://raw.githubusercontent.com/datasciencelabs/2023/HEAD/docs/pset2_files/figure-html/unnamed-chunk-24-1.png
--------------------------------------------------------------------------------
/docs/pset2_files/figure-html/unnamed-chunk-25-1.png:
--------------------------------------------------------------------------------
https://raw.githubusercontent.com/datasciencelabs/2023/HEAD/docs/pset2_files/figure-html/unnamed-chunk-25-1.png
--------------------------------------------------------------------------------
/docs/pset2_files/figure-html/unnamed-chunk-26-1.png:
--------------------------------------------------------------------------------
https://raw.githubusercontent.com/datasciencelabs/2023/HEAD/docs/pset2_files/figure-html/unnamed-chunk-26-1.png
--------------------------------------------------------------------------------
/docs/pset2_files/figure-html/unnamed-chunk-27-1.png:
--------------------------------------------------------------------------------
https://raw.githubusercontent.com/datasciencelabs/2023/HEAD/docs/pset2_files/figure-html/unnamed-chunk-27-1.png
--------------------------------------------------------------------------------
/docs/pset2_files/figure-html/unnamed-chunk-28-1.png:
--------------------------------------------------------------------------------
https://raw.githubusercontent.com/datasciencelabs/2023/HEAD/docs/pset2_files/figure-html/unnamed-chunk-28-1.png
--------------------------------------------------------------------------------
/docs/pset2_files/figure-html/unnamed-chunk-33-1.png:
--------------------------------------------------------------------------------
https://raw.githubusercontent.com/datasciencelabs/2023/HEAD/docs/pset2_files/figure-html/unnamed-chunk-33-1.png
--------------------------------------------------------------------------------
/docs/pset2_files/figure-html/unnamed-chunk-34-1.png:
--------------------------------------------------------------------------------
https://raw.githubusercontent.com/datasciencelabs/2023/HEAD/docs/pset2_files/figure-html/unnamed-chunk-34-1.png
--------------------------------------------------------------------------------
/docs/pset2_files/figure-html/unnamed-chunk-35-1.png:
--------------------------------------------------------------------------------
https://raw.githubusercontent.com/datasciencelabs/2023/HEAD/docs/pset2_files/figure-html/unnamed-chunk-35-1.png
--------------------------------------------------------------------------------
/docs/pset2_files/figure-html/unnamed-chunk-5-1.png:
--------------------------------------------------------------------------------
https://raw.githubusercontent.com/datasciencelabs/2023/HEAD/docs/pset2_files/figure-html/unnamed-chunk-5-1.png
--------------------------------------------------------------------------------
/docs/pset2_files/figure-html/unnamed-chunk-7-1.png:
--------------------------------------------------------------------------------
https://raw.githubusercontent.com/datasciencelabs/2023/HEAD/docs/pset2_files/figure-html/unnamed-chunk-7-1.png
--------------------------------------------------------------------------------
/docs/pset2_files/figure-html/unnamed-chunk-9-1.png:
--------------------------------------------------------------------------------
https://raw.githubusercontent.com/datasciencelabs/2023/HEAD/docs/pset2_files/figure-html/unnamed-chunk-9-1.png
--------------------------------------------------------------------------------
/test_files/figure-commonmark/unnamed-chunk-1-1.png:
--------------------------------------------------------------------------------
https://raw.githubusercontent.com/datasciencelabs/2023/HEAD/test_files/figure-commonmark/unnamed-chunk-1-1.png
--------------------------------------------------------------------------------
/docs/11-ggplot2_files/figure-html/barplot-geom-1.png:
--------------------------------------------------------------------------------
https://raw.githubusercontent.com/datasciencelabs/2023/HEAD/docs/11-ggplot2_files/figure-html/barplot-geom-1.png
--------------------------------------------------------------------------------
/docs/19-models_files/figure-html/poll-spread-qq-1.png:
--------------------------------------------------------------------------------
https://raw.githubusercontent.com/datasciencelabs/2023/HEAD/docs/19-models_files/figure-html/poll-spread-qq-1.png
--------------------------------------------------------------------------------
/docs/19-models_files/figure-html/pollster-bias-1.png:
--------------------------------------------------------------------------------
https://raw.githubusercontent.com/datasciencelabs/2023/HEAD/docs/19-models_files/figure-html/pollster-bias-1.png
--------------------------------------------------------------------------------
/docs/20-regression_files/figure-html/boxplot-1-1.png:
--------------------------------------------------------------------------------
https://raw.githubusercontent.com/datasciencelabs/2023/HEAD/docs/20-regression_files/figure-html/boxplot-1-1.png
--------------------------------------------------------------------------------
/docs/22-linear-models_files/figure-html/gravity-1.png:
--------------------------------------------------------------------------------
https://raw.githubusercontent.com/datasciencelabs/2023/HEAD/docs/22-linear-models_files/figure-html/gravity-1.png
--------------------------------------------------------------------------------
/docs/33-smoothing_files/figure-html/final-loess-1.png:
--------------------------------------------------------------------------------
https://raw.githubusercontent.com/datasciencelabs/2023/HEAD/docs/33-smoothing_files/figure-html/final-loess-1.png
--------------------------------------------------------------------------------
/docs/33-smoothing_files/figure-html/loess-final-1.png:
--------------------------------------------------------------------------------
https://raw.githubusercontent.com/datasciencelabs/2023/HEAD/docs/33-smoothing_files/figure-html/loess-final-1.png
--------------------------------------------------------------------------------
/docs/35-caret_files/figure-html/caret-highlight-1.png:
--------------------------------------------------------------------------------
https://raw.githubusercontent.com/datasciencelabs/2023/HEAD/docs/35-caret_files/figure-html/caret-highlight-1.png
--------------------------------------------------------------------------------
/docs/35-caret_files/figure-html/train-knn-plot-1.png:
--------------------------------------------------------------------------------
https://raw.githubusercontent.com/datasciencelabs/2023/HEAD/docs/35-caret_files/figure-html/train-knn-plot-1.png
--------------------------------------------------------------------------------
/docs/36-algorithms_files/figure-html/olive-eda-1.png:
--------------------------------------------------------------------------------
https://raw.githubusercontent.com/datasciencelabs/2023/HEAD/docs/36-algorithms_files/figure-html/olive-eda-1.png
--------------------------------------------------------------------------------
/docs/36-algorithms_files/figure-html/olive-tree-1.png:
--------------------------------------------------------------------------------
https://raw.githubusercontent.com/datasciencelabs/2023/HEAD/docs/36-algorithms_files/figure-html/olive-tree-1.png
--------------------------------------------------------------------------------
/docs/01-quarto_files/figure-html/unnamed-chunk-4-1.png:
--------------------------------------------------------------------------------
https://raw.githubusercontent.com/datasciencelabs/2023/HEAD/docs/01-quarto_files/figure-html/unnamed-chunk-4-1.png
--------------------------------------------------------------------------------
/docs/04-r-basics_files/figure-html/wrong-co2-plot-1.png:
--------------------------------------------------------------------------------
https://raw.githubusercontent.com/datasciencelabs/2023/HEAD/docs/04-r-basics_files/figure-html/wrong-co2-plot-1.png
--------------------------------------------------------------------------------
/docs/11-ggplot2_files/figure-html/ggplot-density-1.png:
--------------------------------------------------------------------------------
https://raw.githubusercontent.com/datasciencelabs/2023/HEAD/docs/11-ggplot2_files/figure-html/ggplot-density-1.png
--------------------------------------------------------------------------------
/docs/11-ggplot2_files/figure-html/ggplot-example-2-1.png:
--------------------------------------------------------------------------------
https://raw.githubusercontent.com/datasciencelabs/2023/HEAD/docs/11-ggplot2_files/figure-html/ggplot-example-2-1.png
--------------------------------------------------------------------------------
/docs/11-ggplot2_files/figure-html/ggplot-example-3-1.png:
--------------------------------------------------------------------------------
https://raw.githubusercontent.com/datasciencelabs/2023/HEAD/docs/11-ggplot2_files/figure-html/ggplot-example-3-1.png
--------------------------------------------------------------------------------
/docs/11-ggplot2_files/figure-html/ggplot-example-4-1.png:
--------------------------------------------------------------------------------
https://raw.githubusercontent.com/datasciencelabs/2023/HEAD/docs/11-ggplot2_files/figure-html/ggplot-example-4-1.png
--------------------------------------------------------------------------------
/docs/11-ggplot2_files/figure-html/ggplot-example-5-1.png:
--------------------------------------------------------------------------------
https://raw.githubusercontent.com/datasciencelabs/2023/HEAD/docs/11-ggplot2_files/figure-html/ggplot-example-5-1.png
--------------------------------------------------------------------------------
/docs/11-ggplot2_files/figure-html/ggplot-example-6-1.png:
--------------------------------------------------------------------------------
https://raw.githubusercontent.com/datasciencelabs/2023/HEAD/docs/11-ggplot2_files/figure-html/ggplot-example-6-1.png
--------------------------------------------------------------------------------
/docs/11-ggplot2_files/figure-html/ggplot-example-7-1.png:
--------------------------------------------------------------------------------
https://raw.githubusercontent.com/datasciencelabs/2023/HEAD/docs/11-ggplot2_files/figure-html/ggplot-example-7-1.png
--------------------------------------------------------------------------------
/docs/11-ggplot2_files/figure-html/ggplot-example-8-1.png:
--------------------------------------------------------------------------------
https://raw.githubusercontent.com/datasciencelabs/2023/HEAD/docs/11-ggplot2_files/figure-html/ggplot-example-8-1.png
--------------------------------------------------------------------------------
/docs/11-ggplot2_files/figure-html/ggplot-example-9-1.png:
--------------------------------------------------------------------------------
https://raw.githubusercontent.com/datasciencelabs/2023/HEAD/docs/11-ggplot2_files/figure-html/ggplot-example-9-1.png
--------------------------------------------------------------------------------
/docs/11-ggplot2_files/figure-html/unnamed-chunk-14-1.png:
--------------------------------------------------------------------------------
https://raw.githubusercontent.com/datasciencelabs/2023/HEAD/docs/11-ggplot2_files/figure-html/unnamed-chunk-14-1.png
--------------------------------------------------------------------------------
/docs/11-ggplot2_files/figure-html/unnamed-chunk-16-1.png:
--------------------------------------------------------------------------------
https://raw.githubusercontent.com/datasciencelabs/2023/HEAD/docs/11-ggplot2_files/figure-html/unnamed-chunk-16-1.png
--------------------------------------------------------------------------------
/docs/11-ggplot2_files/figure-html/unnamed-chunk-17-1.png:
--------------------------------------------------------------------------------
https://raw.githubusercontent.com/datasciencelabs/2023/HEAD/docs/11-ggplot2_files/figure-html/unnamed-chunk-17-1.png
--------------------------------------------------------------------------------
/docs/11-ggplot2_files/figure-html/unnamed-chunk-18-1.png:
--------------------------------------------------------------------------------
https://raw.githubusercontent.com/datasciencelabs/2023/HEAD/docs/11-ggplot2_files/figure-html/unnamed-chunk-18-1.png
--------------------------------------------------------------------------------
/docs/11-ggplot2_files/figure-html/unnamed-chunk-19-1.png:
--------------------------------------------------------------------------------
https://raw.githubusercontent.com/datasciencelabs/2023/HEAD/docs/11-ggplot2_files/figure-html/unnamed-chunk-19-1.png
--------------------------------------------------------------------------------
/docs/11-ggplot2_files/figure-html/unnamed-chunk-20-1.png:
--------------------------------------------------------------------------------
https://raw.githubusercontent.com/datasciencelabs/2023/HEAD/docs/11-ggplot2_files/figure-html/unnamed-chunk-20-1.png
--------------------------------------------------------------------------------
/docs/19-models_files/figure-html/simulated-polls-1.png:
--------------------------------------------------------------------------------
https://raw.githubusercontent.com/datasciencelabs/2023/HEAD/docs/19-models_files/figure-html/simulated-polls-1.png
--------------------------------------------------------------------------------
/docs/19-models_files/figure-html/unnamed-chunk-2-1.png:
--------------------------------------------------------------------------------
https://raw.githubusercontent.com/datasciencelabs/2023/HEAD/docs/19-models_files/figure-html/unnamed-chunk-2-1.png
--------------------------------------------------------------------------------
/docs/20-regression_files/figure-html/scatterplot-1.png:
--------------------------------------------------------------------------------
https://raw.githubusercontent.com/datasciencelabs/2023/HEAD/docs/20-regression_files/figure-html/scatterplot-1.png
--------------------------------------------------------------------------------
/docs/31-ml-intro_files/figure-html/f_1-vs-cutoff-1.png:
--------------------------------------------------------------------------------
https://raw.githubusercontent.com/datasciencelabs/2023/HEAD/docs/31-ml-intro_files/figure-html/f_1-vs-cutoff-1.png
--------------------------------------------------------------------------------
/docs/34-cross-validation_files/figure-html/knn-fit-1.png:
--------------------------------------------------------------------------------
https://raw.githubusercontent.com/datasciencelabs/2023/HEAD/docs/34-cross-validation_files/figure-html/knn-fit-1.png
--------------------------------------------------------------------------------
/docs/36-algorithms_files/figure-html/best-knn-fit-1.png:
--------------------------------------------------------------------------------
https://raw.githubusercontent.com/datasciencelabs/2023/HEAD/docs/36-algorithms_files/figure-html/best-knn-fit-1.png
--------------------------------------------------------------------------------
/docs/36-algorithms_files/figure-html/cond-prob-rf-1.png:
--------------------------------------------------------------------------------
https://raw.githubusercontent.com/datasciencelabs/2023/HEAD/docs/36-algorithms_files/figure-html/cond-prob-rf-1.png
--------------------------------------------------------------------------------
/docs/36-algorithms_files/figure-html/curse-of-dim-1.png:
--------------------------------------------------------------------------------
https://raw.githubusercontent.com/datasciencelabs/2023/HEAD/docs/36-algorithms_files/figure-html/curse-of-dim-1.png
--------------------------------------------------------------------------------
/docs/36-algorithms_files/figure-html/lda-estimate-1.png:
--------------------------------------------------------------------------------
https://raw.githubusercontent.com/datasciencelabs/2023/HEAD/docs/36-algorithms_files/figure-html/lda-estimate-1.png
--------------------------------------------------------------------------------
/docs/36-algorithms_files/figure-html/lda-explained-1.png:
--------------------------------------------------------------------------------
https://raw.githubusercontent.com/datasciencelabs/2023/HEAD/docs/36-algorithms_files/figure-html/lda-explained-1.png
--------------------------------------------------------------------------------
/docs/36-algorithms_files/figure-html/qda-estimate-1.png:
--------------------------------------------------------------------------------
https://raw.githubusercontent.com/datasciencelabs/2023/HEAD/docs/36-algorithms_files/figure-html/qda-estimate-1.png
--------------------------------------------------------------------------------
/docs/36-algorithms_files/figure-html/qda-explained-1.png:
--------------------------------------------------------------------------------
https://raw.githubusercontent.com/datasciencelabs/2023/HEAD/docs/36-algorithms_files/figure-html/qda-explained-1.png
--------------------------------------------------------------------------------
/docs/36-algorithms_files/figure-html/rf-cond-prob-1.png:
--------------------------------------------------------------------------------
https://raw.githubusercontent.com/datasciencelabs/2023/HEAD/docs/36-algorithms_files/figure-html/rf-cond-prob-1.png
--------------------------------------------------------------------------------
/docs/06-tidyverse_files/figure-html/unnamed-chunk-37-1.png:
--------------------------------------------------------------------------------
https://raw.githubusercontent.com/datasciencelabs/2023/HEAD/docs/06-tidyverse_files/figure-html/unnamed-chunk-37-1.png
--------------------------------------------------------------------------------
/docs/11-ggplot2_files/figure-html/ggplot-example-10-1.png:
--------------------------------------------------------------------------------
https://raw.githubusercontent.com/datasciencelabs/2023/HEAD/docs/11-ggplot2_files/figure-html/ggplot-example-10-1.png
--------------------------------------------------------------------------------
/docs/11-ggplot2_files/figure-html/ggplot-example-11-1.png:
--------------------------------------------------------------------------------
https://raw.githubusercontent.com/datasciencelabs/2023/HEAD/docs/11-ggplot2_files/figure-html/ggplot-example-11-1.png
--------------------------------------------------------------------------------
/docs/11-ggplot2_files/figure-html/ggplot-example-12-1.png:
--------------------------------------------------------------------------------
https://raw.githubusercontent.com/datasciencelabs/2023/HEAD/docs/11-ggplot2_files/figure-html/ggplot-example-12-1.png
--------------------------------------------------------------------------------
/docs/11-ggplot2_files/figure-html/ggplot-example-13-1.png:
--------------------------------------------------------------------------------
https://raw.githubusercontent.com/datasciencelabs/2023/HEAD/docs/11-ggplot2_files/figure-html/ggplot-example-13-1.png
--------------------------------------------------------------------------------
/docs/11-ggplot2_files/figure-html/gridExtra-example-1.png:
--------------------------------------------------------------------------------
https://raw.githubusercontent.com/datasciencelabs/2023/HEAD/docs/11-ggplot2_files/figure-html/gridExtra-example-1.png
--------------------------------------------------------------------------------
/docs/13-wrangling_files/figure-html/ev-vs-population-1.png:
--------------------------------------------------------------------------------
https://raw.githubusercontent.com/datasciencelabs/2023/HEAD/docs/13-wrangling_files/figure-html/ev-vs-population-1.png
--------------------------------------------------------------------------------
/docs/13-wrangling_files/figure-html/unnamed-chunk-18-1.png:
--------------------------------------------------------------------------------
https://raw.githubusercontent.com/datasciencelabs/2023/HEAD/docs/13-wrangling_files/figure-html/unnamed-chunk-18-1.png
--------------------------------------------------------------------------------
/docs/19-models_files/figure-html/time-trend-estimate-1.png:
--------------------------------------------------------------------------------
https://raw.githubusercontent.com/datasciencelabs/2023/HEAD/docs/19-models_files/figure-html/time-trend-estimate-1.png
--------------------------------------------------------------------------------
/docs/20-regression_files/figure-html/ascombe-quartet-1.png:
--------------------------------------------------------------------------------
https://raw.githubusercontent.com/datasciencelabs/2023/HEAD/docs/20-regression_files/figure-html/ascombe-quartet-1.png
--------------------------------------------------------------------------------
/docs/20-regression_files/figure-html/regression-line-1.png:
--------------------------------------------------------------------------------
https://raw.githubusercontent.com/datasciencelabs/2023/HEAD/docs/20-regression_files/figure-html/regression-line-1.png
--------------------------------------------------------------------------------
/docs/20-regression_files/figure-html/unnamed-chunk-4-1.png:
--------------------------------------------------------------------------------
https://raw.githubusercontent.com/datasciencelabs/2023/HEAD/docs/20-regression_files/figure-html/unnamed-chunk-4-1.png
--------------------------------------------------------------------------------
/docs/20-regression_files/figure-html/unnamed-chunk-9-1.png:
--------------------------------------------------------------------------------
https://raw.githubusercontent.com/datasciencelabs/2023/HEAD/docs/20-regression_files/figure-html/unnamed-chunk-9-1.png
--------------------------------------------------------------------------------
/docs/33-smoothing_files/figure-html/gaussian-kernel-1.png:
--------------------------------------------------------------------------------
https://raw.githubusercontent.com/datasciencelabs/2023/HEAD/docs/33-smoothing_files/figure-html/gaussian-kernel-1.png
--------------------------------------------------------------------------------
/docs/33-smoothing_files/figure-html/polls-2008-data-1.png:
--------------------------------------------------------------------------------
https://raw.githubusercontent.com/datasciencelabs/2023/HEAD/docs/33-smoothing_files/figure-html/polls-2008-data-1.png
--------------------------------------------------------------------------------
/docs/33-smoothing_files/figure-html/regression-p-hat-1.png:
--------------------------------------------------------------------------------
https://raw.githubusercontent.com/datasciencelabs/2023/HEAD/docs/33-smoothing_files/figure-html/regression-p-hat-1.png
--------------------------------------------------------------------------------
/docs/33-smoothing_files/figure-html/triweight-kernel-1.png:
--------------------------------------------------------------------------------
https://raw.githubusercontent.com/datasciencelabs/2023/HEAD/docs/33-smoothing_files/figure-html/triweight-kernel-1.png
--------------------------------------------------------------------------------
/docs/33-smoothing_files/figure-html/unnamed-chunk-5-1.png:
--------------------------------------------------------------------------------
https://raw.githubusercontent.com/datasciencelabs/2023/HEAD/docs/33-smoothing_files/figure-html/unnamed-chunk-5-1.png
--------------------------------------------------------------------------------
/docs/33-smoothing_files/figure-html/unnamed-chunk-7-1.png:
--------------------------------------------------------------------------------
https://raw.githubusercontent.com/datasciencelabs/2023/HEAD/docs/33-smoothing_files/figure-html/unnamed-chunk-7-1.png
--------------------------------------------------------------------------------
/docs/33-smoothing_files/figure-html/unnamed-chunk-8-1.png:
--------------------------------------------------------------------------------
https://raw.githubusercontent.com/datasciencelabs/2023/HEAD/docs/33-smoothing_files/figure-html/unnamed-chunk-8-1.png
--------------------------------------------------------------------------------
/docs/33-smoothing_files/figure-html/unnamed-chunk-9-1.png:
--------------------------------------------------------------------------------
https://raw.githubusercontent.com/datasciencelabs/2023/HEAD/docs/33-smoothing_files/figure-html/unnamed-chunk-9-1.png
--------------------------------------------------------------------------------
/docs/36-algorithms_files/figure-html/curse-of-dim-2-1.png:
--------------------------------------------------------------------------------
https://raw.githubusercontent.com/datasciencelabs/2023/HEAD/docs/36-algorithms_files/figure-html/curse-of-dim-2-1.png
--------------------------------------------------------------------------------
/docs/36-algorithms_files/figure-html/curse-of-dim-4-1.png:
--------------------------------------------------------------------------------
https://raw.githubusercontent.com/datasciencelabs/2023/HEAD/docs/36-algorithms_files/figure-html/curse-of-dim-4-1.png
--------------------------------------------------------------------------------
/docs/36-algorithms_files/figure-html/logistic-p-hat-1.png:
--------------------------------------------------------------------------------
https://raw.githubusercontent.com/datasciencelabs/2023/HEAD/docs/36-algorithms_files/figure-html/logistic-p-hat-1.png
--------------------------------------------------------------------------------
/docs/36-algorithms_files/figure-html/polls-2008-tree-1.png:
--------------------------------------------------------------------------------
https://raw.githubusercontent.com/datasciencelabs/2023/HEAD/docs/36-algorithms_files/figure-html/polls-2008-tree-1.png
--------------------------------------------------------------------------------
/docs/10-distributions_files/figure-html/first-boxplot-1.png:
--------------------------------------------------------------------------------
https://raw.githubusercontent.com/datasciencelabs/2023/HEAD/docs/10-distributions_files/figure-html/first-boxplot-1.png
--------------------------------------------------------------------------------
/docs/11-ggplot2_files/figure-html/final-ggplot-example-1.png:
--------------------------------------------------------------------------------
https://raw.githubusercontent.com/datasciencelabs/2023/HEAD/docs/11-ggplot2_files/figure-html/final-ggplot-example-1.png
--------------------------------------------------------------------------------
/docs/11-ggplot2_files/figure-html/ggplot-example-plot-1.png:
--------------------------------------------------------------------------------
https://raw.githubusercontent.com/datasciencelabs/2023/HEAD/docs/11-ggplot2_files/figure-html/ggplot-example-plot-1.png
--------------------------------------------------------------------------------
/docs/11-ggplot2_files/figure-html/height-histogram-geom-1.png:
--------------------------------------------------------------------------------
https://raw.githubusercontent.com/datasciencelabs/2023/HEAD/docs/11-ggplot2_files/figure-html/height-histogram-geom-1.png
--------------------------------------------------------------------------------
/docs/11-ggplot2_files/figure-html/region-freq-barplot-1.png:
--------------------------------------------------------------------------------
https://raw.githubusercontent.com/datasciencelabs/2023/HEAD/docs/11-ggplot2_files/figure-html/region-freq-barplot-1.png
--------------------------------------------------------------------------------
/docs/12-dataviz-principles_files/figure-html/donutchart-1.png:
--------------------------------------------------------------------------------
https://raw.githubusercontent.com/datasciencelabs/2023/HEAD/docs/12-dataviz-principles_files/figure-html/donutchart-1.png
--------------------------------------------------------------------------------
/docs/12-dataviz-principles_files/figure-html/piechart-1.png:
--------------------------------------------------------------------------------
https://raw.githubusercontent.com/datasciencelabs/2023/HEAD/docs/12-dataviz-principles_files/figure-html/piechart-1.png
--------------------------------------------------------------------------------
/docs/12-dataviz-principles_files/figure-html/slope-plot-1.png:
--------------------------------------------------------------------------------
https://raw.githubusercontent.com/datasciencelabs/2023/HEAD/docs/12-dataviz-principles_files/figure-html/slope-plot-1.png
--------------------------------------------------------------------------------
/docs/17-probability_files/figure-html/unnamed-chunk-11-1.png:
--------------------------------------------------------------------------------
https://raw.githubusercontent.com/datasciencelabs/2023/HEAD/docs/17-probability_files/figure-html/unnamed-chunk-11-1.png
--------------------------------------------------------------------------------
/docs/17-probability_files/figure-html/unnamed-chunk-17-1.png:
--------------------------------------------------------------------------------
https://raw.githubusercontent.com/datasciencelabs/2023/HEAD/docs/17-probability_files/figure-html/unnamed-chunk-17-1.png
--------------------------------------------------------------------------------
/docs/17-probability_files/figure-html/unnamed-chunk-19-1.png:
--------------------------------------------------------------------------------
https://raw.githubusercontent.com/datasciencelabs/2023/HEAD/docs/17-probability_files/figure-html/unnamed-chunk-19-1.png
--------------------------------------------------------------------------------
/docs/17-probability_files/figure-html/unnamed-chunk-20-1.png:
--------------------------------------------------------------------------------
https://raw.githubusercontent.com/datasciencelabs/2023/HEAD/docs/17-probability_files/figure-html/unnamed-chunk-20-1.png
--------------------------------------------------------------------------------
/docs/17-probability_files/figure-html/unnamed-chunk-4-1.png:
--------------------------------------------------------------------------------
https://raw.githubusercontent.com/datasciencelabs/2023/HEAD/docs/17-probability_files/figure-html/unnamed-chunk-4-1.png
--------------------------------------------------------------------------------
/docs/17-probability_files/figure-html/unnamed-chunk-5-1.png:
--------------------------------------------------------------------------------
https://raw.githubusercontent.com/datasciencelabs/2023/HEAD/docs/17-probability_files/figure-html/unnamed-chunk-5-1.png
--------------------------------------------------------------------------------
/docs/19-models_files/figure-html/time-trend-variability-1.png:
--------------------------------------------------------------------------------
https://raw.githubusercontent.com/datasciencelabs/2023/HEAD/docs/19-models_files/figure-html/time-trend-variability-1.png
--------------------------------------------------------------------------------
/docs/20-regression_files/figure-html/lse-distributions-1.png:
--------------------------------------------------------------------------------
https://raw.githubusercontent.com/datasciencelabs/2023/HEAD/docs/20-regression_files/figure-html/lse-distributions-1.png
--------------------------------------------------------------------------------
/docs/20-regression_files/figure-html/qqnorm-of-strata-1.png:
--------------------------------------------------------------------------------
https://raw.githubusercontent.com/datasciencelabs/2023/HEAD/docs/20-regression_files/figure-html/qqnorm-of-strata-1.png
--------------------------------------------------------------------------------
/docs/20-regression_files/figure-html/regression-fallacy-1.png:
--------------------------------------------------------------------------------
https://raw.githubusercontent.com/datasciencelabs/2023/HEAD/docs/20-regression_files/figure-html/regression-fallacy-1.png
--------------------------------------------------------------------------------
/docs/25-matrices-in-R_files/figure-html/example-images-1.png:
--------------------------------------------------------------------------------
https://raw.githubusercontent.com/datasciencelabs/2023/HEAD/docs/25-matrices-in-R_files/figure-html/example-images-1.png
--------------------------------------------------------------------------------
/docs/27-dimension-reduction_files/figure-html/iris-pca-1.png:
--------------------------------------------------------------------------------
https://raw.githubusercontent.com/datasciencelabs/2023/HEAD/docs/27-dimension-reduction_files/figure-html/iris-pca-1.png
--------------------------------------------------------------------------------
/docs/29-regularization_files/figure-html/best-penalty-1.png:
--------------------------------------------------------------------------------
https://raw.githubusercontent.com/datasciencelabs/2023/HEAD/docs/29-regularization_files/figure-html/best-penalty-1.png
--------------------------------------------------------------------------------
/docs/29-regularization_files/figure-html/movie-effects-1.png:
--------------------------------------------------------------------------------
https://raw.githubusercontent.com/datasciencelabs/2023/HEAD/docs/29-regularization_files/figure-html/movie-effects-1.png
--------------------------------------------------------------------------------
/docs/31-ml-intro_files/figure-html/accuracy-vs-cutoff-1.png:
--------------------------------------------------------------------------------
https://raw.githubusercontent.com/datasciencelabs/2023/HEAD/docs/31-ml-intro_files/figure-html/accuracy-vs-cutoff-1.png
--------------------------------------------------------------------------------
/docs/31-ml-intro_files/figure-html/precision-recall-1-1.png:
--------------------------------------------------------------------------------
https://raw.githubusercontent.com/datasciencelabs/2023/HEAD/docs/31-ml-intro_files/figure-html/precision-recall-1-1.png
--------------------------------------------------------------------------------
/docs/33-smoothing_files/figure-html/binsmoother-final-1.png:
--------------------------------------------------------------------------------
https://raw.githubusercontent.com/datasciencelabs/2023/HEAD/docs/33-smoothing_files/figure-html/binsmoother-final-1.png
--------------------------------------------------------------------------------
/docs/36-algorithms_files/figure-html/cond-prob-final-rf-1.png:
--------------------------------------------------------------------------------
https://raw.githubusercontent.com/datasciencelabs/2023/HEAD/docs/36-algorithms_files/figure-html/cond-prob-final-rf-1.png
--------------------------------------------------------------------------------
/docs/36-algorithms_files/figure-html/polls-2008-again-1.png:
--------------------------------------------------------------------------------
https://raw.githubusercontent.com/datasciencelabs/2023/HEAD/docs/36-algorithms_files/figure-html/polls-2008-again-1.png
--------------------------------------------------------------------------------
/docs/36-algorithms_files/figure-html/polls-2008-rf-fit-1.png:
--------------------------------------------------------------------------------
https://raw.githubusercontent.com/datasciencelabs/2023/HEAD/docs/36-algorithms_files/figure-html/polls-2008-rf-fit-1.png
--------------------------------------------------------------------------------
/docs/36-algorithms_files/figure-html/qda-does-not-fit-1.png:
--------------------------------------------------------------------------------
https://raw.githubusercontent.com/datasciencelabs/2023/HEAD/docs/36-algorithms_files/figure-html/qda-does-not-fit-1.png
--------------------------------------------------------------------------------
/docs/10-distributions_files/figure-html/boxplot-exercise-1.png:
--------------------------------------------------------------------------------
https://raw.githubusercontent.com/datasciencelabs/2023/HEAD/docs/10-distributions_files/figure-html/boxplot-exercise-1.png
--------------------------------------------------------------------------------
/docs/10-distributions_files/figure-html/height-histogram-1.png:
--------------------------------------------------------------------------------
https://raw.githubusercontent.com/datasciencelabs/2023/HEAD/docs/10-distributions_files/figure-html/height-histogram-1.png
--------------------------------------------------------------------------------
/docs/12-dataviz-principles_files/figure-html/bland-altman-1.png:
--------------------------------------------------------------------------------
https://raw.githubusercontent.com/datasciencelabs/2023/HEAD/docs/12-dataviz-principles_files/figure-html/bland-altman-1.png
--------------------------------------------------------------------------------
/docs/12-dataviz-principles_files/figure-html/show-data-1-1.png:
--------------------------------------------------------------------------------
https://raw.githubusercontent.com/datasciencelabs/2023/HEAD/docs/12-dataviz-principles_files/figure-html/show-data-1-1.png
--------------------------------------------------------------------------------
/docs/12-dataviz-principles_files/figure-html/show-data-2-1.png:
--------------------------------------------------------------------------------
https://raw.githubusercontent.com/datasciencelabs/2023/HEAD/docs/12-dataviz-principles_files/figure-html/show-data-2-1.png
--------------------------------------------------------------------------------
/docs/12-dataviz-principles_files/figure-html/two-barplots-1.png:
--------------------------------------------------------------------------------
https://raw.githubusercontent.com/datasciencelabs/2023/HEAD/docs/12-dataviz-principles_files/figure-html/two-barplots-1.png
--------------------------------------------------------------------------------
/docs/18-inference_files/figure-html/first-simulated-poll-1.png:
--------------------------------------------------------------------------------
https://raw.githubusercontent.com/datasciencelabs/2023/HEAD/docs/18-inference_files/figure-html/first-simulated-poll-1.png
--------------------------------------------------------------------------------
/docs/19-models_files/figure-html/pollster-bias-histogram-1.png:
--------------------------------------------------------------------------------
https://raw.githubusercontent.com/datasciencelabs/2023/HEAD/docs/19-models_files/figure-html/pollster-bias-histogram-1.png
--------------------------------------------------------------------------------
/docs/19-models_files/figure-html/simulated-pollster-data-1.png:
--------------------------------------------------------------------------------
https://raw.githubusercontent.com/datasciencelabs/2023/HEAD/docs/19-models_files/figure-html/simulated-pollster-data-1.png
--------------------------------------------------------------------------------
/docs/19-models_files/figure-html/t-distribution-examples-1.png:
--------------------------------------------------------------------------------
https://raw.githubusercontent.com/datasciencelabs/2023/HEAD/docs/19-models_files/figure-html/t-distribution-examples-1.png
--------------------------------------------------------------------------------
/docs/20-regression_files/figure-html/rss-versus-estimate-1.png:
--------------------------------------------------------------------------------
https://raw.githubusercontent.com/datasciencelabs/2023/HEAD/docs/20-regression_files/figure-html/rss-versus-estimate-1.png
--------------------------------------------------------------------------------
/docs/20-regression_files/figure-html/two-regression-lines-1.png:
--------------------------------------------------------------------------------
https://raw.githubusercontent.com/datasciencelabs/2023/HEAD/docs/20-regression_files/figure-html/two-regression-lines-1.png
--------------------------------------------------------------------------------
/docs/22-linear-models_files/figure-html/unnamed-chunk-17-1.png:
--------------------------------------------------------------------------------
https://raw.githubusercontent.com/datasciencelabs/2023/HEAD/docs/22-linear-models_files/figure-html/unnamed-chunk-17-1.png
--------------------------------------------------------------------------------
/docs/22-linear-models_files/figure-html/unnamed-chunk-18-1.png:
--------------------------------------------------------------------------------
https://raw.githubusercontent.com/datasciencelabs/2023/HEAD/docs/22-linear-models_files/figure-html/unnamed-chunk-18-1.png
--------------------------------------------------------------------------------
/docs/25-matrices-in-R_files/figure-html/unnamed-chunk-20-1.png:
--------------------------------------------------------------------------------
https://raw.githubusercontent.com/datasciencelabs/2023/HEAD/docs/25-matrices-in-R_files/figure-html/unnamed-chunk-20-1.png
--------------------------------------------------------------------------------
/docs/25-matrices-in-R_files/figure-html/unnamed-chunk-21-1.png:
--------------------------------------------------------------------------------
https://raw.githubusercontent.com/datasciencelabs/2023/HEAD/docs/25-matrices-in-R_files/figure-html/unnamed-chunk-21-1.png
--------------------------------------------------------------------------------
/docs/25-matrices-in-R_files/figure-html/unnamed-chunk-28-1.png:
--------------------------------------------------------------------------------
https://raw.githubusercontent.com/datasciencelabs/2023/HEAD/docs/25-matrices-in-R_files/figure-html/unnamed-chunk-28-1.png
--------------------------------------------------------------------------------
/docs/25-matrices-in-R_files/figure-html/unnamed-chunk-33-1.png:
--------------------------------------------------------------------------------
https://raw.githubusercontent.com/datasciencelabs/2023/HEAD/docs/25-matrices-in-R_files/figure-html/unnamed-chunk-33-1.png
--------------------------------------------------------------------------------
/docs/25-matrices-in-R_files/figure-html/unnamed-chunk-33-2.png:
--------------------------------------------------------------------------------
https://raw.githubusercontent.com/datasciencelabs/2023/HEAD/docs/25-matrices-in-R_files/figure-html/unnamed-chunk-33-2.png
--------------------------------------------------------------------------------
/docs/25-matrices-in-R_files/figure-html/unnamed-chunk-45-1.png:
--------------------------------------------------------------------------------
https://raw.githubusercontent.com/datasciencelabs/2023/HEAD/docs/25-matrices-in-R_files/figure-html/unnamed-chunk-45-1.png
--------------------------------------------------------------------------------
/docs/26-linear-algebra_files/figure-html/unnamed-chunk-15-1.png:
--------------------------------------------------------------------------------
https://raw.githubusercontent.com/datasciencelabs/2023/HEAD/docs/26-linear-algebra_files/figure-html/unnamed-chunk-15-1.png
--------------------------------------------------------------------------------
/docs/26-linear-algebra_files/figure-html/unnamed-chunk-19-1.png:
--------------------------------------------------------------------------------
https://raw.githubusercontent.com/datasciencelabs/2023/HEAD/docs/26-linear-algebra_files/figure-html/unnamed-chunk-19-1.png
--------------------------------------------------------------------------------
/docs/26-linear-algebra_files/figure-html/unnamed-chunk-20-1.png:
--------------------------------------------------------------------------------
https://raw.githubusercontent.com/datasciencelabs/2023/HEAD/docs/26-linear-algebra_files/figure-html/unnamed-chunk-20-1.png
--------------------------------------------------------------------------------
/docs/26-linear-algebra_files/figure-html/unnamed-chunk-7-1.png:
--------------------------------------------------------------------------------
https://raw.githubusercontent.com/datasciencelabs/2023/HEAD/docs/26-linear-algebra_files/figure-html/unnamed-chunk-7-1.png
--------------------------------------------------------------------------------
/docs/26-linear-algebra_files/figure-html/unnamed-chunk-8-1.png:
--------------------------------------------------------------------------------
https://raw.githubusercontent.com/datasciencelabs/2023/HEAD/docs/26-linear-algebra_files/figure-html/unnamed-chunk-8-1.png
--------------------------------------------------------------------------------
/docs/29-regularization_files/figure-html/unnamed-chunk-31-1.png:
--------------------------------------------------------------------------------
https://raw.githubusercontent.com/datasciencelabs/2023/HEAD/docs/29-regularization_files/figure-html/unnamed-chunk-31-1.png
--------------------------------------------------------------------------------
/docs/29-regularization_files/figure-html/user-effect-hist-1.png:
--------------------------------------------------------------------------------
https://raw.githubusercontent.com/datasciencelabs/2023/HEAD/docs/29-regularization_files/figure-html/user-effect-hist-1.png
--------------------------------------------------------------------------------
/docs/30-matrix-factorization_files/figure-html/movie-cor-1.png:
--------------------------------------------------------------------------------
https://raw.githubusercontent.com/datasciencelabs/2023/HEAD/docs/30-matrix-factorization_files/figure-html/movie-cor-1.png
--------------------------------------------------------------------------------
/docs/33-smoothing_files/figure-html/binsmoother-expained-1.png:
--------------------------------------------------------------------------------
https://raw.githubusercontent.com/datasciencelabs/2023/HEAD/docs/33-smoothing_files/figure-html/binsmoother-expained-1.png
--------------------------------------------------------------------------------
/docs/33-smoothing_files/figure-html/ggplot-loess-default-1.png:
--------------------------------------------------------------------------------
https://raw.githubusercontent.com/datasciencelabs/2023/HEAD/docs/33-smoothing_files/figure-html/ggplot-loess-default-1.png
--------------------------------------------------------------------------------
/docs/33-smoothing_files/figure-html/ggplot-loess-degree-1-1.png:
--------------------------------------------------------------------------------
https://raw.githubusercontent.com/datasciencelabs/2023/HEAD/docs/33-smoothing_files/figure-html/ggplot-loess-degree-1-1.png
--------------------------------------------------------------------------------
/docs/33-smoothing_files/figure-html/true-p-better-colors-1.png:
--------------------------------------------------------------------------------
https://raw.githubusercontent.com/datasciencelabs/2023/HEAD/docs/33-smoothing_files/figure-html/true-p-better-colors-1.png
--------------------------------------------------------------------------------
/docs/33-smoothing_files/figure-html/two-or-seven-scatter-1.png:
--------------------------------------------------------------------------------
https://raw.githubusercontent.com/datasciencelabs/2023/HEAD/docs/33-smoothing_files/figure-html/two-or-seven-scatter-1.png
--------------------------------------------------------------------------------
/docs/34-cross-validation_files/figure-html/knn-1-overfit-1.png:
--------------------------------------------------------------------------------
https://raw.githubusercontent.com/datasciencelabs/2023/HEAD/docs/34-cross-validation_files/figure-html/knn-1-overfit-1.png
--------------------------------------------------------------------------------
/docs/36-algorithms_files/figure-html/olive-two-predictors-1.png:
--------------------------------------------------------------------------------
https://raw.githubusercontent.com/datasciencelabs/2023/HEAD/docs/36-algorithms_files/figure-html/olive-two-predictors-1.png
--------------------------------------------------------------------------------
/docs/36-algorithms_files/figure-html/polls-2008-final-fit-1.png:
--------------------------------------------------------------------------------
https://raw.githubusercontent.com/datasciencelabs/2023/HEAD/docs/36-algorithms_files/figure-html/polls-2008-final-fit-1.png
--------------------------------------------------------------------------------
/docs/36-algorithms_files/figure-html/polls-2008-tree-fit-1.png:
--------------------------------------------------------------------------------
https://raw.githubusercontent.com/datasciencelabs/2023/HEAD/docs/36-algorithms_files/figure-html/polls-2008-tree-fit-1.png
--------------------------------------------------------------------------------
/docs/07-dates-and-times_files/figure-html/unnamed-chunk-26-1.png:
--------------------------------------------------------------------------------
https://raw.githubusercontent.com/datasciencelabs/2023/HEAD/docs/07-dates-and-times_files/figure-html/unnamed-chunk-26-1.png
--------------------------------------------------------------------------------
/docs/07-dates-and-times_files/figure-html/unnamed-chunk-27-1.png:
--------------------------------------------------------------------------------
https://raw.githubusercontent.com/datasciencelabs/2023/HEAD/docs/07-dates-and-times_files/figure-html/unnamed-chunk-27-1.png
--------------------------------------------------------------------------------
/docs/07-dates-and-times_files/figure-html/unnamed-chunk-28-1.png:
--------------------------------------------------------------------------------
https://raw.githubusercontent.com/datasciencelabs/2023/HEAD/docs/07-dates-and-times_files/figure-html/unnamed-chunk-28-1.png
--------------------------------------------------------------------------------
/docs/07-dates-and-times_files/figure-html/unnamed-chunk-31-1.png:
--------------------------------------------------------------------------------
https://raw.githubusercontent.com/datasciencelabs/2023/HEAD/docs/07-dates-and-times_files/figure-html/unnamed-chunk-31-1.png
--------------------------------------------------------------------------------
/docs/10-distributions_files/figure-html/female-male-boxplots-1.png:
--------------------------------------------------------------------------------
https://raw.githubusercontent.com/datasciencelabs/2023/HEAD/docs/10-distributions_files/figure-html/female-male-boxplots-1.png
--------------------------------------------------------------------------------
/docs/10-distributions_files/figure-html/hist-non-normal-data-1.png:
--------------------------------------------------------------------------------
https://raw.githubusercontent.com/datasciencelabs/2023/HEAD/docs/10-distributions_files/figure-html/hist-non-normal-data-1.png
--------------------------------------------------------------------------------
/docs/11-ggplot2_files/figure-html/female-male-boxplots-geom-1.png:
--------------------------------------------------------------------------------
https://raw.githubusercontent.com/datasciencelabs/2023/HEAD/docs/11-ggplot2_files/figure-html/female-male-boxplots-geom-1.png
--------------------------------------------------------------------------------
/docs/11-ggplot2_files/figure-html/ggplot2-image-new-colors-1.png:
--------------------------------------------------------------------------------
https://raw.githubusercontent.com/datasciencelabs/2023/HEAD/docs/11-ggplot2_files/figure-html/ggplot2-image-new-colors-1.png
--------------------------------------------------------------------------------
/docs/12-dataviz-principles_files/figure-html/area-not-radius-1.png:
--------------------------------------------------------------------------------
https://raw.githubusercontent.com/datasciencelabs/2023/HEAD/docs/12-dataviz-principles_files/figure-html/area-not-radius-1.png
--------------------------------------------------------------------------------
/docs/12-dataviz-principles_files/figure-html/excel-barplot-1.png:
--------------------------------------------------------------------------------
https://raw.githubusercontent.com/datasciencelabs/2023/HEAD/docs/12-dataviz-principles_files/figure-html/excel-barplot-1.png
--------------------------------------------------------------------------------
/docs/13-wrangling_files/figure-html/caribbean-with-nicknames-1.png:
--------------------------------------------------------------------------------
https://raw.githubusercontent.com/datasciencelabs/2023/HEAD/docs/13-wrangling_files/figure-html/caribbean-with-nicknames-1.png
--------------------------------------------------------------------------------
/docs/16-text-mining_files/figure-html/percent-diff-by-word-1.png:
--------------------------------------------------------------------------------
https://raw.githubusercontent.com/datasciencelabs/2023/HEAD/docs/16-text-mining_files/figure-html/percent-diff-by-word-1.png
--------------------------------------------------------------------------------
/docs/19-models_files/figure-html/fivethirtyeight-densities-1.png:
--------------------------------------------------------------------------------
https://raw.githubusercontent.com/datasciencelabs/2023/HEAD/docs/19-models_files/figure-html/fivethirtyeight-densities-1.png
--------------------------------------------------------------------------------
/docs/19-models_files/figure-html/polls-2016-spread-histogram-1.png:
--------------------------------------------------------------------------------
https://raw.githubusercontent.com/datasciencelabs/2023/HEAD/docs/19-models_files/figure-html/polls-2016-spread-histogram-1.png
--------------------------------------------------------------------------------
/docs/19-models_files/figure-html/simulated-data-without-bias-1.png:
--------------------------------------------------------------------------------
https://raw.githubusercontent.com/datasciencelabs/2023/HEAD/docs/19-models_files/figure-html/simulated-data-without-bias-1.png
--------------------------------------------------------------------------------
/docs/20-regression_files/figure-html/father-son-regression-1.png:
--------------------------------------------------------------------------------
https://raw.githubusercontent.com/datasciencelabs/2023/HEAD/docs/20-regression_files/figure-html/father-son-regression-1.png
--------------------------------------------------------------------------------
/docs/21-multivariate-regression_files/figure-html/bb-vs-hrs-1.png:
--------------------------------------------------------------------------------
https://raw.githubusercontent.com/datasciencelabs/2023/HEAD/docs/21-multivariate-regression_files/figure-html/bb-vs-hrs-1.png
--------------------------------------------------------------------------------
/docs/21-multivariate-regression_files/figure-html/r-hat-hist-1.png:
--------------------------------------------------------------------------------
https://raw.githubusercontent.com/datasciencelabs/2023/HEAD/docs/21-multivariate-regression_files/figure-html/r-hat-hist-1.png
--------------------------------------------------------------------------------
/docs/21-multivariate-regression_files/figure-html/runs-vs-bb-1.png:
--------------------------------------------------------------------------------
https://raw.githubusercontent.com/datasciencelabs/2023/HEAD/docs/21-multivariate-regression_files/figure-html/runs-vs-bb-1.png
--------------------------------------------------------------------------------
/docs/21-multivariate-regression_files/figure-html/runs-vs-sb-1.png:
--------------------------------------------------------------------------------
https://raw.githubusercontent.com/datasciencelabs/2023/HEAD/docs/21-multivariate-regression_files/figure-html/runs-vs-sb-1.png
--------------------------------------------------------------------------------
/docs/22-linear-models_files/figure-html/falling-object-fit-1.png:
--------------------------------------------------------------------------------
https://raw.githubusercontent.com/datasciencelabs/2023/HEAD/docs/22-linear-models_files/figure-html/falling-object-fit-1.png
--------------------------------------------------------------------------------
/docs/22-linear-models_files/figure-html/lm-diagnostic-plot-1.png:
--------------------------------------------------------------------------------
https://raw.githubusercontent.com/datasciencelabs/2023/HEAD/docs/22-linear-models_files/figure-html/lm-diagnostic-plot-1.png
--------------------------------------------------------------------------------
/docs/22-linear-models_files/figure-html/lm-residual-boxplots-1.png:
--------------------------------------------------------------------------------
https://raw.githubusercontent.com/datasciencelabs/2023/HEAD/docs/22-linear-models_files/figure-html/lm-residual-boxplots-1.png
--------------------------------------------------------------------------------
/docs/24-corrleation-not-causation_files/figure-html/dredging-1.png:
--------------------------------------------------------------------------------
https://raw.githubusercontent.com/datasciencelabs/2023/HEAD/docs/24-corrleation-not-causation_files/figure-html/dredging-1.png
--------------------------------------------------------------------------------
/docs/24-corrleation-not-causation_files/figure-html/outlier-1.png:
--------------------------------------------------------------------------------
https://raw.githubusercontent.com/datasciencelabs/2023/HEAD/docs/24-corrleation-not-causation_files/figure-html/outlier-1.png
--------------------------------------------------------------------------------
/docs/25-matrices-in-R_files/figure-html/digit-images-example-1.png:
--------------------------------------------------------------------------------
https://raw.githubusercontent.com/datasciencelabs/2023/HEAD/docs/25-matrices-in-R_files/figure-html/digit-images-example-1.png
--------------------------------------------------------------------------------
/docs/27-dimension-reduction_files/figure-html/dist-approx-4-1.png:
--------------------------------------------------------------------------------
https://raw.githubusercontent.com/datasciencelabs/2023/HEAD/docs/27-dimension-reduction_files/figure-html/dist-approx-4-1.png
--------------------------------------------------------------------------------
/docs/27-dimension-reduction_files/figure-html/max-rotation-1.png:
--------------------------------------------------------------------------------
https://raw.githubusercontent.com/datasciencelabs/2023/HEAD/docs/27-dimension-reduction_files/figure-html/max-rotation-1.png
--------------------------------------------------------------------------------
/docs/27-dimension-reduction_files/figure-html/mnist-pca-1-4-1.png:
--------------------------------------------------------------------------------
https://raw.githubusercontent.com/datasciencelabs/2023/HEAD/docs/27-dimension-reduction_files/figure-html/mnist-pca-1-4-1.png
--------------------------------------------------------------------------------
/docs/34-cross-validation_files/figure-html/accuracy-vs-k-knn-1.png:
--------------------------------------------------------------------------------
https://raw.githubusercontent.com/datasciencelabs/2023/HEAD/docs/34-cross-validation_files/figure-html/accuracy-vs-k-knn-1.png
--------------------------------------------------------------------------------
/docs/34-cross-validation_files/figure-html/median-is-normal-1.png:
--------------------------------------------------------------------------------
https://raw.githubusercontent.com/datasciencelabs/2023/HEAD/docs/34-cross-validation_files/figure-html/median-is-normal-1.png
--------------------------------------------------------------------------------
/docs/34-cross-validation_files/figure-html/mnist-27-glm-est-1.png:
--------------------------------------------------------------------------------
https://raw.githubusercontent.com/datasciencelabs/2023/HEAD/docs/34-cross-validation_files/figure-html/mnist-27-glm-est-1.png
--------------------------------------------------------------------------------
/docs/35-caret_files/figure-html/cv-10-fold-accuracy-estimate-1.png:
--------------------------------------------------------------------------------
https://raw.githubusercontent.com/datasciencelabs/2023/HEAD/docs/35-caret_files/figure-html/cv-10-fold-accuracy-estimate-1.png
--------------------------------------------------------------------------------
/docs/36-algorithms_files/figure-html/more-trees-better-fit-1.png:
--------------------------------------------------------------------------------
https://raw.githubusercontent.com/datasciencelabs/2023/HEAD/docs/36-algorithms_files/figure-html/more-trees-better-fit-1.png
--------------------------------------------------------------------------------
/README.md:
--------------------------------------------------------------------------------
1 | # Welcome to BST 260: Introduction to Data Science
2 |
3 | * This repository provides the code for the [Fall 2023 course notes](https://datasciencelabs.github.io/2023/).
4 |
5 |
--------------------------------------------------------------------------------
/docs/10-distributions_files/figure-html/two-densities-one-plot-1.png:
--------------------------------------------------------------------------------
https://raw.githubusercontent.com/datasciencelabs/2023/HEAD/docs/10-distributions_files/figure-html/two-densities-one-plot-1.png
--------------------------------------------------------------------------------
/docs/12-dataviz-principles_files/figure-html/available-shapes-1.png:
--------------------------------------------------------------------------------
https://raw.githubusercontent.com/datasciencelabs/2023/HEAD/docs/12-dataviz-principles_files/figure-html/available-shapes-1.png
--------------------------------------------------------------------------------
/docs/12-dataviz-principles_files/figure-html/measels-exercise-1.png:
--------------------------------------------------------------------------------
https://raw.githubusercontent.com/datasciencelabs/2023/HEAD/docs/12-dataviz-principles_files/figure-html/measels-exercise-1.png
--------------------------------------------------------------------------------
/docs/12-dataviz-principles_files/figure-html/no-transformation-1.png:
--------------------------------------------------------------------------------
https://raw.githubusercontent.com/datasciencelabs/2023/HEAD/docs/12-dataviz-principles_files/figure-html/no-transformation-1.png
--------------------------------------------------------------------------------
/docs/16-text-mining_files/figure-html/tweets-by-time-by-device-1.png:
--------------------------------------------------------------------------------
https://raw.githubusercontent.com/datasciencelabs/2023/HEAD/docs/16-text-mining_files/figure-html/tweets-by-time-by-device-1.png
--------------------------------------------------------------------------------
/docs/21-multivariate-regression_files/figure-html/runs-vs-hrs-1.png:
--------------------------------------------------------------------------------
https://raw.githubusercontent.com/datasciencelabs/2023/HEAD/docs/21-multivariate-regression_files/figure-html/runs-vs-hrs-1.png
--------------------------------------------------------------------------------
/docs/27-dimension-reduction_files/figure-html/mnist-pca-last,-1.png:
--------------------------------------------------------------------------------
https://raw.githubusercontent.com/datasciencelabs/2023/HEAD/docs/27-dimension-reduction_files/figure-html/mnist-pca-last,-1.png
--------------------------------------------------------------------------------
/docs/27-dimension-reduction_files/figure-html/unnamed-chunk-16-1.png:
--------------------------------------------------------------------------------
https://raw.githubusercontent.com/datasciencelabs/2023/HEAD/docs/27-dimension-reduction_files/figure-html/unnamed-chunk-16-1.png
--------------------------------------------------------------------------------
/docs/27-dimension-reduction_files/figure-html/unnamed-chunk-21-1.png:
--------------------------------------------------------------------------------
https://raw.githubusercontent.com/datasciencelabs/2023/HEAD/docs/27-dimension-reduction_files/figure-html/unnamed-chunk-21-1.png
--------------------------------------------------------------------------------
/docs/27-dimension-reduction_files/figure-html/unnamed-chunk-28-1.png:
--------------------------------------------------------------------------------
https://raw.githubusercontent.com/datasciencelabs/2023/HEAD/docs/27-dimension-reduction_files/figure-html/unnamed-chunk-28-1.png
--------------------------------------------------------------------------------
/docs/27-dimension-reduction_files/figure-html/unnamed-chunk-6-1.png:
--------------------------------------------------------------------------------
https://raw.githubusercontent.com/datasciencelabs/2023/HEAD/docs/27-dimension-reduction_files/figure-html/unnamed-chunk-6-1.png
--------------------------------------------------------------------------------
/docs/27-dimension-reduction_files/figure-html/unnamed-chunk-7-1.png:
--------------------------------------------------------------------------------
https://raw.githubusercontent.com/datasciencelabs/2023/HEAD/docs/27-dimension-reduction_files/figure-html/unnamed-chunk-7-1.png
--------------------------------------------------------------------------------
/docs/27-dimension-reduction_files/figure-html/unnamed-chunk-8-1.png:
--------------------------------------------------------------------------------
https://raw.githubusercontent.com/datasciencelabs/2023/HEAD/docs/27-dimension-reduction_files/figure-html/unnamed-chunk-8-1.png
--------------------------------------------------------------------------------
/docs/33-smoothing_files/figure-html/signal-plus-noise-example-1.png:
--------------------------------------------------------------------------------
https://raw.githubusercontent.com/datasciencelabs/2023/HEAD/docs/33-smoothing_files/figure-html/signal-plus-noise-example-1.png
--------------------------------------------------------------------------------
/docs/34-cross-validation_files/figure-html/income-distribution-1.png:
--------------------------------------------------------------------------------
https://raw.githubusercontent.com/datasciencelabs/2023/HEAD/docs/34-cross-validation_files/figure-html/income-distribution-1.png
--------------------------------------------------------------------------------
/docs/36-algorithms_files/figure-html/polls-2008-tree-over-fit-1.png:
--------------------------------------------------------------------------------
https://raw.githubusercontent.com/datasciencelabs/2023/HEAD/docs/36-algorithms_files/figure-html/polls-2008-tree-over-fit-1.png
--------------------------------------------------------------------------------
/docs/10-distributions_files/figure-html/data-and-normal-densities-1.png:
--------------------------------------------------------------------------------
https://raw.githubusercontent.com/datasciencelabs/2023/HEAD/docs/10-distributions_files/figure-html/data-and-normal-densities-1.png
--------------------------------------------------------------------------------
/docs/10-distributions_files/figure-html/state-region-distribution-1.png:
--------------------------------------------------------------------------------
https://raw.githubusercontent.com/datasciencelabs/2023/HEAD/docs/10-distributions_files/figure-html/state-region-distribution-1.png
--------------------------------------------------------------------------------
/docs/12-dataviz-principles_files/figure-html/barplot-from-zero-1-1.png:
--------------------------------------------------------------------------------
https://raw.githubusercontent.com/datasciencelabs/2023/HEAD/docs/12-dataviz-principles_files/figure-html/barplot-from-zero-1-1.png
--------------------------------------------------------------------------------
/docs/12-dataviz-principles_files/figure-html/barplot-from-zero-2-1.png:
--------------------------------------------------------------------------------
https://raw.githubusercontent.com/datasciencelabs/2023/HEAD/docs/12-dataviz-principles_files/figure-html/barplot-from-zero-2-1.png
--------------------------------------------------------------------------------
/docs/12-dataviz-principles_files/figure-html/barplot-from-zero-3-1.png:
--------------------------------------------------------------------------------
https://raw.githubusercontent.com/datasciencelabs/2023/HEAD/docs/12-dataviz-principles_files/figure-html/barplot-from-zero-3-1.png
--------------------------------------------------------------------------------
/docs/12-dataviz-principles_files/figure-html/pseud-3d-exercise-2-1.png:
--------------------------------------------------------------------------------
https://raw.githubusercontent.com/datasciencelabs/2023/HEAD/docs/12-dataviz-principles_files/figure-html/pseud-3d-exercise-2-1.png
--------------------------------------------------------------------------------
/docs/12-dataviz-principles_files/figure-html/pseudo-3d-exercise-1.png:
--------------------------------------------------------------------------------
https://raw.githubusercontent.com/datasciencelabs/2023/HEAD/docs/12-dataviz-principles_files/figure-html/pseudo-3d-exercise-1.png
--------------------------------------------------------------------------------
/docs/12-dataviz-principles_files/figure-html/r-color-brewer-div-1.png:
--------------------------------------------------------------------------------
https://raw.githubusercontent.com/datasciencelabs/2023/HEAD/docs/12-dataviz-principles_files/figure-html/r-color-brewer-div-1.png
--------------------------------------------------------------------------------
/docs/12-dataviz-principles_files/figure-html/r-color-brewer-seq-1.png:
--------------------------------------------------------------------------------
https://raw.githubusercontent.com/datasciencelabs/2023/HEAD/docs/12-dataviz-principles_files/figure-html/r-color-brewer-seq-1.png
--------------------------------------------------------------------------------
/docs/12-dataviz-principles_files/figure-html/us-murders-barplot-1.png:
--------------------------------------------------------------------------------
https://raw.githubusercontent.com/datasciencelabs/2023/HEAD/docs/12-dataviz-principles_files/figure-html/us-murders-barplot-1.png
--------------------------------------------------------------------------------
/docs/18-inference_files/figure-html/confidence-interval-coverage-1.png:
--------------------------------------------------------------------------------
https://raw.githubusercontent.com/datasciencelabs/2023/HEAD/docs/18-inference_files/figure-html/confidence-interval-coverage-1.png
--------------------------------------------------------------------------------
/docs/19-models_files/figure-html/trend-estimate-for-all-pollsters-1.png:
--------------------------------------------------------------------------------
https://raw.githubusercontent.com/datasciencelabs/2023/HEAD/docs/19-models_files/figure-html/trend-estimate-for-all-pollsters-1.png
--------------------------------------------------------------------------------
/docs/20-regression_files/figure-html/what-correlation-looks-like-1.png:
--------------------------------------------------------------------------------
https://raw.githubusercontent.com/datasciencelabs/2023/HEAD/docs/20-regression_files/figure-html/what-correlation-looks-like-1.png
--------------------------------------------------------------------------------
/docs/21-multivariate-regression_files/figure-html/hr-by-runs-qq-1.png:
--------------------------------------------------------------------------------
https://raw.githubusercontent.com/datasciencelabs/2023/HEAD/docs/21-multivariate-regression_files/figure-html/hr-by-runs-qq-1.png
--------------------------------------------------------------------------------
/docs/22-linear-models_files/figure-html/weight-by-diet-boxplots-1.png:
--------------------------------------------------------------------------------
https://raw.githubusercontent.com/datasciencelabs/2023/HEAD/docs/22-linear-models_files/figure-html/weight-by-diet-boxplots-1.png
--------------------------------------------------------------------------------
/docs/24-corrleation-not-causation_files/figure-html/confounding-1.png:
--------------------------------------------------------------------------------
https://raw.githubusercontent.com/datasciencelabs/2023/HEAD/docs/24-corrleation-not-causation_files/figure-html/confounding-1.png
--------------------------------------------------------------------------------
/docs/25-matrices-in-R_files/figure-html/boxplot-of-digit-averages-1.png:
--------------------------------------------------------------------------------
https://raw.githubusercontent.com/datasciencelabs/2023/HEAD/docs/25-matrices-in-R_files/figure-html/boxplot-of-digit-averages-1.png
--------------------------------------------------------------------------------
/docs/27-dimension-reduction_files/figure-html/distance-approx-2-1.png:
--------------------------------------------------------------------------------
https://raw.githubusercontent.com/datasciencelabs/2023/HEAD/docs/27-dimension-reduction_files/figure-html/distance-approx-2-1.png
--------------------------------------------------------------------------------
/docs/29-regularization_files/figure-html/movie-id-and-user-hists-1.png:
--------------------------------------------------------------------------------
https://raw.githubusercontent.com/datasciencelabs/2023/HEAD/docs/29-regularization_files/figure-html/movie-id-and-user-hists-1.png
--------------------------------------------------------------------------------
/docs/29-regularization_files/figure-html/regularization-shrinkage-1.png:
--------------------------------------------------------------------------------
https://raw.githubusercontent.com/datasciencelabs/2023/HEAD/docs/29-regularization_files/figure-html/regularization-shrinkage-1.png
--------------------------------------------------------------------------------
/docs/29-regularization_files/figure-html/sparsity-of-movie-recs-1.png:
--------------------------------------------------------------------------------
https://raw.githubusercontent.com/datasciencelabs/2023/HEAD/docs/29-regularization_files/figure-html/sparsity-of-movie-recs-1.png
--------------------------------------------------------------------------------
/docs/33-smoothing_files/figure-html/final-ksmooth-normal-kernel-1.png:
--------------------------------------------------------------------------------
https://raw.githubusercontent.com/datasciencelabs/2023/HEAD/docs/33-smoothing_files/figure-html/final-ksmooth-normal-kernel-1.png
--------------------------------------------------------------------------------
/docs/33-smoothing_files/figure-html/two-or-seven-images-large-x1-1.png:
--------------------------------------------------------------------------------
https://raw.githubusercontent.com/datasciencelabs/2023/HEAD/docs/33-smoothing_files/figure-html/two-or-seven-images-large-x1-1.png
--------------------------------------------------------------------------------
/docs/36-algorithms_files/figure-html/conditional-prob-glm-fit-2-1.png:
--------------------------------------------------------------------------------
https://raw.githubusercontent.com/datasciencelabs/2023/HEAD/docs/36-algorithms_files/figure-html/conditional-prob-glm-fit-2-1.png
--------------------------------------------------------------------------------
/docs/36-algorithms_files/figure-html/naive-with-good-prevalence-1.png:
--------------------------------------------------------------------------------
https://raw.githubusercontent.com/datasciencelabs/2023/HEAD/docs/36-algorithms_files/figure-html/naive-with-good-prevalence-1.png
--------------------------------------------------------------------------------
/docs/10-distributions_files/figure-html/example-of-smoothed-density-1.png:
--------------------------------------------------------------------------------
https://raw.githubusercontent.com/datasciencelabs/2023/HEAD/docs/10-distributions_files/figure-html/example-of-smoothed-density-1.png
--------------------------------------------------------------------------------
/docs/10-distributions_files/figure-html/normal-distribution-density-1.png:
--------------------------------------------------------------------------------
https://raw.githubusercontent.com/datasciencelabs/2023/HEAD/docs/10-distributions_files/figure-html/normal-distribution-density-1.png
--------------------------------------------------------------------------------
/docs/12-dataviz-principles_files/figure-html/boxplot-adjacent-comps-1.png:
--------------------------------------------------------------------------------
https://raw.githubusercontent.com/datasciencelabs/2023/HEAD/docs/12-dataviz-principles_files/figure-html/boxplot-adjacent-comps-1.png
--------------------------------------------------------------------------------
/docs/12-dataviz-principles_files/figure-html/boxplots-not-adjacent-1.png:
--------------------------------------------------------------------------------
https://raw.githubusercontent.com/datasciencelabs/2023/HEAD/docs/12-dataviz-principles_files/figure-html/boxplots-not-adjacent-1.png
--------------------------------------------------------------------------------
/docs/12-dataviz-principles_files/figure-html/correct-transformation-1.png:
--------------------------------------------------------------------------------
https://raw.githubusercontent.com/datasciencelabs/2023/HEAD/docs/12-dataviz-principles_files/figure-html/correct-transformation-1.png
--------------------------------------------------------------------------------
/docs/18-inference_files/figure-html/normal-approximation-for-polls-1.png:
--------------------------------------------------------------------------------
https://raw.githubusercontent.com/datasciencelabs/2023/HEAD/docs/18-inference_files/figure-html/normal-approximation-for-polls-1.png
--------------------------------------------------------------------------------
/docs/19-models_files/figure-html/confidence-coverage-2008-election-1.png:
--------------------------------------------------------------------------------
https://raw.githubusercontent.com/datasciencelabs/2023/HEAD/docs/19-models_files/figure-html/confidence-coverage-2008-election-1.png
--------------------------------------------------------------------------------
/docs/20-regression_files/figure-html/regression-line-standard-units-1.png:
--------------------------------------------------------------------------------
https://raw.githubusercontent.com/datasciencelabs/2023/HEAD/docs/20-regression_files/figure-html/regression-line-standard-units-1.png
--------------------------------------------------------------------------------
/docs/21-multivariate-regression_files/figure-html/mlb-2002-payroll-1.png:
--------------------------------------------------------------------------------
https://raw.githubusercontent.com/datasciencelabs/2023/HEAD/docs/21-multivariate-regression_files/figure-html/mlb-2002-payroll-1.png
--------------------------------------------------------------------------------
/docs/22-linear-models_files/figure-html/weight-by-sex-diet-boxplots-1.png:
--------------------------------------------------------------------------------
https://raw.githubusercontent.com/datasciencelabs/2023/HEAD/docs/22-linear-models_files/figure-html/weight-by-sex-diet-boxplots-1.png
--------------------------------------------------------------------------------
/docs/24-corrleation-not-causation_files/figure-html/null-corr-hist-1.png:
--------------------------------------------------------------------------------
https://raw.githubusercontent.com/datasciencelabs/2023/HEAD/docs/24-corrleation-not-causation_files/figure-html/null-corr-hist-1.png
--------------------------------------------------------------------------------
/docs/27-dimension-reduction_files/figure-html/distance-illustration-1.png:
--------------------------------------------------------------------------------
https://raw.githubusercontent.com/datasciencelabs/2023/HEAD/docs/27-dimension-reduction_files/figure-html/distance-illustration-1.png
--------------------------------------------------------------------------------
/docs/27-dimension-reduction_files/figure-html/mnist-pca-1-2-scatter-1.png:
--------------------------------------------------------------------------------
https://raw.githubusercontent.com/datasciencelabs/2023/HEAD/docs/27-dimension-reduction_files/figure-html/mnist-pca-1-2-scatter-1.png
--------------------------------------------------------------------------------
/docs/33-smoothing_files/figure-html/linear-regression-not-flexible-1.png:
--------------------------------------------------------------------------------
https://raw.githubusercontent.com/datasciencelabs/2023/HEAD/docs/33-smoothing_files/figure-html/linear-regression-not-flexible-1.png
--------------------------------------------------------------------------------
/docs/33-smoothing_files/figure-html/polls-2008-parabola-line-loess-1.png:
--------------------------------------------------------------------------------
https://raw.githubusercontent.com/datasciencelabs/2023/HEAD/docs/33-smoothing_files/figure-html/polls-2008-parabola-line-loess-1.png
--------------------------------------------------------------------------------
/docs/12-dataviz-principles_files/figure-html/barplot-better-than-area-1.png:
--------------------------------------------------------------------------------
https://raw.githubusercontent.com/datasciencelabs/2023/HEAD/docs/12-dataviz-principles_files/figure-html/barplot-better-than-area-1.png
--------------------------------------------------------------------------------
/docs/12-dataviz-principles_files/figure-html/encoding-third-variable-1.png:
--------------------------------------------------------------------------------
https://raw.githubusercontent.com/datasciencelabs/2023/HEAD/docs/12-dataviz-principles_files/figure-html/encoding-third-variable-1.png
--------------------------------------------------------------------------------
/docs/12-dataviz-principles_files/figure-html/points-plot-not-from-zero-1.png:
--------------------------------------------------------------------------------
https://raw.githubusercontent.com/datasciencelabs/2023/HEAD/docs/12-dataviz-principles_files/figure-html/points-plot-not-from-zero-1.png
--------------------------------------------------------------------------------
/docs/12-dataviz-principles_files/figure-html/reorder-boxplot-example-1.png:
--------------------------------------------------------------------------------
https://raw.githubusercontent.com/datasciencelabs/2023/HEAD/docs/12-dataviz-principles_files/figure-html/reorder-boxplot-example-1.png
--------------------------------------------------------------------------------
/docs/12-dataviz-principles_files/figure-html/show-points-with-jitter-1.png:
--------------------------------------------------------------------------------
https://raw.githubusercontent.com/datasciencelabs/2023/HEAD/docs/12-dataviz-principles_files/figure-html/show-points-with-jitter-1.png
--------------------------------------------------------------------------------
/docs/12-dataviz-principles_files/figure-html/show-the-data-comparison-1.png:
--------------------------------------------------------------------------------
https://raw.githubusercontent.com/datasciencelabs/2023/HEAD/docs/12-dataviz-principles_files/figure-html/show-the-data-comparison-1.png
--------------------------------------------------------------------------------
/docs/18-inference_files/figure-html/standard-error-versus-sample-size-1.png:
--------------------------------------------------------------------------------
https://raw.githubusercontent.com/datasciencelabs/2023/HEAD/docs/18-inference_files/figure-html/standard-error-versus-sample-size-1.png
--------------------------------------------------------------------------------
/docs/19-models_files/figure-html/posterior-versus-original-estimates-1.png:
--------------------------------------------------------------------------------
https://raw.githubusercontent.com/datasciencelabs/2023/HEAD/docs/19-models_files/figure-html/posterior-versus-original-estimates-1.png
--------------------------------------------------------------------------------
/docs/19-models_files/figure-html/time-trend-estimate-several-pollsters-1.png:
--------------------------------------------------------------------------------
https://raw.githubusercontent.com/datasciencelabs/2023/HEAD/docs/19-models_files/figure-html/time-trend-estimate-several-pollsters-1.png
--------------------------------------------------------------------------------
/docs/20-regression_files/figure-html/conditional-averages-follow-line-1.png:
--------------------------------------------------------------------------------
https://raw.githubusercontent.com/datasciencelabs/2023/HEAD/docs/20-regression_files/figure-html/conditional-averages-follow-line-1.png
--------------------------------------------------------------------------------
/docs/20-regression_files/figure-html/sample-correlation-distribution-1.png:
--------------------------------------------------------------------------------
https://raw.githubusercontent.com/datasciencelabs/2023/HEAD/docs/20-regression_files/figure-html/sample-correlation-distribution-1.png
--------------------------------------------------------------------------------
/docs/20-regression_files/figure-html/sample-correlation-distribution-2-1.png:
--------------------------------------------------------------------------------
https://raw.githubusercontent.com/datasciencelabs/2023/HEAD/docs/20-regression_files/figure-html/sample-correlation-distribution-2-1.png
--------------------------------------------------------------------------------
/docs/21-multivariate-regression_files/figure-html/model-predicts-runs-1.png:
--------------------------------------------------------------------------------
https://raw.githubusercontent.com/datasciencelabs/2023/HEAD/docs/21-multivariate-regression_files/figure-html/model-predicts-runs-1.png
--------------------------------------------------------------------------------
/docs/24-corrleation-not-causation_files/figure-html/admission-by-major-1.png:
--------------------------------------------------------------------------------
https://raw.githubusercontent.com/datasciencelabs/2023/HEAD/docs/24-corrleation-not-causation_files/figure-html/admission-by-major-1.png
--------------------------------------------------------------------------------
/docs/24-corrleation-not-causation_files/figure-html/simpsons-paradox-1.png:
--------------------------------------------------------------------------------
https://raw.githubusercontent.com/datasciencelabs/2023/HEAD/docs/24-corrleation-not-causation_files/figure-html/simpsons-paradox-1.png
--------------------------------------------------------------------------------
/docs/24-corrleation-not-causation_files/figure-html/uc-berkeley-majors-1.png:
--------------------------------------------------------------------------------
https://raw.githubusercontent.com/datasciencelabs/2023/HEAD/docs/24-corrleation-not-causation_files/figure-html/uc-berkeley-majors-1.png
--------------------------------------------------------------------------------
/docs/28-gene-expression-case-study_files/figure-html/unnamed-chunk-10-1.png:
--------------------------------------------------------------------------------
https://raw.githubusercontent.com/datasciencelabs/2023/HEAD/docs/28-gene-expression-case-study_files/figure-html/unnamed-chunk-10-1.png
--------------------------------------------------------------------------------
/docs/28-gene-expression-case-study_files/figure-html/unnamed-chunk-11-1.png:
--------------------------------------------------------------------------------
https://raw.githubusercontent.com/datasciencelabs/2023/HEAD/docs/28-gene-expression-case-study_files/figure-html/unnamed-chunk-11-1.png
--------------------------------------------------------------------------------
/docs/28-gene-expression-case-study_files/figure-html/unnamed-chunk-11-2.png:
--------------------------------------------------------------------------------
https://raw.githubusercontent.com/datasciencelabs/2023/HEAD/docs/28-gene-expression-case-study_files/figure-html/unnamed-chunk-11-2.png
--------------------------------------------------------------------------------
/docs/28-gene-expression-case-study_files/figure-html/unnamed-chunk-11-3.png:
--------------------------------------------------------------------------------
https://raw.githubusercontent.com/datasciencelabs/2023/HEAD/docs/28-gene-expression-case-study_files/figure-html/unnamed-chunk-11-3.png
--------------------------------------------------------------------------------
/docs/28-gene-expression-case-study_files/figure-html/unnamed-chunk-11-4.png:
--------------------------------------------------------------------------------
https://raw.githubusercontent.com/datasciencelabs/2023/HEAD/docs/28-gene-expression-case-study_files/figure-html/unnamed-chunk-11-4.png
--------------------------------------------------------------------------------
/docs/28-gene-expression-case-study_files/figure-html/unnamed-chunk-11-5.png:
--------------------------------------------------------------------------------
https://raw.githubusercontent.com/datasciencelabs/2023/HEAD/docs/28-gene-expression-case-study_files/figure-html/unnamed-chunk-11-5.png
--------------------------------------------------------------------------------
/docs/28-gene-expression-case-study_files/figure-html/unnamed-chunk-12-1.png:
--------------------------------------------------------------------------------
https://raw.githubusercontent.com/datasciencelabs/2023/HEAD/docs/28-gene-expression-case-study_files/figure-html/unnamed-chunk-12-1.png
--------------------------------------------------------------------------------
/docs/28-gene-expression-case-study_files/figure-html/unnamed-chunk-8-1.png:
--------------------------------------------------------------------------------
https://raw.githubusercontent.com/datasciencelabs/2023/HEAD/docs/28-gene-expression-case-study_files/figure-html/unnamed-chunk-8-1.png
--------------------------------------------------------------------------------
/docs/10-distributions_files/figure-html/histogram-qqplot-female-heights-1.png:
--------------------------------------------------------------------------------
https://raw.githubusercontent.com/datasciencelabs/2023/HEAD/docs/10-distributions_files/figure-html/histogram-qqplot-female-heights-1.png
--------------------------------------------------------------------------------
/docs/12-dataviz-principles_files/figure-html/color-blind-friendly-colors-1.png:
--------------------------------------------------------------------------------
https://raw.githubusercontent.com/datasciencelabs/2023/HEAD/docs/12-dataviz-principles_files/figure-html/color-blind-friendly-colors-1.png
--------------------------------------------------------------------------------
/docs/12-dataviz-principles_files/figure-html/colors-for-different-lines-1.png:
--------------------------------------------------------------------------------
https://raw.githubusercontent.com/datasciencelabs/2023/HEAD/docs/12-dataviz-principles_files/figure-html/colors-for-different-lines-1.png
--------------------------------------------------------------------------------
/docs/12-dataviz-principles_files/figure-html/do-not-order-alphabetically-1.png:
--------------------------------------------------------------------------------
https://raw.githubusercontent.com/datasciencelabs/2023/HEAD/docs/12-dataviz-principles_files/figure-html/do-not-order-alphabetically-1.png
--------------------------------------------------------------------------------
/docs/20-regression_files/figure-html/small-sample-correlation-not-normal-1.png:
--------------------------------------------------------------------------------
https://raw.githubusercontent.com/datasciencelabs/2023/HEAD/docs/20-regression_files/figure-html/small-sample-correlation-not-normal-1.png
--------------------------------------------------------------------------------
/docs/12-dataviz-principles_files/figure-html/baplot-not-from-zero-exercises-1.png:
--------------------------------------------------------------------------------
https://raw.githubusercontent.com/datasciencelabs/2023/HEAD/docs/12-dataviz-principles_files/figure-html/baplot-not-from-zero-exercises-1.png
--------------------------------------------------------------------------------
/docs/12-dataviz-principles_files/figure-html/barplot-plot-exercise-example-1.png:
--------------------------------------------------------------------------------
https://raw.githubusercontent.com/datasciencelabs/2023/HEAD/docs/12-dataviz-principles_files/figure-html/barplot-plot-exercise-example-1.png
--------------------------------------------------------------------------------
/docs/12-dataviz-principles_files/figure-html/common-axes-histograms-right-1.png:
--------------------------------------------------------------------------------
https://raw.githubusercontent.com/datasciencelabs/2023/HEAD/docs/12-dataviz-principles_files/figure-html/common-axes-histograms-right-1.png
--------------------------------------------------------------------------------
/docs/12-dataviz-principles_files/figure-html/common-axes-histograms-right-2-1.png:
--------------------------------------------------------------------------------
https://raw.githubusercontent.com/datasciencelabs/2023/HEAD/docs/12-dataviz-principles_files/figure-html/common-axes-histograms-right-2-1.png
--------------------------------------------------------------------------------
/docs/12-dataviz-principles_files/figure-html/common-axes-histograms-wrong-1.png:
--------------------------------------------------------------------------------
https://raw.githubusercontent.com/datasciencelabs/2023/HEAD/docs/12-dataviz-principles_files/figure-html/common-axes-histograms-wrong-1.png
--------------------------------------------------------------------------------
/docs/12-dataviz-principles_files/figure-html/scatter-plot-instead-of-slope-1.png:
--------------------------------------------------------------------------------
https://raw.githubusercontent.com/datasciencelabs/2023/HEAD/docs/12-dataviz-principles_files/figure-html/scatter-plot-instead-of-slope-1.png
--------------------------------------------------------------------------------
/docs/19-models_files/figure-html/comparison-forecast-with-and-without-bias-1.png:
--------------------------------------------------------------------------------
https://raw.githubusercontent.com/datasciencelabs/2023/HEAD/docs/19-models_files/figure-html/comparison-forecast-with-and-without-bias-1.png
--------------------------------------------------------------------------------
/docs/21-multivariate-regression_files/figure-html/hr-versus-runs-regression-1.png:
--------------------------------------------------------------------------------
https://raw.githubusercontent.com/datasciencelabs/2023/HEAD/docs/21-multivariate-regression_files/figure-html/hr-versus-runs-regression-1.png
--------------------------------------------------------------------------------
/docs/21-multivariate-regression_files/figure-html/predicted-runs-vs-salary-1.png:
--------------------------------------------------------------------------------
https://raw.githubusercontent.com/datasciencelabs/2023/HEAD/docs/21-multivariate-regression_files/figure-html/predicted-runs-vs-salary-1.png
--------------------------------------------------------------------------------
/docs/21-multivariate-regression_files/figure-html/runs-vs-bb-by-hr-strata-1.png:
--------------------------------------------------------------------------------
https://raw.githubusercontent.com/datasciencelabs/2023/HEAD/docs/21-multivariate-regression_files/figure-html/runs-vs-bb-by-hr-strata-1.png
--------------------------------------------------------------------------------
/docs/24-corrleation-not-causation_files/figure-html/scatter-plot-of-ranks-1.png:
--------------------------------------------------------------------------------
https://raw.githubusercontent.com/datasciencelabs/2023/HEAD/docs/24-corrleation-not-causation_files/figure-html/scatter-plot-of-ranks-1.png
--------------------------------------------------------------------------------
/docs/27-dimension-reduction_files/figure-html/illustrate-pca-twin-heights-1.png:
--------------------------------------------------------------------------------
https://raw.githubusercontent.com/datasciencelabs/2023/HEAD/docs/27-dimension-reduction_files/figure-html/illustrate-pca-twin-heights-1.png
--------------------------------------------------------------------------------
/docs/27-dimension-reduction_files/figure-html/mnist-pca-variance-explained-1.png:
--------------------------------------------------------------------------------
https://raw.githubusercontent.com/datasciencelabs/2023/HEAD/docs/27-dimension-reduction_files/figure-html/mnist-pca-variance-explained-1.png
--------------------------------------------------------------------------------
/docs/12-dataviz-principles_files/figure-html/boxplot-with-points-with-jitter-1.png:
--------------------------------------------------------------------------------
https://raw.githubusercontent.com/datasciencelabs/2023/HEAD/docs/12-dataviz-principles_files/figure-html/boxplot-with-points-with-jitter-1.png
--------------------------------------------------------------------------------
/docs/24-corrleation-not-causation_files/figure-html/divorce-versus-margarine-1.png:
--------------------------------------------------------------------------------
https://raw.githubusercontent.com/datasciencelabs/2023/HEAD/docs/24-corrleation-not-causation_files/figure-html/divorce-versus-margarine-1.png
--------------------------------------------------------------------------------
/docs/12-dataviz-principles_files/figure-html/boxplot-adjacent-comps-with-color-1.png:
--------------------------------------------------------------------------------
https://raw.githubusercontent.com/datasciencelabs/2023/HEAD/docs/12-dataviz-principles_files/figure-html/boxplot-adjacent-comps-with-color-1.png
--------------------------------------------------------------------------------
/docs/21-multivariate-regression_files/figure-html/hr-versus-runs-regression-easy-1.png:
--------------------------------------------------------------------------------
https://raw.githubusercontent.com/datasciencelabs/2023/HEAD/docs/21-multivariate-regression_files/figure-html/hr-versus-runs-regression-easy-1.png
--------------------------------------------------------------------------------
/docs/24-corrleation-not-causation_files/figure-html/simpsons-paradox-explained-1.png:
--------------------------------------------------------------------------------
https://raw.githubusercontent.com/datasciencelabs/2023/HEAD/docs/24-corrleation-not-causation_files/figure-html/simpsons-paradox-explained-1.png
--------------------------------------------------------------------------------
/docs/27-dimension-reduction_files/figure-html/illustrate-pca-twin-heights-iris-1.png:
--------------------------------------------------------------------------------
https://raw.githubusercontent.com/datasciencelabs/2023/HEAD/docs/27-dimension-reduction_files/figure-html/illustrate-pca-twin-heights-iris-1.png
--------------------------------------------------------------------------------
/docs/12-dataviz-principles_files/figure-html/no-transformations-wrong-use-of-barplot-1.png:
--------------------------------------------------------------------------------
https://raw.githubusercontent.com/datasciencelabs/2023/HEAD/docs/12-dataviz-principles_files/figure-html/no-transformations-wrong-use-of-barplot-1.png
--------------------------------------------------------------------------------
/test.md:
--------------------------------------------------------------------------------
1 | # test
2 |
3 | ## Intro
4 |
5 | This is my project
6 |
7 | ## EDA
8 |
9 | Here is the distribution of my data
10 |
11 | ``` r
12 | x <- rnorm(100)
13 | hist(x)
14 | ```
15 |
16 | 
17 |
--------------------------------------------------------------------------------
/2023.Rproj:
--------------------------------------------------------------------------------
1 | Version: 1.0
2 |
3 | RestoreWorkspace: Default
4 | SaveWorkspace: Default
5 | AlwaysSaveHistory: Default
6 |
7 | EnableCodeIndexing: Yes
8 | UseSpacesForTab: Yes
9 | NumSpacesForTab: 2
10 | Encoding: UTF-8
11 |
12 | RnwWeave: Sweave
13 | LaTeX: pdfLaTeX
14 |
--------------------------------------------------------------------------------
/docs/site_libs/kePrint-0.0.1/kePrint.js:
--------------------------------------------------------------------------------
1 | $(document).ready(function(){
2 | if (typeof $('[data-toggle="tooltip"]').tooltip === 'function') {
3 | $('[data-toggle="tooltip"]').tooltip();
4 | }
5 | if ($('[data-toggle="popover"]').popover === 'function') {
6 | $('[data-toggle="popover"]').popover();
7 | }
8 | });
9 |
--------------------------------------------------------------------------------
/midterm-analysis.R:
--------------------------------------------------------------------------------
1 |
2 | x <- read.csv("~/Downloads/2023-10-16T1140_Grades-BST_260.csv") |> janitor::clean_names() |> dplyr::slice(-1)
3 |
4 |
5 | y <- readr::parse_number(x$midterm_1_2023_757880)
6 | x <- readr::parse_number(x$diagnostic_assessment_726041)
7 | x[x==0] <- NA
8 |
9 | library(ggplot2)
10 | library(dplyr)
11 |
12 | data.frame(x=as.character(x), y=y) |>
13 | filter(x!=15 | is.na(x)) |>
14 | mutate(x = ifelse(x<18, "<18", x)) |>
15 | mutate(y=y/16*100, x = ifelse(is.na(x), "NA", x)) |>
16 | group_by(x) |>
17 | summarize(avg = mean(y, na.rm=TRUE), min = min(y, na.rm = TRUE), n = n()) |>
18 | filter(!is.na(avg)) |>
19 | mutate(x = factor(x, levels = c("NA", "20", "19", "18", "<18")), avg = round(avg), min = round(min)) |>
20 | arrange(x) |>
21 | setNames(c("Diagnostic", "Midterm 1 avg", "Minimum", "N"))
22 |
--------------------------------------------------------------------------------
/intro.qmd:
--------------------------------------------------------------------------------
1 | # Course description {.unnumbered}
2 |
3 | This course introduces UNIX/Linux shell, version control with git and GitHub, R programming, data wrangling with dplyr and data.table, data visualization with ggplot2 and shiny, and reproducible document preparation with RStudio, knitr and markdown. We briefly introduce Monte Carlo simulations, statistical modeling, high-dimensional data techniques, and machine learning and how these are applied to real data. Throughout the course, we use motivating case studies and data analysis problem sets based on challenges similar to those you encounter in scientific research.
4 |
5 | Lectures will be mostly live coding. We will go over exercises and challenges together but will pause 1-4 times per lectures so students can complete exercises on their own. The midterm questions will be selected from the exercises presented in class. Some time will be dedicated to answering problem set questions. Lectures will not be recorded.
6 |
7 | Students are required to have a GitHub account and create a repository for the course.
8 |
9 | Problem sets are mostly composed of open ended questions. Submission should be in the form of a scientific report. Problem set submission need to be completely reproducible. Specifically, students are expected to upload a Quarto document to their GitHub class repository that graders can compile into a readable report.
10 |
11 |
--------------------------------------------------------------------------------
/docs/site_libs/quarto-html/tippy.css:
--------------------------------------------------------------------------------
1 | .tippy-box[data-animation=fade][data-state=hidden]{opacity:0}[data-tippy-root]{max-width:calc(100vw - 10px)}.tippy-box{position:relative;background-color:#333;color:#fff;border-radius:4px;font-size:14px;line-height:1.4;white-space:normal;outline:0;transition-property:transform,visibility,opacity}.tippy-box[data-placement^=top]>.tippy-arrow{bottom:0}.tippy-box[data-placement^=top]>.tippy-arrow:before{bottom:-7px;left:0;border-width:8px 8px 0;border-top-color:initial;transform-origin:center top}.tippy-box[data-placement^=bottom]>.tippy-arrow{top:0}.tippy-box[data-placement^=bottom]>.tippy-arrow:before{top:-7px;left:0;border-width:0 8px 8px;border-bottom-color:initial;transform-origin:center bottom}.tippy-box[data-placement^=left]>.tippy-arrow{right:0}.tippy-box[data-placement^=left]>.tippy-arrow:before{border-width:8px 0 8px 8px;border-left-color:initial;right:-7px;transform-origin:center left}.tippy-box[data-placement^=right]>.tippy-arrow{left:0}.tippy-box[data-placement^=right]>.tippy-arrow:before{left:-7px;border-width:8px 8px 8px 0;border-right-color:initial;transform-origin:center right}.tippy-box[data-inertia][data-state=visible]{transition-timing-function:cubic-bezier(.54,1.5,.38,1.11)}.tippy-arrow{width:16px;height:16px;color:#333}.tippy-arrow:before{content:"";position:absolute;border-color:transparent;border-style:solid}.tippy-content{position:relative;padding:5px 9px;z-index:1}
--------------------------------------------------------------------------------
/r4ds.scss:
--------------------------------------------------------------------------------
1 | /*-- scss:defaults --*/
2 |
3 | $primary: #637238 !default;
4 |
5 | /*-- scss:rules --*/
6 |
7 | .sidebar-title {
8 | color: #637238;
9 | }
10 |
11 | div.sidebar-item-container .active {
12 | font-weight: bold;
13 | }
14 |
15 | .sidebar nav[role=doc-toc] ul>li>a.active, .sidebar nav[role=doc-toc] ul>li>ul>li>a.active{
16 | font-weight: bold;
17 | }
18 |
19 | img.quarto-cover-image {
20 | box-shadow: 0 .5rem 1rem rgba(0,0,0,.15);
21 | }
22 |
23 | /* Headings ------------------------------------------------------ */
24 |
25 | h2 {
26 | margin-top: 2rem;
27 | margin-bottom: 1rem;
28 | font-size: 1.5rem;
29 | }
30 | h3 { margin-top: 1.5em; font-size: 1.2rem; }
31 | h4 { margin-top: 1.5em; font-size: 1.1rem; }
32 | h5 { margin-top: 1.5em; font-size: 1rem; }
33 |
34 | h1, h2, h3, h4, h5 {
35 | line-height: 1.3;
36 | }
37 |
38 | .quarto-section-identifier {
39 | color: #6C6C6C;
40 | font-weight: normal;
41 | }
42 |
43 | /* Code ------------------------------------------------ */
44 |
45 | code {
46 | color: #373a3c;
47 | }
48 |
49 | code a:any-link {
50 | text-decoration: underline;
51 | text-decoration-color: #ccc;
52 | }
53 |
54 | pre {
55 | background-image: linear-gradient(160deg,#f8f8f8 0,#f1f1f1 100%);
56 | }
57 |
58 | /* Printing ------------------------------------------------ */
59 |
60 | @media print {
61 | :root {
62 | font-size: 11pt;
63 | }
64 | #quarto-sidebar, #TOC, .nav-page {
65 | display: none;
66 | }
67 | .page-columns .content {
68 | grid-column-start: page-start;
69 | }
70 | .fixed-top {
71 | position: relative;
72 | }
73 | .panel-caption, .figure-caption, figcaption {
74 | color: #666;
75 | }
76 | }
77 |
--------------------------------------------------------------------------------
/_quarto.yml:
--------------------------------------------------------------------------------
1 | project:
2 | type: book
3 | output-dir: docs
4 |
5 | execute:
6 | cache: true
7 |
8 | book:
9 | title: "BST 260 Introduction to Data Science"
10 | subtitle: "2023 Notes"
11 | author: "Rafael Irizarry"
12 | date: "8/19/2023"
13 | chapters:
14 | - index.qmd
15 | - intro.qmd
16 | - schedule.qmd
17 | - 01-quarto.qmd
18 | - 02-unix.qmd
19 | - 03-git.qmd
20 | - 04-r-basics.qmd
21 | - 05-vectorization.qmd
22 | - 06-tidyverse.qmd
23 | - 07-dates-and-times.qmd
24 | - 08-importing-data.qmd
25 | - 09-data-table.qmd
26 | - pset1.qmd
27 | - 10-distributions.qmd
28 | - 11-ggplot2.qmd
29 | - 12-dataviz-principles.qmd
30 | - 13-wrangling.qmd
31 | - 14-web-scraping.qmd
32 | - 15-locales.qmd
33 | - 16-text-mining.qmd
34 | - 17-probability.qmd
35 | - 18-inference.qmd
36 | - 19-models.qmd
37 | - pset2.qmd
38 | - 20-regression.qmd
39 | - 21-multivariate-regression.qmd
40 | - 22-linear-models.qmd
41 | - 23-association-tests.qmd
42 | - 24-corrleation-not-causation.qmd
43 | - 25-matrices-in-R.qmd
44 | - 26-linear-algebra.qmd
45 | - 27-dimension-reduction.qmd
46 | - 28-gene-expression-case-study.qmd
47 | - 29-regularization.qmd
48 | - 30-matrix-factorization.qmd
49 | - 31-ml-intro.qmd
50 | - 32-conditional-expectations.qmd
51 | - 33-smoothing.qmd
52 | - 34-cross-validation.qmd
53 | - 35-caret.qmd
54 | - 36-algorithms.qmd
55 | reader-mode: true
56 | site-url: http://datasciencelabs.github.io/2023
57 | repo-url: https://github.com/datasciencelabs/2023
58 | repo-branch: main
59 | repo-actions: [source, issue]
60 | sidebar:
61 | collapse-level: 1
62 |
63 | format:
64 | html:
65 | theme:
66 | - cosmo
67 | - r4ds.scss
68 |
69 | editor: source
70 |
71 |
--------------------------------------------------------------------------------
/15-locales.qmd:
--------------------------------------------------------------------------------
1 | # Locales
2 |
3 | Notice the character on this file.
4 |
5 | ```{r}
6 | fn <- file.path(system.file("extdata", package = "dslabs"), "calificaciones.csv")
7 | readLines(fn)
8 | ```
9 |
10 | The unrecognizable characters actually lead to `read.csv` failing:
11 |
12 | ```{r}
13 | try({x <- read.csv(fn)})
14 | ```
15 |
16 | This is because it is not UTF encoding, which is the default:
17 |
18 | ```{r}
19 | Sys.getlocale()
20 | ```
21 |
22 | The `locale` is a group of information about your system. This includes the encoding, the language, and the time zone. This can affect how data is read into R. A mismatch of encodings creates weird problems often without warning or error.
23 |
24 | You can use the `stri_enc_detect` function in the **stringi** package to predict the encoding of a character:
25 |
26 | ```{r}
27 | library(stringi)
28 | x <- readLines(fn, n = 1)
29 | stri_enc_detect(x)
30 | ```
31 |
32 | We can also use this **readr** function to detect encoding of files:
33 |
34 | ```{r}
35 | library(readr)
36 | guess_encoding(fn)
37 | ```
38 |
39 | The `read_csv` permits us to define elements of the encoding through the `locale` argument. It switches the local only temporarily, while running the parser _read_csv_. The locale for R remains the same after calling this.
40 |
41 | ```{r}
42 | x <- read_csv(fn, locale = locale(encoding = "ISO-8859-1"))
43 | x
44 | ```
45 |
46 | Now notice the last column. Compare it to what we saw with `readLines`. They were numbers that used the European decimal point. This confuses `read_csv`. We can also change the encoding so the Europearn decimals are used.
47 |
48 | ```{r}
49 | x <- read_csv(fn, locale = locale(encoding = "ISO-8859-1", decimal_mark = ","))
50 | x
51 | ```
52 |
53 | Now let's try to change the dates to date format:
54 |
55 | ```{r}
56 | library(lubridate)
57 | dmy(x$f.n.)
58 | ```
59 |
60 | Nothing gets correctly converted. This is because the dates are in Spanish. You can change the locale to use Spanish as the language:
61 | ```{r}
62 | parse_date(x$f.n., format = "%d de %B de %Y", locale = locale(date_names = "es"))
63 | ```
64 |
65 | Finally notice that two students turned in the homework past the deadline of September 21
66 |
67 | ```{r}
68 | x$estampa >= make_date(2023, 9, 22)
69 | ```
70 |
71 | However, with times we have to be particularly careful as some functions default to UTC.
72 |
73 | ```{r}
74 | tz(x$estampa)
75 | ```
76 |
77 | But these times are in the default GMT. If we change to out timezone:
78 |
79 | ```{r}
80 | with_tz(x$estampa, tz = Sys.timezone()) >= make_date(2023, 9, 22)
81 | ```
82 |
83 | we see everybody turned it in on time.
84 |
--------------------------------------------------------------------------------
/38-making-webpage.qmd:
--------------------------------------------------------------------------------
1 | # Making a web page
2 |
3 |
4 | ## HTML
5 |
6 | It's worth learning HTML and CSS
7 |
8 | Here a very basic HTML page:
9 |
10 | ```
11 |
12 |
13 |
14 | Basic HTML Page
15 |
16 |
17 | Hello BST 260!
18 | This is a very basic HTML page.
19 |
20 |
21 | ```
22 |
23 | On most web servers, the URL will default to the file `index.html`
24 |
25 | CSS is used to change the style, whle keeping the HTML the same:
26 |
27 | ```
28 |
29 |
30 |
31 | Basic HTML Page with CSS
32 |
50 |
51 |
52 | Hello BST 260!
53 | This is a very basic HTML page with some CSS styling.
54 |
55 |
56 | ```
57 |
58 |
59 | Usually, we keep the CSS in a separate file, as they can be quite long. You can Typically we call the file `sytle.css`.
60 |
61 | ```
62 | body {
63 | font-family: Arial, sans-serif;
64 | background-color: #f0f0f0;
65 | margin: 0;
66 | padding: 0;
67 | }
68 |
69 | h1 {
70 | color: navy;
71 | text-align: center;
72 | }
73 |
74 | p {
75 | color: #333333;
76 | margin-left: 20px;
77 | }
78 | ```
79 |
80 | Then we add a line to the html file to make let the browser know to use the style:
81 |
82 | ```
83 |
84 |
85 |
86 | Basic HTML Page with External CSS
87 | Hello Hello BST 260!!
91 | This is a very basic HTML page with external CSS styling.
92 |
93 |
94 | ```
95 |
96 | There are many css file you can borrow to make the page follow different styles.
97 |
98 | ## Markdown
99 |
100 | * To avoid learning HTML syntax you can instead use markdown to create pages.
101 |
102 | * Markdown is what Quarto is based on. If you remove the runable code from quarto it becomes a markdown document.
103 |
104 | * GitHub uses markdown for the README files shown in repositores.
105 |
106 | - Example:
107 | - Code:
108 |
109 | * GitHub converts it to HTML for you so it looks _pretty_.
110 |
111 | ## Making a GitHub ready markdown in Quarto
112 |
113 | If you use the header
114 |
115 | ```
116 | ---
117 | format: gfm
118 | ---
119 | ```
120 | ## GitHub Welcome page
121 |
122 | You can easily have a nice introductory page like this one:
123 |
124 | https://github.com/rafalab
125 |
126 | * Go to your GitHub account.
127 |
128 | * Create a repo with the same name as your username. For example, I created a repo called `rafalab`
129 |
130 | * Add a README.md file like this:
131 |
132 | ```
133 | ### Hi there 👋
134 |
135 | - I am NAME. I am a student at HSPH.
136 | - I am studying Biostatistics.
137 | - I keep examples of my work in this GitHub repo
138 | - Follow me @handle
139 | ```
140 |
141 | ## GitHub pages
142 |
143 | You can use GitHub pages to create a webpage using only markdown.
144 |
145 | You can create a homw page with URL `http://username.github.io/`
146 |
147 | But also webpages for projects with URLs `http://username.github.io/project-name`
148 |
149 |
150 | Try it out:
151 |
152 |
153 |
154 |
155 | ## Bookdown
156 |
157 | The R package bookdown makes it very easy to create books with quarto. We can easily share these on GitHub.
158 |
159 | ## Blogdown
160 |
161 | Similarly, the bloogdown pacakge lets you write a blog with quarto.
162 |
163 |
164 |
165 |
--------------------------------------------------------------------------------
/docs/site_libs/quarto-html/quarto-syntax-highlighting.css:
--------------------------------------------------------------------------------
1 | /* quarto syntax highlight colors */
2 | :root {
3 | --quarto-hl-ot-color: #003B4F;
4 | --quarto-hl-at-color: #657422;
5 | --quarto-hl-ss-color: #20794D;
6 | --quarto-hl-an-color: #5E5E5E;
7 | --quarto-hl-fu-color: #4758AB;
8 | --quarto-hl-st-color: #20794D;
9 | --quarto-hl-cf-color: #003B4F;
10 | --quarto-hl-op-color: #5E5E5E;
11 | --quarto-hl-er-color: #AD0000;
12 | --quarto-hl-bn-color: #AD0000;
13 | --quarto-hl-al-color: #AD0000;
14 | --quarto-hl-va-color: #111111;
15 | --quarto-hl-bu-color: inherit;
16 | --quarto-hl-ex-color: inherit;
17 | --quarto-hl-pp-color: #AD0000;
18 | --quarto-hl-in-color: #5E5E5E;
19 | --quarto-hl-vs-color: #20794D;
20 | --quarto-hl-wa-color: #5E5E5E;
21 | --quarto-hl-do-color: #5E5E5E;
22 | --quarto-hl-im-color: #00769E;
23 | --quarto-hl-ch-color: #20794D;
24 | --quarto-hl-dt-color: #AD0000;
25 | --quarto-hl-fl-color: #AD0000;
26 | --quarto-hl-co-color: #5E5E5E;
27 | --quarto-hl-cv-color: #5E5E5E;
28 | --quarto-hl-cn-color: #8f5902;
29 | --quarto-hl-sc-color: #5E5E5E;
30 | --quarto-hl-dv-color: #AD0000;
31 | --quarto-hl-kw-color: #003B4F;
32 | }
33 |
34 | /* other quarto variables */
35 | :root {
36 | --quarto-font-monospace: SFMono-Regular, Menlo, Monaco, Consolas, "Liberation Mono", "Courier New", monospace;
37 | }
38 |
39 | pre > code.sourceCode > span {
40 | color: #003B4F;
41 | }
42 |
43 | code span {
44 | color: #003B4F;
45 | }
46 |
47 | code.sourceCode > span {
48 | color: #003B4F;
49 | }
50 |
51 | div.sourceCode,
52 | div.sourceCode pre.sourceCode {
53 | color: #003B4F;
54 | }
55 |
56 | code span.ot {
57 | color: #003B4F;
58 | font-style: inherit;
59 | }
60 |
61 | code span.at {
62 | color: #657422;
63 | font-style: inherit;
64 | }
65 |
66 | code span.ss {
67 | color: #20794D;
68 | font-style: inherit;
69 | }
70 |
71 | code span.an {
72 | color: #5E5E5E;
73 | font-style: inherit;
74 | }
75 |
76 | code span.fu {
77 | color: #4758AB;
78 | font-style: inherit;
79 | }
80 |
81 | code span.st {
82 | color: #20794D;
83 | font-style: inherit;
84 | }
85 |
86 | code span.cf {
87 | color: #003B4F;
88 | font-style: inherit;
89 | }
90 |
91 | code span.op {
92 | color: #5E5E5E;
93 | font-style: inherit;
94 | }
95 |
96 | code span.er {
97 | color: #AD0000;
98 | font-style: inherit;
99 | }
100 |
101 | code span.bn {
102 | color: #AD0000;
103 | font-style: inherit;
104 | }
105 |
106 | code span.al {
107 | color: #AD0000;
108 | font-style: inherit;
109 | }
110 |
111 | code span.va {
112 | color: #111111;
113 | font-style: inherit;
114 | }
115 |
116 | code span.bu {
117 | font-style: inherit;
118 | }
119 |
120 | code span.ex {
121 | font-style: inherit;
122 | }
123 |
124 | code span.pp {
125 | color: #AD0000;
126 | font-style: inherit;
127 | }
128 |
129 | code span.in {
130 | color: #5E5E5E;
131 | font-style: inherit;
132 | }
133 |
134 | code span.vs {
135 | color: #20794D;
136 | font-style: inherit;
137 | }
138 |
139 | code span.wa {
140 | color: #5E5E5E;
141 | font-style: italic;
142 | }
143 |
144 | code span.do {
145 | color: #5E5E5E;
146 | font-style: italic;
147 | }
148 |
149 | code span.im {
150 | color: #00769E;
151 | font-style: inherit;
152 | }
153 |
154 | code span.ch {
155 | color: #20794D;
156 | font-style: inherit;
157 | }
158 |
159 | code span.dt {
160 | color: #AD0000;
161 | font-style: inherit;
162 | }
163 |
164 | code span.fl {
165 | color: #AD0000;
166 | font-style: inherit;
167 | }
168 |
169 | code span.co {
170 | color: #5E5E5E;
171 | font-style: inherit;
172 | }
173 |
174 | code span.cv {
175 | color: #5E5E5E;
176 | font-style: italic;
177 | }
178 |
179 | code span.cn {
180 | color: #8f5902;
181 | font-style: inherit;
182 | }
183 |
184 | code span.sc {
185 | color: #5E5E5E;
186 | font-style: inherit;
187 | }
188 |
189 | code span.dv {
190 | color: #AD0000;
191 | font-style: inherit;
192 | }
193 |
194 | code span.kw {
195 | color: #003B4F;
196 | font-style: inherit;
197 | }
198 |
199 | .prevent-inlining {
200 | content: "s.tolerance[a.direction],e(a),l=t,i=!1}function h(){i||(i=!0,n=requestAnimationFrame(c))}var u=!!o&&{passive:!0,capture:!1};return t.addEventListener("scroll",h,u),c(),{destroy:function(){cancelAnimationFrame(n),t.removeEventListener("scroll",h,u)}}}function o(t){return t===Object(t)?t:{down:t,up:t}}function s(t,n){n=n||{},Object.assign(this,s.options,n),this.classes=Object.assign({},s.options.classes,n.classes),this.elem=t,this.tolerance=o(this.tolerance),this.offset=o(this.offset),this.initialised=!1,this.frozen=!1}return s.prototype={constructor:s,init:function(){return s.cutsTheMustard&&!this.initialised&&(this.addClass("initial"),this.initialised=!0,setTimeout(function(t){t.scrollTracker=n(t.scroller,{offset:t.offset,tolerance:t.tolerance},t.update.bind(t))},100,this)),this},destroy:function(){this.initialised=!1,Object.keys(this.classes).forEach(this.removeClass,this),this.scrollTracker.destroy()},unpin:function(){!this.hasClass("pinned")&&this.hasClass("unpinned")||(this.addClass("unpinned"),this.removeClass("pinned"),this.onUnpin&&this.onUnpin.call(this))},pin:function(){this.hasClass("unpinned")&&(this.addClass("pinned"),this.removeClass("unpinned"),this.onPin&&this.onPin.call(this))},freeze:function(){this.frozen=!0,this.addClass("frozen")},unfreeze:function(){this.frozen=!1,this.removeClass("frozen")},top:function(){this.hasClass("top")||(this.addClass("top"),this.removeClass("notTop"),this.onTop&&this.onTop.call(this))},notTop:function(){this.hasClass("notTop")||(this.addClass("notTop"),this.removeClass("top"),this.onNotTop&&this.onNotTop.call(this))},bottom:function(){this.hasClass("bottom")||(this.addClass("bottom"),this.removeClass("notBottom"),this.onBottom&&this.onBottom.call(this))},notBottom:function(){this.hasClass("notBottom")||(this.addClass("notBottom"),this.removeClass("bottom"),this.onNotBottom&&this.onNotBottom.call(this))},shouldUnpin:function(t){return"down"===t.direction&&!t.top&&t.toleranceExceeded},shouldPin:function(t){return"up"===t.direction&&t.toleranceExceeded||t.top},addClass:function(t){this.elem.classList.add.apply(this.elem.classList,this.classes[t].split(" "))},removeClass:function(t){this.elem.classList.remove.apply(this.elem.classList,this.classes[t].split(" "))},hasClass:function(t){return this.classes[t].split(" ").every(function(t){return this.classList.contains(t)},this.elem)},update:function(t){t.isOutOfBounds||!0!==this.frozen&&(t.top?this.top():this.notTop(),t.bottom?this.bottom():this.notBottom(),this.shouldUnpin(t)?this.unpin():this.shouldPin(t)&&this.pin())}},s.options={tolerance:{up:0,down:0},offset:0,scroller:t()?window:null,classes:{frozen:"headroom--frozen",pinned:"headroom--pinned",unpinned:"headroom--unpinned",top:"headroom--top",notTop:"headroom--not-top",bottom:"headroom--bottom",notBottom:"headroom--not-bottom",initial:"headroom"}},s.cutsTheMustard=!!(t()&&function(){}.bind&&"classList"in document.documentElement&&Object.assign&&Object.keys&&requestAnimationFrame),s});
8 |
--------------------------------------------------------------------------------
/data/covid19-tests.txt:
--------------------------------------------------------------------------------
1 | date tests
2 | 03-14-20 " 38,903"
3 | 03-21-20 " 91,966"
4 | 03-28-20 " 116,862"
5 | 04-04-20 " 136,384"
6 | 04-11-20 " 140,517"
7 | 04-18-20 " 152,223"
8 | 04-25-20 " 220,769"
9 | 05-02-20 " 264,655"
10 | 05-09-20 " 299,748"
11 | 05-16-20 " 341,549"
12 | 05-23-20 " 412,438"
13 | 05-30-20 " 427,479"
14 | 06-06-20 " 455,176"
15 | 06-13-20 " 467,667"
16 | 06-20-20 " 490,479"
17 | 06-27-20 " 544,282"
18 | 07-04-20 " 570,823"
19 | 07-11-20 " 678,361"
20 | 07-18-20 " 751,549"
21 | 07-25-20 " 703,396"
22 | 08-01-20 " 661,163"
23 | 08-08-20 " 662,501"
24 | 08-15-20 " 647,947"
25 | 08-22-20 " 616,320"
26 | 08-29-20 " 602,515"
27 | 09-05-20 " 632,168"
28 | 09-12-20 " 624,989"
29 | 09-19-20 " 740,980"
30 | 09-26-20 " 779,731"
31 | 10-03-20 " 797,063"
32 | 10-10-20 " 860,320"
33 | 10-17-20 " 840,103"
34 | 10-24-20 " 843,192"
35 | 10-31-20 " 890,760"
36 | 11-07-20 " 959,008"
37 | 11-14-20 1,017,005
38 | 11-21-20 1,096,775
39 | 11-28-20 " 810,254"
40 | 12-05-20 " 937,272"
41 | 12-12-20 " 897,605"
42 | 12-19-20 " 863,843"
43 | 12-26-20 " 643,891"
44 | 01-02-21 " 685,956"
45 | 01-09-21 " 822,409"
46 | 01-16-21 " 715,736"
47 | 01-23-21 " 636,672"
48 | 01-30-21 " 625,192"
49 | 02-06-21 " 568,679"
50 | 02-13-21 " 525,630"
51 | 02-20-21 " 460,026"
52 | 02-27-21 " 522,491"
53 | 03-06-21 " 521,632"
54 | 03-13-21 " 497,802"
55 | 03-20-21 " 476,027"
56 | 03-27-21 " 483,866"
57 | 04-03-21 " 464,905"
58 | 04-10-21 " 496,140"
59 | 04-17-21 " 500,386"
60 | 04-24-21 " 501,810"
61 | 05-01-21 " 490,898"
62 | 05-08-21 " 466,777"
63 | 05-15-21 " 438,635"
64 | 05-22-21 " 406,644"
65 | 05-29-21 " 354,739"
66 | 06-05-21 " 306,460"
67 | 06-12-21 " 305,029"
68 | 06-19-21 " 289,431"
69 | 06-26-21 " 266,271"
70 | 07-03-21 " 244,708"
71 | 07-10-21 " 249,174"
72 | 07-17-21 " 288,080"
73 | 07-24-21 " 320,092"
74 | 07-31-21 " 390,550"
75 | 08-07-21 " 468,161"
76 | 08-14-21 " 561,551"
77 | 08-21-21 " 613,565"
78 | 08-28-21 " 650,624"
79 | 09-04-21 " 665,052"
80 | 09-11-21 " 620,080"
81 | 09-18-21 " 675,779"
82 | 09-25-21 " 643,573"
83 | 10-02-21 " 603,861"
84 | 10-09-21 " 592,572"
85 | 10-16-21 " 547,945"
86 | 10-23-21 " 531,567"
87 | 10-30-21 " 511,120"
88 | 11-06-21 " 533,193"
89 | 11-13-21 " 524,863"
90 | 11-20-21 " 531,585"
91 | 11-27-21 " 431,501"
92 | 12-04-21 " 561,474"
93 | 12-11-21 " 544,989"
94 | 12-18-21 " 559,212"
95 | 12-25-21 " 594,248"
96 | 01-01-22 " 781,053"
97 | 01-08-22 " 990,961"
98 | 01-15-22 " 965,561"
99 | 01-22-22 " 787,038"
100 | 01-29-22 " 611,546"
101 | 02-05-22 " 485,720"
102 | 02-12-22 " 421,474"
103 | 02-19-22 " 374,716"
104 | 02-26-22 " 330,847"
105 | 03-05-22 " 311,400"
106 | 03-12-22 " 289,067"
107 | 03-19-22 " 271,865"
108 | 03-26-22 " 264,746"
109 | 04-02-22 " 252,787"
110 | 04-09-22 " 253,306"
111 | 04-16-22 " 244,046"
112 | 04-23-22 " 254,209"
113 | 04-30-22 " 269,764"
114 | 05-07-22 " 285,425"
115 | 05-14-22 " 312,089"
116 | 05-21-22 " 318,790"
117 | 05-28-22 " 308,534"
118 | 06-04-22 " 291,854"
119 | 06-11-22 " 300,497"
120 | 06-18-22 " 287,755"
121 | 06-25-22 " 270,899"
122 | 07-02-22 " 256,248"
123 | 07-09-22 " 260,178"
124 | 07-16-22 " 277,087"
125 | 07-23-22 " 275,961"
126 | 07-30-22 " 260,723"
127 | 08-06-22 " 242,508"
128 | 08-13-22 " 235,015"
129 | 08-20-22 " 232,196"
130 | 08-27-22 " 230,583"
131 | 09-03-22 " 225,183"
132 | 09-10-22 " 217,539"
133 | 09-17-22 " 218,372"
134 | 09-24-22 " 230,108"
135 | 10-01-22 " 201,077"
136 | 10-08-22 " 189,887"
137 | 10-15-22 " 190,865"
138 | 10-22-22 " 196,143"
139 | 10-29-22 " 201,501"
140 | 11-05-22 " 224,024"
141 | 11-12-22 " 206,591"
142 | 11-19-22 " 219,510"
143 | 11-26-22 " 200,732"
144 | 12-03-22 " 243,773"
145 | 12-10-22 " 232,848"
146 | 12-17-22 " 225,464"
147 | 12-24-22 " 192,655"
148 | 12-31-22 " 174,643"
149 | 01-07-23 " 173,257"
150 | 01-14-23 " 165,293"
151 | 01-21-23 " 154,495"
152 | 01-28-23 " 154,280"
153 | 02-04-23 " 146,354"
154 | 02-11-23 " 149,913"
155 | 02-18-23 " 140,959"
156 | 02-25-23 " 134,031"
157 | 03-04-23 " 131,368"
158 | 03-11-23 " 127,116"
159 | 03-18-23 " 120,265"
160 | 03-25-23 " 116,250"
161 | 04-01-23 " 109,151"
162 | 04-08-23 " 102,563"
163 | 04-15-23 " 97,584"
164 | 04-22-23 " 88,861"
165 | 04-29-23 " 85,131"
166 | 05-06-23 " 79,947"
167 | 05-13-23 " 74,123"
168 | 05-20-23 " 67,790"
169 | 05-27-23 " 61,636"
170 | 06-03-23 " 57,203"
171 | 06-10-23 " 54,743"
172 | 06-17-23 " 48,525"
173 | 06-24-23 " 45,881"
174 | 07-01-23 " 42,896"
175 | 07-08-23 " 40,034"
176 | 07-15-23 " 42,881"
177 | 07-22-23 " 43,158"
178 | 07-29-23 " 44,749"
179 | 08-05-23 " 44,301"
180 | 08-12-23 " 47,761"
181 | 08-19-23 " 54,110"
182 | 08-26-23 " 58,069"
183 | 09-02-23 " 62,568"
184 | 09-09-23 " 50,579"
185 |
--------------------------------------------------------------------------------
/28-gene-expression-case-study.qmd:
--------------------------------------------------------------------------------
1 | # Case Study: Differential expression between ethnicity
2 |
3 | Paper here: \]./()*\\\n\t\b\v\u00A0]/g,"-").replace(/-{2,}/g,"-").substring(0,this.options.truncate).replace(/^-+|-+$/gm,"").toLowerCase()},this.hasAnchorJSLink=function(A){var e=A.firstChild&&-1<(" "+A.firstChild.className+" ").indexOf(" anchorjs-link "),A=A.lastChild&&-1<(" "+A.lastChild.className+" ").indexOf(" anchorjs-link ");return e||A||!1}}});
9 | // @license-end
--------------------------------------------------------------------------------
/05-vectorization.qmd:
--------------------------------------------------------------------------------
1 | # Vectorization
2 |
3 | A European friend has a great job offer from USA but is concerned about gun violence.
4 |
5 | The `murders` dataset in the **dslabs** package includes data on gun murders for the US 50 states and DC. Use this to prepare a report for your fried to help them decide where to live. Note your friend likes hiking so might prefer the west. Your friend does not like low population density.
6 |
7 | ```{r}
8 | library(dslabs)
9 | ```
10 |
11 | ## Arithmetics
12 |
13 | ```{r}
14 | heights <- c(69, 62, 66, 70, 70, 73, 67, 73, 67, 70)
15 | ```
16 |
17 | Convert to meters:
18 |
19 | ```{r}
20 | heights * 2.54 / 100
21 | ```
22 |
23 | Difference from the average:
24 |
25 | ```{r}
26 | avg <- mean(heights)
27 | heights - avg
28 | ```
29 |
30 | Exercise: compute the height in standardized units
31 |
32 | ```{r}
33 | s <- sd(heights)
34 | (heights - avg) / s
35 | # can also use scale(heights)
36 | ```
37 |
38 |
39 | If it's two vectors, it does it component wise:
40 |
41 | ```{r}
42 | heights <- c(69, 62, 66, 70, 70, 73, 67, 73, 67, 70)
43 | error <- rnorm(length(heights), 0, 0.1)
44 | heights + error
45 | ```
46 |
47 |
48 | Exercise:
49 |
50 | Add a column to the murders dataset with the murder rate in per 100,000.
51 |
52 | ```{r}
53 | library(dslabs)
54 | murders$rate <- with(murders, total / population * 10^5)
55 | ```
56 |
57 |
58 | ## Functions that vectorize
59 |
60 | Most arithmetic functions work on vectors
61 |
62 | ```{r}
63 | x <- 1:10
64 | sqrt(x)
65 | log(x)
66 | 2^x
67 | ```
68 |
69 | Note that the conditional function `if`-`else` does not vectorize. A particularly useful function is a vectorized version `ifelse`. Here is an example:
70 |
71 | ```{r}
72 | a <- c(0, 1, 2, -4, 5)
73 | ifelse(a > 0, 1/a, NA)
74 | ```
75 |
76 | Other conditional functions, such as `any` and `all`, do vectorize.
77 |
78 | ## Indexing
79 |
80 |
81 | Vectorization also works for logical relationships:
82 |
83 | ```{r}
84 | ind <- murders$population < 10^6
85 | ```
86 |
87 |
88 | You can subset a vector using these:
89 |
90 | ```{r}
91 | murders$state[ind]
92 | ```
93 |
94 |
95 | You can also use vectorization to apply logical operators:
96 |
97 | ```{r}
98 | ind <- murders$population < 10^6 & murders$region == "West"
99 | murders$state[ind]
100 | ```
101 |
102 | ## split
103 |
104 | Split is a useful function to get indexes using a factor.
105 | ```{r}
106 | inds <- with(murders, split(seq_along(region), region))
107 | murders$state[inds$West]
108 | ```
109 |
110 | ## Functions for subsetting
111 |
112 | The functions `which`, `match` and the operator `%in%` are
113 | useful for sub-setting
114 |
115 | Here are some examples:
116 |
117 | ```{r}
118 | ind <- which(murders$state == "California")
119 | ind
120 | murders[ind,]
121 | ```
122 |
123 |
124 | ```{r}
125 | ind <- match(c("New York", "Florida", "Texas"), murders$state)
126 | ind
127 | ```
128 |
129 | ```{r}
130 | c("Boston", "Dakota", "Washington") %in% murders$state
131 | ```
132 |
133 | ## sapply
134 |
135 | You can apply functions that don't vectorize. Like this one:
136 |
137 | ```{r}
138 | s <- function(n){
139 | return(sum(1:n))
140 | }
141 | ```
142 |
143 | Try it on a vector:
144 |
145 | ```{r}
146 | ns <- c(25, 100, 1000)
147 | s(ns)
148 | ```
149 |
150 | We can use `sapply`
151 | ```{r}
152 | sapply(ns, s)
153 | ```
154 |
155 | `sapply` will work on any vector, including lists.
156 |
157 |
158 | ## Exercises
159 |
160 | Now we are ready to help your friend. Let's give them options of places with low murders rates, mountains, and not too small.
161 |
162 | For the following exercises do no load any packages other than **dslabs**.
163 |
164 | (@) Show the subset of `murders` showing states with less than 1 per 100,000 deaths. Show all variables.
165 |
166 | ```{r}
167 | if (exists("murders")) rm(murders)
168 | library(dslabs)
169 |
170 | murders$rate <- with(murders, total/population*10^5)
171 | murders[murders$rate < 1,]
172 | ```
173 |
174 |
175 | (@) Show the subset of `murders` showing states with less than 1 per 100,000 deaths and in the West of the US. Don't show the `region` variable.
176 |
177 | ```{r}
178 | murders[murders$rate < 1 & murders$region == "West",]
179 | ```
180 |
181 |
182 | (@) Show the largest state with a rate less than 1 per 100,000.
183 |
184 | ```{r}
185 | dat <- murders[murders$rate < 1,]
186 | dat[which.max(dat$population),]
187 | ```
188 |
189 | (@) Show the state with a population of more than 10 million with the lowest rate.
190 |
191 | ```{r}
192 | dat <- murders[murders$population >= 10^7,]
193 | dat[which.min(dat$rate),]
194 | ```
195 |
196 | (@) Compute the rate for each region of the US.
197 |
198 | ```{r}
199 | indexes <- split(1:nrow(murders), murders$region)
200 | sapply(indexes, function(ind) {
201 | sum(murders$total[ind])/sum(murders$population[ind])*10^5
202 | })
203 | ```
204 |
205 |
206 | More practice exercises:
207 |
208 | (@) Create a vector of numbers that starts at 6, does not pass 55, and adds numbers in increments of 4/7: 6, 6 + 4/7, 6 + 8/7, and so on. How many numbers does the list have? Hint: use `seq` and `length`.
209 |
210 | (@) Make this data frame:
211 |
212 | ```{r}
213 | temp <- c(35, 88, 42, 84, 81, 30)
214 | city <- c("Beijing", "Lagos", "Paris", "Rio de Janeiro",
215 | "San Juan", "Toronto")
216 | city_temps <- data.frame(name = city, temperature = temp)
217 | ```
218 |
219 | Convert the temperatures to Celsius.
220 |
221 | (@) Compute the following sum
222 |
223 | $$
224 | S_n = 1+1/2^2 + 1/3^2 + \dots 1/n^2
225 | $$
226 |
227 | Show that as $n$ gets bigger we get closer $\pi^2/6$.
228 |
229 | (@) Use the `%in%` operator and the predefined object `state.abb` to create a logical vector that answers the question: which of the following are actual abbreviations: MA, ME, MI, MO, MU?
230 |
231 |
232 | (@) Extend the code you used in the previous exercise to report the one entry that is **not** an actual abbreviation. Hint: use the `!` operator, which turns `FALSE` into `TRUE` and viceversa, then `which` to obtain an index.
233 |
234 | (@) Show all variables for New York, California, and Texas, in that order.
235 |
--------------------------------------------------------------------------------
/32-conditional-expectations.qmd:
--------------------------------------------------------------------------------
1 | # Conditional probabilities and expectations
2 |
3 | * In machine learning applications, we rarely can predict outcomes perfectly. For example,
4 | - spam detectors often miss emails that are clearly spam,
5 | - Siri often misunderstands the words we are saying, and
6 | - your bank at times thinks your card was stolen when it was not.
7 |
8 | * The most common reason for not being able to build perfect algorithms is that it is impossible.
9 |
10 | * To see this, note that most datasets will include groups of observations with the same exact observed values for all predictors, but with different outcomes.
11 |
12 | * Because our prediction rules are functions, equal inputs (the predictors) implies equal outputs (the predictions).
13 |
14 | * Therefore, for a challenge in which the same predictors are associated with different outcomes across different individual observations, it is impossible to predict correctly for all these cases.
15 |
16 | ## Conditional probabilities
17 |
18 | * We use the notation $(X_1 = x_1,\dots,X_p=x_p)$ to represent the fact that we have observed values $x_1,\dots,x_p$ for features $X_1, \dots, X_p$.
19 |
20 | * This does not imply that the outcome $Y$ will take a specific value. Instead, it implies a specific probability.
21 |
22 | * We denote the _conditional probabilities_ for each class $k$ with:
23 |
24 | $$
25 | \mbox{Pr}(Y=k \mid X_1 = x_1,\dots,X_p=x_p), \, \mbox{for}\,k=1,\dots,K
26 | $$
27 |
28 | * We will use the bold letters like this: $\mathbf{X} \equiv (X_1,\dots,X_p)^\top$ and $\mathbf{x} \equiv (x_1,\dots,x_p)^\top$.
29 | * We will also use the following notation for the conditional probability of being class $k$:
30 |
31 | $$
32 | p_k(\mathbf{x}) = \mbox{Pr}(Y=k \mid \mathbf{X}=\mathbf{x}), \, \mbox{for}\, k=1,\dots,K
33 | $$
34 |
35 | :::{.callout-note}
36 | WDo not confuse this with the $p$ that represents the number of predictors.
37 | :::
38 |
39 | * These probabilities guide the construction of an algorithm that makes the best prediction: for any given $\mathbf{x}$, we will predict the class $k$ with the largest probability among $p_1(x), p_2(x), \dots p_K(x)$.
40 |
41 | * In mathematical notation, we write it like this:
42 |
43 | $$\hat{Y} = \max_k p_k(\mathbf{x})$$
44 |
45 | * In machine learning, we refer to this as _Bayes' Rule_.
46 |
47 | * But this is a theoretical rule since, in practice, we don't know $p_k(\mathbf{x}), k=1,\dots,K$.
48 |
49 | * Estimating these conditional probabilities can be thought of as the main challenge of machine learning.
50 |
51 | * The better our probability estimates $\hat{p}_k(\mathbf{x})$, the better our predictor $\hat{Y}$.
52 |
53 | * So how well we predict depends on two things:
54 | 1. how close are the $\max_k p_k(\mathbf{x})$ to 1 or 0 (perfect certainty) and
55 | 2. how close our estimates $\hat{p}_k(\mathbf{x})$ are to $p_k(\mathbf{x})$.
56 |
57 | * We can't do anything about the first restriction as it is determined by the nature of the problem, so
58 |
59 | * our energy goes into finding ways to best estimate conditional probabilities.
60 |
61 | * The first restriction does imply that we have limits as to how well even the best possible algorithm can perform.
62 |
63 | * in some challenges we will be able to achieve almost perfect accuracy, with digit readers for example,
64 |
65 | * in others our success is restricted by the randomness of the process, with movie recommendations for example.
66 |
67 | * It is important to remember that defining our prediction by maximizing the probability is not always optimal in practice and depends on the context.
68 |
69 | * As discussed above, sensitivity and specificity may differ in importance.
70 |
71 | * But even in these cases, having a good estimate of the $p_k(x), k=1,\dots,K$ will suffice for us to build optimal prediction models, since we can control the balance between specificity and sensitivity however we wish.
72 |
73 | ## Conditional expectations
74 |
75 | * For binary data, you can think of the probability $\mbox{Pr}(Y=1 \mid \mathbf{X}=\mathbf{x})$ as the proportion of 1s in the stratum of the population for which $\mathbf{X}=\mathbf{x}$.
76 |
77 | * Many of the algorithms we will learn can be applied to both categorical and continuous data due to the connection between _conditional probabilities_ and _conditional expectations_.
78 |
79 | * Because the expectation is the average of values $y_1,\dots,y_n$ in the population, in the case in which the $y$s are 0 or 1:
80 |
81 | $$
82 | \mbox{E}(Y \mid \mathbf{X}=\mathbf{x})=\mbox{Pr}(Y=1 \mid \mathbf{X}=\mathbf{x}).
83 | $$
84 |
85 | * As a result, we often only use the expectation to denote both the conditional probability and conditional expectation.
86 |
87 | * We assume that the outcome follows the same conditional distribution.
88 |
89 |
90 | ## Conditional expectations minimizes squared loss function
91 |
92 | * Why do we care about the conditional expectation in machine learning?
93 |
94 | * This is because the expected value has an attractive mathematical property: it minimizes the MSE. Specifically, of all possible predictions $\hat{Y}$,
95 |
96 | $$
97 | \hat{Y} = \mbox{E}(Y \mid \mathbf{X}=\mathbf{x}) \, \mbox{ minimizes } \, \mbox{E}\{ (\hat{Y} - Y)^2 \mid \mathbf{X}=\mathbf{x} \}
98 | $$
99 |
100 | * Due to this property, a succinct description of the main task of machine learning is that we use data to estimate:
101 |
102 | $$
103 | f(\mathbf{x}) \equiv \mbox{E}( Y \mid \mathbf{X}=\mathbf{x} )
104 | $$
105 |
106 | for any set of features $\mathbf{x} = (x_1, \dots, x_p)^\top$.
107 |
108 | * This is easier said than done, since this function can take any shape and $p$ can be very large.
109 |
110 | * Consider a case in which we only have one predictor $x$. The expectation $\mbox{E}\{ Y \mid X=x \}$ can be any function of $x$: a line, a parabola, a sine wave, a step function, anything.
111 |
112 | * It gets even more complicated when we consider instances with large $p$, in which case $f(\mathbf{x})$ is a function of a multidimensional vector $\mathbf{x}$. For example, in our digit reader example $p = 784$!
113 |
114 | * The main way in which competing machine learning algorithms differ is in their approach to estimating this conditional expectation.
115 |
--------------------------------------------------------------------------------
/35-caret.qmd:
--------------------------------------------------------------------------------
1 | # The caret package {#sec-caret}
2 |
3 | * We have already learned about several machine learning algorithms.
4 |
5 | * Many of these algorithms are implemented in R.
6 |
7 | * However, they are distributed via different packages, developed by different authors, and often use different syntax.
8 |
9 | * The __caret__ package tries to consolidate these differences and provide consistency.
10 |
11 | * It currently includes over 200 different methods which are summarized in the __caret__ package manual^[https://topepo.github.io/caret/available-models.html]. Keep in mind that __caret__ does not include the needed packages and, to implement a package through __caret__, you still need to install the library.
12 |
13 | * The required packages for each method are described in the package manual.
14 |
15 | * The __caret__ package also provides a function that performs cross validation for us.
16 |
17 | * Here we provide some examples showing how we use this incredibly helpful package.
18 |
19 | * We will use the 2 or 7 example to illustrate and in later sections we use use the package to run algorithms on the larger MNIST datset.
20 |
21 | ## The `train` functon
22 |
23 | The __caret__ `train` function lets us train different algorithms using similar syntax.
24 |
25 | * So, for example, we can type:
26 |
27 | ```{r}
28 | #| message: false
29 | #| warning: false
30 | #| cache: false
31 | library(tidyverse)
32 | library(dslabs)
33 | library(caret)
34 | train_glm <- train(y ~ ., method = "glm", data = mnist_27$train)
35 | train_qda <- train(y ~ ., method = "qda", data = mnist_27$train)
36 | train_knn <- train(y ~ ., method = "knn", data = mnist_27$train)
37 | ```
38 |
39 | * To make predictions, we can use the output of this function directly without needing to look at the specifics of `predict.glm` and `predict.knn`.
40 |
41 | * Instead, we can learn how to obtain predictions from `predict.train`.
42 |
43 | The code looks the same for both methods:
44 | ```{r}
45 | y_hat_glm <- predict(train_glm, mnist_27$test, type = "raw")
46 | y_hat_qda <- predict(train_qda, mnist_27$test, type = "raw")
47 | y_hat_knn <- predict(train_knn, mnist_27$test, type = "raw")
48 | ```
49 |
50 | * This permits us to quickly compare the algorithms.
51 |
52 | * For example, we can compare the accuracy like this:
53 |
54 | ```{r}
55 | fits <- list(glm = y_hat_glm, qda = y_hat_qda, knn = y_hat_knn)
56 | sapply(fits, function(fit) confusionMatrix(fit, mnist_27$test$y)$overall[["Accuracy"]])
57 | ```
58 |
59 | ## Cross validation {#sec-caret-cv}
60 |
61 | * When an algorithm includes a tuning parameter, `train` automatically uses cross validation to decide among a few default values.
62 |
63 | * To find out what parameter or parameters are optimized, you can read the manual ^[http://topepo.github.io/caret/available-models.html] or study the output of:
64 |
65 | ```{r, eval=FALSE}
66 | getModelInfo("knn")
67 | ```
68 |
69 | * We can also use a quick lookup like this:
70 |
71 | ```{r, eval=FALSE}
72 | modelLookup("knn")
73 | ```
74 |
75 | * If we run it with default values:
76 |
77 | ```{r}
78 | train_knn <- train(y ~ ., method = "knn", data = mnist_27$train)
79 | ```
80 |
81 | you can quickly see the results of the cross validation using the `ggplot` function.
82 |
83 | * The argument `highlight` highlights the max:
84 |
85 | ```{r caret-highlight}
86 | ggplot(train_knn, highlight = TRUE)
87 | ```
88 |
89 | * By default, the cross validation is performed by taking 25 bootstrap samples comprised of 25% of the observations.
90 |
91 | * For the `kNN` method, the default is to try $k=5,7,9$. We change this using the `tuneGrid` parameter.
92 |
93 | * The grid of values must be supplied by a data frame with the parameter names as specified in the `modelLookup` output.
94 |
95 | * Here, we present an example where we try out 30 values between 9 and 67.
96 | * To do this with __caret__, we need to define a column named `k`, so we use this: `data.frame(k = seq(9, 67, 2))`.
97 |
98 | * Note that when running this code, we are fitting 30 versions of kNN to 25 bootstrapped samples.
99 |
100 | * Since we are fitting $30 \times 25 = 750$ kNN models, running this code will take several seconds.
101 |
102 | * We set the seed because cross validation is a random procedure and we want to make sure the result here is reproducible.
103 |
104 | ```{r train-knn-plot}
105 | set.seed(2008)
106 | train_knn <- train(y ~ ., method = "knn",
107 | data = mnist_27$train,
108 | tuneGrid = data.frame(k = seq(9, 71, 2)))
109 | ggplot(train_knn, highlight = TRUE)
110 | ```
111 |
112 | * To access the parameter that maximized the accuracy, you can use this:
113 |
114 | ```{r}
115 | train_knn$bestTune
116 | ```
117 |
118 | and the best performing model like this:
119 |
120 | ```{r}
121 | train_knn$finalModel
122 | ```
123 |
124 | * The function `predict` will use this best performing model.
125 |
126 | * Here is the accuracy of the best model when applied to the test set, which we have not used at all yet because the cross validation was done on the training set:
127 |
128 | ```{r}
129 | confusionMatrix(predict(train_knn, mnist_27$test, type = "raw"),
130 | mnist_27$test$y)$overall["Accuracy"]
131 | ```
132 |
133 | * If we want to change how we perform cross validation, we can use the `trainControl` function.
134 |
135 | * We can make the code above go a bit faster by using, for example, 10-fold cross validation.
136 |
137 | * This means we have 10 samples using 10% of the observations each.
138 |
139 | * We accomplish this using the following code:
140 |
141 | ```{r cv-10-fold-accuracy-estimate}
142 | control <- trainControl(method = "cv", number = 10, p = .9)
143 | train_knn_cv <- train(y ~ ., method = "knn",
144 | data = mnist_27$train,
145 | tuneGrid = data.frame(k = seq(9, 71, 2)),
146 | trControl = control)
147 | ggplot(train_knn_cv, highlight = TRUE)
148 | ```
149 |
150 | * We notice that the accuracy estimates are more variable, which is expected since we changed the number of samples used to estimate accuracy.
151 |
152 | * Note that `results` component of the `train` output includes several summary statistics related to the variability of the cross validation estimates:
153 |
154 | ```{r}
155 | names(train_knn$results)
156 | ```
157 |
158 | * We have only covered the basics.
159 |
160 | * The **caret** package manual ^[https://topepo.github.io/caret/available-models.html] includes many more details.
161 |
162 |
--------------------------------------------------------------------------------
/docs/site_libs/lightable-0.0.1/lightable.css:
--------------------------------------------------------------------------------
1 | /*!
2 | * lightable v0.0.1
3 | * Copyright 2020 Hao Zhu
4 | * Licensed under MIT (https://github.com/haozhu233/kableExtra/blob/master/LICENSE)
5 | */
6 |
7 | .lightable-minimal {
8 | border-collapse: separate;
9 | border-spacing: 16px 1px;
10 | width: 100%;
11 | margin-bottom: 10px;
12 | }
13 |
14 | .lightable-minimal td {
15 | margin-left: 5px;
16 | margin-right: 5px;
17 | }
18 |
19 | .lightable-minimal th {
20 | margin-left: 5px;
21 | margin-right: 5px;
22 | }
23 |
24 | .lightable-minimal thead tr:last-child th {
25 | border-bottom: 2px solid #00000050;
26 | empty-cells: hide;
27 |
28 | }
29 |
30 | .lightable-minimal tbody tr:first-child td {
31 | padding-top: 0.5em;
32 | }
33 |
34 | .lightable-minimal.lightable-hover tbody tr:hover {
35 | background-color: #f5f5f5;
36 | }
37 |
38 | .lightable-minimal.lightable-striped tbody tr:nth-child(even) {
39 | background-color: #f5f5f5;
40 | }
41 |
42 | .lightable-classic {
43 | border-top: 0.16em solid #111111;
44 | border-bottom: 0.16em solid #111111;
45 | width: 100%;
46 | margin-bottom: 10px;
47 | margin: 10px 5px;
48 | }
49 |
50 | .lightable-classic tfoot tr td {
51 | border: 0;
52 | }
53 |
54 | .lightable-classic tfoot tr:first-child td {
55 | border-top: 0.14em solid #111111;
56 | }
57 |
58 | .lightable-classic caption {
59 | color: #222222;
60 | }
61 |
62 | .lightable-classic td {
63 | padding-left: 5px;
64 | padding-right: 5px;
65 | color: #222222;
66 | }
67 |
68 | .lightable-classic th {
69 | padding-left: 5px;
70 | padding-right: 5px;
71 | font-weight: normal;
72 | color: #222222;
73 | }
74 |
75 | .lightable-classic thead tr:last-child th {
76 | border-bottom: 0.10em solid #111111;
77 | }
78 |
79 | .lightable-classic.lightable-hover tbody tr:hover {
80 | background-color: #F9EEC1;
81 | }
82 |
83 | .lightable-classic.lightable-striped tbody tr:nth-child(even) {
84 | background-color: #f5f5f5;
85 | }
86 |
87 | .lightable-classic-2 {
88 | border-top: 3px double #111111;
89 | border-bottom: 3px double #111111;
90 | width: 100%;
91 | margin-bottom: 10px;
92 | }
93 |
94 | .lightable-classic-2 tfoot tr td {
95 | border: 0;
96 | }
97 |
98 | .lightable-classic-2 tfoot tr:first-child td {
99 | border-top: 3px double #111111;
100 | }
101 |
102 | .lightable-classic-2 caption {
103 | color: #222222;
104 | }
105 |
106 | .lightable-classic-2 td {
107 | padding-left: 5px;
108 | padding-right: 5px;
109 | color: #222222;
110 | }
111 |
112 | .lightable-classic-2 th {
113 | padding-left: 5px;
114 | padding-right: 5px;
115 | font-weight: normal;
116 | color: #222222;
117 | }
118 |
119 | .lightable-classic-2 tbody tr:last-child td {
120 | border-bottom: 3px double #111111;
121 | }
122 |
123 | .lightable-classic-2 thead tr:last-child th {
124 | border-bottom: 1px solid #111111;
125 | }
126 |
127 | .lightable-classic-2.lightable-hover tbody tr:hover {
128 | background-color: #F9EEC1;
129 | }
130 |
131 | .lightable-classic-2.lightable-striped tbody tr:nth-child(even) {
132 | background-color: #f5f5f5;
133 | }
134 |
135 | .lightable-material {
136 | min-width: 100%;
137 | white-space: nowrap;
138 | table-layout: fixed;
139 | font-family: Roboto, sans-serif;
140 | border: 1px solid #EEE;
141 | border-collapse: collapse;
142 | margin-bottom: 10px;
143 | }
144 |
145 | .lightable-material tfoot tr td {
146 | border: 0;
147 | }
148 |
149 | .lightable-material tfoot tr:first-child td {
150 | border-top: 1px solid #EEE;
151 | }
152 |
153 | .lightable-material th {
154 | height: 56px;
155 | padding-left: 16px;
156 | padding-right: 16px;
157 | }
158 |
159 | .lightable-material td {
160 | height: 52px;
161 | padding-left: 16px;
162 | padding-right: 16px;
163 | border-top: 1px solid #eeeeee;
164 | }
165 |
166 | .lightable-material.lightable-hover tbody tr:hover {
167 | background-color: #f5f5f5;
168 | }
169 |
170 | .lightable-material.lightable-striped tbody tr:nth-child(even) {
171 | background-color: #f5f5f5;
172 | }
173 |
174 | .lightable-material.lightable-striped tbody td {
175 | border: 0;
176 | }
177 |
178 | .lightable-material.lightable-striped thead tr:last-child th {
179 | border-bottom: 1px solid #ddd;
180 | }
181 |
182 | .lightable-material-dark {
183 | min-width: 100%;
184 | white-space: nowrap;
185 | table-layout: fixed;
186 | font-family: Roboto, sans-serif;
187 | border: 1px solid #FFFFFF12;
188 | border-collapse: collapse;
189 | margin-bottom: 10px;
190 | background-color: #363640;
191 | }
192 |
193 | .lightable-material-dark tfoot tr td {
194 | border: 0;
195 | }
196 |
197 | .lightable-material-dark tfoot tr:first-child td {
198 | border-top: 1px solid #FFFFFF12;
199 | }
200 |
201 | .lightable-material-dark th {
202 | height: 56px;
203 | padding-left: 16px;
204 | padding-right: 16px;
205 | color: #FFFFFF60;
206 | }
207 |
208 | .lightable-material-dark td {
209 | height: 52px;
210 | padding-left: 16px;
211 | padding-right: 16px;
212 | color: #FFFFFF;
213 | border-top: 1px solid #FFFFFF12;
214 | }
215 |
216 | .lightable-material-dark.lightable-hover tbody tr:hover {
217 | background-color: #FFFFFF12;
218 | }
219 |
220 | .lightable-material-dark.lightable-striped tbody tr:nth-child(even) {
221 | background-color: #FFFFFF12;
222 | }
223 |
224 | .lightable-material-dark.lightable-striped tbody td {
225 | border: 0;
226 | }
227 |
228 | .lightable-material-dark.lightable-striped thead tr:last-child th {
229 | border-bottom: 1px solid #FFFFFF12;
230 | }
231 |
232 | .lightable-paper {
233 | width: 100%;
234 | margin-bottom: 10px;
235 | color: #444;
236 | }
237 |
238 | .lightable-paper tfoot tr td {
239 | border: 0;
240 | }
241 |
242 | .lightable-paper tfoot tr:first-child td {
243 | border-top: 1px solid #00000020;
244 | }
245 |
246 | .lightable-paper thead tr:last-child th {
247 | color: #666;
248 | vertical-align: bottom;
249 | border-bottom: 1px solid #00000020;
250 | line-height: 1.15em;
251 | padding: 10px 5px;
252 | }
253 |
254 | .lightable-paper td {
255 | vertical-align: middle;
256 | border-bottom: 1px solid #00000010;
257 | line-height: 1.15em;
258 | padding: 7px 5px;
259 | }
260 |
261 | .lightable-paper.lightable-hover tbody tr:hover {
262 | background-color: #F9EEC1;
263 | }
264 |
265 | .lightable-paper.lightable-striped tbody tr:nth-child(even) {
266 | background-color: #00000008;
267 | }
268 |
269 | .lightable-paper.lightable-striped tbody td {
270 | border: 0;
271 | }
272 |
273 |
--------------------------------------------------------------------------------
/docs/sitemap.xml:
--------------------------------------------------------------------------------
1 |
2 |
3 |
4 | http://datasciencelabs.github.io/2023/index.html
5 | 2023-12-03T22:32:34.487Z
6 |
7 |
8 | http://datasciencelabs.github.io/2023/intro.html
9 | 2023-12-03T22:32:34.490Z
10 |
11 |
12 | http://datasciencelabs.github.io/2023/schedule.html
13 | 2023-12-03T22:32:34.496Z
14 |
15 |
16 | http://datasciencelabs.github.io/2023/01-quarto.html
17 | 2023-12-03T22:32:34.502Z
18 |
19 |
20 | http://datasciencelabs.github.io/2023/02-unix.html
21 | 2024-01-17T20:36:12.891Z
22 |
23 |
24 | http://datasciencelabs.github.io/2023/03-git.html
25 | 2023-12-03T22:32:34.521Z
26 |
27 |
28 | http://datasciencelabs.github.io/2023/04-r-basics.html
29 | 2023-12-03T22:32:34.537Z
30 |
31 |
32 | http://datasciencelabs.github.io/2023/05-vectorization.html
33 | 2023-12-03T22:32:34.547Z
34 |
35 |
36 | http://datasciencelabs.github.io/2023/06-tidyverse.html
37 | 2023-12-03T22:32:34.559Z
38 |
39 |
40 | http://datasciencelabs.github.io/2023/07-dates-and-times.html
41 | 2023-12-03T22:32:34.570Z
42 |
43 |
44 | http://datasciencelabs.github.io/2023/08-importing-data.html
45 | 2023-12-03T22:32:34.581Z
46 |
47 |
48 | http://datasciencelabs.github.io/2023/09-data-table.html
49 | 2023-12-03T22:32:34.593Z
50 |
51 |
52 | http://datasciencelabs.github.io/2023/pset1.html
53 | 2023-12-03T22:32:34.611Z
54 |
55 |
56 | http://datasciencelabs.github.io/2023/10-distributions.html
57 | 2023-12-03T22:32:34.618Z
58 |
59 |
60 | http://datasciencelabs.github.io/2023/11-ggplot2.html
61 | 2023-12-03T22:32:34.636Z
62 |
63 |
64 | http://datasciencelabs.github.io/2023/12-dataviz-principles.html
65 | 2023-12-03T22:32:34.651Z
66 |
67 |
68 | http://datasciencelabs.github.io/2023/13-wrangling.html
69 | 2023-12-03T22:32:34.685Z
70 |
71 |
72 | http://datasciencelabs.github.io/2023/14-web-scraping.html
73 | 2023-12-03T22:32:34.695Z
74 |
75 |
76 | http://datasciencelabs.github.io/2023/15-locales.html
77 | 2023-12-03T22:32:34.700Z
78 |
79 |
80 | http://datasciencelabs.github.io/2023/16-text-mining.html
81 | 2023-12-03T22:32:34.712Z
82 |
83 |
84 | http://datasciencelabs.github.io/2023/17-probability.html
85 | 2023-12-03T22:32:34.727Z
86 |
87 |
88 | http://datasciencelabs.github.io/2023/18-inference.html
89 | 2023-12-03T22:32:34.740Z
90 |
91 |
92 | http://datasciencelabs.github.io/2023/19-models.html
93 | 2023-12-03T22:32:34.764Z
94 |
95 |
96 | http://datasciencelabs.github.io/2023/pset2.html
97 | 2023-12-03T22:32:34.789Z
98 |
99 |
100 | http://datasciencelabs.github.io/2023/20-regression.html
101 | 2023-12-03T22:32:34.809Z
102 |
103 |
104 | http://datasciencelabs.github.io/2023/21-multivariate-regression.html
105 | 2023-12-03T22:32:34.826Z
106 |
107 |
108 | http://datasciencelabs.github.io/2023/22-linear-models.html
109 | 2023-12-03T22:32:34.838Z
110 |
111 |
112 | http://datasciencelabs.github.io/2023/23-association-tests.html
113 | 2023-12-03T22:32:34.851Z
114 |
115 |
116 | http://datasciencelabs.github.io/2023/24-corrleation-not-causation.html
117 | 2023-12-03T22:32:34.862Z
118 |
119 |
120 | http://datasciencelabs.github.io/2023/25-matrices-in-R.html
121 | 2023-12-03T22:32:34.874Z
122 |
123 |
124 | http://datasciencelabs.github.io/2023/26-linear-algebra.html
125 | 2023-12-03T22:32:34.885Z
126 |
127 |
128 | http://datasciencelabs.github.io/2023/27-dimension-reduction.html
129 | 2023-12-03T22:32:34.900Z
130 |
131 |
132 | http://datasciencelabs.github.io/2023/28-gene-expression-case-study.html
133 | 2023-12-03T22:32:34.933Z
134 |
135 |
136 | http://datasciencelabs.github.io/2023/29-regularization.html
137 | 2023-12-03T22:32:34.965Z
138 |
139 |
140 | http://datasciencelabs.github.io/2023/30-matrix-factorization.html
141 | 2023-12-03T22:32:34.965Z
142 |
143 |
144 | http://datasciencelabs.github.io/2023/31-ml-intro.html
145 | 2023-12-03T22:32:34.972Z
146 |
147 |
148 | http://datasciencelabs.github.io/2023/32-conditional-expectations.html
149 | 2023-12-03T22:32:34.983Z
150 |
151 |
152 | http://datasciencelabs.github.io/2023/33-smoothing.html
153 | 2023-12-03T22:32:34.991Z
154 |
155 |
156 | http://datasciencelabs.github.io/2023/34-cross-validation.html
157 | 2023-12-03T22:32:35.003Z
158 |
159 |
160 | http://datasciencelabs.github.io/2023/35-caret.html
161 | 2023-12-03T22:32:35.010Z
162 |
163 |
164 | http://datasciencelabs.github.io/2023/36-algorithms.html
165 | 2023-12-03T22:32:35.026Z
166 |
167 |
168 |
--------------------------------------------------------------------------------
/project-ideas.md:
--------------------------------------------------------------------------------
1 | ## Project Ideas
2 |
3 | | Project | Data | References |
4 | |---------------------|--------------------------|-------------------------|
5 | | Analyze data from [this](https://www.thecrimson.com/article/2023/6/23/alleged-data-fraud-gino/) controversy and write your take on it. | [Data Colada](https://datacolada.org/98) | [Crimson](https://www.thecrimson.com/article/2023/6/23/alleged-data-fraud-gino/), [NYT](https://www.nytimes.com/2023/09/30/business/the-harvard-professor-and-the-bloggers.html) |
6 | | Which counties did worse during COVID pandemic? Did it vary by variant? What predicted bad outcomes? | [CDC](https://data.cdc.gov/NCHS/Provisional-COVID-19-Deaths-by-County-and-Race-and/k8wy-p9cg) | |
7 | | Write a shiny app that predicts when Walden Pond will close. | [Twitter feed](https://twitter.com/Waldenpanos) | |
8 | | Cluster books based on sentiment analysis. | [Project Gutenberg](https://www.gutenberg.org/) | |
9 | | Are there batch effects in the early microarray papers. | [Stanford web site](https://web.archive.org/web/20090622110027/http://genome-www.stanford.edu/cellcycle/data/rawdata), [Kaggle](https://www.kaggle.com/datasets/crawford/gene-expression) | [Spellman et al.](https://pubmed.ncbi.nlm.nih.gov/9843569), [Golub et al.](https://pubmed.ncbi.nlm.nih.gov/10521349/) |
10 | | Are there regional effects on excess deaths during oxycontin epidemic? | [CDC](https://www.cdc.gov/nchs/nvss/deaths.htm) | |
11 | | Is crime rising in cities? What kinds of crimes? Which cities? | | |
12 | | What are the US News college rankings about? Build your own ranking and compare it to US News. | [College Score Card](https://collegescorecard.ed.gov/data/) | [US News Best Colleges](https://www.usnews.com/best-colleges) |
13 | | How has productivity changed by country over the years? Are there characteristics that could make countries less productive? | [Long Term Productivity Data](http://longtermproductivity.com/download.html) | |
14 | | What is the best energy source? Which one is the most consumed and how clean is it? How does a country's GDP influences energy sources usage? | [energy-data](https://github.com/owid/energy-data) | |
15 | | Is an art piece's background (culture, country, etc.) relevant to the piece's importance to the museum? | [Met Museum](https://metmuseum.github.io/) | |
16 | | Is the number of guns a predictor of fatalities in a shooting? Exploring gun violence in the USA | [gun-violence-data](https://github.com/jamesqo/gun-violence-data) | |
17 |
--------------------------------------------------------------------------------
/index.qmd:
--------------------------------------------------------------------------------
1 | # Preface {.unnumbered}
2 |
3 | * These are the class notes for BST 260 Introduction to Data Science.
4 | * Schedule is subject to change.
5 | * The GitHub repository is
6 | * These notes are generated with a Quarto Book.
7 | * Class notes will be updated regularly with material covered during class.
8 | * New material is added approximately on a weekly basis.
9 | * Questions for the midterm will be drawn from the exercises sections at the end of each lecture.
10 |
11 | # Instructor
12 |
13 | * [Rafael A. Irizarry](http://rafalab.github.io)
14 | * [http://rafalab.github.io](http://rafalab.github.io)
15 |
16 | # Text books
17 |
18 | * [Introduction to Data Science](https://rafalab.github.io/dsbook-part-1/), Data Wrangling and
19 | Visualization with R.
20 | * [Advanced Data Science](https://rafalab.github.io/dsbook-part-2/), Statistics and Prediction Algorithms Through Case Studies.
21 |
22 |
23 | ## Downloading course materials using Git
24 |
25 | You can download the quarto files used to create the course notes using Git. You can update files using `git pull` but **you will not be able to change the course notes on the main repository**. This means that if you edit the files and then try to update then using `git pull` you will encounter conflicts. For this reason
26 | recommend that you **make a copy before editing files**. We have edited the `.gitignore` file so that if you add the word `notes` to your filenames, git will not track the files. So we recommend that you before editing you make a copy of the file and _notes_ to the filename. For example `01-unix.qmd` to `01-unix-notes.qmd`.
27 |
28 |
29 | You can download the files using `git clone` like this:
30 |
31 | 1. Open a terminal and navigate to the directory you want to keep these notes in.
32 | 2. Type `git clone https://github.com/datasciencelabs/2023.git`
33 |
34 | or using RStudio like this:
35 |
36 | 1. Got to
37 | 2. Click on the green "Clone or Download" on Github and copy the link.
38 | 3. Open RStudio, and go to File > New Project > Version Control > Git,
39 | and paste in the link you just copied. Under "Create Project as
40 | Sub-directory of", browse and select a folder where you want the course
41 | materials to go.
42 | 4. Press "Create Project". This will create a folder called `2023`
43 | in the folder you selected in step 3.
44 | 5. Now, you can open this project using the projects tab in the upper
45 | right of RStudio, or going to File > Open Project and then navigating
46 | to the 2023 folder and opening the `.Rproj` file.
47 |
48 | Once you cloned the course repository and want to get updates, you must
49 | use `git pull` to get updates. You can do this in the terminal or on the RStudio's **Git** pane.
50 |
51 | ### Associating an existing directory
52 |
53 | **If you already cloned the repository outside of RStudio**, you can associate the directory that was created in that
54 | step with RStudio. In RStudio, go to File > New Project > Existing Directory, and then navigate / click on the 2023 folder. Then click
55 | "Create Project". Then you can follow step 5 above to open the project
56 | when you launch RStudio.
57 |
58 | ### Forking the repository
59 |
60 | An alternative **more advanced** way to cloning the directory is creating a _fork_.
61 | Forking a repository on GitHub allows you to create a copy of a project under your own GitHub account. This lets you make changes without affecting the original repository. Here's how you can fork a repository on GitHub:
62 |
63 | 1. **Log In to GitHub**:
64 | - Make sure you are logged in to your GitHub account.
65 |
66 | 2. **Navigate to the Repository**:
67 | - Go to the main page of the repository you want to fork:
68 |
69 | 3. **Click the 'Fork' Button**:
70 | - In the top-right corner of the repository's page, you'll find the "Fork" button. Click on it.
71 |
72 | 4. **Choose an Account**:
73 | - If you are a member of any organizations, GitHub will ask you where you'd like to fork the repository. Choose your personal account unless you want to fork it to an organization.
74 |
75 | 5. **Wait for the Forking Process to Complete**:
76 | - GitHub will then create a copy of the repository in your account. You'll see an animation indicating the process, and once it's done, you'll be redirected to the forked repository under your account.
77 |
78 | 6. **Clone Your Forked Repository**:
79 | - To work with the forked repository on your local machine, you can clone it. Navigate to the main page of your forked repo, click on the green "Code" button, copy the URL, and then use the following command in your terminal or command prompt:
80 | ```
81 | git clone [URL_you_copied]
82 | ```
83 |
84 | You can continue to update the forked repository by doing the following:
85 |
86 | 1. **Navigate to Your Local Repository**:
87 | - Open a terminal or command prompt.
88 | - Navigate to the directory where you have your forked repository.
89 |
90 | 2. **Add the Original Repository as an Upstream Remote**:
91 | - Use the following command to add the original repository as an upstream remote:
92 | ```bash
93 | git remote add upstream [URL_of_original_repository]
94 | ```
95 | - For example, if the original repository's URL is `https://github.com/original-owner/original-repo.git`, the command would be:
96 | ```bash
97 | git remote add upstream https://github.com/original-owner/original-repo.git
98 | ```
99 |
100 | 3. **Fetch Changes from the Upstream**:
101 | - Use the following command to fetch changes from the upstream:
102 | ```bash
103 | git fetch upstream
104 | ```
105 |
106 | 4. **Merge Changes into Your Local Branch**:
107 | - First, ensure you are on the branch into which you want to merge the upstream changes, typically the `main` or `master` branch:
108 | ```bash
109 | git checkout main
110 | ```
111 | - Then, merge the changes from the upstream's `main` or `master` branch:
112 | ```bash
113 | git merge upstream/main
114 | ```
115 |
116 | 5. **Push Changes to Your Forked Repository on GitHub (if needed)**:
117 | - If you want these changes to reflect in your GitHub fork, push them:
118 | ```bash
119 | git push origin main
120 | ```
121 |
122 | Now your fork is synchronized with the original repository. Whenever you want to pull in new changes from the original repository in the future, you just need to repeat steps 3-5.
123 |
124 | **To avoid conflicts you sill want to avoid editing the course notes files and instead make copies.**
125 |
126 |
127 |
128 |
--------------------------------------------------------------------------------
/01-quarto.qmd:
--------------------------------------------------------------------------------
1 | # Quarto
2 |
3 | Your task is to produce a report in PDF that solves the quadratic equations $ax^2+bx+c=0$ for $a=1, b=-1, c=-2$ and shows a plot of the function to confirm the finding.
4 |
5 | But after you are done, I will discover I made a mistake and ask you to rewrite the report with $a=1, b=3, c=-2$ (or any number).
6 |
7 | Then once you are done, I will like the report so much I will ask you to make an html page displaying the result and showing and explaining the code you used.
8 |
9 | We will do all this using R, RStudio, Quarto, and knitr.
10 |
11 | ## R and RStudio
12 |
13 | Before introducing Quarto we need R installed. We highly recommend using RStudio as an IDE for this course. We will be using it in lectures.
14 |
15 | ### Installation
16 |
17 | - [Install the latest version (4.3.1) of R](https://cloud.r-project.org/)
18 | - [Install RStudio](https://posit.co/download/rstudio-desktop/)
19 |
20 | 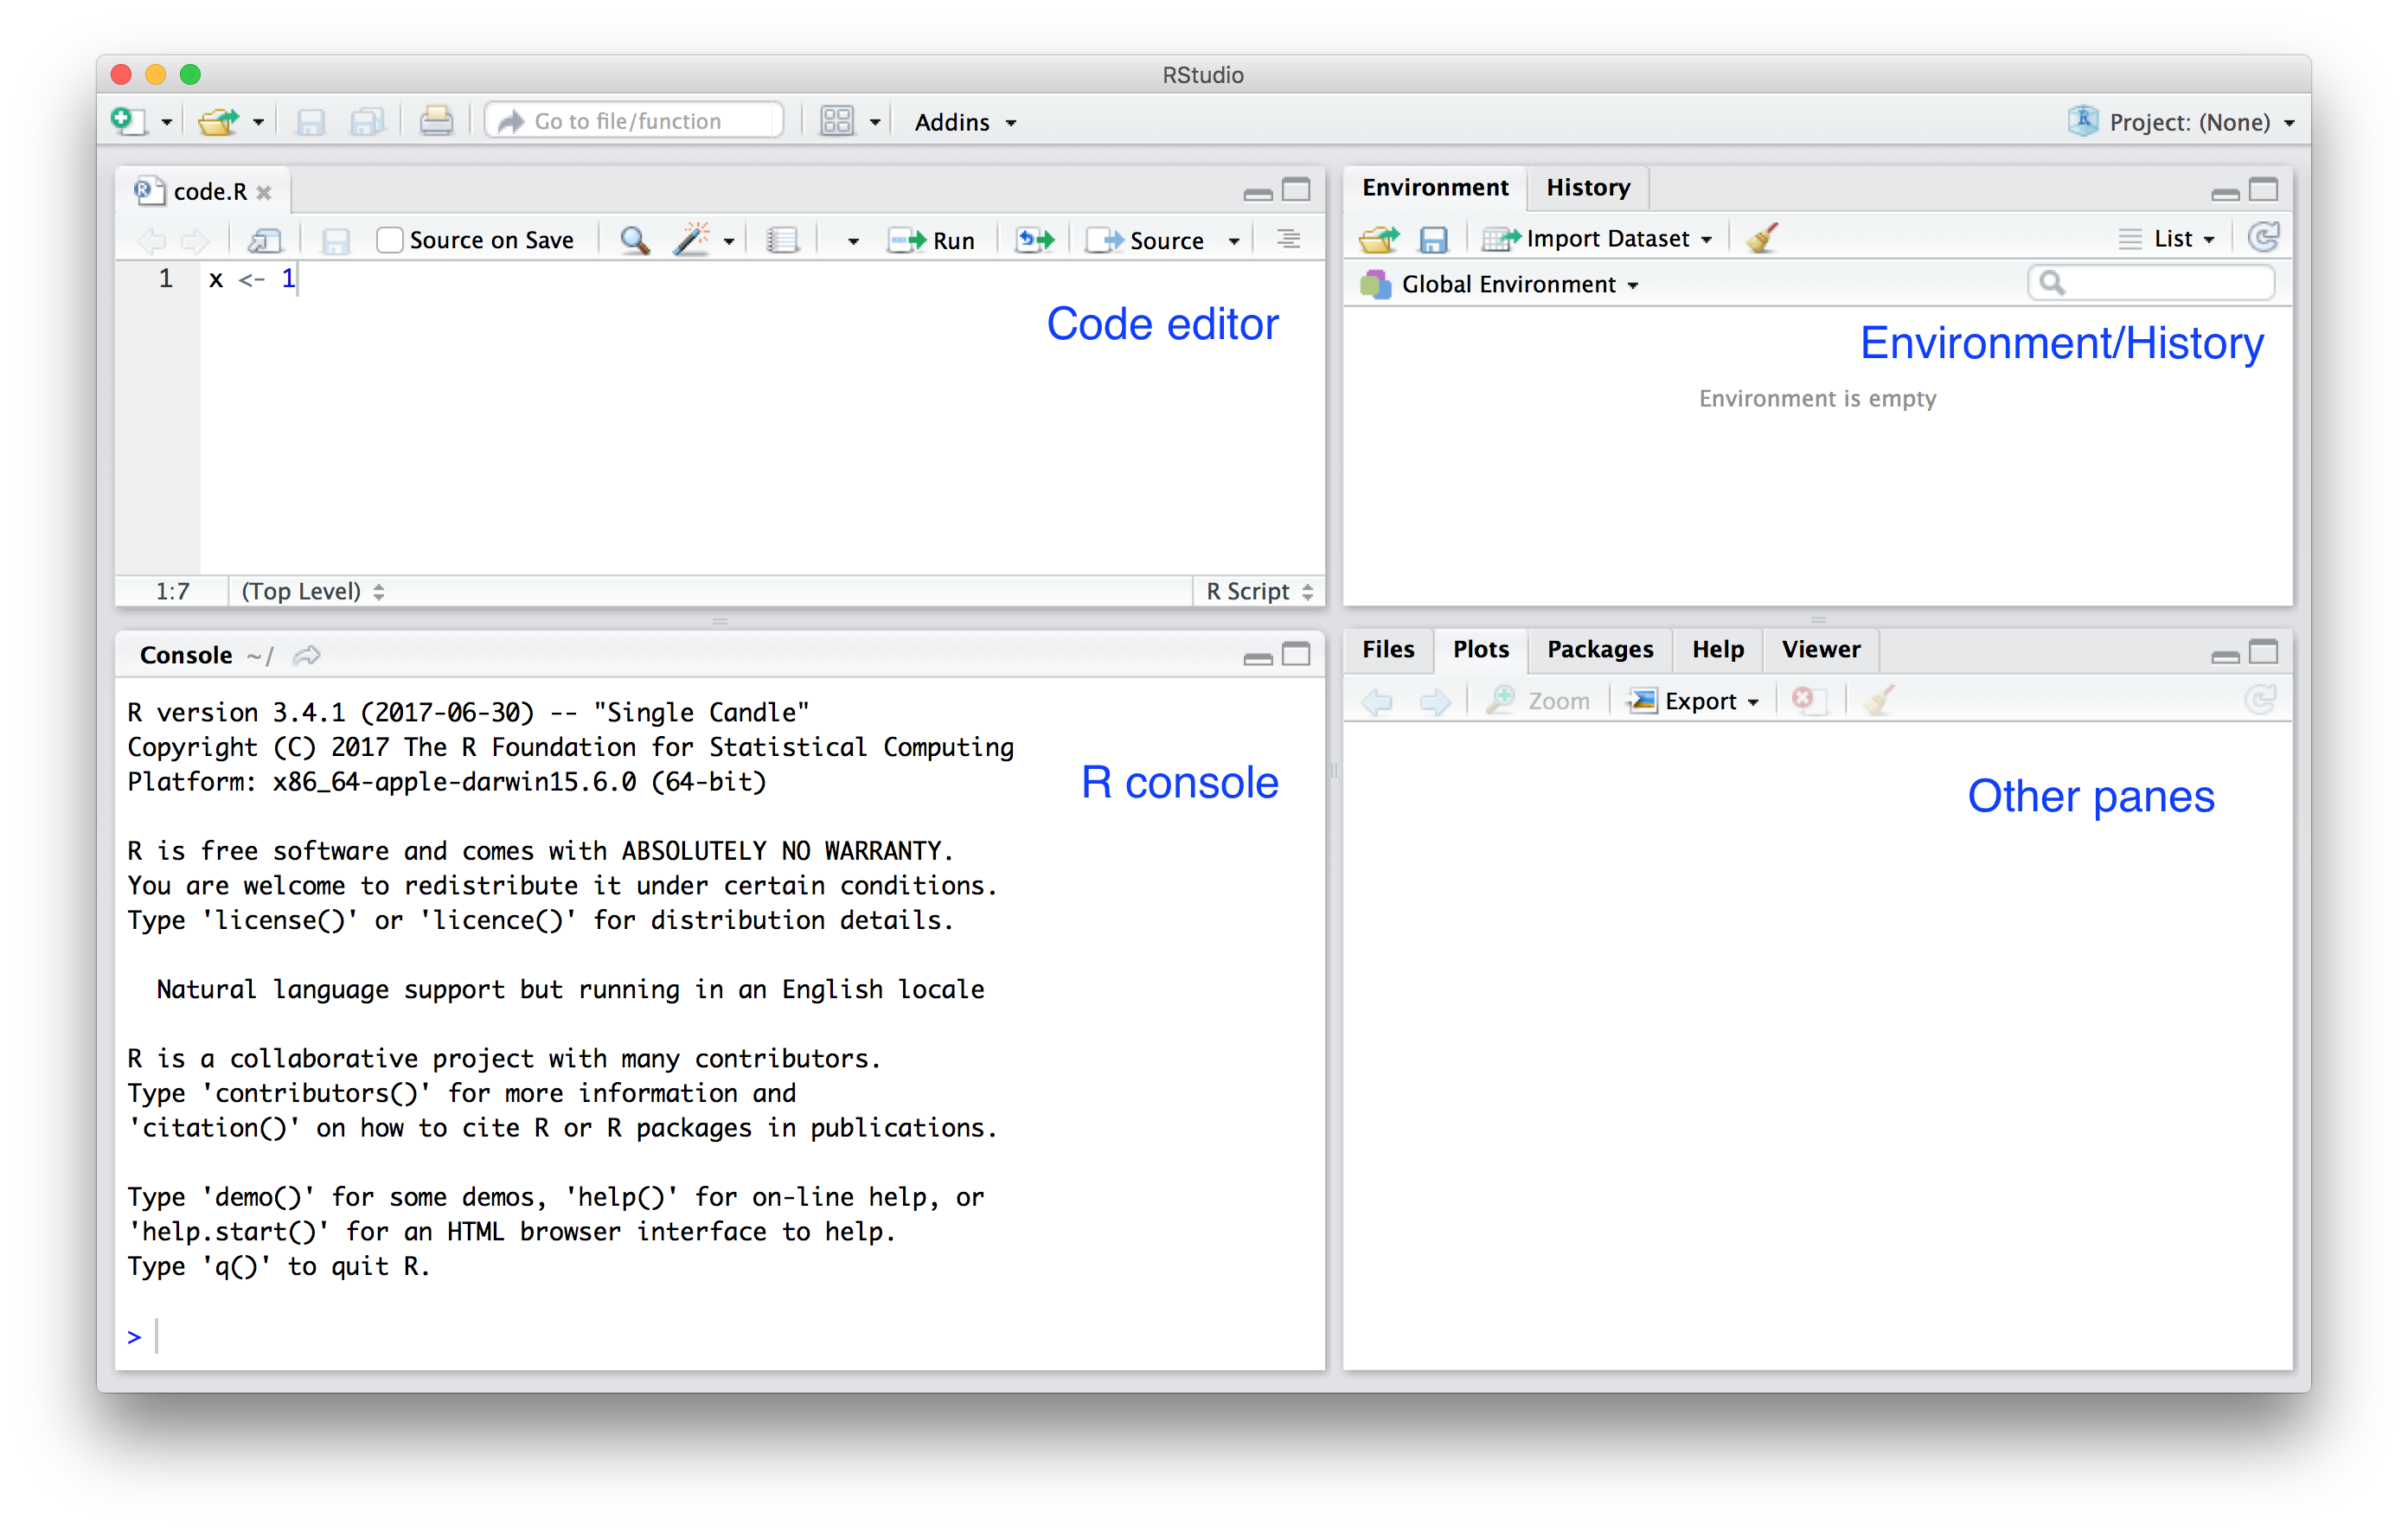
21 |
22 | ### Basics
23 |
24 | Let's try a few things together:
25 |
26 | * Open a new R script file
27 | * Learn tab complete
28 | * Run commands while editing scripts
29 | * Run the entire script
30 | * Make a plot
31 | * Change options to never save workspace.
32 |
33 | ### Projects
34 |
35 | * Start new project in exciting directory.
36 | * Start new project in new directory.
37 | * Change projects.
38 |
39 |
40 | ## Markdown
41 |
42 | Start a new Quarto.
43 |
44 | ### Type of editor
45 |
46 | * Source - See the actual code (WYSIWYG).
47 | * Visual - Partial preview of final document.
48 |
49 | ### The header
50 |
51 | At the top you see:
52 |
53 | ```
54 | ---
55 | title: "Untitled"
56 | ---
57 | ```
58 |
59 | The things between the `---` is the *YAML* header.
60 |
61 | You will see it used throughout the [Quarto guide](https://quarto.org/docs/guide/).
62 |
63 | ### Text formating
64 |
65 | *italics*, **bold**, ***bold italics***
66 |
67 | ~strikethrough~
68 |
69 | `code`
70 |
71 | ### Headings
72 |
73 | `# Header 1`
74 |
75 | `## Header 2`
76 |
77 | `### Header 3`
78 |
79 | and so on
80 |
81 | ### Links
82 |
83 | Just the link:
169 | - The knitR book: