├── tests
├── __init__.py
└── dataIdentification_test.py
├── VizKG
├── __init__.py
├── utils
│ ├── __init__.py
│ ├── chartdict.py
│ └── util.py
├── charts
│ ├── __init__.py
│ ├── table.py
│ ├── piechart.py
│ ├── donutchart.py
│ ├── treemap.py
│ ├── sunburstchart.py
│ ├── scatterchart.py
│ ├── histogram.py
│ ├── areachart.py
│ ├── boxplot.py
│ ├── violinplot.py
│ ├── densityplot.py
│ ├── linechart.py
│ ├── heatmap.py
│ ├── radarchart.py
│ ├── tree.py
│ ├── map.py
│ ├── timeline.py
│ ├── imagegrid.py
│ ├── stackedareachart.py
│ ├── wordcloud.py
│ ├── dimensions.py
│ ├── barchart.py
│ ├── chart.py
│ ├── graph.py
│ └── bubblechart.py
└── visualize.py
├── .gitignore
├── images
├── VizKG-DBpedia-Map of Temple in Indonesia.png
├── VizKG-Wikidata_COVID-19 Vaccine's origin.png
├── VizKG-Budaya KB_Number of temple in Indonesia.png
├── VizKG-OU_OU Number of employees based on job title.png
└── VizKG-Wikidata_ Covid19 Recoveries, Cases, and Death Growth.png
├── requirements.txt
├── LICENSE
├── setup.py
├── .github
└── workflows
│ └── publish-to-pypi.yml
└── README.md
/tests/__init__.py:
--------------------------------------------------------------------------------
1 |
--------------------------------------------------------------------------------
/VizKG/__init__.py:
--------------------------------------------------------------------------------
1 | from .visualize import *
--------------------------------------------------------------------------------
/.gitignore:
--------------------------------------------------------------------------------
1 | .vscode
2 | venv
3 | build/
4 | dist/
5 | VizKG.egg-info/
--------------------------------------------------------------------------------
/VizKG/utils/__init__.py:
--------------------------------------------------------------------------------
1 | from .util import *
2 | from .chartdict import chartdict
3 |
--------------------------------------------------------------------------------
/images/VizKG-DBpedia-Map of Temple in Indonesia.png:
--------------------------------------------------------------------------------
https://raw.githubusercontent.com/fadirra/vizkg/HEAD/images/VizKG-DBpedia-Map of Temple in Indonesia.png
--------------------------------------------------------------------------------
/images/VizKG-Wikidata_COVID-19 Vaccine's origin.png:
--------------------------------------------------------------------------------
https://raw.githubusercontent.com/fadirra/vizkg/HEAD/images/VizKG-Wikidata_COVID-19 Vaccine's origin.png
--------------------------------------------------------------------------------
/images/VizKG-Budaya KB_Number of temple in Indonesia.png:
--------------------------------------------------------------------------------
https://raw.githubusercontent.com/fadirra/vizkg/HEAD/images/VizKG-Budaya KB_Number of temple in Indonesia.png
--------------------------------------------------------------------------------
/images/VizKG-OU_OU Number of employees based on job title.png:
--------------------------------------------------------------------------------
https://raw.githubusercontent.com/fadirra/vizkg/HEAD/images/VizKG-OU_OU Number of employees based on job title.png
--------------------------------------------------------------------------------
/requirements.txt:
--------------------------------------------------------------------------------
1 | pandas >= 1.0.1
2 | SPARQLWrapper
3 | matplotlib
4 | seaborn
5 | imageio
6 | plotly==4.14.3
7 | networkx
8 | folium
9 | anytree
10 | wordcloud
11 | IPython
--------------------------------------------------------------------------------
/images/VizKG-Wikidata_ Covid19 Recoveries, Cases, and Death Growth.png:
--------------------------------------------------------------------------------
https://raw.githubusercontent.com/fadirra/vizkg/HEAD/images/VizKG-Wikidata_ Covid19 Recoveries, Cases, and Death Growth.png
--------------------------------------------------------------------------------
/VizKG/utils/chartdict.py:
--------------------------------------------------------------------------------
1 | from VizKG.charts import *
2 | """
3 | Dictionary of visualization charts
4 | """
5 | chartdict = {
6 | 'imagegrid': ImageGrid,
7 | 'timeline': Timeline,
8 | 'graph': Graph,
9 | 'dimensions': Dimensions,
10 | 'map': Map,
11 | 'tree': Tree,
12 | 'wordcloud': WordCloud,
13 | 'linechart': LineChart,
14 | 'barchart': BarChart,
15 | 'histogram': Histogram,
16 | 'densityplot': DensityPlot,
17 | 'treemap': TreeMap,
18 | 'sunburstchart': SunBurstChart,
19 | 'heatmap': HeatMap,
20 | 'piechart': PieChart,
21 | 'donutchart': DonutChart,
22 | 'boxplot': BoxPlot,
23 | 'violinplot': ViolinPlot,
24 | 'areachart': AreaChart,
25 | 'stackedareachart': StackedAreaChart,
26 | 'scatterchart': ScatterChart,
27 | 'bubblechart': BubbleChart,
28 | 'table': Table,
29 | 'radarchart': RadarChart
30 | }
--------------------------------------------------------------------------------
/VizKG/charts/__init__.py:
--------------------------------------------------------------------------------
1 | from .chart import Chart
2 | from .bubblechart import BubbleChart
3 | from .wordcloud import WordCloud
4 | from .tree import Tree
5 | from .graph import Graph
6 | from .map import Map
7 | from .table import Table
8 | from .imagegrid import ImageGrid
9 | from .dimensions import Dimensions
10 | from .timeline import Timeline
11 | from .scatterchart import ScatterChart
12 | from .heatmap import HeatMap
13 | from .histogram import Histogram
14 | from .densityplot import DensityPlot
15 | from .boxplot import BoxPlot
16 | from .violinplot import ViolinPlot
17 | from .donutchart import DonutChart
18 | from .piechart import PieChart
19 | from .sunburstchart import SunBurstChart
20 | from .treemap import TreeMap
21 | from .barchart import BarChart
22 | from .linechart import LineChart
23 | from .areachart import AreaChart
24 | from .stackedareachart import StackedAreaChart
25 | from .radarchart import RadarChart
--------------------------------------------------------------------------------
/LICENSE:
--------------------------------------------------------------------------------
1 | MIT License
2 |
3 | Copyright (c) 2021 Hana Raissya, Fariz Darari, Fajar Juang Ekaputra
4 |
5 | Permission is hereby granted, free of charge, to any person obtaining a copy
6 | of this software and associated documentation files (the "Software"), to deal
7 | in the Software without restriction, including without limitation the rights
8 | to use, copy, modify, merge, publish, distribute, sublicense, and/or sell
9 | copies of the Software, and to permit persons to whom the Software is
10 | furnished to do so, subject to the following conditions:
11 |
12 | The above copyright notice and this permission notice shall be included in all
13 | copies or substantial portions of the Software.
14 |
15 | THE SOFTWARE IS PROVIDED "AS IS", WITHOUT WARRANTY OF ANY KIND, EXPRESS OR
16 | IMPLIED, INCLUDING BUT NOT LIMITED TO THE WARRANTIES OF MERCHANTABILITY,
17 | FITNESS FOR A PARTICULAR PURPOSE AND NONINFRINGEMENT. IN NO EVENT SHALL THE
18 | AUTHORS OR COPYRIGHT HOLDERS BE LIABLE FOR ANY CLAIM, DAMAGES OR OTHER
19 | LIABILITY, WHETHER IN AN ACTION OF CONTRACT, TORT OR OTHERWISE, ARISING FROM,
20 | OUT OF OR IN CONNECTION WITH THE SOFTWARE OR THE USE OR OTHER DEALINGS IN THE
21 | SOFTWARE.
22 |
--------------------------------------------------------------------------------
/VizKG/charts/table.py:
--------------------------------------------------------------------------------
1 | from .chart import Chart
2 | import plotly.figure_factory as ff
3 | from IPython.display import display
4 | import pandas as pd
5 |
6 | class Table(Chart):
7 | def __init__(self, dataframe, kwargs):
8 | """
9 | Constructs all the necessary attributes for the Table object
10 |
11 | Parameters:
12 | dataframe (pandas.Dataframe): The dataframe
13 | """
14 | Chart.__init__(self, dataframe, kwargs)
15 |
16 | def promote_to_candidate(self):
17 |
18 | is_promote = len(self.dataframe) > 0
19 |
20 | return is_promote
21 |
22 | def plot(self):
23 | """
24 | Generate visualization
25 | """
26 | if self.promote_to_candidate():
27 | self.draw()
28 | else:
29 | pass
30 |
31 | def draw(self):
32 | """
33 | Generate table visualization
34 | """
35 | if len(self.dataframe) > 1000 :
36 | fig = ff.create_table(self.dataframe)
37 | fig.show()
38 | else:
39 | with pd.option_context('display.max_rows', None, 'display.max_columns', None):
40 | display(self.dataframe)
--------------------------------------------------------------------------------
/setup.py:
--------------------------------------------------------------------------------
1 | import codecs
2 | import os
3 | import re
4 | from setuptools import find_packages, setup
5 |
6 | def local_file(file):
7 | return codecs.open(
8 | os.path.join(os.path.dirname(__file__), file), 'r', 'utf-8'
9 | )
10 |
11 | install_reqs = [
12 | line.strip()
13 | for line in local_file('requirements.txt').readlines()
14 | if line.strip() != ''
15 | ]
16 |
17 | # Get the long description from the README file
18 | with open(os.path.join(os.path.dirname(__file__), 'README.md'), encoding='utf-8') as f:
19 | long_description = f.read()
20 |
21 | setup(
22 | name='VizKG',
23 | packages=['VizKG', 'VizKG.charts', 'VizKG.utils'],
24 | version='1.0.9',
25 | description='Visualization library for SPARQL query results',
26 | long_description=long_description,
27 | long_description_content_type="text/markdown",
28 | project_urls = {
29 | "Source Code": "https://github.com/fadirra/vizkg",
30 | "Demo" : "https://www.youtube.com/watch?v=i0dd_-PRxlI"
31 | },
32 | author='Hana',
33 | install_requires=install_reqs,
34 | license='MIT',
35 | classifiers=[
36 | "Programming Language :: Python :: 3",
37 | "License :: OSI Approved :: MIT License",
38 | "Operating System :: OS Independent"
39 | ],
40 | python_requires='>=3.7'
41 | )
--------------------------------------------------------------------------------
/.github/workflows/publish-to-pypi.yml:
--------------------------------------------------------------------------------
1 | name: Publish Python Package to PyPI and TestPyPI
2 |
3 | on: push
4 |
5 | jobs:
6 | build-n-publish:
7 | name: Build and Publish Python Package
8 | runs-on: ubuntu-18.04
9 |
10 | steps:
11 | - uses: actions/checkout@master
12 | - name: Set up Python 3.7
13 | uses: actions/setup-python@v1
14 | with:
15 | python-version: 3.7
16 |
17 | - name: Install pypa/build
18 | run: >-
19 | python -m
20 | pip install
21 | build
22 | --user
23 |
24 | - name: Build a binary wheel and a source tarball
25 | run: >-
26 | python -m
27 | build
28 | --sdist
29 | --wheel
30 | --outdir dist/
31 |
32 | - name: Install requirements
33 | run: >-
34 | python -m
35 | pip install -r
36 | requirements.txt
37 |
38 | - name: Test unittest
39 | run: >-
40 | python -m
41 | unittest
42 | tests/dataIdentification_test.py
43 |
44 | # - name: Publish distribution to Test PyPI
45 | # if: github.ref == 'refs/heads/main'
46 | # uses: pypa/gh-action-pypi-publish@main
47 | # with:
48 | # password: ${{ secrets.TEST_PYPI_API_TOKEN }}
49 | # repository_url: https://test.pypi.org/legacy/
50 |
51 | # - name: Publish distribution to PyPI
52 | # if: github.ref == 'refs/heads/main'
53 | # uses: pypa/gh-action-pypi-publish@main
54 | # with:
55 | # password: ${{ secrets.PYPI_API_TOKEN }}
--------------------------------------------------------------------------------
/VizKG/charts/piechart.py:
--------------------------------------------------------------------------------
1 | from .chart import Chart
2 | import plotly.express as px
3 |
4 | class PieChart(Chart):
5 | def __init__(self, dataframe, kwargs):
6 | """
7 | Constructs all the necessary attributes for the PieChart object
8 |
9 | Parameters:
10 | dataframe (pandas.Dataframe): The dataframe
11 | """
12 | Chart.__init__(self, dataframe, kwargs)
13 |
14 | def promote_to_candidate(self):
15 |
16 | is_promote = self._is_var_exist(self._label_column, 1) and self._is_var_exist(self._numerical_column, 1)
17 |
18 | return is_promote
19 |
20 | def plot(self):
21 | """
22 | Generate visualization
23 | """
24 | if self.promote_to_candidate():
25 | self.draw()
26 | else:
27 | pass
28 |
29 | def _check_requirements(self):
30 | """
31 | Check the requirements for generating PieChart visualization
32 |
33 | Returns:
34 | (string) label_name: label name
35 | (list) numerical_var: numerical var
36 | """
37 | label_name = None
38 | numerical_var = None
39 |
40 | if self._is_var_exist(self._numerical_column, 1):
41 | numerical_var = self._numerical_column[0]
42 | if self._is_var_exist(self._label_column, 1):
43 | label_name = self._label_column[0]
44 |
45 |
46 | return label_name, numerical_var
47 |
48 | def draw(self):
49 | """
50 | Generate PieChart visualization
51 | """
52 | label_name, numerical_var = self._check_requirements()
53 |
54 | if label_name is not None and numerical_var is not None:
55 | fig = px.pie(self.dataframe, values=numerical_var, names=label_name)
56 | fig.show()
57 |
58 |
--------------------------------------------------------------------------------
/VizKG/charts/donutchart.py:
--------------------------------------------------------------------------------
1 | from .chart import Chart
2 | import plotly.express as px
3 |
4 | class DonutChart(Chart):
5 | def __init__(self, dataframe, kwargs):
6 | """
7 | Constructs all the necessary attributes for the DonutChart object
8 |
9 | Parameters:
10 | dataframe (pandas.Dataframe): The dataframe
11 | """
12 | Chart.__init__(self, dataframe, kwargs)
13 |
14 | def promote_to_candidate(self):
15 |
16 | is_promote = self._is_var_exist(self._label_column, 1) and self._is_var_exist(self._numerical_column, 1)
17 |
18 | return is_promote
19 |
20 | def plot(self):
21 | """
22 | Generate visualization
23 | """
24 | if self.promote_to_candidate():
25 | self.draw()
26 | else:
27 | pass
28 |
29 | def _check_requirements(self):
30 | """
31 | Check the requirements for generating DonutChart visualization
32 |
33 | Returns:
34 | (string) label_name: label name
35 | (list) numerical_var: numerical var
36 | """
37 | label_name = None
38 | numerical_var = None
39 |
40 | if self._is_var_exist(self._numerical_column, 1):
41 | numerical_var = self._numerical_column[0]
42 | if self._is_var_exist(self._label_column, 1):
43 | label_name = self._label_column[0]
44 |
45 |
46 | return label_name, numerical_var
47 |
48 | def draw(self):
49 | """
50 | Generate PieChart visualization
51 | """
52 | label_name, numerical_var = self._check_requirements()
53 |
54 | if label_name is not None and numerical_var is not None:
55 | fig = px.pie(self.dataframe, values=numerical_var, names=label_name, hole=0.3)
56 | fig.show()
57 |
--------------------------------------------------------------------------------
/VizKG/charts/treemap.py:
--------------------------------------------------------------------------------
1 | from .chart import Chart
2 | import plotly.express as px
3 |
4 | class TreeMap(Chart):
5 | def __init__(self, dataframe, kwargs):
6 | """
7 | Constructs all the necessary attributes for the TreeMap object
8 |
9 | Parameters:
10 | dataframe (pandas.Dataframe): The dataframe
11 | """
12 | Chart.__init__(self, dataframe, kwargs)
13 |
14 | def promote_to_candidate(self):
15 |
16 | is_promote = self._is_var_exist(self._label_column, 1)
17 |
18 | return is_promote
19 |
20 | def plot(self):
21 | """
22 | Generate visualization
23 | """
24 | if self.promote_to_candidate():
25 | self.draw()
26 | else:
27 | pass
28 |
29 | def _check_requirements(self):
30 | """
31 | Check the requirements for generating TreeMap visualization
32 |
33 | Returns:
34 | (list) label_column: label name
35 | (list) numerical_var: numerical variable
36 | """
37 | label_column = None
38 | numerical_var = None
39 |
40 | if self._is_var_exist(self._label_column, 1):
41 | label_column = self._label_column
42 | if self._is_var_exist(self._numerical_column):
43 | numerical_var = self._numerical_column[0]
44 |
45 |
46 | return label_column, numerical_var
47 |
48 | def draw(self):
49 | """
50 | Generate TreeMap visualization
51 | """
52 | label_column, numerical_var = self._check_requirements()
53 |
54 | if numerical_var is not None:
55 | fig = px.treemap(self.dataframe, values=numerical_var, path=label_column)
56 | fig.show()
57 | else:
58 | fig = px.treemap(self.dataframe, path=label_column)
59 | fig.show()
60 |
--------------------------------------------------------------------------------
/VizKG/charts/sunburstchart.py:
--------------------------------------------------------------------------------
1 | from .chart import Chart
2 | import plotly.express as px
3 |
4 | class SunBurstChart(Chart):
5 | def __init__(self, dataframe, kwargs):
6 | """
7 | Constructs all the necessary attributes for the SunBurstChart object
8 |
9 | Parameters:
10 | dataframe (pandas.Dataframe): The dataframe
11 | """
12 | Chart.__init__(self, dataframe, kwargs)
13 |
14 | def promote_to_candidate(self):
15 |
16 | is_promote = self._is_var_exist(self._label_column, 1)
17 |
18 | return is_promote
19 |
20 | def plot(self):
21 | """
22 | Generate visualization
23 | """
24 | if self.promote_to_candidate():
25 | self.draw()
26 | else:
27 | pass
28 |
29 | def _check_requirements(self):
30 | """
31 | Check the requirements for generating SunBurstChart visualization
32 |
33 | Returns:
34 | (list) label_column: label name
35 | (list) numerical_var: numerical variable
36 | """
37 | label_column = None
38 | numerical_var = None
39 |
40 | if self._is_var_exist(self._label_column, 1):
41 | label_column = self._label_column
42 | if self._is_var_exist(self._numerical_column):
43 | numerical_var = self._numerical_column[0]
44 |
45 |
46 | return label_column, numerical_var
47 |
48 | def draw(self):
49 | """
50 | Generate SunBurstChart visualization
51 | """
52 | label_column, numerical_var = self._check_requirements()
53 |
54 | if numerical_var is not None:
55 | #plot
56 | fig = px.sunburst(self.dataframe, values=numerical_var, path=label_column)
57 | fig.show()
58 | else:
59 | fig = px.sunburst(self.dataframe, path=label_column)
60 | fig.show()
61 |
62 |
--------------------------------------------------------------------------------
/VizKG/charts/scatterchart.py:
--------------------------------------------------------------------------------
1 | from .chart import Chart
2 | import plotly.express as px
3 |
4 | class ScatterChart(Chart):
5 | def __init__(self, dataframe, kwargs):
6 | """
7 | Constructs all the necessary attributes for the ScatterChart object
8 |
9 | Parameters:
10 | dataframe (pandas.Dataframe): The dataframe
11 | """
12 | Chart.__init__(self, dataframe, kwargs)
13 |
14 | def promote_to_candidate(self):
15 |
16 | is_promote = self._is_var_exist(self._numerical_column, 2)
17 |
18 | return is_promote
19 |
20 | def plot(self):
21 | """
22 | Generate visualization
23 | """
24 | if self.promote_to_candidate():
25 | self.draw()
26 | else:
27 | pass
28 |
29 | def _check_requirements(self):
30 | """
31 | Check the requirements for generating ScatterChart visualization
32 |
33 | Returns:
34 | (list) numerical_columns: list of numerical column
35 | (string) label_name: label name
36 | """
37 | numerical_columns = None
38 | label_name = None
39 |
40 | if self._is_var_exist(self._numerical_column, 2):
41 | numerical_columns = self._numerical_column
42 | if len(self._label_column) > 0:
43 | label_name = self._label_column[0]
44 |
45 | return numerical_columns, label_name
46 |
47 | def draw(self):
48 | """
49 | Generate ScatterChart visualization
50 | """
51 | numerical_columns, label_name = self._check_requirements()
52 |
53 | if numerical_columns is not None:
54 | x_label = numerical_columns[0]
55 | y_label = numerical_columns[1]
56 | if label_name is not None:
57 | fig = px.scatter(self.dataframe, x=x_label, y=y_label, color=label_name)
58 | fig.show()
59 | else:
60 | fig = px.scatter(self.dataframe, x=x_label, y=y_label)
61 | fig.show()
--------------------------------------------------------------------------------
/VizKG/charts/histogram.py:
--------------------------------------------------------------------------------
1 | from .chart import Chart
2 | import plotly.express as px
3 |
4 | class Histogram(Chart):
5 | def __init__(self, dataframe, kwargs):
6 | """
7 | Constructs all the necessary attributes for the Histogram object
8 |
9 | Parameters:
10 | dataframe (pandas.Dataframe): The dataframe
11 | """
12 | Chart.__init__(self, dataframe, kwargs)
13 |
14 | def promote_to_candidate(self):
15 |
16 | is_promote = self._is_var_exist(self._numerical_column, 1)
17 |
18 | return is_promote
19 |
20 | def plot(self):
21 | """
22 | Generate visualization
23 | """
24 | if self.promote_to_candidate():
25 | self.draw()
26 | else:
27 | pass
28 |
29 | def _check_requirements(self):
30 | """
31 | Check the requirements for generating Histogram visualization
32 |
33 | Returns:
34 | (string) numerical_label: label of numerical column
35 | (string) label_name: label name
36 | """
37 | numerical_label = None
38 | label_name = None
39 |
40 | if self._is_var_exist(self._numerical_column, 1):
41 | numerical_label = self._numerical_column[0]
42 | self._item_var, self._categorical_column = self._set_item_and_categorical()
43 | if len(self._categorical_column) > 0:
44 | label_name = self._categorical_column[0]
45 |
46 | return numerical_label, label_name
47 |
48 | def draw(self):
49 | """
50 | Generate Histogram visualization
51 | """
52 | numerical_label, label_name = self._check_requirements()
53 |
54 | if numerical_label is not None:
55 | if label_name is not None:
56 | #plot
57 | fig = px.histogram(self.dataframe, x=numerical_label, color=label_name, marginal="rug", hover_data=self.dataframe.columns)
58 | fig.show()
59 | else:
60 | #plot
61 | fig = px.histogram(self.dataframe, x=numerical_label, marginal="rug", hover_data=self.dataframe.columns)
62 | fig.show()
63 |
64 |
--------------------------------------------------------------------------------
/VizKG/charts/areachart.py:
--------------------------------------------------------------------------------
1 | from .chart import Chart
2 | import plotly.express as px
3 |
4 | class AreaChart(Chart):
5 | def __init__(self, dataframe, kwargs):
6 | """
7 | Constructs all the necessary attributes for the AreaChart object
8 |
9 | Parameters:
10 | dataframe (pandas.Dataframe): The dataframe
11 | """
12 | Chart.__init__(self, dataframe, kwargs)
13 |
14 | def promote_to_candidate(self):
15 |
16 | is_promote = self._is_var_exist(self._numerical_column, 1) and self._is_var_exist(self._date_column, 1)
17 |
18 | return is_promote
19 |
20 | def plot(self):
21 | """
22 | Generate visualization
23 | """
24 | if self.promote_to_candidate():
25 | self.draw()
26 | else:
27 | pass
28 |
29 | def _check_requirements(self):
30 | """
31 | Check the requirements for generating AreaChart visualization
32 |
33 | Returns:
34 | (string) date_label: date label for axis-x
35 | (string) int_label: numerical label for axis-y
36 | (string) label_name: label name
37 | """
38 | date_label = None
39 | int_label = None
40 | label_name = None
41 |
42 | if self._is_var_exist(self._date_column, 1):
43 | date_label = self._date_column[0]
44 | if self._is_var_exist(self._numerical_column, 1):
45 | int_label = self._numerical_column[0]
46 | if self._is_var_exist(self._label_column, 1):
47 | label_name = self._label_column[0]
48 |
49 | return date_label, int_label, label_name
50 |
51 | def draw(self):
52 | """
53 | Generate AreaChart visualization
54 | """
55 | date_label, numerical_label, label_name = self._check_requirements()
56 |
57 | if label_name is not None:
58 | #plot
59 | fig = px.area(self.dataframe, x=date_label, y=numerical_label, color=label_name, line_group=label_name)
60 | fig.show()
61 | else:
62 | fig = px.area(self.dataframe, x=date_label, y=numerical_label)
63 | fig.show()
64 |
65 |
--------------------------------------------------------------------------------
/VizKG/charts/boxplot.py:
--------------------------------------------------------------------------------
1 | from .chart import Chart
2 | import plotly.express as px
3 |
4 | class BoxPlot(Chart):
5 | def __init__(self, dataframe, kwargs):
6 | """
7 | Constructs all the necessary attributes for the BoxPlot object
8 |
9 | Parameters:
10 | dataframe (pandas.Dataframe): The dataframe
11 | """
12 | Chart.__init__(self, dataframe, kwargs)
13 |
14 | def promote_to_candidate(self):
15 |
16 | is_promote = self._is_var_exist(self._numerical_column, 1)
17 |
18 | return is_promote
19 |
20 | def plot(self):
21 | """
22 | Generate visualization
23 | """
24 | if self.promote_to_candidate():
25 | self.draw()
26 | else:
27 | pass
28 |
29 |
30 | def _check_requirements(self):
31 | """
32 | Check the requirements for generating BoxPlot visualization
33 |
34 | Returns:
35 | (string) numerical_label: label of numerical column
36 | (list) group_column: categorical column
37 | """
38 | numerical_label = None
39 | group_column = None
40 | item_col, categorical_col = self._set_item_and_categorical()
41 |
42 | if self._is_var_exist(self._numerical_column, 1):
43 | numerical_label = self._numerical_column[0]
44 | if self._is_var_exist(categorical_col, 1):
45 | group_column= categorical_col
46 |
47 | return numerical_label, group_column
48 |
49 | def draw(self):
50 | """
51 | Generate BoxPlot visualization
52 | """
53 | numerical_label, group_column = self._check_requirements()
54 |
55 | if numerical_label is not None and group_column is not None:
56 | if len(group_column) > 1:
57 | fig = px.box(self.dataframe, x=group_column[1], y=numerical_label, color=group_column[0])
58 | fig.show()
59 | else:
60 | fig = px.box(self.dataframe, x=group_column[0], y=numerical_label)
61 | fig.show()
62 | elif numerical_label is not None:
63 | fig = px.box(self.dataframe, y=numerical_label)
64 | fig.show()
65 | else:
66 | pass
--------------------------------------------------------------------------------
/VizKG/charts/violinplot.py:
--------------------------------------------------------------------------------
1 | from .chart import Chart
2 | import plotly.express as px
3 |
4 | class ViolinPlot(Chart):
5 | def __init__(self, dataframe, kwargs):
6 | """
7 | Constructs all the necessary attributes for the violinPlot object
8 |
9 | Parameters:
10 | dataframe (pandas.Dataframe): The dataframe
11 | """
12 | Chart.__init__(self, dataframe, kwargs)
13 |
14 | def promote_to_candidate(self):
15 |
16 | is_promote = self._is_var_exist(self._numerical_column, 1)
17 |
18 | return is_promote
19 |
20 | def plot(self):
21 | """
22 | Generate visualization
23 | """
24 | if self.promote_to_candidate():
25 | self.draw()
26 | else:
27 | pass
28 |
29 | def _check_requirements(self):
30 | """
31 | Check the requirements for generating violinPlot visualization
32 |
33 | Returns:
34 | (string) numerical_label: label of numerical column
35 | (list) group_column: categorical column
36 | """
37 | numerical_label = None
38 | group_column = None
39 | item_col, categorical_col = self._set_item_and_categorical()
40 |
41 | if self._is_var_exist(self._numerical_column, 1):
42 | numerical_label = self._numerical_column[0]
43 | if self._is_var_exist(categorical_col, 1):
44 | group_column= categorical_col
45 |
46 | return numerical_label, group_column
47 |
48 | def draw(self):
49 | """
50 | Generate violinPlot visualization
51 | """
52 | numerical_label, group_column = self._check_requirements()
53 |
54 | if numerical_label is not None and group_column is not None:
55 | if len(group_column) > 1:
56 | fig = px.violin(self.dataframe, x=group_column[1], y=numerical_label, color=group_column[0])
57 | fig.show()
58 | else:
59 | fig = px.violin(self.dataframe, x=group_column[0], y=numerical_label)
60 | fig.show()
61 | elif numerical_label is not None:
62 | fig = px.violin(self.dataframe, y=numerical_label)
63 | fig.show()
64 | else:
65 | pass
--------------------------------------------------------------------------------
/VizKG/charts/densityplot.py:
--------------------------------------------------------------------------------
1 | from .chart import Chart
2 | import seaborn as sns
3 |
4 | class DensityPlot(Chart):
5 | def __init__(self, dataframe, kwargs):
6 | """
7 | Constructs all the necessary attributes for the DensityPlot object
8 |
9 | Parameters:
10 | dataframe (pandas.Dataframe): The dataframe
11 | """
12 | Chart.__init__(self, dataframe, kwargs)
13 |
14 | def promote_to_candidate(self):
15 |
16 | is_promote = self._is_var_exist(self._numerical_column, 1)
17 |
18 | return is_promote
19 |
20 | def plot(self):
21 | """
22 | Generate visualization
23 | """
24 | if self.promote_to_candidate():
25 | self.draw()
26 | else:
27 | pass
28 |
29 | def _check_requirements(self):
30 | """
31 | Check the requirements for generating DensityPlot visualization
32 |
33 | Returns:
34 | (string) numerical_label: label of numerical column
35 | (string) label_name: label name
36 | """
37 | numerical_label = None
38 | label_name = None
39 |
40 | if self._is_var_exist(self._numerical_column, 1):
41 | numerical_label = self._numerical_column[0]
42 | self._item_var, self._categorical_column = self._set_item_and_categorical()
43 | if len(self._categorical_column) > 0:
44 | label_name = self._categorical_column[0]
45 |
46 | return numerical_label, label_name
47 |
48 | def filter_data(self):
49 |
50 | var_name = list(self.dataframe.columns)
51 | data = self.dataframe.copy()
52 |
53 | if len(self._date_column) > 0:
54 | filter_date_column = list(set(var_name) - set(self._date_column))
55 | data = data.filter(items=filter_date_column)
56 | else:
57 | pass
58 |
59 | return data
60 |
61 | def draw(self):
62 |
63 | numerical_label, label_name = self._check_requirements()
64 |
65 | if label_name is not None:
66 | sns.displot(data=self.dataframe, x=numerical_label, hue=label_name, kind="kde")
67 | pass
68 | else:
69 | sns.displot(data=self.dataframe, x=numerical_label, kind="kde")
70 | pass
71 |
72 |
73 |
74 |
75 |
76 |
--------------------------------------------------------------------------------
/VizKG/charts/linechart.py:
--------------------------------------------------------------------------------
1 | from .chart import Chart
2 | import plotly.express as px
3 |
4 | class LineChart(Chart):
5 | def __init__(self, dataframe, kwargs):
6 | """
7 | Constructs all the necessary attributes for the LineChart object
8 |
9 | Parameters:
10 | dataframe (pandas.Dataframe): The dataframe
11 | """
12 | Chart.__init__(self, dataframe, kwargs)
13 |
14 | def promote_to_candidate(self):
15 |
16 | is_promote = self._is_var_exist(self._numerical_column, 1) and self._is_var_exist(self._date_column, 1)
17 |
18 | return is_promote
19 |
20 | def plot(self):
21 | """
22 | Generate visualization
23 | """
24 | if self.promote_to_candidate():
25 | self.draw()
26 | else:
27 | pass
28 |
29 | def _check_requirements(self):
30 | """
31 | Check the requirements for generating LineChart visualization
32 |
33 | Returns:
34 | (string) date_label: date label for axis-x
35 | (string) int_label: numerical label for axis-y
36 | (string) label_name: label for hue
37 | """
38 | date_label = None
39 | int_label = None
40 | label_name = None
41 |
42 | if self._is_var_exist(self._date_column, 1):
43 | date_label = self._date_column[0]
44 | if self._is_var_exist(self._numerical_column, 1):
45 | int_label = self._numerical_column[0]
46 | if len(self._label_column) > 0:
47 | label_name = self._label_column[0]
48 |
49 | return date_label, int_label, label_name
50 |
51 | def draw(self):
52 | """
53 | Generate LineChart visualization
54 | """
55 | date_label, numerical_label, label_name = self._check_requirements()
56 |
57 | if date_label is not None and numerical_label is not None:
58 | if label_name is not None:
59 | data = self.dataframe.sort_values(by=[date_label])
60 | fig = px.line(data_frame=data, x=date_label, y=numerical_label, color=label_name)
61 | fig.show()
62 | else:
63 | data = self.dataframe.sort_values(by=[date_label])
64 | fig = px.line(data_frame=data, x=date_label, y=numerical_label)
65 | fig.show()
66 |
67 |
--------------------------------------------------------------------------------
/VizKG/charts/heatmap.py:
--------------------------------------------------------------------------------
1 | from .chart import Chart
2 | import matplotlib.pyplot as plt
3 | import seaborn as sns
4 |
5 | class HeatMap(Chart):
6 | def __init__(self, dataframe, kwargs):
7 | """
8 | Constructs all the necessary attributes for the HeatMap object
9 |
10 | Parameters:
11 | dataframe (pandas.Dataframe): The dataframe
12 | """
13 | Chart.__init__(self, dataframe, kwargs)
14 |
15 | def promote_to_candidate(self):
16 |
17 | is_promote = self._is_var_exist(self._numerical_column, 2)
18 |
19 | return is_promote
20 |
21 | def plot(self):
22 | """
23 | Generate visualization
24 | """
25 | if self.promote_to_candidate():
26 | self.draw()
27 | else:
28 | pass
29 |
30 | def draw(self):
31 | """
32 | Generate HeatMap visualization
33 | """
34 |
35 | if self._is_var_exist(self._numerical_column, 2):
36 |
37 | self.figsize = self.__set_figsize(self.kwargs.get('figsize'))
38 | #check if param figsize exist
39 | if self.figsize is not None:
40 | plt.figure(figsize=self.figsize)
41 | sns.heatmap(self.dataframe.corr(), annot = True)
42 | plt.show(block=True)
43 | else:
44 | #plot HeatMap
45 | plt.figure(figsize=(13,8))
46 | sns.heatmap(self.dataframe.corr(), annot = True)
47 | plt.show(block=True)
48 |
49 | @staticmethod
50 | def __set_figsize(figsize_input):
51 | """
52 | Setter of figsize based on figsize input for matplotlib chart
53 |
54 | Parameters:
55 | (tuple) figsize_input: The figsize input
56 |
57 | Returns:
58 | (tuple) figsize: The result figsize
59 | """
60 | figsize = None
61 | is_numeric_value = None
62 |
63 | try:
64 | if figsize_input is not None and len(figsize_input) == 2:
65 | is_numeric_value = all(isinstance(v, int) or isinstance(v, float) for v in figsize_input)
66 | else:
67 | is_numeric_value = False
68 | except:
69 | is_numeric_value = False
70 |
71 | if is_numeric_value:
72 | figsize = figsize_input
73 | else:
74 | figsize = None
75 |
76 | return figsize
--------------------------------------------------------------------------------
/VizKG/charts/radarchart.py:
--------------------------------------------------------------------------------
1 | from .chart import Chart
2 | import plotly.graph_objects as go
3 |
4 |
5 | class RadarChart(Chart):
6 | def __init__(self, dataframe, kwargs):
7 | """
8 | Constructs all the necessary attributes for the Radar Chart object
9 |
10 | Parameters:
11 | dataframe (pandas.Dataframe): The dataframe
12 | """
13 | Chart.__init__(self, dataframe, kwargs)
14 |
15 | def promote_to_candidate(self):
16 |
17 | is_promote = self._is_var_exist(self._label_column, 1) and self._is_var_exist(self._numerical_column, 3)
18 |
19 | return is_promote
20 |
21 | def plot(self):
22 | """
23 | Generate visualization
24 | """
25 | if self.promote_to_candidate():
26 | self.draw()
27 | else:
28 | pass
29 |
30 | def _check_requirements(self):
31 | """
32 | Check the requirements for generating Radar Chart visualization
33 |
34 | Returns:
35 | (string) label_name: label name
36 | (list) numerical_column: list of numerical column
37 | """
38 | label_name = None
39 | numerical_column = None
40 |
41 | if self._is_var_exist(self._numerical_column, 3):
42 | numerical_column = self._numerical_column
43 | if self._is_var_exist(self._label_column, 1):
44 | label_name = self._label_column[0]
45 |
46 | return label_name, numerical_column
47 |
48 | def draw(self):
49 | """
50 | Generate Radar Chart visualization
51 | """
52 | label_name, numerical_column = self._check_requirements()
53 |
54 | if label_name is not None and numerical_column is not None:
55 | categories = numerical_column
56 | data_label = self.dataframe[label_name]
57 | data_numeric = self.dataframe[numerical_column]
58 |
59 | list_number = []
60 |
61 | fig = go.Figure()
62 |
63 | for i in range (len(data_numeric)):
64 | idx_data_numeric = (list(data_numeric.iloc[i]))
65 | fig.add_trace(go.Scatterpolar(
66 | r=idx_data_numeric,
67 | theta=categories,
68 | fill='toself',
69 | name=data_label[i]
70 | ))
71 | list_number.append(idx_data_numeric)
72 |
73 | fig.update_layout(
74 | polar=dict(
75 | radialaxis=dict(
76 | visible=True,
77 | range=[0, max(list_number)]
78 | )),
79 | showlegend=False
80 | )
81 |
82 | fig.show()
83 |
84 |
85 |
86 |
--------------------------------------------------------------------------------
/VizKG/charts/tree.py:
--------------------------------------------------------------------------------
1 | from .chart import Chart
2 | from anytree import Node, RenderTree
3 |
4 | class Tree(Chart):
5 | def __init__(self, dataframe, kwargs):
6 | """
7 | Constructs all the necessary attributes for the Tree object
8 |
9 | Parameters:
10 | dataframe (pandas.Dataframe): The dataframe
11 | """
12 | Chart.__init__(self, dataframe, kwargs)
13 |
14 | def promote_to_candidate(self):
15 |
16 | is_promote = self._is_var_exist(self._uri_column, 2)
17 |
18 | return is_promote
19 |
20 | def plot(self):
21 | """
22 | Generate visualization
23 | """
24 | if self.promote_to_candidate():
25 | self.draw()
26 | else:
27 | pass
28 |
29 | def _check_requirements(self):
30 | """
31 | Check the requirements for generating tree visualization
32 |
33 | Returns:
34 | (list) filter_column: list of filter label name
35 | """
36 | filter_column = None
37 | if self._is_var_exist(self._uri_column, 2):
38 | if (len(self._label_column)) == (len(self._uri_column)):
39 | filter_column = self._label_column
40 | else:
41 | filter_column = self._uri_column
42 | else:
43 | pass
44 |
45 | return filter_column
46 |
47 | def draw(self):
48 | """
49 | Generate tree visualization
50 | """
51 | #filter_column
52 | filter_column = self._check_requirements()
53 |
54 | if filter_column is not None:
55 | #Extract selected column as new dataframe
56 | data = self.dataframe[filter_column].copy()
57 |
58 | for i in range (len(filter_column)):
59 | nodes = {}
60 | if i == len(filter_column) - 1:
61 | break
62 | for parent, child in zip(data.iloc[:, i],data.iloc[:, i+1]):
63 | self.add_nodes(nodes, parent, child)
64 |
65 | roots = list(data[~data.iloc[:, i].isin(data.iloc[:, i+1])][data.columns[i]].unique())
66 | for root in roots: # you can skip this for roots[0], if there is no forest and just 1 tree
67 | for pre, _, node in RenderTree(nodes[root]):
68 | print("%s%s" % (pre, node.name))
69 |
70 | @staticmethod
71 | def add_nodes(nodes, parent, child):
72 | """
73 | Set parent nodes with corresponding child nodes
74 | """
75 | if parent not in nodes:
76 | nodes[parent] = Node(parent)
77 | if child not in nodes:
78 | nodes[child] = Node(child)
79 | nodes[child].parent = nodes[parent]
--------------------------------------------------------------------------------
/tests/dataIdentification_test.py:
--------------------------------------------------------------------------------
1 | import unittest
2 | import VizKG.visualize as vkg
3 | from VizKG.charts import Chart
4 | from VizKG.utils import generate_charts_dictionary
5 |
6 | class VizKGTestCase(unittest.TestCase):
7 |
8 | def setUp(self):
9 | query = """
10 | #entity of barack obama
11 | SELECT ?item ?linkTo ?prop ?itemLabel ?propLabel ?linkToLabel ?img ?dob ?height ?point
12 | WHERE
13 | {
14 | BIND(wd:Q76 AS ?item)
15 | VALUES ?prop { wdt:P26 wdt:P40 }
16 | VALUES ?USA { wd:Q30 }
17 | ?item ?prop ?linkTo .
18 | ?item rdfs:label ?itemLabel .
19 | ?linkTo rdfs:label ?linkToLabel .
20 | ?propFull wikibase:directClaim ?prop .
21 | ?propFull rdfs:label ?propLabel .
22 | ?item wdt:P18 ?img;
23 | wdt:P569 ?dob;
24 | wdt:P2048 ?height.
25 | ?USA wdt:P625 ?point.
26 | FILTER(LANG(?itemLabel)="en")
27 | FILTER(LANG(?linkToLabel)="en")
28 | FILTER(LANG(?propLabel)="en")
29 | }
30 | """
31 | service_url = "https://query.wikidata.org/sparql"
32 | self.obj = vkg(sparql_query=query, sparql_service_url=service_url)
33 | # self.chart = DataIdentification(self.obj.dataframe)
34 | self.chart = Chart(self.obj.dataframe, self.obj.kwargs)
35 |
36 |
37 | def test_column_dataframe(self):
38 | obj_column_names = list(self.obj.dataframe.columns)
39 | column_names = ["item", "linkTo", "prop", "itemLabel", "propLabel", "linkToLabel", "img", "dob", "height", "point"]
40 | self.assertListEqual(obj_column_names, obj_column_names)
41 |
42 | def test_string_column_data_type(self):
43 | str_column_names = ["item", "linkTo", "prop", "itemLabel", "propLabel", "linkToLabel", "img", "point"]
44 | for name in str_column_names:
45 | self.assertEqual(True, (self.obj.dataframe[name].dtypes == 'string'))
46 |
47 | def test_date_column(self):
48 | date_column = self.chart._date_column
49 | for name in date_column:
50 | self.assertEqual(True, (self.obj.dataframe[name].dtypes == 'datetime64[ns]'))
51 |
52 | def test_numeric_column(self):
53 | numeric_column = self.chart._numerical_column
54 | for name in numeric_column:
55 | self.assertEqual(True, (self.obj.dataframe[name].dtypes == 'float64'))
56 |
57 | def test_uri_column(self):
58 | uri_column = self.chart._uri_column
59 | exp_uri_column = ["item", "prop", "linkTo"]
60 | self.assertListEqual(uri_column, exp_uri_column)
61 |
62 | def test_label_column(self):
63 | label_column = self.chart._label_column
64 | exp_label_column = ["itemLabel", "linkToLabel", "propLabel"]
65 | self.assertListEqual(label_column, exp_label_column)
66 |
67 | def test_img_column(self):
68 | img_column = self.chart._img_column
69 | exp_img_column = ["img"]
70 | self.assertListEqual(img_column, exp_img_column)
71 |
72 | def test_coord_column(self):
73 | coord_column = self.chart._coordinate_column
74 | exp_coord_column = ["point"]
75 | self.assertListEqual(coord_column, exp_coord_column)
76 |
77 | if __name__ == '__main__':
78 |
79 | unittest.main()
--------------------------------------------------------------------------------
/VizKG/charts/map.py:
--------------------------------------------------------------------------------
1 | from .chart import Chart
2 | import folium
3 | from IPython.display import display
4 |
5 | class Map(Chart):
6 | def __init__(self, dataframe, kwargs):
7 | """
8 | Constructs all the necessary attributes for the Map object
9 |
10 | Parameters:
11 | dataframe (pandas.Dataframe): The dataframe
12 | """
13 | Chart.__init__(self, dataframe, kwargs)
14 |
15 | def promote_to_candidate(self):
16 |
17 | is_promote = self._is_var_exist(self._coordinate_column, 1)
18 |
19 | return is_promote
20 |
21 | def _check_requirements(self):
22 | """
23 | Check the requirements for generating tree visualization
24 |
25 | Returns:
26 | (list) popup_data: list of label name
27 | """
28 | popup_data = None
29 | if self._is_var_exist(self._coordinate_column, 1):
30 | new_data = self._add_point()
31 | if len(self._label_column) == 0:
32 | popup_data = new_data.coordinate_point
33 | else:
34 | popup_data = new_data[self._label_column[0]]
35 | else:
36 | popup_data = None
37 |
38 | return popup_data
39 |
40 |
41 | def plot(self):
42 | """
43 | Generate Image Grid visualization
44 | """
45 | if self._is_var_exist(self._coordinate_column, 1):
46 | self.draw_map()
47 | else:
48 | pass
49 |
50 |
51 | def draw_map(self):
52 | """
53 | Generate map visualization
54 | """
55 | popup_data = self._check_requirements()
56 |
57 | if popup_data is not None:
58 | data_point = self._add_point()
59 | #Initiate map folium object
60 | new_data = self.truncate_data(data_point)
61 | maps = folium.Map()
62 |
63 | #Marked the map folium object
64 | for i in range (len(new_data)):
65 | folium.Marker(
66 | location=new_data.coordinate[i],
67 | popup=popup_data[i]
68 | ).add_to(maps)
69 |
70 | display(maps)
71 |
72 | def _add_point(self):
73 | """
74 | Add coordinate column for coordinate folium map
75 |
76 | Returns:
77 | (pandas.Dataframe): Dataframe with new coordinate column
78 | """
79 | copy_data = self.dataframe.copy()
80 |
81 | coor_var = self._coordinate_column[0]
82 | #Get coordinate data (latitude and longitude)
83 | char_delete = 'Point()OINT'
84 | copy_data['coordinate_point'] = copy_data[coor_var]
85 | dataframe_new = copy_data.coordinate_point.astype(str).apply(lambda S:S.strip(char_delete))
86 | dataframe_new = dataframe_new.to_frame()
87 | new = dataframe_new[dataframe_new.columns[-1]].str.split(" ", n = 1, expand = True)
88 | new = new.astype('float64')
89 | copy_data['coordinate'] = new.apply(lambda x: list([x[1], x[0]]),axis=1)
90 |
91 | return copy_data
92 |
93 | def truncate_data(self, data):
94 |
95 | if len(data) > 2000 :
96 | truncate_data = data.head(2000)
97 | data = truncate_data
98 | print(f"Time limit exceed... Showing only 2000 coordinates")
99 | else:
100 | pass
101 |
102 | return data
--------------------------------------------------------------------------------
/VizKG/charts/timeline.py:
--------------------------------------------------------------------------------
1 | from .chart import Chart
2 | import plotly.express as px
3 | import datetime
4 |
5 | class Timeline(Chart):
6 | def __init__(self, dataframe, kwargs):
7 | """
8 | Constructs all the necessary attributes for the Timeline object
9 |
10 | Parameters:
11 | dataframe (pandas.Dataframe): The dataframe
12 | """
13 | Chart.__init__(self, dataframe, kwargs)
14 |
15 | def promote_to_candidate(self):
16 |
17 | is_promote = self._is_var_exist(self._date_column, 1) and (self._is_var_exist(self._label_column, 1) or self._is_var_exist(self._uri_column, 1))
18 |
19 | return is_promote
20 |
21 | def plot(self):
22 | """
23 | Generate visualization
24 | """
25 | if self.promote_to_candidate():
26 | self.draw()
27 | else:
28 | pass
29 |
30 | def _check_requirements(self):
31 | """
32 | Check the requirements for Timeline visualization
33 |
34 | Returns:
35 | (list) date_column: label for axis-x
36 | (list) label_name: label for axis-y
37 | """
38 | date_column = None
39 | label_name = None
40 |
41 | if self._is_var_exist(self._date_column, 1):
42 | date_column = self._date_column
43 | if len(self._label_column) == 0:
44 | if len(self._uri_column) > 0:
45 | label_name = self._uri_column[0]
46 | else:
47 | label_name = None
48 | else:
49 | label_name = self._label_column[0]
50 |
51 | return date_column, label_name
52 |
53 |
54 | def draw(self):
55 | """
56 | Generate Timeline visualization
57 | """
58 | date_column, label_name = self._check_requirements()
59 |
60 | if date_column is not None and label_name is not None:
61 | if len(date_column) >= 2:
62 | if self.dataframe[date_column[0]][0] > self.dataframe[date_column[1]][0]:
63 | date_column[1],date_column[0] = date_column[0],date_column[1]
64 | fig = px.timeline(self.dataframe, x_start=date_column[0], x_end=date_column[1],
65 | y=label_name, color=label_name)
66 | fig.update_yaxes(autorange="reversed")
67 | fig.show()
68 | else:
69 | data = self.dataframe.sort_values(by=[date_column[0]])
70 | range_time = data[date_column[0]][0] - data[date_column[0]][len(self.dataframe)-1]
71 | add_column = self.dataframe.copy()
72 |
73 | if range_time <= datetime.timedelta(days=30):
74 | add_column['T+1'] = [add_column[date_column[0]][i] + datetime.timedelta(days=1) for i in range (len(add_column))]
75 | elif range_time > datetime.timedelta(days=30) and range_time <= datetime.timedelta(days=365):
76 | add_column['T+1'] = [add_column[date_column[0]][i] + datetime.timedelta(days=15) for i in range (len(add_column))]
77 | else:
78 | add_column['T+1'] = [add_column[date_column[0]][i] + datetime.timedelta(days=365) for i in range (len(add_column))]
79 |
80 | fig = px.timeline(add_column, x_start=date_column[0], x_end='T+1',
81 | y=label_name, color=label_name, hover_data={'T+1':False})
82 | fig.update_yaxes(autorange="reversed")
83 | fig.show()
84 |
--------------------------------------------------------------------------------
/VizKG/charts/imagegrid.py:
--------------------------------------------------------------------------------
1 | from .chart import Chart
2 | import matplotlib.pyplot as plt
3 | from imageio import imread
4 | import time
5 |
6 | class ImageGrid(Chart):
7 | def __init__(self, dataframe, kwargs):
8 | """
9 | Constructs all the necessary attributes for the Image Grid visualization
10 |
11 | Parameters:
12 | dataframe (pandas.Dataframe): The dataframe
13 | """
14 | Chart.__init__(self, dataframe, kwargs)
15 |
16 | def promote_to_candidate(self):
17 |
18 | is_promote = self._is_var_exist(self._img_column, 1)
19 |
20 | return is_promote
21 |
22 | def _check_requirements(self):
23 | """
24 | Check the requirements for Image Grid visualization
25 |
26 | Returns:
27 | (list) label_name: list of image label
28 | """
29 | label_name = None
30 | if self._is_var_exist(self._img_column, 1):
31 | if len(self._label_column) > 0:
32 | label_name = self._label_column[0]
33 | else:
34 | pass
35 | else:
36 | label_name = None
37 |
38 | return label_name
39 |
40 | def plot(self):
41 | """
42 | Generate Image Grid visualization
43 | """
44 | if self._is_var_exist(self._img_column, 1):
45 | self.draw_imagegrid()
46 | else:
47 | pass
48 |
49 | def draw_imagegrid(self):
50 |
51 | label_name = self._check_requirements()
52 | columns = 4
53 | width = 20
54 |
55 | data_to_pic = self.truncate_data()
56 |
57 | img_var = self._img_column[0]
58 |
59 | pic = [i for i in data_to_pic[img_var]]
60 | num_pic = len(pic)
61 | height = max(20, int(num_pic/columns) * 20)
62 |
63 | if label_name is not None:
64 | item_label = [i for i in data_to_pic[label_name]]
65 | plt.figure(figsize=(20,20))
66 | for i, url in enumerate(pic):
67 | plt.subplot(int(num_pic / columns + 1), columns, i + 1)
68 | try:
69 | image = imread(url)
70 | plt.title(item_label[i])
71 | plt.imshow(image) #, plt.xticks([]), plt.yticks([])
72 | plt.axis('off')
73 | except ValueError:
74 | pass
75 | except:
76 | time.sleep(2)
77 | image = imread(url)
78 | plt.title(item_label[i])
79 | plt.imshow(image) #, plt.xticks([]), plt.yticks([])
80 | plt.axis('off')
81 | else:
82 | plt.figure(figsize=(20,20))
83 | for i, url in enumerate(pic):
84 | plt.subplot(int(num_pic / columns + 1), columns, i + 1)
85 | try:
86 | image = imread(url)
87 | plt.imshow(image) #, plt.xticks([]), plt.yticks([])
88 | plt.axis('off')
89 | except ValueError:
90 | pass
91 | except:
92 | time.sleep(2)
93 | image = imread(url)
94 | plt.imshow(image) #, plt.xticks([]), plt.yticks([])
95 | plt.axis('off')
96 |
97 | def truncate_data(self):
98 |
99 | data = self.dataframe.copy()
100 | if len(self.dataframe) > 200 :
101 | data = self.dataframe.head(200)
102 | print(f"Time limit exceed. Showing only top of 200 pictures")
103 | else:
104 | pass
105 |
106 | return data
107 |
108 |
--------------------------------------------------------------------------------
/VizKG/charts/stackedareachart.py:
--------------------------------------------------------------------------------
1 | from .chart import Chart
2 | import matplotlib.pyplot as plt
3 |
4 | class StackedAreaChart(Chart):
5 | def __init__(self, dataframe, kwargs):
6 | """
7 | Constructs all the necessary attributes for the StackedAreaChart object
8 |
9 | Parameters:
10 | dataframe (pandas.Dataframe): The dataframe
11 | """
12 | Chart.__init__(self, dataframe, kwargs)
13 |
14 | def promote_to_candidate(self):
15 |
16 | is_promote = False
17 | check_var = self._is_var_exist(self._numerical_column, 1) and self._is_var_exist(self._date_column, 1)
18 | if check_var:
19 | if (len(self._numerical_column) == 1):
20 | if len(self.dataframe[self._date_column[0]].unique()) == len(self.dataframe):
21 | is_promote = True
22 | else:
23 | is_promote = False
24 | else:
25 | is_promote = True
26 |
27 | return is_promote
28 |
29 | def plot(self):
30 | """
31 | Generate visualization
32 | """
33 | if self.promote_to_candidate():
34 | self.draw()
35 | else:
36 | pass
37 |
38 | def _check_requirements(self):
39 | """
40 | Check the requirements for generating StackedAreaChart visualization
41 |
42 | Returns:
43 | (string) date_label: date label for axis-x
44 | (list) numerical_columns: numerical list
45 | """
46 | date_label = None
47 | numerical_column = None
48 |
49 | if self._is_var_exist(self._date_column, 1):
50 | date_label = self._date_column[0]
51 | if self._is_var_exist(self._numerical_column, 1):
52 | numerical_column = self._numerical_column
53 |
54 | return date_label, numerical_column
55 |
56 |
57 | def draw(self):
58 | """
59 | Generate StackedAreaChart visualization
60 | """
61 | date_label, numerical_column = self._check_requirements()
62 |
63 | if date_label is not None and numerical_column is not None:
64 | #set index by date label
65 | dataframe = self.dataframe.copy()
66 | dataframe = dataframe.set_index(date_label)
67 | #plot
68 | self.figsize = self.__set_figsize(self.kwargs.get('figsize'))
69 | #check if param figsize exist
70 | if self.figsize is not None:
71 | ax = dataframe.plot.area(stacked=True, figsize=self.figsize)
72 | plt.show(block=True)
73 | else:
74 | ax = dataframe.plot.area(stacked=True, figsize=(15,10))
75 | plt.show(block=True)
76 |
77 | @staticmethod
78 | def __set_figsize(figsize_input):
79 | """
80 | Setter of figsize based on figsize input for matplotlib chart
81 |
82 | Parameters:
83 | (tuple) figsize_input: The figsize input
84 |
85 | Returns:
86 | (tuple) figsize: The result figsize
87 | """
88 | figsize = None
89 | is_numeric_value = None
90 |
91 | try:
92 | if figsize_input is not None and len(figsize_input) == 2:
93 | is_numeric_value = all(isinstance(v, int) or isinstance(v, float) for v in figsize_input)
94 | else:
95 | is_numeric_value = False
96 | except:
97 | is_numeric_value = False
98 |
99 | if is_numeric_value:
100 | figsize = figsize_input
101 | else:
102 | figsize = None
103 |
104 | return figsize
--------------------------------------------------------------------------------
/VizKG/charts/wordcloud.py:
--------------------------------------------------------------------------------
1 | from .chart import Chart
2 | import pandas as pd
3 | import matplotlib.pyplot as plt
4 | from wordcloud import STOPWORDS, WordCloud as wrdcld
5 |
6 | class WordCloud(Chart):
7 | def __init__(self, dataframe, kwargs):
8 | """
9 | Constructs all the necessary attributes for the WordCloud object
10 |
11 | Parameters:
12 | dataframe (pandas.Dataframe): The dataframe
13 | """
14 | Chart.__init__(self, dataframe, kwargs)
15 |
16 | def promote_to_candidate(self):
17 |
18 | is_promote = self._is_var_exist(self._label_column, 1)
19 |
20 | return is_promote
21 |
22 | def plot(self):
23 | """
24 | Generate visualization
25 | """
26 | if self.promote_to_candidate():
27 | self.draw()
28 | else:
29 | pass
30 |
31 | def _word_result(self):
32 | """
33 | Compile dataframe to one variable
34 |
35 | Parameters:
36 | (pandas.Dataframe) dataframe: The dataframe
37 |
38 | Returns:
39 | (string) words: The word result
40 | """
41 | #Merge into one column
42 | new_data = self.dataframe[self._label_column]
43 | new_data_flat = list(pd.Series(new_data.values.ravel('F')))
44 |
45 | #Merge into one variable
46 | words = " ".join([str(element) for element in new_data_flat])
47 |
48 | return words
49 |
50 | def draw(self):
51 | """
52 | Display WordCloud visualizations
53 |
54 | Parameters:
55 | (string) words: the visualized words
56 | """
57 | if self._is_var_exist(self._label_column, 1):
58 | #initiate words
59 | words = self._word_result()
60 | #initiate wordcloud object
61 | stopwords = set(STOPWORDS)
62 | wordcloud = wrdcld(
63 | width = 800, height = 800,
64 | background_color ='white',
65 | stopwords = stopwords,
66 | min_font_size = 10
67 | ).generate(words)
68 |
69 | # plot the WordCloud image
70 | self.figsize = self.__set_figsize(self.kwargs.get('figsize'))
71 | #check if param figsize exist
72 | if self.figsize is not None:
73 | plt.figure(figsize = self.figsize, facecolor = None)
74 | plt.imshow(wordcloud)
75 | plt.axis("off")
76 | plt.tight_layout(pad = 0)
77 | else:
78 | plt.figure(figsize = (8, 8), facecolor = None)
79 | plt.imshow(wordcloud)
80 | plt.axis("off")
81 | plt.tight_layout(pad = 0)
82 |
83 | @staticmethod
84 | def __set_figsize(figsize_input):
85 | """
86 | Setter of figsize based on figsize input for matplotlib chart
87 |
88 | Parameters:
89 | (tuple) figsize_input: The figsize input
90 |
91 | Returns:
92 | (tuple) figsize: The result figsize
93 | """
94 | figsize = None
95 | is_numeric_value = None
96 |
97 | try:
98 | if figsize_input is not None and len(figsize_input) == 2:
99 | is_numeric_value = all(isinstance(v, int) or isinstance(v, float) for v in figsize_input)
100 | else:
101 | is_numeric_value = False
102 | except:
103 | is_numeric_value = False
104 |
105 | if is_numeric_value:
106 | figsize = figsize_input
107 | else:
108 | figsize = None
109 |
110 | return figsize
--------------------------------------------------------------------------------
/VizKG/charts/dimensions.py:
--------------------------------------------------------------------------------
1 | from .chart import Chart
2 | import plotly.graph_objects as go
3 |
4 | class Dimensions(Chart):
5 | def __init__(self, dataframe, kwargs):
6 | """
7 | Constructs all the necessary attributes for the Dimensions object
8 |
9 | Parameters:
10 | dataframe (pandas.Dataframe): The dataframe
11 | """
12 | Chart.__init__(self, dataframe, kwargs)
13 |
14 | def promote_to_candidate(self):
15 |
16 | is_promote = self._is_var_exist(self._label_column, 2)
17 |
18 | return is_promote
19 |
20 | def plot(self):
21 | """
22 | Generate visualization
23 | """
24 | if self.promote_to_candidate():
25 | self.draw()
26 | else:
27 | pass
28 |
29 | def _check_requirements(self):
30 | """
31 | Check the requirements for generating dimension visualization
32 |
33 | Returns:
34 | (list) dataframe_to_list: list of dataframe
35 | """
36 | dataframe_to_list = None
37 | if self._is_var_exist(self._label_column, 2):
38 | dataframe_to_list = []
39 | for column in self._label_column:
40 | dataframe_to_list += self.dataframe[column].tolist()
41 |
42 | return dataframe_to_list
43 |
44 | def draw(self):
45 | """
46 | Generate Dimensions visualization
47 | """
48 | dataframe_to_list = self._check_requirements()
49 |
50 | if dataframe_to_list is not None:
51 | #plot
52 | figure = go.Figure(data=[go.Sankey(
53 | node = dict(
54 | label = dataframe_to_list,
55 | ),
56 | link = dict(
57 | source = self._index_data(dataframe_to_list), # indices correspond to labels, eg A1, A2, A1, B1, ...
58 | target = self._index_data(dataframe_to_list, type_link='target'),
59 | value = [1 for i in range(len(dataframe_to_list)-self.dataframe.shape[0])]
60 | ))])
61 |
62 | figure.show()
63 |
64 | def _index_data(self, dataframe_to_list, type_link='source'):
65 | """
66 | Return indices correspond to type_link labels
67 |
68 | Parameters:
69 | (string) type_link: Type of link {'source' or target}
70 | DEFAULT: 'source'
71 | Returns:
72 | (list) indices: index list of Type of link
73 | """
74 | curr_key = 0
75 | indices = [0]
76 | curr_value = dataframe_to_list[0]
77 | first_row = [dataframe_to_list[0]]
78 | data = dataframe_to_list[:-self.dataframe.shape[0]]
79 |
80 | if type_link == 'target':
81 | curr_value = dataframe_to_list[self.dataframe.shape[0]]
82 | first_row = [dataframe_to_list[self.dataframe.shape[0]]]
83 | data = dataframe_to_list[self.dataframe.shape[0]:]
84 |
85 | for key,value in enumerate(data):
86 | if value != curr_value :
87 | if value in first_row:
88 | curr_key = first_row.index(value)
89 | curr_value = value
90 | indices.append(curr_key)
91 | first_row.append(curr_value)
92 | else:
93 | indices.append(key)
94 | first_row.append(value)
95 | curr_value = value
96 | curr_key = key
97 | elif value == curr_value:
98 | if key != 0:
99 | indices.append(curr_key)
100 | first_row.append(curr_value)
101 |
102 | if type_link == 'target':
103 | indices = [i+self.dataframe.shape[0] for i in indices]
104 |
105 | return indices
--------------------------------------------------------------------------------
/VizKG/charts/barchart.py:
--------------------------------------------------------------------------------
1 | from .chart import Chart
2 | import seaborn as sns
3 | import plotly.express as px
4 |
5 | class BarChart(Chart):
6 | def __init__(self, dataframe, kwargs):
7 | """
8 | Constructs all the necessary attributes for the BarChart object
9 |
10 | Parameters:
11 | dataframe (pandas.Dataframe): The dataframe
12 | """
13 | Chart.__init__(self, dataframe, kwargs)
14 |
15 | def promote_to_candidate(self):
16 |
17 | item_column, categorical_column = self._set_item_and_categorical()
18 | is_promote = self._is_var_exist(self._numerical_column, 1) and self._is_var_exist(item_column, 1)
19 |
20 | return is_promote
21 |
22 | def plot(self):
23 | """
24 | Generate visualization
25 | """
26 | if self.promote_to_candidate():
27 | self.draw()
28 | else:
29 | pass
30 |
31 | def _check_requirements(self):
32 | """
33 | Check the requirements for generating BarChart visualization
34 |
35 | Returns:
36 | (string) int_label: numerical label
37 | (list) item_column: item_column
38 | (list) categorical_column: categorical_column
39 | """
40 | int_label = None
41 | item_column = None
42 | categorical_column = None
43 |
44 | if self._is_var_exist(self._numerical_column, 1):
45 | int_label = self._numerical_column[0]
46 | if self._is_var_exist(self._label_column, 1):
47 | item_column, categorical_column = self._set_item_and_categorical()
48 |
49 | return int_label, item_column, categorical_column
50 |
51 | def draw(self):
52 | """
53 | Generate BarChart visualization
54 | """
55 | numerical_label, item_column, categorical_column = self._check_requirements()
56 |
57 | #check orientation
58 | orientation = None
59 | if len(categorical_column) > 0:
60 | orientation = self._check_orientation(item_column[0],categorical_column[0])
61 | else:
62 | orientation = self._check_orientation(item_column[0])
63 |
64 | if len(categorical_column) > 0:
65 | if orientation is not None:
66 | fig = px.bar(self.dataframe, x=numerical_label, y=item_column[0], color=categorical_column[0])
67 | fig.show()
68 | else:
69 | fig = px.bar(self.dataframe, x=item_column[0], y=numerical_label, color=categorical_column[0])
70 | fig.show()
71 | else:
72 | if orientation is not None:
73 | data = self.dataframe.sort_values(by=[numerical_label])
74 | fig = px.bar(data, x=numerical_label, y=item_column[0])
75 | fig.show()
76 | else:
77 | data = self.dataframe.sort_values(by=[numerical_label], ascending=False)
78 | fig = px.bar(data, x=item_column[0], y=numerical_label)
79 | fig.show()
80 |
81 |
82 | def _check_orientation(self, axis_label, group_label=None, max_number=6):
83 | """
84 | Check the requirements for changing orientation, returns None if horizontal
85 |
86 | Returns:
87 | (string) orientation: label for axis
88 | """
89 | orientation = None
90 | num_box = 0
91 | num_axis = len(self.dataframe[axis_label].unique())
92 | num_box = 0
93 |
94 | if group_label is not None:
95 | num_group = len(self.dataframe[group_label].unique())
96 | num_box = num_axis + num_group
97 | else:
98 | num_box = num_axis
99 |
100 | if num_box > max_number:
101 | orientation = 'Horizontal'
102 |
103 | return orientation
--------------------------------------------------------------------------------
/VizKG/utils/util.py:
--------------------------------------------------------------------------------
1 | import re
2 | import pandas as pd
3 | import importlib, inspect
4 | from pandas import json_normalize
5 | from SPARQLWrapper import SPARQLWrapper
6 | from difflib import SequenceMatcher
7 | import ssl
8 |
9 | from .chartdict import chartdict as chart_dictionary
10 |
11 | def set_chart(chart_input):
12 | """
13 | Setter of chart based on chart input
14 |
15 | :param (str) chart_input: The chart input
16 |
17 | :return: (str) chart: The available chart
18 | """
19 | chart = chart_dictionary
20 | charts = chart.keys()
21 |
22 | if chart_input is not None:
23 | lowercase_input = chart_input.lower()
24 | highest_prob = 0
25 |
26 | if lowercase_input in charts:
27 | chart = lowercase_input
28 | else:
29 | for name in charts:
30 | prob_now = SequenceMatcher(None, lowercase_input, name).ratio()
31 | if prob_now > highest_prob and prob_now >= 0.5:
32 | highest_prob = prob_now
33 | chart = name
34 | else:
35 | chart = None
36 |
37 | return chart
38 |
39 | def set_dataframe(sparql_query, sparql_endpoint, user, passwd):
40 | """
41 | Query the endpoint with the given query string and format the result table
42 |
43 | Parameters:
44 | (string) sparql_query: The sparql query.
45 | (string) sparql_endpoint: The sparql endpoint
46 | (string) user: The sparql endpoint basic authentication user
47 | (string) passwd: The sparql endpoint basic authentication password
48 |
49 | Returns:
50 | (pandas.Dataframe) result_table: The table of result
51 | """
52 |
53 | sparql = SPARQLWrapper(sparql_endpoint)
54 |
55 | sparql.setQuery(sparql_query)
56 | sparql.setReturnFormat('json')
57 | if user != None:
58 | ssl._create_default_https_context = ssl._create_unverified_context
59 | sparql.setCredentials(user, passwd)
60 |
61 | results = sparql.query().convert()
62 | table = json_normalize(results["results"]["bindings"])
63 |
64 | data_table = table[[column_name for column_name in table.columns if column_name.endswith('.value')]]
65 | data_table.columns = data_table.columns.str.replace('.value$', '', regex=True)
66 | result_table = __convert_dtypes(data_table)
67 |
68 | return result_table
69 |
70 | def __convert_dtypes(dataframe):
71 | """
72 | Convert data type each column of dataframe
73 |
74 | Parameters:
75 | (pandas.Dataframe) dataframe: The table
76 |
77 | Returns:
78 | (pandas.Dataframe) table: The result table
79 | """
80 |
81 | for column in dataframe:
82 | try:
83 | dataframe[column] = dataframe[column].astype('string')
84 | except ValueError:
85 | pass
86 |
87 | for column in dataframe:
88 | try:
89 | dataframe[column] = dataframe[column].astype('datetime64')
90 | except ValueError:
91 | pass
92 |
93 | for column in dataframe:
94 | try:
95 | dataframe[column] = dataframe[column].astype('float64')
96 | except (ValueError, TypeError):
97 | pass
98 |
99 | return dataframe
100 |
101 | def generate_charts_dictionary():
102 | """
103 | Get dictionary of chart type
104 |
105 | Returns:
106 | (dict) chartdict: dictionary of visualization chart type
107 | """
108 | keys = []
109 | values = []
110 | for name, mod in inspect.getmembers(importlib.import_module("VizKG.charts"), inspect.ismodule):
111 | keys.append(name)
112 |
113 | for name, cls in inspect.getmembers(importlib.import_module("VizKG.charts"), inspect.isclass):
114 | values.append(cls)
115 |
116 | chartdict = {keys[i]: values[i] for i in range(len(values))}
117 | chartdict.pop("chart")
118 |
119 | return chartdict
--------------------------------------------------------------------------------
/VizKG/visualize.py:
--------------------------------------------------------------------------------
1 | import sys
2 | import random
3 | from .utils import set_chart, set_dataframe, chartdict
4 | from .charts import Chart
5 | class VizKG:
6 | """
7 | Instantiate VizKG object.
8 |
9 | Attributes:
10 | sparql_query (string): The SPARQL query to retrieve.
11 | sparql_service_url (string): The SPARQL endpoint URL.
12 | chart (string): Type of visualization
13 | Options = {'Table', 'ImageGrid', 'Timeline' 'Graph'
14 | 'Map', 'Tree','WordCloud', 'Dimensions',
15 | 'LineChart', 'BarChart', 'Histogram',
16 | 'DensityPlot', 'TreeMap' ,'SunBurstChart',
17 | 'HeatMap' ,'PieChart', 'DonutChart',
18 | 'BoxPlot' ,'ViolinPlot', 'AreaChart',
19 | 'StackedAreaChart', 'ScatterChart',
20 | 'BubbleChart', 'RadarChart'}.
21 | **figsize (float, float): Width, height in inches of matplotlib plot
22 | """
23 |
24 | def __init__(self, sparql_query, sparql_service_url, user=None, passwd=None, chart=None, **kwargs):
25 | """
26 | Constructs all the necessary attributes for the vizKG object
27 |
28 | Parameters:
29 | sparql_query (string): The SPARQL query to retrieve.
30 | sparql_service_url (string): The SPARQL endpoint URL.
31 | user (string): The sparql endpoint basic authentication user
32 | passwd (string): The sparql endpoint basic authentication password
33 | chart (string): Type of visualization
34 | """
35 |
36 | self.sparql_query = sparql_query
37 | self.sparql_service_url = sparql_service_url
38 | self.user = user
39 | self.passwd = passwd
40 | self.chart = set_chart(chart)
41 | self.kwargs = kwargs
42 |
43 | self.__data = set_dataframe(sparql_query, sparql_service_url, user, passwd)
44 | self.__candidate_visualization = self.__find_candidate()
45 | self.dataframe = self.__data
46 | self.candidate_visualization = self.__candidate_visualization
47 |
48 | def plot(self):
49 | """
50 | Plot visualization with suitable corresponding chart
51 |
52 | """
53 | chart_list = chartdict.keys()
54 | figure = None
55 | if len(self.__data) != 0:
56 | if self.chart not in chart_list:
57 | if len(self.__candidate_visualization) > 1:
58 | print(f"You haven’t selected the chart type for your query result visualization.")
59 | print(f"Based on your query result data, we suggest to choose one of the following chart type: {self.__candidate_visualization}\n")
60 | self.__plot_randomize(self.__candidate_visualization)
61 | else:
62 | figure = chartdict["table"](self.__data, self.kwargs)
63 | figure.plot()
64 | else:
65 | if self.chart in self.__candidate_visualization:
66 | figure = chartdict[self.chart](self.__data, self.kwargs)
67 | figure.plot()
68 | else:
69 | print(f"Based on your query result data, we suggest to choose one of the following chart type: {self.__candidate_visualization}\n")
70 | else:
71 | print("No matching records found")
72 |
73 | def __find_candidate(self):
74 | """
75 | Find candidate of visualization
76 |
77 | Returns:
78 | (list) candidate: List of recommendation chart name
79 | """
80 | chart_list = list(chartdict.keys())
81 | candidate = []
82 | for idx,name in enumerate(chart_list):
83 | check = chartdict[name.lower()](self.__data, self.kwargs)
84 | if check.promote_to_candidate():
85 | candidate.append(name)
86 | return candidate
87 |
88 | def __plot_randomize(self, candidate_visualization):
89 | """
90 | Plot two of recommendation chart chart
91 |
92 | Returns:
93 | (list) candidate: List of recommendation chart name
94 | """
95 | list_of_random_items = random.sample(candidate_visualization, 2)
96 | print(f"We show below two of them {tuple(list_of_random_items)} as illustrations: ")
97 | for idx,name in enumerate(list_of_random_items):
98 | figure = chartdict[name.lower()](self.__data, self.kwargs)
99 | figure.plot()
100 |
101 | sys.modules[__name__] = VizKG
--------------------------------------------------------------------------------
/VizKG/charts/chart.py:
--------------------------------------------------------------------------------
1 | import re
2 | import statistics
3 |
4 | class Chart():
5 | def __init__(self, dataframe, kwargs):
6 | """
7 | Constructs all the necessary attributes for the Chart object
8 |
9 | Parameters:
10 | dataframe (pandas.Dataframe): The dataframe
11 | kwargs: Arbitrary keyword arguments.
12 | """
13 | self.dataframe = dataframe
14 | self.kwargs = kwargs
15 |
16 | self._uri_column = self._set_uri_column()
17 | self._date_column = self._set_date_column()
18 | self._numerical_column = self._set_numerical_column()
19 | self._coordinate_column = self._set_coordinate_column()
20 | self._img_column = self._set_image_column()
21 | self._label_column = self._set_label_column()
22 |
23 | def promote_to_candidate(self):
24 | "Check required variable to generate chart"
25 | pass
26 |
27 | def plot(self):
28 | "Generate visualization"
29 | pass
30 |
31 | def _is_var_exist(self, column, request=1):
32 | """
33 | Check if list exist return True if exist
34 |
35 | Parameters:
36 | (int) request:number of required column
37 |
38 | Returns:
39 | (boolena) is_exist: True if list exist
40 | """
41 | is_exist = False
42 | if len(column) >= request:
43 | is_exist = True
44 | else:
45 | is_exist = False
46 |
47 | return is_exist
48 |
49 | def _set_label_column(self):
50 | """
51 | Get label column name of dataframe based on 'string' dtypes
52 | with excluded uri, image url and coordinate column
53 |
54 | :return: (list) label_column: list of label column
55 | """
56 | str_column = list(self.dataframe.columns)
57 |
58 | #exclude uri, image url, coordinate column
59 | excluded_column = self._uri_column + self._img_column + self._coordinate_column + self._numerical_column + self._date_column
60 | label_column = [i for i in str_column + excluded_column if i not in str_column or i not in excluded_column]
61 |
62 | return label_column
63 |
64 | def _set_item_and_categorical(self):
65 | """
66 | Set item and categorical var from label column
67 | set categorical var if unique value <= (len(self.dataframe) / 2)
68 |
69 | :return: (list,list) list_item_col, list_of_categorical_variable: list of name
70 | """
71 | item_col = []
72 | categorical_col = []
73 |
74 | filter_col = []
75 | if len(self._label_column) > 0:
76 | filter_col = self._label_column
77 |
78 | unique_dict = {name:len(self.dataframe[name].unique()) for name in (filter_col)}
79 | sort_dict = {k: v for k, v in sorted(unique_dict.items(), key=lambda item: item[1])}
80 | for name, value in sort_dict.items():
81 | if value <= (len(self.dataframe) / 2):
82 | categorical_col.append(name)
83 | else:
84 | item_col.append(name)
85 | return item_col, categorical_col
86 |
87 | def _set_date_column(self):
88 | """
89 | Get date column name of dataframe based on date data type
90 | """
91 | date_column = [name for name in self.dataframe.columns if self.dataframe[name].dtypes == 'datetime64[ns]']
92 |
93 | return date_column
94 |
95 | def _set_numerical_column(self):
96 | """
97 | Get date column name of dataframe based on date data type
98 | """
99 | numerical_column = [name for name in self.dataframe.columns if self.dataframe[name].dtypes == 'float64']
100 |
101 | return numerical_column
102 |
103 | def _set_uri_column(self):
104 | """
105 | Get date column name of dataframe based on date data type
106 | """
107 | #Regex pattern
108 | """
109 | Get uri column name of dataframe based on regex pattern
110 |
111 | :return: (list) uri_column: list of uri variable
112 | """
113 | #Regex pattern
114 | pattern_url = r"^(?:http(s)?:\/\/)[\w.-]+(?:\.[\w\.-]+)+[\w\-\._~:/?#[\]@!\$&'\(\)\*\+,;=.]+$(? len(self._label_column):
44 | filter_column = self._uri_column
45 | else:
46 | filter_column = self._sort_label_column(self._label_column)
47 | is_label_column = True
48 |
49 | return filter_column, is_label_column
50 |
51 | def _sort_label_column(self, label_column):
52 | #sort based on unique value (ASC)
53 | unique_dict = {name:len(self.dataframe[name].unique()) for name in (label_column)}
54 | sort_dict = {k: v for k, v in sorted(unique_dict.items(), key=lambda item: item[1])}
55 |
56 | sorted_label_column = list(sort_dict.keys())
57 |
58 | return sorted_label_column
59 |
60 | def draw(self):
61 | """
62 | Generate graph visualization
63 | """
64 | is_label_column = True
65 | filter_column = None
66 | keyword_column = None
67 | filter_column, is_label_column = self._check_requirements()
68 |
69 | #check mode keyword
70 | self.mode_keyword = set_mode(self.kwargs.get('mode_keyword'))
71 | if self.mode_keyword is not None:
72 | keyword_column = self._check_variable_mode_keyword()
73 |
74 |
75 | #plot
76 | if filter_column is not None:
77 | self.figsize = set_figsize(self.kwargs.get('figsize'))
78 | #check if param figsize exist
79 | if self.figsize is not None:
80 | plt.figure(figsize=self.figsize)
81 | else:
82 | plt.figure(figsize=(20,15))
83 | try:
84 | #check if edge label exist
85 | if len(filter_column) > 2:
86 | #check if label exist (not uri)
87 | if keyword_column is not None:
88 | graph, positions, edge_labels = self.create_graph_nx('source_node', 'target_node', 'edge_label')
89 | elif is_label_column:
90 | graph, positions, edge_labels = self.create_graph_nx(filter_column[0], filter_column[2], filter_column[1])
91 | else:
92 | graph, positions, edge_labels = self.create_graph_nx(filter_column[0], filter_column[2], filter_column[1])
93 | nx.draw_networkx(graph, positions, arrowsize=15, node_color='#f0f8ff')
94 | nx.draw_networkx_edge_labels(graph, pos=positions, edge_labels=edge_labels, font_color='r')
95 | else:
96 | graph, positions, edge_labels = self.create_graph_nx(filter_column[0], filter_column[1])
97 | nx.draw_networkx(graph, positions, arrowsize=15, node_color='#f0f8ff')
98 | finally:
99 | plt.show()
100 |
101 | def create_graph_nx(self, source_column, target_column, edge_column=None):
102 | """
103 | Create graph networkx
104 |
105 | Paramaters:
106 | (list) node_list: list of node
107 | (list) filter_column: list of parent and child name column
108 |
109 | Returns:
110 | (networkx.DiGraph) Graph: Digraph graph
111 | """
112 | Graph = nx.DiGraph()
113 |
114 | #add edges and edge_label to graph
115 | edge_label = {}
116 | for key, node in self.dataframe.iterrows():
117 | Graph.add_edges_from([(node[source_column],node[target_column])])
118 | if edge_column is not None:
119 | edge_label[(node[source_column],node[target_column])] = node[edge_column]
120 |
121 |
122 | #Getting positions for each node.
123 | positions = nx.kamada_kawai_layout(Graph)
124 |
125 | return Graph, positions, edge_label
126 |
127 | def _check_variable_mode_keyword(self):
128 | """
129 | Check the required var for generating graph visualization
130 |
131 | Returns:
132 | (list) filter_column: list of filter label name
133 | """
134 | filter_column = None
135 | required_var = ['source_node', 'target_node', 'edge_label']
136 | exist_var = [name for name in self.dataframe.columns if name.startswith(tuple(required_var)) and self.dataframe[name].dtypes == 'string']
137 | miss_var = list(set(required_var)-set(exist_var))
138 |
139 | if len(miss_var) > 0:
140 | raise Exception(f"Missing required variable: {miss_var}")
141 | else:
142 | filter_column = required_var
143 |
144 | return filter_column
145 |
146 | def set_mode(mode_input):
147 | """
148 | Setter of mode of mapping based on mode input
149 |
150 | Parameters:
151 | (bool) mode_input: The mode input
152 |
153 | Returns:
154 | (bool) mode: The result mode
155 | """
156 | mode = None
157 | if mode_input is not None and isinstance(mode_input, bool) and mode_input == True:
158 | mode = mode_input
159 | else:
160 | mode = None
161 |
162 | return mode
163 |
164 | def set_figsize(figsize_input):
165 | """
166 | Setter of figsize based on figsize input for matplotlib chart
167 |
168 | Parameters:
169 | (tuple) figsize_input: The figsize input
170 |
171 | Returns:
172 | (tuple) figsize: The result figsize
173 | """
174 | figsize = None
175 | is_numeric_value = None
176 |
177 | try:
178 | if figsize_input is not None and len(figsize_input) == 2:
179 | is_numeric_value = all(isinstance(v, int) or isinstance(v, float) for v in figsize_input)
180 | else:
181 | is_numeric_value = False
182 | except:
183 | is_numeric_value = False
184 |
185 | if is_numeric_value:
186 | figsize = figsize_input
187 | else:
188 | figsize = None
189 |
190 | return figsize
--------------------------------------------------------------------------------
/README.md:
--------------------------------------------------------------------------------
1 | # VizKG
2 | [](https://colab.research.google.com/drive/17caTzWK1-rPU44mYfn5v4YaEc7Y7eAZa?pli=1#scrollTo=gOM-o9o6twi4)
3 | [](https://pypi.org/project/VizKG)
4 | [](https://pypi.org/project/VizKG)
5 | [](https://github.com/fadirra/vizkg/blob/main/LICENSE)
6 |
7 | VizKG, a visualization library for SPARQL query results over KGs. VizKG links SPARQL query results and external visualization libraries by [mapping](https://bit.ly/VizKG-MappingRules) query variables to the visualization components needed, currently allowing for 24 types of visualizations. Not only that, VizKG also provides visualization recommendations for arbitrary SPARQL query result.
8 |
9 | ### Update feature v.1.0.9
10 | VizKG now features SPARQL endpoint access with basic authentication where users can use the feature at their own risk. The purpose of VizKG is for **educational only**.
11 |
12 | ## Installation
13 | Use the package manager [pip](https://pip.pypa.io/en/stable/) to install VizKG.
14 |
15 | ```bash
16 | pip install VizKG
17 | ```
18 |
19 | ## Usage
20 |
21 | ```python
22 | # Import the library
23 | import VizKG.visualize as vkg
24 | ```
25 |
26 | ### Visualization Recommendation
27 |
28 | VizKG returns the automated visualization when there is no chart type preference given.
29 |
30 | ```python
31 | #Wikidata: Covid-19 Recoveries, Cases, and Death Growth
32 | sparql_query = """
33 | SELECT ?time ?Recoveries ?Cases ?Deaths WHERE {
34 | {
35 | SELECT ?time ?Recoveries WHERE {
36 | wd:Q84263196 p:P8010 ?countRes .
37 | FILTER NOT EXISTS { ?countRes pq:P276 ?loc }
38 | ?countRes ps:P8010 ?Recoveries ;
39 | pq:P585 ?time .
40 | }
41 | }
42 | {
43 | SELECT ?time ?Cases WHERE {
44 | wd:Q84263196 p:P1603 ?countRes .
45 | FILTER NOT EXISTS { ?countRes pq:P276 ?loc }
46 | ?countRes ps:P1603 ?Cases ;
47 | pq:P585 ?time .
48 | }
49 | }
50 | {
51 | SELECT ?time ?Deaths WHERE {
52 | wd:Q84263196 p:P1120 ?countRes .
53 | FILTER NOT EXISTS { ?countRes pq:P276 ?loc }
54 | ?countRes ps:P1120 ?Deaths ;
55 | pq:P585 ?time .
56 | }
57 | }
58 | }
59 | """
60 | sparql_service_url = "https://query.wikidata.org/sparql"
61 | chart = vkg(sparql_query=sparql_query, sparql_service_url=sparql_service_url)
62 | chart.plot()
63 | ```
64 | 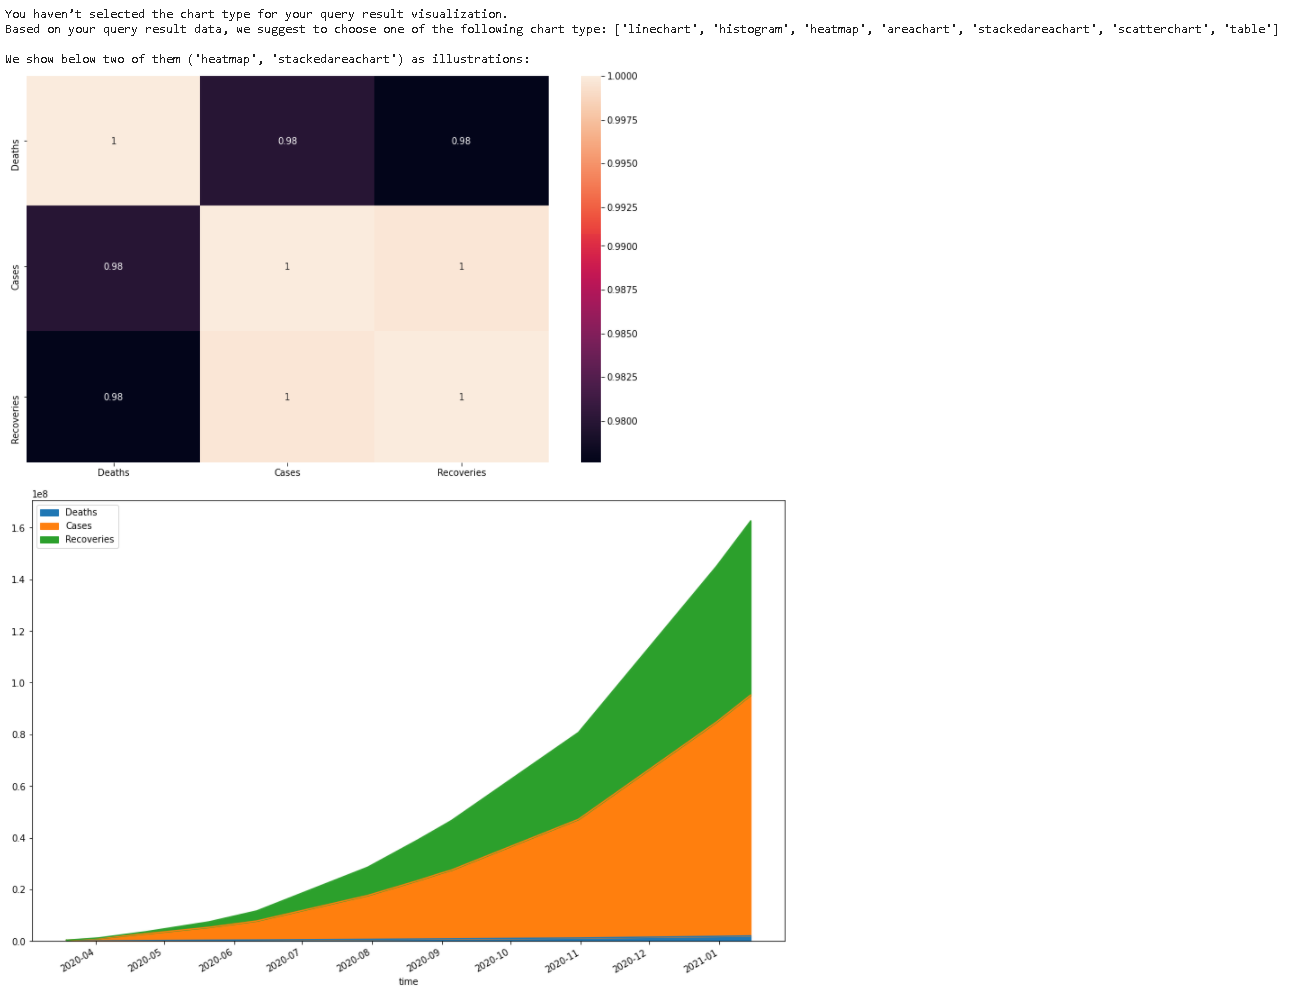
65 |
66 | ## Use Case Examples
67 |
68 | ### Wikidata: COVID-19 Vaccine Origins
69 | ```python
70 | sparql_query = """
71 | SELECT DISTINCT ?vaccineLabel ?originCountry {
72 | ?vaccine wdt:P1924 wd:Q84263196 .
73 | ?vaccine wdt:P178 ?developer.
74 | ?vaccine rdfs:label ?vaccineLabel .
75 | ?developer wdt:P17 ?origin .
76 | ?origin rdfs:label ?originCountry .
77 | FILTER (LANG(?vaccineLabel) = 'en').
78 | FILTER (LANG(?originCountry) = 'en').
79 | }LIMIT 25
80 | """
81 | #to query another endpoint, change the URL for the service and the query
82 | sparql_service_url = "https://query.wikidata.org/sparql"
83 | chart = vkg(sparql_query=sparql_query, sparql_service_url=sparql_service_url, chart='sunburst')
84 | chart.plot()
85 | ```
86 | 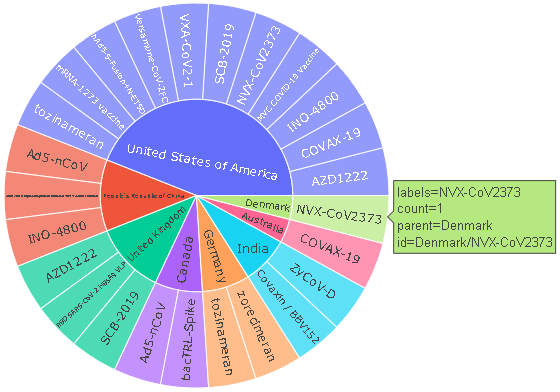
87 |
88 |
89 | ### DBpedia: Map of Temples in Indonesia
90 | ```python
91 | sparql_query = """
92 | SELECT * WHERE {
93 | ?item dbo:wikiPageWikiLink dbr:Candi_of_Indonesia;
94 | geo:geometry ?geo .
95 | ?item rdfs:label ?itemLabel.
96 | FILTER((LANG(?itemLabel)) = "en")
97 | }
98 | """
99 | #to query another endpoint, change the URL for the service and the query
100 | sparql_service_url = "https://dbpedia.org/sparql/"
101 | chart = vkg(sparql_query=sparql_query, sparql_service_url=sparql_service_url, chart='map')
102 | chart.plot()
103 | ```
104 | 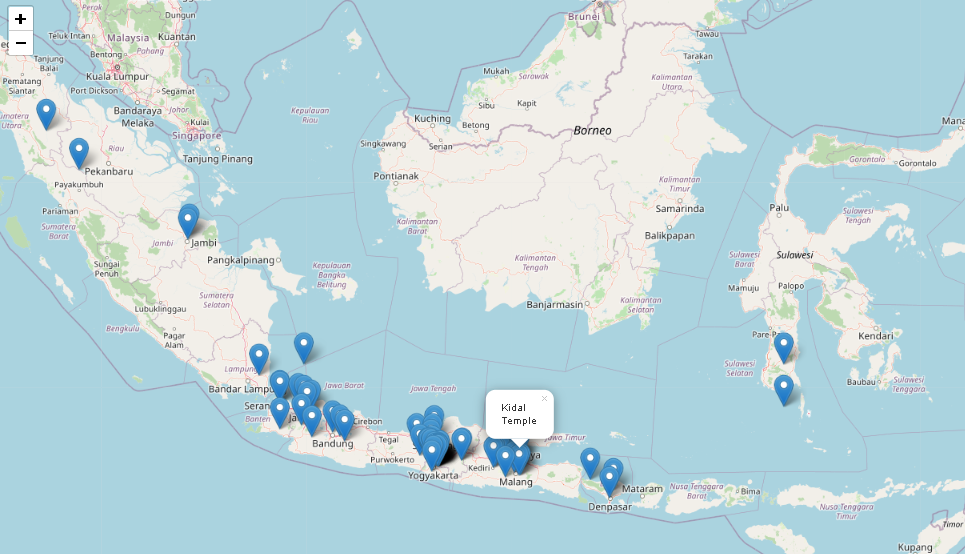
105 |
106 |
107 | ### OU_UK: Number of Employees by Job Title
108 | ```python
109 | sparql_query = """
110 | PREFIX foaf:
111 | PREFIX schema:
112 |
113 | SELECT DISTINCT ?jobTitle (COUNT(?jobTitle) as ?count) WHERE {?s a foaf:Person .
114 | ?s ?jobTitle .
115 | FILTER (lang(?jobTitle) != 'en')
116 | }
117 | GROUP BY ?jobTitle
118 | HAVING (?count > 10)
119 | """
120 | #to query another endpoint, change the URL for the service and the query
121 | sparql_service_url = "https://data.open.ac.uk/sparql"
122 | chart = vkg(sparql_query=sparql_query, sparql_service_url=sparql_service_url, chart='TreeMap')
123 | chart.plot()
124 | ```
125 | 
126 |
127 |
128 | ### Budaya KB: Number of Temples by Indonesian Regencies
129 | ```python
130 | sparql_query = """
131 | prefix bkb:
132 | prefix rdfs:
133 |
134 |
135 | SELECT ?provLabel (COUNT(?temple) AS ?numTemple) WHERE {
136 | ?temple a bkb:Candi .
137 | ?temple bkb:locationInProvince ?prov .
138 | ?prov rdfs:label ?provLabel.
139 | FILTER (lang(?provLabel) = 'id')
140 |
141 | } GROUP BY ?provLabel
142 | ORDER BY DESC(?numTemple)
143 | """
144 | #to query another endpoint, change the URL for the service and the query
145 | sparql_service_url = "https://budayakb.cs.ui.ac.id/budaya/sparql"
146 | chart = vkg(sparql_query=sparql_query, sparql_service_url=sparql_service_url, chart='bubble')
147 | chart.plot()
148 | ```
149 | 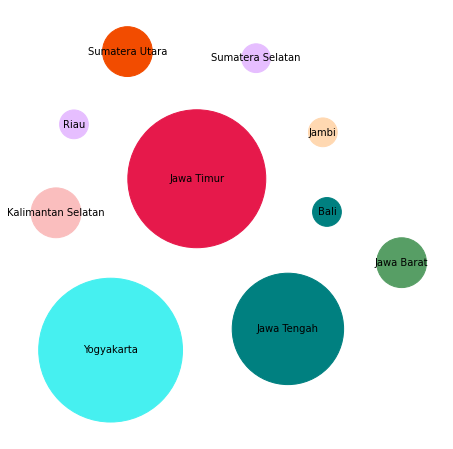
150 |
151 | ## Supported Visualizations
152 | - Table
153 | - ImageGrid
154 | - Map
155 | - Graph
156 | - Tree
157 | - Dimensions
158 | - Timeline
159 | - WordCloud
160 | - Histogram
161 | - Density Plot
162 | - Box Plot
163 | - Violin Plot
164 | - Line Chart
165 | - Bar Chart
166 | - Area Chart
167 | - Stacked Area Chart
168 | - Bubble Chart
169 | - Scatter Chart
170 | - HeatMap
171 | - Radar Chart
172 | - Tree Map
173 | - SunBurst Chart
174 | - Pie Chart
175 | - Donut Chart
176 |
177 | ## Related Work
178 |
179 | | Tool | Framework | Data Source | Input Type | Number of Chart Types |
180 | | :--- | :---: | :---: | :---: | :---: |
181 | |[Wikidata Query Service](https://query.wikidata.org/) | Web-based | Wikidata only | SPARQL SELECT | 14 |
182 | |[Dataviz](https://dataviz.toolforge.org/) | Web-based | Wikidata only | SPARQL SELECT | 23 |
183 | |[YASGUI](https://yasgui.triply.cc/) | Web-based | Generic | SPARQL SELECT and SPARQL CONSTRUCT | 11 |
184 | |[LDVizWiz](http://semantics.eurecom.fr/datalift/rdfViz/apps/) | Web-based | Generic | SPARQL SELECT/ASK and RDF Data | 27 |
185 | |[Sparklis](http://www.irisa.fr/LIS/ferre/sparklis/) | Web-based | Generic | Text | 4 |
186 | |[Quedi](https://link.springer.com/chapter/10.1007%2F978-3-030-59833-4_5) | Web-based | Generic | Text | 16 |
187 | |[Voyager](https://vega.github.io/voyager/) | Web-based | Generic | Tabular Data | 5 |
188 | |[S-Paths](http://s-paths.lri.fr/) | Web-based | Generic | RDF Data | 10 |
189 | |[Gastrodon](https://github.com/paulhoule/gastrodon) | Python Library | Generic | RDF Data | - |
190 | |[kglab](https://github.com/DerwenAI/kglab) | Python Library | Generic | RDF Data | 1 |
191 | |[Autoviz](https://pypi.org/project/autoviz/) | Python Library | Generic | Tabular Data | 5 |
192 | |[Visualizer](https://pypi.org/project/visualizer/) | Python Library | Generic | Tabular Data | 20 |
193 |
194 | ## Code Contributors
195 |
196 | This project exists thanks to all the people who contribute.
--------------------------------------------------------------------------------
/VizKG/charts/bubblechart.py:
--------------------------------------------------------------------------------
1 | from .chart import Chart
2 | import numpy as np
3 | import random
4 | import matplotlib.pyplot as plt
5 |
6 | class BubbleChart(Chart):
7 | def __init__(self, dataframe, kwargs):
8 | """
9 | Constructs all the necessary attributes for the BubbleChart object
10 |
11 | Parameters:
12 | dataframe (pandas.Dataframe): The dataframe
13 | """
14 | Chart.__init__(self, dataframe, kwargs)
15 |
16 | def promote_to_candidate(self):
17 |
18 | item_col, categorical_col = self._set_item_and_categorical()
19 | is_promote = self._is_var_exist(item_col, 1) and self._is_var_exist(self._numerical_column, 1)
20 |
21 | return is_promote
22 |
23 | def plot(self):
24 | """
25 | Generate visualization
26 | """
27 | if self.promote_to_candidate():
28 | self.draw()
29 | else:
30 | pass
31 |
32 | def _check_requirements(self):
33 | """
34 | Check the requirements for generating BubbleChart visualization
35 |
36 | Returns:
37 | (string) numerical_label: label column with float data type
38 | (string) label_name: label column with string data type
39 | """
40 | numerical_label = None
41 | label_name = None
42 | if self._is_var_exist(self._numerical_column, 1):
43 | numerical_label = self._numerical_column[0]
44 | if len(self._label_column) > 0:
45 | label_name = self._label_column[-1]
46 |
47 | return numerical_label, label_name
48 |
49 | def draw(self):
50 | """
51 | Generate table visualization
52 | """
53 | numerical_label, label_name = self._check_requirements()
54 |
55 | if numerical_label is not None and label_name is not None:
56 | self.figsize = set_figsize(self.kwargs.get('figsize'))
57 | bubble_chart = DrawBubbleChart(area=self.dataframe[numerical_label], bubble_spacing=2)
58 | bubble_chart.draw(self.dataframe[label_name], self.figsize)
59 |
60 |
61 | class DrawBubbleChart:
62 | def __init__(self, area, bubble_spacing=0):
63 | """
64 | Setup for bubble collapse.
65 |
66 | Parameters
67 | ----------
68 | area : array-like
69 | Area of the bubbles.
70 | bubble_spacing : float, default: 0
71 | Minimal spacing between bubbles after collapsing.
72 |
73 | Notes
74 | -----
75 | If "area" is sorted, the results might look weird.
76 | """
77 | area = np.asarray(area)
78 | r = np.sqrt(area / np.pi)
79 |
80 | self.bubble_spacing = bubble_spacing
81 | self.bubbles = np.ones((len(area), 4))
82 | self.bubbles[:, 2] = r
83 | self.bubbles[:, 3] = area
84 | self.maxstep = 2 * self.bubbles[:, 2].max() + self.bubble_spacing
85 | self.step_dist = self.maxstep / 2
86 |
87 | # calculate initial grid layout for bubbles
88 | length = np.ceil(np.sqrt(len(self.bubbles)))
89 | grid = np.arange(length) * self.maxstep
90 | gx, gy = np.meshgrid(grid, grid)
91 | self.bubbles[:, 0] = gx.flatten()[:len(self.bubbles)]
92 | self.bubbles[:, 1] = gy.flatten()[:len(self.bubbles)]
93 |
94 | self.com = self.center_of_mass()
95 |
96 | # initiate color of bubbles
97 | group_of_items = ['#5A69AF', '#579E65', '#F9C784', '#FC944A', '#F24C00',
98 | '#00B825', '#e6194b', '#3cb44b', '#ffe119', '#4363d8',
99 | '#f58231', '#911eb4', '#46f0f0', '#f032e6', '#bcf60c',
100 | '#fabebe', '#008080', '#e6beff', '#9a6324', '#fffac8',
101 | '#800000', '#aaffc3', '#808000', '#ffd8b1', '#000075',
102 | '#808080']
103 | num_to_select = len(self.bubbles)
104 | self.colors = [random.choice(group_of_items) for _ in range(num_to_select)]
105 |
106 | def center_of_mass(self):
107 | return np.average(
108 | self.bubbles[:, :2], axis=0, weights=self.bubbles[:, 3]
109 | )
110 |
111 | def center_distance(self, bubble, bubbles):
112 | return np.hypot(bubble[0] - bubbles[:, 0],
113 | bubble[1] - bubbles[:, 1])
114 |
115 | def outline_distance(self, bubble, bubbles):
116 | center_distance = self.center_distance(bubble, bubbles)
117 | return center_distance - bubble[2] - \
118 | bubbles[:, 2] - self.bubble_spacing
119 |
120 | def check_collisions(self, bubble, bubbles):
121 | distance = self.outline_distance(bubble, bubbles)
122 | return len(distance[distance < 0])
123 |
124 | def collides_with(self, bubble, bubbles):
125 | distance = self.outline_distance(bubble, bubbles)
126 | idx_min = np.argmin(distance)
127 | return idx_min if type(idx_min) == np.ndarray else [idx_min]
128 |
129 | def collapse(self, n_iterations=50):
130 | """
131 | Move bubbles to the center of mass.
132 |
133 | Parameters
134 | ----------
135 | n_iterations : int, default: 50
136 | Number of moves to perform.
137 | """
138 | for _i in range(n_iterations):
139 | moves = 0
140 | for i in range(len(self.bubbles)):
141 | rest_bub = np.delete(self.bubbles, i, 0)
142 | # try to move directly towards the center of mass
143 | # direction vector from bubble to the center of mass
144 | dir_vec = self.com - self.bubbles[i, :2]
145 |
146 | # shorten direction vector to have length of 1
147 | dir_vec = dir_vec / np.sqrt(dir_vec.dot(dir_vec))
148 |
149 | # calculate new bubble position
150 | new_point = self.bubbles[i, :2] + dir_vec * self.step_dist
151 | new_bubble = np.append(new_point, self.bubbles[i, 2:4])
152 |
153 | # check whether new bubble collides with other bubbles
154 | if not self.check_collisions(new_bubble, rest_bub):
155 | self.bubbles[i, :] = new_bubble
156 | self.com = self.center_of_mass()
157 | moves += 1
158 | else:
159 | # try to move around a bubble that you collide with
160 | # find colliding bubble
161 | for colliding in self.collides_with(new_bubble, rest_bub):
162 | # calculate direction vector
163 | dir_vec = rest_bub[colliding, :2] - self.bubbles[i, :2]
164 | dir_vec = dir_vec / np.sqrt(dir_vec.dot(dir_vec))
165 | # calculate orthogonal vector
166 | orth = np.array([dir_vec[1], -dir_vec[0]])
167 | # test which direction to go
168 | new_point1 = (self.bubbles[i, :2] + orth *
169 | self.step_dist)
170 | new_point2 = (self.bubbles[i, :2] - orth *
171 | self.step_dist)
172 | dist1 = self.center_distance(
173 | self.com, np.array([new_point1]))
174 | dist2 = self.center_distance(
175 | self.com, np.array([new_point2]))
176 | new_point = new_point1 if dist1 < dist2 else new_point2
177 | new_bubble = np.append(new_point, self.bubbles[i, 2:4])
178 | if not self.check_collisions(new_bubble, rest_bub):
179 | self.bubbles[i, :] = new_bubble
180 | self.com = self.center_of_mass()
181 |
182 | if moves / len(self.bubbles) < 0.1:
183 | self.step_dist = self.step_dist / 2
184 |
185 | def draw(self, labels, figsize_input=None):
186 | """
187 | Draw the bubble plot.
188 |
189 | Parameters
190 | ----------
191 | ax : matplotlib.axes.Axes
192 | labels : list
193 | Labels of the bubbles.
194 | colors : list
195 | Colors of the bubbles.
196 | """
197 | self.collapse()
198 |
199 | #check if param figsize exist
200 | if figsize_input is not None:
201 | fig, ax = plt.subplots(figsize=figsize_input, subplot_kw=dict(aspect="equal"))
202 | for i in range(len(self.bubbles)):
203 | circ = plt.Circle(
204 | self.bubbles[i, :2], self.bubbles[i, 2],
205 | color=self.colors[i],
206 | )
207 | ax.add_patch(circ)
208 | ax.text(*self.bubbles[i, :2], labels[i],
209 | horizontalalignment='center', verticalalignment='center')
210 |
211 | ax.axis("off")
212 | ax.relim()
213 | ax.autoscale_view()
214 | plt.show()
215 | else:
216 | fig, ax = plt.subplots(figsize=(10,8), subplot_kw=dict(aspect="equal"))
217 | for i in range(len(self.bubbles)):
218 | circ = plt.Circle(
219 | self.bubbles[i, :2], self.bubbles[i, 2],
220 | color=self.colors[i],
221 | )
222 | ax.add_patch(circ)
223 | ax.text(*self.bubbles[i, :2], labels[i],
224 | horizontalalignment='center', verticalalignment='center')
225 |
226 | ax.axis("off")
227 | ax.relim()
228 | ax.autoscale_view()
229 | plt.show()
230 |
231 |
232 | def set_figsize(figsize_input):
233 | """
234 | Setter of figsize based on figsize input for matplotlib chart
235 |
236 | Parameters:
237 | (tuple) figsize_input: The figsize input
238 |
239 | Returns:
240 | (tuple) figsize: The result figsize
241 | """
242 | figsize = None
243 | is_numeric_value = None
244 |
245 | try:
246 | if figsize_input is not None and len(figsize_input) == 2:
247 | is_numeric_value = all(isinstance(v, int) or isinstance(v, float) for v in figsize_input)
248 | else:
249 | is_numeric_value = False
250 | except:
251 | is_numeric_value = False
252 |
253 | if is_numeric_value:
254 | figsize = figsize_input
255 | else:
256 | figsize = None
257 |
258 | return figsize
--------------------------------------------------------------------------------