├── CONTRIBUTING.md
├── solutions
├── x_media_review
│ └── README.md
└── causal-impact
│ ├── README.md
│ └── CausalImpact_with_Experimental_Design.ipynb
├── README.md
├── .github
└── workflows
│ └── scorecard.yml
└── LICENSE
/CONTRIBUTING.md:
--------------------------------------------------------------------------------
1 | # How to Contribute
2 |
3 | We'd love to accept your patches and contributions to this project. There are
4 | just a few small guidelines you need to follow.
5 |
6 | ## Contributor License Agreement
7 |
8 | Contributions to this project must be accompanied by a Contributor License
9 | Agreement (CLA). You (or your employer) retain the copyright to your
10 | contribution; this simply gives us permission to use and redistribute your
11 | contributions as part of the project. Head over to
12 | to see your current agreements on file or
13 | to sign a new one.
14 |
15 | You generally only need to submit a CLA once, so if you've already submitted one
16 | (even if it was for a different project), you probably don't need to do it
17 | again.
18 |
19 | ## Code Reviews
20 |
21 | All submissions, including submissions by project members, require review. We
22 | use GitHub pull requests for this purpose. Consult
23 | [GitHub Help](https://help.github.com/articles/about-pull-requests/) for more
24 | information on using pull requests.
25 |
26 | ## Community Guidelines
27 |
28 | This project follows
29 | [Google's Open Source Community Guidelines](https://opensource.google/conduct/).
30 |
--------------------------------------------------------------------------------
/solutions/x_media_review/README.md:
--------------------------------------------------------------------------------
1 | # Cross-Media Review with same level
2 |
3 | ##### This is not an official Google product.
4 |
5 | Advertisers often use many media to achieve their goals, but because standardsvary from one medium to another,
6 | it can be difficult to properly evaluate strategies and make appropriate decisions.
7 |
8 | By using Google Analytics 4 conversions, the media that directly drive sessions are limited,
9 | but multiple media can be evaluated at the same level.
10 |
11 | By providing the monthly investment amount for each medium,
12 | it produces consistent output about the effectiveness and efficiency of each measure, which is what marketers want to know.
13 |
14 |
15 | ## Overview
16 |
17 | ### What you can do with Cross-Media Review with same level
18 |
19 | - Visualization of effectiveness and efficiency in time series
20 | - Visualization of monthly differences in effectiveness for each media
21 | - Visualization of monthly efficiency by media
22 |
23 |
24 | ### Motivation to develop and open the source code
25 |
26 | There are cases where the effectiveness and efficiency of media with different standards are evaluated as they are,
27 | and cases where media with different roles are evaluated with the same standards (last click model).
28 | In these cases, there is a possibility that resources are not being allocated to measures that are truly contributing to acquisition,
29 | so we created this to reduce this possibility and improve productivity.
30 |
31 |
32 | ### Typical procedure for use
33 |
34 | 1. TBW
35 |
36 |
37 |
38 | ## Getting started
39 |
40 | 1. Prepare the time series data on spreadsheet
41 |
--------------------------------------------------------------------------------
/README.md:
--------------------------------------------------------------------------------
1 | # Business Intelligence Group - Marketing Analysis & Data Science Solution Packages
2 |
3 | ##### This is not an official Google product.
4 |
5 | ## Overview
6 | This repository provides a collection of Jupyter Notebooks designed to help marketing analysts and data scientists measure and analyze the effectiveness of marketing campaigns. These notebooks facilitate data preprocessing, visualization, statistical analysis, and machine learning model building, enabling a deep dive into campaign performance and the extraction of actionable insights. By customizing and utilizing these notebooks, marketing analysts and data scientists can develop and execute more effective campaign strategies, ultimately driving data-informed decisions and optimizing marketing ROI.
7 |
8 | ### Motivation to develop and open the source code
9 | - CausalImpact with experimental design
10 | - Some marketing practitioners pay attention to
11 | [Causal inference in statistics](https://en.wikipedia.org/wiki/Causal_inference). However,
12 | using time series data without parallel trend assumptions does not allow for
13 | appropriate analysis. Therefore, the purpose is to enable the implementation and
14 | analysis of interventions after classifying time-series data for which parallel
15 | trend assumptions can be made.
16 |
17 | For contributions, see [CONTRIBUTING.md](https://github.com/google/business_intelligence_group/blob/main/CONTRIBUTING.md).
18 |
19 | ### Available solution packages:
20 | - [CausalImpact with experimental design](https://github.com/google/business_intelligence_group/tree/main/solutions/causal-impact)
21 |
22 |
23 | ## Note
24 | - **Analysis should not be the goal**
25 | - Solving business problems is the goal.
26 | - Be clear about the decision you want to make to solve business problems.
27 | - Make clear the path to what you need to know to make a decision.
28 | - Analysis is one way to find out what you need to know.
29 | - **[Test your hypotheses instead of testing the effectiveness]**
30 | - Formulate hypotheses about why there are issues in the current situation and how to solve them.
31 | - Business situations are constantly changing, so analysis without a hypothesis will not be reproducible.
32 | - **[Be honest with the data]**
33 | - However, playing with data to prove a hypothesis is strictly prohibited.
34 | - Acquire the necessary knowledge to be able to conduct appropriate verification.
35 | - Do not do [HARKing](https://en.wikipedia.org/wiki/HARKing)(hypothesizing after the results are known)
36 | - Do not do [p-hacking](https://en.wikipedia.org/wiki/Data_dredging)
37 |
--------------------------------------------------------------------------------
/.github/workflows/scorecard.yml:
--------------------------------------------------------------------------------
1 | # This workflow uses actions that are not certified by GitHub. They are provided
2 | # by a third-party and are governed by separate terms of service, privacy
3 | # policy, and support documentation.
4 |
5 | name: Scorecard supply-chain security
6 | on:
7 | # For Branch-Protection check. Only the default branch is supported. See
8 | # https://github.com/ossf/scorecard/blob/main/docs/checks.md#branch-protection
9 | branch_protection_rule:
10 | # To guarantee Maintained check is occasionally updated. See
11 | # https://github.com/ossf/scorecard/blob/main/docs/checks.md#maintained
12 | schedule:
13 | - cron: '29 10 * * 1'
14 | push:
15 | branches: [ "main" ]
16 |
17 | # Declare default permissions as read only.
18 | permissions: read-all
19 |
20 | jobs:
21 | analysis:
22 | name: Scorecard analysis
23 | runs-on: ubuntu-latest
24 | permissions:
25 | # Needed to upload the results to code-scanning dashboard.
26 | security-events: write
27 | # Needed to publish results and get a badge (see publish_results below).
28 | id-token: write
29 | # Uncomment the permissions below if installing in a private repository.
30 | # contents: read
31 | # actions: read
32 |
33 | steps:
34 | - name: "Checkout code"
35 | uses: actions/checkout@93ea575cb5d8a053eaa0ac8fa3b40d7e05a33cc8 # v3.1.0
36 | with:
37 | persist-credentials: false
38 |
39 | - name: "Run analysis"
40 | uses: ossf/scorecard-action@99c53751e09b9529366343771cc321ec74e9bd3d # v2.0.6
41 | with:
42 | results_file: results.sarif
43 | results_format: sarif
44 | # (Optional) "write" PAT token. Uncomment the `repo_token` line below if:
45 | # - you want to enable the Branch-Protection check on a *public* repository, or
46 | # - you are installing Scorecard on a *private* repository
47 | # To create the PAT, follow the steps in https://github.com/ossf/scorecard-action#authentication-with-pat.
48 | # repo_token: ${{ secrets.SCORECARD_TOKEN }}
49 |
50 | # Public repositories:
51 | # - Publish results to OpenSSF REST API for easy access by consumers
52 | # - Allows the repository to include the Scorecard badge.
53 | # - See https://github.com/ossf/scorecard-action#publishing-results.
54 | # For private repositories:
55 | # - `publish_results` will always be set to `false`, regardless
56 | # of the value entered here.
57 | publish_results: true
58 |
59 | # Upload the results as artifacts (optional). Commenting out will disable uploads of run results in SARIF
60 | # format to the repository Actions tab.
61 | - name: "Upload artifact"
62 | uses: actions/upload-artifact@3cea5372237819ed00197afe530f5a7ea3e805c8 # v3.1.0
63 | with:
64 | name: SARIF file
65 | path: results.sarif
66 | retention-days: 5
67 |
68 | # Upload the results to GitHub's code scanning dashboard.
69 | - name: "Upload to code-scanning"
70 | uses: github/codeql-action/upload-sarif@807578363a7869ca324a79039e6db9c843e0e100 # v2.1.27
71 | with:
72 | sarif_file: results.sarif
73 |
--------------------------------------------------------------------------------
/solutions/causal-impact/README.md:
--------------------------------------------------------------------------------
1 | # CausalImpact with experimental design
2 |
3 | ##### This is not an official Google product.
4 |
5 | CausalImpact is a R package for causal inference using Bayesian structural
6 | time-series models. In using CausalImpact, the parallel trend assumption is
7 | needed for counterfactual modeling, so this code performs classification of time
8 | series data based on DTW distances.
9 |
10 | ## Overview
11 |
12 | ### What you can do with CausalImpact with experiment design
13 |
14 | - Experimental Design
15 | - load time series data from google spreadsheet or csv file
16 | - classify time series data so that parallel trend assumptions can be made
17 | - simulate the conditions required for verification
18 | - CausalImpact Analysis
19 | - load time series data from google spreadsheet or csv file
20 | - CausalImpact Analysis
21 |
22 | ### Motivation to develop and open the source code
23 |
24 | Some marketing practitioners pay attention to
25 | [Causal inference in statistics](https://en.wikipedia.org/wiki/Causal_inference). However,
26 | using time series data without parallel trend assumptions does not allow for
27 | appropriate analysis. Therefore, the purpose is to enable the implementation and
28 | analysis of interventions after classifying time-series data for which parallel
29 | trend assumptions can be made.
30 |
31 | ### Typical procedure for use
32 |
33 | 1. Assume a hypothetical solution to the issue and its factors.
34 | 2. Assume room for KPIs and the mechanisms that drive KPIs depending on the solution.
35 | 3. In advance, decide next-actions to be taken for each result of hypothesis testing (with/without significant difference).
36 | - Recommend supporting the mechanism with relevant data other than KPIs
37 | 4. Prepare time-series KPI data for at least 100 time points.
38 | - Regional segmentation is recommended.
39 | - Previous data, such as the previous year, may make a difference in the market environment.
40 | - Relevant data must be independent and unaffected by interventions
41 | 5. **(Experimental Design)** This tool is used to conduct the experimental design.
42 | - Split into groups that are closest to each other where the parallel trend assumption can be placed.
43 | - Simulation of required timeframe and budget
44 | - :warning: If the parallel trend assumption cannot be placed, we recommend considering another approach
45 | 6. Implemented interventions.
46 | 7. Prepare time-series KPI data, including intervention period and assumed residual period, in addition to previous data.
47 | 8. **(CausalImpact Analysis)** Conduct CausalImpact analysis.
48 | 9. Implement next actions based on results of hypothesis testing
49 |
50 | ## Note
51 |
52 | - Do not do [HARKing](https://en.wikipedia.org/wiki/HARKing)(hypothesizing after the results are known)
53 | - Do not do [p-hacking](https://en.wikipedia.org/wiki/Data_dredging)
54 |
55 | ## Getting started
56 |
57 | 1. Prepare the time series data on spreadsheet or csv file
58 | 2. Open ipynb file with **[Open in Colab](https://colab.research.google.com/github/google/business_intelligence_group/blob/main/solutions/causal-impact/CausalImpact_with_Experimental_Design.ipynb)** Button.
59 | 3. Run cells in sequence
60 |
61 | ## Tutorial
62 | #### CausalImpact Analysis Section
63 |
64 | 1. Press the **Connect** button to connect to the runtime
65 |
66 | 2. Run **Step 1** cell. Step 1 cells take a little longer because they install the [tfcausalImpact library](https://github.com/WillianFuks/tfcausalimpact).
If you do so, you will see some selections in the Step 1 cell.
67 |
68 | 3. In question 1, choose **CausalImpact Analysis** and update period before the intervention(**Pre Start & Pre End**) and the period during the intervention(**Post Start and Post End**).
69 | 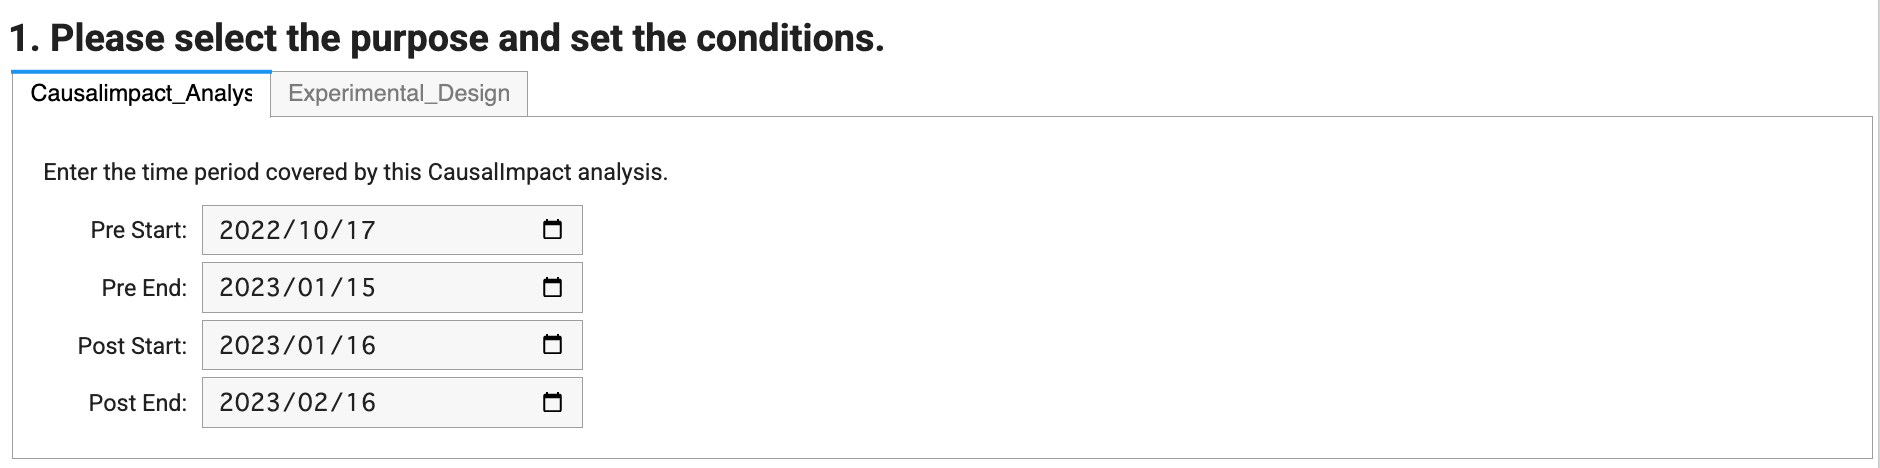
70 |
71 | 4. In question 2, please select the data source from **google_spreadsheet**, **CSV_file**, or **Big_Query**.
72 | Then enter the required items.
73 | 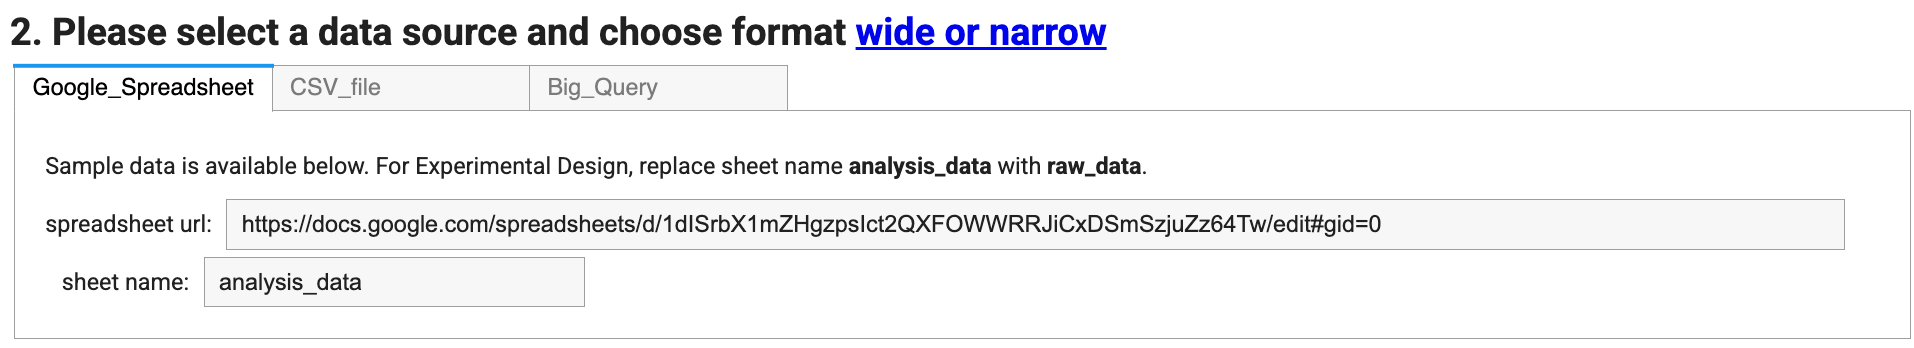
74 |
75 | 5. After entering the required items, the data format will be selected. For CausalImpact analysis, please prepare the data in **wide format** in advance.
76 | After selecting wide format, enter the **date column name**.
77 | 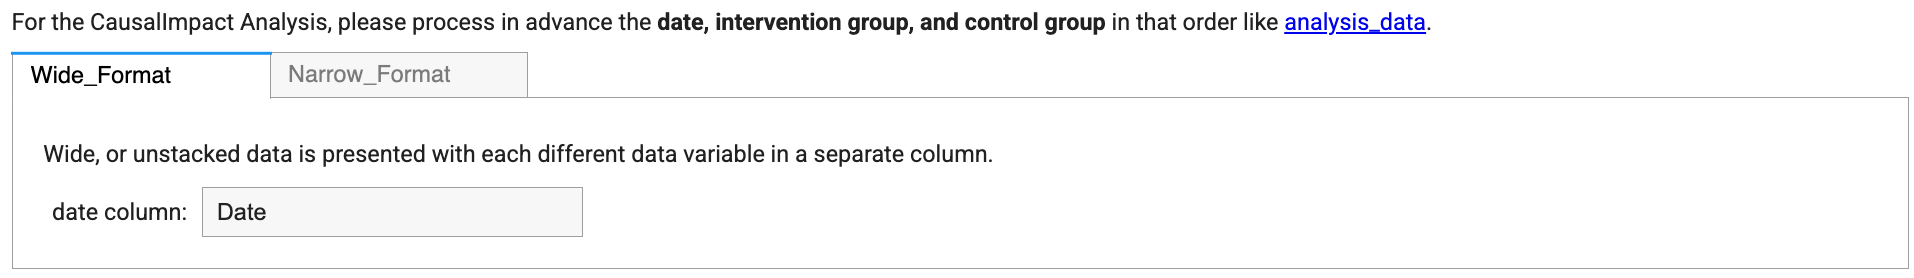
78 |
79 | 6. Once the items are filled in, run the **Step 2** cell.
80 | (:warning: If you have selected **google_spreadsheet** or **big_query**, a pop-up will appear regarding granting permission, so please grant it to Colab.)
81 |
82 | 7. After Step 2 is executed, you will see **the results of CausalImpact Analysis**.
83 | 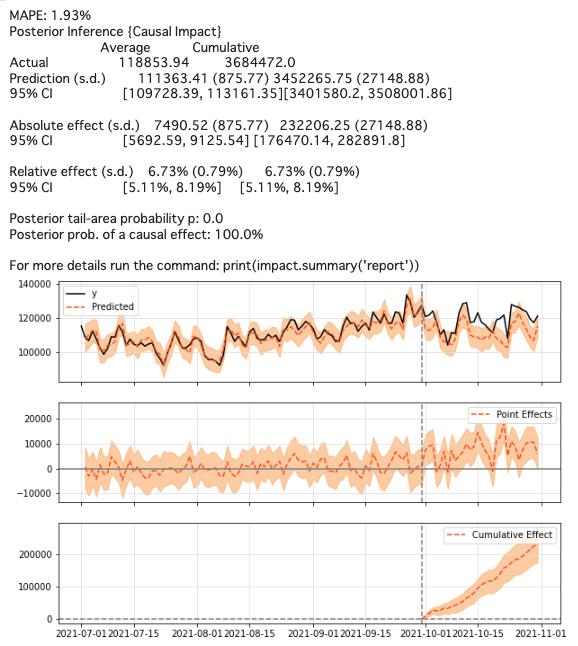
84 |
85 | #### Experimental Design Section
86 |
87 | 1. Press the **Connect** button to connect to the runtime
88 |
89 | 2. Run **Step 1** cell. Step 1 cells take a little longer because they install the [tfcausalImpact library](https://github.com/WillianFuks/tfcausalimpact).
If you do so, you will see some selections in the Step 1 cell.
90 |
91 | 3. In question 1, choose **Experimental Design** and update the term(**Start Date & End Date**) to be used in the Experimental Design.
92 | 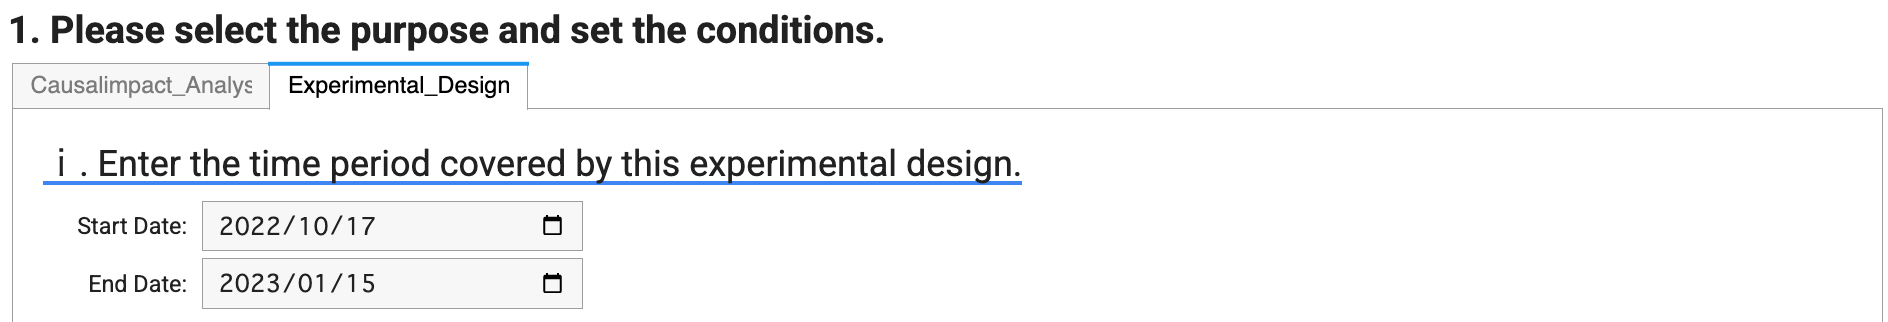
93 |
94 | 4. After updating the term, select the **type of Experimental Design** and update the required items.
95 | * A: divide_equally divides the time series data into n groups with similar movements.
96 | * B: similarity_selection extracts n groups that move similarly to a particular column.
97 |
98 | 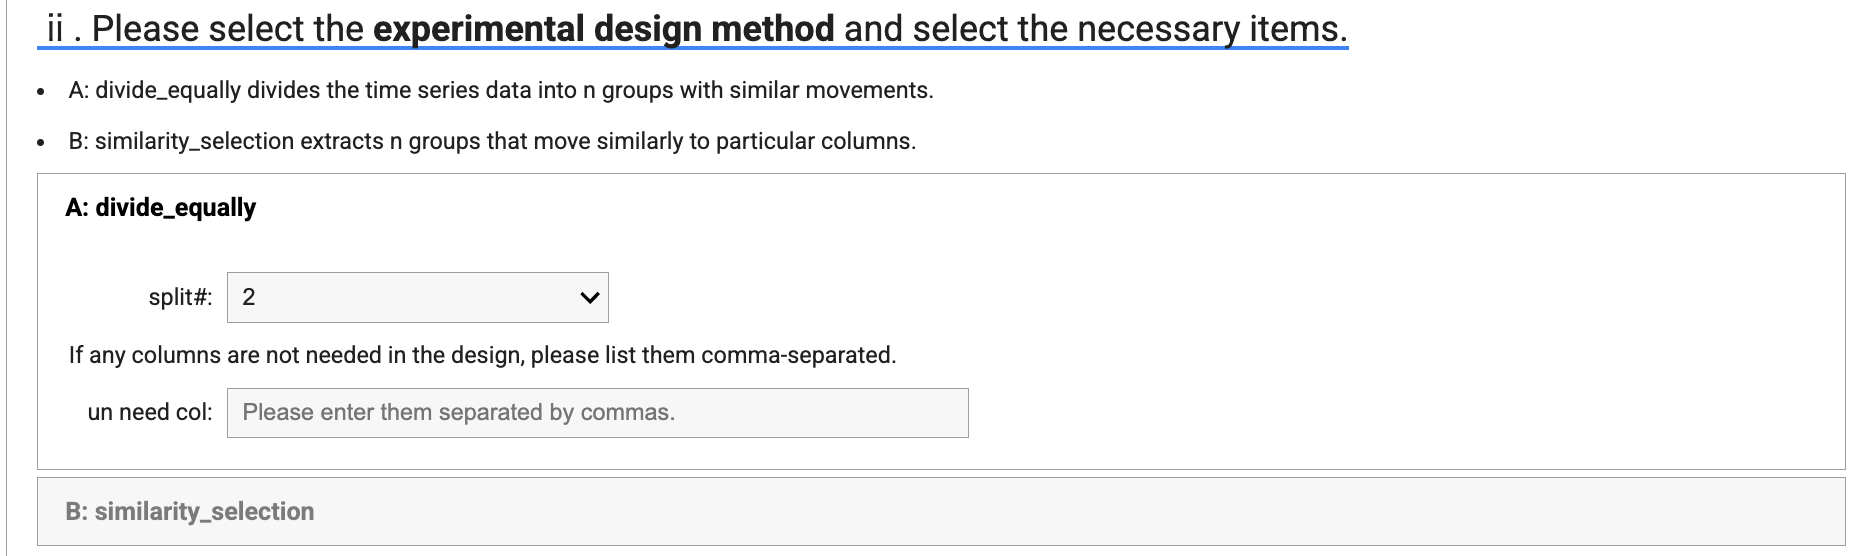
99 |
100 | 5. After updating required items, enter the estimated incremental CPA.
101 | 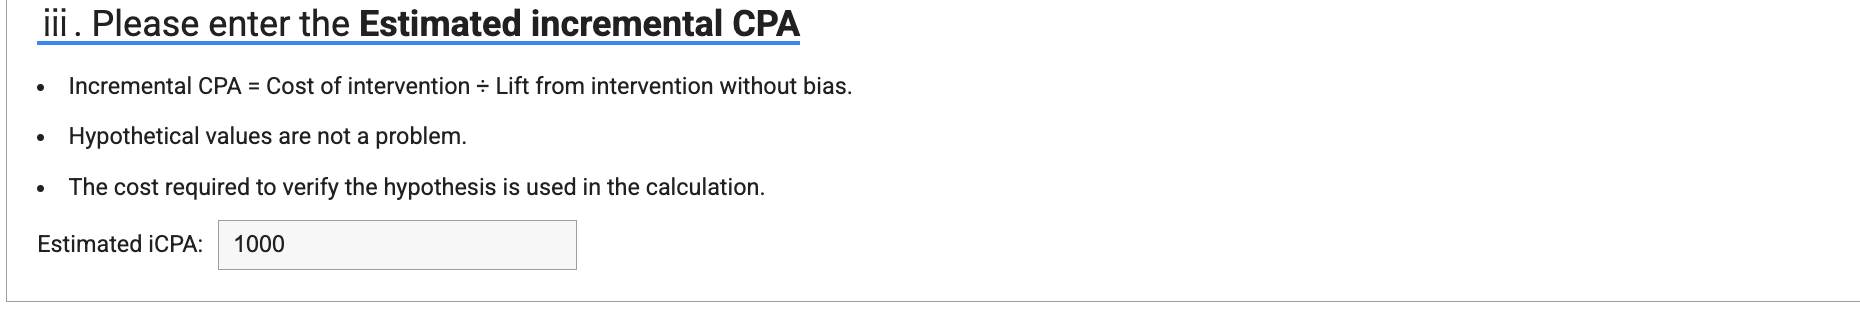
102 |
103 | 6. In question 2, please select the data source from **google_spreadsheet**, **CSV_file**, or **Big_Query**.
104 | Then enter the required items.
105 | 
106 |
107 | 6. After entering the required items, select data format [**narrow_format** or **wide_format**](https://en.wikipedia.org/wiki/Wide_and_narrow_data) and enter the required fields.
108 | 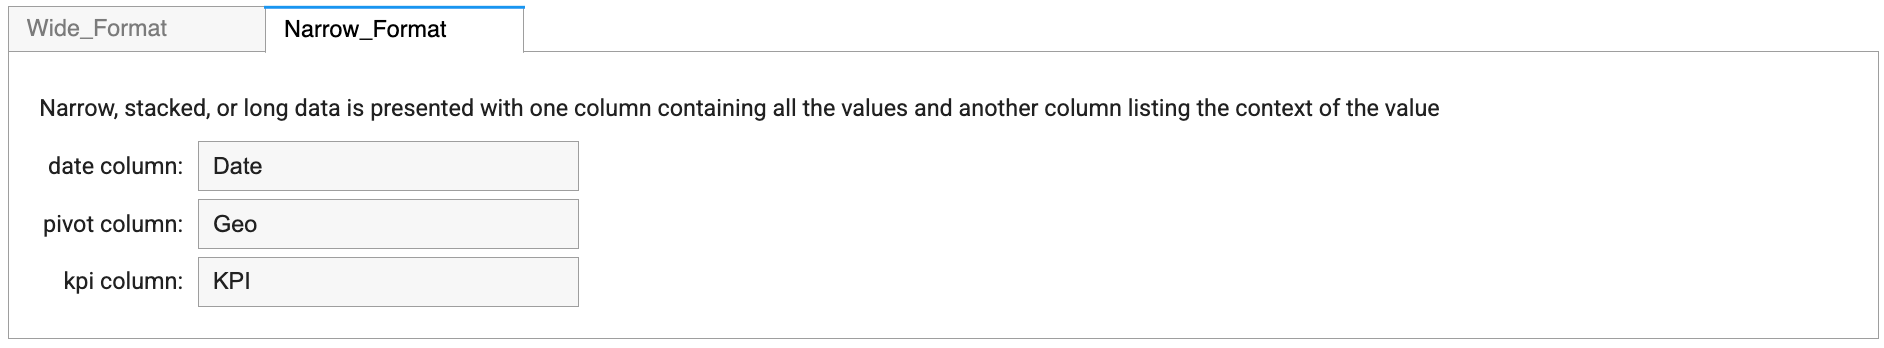
109 |
110 | 7. Once the items are filled in, run the **Step 2** cell.
111 | (:warning: If you have selected **google_spreadsheet** or **big_query**, a pop-up will appear regarding granting permission, so please grant it to Colab.)
112 |
113 | 8. The output results will vary depending on the type of experimental design, but select the data on which you want to run the simulation.
114 |
115 | 9. Once the items are filled in, run the **Step 3** cell. Depending on the data, this may take more than 10 minutes.
116 | After Step 3 is run, the results are displayed in a table. Check the MAPE, budget and p-value, and consider the intervention period and the assumed increments to experimental design.
117 | 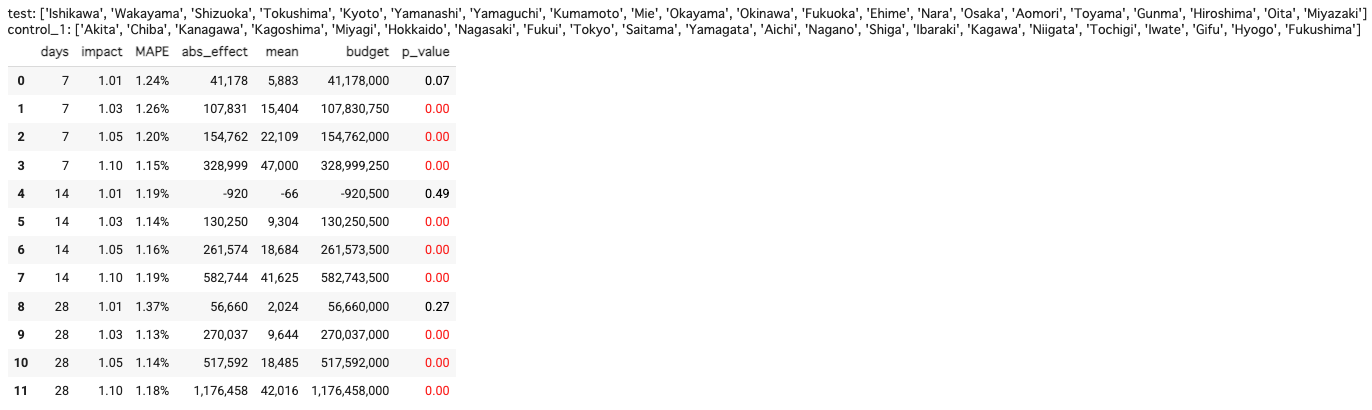
118 |
119 | 10. run the **Step 4** cell.
120 | 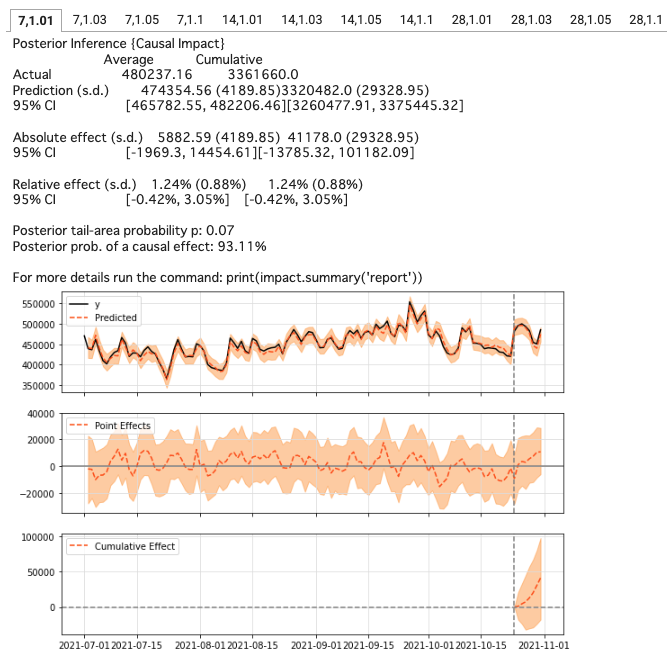
121 |
--------------------------------------------------------------------------------
/LICENSE:
--------------------------------------------------------------------------------
1 | Apache License
2 | Version 2.0, January 2004
3 | http://www.apache.org/licenses/
4 |
5 | TERMS AND CONDITIONS FOR USE, REPRODUCTION, AND DISTRIBUTION
6 |
7 | 1. Definitions.
8 |
9 | "License" shall mean the terms and conditions for use, reproduction,
10 | and distribution as defined by Sections 1 through 9 of this document.
11 |
12 | "Licensor" shall mean the copyright owner or entity authorized by
13 | the copyright owner that is granting the License.
14 |
15 | "Legal Entity" shall mean the union of the acting entity and all
16 | other entities that control, are controlled by, or are under common
17 | control with that entity. For the purposes of this definition,
18 | "control" means (i) the power, direct or indirect, to cause the
19 | direction or management of such entity, whether by contract or
20 | otherwise, or (ii) ownership of fifty percent (50%) or more of the
21 | outstanding shares, or (iii) beneficial ownership of such entity.
22 |
23 | "You" (or "Your") shall mean an individual or Legal Entity
24 | exercising permissions granted by this License.
25 |
26 | "Source" form shall mean the preferred form for making modifications,
27 | including but not limited to software source code, documentation
28 | source, and configuration files.
29 |
30 | "Object" form shall mean any form resulting from mechanical
31 | transformation or translation of a Source form, including but
32 | not limited to compiled object code, generated documentation,
33 | and conversions to other media types.
34 |
35 | "Work" shall mean the work of authorship, whether in Source or
36 | Object form, made available under the License, as indicated by a
37 | copyright notice that is included in or attached to the work
38 | (an example is provided in the Appendix below).
39 |
40 | "Derivative Works" shall mean any work, whether in Source or Object
41 | form, that is based on (or derived from) the Work and for which the
42 | editorial revisions, annotations, elaborations, or other modifications
43 | represent, as a whole, an original work of authorship. For the purposes
44 | of this License, Derivative Works shall not include works that remain
45 | separable from, or merely link (or bind by name) to the interfaces of,
46 | the Work and Derivative Works thereof.
47 |
48 | "Contribution" shall mean any work of authorship, including
49 | the original version of the Work and any modifications or additions
50 | to that Work or Derivative Works thereof, that is intentionally
51 | submitted to Licensor for inclusion in the Work by the copyright owner
52 | or by an individual or Legal Entity authorized to submit on behalf of
53 | the copyright owner. For the purposes of this definition, "submitted"
54 | means any form of electronic, verbal, or written communication sent
55 | to the Licensor or its representatives, including but not limited to
56 | communication on electronic mailing lists, source code control systems,
57 | and issue tracking systems that are managed by, or on behalf of, the
58 | Licensor for the purpose of discussing and improving the Work, but
59 | excluding communication that is conspicuously marked or otherwise
60 | designated in writing by the copyright owner as "Not a Contribution."
61 |
62 | "Contributor" shall mean Licensor and any individual or Legal Entity
63 | on behalf of whom a Contribution has been received by Licensor and
64 | subsequently incorporated within the Work.
65 |
66 | 2. Grant of Copyright License. Subject to the terms and conditions of
67 | this License, each Contributor hereby grants to You a perpetual,
68 | worldwide, non-exclusive, no-charge, royalty-free, irrevocable
69 | copyright license to reproduce, prepare Derivative Works of,
70 | publicly display, publicly perform, sublicense, and distribute the
71 | Work and such Derivative Works in Source or Object form.
72 |
73 | 3. Grant of Patent License. Subject to the terms and conditions of
74 | this License, each Contributor hereby grants to You a perpetual,
75 | worldwide, non-exclusive, no-charge, royalty-free, irrevocable
76 | (except as stated in this section) patent license to make, have made,
77 | use, offer to sell, sell, import, and otherwise transfer the Work,
78 | where such license applies only to those patent claims licensable
79 | by such Contributor that are necessarily infringed by their
80 | Contribution(s) alone or by combination of their Contribution(s)
81 | with the Work to which such Contribution(s) was submitted. If You
82 | institute patent litigation against any entity (including a
83 | cross-claim or counterclaim in a lawsuit) alleging that the Work
84 | or a Contribution incorporated within the Work constitutes direct
85 | or contributory patent infringement, then any patent licenses
86 | granted to You under this License for that Work shall terminate
87 | as of the date such litigation is filed.
88 |
89 | 4. Redistribution. You may reproduce and distribute copies of the
90 | Work or Derivative Works thereof in any medium, with or without
91 | modifications, and in Source or Object form, provided that You
92 | meet the following conditions:
93 |
94 | (a) You must give any other recipients of the Work or
95 | Derivative Works a copy of this License; and
96 |
97 | (b) You must cause any modified files to carry prominent notices
98 | stating that You changed the files; and
99 |
100 | (c) You must retain, in the Source form of any Derivative Works
101 | that You distribute, all copyright, patent, trademark, and
102 | attribution notices from the Source form of the Work,
103 | excluding those notices that do not pertain to any part of
104 | the Derivative Works; and
105 |
106 | (d) If the Work includes a "NOTICE" text file as part of its
107 | distribution, then any Derivative Works that You distribute must
108 | include a readable copy of the attribution notices contained
109 | within such NOTICE file, excluding those notices that do not
110 | pertain to any part of the Derivative Works, in at least one
111 | of the following places: within a NOTICE text file distributed
112 | as part of the Derivative Works; within the Source form or
113 | documentation, if provided along with the Derivative Works; or,
114 | within a display generated by the Derivative Works, if and
115 | wherever such third-party notices normally appear. The contents
116 | of the NOTICE file are for informational purposes only and
117 | do not modify the License. You may add Your own attribution
118 | notices within Derivative Works that You distribute, alongside
119 | or as an addendum to the NOTICE text from the Work, provided
120 | that such additional attribution notices cannot be construed
121 | as modifying the License.
122 |
123 | You may add Your own copyright statement to Your modifications and
124 | may provide additional or different license terms and conditions
125 | for use, reproduction, or distribution of Your modifications, or
126 | for any such Derivative Works as a whole, provided Your use,
127 | reproduction, and distribution of the Work otherwise complies with
128 | the conditions stated in this License.
129 |
130 | 5. Submission of Contributions. Unless You explicitly state otherwise,
131 | any Contribution intentionally submitted for inclusion in the Work
132 | by You to the Licensor shall be under the terms and conditions of
133 | this License, without any additional terms or conditions.
134 | Notwithstanding the above, nothing herein shall supersede or modify
135 | the terms of any separate license agreement you may have executed
136 | with Licensor regarding such Contributions.
137 |
138 | 6. Trademarks. This License does not grant permission to use the trade
139 | names, trademarks, service marks, or product names of the Licensor,
140 | except as required for reasonable and customary use in describing the
141 | origin of the Work and reproducing the content of the NOTICE file.
142 |
143 | 7. Disclaimer of Warranty. Unless required by applicable law or
144 | agreed to in writing, Licensor provides the Work (and each
145 | Contributor provides its Contributions) on an "AS IS" BASIS,
146 | WITHOUT WARRANTIES OR CONDITIONS OF ANY KIND, either express or
147 | implied, including, without limitation, any warranties or conditions
148 | of TITLE, NON-INFRINGEMENT, MERCHANTABILITY, or FITNESS FOR A
149 | PARTICULAR PURPOSE. You are solely responsible for determining the
150 | appropriateness of using or redistributing the Work and assume any
151 | risks associated with Your exercise of permissions under this License.
152 |
153 | 8. Limitation of Liability. In no event and under no legal theory,
154 | whether in tort (including negligence), contract, or otherwise,
155 | unless required by applicable law (such as deliberate and grossly
156 | negligent acts) or agreed to in writing, shall any Contributor be
157 | liable to You for damages, including any direct, indirect, special,
158 | incidental, or consequential damages of any character arising as a
159 | result of this License or out of the use or inability to use the
160 | Work (including but not limited to damages for loss of goodwill,
161 | work stoppage, computer failure or malfunction, or any and all
162 | other commercial damages or losses), even if such Contributor
163 | has been advised of the possibility of such damages.
164 |
165 | 9. Accepting Warranty or Additional Liability. While redistributing
166 | the Work or Derivative Works thereof, You may choose to offer,
167 | and charge a fee for, acceptance of support, warranty, indemnity,
168 | or other liability obligations and/or rights consistent with this
169 | License. However, in accepting such obligations, You may act only
170 | on Your own behalf and on Your sole responsibility, not on behalf
171 | of any other Contributor, and only if You agree to indemnify,
172 | defend, and hold each Contributor harmless for any liability
173 | incurred by, or claims asserted against, such Contributor by reason
174 | of your accepting any such warranty or additional liability.
175 |
176 | END OF TERMS AND CONDITIONS
177 |
178 | APPENDIX: How to apply the Apache License to your work.
179 |
180 | To apply the Apache License to your work, attach the following
181 | boilerplate notice, with the fields enclosed by brackets "[]"
182 | replaced with your own identifying information. (Don't include
183 | the brackets!) The text should be enclosed in the appropriate
184 | comment syntax for the file format. We also recommend that a
185 | file or class name and description of purpose be included on the
186 | same "printed page" as the copyright notice for easier
187 | identification within third-party archives.
188 |
189 | Copyright [yyyy] [name of copyright owner]
190 |
191 | Licensed under the Apache License, Version 2.0 (the "License");
192 | you may not use this file except in compliance with the License.
193 | You may obtain a copy of the License at
194 |
195 | http://www.apache.org/licenses/LICENSE-2.0
196 |
197 | Unless required by applicable law or agreed to in writing, software
198 | distributed under the License is distributed on an "AS IS" BASIS,
199 | WITHOUT WARRANTIES OR CONDITIONS OF ANY KIND, either express or implied.
200 | See the License for the specific language governing permissions and
201 | limitations under the License.
202 |
--------------------------------------------------------------------------------
/solutions/causal-impact/CausalImpact_with_Experimental_Design.ipynb:
--------------------------------------------------------------------------------
1 | {
2 | "cells": [
3 | {
4 | "cell_type": "markdown",
5 | "metadata": {
6 | "id": "view-in-github",
7 | "colab_type": "text"
8 | },
9 | "source": [
10 | " "
11 | ]
12 | },
13 | {
14 | "cell_type": "markdown",
15 | "metadata": {
16 | "id": "dH_QXijHFzJP"
17 | },
18 | "source": [
19 | "# **CausalImpact with Experimental Design**\n",
20 | "\n",
21 | "This Colab file contains *Experimental Design* and *CausalImpact Analysis*.\n",
22 | "\n",
23 | "See [README.md](https://github.com/google/business_intelligence_group/tree/main/solutions/causal-impact) for details\n",
24 | "\n",
25 | "---\n",
26 | "\n",
27 | "Copyright 2024 Google LLC\n",
28 | "\n",
29 | "Licensed under the Apache License, Version 2.0 (the \"License\"); you may not use this file except in compliance with the License. You may obtain a copy of the License at https://www.apache.org/licenses/LICENSE-2.0\n",
30 | "\n",
31 | "Unless required by applicable law or agreed to in writing, software distributed under the License is distributed on an \"AS IS\" BASIS, WITHOUT WARRANTIES OR CONDITIONS OF ANY KIND, either express or implied. See the License for the specific language governing permissions and limitations under the License."
32 | ]
33 | },
34 | {
35 | "cell_type": "code",
36 | "source": [
37 | "# @title Step.1 (~ 2min)\n",
38 | "%%time\n",
39 | "\n",
40 | "import sys\n",
41 | "if 'fastdtw' not in sys.modules:\n",
42 | " !pip install 'fastdtw' --q\n",
43 | "if 'tslearn' not in sys.modules:\n",
44 | " !pip install 'tslearn' --q\n",
45 | "if 'tfp-causalimpact' not in sys.modules:\n",
46 | " !pip install 'tfp-causalimpact' --q\n",
47 | "\n",
48 | "# Data Load\n",
49 | "from google.colab import auth, files, widgets\n",
50 | "from google.auth import default\n",
51 | "from google.cloud import bigquery\n",
52 | "import io\n",
53 | "import os\n",
54 | "import gspread\n",
55 | "from oauth2client.client import GoogleCredentials\n",
56 | "\n",
57 | "# Calculate\n",
58 | "import altair as alt\n",
59 | "import itertools\n",
60 | "import random\n",
61 | "import numpy as np\n",
62 | "import pandas as pd\n",
63 | "import fastdtw\n",
64 | "\n",
65 | "from tslearn.clustering import TimeSeriesKMeans\n",
66 | "from decimal import Decimal, ROUND_HALF_UP\n",
67 | "from scipy.spatial.distance import euclidean\n",
68 | "from sklearn.metrics import mean_absolute_percentage_error\n",
69 | "from sklearn.preprocessing import MinMaxScaler\n",
70 | "from statsmodels.tsa.seasonal import STL\n",
71 | "\n",
72 | "# UI/UX\n",
73 | "import datetime\n",
74 | "from dateutil.relativedelta import relativedelta\n",
75 | "import ipywidgets\n",
76 | "from IPython.display import display, Markdown, HTML, Javascript\n",
77 | "from tqdm.auto import tqdm\n",
78 | "import warnings\n",
79 | "warnings.simplefilter('ignore')\n",
80 | "\n",
81 | "# causalimpact\n",
82 | "import causalimpact\n",
83 | "import tensorflow as tf\n",
84 | "import tensorflow_probability as tfp\n",
85 | "tfd = tfp.distributions\n",
86 | "\n",
87 | "class PreProcess(object):\n",
88 | " \"\"\"PreProcess handles process from data loading to visualization.\n",
89 | "\n",
90 | " Create a UI, load time series data based on input and do some\n",
91 | " transformations to pass it to analysis. This also includes visualization of\n",
92 | " points that should be confirmed in time series data.\n",
93 | "\n",
94 | " Attributes:\n",
95 | " _apply_text_style: Decorate the text\n",
96 | " define_ui: Define the UI using ipywidget\n",
97 | " generate_ui: Generates UI for input from the user\n",
98 | " load_data: Load data from any data source\n",
99 | " _load_data_from_sheet: Load data from spreadsheet\n",
100 | " _load_data_from_csv: Load data from CSV\n",
101 | " _load_data_from_bigquery: Load data from Big Query\n",
102 | " format_date: Set index\n",
103 | " _shape_wide: Configure narrow/wide conversion\n",
104 | " _trend_check: Visualize data\n",
105 | " saving_params: Save the contents entered in the UI\n",
106 | " set_params: Set the saved input contents to the instance\n",
107 | " \"\"\"\n",
108 | "\n",
109 | " def __init__(self):\n",
110 | " self.define_ui()\n",
111 | "\n",
112 | " @staticmethod\n",
113 | " def _apply_text_style(type, text):\n",
114 | " if type == 'success':\n",
115 | " return print(f\"\\033[38;2;15;157;88m \" + text + \"\\033[0m\")\n",
116 | "\n",
117 | " if type == 'failure':\n",
118 | " return print(f\"\\033[38;2;219;68;55m \" + text + \"\\033[0m\")\n",
119 | "\n",
120 | " if isinstance(type, int):\n",
121 | " span_style = ipywidgets.HTML(\n",
122 | " \"\"\n",
124 | " + text\n",
125 | " + ''\n",
126 | " )\n",
127 | " return span_style\n",
128 | "\n",
129 | " def define_ui(self):\n",
130 | " self._define_data_source_widgets()\n",
131 | " self._define_data_format_widgets()\n",
132 | " self._define_date_widgets()\n",
133 | " self._define_experimental_design_widgets()\n",
134 | " self._define_simulation_widgets()\n",
135 | "\n",
136 | " def _define_data_source_widgets(self):\n",
137 | " # Input box for data sources\n",
138 | " self.sheet_url = ipywidgets.Text(\n",
139 | " placeholder='Please enter google spreadsheet url',\n",
140 | " value='https://docs.google.com/spreadsheets/d/1dISrbX1mZHgzpsIct2QXFOWWRRJiCxDSmSzjuZz64Tw/edit#gid=0',\n",
141 | " description='spreadsheet url:',\n",
142 | " style={'description_width': 'initial'},\n",
143 | " layout=ipywidgets.Layout(width='800px'),\n",
144 | " )\n",
145 | " self.sheet_name = ipywidgets.Text(\n",
146 | " placeholder='Please enter sheet name',\n",
147 | " value='analysis_data',\n",
148 | " # value='raw_data',\n",
149 | " description='sheet name:',\n",
150 | " )\n",
151 | " self.csv_name = ipywidgets.Text(\n",
152 | " placeholder='Please enter csv name',\n",
153 | " description='csv name:',\n",
154 | " layout=ipywidgets.Layout(width='500px'),\n",
155 | " )\n",
156 | " self.bq_project_id = ipywidgets.Text(\n",
157 | " placeholder='Please enter project id',\n",
158 | " description='project id:',\n",
159 | " layout=ipywidgets.Layout(width='500px'),\n",
160 | " )\n",
161 | " self.bq_table_name = ipywidgets.Text(\n",
162 | " placeholder='Please enter table name',\n",
163 | " description='table name:',\n",
164 | " layout=ipywidgets.Layout(width='500px'),\n",
165 | " )\n",
166 | "\n",
167 | " def _define_data_format_widgets(self):\n",
168 | " # Input box for data format\n",
169 | " self.date_col = ipywidgets.Text(\n",
170 | " placeholder='Please enter date column name',\n",
171 | " value='Date',\n",
172 | " description='date column:',\n",
173 | " )\n",
174 | " self.pivot_col = ipywidgets.Text(\n",
175 | " placeholder='Please enter pivot column name',\n",
176 | " value='Geo',\n",
177 | " description='pivot column:',\n",
178 | " )\n",
179 | " self.kpi_col = ipywidgets.Text(\n",
180 | " placeholder='Please enter kpi column name',\n",
181 | " value='KPI',\n",
182 | " description='kpi column:',\n",
183 | " )\n",
184 | "\n",
185 | " def _define_experimental_design_widgets(self):\n",
186 | " # Input box for Experimental_Design-related\n",
187 | " self.exclude_cols = ipywidgets.Text(\n",
188 | " placeholder=(\n",
189 | " 'Enter comma-separated columns if any columns are not used in the'\n",
190 | " ' design.'\n",
191 | " ),\n",
192 | " description='exclude cols:',\n",
193 | " layout=ipywidgets.Layout(width='1000px'),\n",
194 | " )\n",
195 | " self.num_of_split = ipywidgets.Dropdown(\n",
196 | " options=[2, 3, 4, 5],\n",
197 | " value=2,\n",
198 | " description='split#:',\n",
199 | " disabled=False,\n",
200 | " )\n",
201 | " self.target_columns = ipywidgets.Text(\n",
202 | " placeholder='Please enter comma-separated entries',\n",
203 | " value='Tokyo, Kanagawa',\n",
204 | " description='target_cols:',\n",
205 | " layout=ipywidgets.Layout(width='500px'),\n",
206 | " )\n",
207 | " self.num_of_pick_range = ipywidgets.IntRangeSlider(\n",
208 | " value=[5, 10],\n",
209 | " min=1,\n",
210 | " max=50,\n",
211 | " step=1,\n",
212 | " description='pick range:',\n",
213 | " orientation='horizontal',\n",
214 | " readout=True,\n",
215 | " readout_format='d',\n",
216 | " )\n",
217 | " self.num_of_covariate = ipywidgets.Dropdown(\n",
218 | " options=[1, 2, 3, 4, 5],\n",
219 | " value=1,\n",
220 | " description='covariate#:',\n",
221 | " layout=ipywidgets.Layout(width='192px'),\n",
222 | " )\n",
223 | " self.target_share = ipywidgets.FloatSlider(\n",
224 | " value=0.3,\n",
225 | " min=0.05,\n",
226 | " max=0.5,\n",
227 | " step=0.05,\n",
228 | " description='target share#:',\n",
229 | " orientation='horizontal',\n",
230 | " readout=True,\n",
231 | " readout_format='.1%',\n",
232 | " )\n",
233 | " self.control_columns = ipywidgets.Text(\n",
234 | " placeholder='Please enter comma-separated entries',\n",
235 | " value='Aomori, Akita',\n",
236 | " description='control_cols:',\n",
237 | " layout=ipywidgets.Layout(width='500px'),\n",
238 | " )\n",
239 | "\n",
240 | " def _define_simulation_widgets(self):\n",
241 | " # Input box for simulation params\n",
242 | " self.num_of_seasons = ipywidgets.IntText(\n",
243 | " value=1,\n",
244 | " description='num_of_seasons:',\n",
245 | " disabled=False,\n",
246 | " style={'description_width': 'initial'},\n",
247 | " )\n",
248 | " self.estimate_icpa = ipywidgets.IntText(\n",
249 | " value=1000,\n",
250 | " description='Estimated iCPA:',\n",
251 | " style={'description_width': 'initial'},\n",
252 | " )\n",
253 | " self.credible_interval = ipywidgets.RadioButtons(\n",
254 | " options=[70, 80, 90, 95],\n",
255 | " value=90,\n",
256 | " description='Credible interval %:',\n",
257 | " style={'description_width': 'initial'},\n",
258 | " )\n",
259 | "\n",
260 | " def _define_date_widgets(self):\n",
261 | " # Input box for Date-related\n",
262 | " self.pre_period_start = ipywidgets.DatePicker(\n",
263 | " description='Pre Start:',\n",
264 | " value=datetime.date.today() - relativedelta(days=122),\n",
265 | " )\n",
266 | " self.pre_period_end = ipywidgets.DatePicker(\n",
267 | " description='Pre End:',\n",
268 | " value=datetime.date.today() - relativedelta(days=32),\n",
269 | " )\n",
270 | " self.post_period_start = ipywidgets.DatePicker(\n",
271 | " description='Post Start:',\n",
272 | " value=datetime.date.today() - relativedelta(days=31),\n",
273 | " )\n",
274 | " self.post_period_end = ipywidgets.DatePicker(\n",
275 | " description='Post End:',\n",
276 | " value=datetime.date.today(),\n",
277 | " )\n",
278 | " self.start_date = ipywidgets.DatePicker(\n",
279 | " description='Start Date:',\n",
280 | " value=datetime.date.today() - relativedelta(days=122),\n",
281 | " )\n",
282 | " self.end_date = ipywidgets.DatePicker(\n",
283 | " description='End Date:',\n",
284 | " value=datetime.date.today() - relativedelta(days=32),\n",
285 | " )\n",
286 | " self.depend_data = ipywidgets.ToggleButton(\n",
287 | " value=False,\n",
288 | " description='Click >> Use the beginning and end of data',\n",
289 | " disabled=False,\n",
290 | " button_style='info',\n",
291 | " tooltip='Description',\n",
292 | " layout=ipywidgets.Layout(width='300px'),\n",
293 | " )\n",
294 | "\n",
295 | " def generate_ui(self):\n",
296 | " self._build_source_selection_tab()\n",
297 | " self._build_data_type_selection_tab()\n",
298 | " self._build_design_type_tab()\n",
299 | " self._build_purpose_selection_tab()\n",
300 | "\n",
301 | " def _build_source_selection_tab(self):\n",
302 | " # UI for data soure\n",
303 | " self.soure_selection = ipywidgets.Tab()\n",
304 | " self.soure_selection.children = [\n",
305 | " ipywidgets.VBox([self.sheet_url, self.sheet_name]),\n",
306 | " ipywidgets.VBox([self.csv_name]),\n",
307 | " ipywidgets.VBox([self.bq_project_id, self.bq_table_name]),\n",
308 | " ]\n",
309 | " self.soure_selection.set_title(0, 'Google_Spreadsheet')\n",
310 | " self.soure_selection.set_title(1, 'CSV_file')\n",
311 | " self.soure_selection.set_title(2, 'Big_Query')\n",
312 | "\n",
313 | " def _build_data_type_selection_tab(self):\n",
314 | " # UI for data type(narrow or wide)\n",
315 | " self.data_type_selection = ipywidgets.Tab()\n",
316 | " self.data_type_selection.children = [\n",
317 | " ipywidgets.VBox([\n",
318 | " ipywidgets.Label(\n",
319 | " 'Wide, or unstacked data is presented with each different'\n",
320 | " ' data variable in a separate column.'\n",
321 | " ),\n",
322 | " self.date_col,\n",
323 | " ]),\n",
324 | " ipywidgets.VBox([\n",
325 | " ipywidgets.Label(\n",
326 | " 'Narrow, stacked, or long data is presented with one column '\n",
327 | " 'containing all the values and another column listing the '\n",
328 | " 'context of the value'\n",
329 | " ),\n",
330 | " ipywidgets.HBox([self.date_col, self.pivot_col, self.kpi_col]),\n",
331 | " ]),\n",
332 | " ]\n",
333 | " self.data_type_selection.set_title(0, 'Wide_Format')\n",
334 | " self.data_type_selection.set_title(1, 'Narrow_Format')\n",
335 | "\n",
336 | " def _build_design_type_tab(self):\n",
337 | " # UI for experimental design\n",
338 | " self.design_type = ipywidgets.Tab(\n",
339 | " children=[\n",
340 | " ipywidgets.VBox([\n",
341 | " ipywidgets.HTML(\n",
342 | " 'divide_equally divides the time series data into N'\n",
343 | " ' groups(split#) with similar movements.'\n",
344 | " ),\n",
345 | " self.num_of_split,\n",
346 | " self.exclude_cols,\n",
347 | " ]),\n",
348 | " ipywidgets.VBox([\n",
349 | " ipywidgets.HTML(\n",
350 | " 'similarity_selection extracts N groups(covariate#) that '\n",
351 | " 'move similarly to particular columns(target_cols).'\n",
352 | " ),\n",
353 | " ipywidgets.HBox([\n",
354 | " self.target_columns,\n",
355 | " self.num_of_covariate,\n",
356 | " self.num_of_pick_range,\n",
357 | " ]),\n",
358 | " self.exclude_cols,\n",
359 | " ]),\n",
360 | " ipywidgets.VBox([\n",
361 | " ipywidgets.HTML(\n",
362 | " 'target share extracts targeted time series data from'\n",
363 | " ' the proportion of interventions.'\n",
364 | " ),\n",
365 | " self.target_share,\n",
366 | " self.exclude_cols,\n",
367 | " ]),\n",
368 | " ipywidgets.VBox([\n",
369 | " ipywidgets.HTML(\n",
370 | " 'To improve reproducibility, it is important to create an'\n",
371 | " ' accurate counterfactual model rather than a balanced'\n",
372 | " ' assignment.'\n",
373 | " ),\n",
374 | " self.target_columns,\n",
375 | " self.control_columns,\n",
376 | " ]),\n",
377 | " ]\n",
378 | " )\n",
379 | " self.design_type.set_title(0, 'A: divide_equally')\n",
380 | " self.design_type.set_title(1, 'B: similarity_selection')\n",
381 | " self.design_type.set_title(2, 'C: target_share')\n",
382 | " self.design_type.set_title(3, 'D: pre-allocated')\n",
383 | "\n",
384 | " def _build_purpose_selection_tab(self):\n",
385 | " # UI for purpose (CausalImpact or Experimental Design)\n",
386 | " self.purpose_selection = ipywidgets.Tab()\n",
387 | " self.date_selection = ipywidgets.Tab()\n",
388 | " self.date_selection.children = [\n",
389 | " ipywidgets.VBox(\n",
390 | " [\n",
391 | " ipywidgets.HTML('The minimum date of the data is '\n",
392 | " 'selected as the start date.'),\n",
393 | " ipywidgets.HTML('The maximum date in the data is '\n",
394 | " 'selected as the end date.'),\n",
395 | " ]),\n",
396 | " ipywidgets.VBox(\n",
397 | " [\n",
398 | " self.start_date,\n",
399 | " self.end_date,\n",
400 | " ]\n",
401 | " )]\n",
402 | " self.date_selection.set_title(0, 'automatic selection')\n",
403 | " self.date_selection.set_title(1, 'manual input')\n",
404 | "\n",
405 | " self.purpose_selection.children = [\n",
406 | " # Causalimpact\n",
407 | " ipywidgets.VBox([\n",
408 | " PreProcess._apply_text_style(\n",
409 | " 15, '⑶ - a: Enter the Pre and Post the intervention.'\n",
410 | " ),\n",
411 | " self.pre_period_start,\n",
412 | " self.pre_period_end,\n",
413 | " self.post_period_start,\n",
414 | " self.post_period_end,\n",
415 | " PreProcess._apply_text_style(\n",
416 | " 15,\n",
417 | " '⑶ - b: Enter the number of periodicities in the'\n",
418 | " ' time series data.(default=1)',\n",
419 | " ),\n",
420 | " ipywidgets.VBox([self.num_of_seasons, self.credible_interval]),\n",
421 | " ]),\n",
422 | " # Experimental_Design\n",
423 | " ipywidgets.VBox([\n",
424 | " PreProcess._apply_text_style(\n",
425 | " 15,\n",
426 | " '⑶ - a: Please select date for experimental design',\n",
427 | " ),\n",
428 | " self.date_selection,\n",
429 | " PreProcess._apply_text_style(\n",
430 | " 15,\n",
431 | " '⑶ - b: Select the experimental design method and'\n",
432 | " ' enter the necessary items.',\n",
433 | " ),\n",
434 | " self.design_type,\n",
435 | " PreProcess._apply_text_style(\n",
436 | " 15,\n",
437 | " '⑶ - c: (Optional) Enter Estimated incremental CPA(Cost'\n",
438 | " ' of intervention ÷ Lift from intervention without bias) & the '\n",
439 | " 'number of periodicities in the time series data.',\n",
440 | " ),\n",
441 | " ipywidgets.VBox([\n",
442 | " self.estimate_icpa,\n",
443 | " self.num_of_seasons,\n",
444 | " self.credible_interval,\n",
445 | " ]),\n",
446 | " ]),\n",
447 | " ]\n",
448 | " self.purpose_selection.set_title(0, 'Causalimpact')\n",
449 | " self.purpose_selection.set_title(1, 'Experimental_Design')\n",
450 | "\n",
451 | " display(\n",
452 | " PreProcess._apply_text_style(18, '⑴ Please select a data source.'),\n",
453 | " self.soure_selection,\n",
454 | " Markdown('
"
11 | ]
12 | },
13 | {
14 | "cell_type": "markdown",
15 | "metadata": {
16 | "id": "dH_QXijHFzJP"
17 | },
18 | "source": [
19 | "# **CausalImpact with Experimental Design**\n",
20 | "\n",
21 | "This Colab file contains *Experimental Design* and *CausalImpact Analysis*.\n",
22 | "\n",
23 | "See [README.md](https://github.com/google/business_intelligence_group/tree/main/solutions/causal-impact) for details\n",
24 | "\n",
25 | "---\n",
26 | "\n",
27 | "Copyright 2024 Google LLC\n",
28 | "\n",
29 | "Licensed under the Apache License, Version 2.0 (the \"License\"); you may not use this file except in compliance with the License. You may obtain a copy of the License at https://www.apache.org/licenses/LICENSE-2.0\n",
30 | "\n",
31 | "Unless required by applicable law or agreed to in writing, software distributed under the License is distributed on an \"AS IS\" BASIS, WITHOUT WARRANTIES OR CONDITIONS OF ANY KIND, either express or implied. See the License for the specific language governing permissions and limitations under the License."
32 | ]
33 | },
34 | {
35 | "cell_type": "code",
36 | "source": [
37 | "# @title Step.1 (~ 2min)\n",
38 | "%%time\n",
39 | "\n",
40 | "import sys\n",
41 | "if 'fastdtw' not in sys.modules:\n",
42 | " !pip install 'fastdtw' --q\n",
43 | "if 'tslearn' not in sys.modules:\n",
44 | " !pip install 'tslearn' --q\n",
45 | "if 'tfp-causalimpact' not in sys.modules:\n",
46 | " !pip install 'tfp-causalimpact' --q\n",
47 | "\n",
48 | "# Data Load\n",
49 | "from google.colab import auth, files, widgets\n",
50 | "from google.auth import default\n",
51 | "from google.cloud import bigquery\n",
52 | "import io\n",
53 | "import os\n",
54 | "import gspread\n",
55 | "from oauth2client.client import GoogleCredentials\n",
56 | "\n",
57 | "# Calculate\n",
58 | "import altair as alt\n",
59 | "import itertools\n",
60 | "import random\n",
61 | "import numpy as np\n",
62 | "import pandas as pd\n",
63 | "import fastdtw\n",
64 | "\n",
65 | "from tslearn.clustering import TimeSeriesKMeans\n",
66 | "from decimal import Decimal, ROUND_HALF_UP\n",
67 | "from scipy.spatial.distance import euclidean\n",
68 | "from sklearn.metrics import mean_absolute_percentage_error\n",
69 | "from sklearn.preprocessing import MinMaxScaler\n",
70 | "from statsmodels.tsa.seasonal import STL\n",
71 | "\n",
72 | "# UI/UX\n",
73 | "import datetime\n",
74 | "from dateutil.relativedelta import relativedelta\n",
75 | "import ipywidgets\n",
76 | "from IPython.display import display, Markdown, HTML, Javascript\n",
77 | "from tqdm.auto import tqdm\n",
78 | "import warnings\n",
79 | "warnings.simplefilter('ignore')\n",
80 | "\n",
81 | "# causalimpact\n",
82 | "import causalimpact\n",
83 | "import tensorflow as tf\n",
84 | "import tensorflow_probability as tfp\n",
85 | "tfd = tfp.distributions\n",
86 | "\n",
87 | "class PreProcess(object):\n",
88 | " \"\"\"PreProcess handles process from data loading to visualization.\n",
89 | "\n",
90 | " Create a UI, load time series data based on input and do some\n",
91 | " transformations to pass it to analysis. This also includes visualization of\n",
92 | " points that should be confirmed in time series data.\n",
93 | "\n",
94 | " Attributes:\n",
95 | " _apply_text_style: Decorate the text\n",
96 | " define_ui: Define the UI using ipywidget\n",
97 | " generate_ui: Generates UI for input from the user\n",
98 | " load_data: Load data from any data source\n",
99 | " _load_data_from_sheet: Load data from spreadsheet\n",
100 | " _load_data_from_csv: Load data from CSV\n",
101 | " _load_data_from_bigquery: Load data from Big Query\n",
102 | " format_date: Set index\n",
103 | " _shape_wide: Configure narrow/wide conversion\n",
104 | " _trend_check: Visualize data\n",
105 | " saving_params: Save the contents entered in the UI\n",
106 | " set_params: Set the saved input contents to the instance\n",
107 | " \"\"\"\n",
108 | "\n",
109 | " def __init__(self):\n",
110 | " self.define_ui()\n",
111 | "\n",
112 | " @staticmethod\n",
113 | " def _apply_text_style(type, text):\n",
114 | " if type == 'success':\n",
115 | " return print(f\"\\033[38;2;15;157;88m \" + text + \"\\033[0m\")\n",
116 | "\n",
117 | " if type == 'failure':\n",
118 | " return print(f\"\\033[38;2;219;68;55m \" + text + \"\\033[0m\")\n",
119 | "\n",
120 | " if isinstance(type, int):\n",
121 | " span_style = ipywidgets.HTML(\n",
122 | " \"\"\n",
124 | " + text\n",
125 | " + ''\n",
126 | " )\n",
127 | " return span_style\n",
128 | "\n",
129 | " def define_ui(self):\n",
130 | " self._define_data_source_widgets()\n",
131 | " self._define_data_format_widgets()\n",
132 | " self._define_date_widgets()\n",
133 | " self._define_experimental_design_widgets()\n",
134 | " self._define_simulation_widgets()\n",
135 | "\n",
136 | " def _define_data_source_widgets(self):\n",
137 | " # Input box for data sources\n",
138 | " self.sheet_url = ipywidgets.Text(\n",
139 | " placeholder='Please enter google spreadsheet url',\n",
140 | " value='https://docs.google.com/spreadsheets/d/1dISrbX1mZHgzpsIct2QXFOWWRRJiCxDSmSzjuZz64Tw/edit#gid=0',\n",
141 | " description='spreadsheet url:',\n",
142 | " style={'description_width': 'initial'},\n",
143 | " layout=ipywidgets.Layout(width='800px'),\n",
144 | " )\n",
145 | " self.sheet_name = ipywidgets.Text(\n",
146 | " placeholder='Please enter sheet name',\n",
147 | " value='analysis_data',\n",
148 | " # value='raw_data',\n",
149 | " description='sheet name:',\n",
150 | " )\n",
151 | " self.csv_name = ipywidgets.Text(\n",
152 | " placeholder='Please enter csv name',\n",
153 | " description='csv name:',\n",
154 | " layout=ipywidgets.Layout(width='500px'),\n",
155 | " )\n",
156 | " self.bq_project_id = ipywidgets.Text(\n",
157 | " placeholder='Please enter project id',\n",
158 | " description='project id:',\n",
159 | " layout=ipywidgets.Layout(width='500px'),\n",
160 | " )\n",
161 | " self.bq_table_name = ipywidgets.Text(\n",
162 | " placeholder='Please enter table name',\n",
163 | " description='table name:',\n",
164 | " layout=ipywidgets.Layout(width='500px'),\n",
165 | " )\n",
166 | "\n",
167 | " def _define_data_format_widgets(self):\n",
168 | " # Input box for data format\n",
169 | " self.date_col = ipywidgets.Text(\n",
170 | " placeholder='Please enter date column name',\n",
171 | " value='Date',\n",
172 | " description='date column:',\n",
173 | " )\n",
174 | " self.pivot_col = ipywidgets.Text(\n",
175 | " placeholder='Please enter pivot column name',\n",
176 | " value='Geo',\n",
177 | " description='pivot column:',\n",
178 | " )\n",
179 | " self.kpi_col = ipywidgets.Text(\n",
180 | " placeholder='Please enter kpi column name',\n",
181 | " value='KPI',\n",
182 | " description='kpi column:',\n",
183 | " )\n",
184 | "\n",
185 | " def _define_experimental_design_widgets(self):\n",
186 | " # Input box for Experimental_Design-related\n",
187 | " self.exclude_cols = ipywidgets.Text(\n",
188 | " placeholder=(\n",
189 | " 'Enter comma-separated columns if any columns are not used in the'\n",
190 | " ' design.'\n",
191 | " ),\n",
192 | " description='exclude cols:',\n",
193 | " layout=ipywidgets.Layout(width='1000px'),\n",
194 | " )\n",
195 | " self.num_of_split = ipywidgets.Dropdown(\n",
196 | " options=[2, 3, 4, 5],\n",
197 | " value=2,\n",
198 | " description='split#:',\n",
199 | " disabled=False,\n",
200 | " )\n",
201 | " self.target_columns = ipywidgets.Text(\n",
202 | " placeholder='Please enter comma-separated entries',\n",
203 | " value='Tokyo, Kanagawa',\n",
204 | " description='target_cols:',\n",
205 | " layout=ipywidgets.Layout(width='500px'),\n",
206 | " )\n",
207 | " self.num_of_pick_range = ipywidgets.IntRangeSlider(\n",
208 | " value=[5, 10],\n",
209 | " min=1,\n",
210 | " max=50,\n",
211 | " step=1,\n",
212 | " description='pick range:',\n",
213 | " orientation='horizontal',\n",
214 | " readout=True,\n",
215 | " readout_format='d',\n",
216 | " )\n",
217 | " self.num_of_covariate = ipywidgets.Dropdown(\n",
218 | " options=[1, 2, 3, 4, 5],\n",
219 | " value=1,\n",
220 | " description='covariate#:',\n",
221 | " layout=ipywidgets.Layout(width='192px'),\n",
222 | " )\n",
223 | " self.target_share = ipywidgets.FloatSlider(\n",
224 | " value=0.3,\n",
225 | " min=0.05,\n",
226 | " max=0.5,\n",
227 | " step=0.05,\n",
228 | " description='target share#:',\n",
229 | " orientation='horizontal',\n",
230 | " readout=True,\n",
231 | " readout_format='.1%',\n",
232 | " )\n",
233 | " self.control_columns = ipywidgets.Text(\n",
234 | " placeholder='Please enter comma-separated entries',\n",
235 | " value='Aomori, Akita',\n",
236 | " description='control_cols:',\n",
237 | " layout=ipywidgets.Layout(width='500px'),\n",
238 | " )\n",
239 | "\n",
240 | " def _define_simulation_widgets(self):\n",
241 | " # Input box for simulation params\n",
242 | " self.num_of_seasons = ipywidgets.IntText(\n",
243 | " value=1,\n",
244 | " description='num_of_seasons:',\n",
245 | " disabled=False,\n",
246 | " style={'description_width': 'initial'},\n",
247 | " )\n",
248 | " self.estimate_icpa = ipywidgets.IntText(\n",
249 | " value=1000,\n",
250 | " description='Estimated iCPA:',\n",
251 | " style={'description_width': 'initial'},\n",
252 | " )\n",
253 | " self.credible_interval = ipywidgets.RadioButtons(\n",
254 | " options=[70, 80, 90, 95],\n",
255 | " value=90,\n",
256 | " description='Credible interval %:',\n",
257 | " style={'description_width': 'initial'},\n",
258 | " )\n",
259 | "\n",
260 | " def _define_date_widgets(self):\n",
261 | " # Input box for Date-related\n",
262 | " self.pre_period_start = ipywidgets.DatePicker(\n",
263 | " description='Pre Start:',\n",
264 | " value=datetime.date.today() - relativedelta(days=122),\n",
265 | " )\n",
266 | " self.pre_period_end = ipywidgets.DatePicker(\n",
267 | " description='Pre End:',\n",
268 | " value=datetime.date.today() - relativedelta(days=32),\n",
269 | " )\n",
270 | " self.post_period_start = ipywidgets.DatePicker(\n",
271 | " description='Post Start:',\n",
272 | " value=datetime.date.today() - relativedelta(days=31),\n",
273 | " )\n",
274 | " self.post_period_end = ipywidgets.DatePicker(\n",
275 | " description='Post End:',\n",
276 | " value=datetime.date.today(),\n",
277 | " )\n",
278 | " self.start_date = ipywidgets.DatePicker(\n",
279 | " description='Start Date:',\n",
280 | " value=datetime.date.today() - relativedelta(days=122),\n",
281 | " )\n",
282 | " self.end_date = ipywidgets.DatePicker(\n",
283 | " description='End Date:',\n",
284 | " value=datetime.date.today() - relativedelta(days=32),\n",
285 | " )\n",
286 | " self.depend_data = ipywidgets.ToggleButton(\n",
287 | " value=False,\n",
288 | " description='Click >> Use the beginning and end of data',\n",
289 | " disabled=False,\n",
290 | " button_style='info',\n",
291 | " tooltip='Description',\n",
292 | " layout=ipywidgets.Layout(width='300px'),\n",
293 | " )\n",
294 | "\n",
295 | " def generate_ui(self):\n",
296 | " self._build_source_selection_tab()\n",
297 | " self._build_data_type_selection_tab()\n",
298 | " self._build_design_type_tab()\n",
299 | " self._build_purpose_selection_tab()\n",
300 | "\n",
301 | " def _build_source_selection_tab(self):\n",
302 | " # UI for data soure\n",
303 | " self.soure_selection = ipywidgets.Tab()\n",
304 | " self.soure_selection.children = [\n",
305 | " ipywidgets.VBox([self.sheet_url, self.sheet_name]),\n",
306 | " ipywidgets.VBox([self.csv_name]),\n",
307 | " ipywidgets.VBox([self.bq_project_id, self.bq_table_name]),\n",
308 | " ]\n",
309 | " self.soure_selection.set_title(0, 'Google_Spreadsheet')\n",
310 | " self.soure_selection.set_title(1, 'CSV_file')\n",
311 | " self.soure_selection.set_title(2, 'Big_Query')\n",
312 | "\n",
313 | " def _build_data_type_selection_tab(self):\n",
314 | " # UI for data type(narrow or wide)\n",
315 | " self.data_type_selection = ipywidgets.Tab()\n",
316 | " self.data_type_selection.children = [\n",
317 | " ipywidgets.VBox([\n",
318 | " ipywidgets.Label(\n",
319 | " 'Wide, or unstacked data is presented with each different'\n",
320 | " ' data variable in a separate column.'\n",
321 | " ),\n",
322 | " self.date_col,\n",
323 | " ]),\n",
324 | " ipywidgets.VBox([\n",
325 | " ipywidgets.Label(\n",
326 | " 'Narrow, stacked, or long data is presented with one column '\n",
327 | " 'containing all the values and another column listing the '\n",
328 | " 'context of the value'\n",
329 | " ),\n",
330 | " ipywidgets.HBox([self.date_col, self.pivot_col, self.kpi_col]),\n",
331 | " ]),\n",
332 | " ]\n",
333 | " self.data_type_selection.set_title(0, 'Wide_Format')\n",
334 | " self.data_type_selection.set_title(1, 'Narrow_Format')\n",
335 | "\n",
336 | " def _build_design_type_tab(self):\n",
337 | " # UI for experimental design\n",
338 | " self.design_type = ipywidgets.Tab(\n",
339 | " children=[\n",
340 | " ipywidgets.VBox([\n",
341 | " ipywidgets.HTML(\n",
342 | " 'divide_equally divides the time series data into N'\n",
343 | " ' groups(split#) with similar movements.'\n",
344 | " ),\n",
345 | " self.num_of_split,\n",
346 | " self.exclude_cols,\n",
347 | " ]),\n",
348 | " ipywidgets.VBox([\n",
349 | " ipywidgets.HTML(\n",
350 | " 'similarity_selection extracts N groups(covariate#) that '\n",
351 | " 'move similarly to particular columns(target_cols).'\n",
352 | " ),\n",
353 | " ipywidgets.HBox([\n",
354 | " self.target_columns,\n",
355 | " self.num_of_covariate,\n",
356 | " self.num_of_pick_range,\n",
357 | " ]),\n",
358 | " self.exclude_cols,\n",
359 | " ]),\n",
360 | " ipywidgets.VBox([\n",
361 | " ipywidgets.HTML(\n",
362 | " 'target share extracts targeted time series data from'\n",
363 | " ' the proportion of interventions.'\n",
364 | " ),\n",
365 | " self.target_share,\n",
366 | " self.exclude_cols,\n",
367 | " ]),\n",
368 | " ipywidgets.VBox([\n",
369 | " ipywidgets.HTML(\n",
370 | " 'To improve reproducibility, it is important to create an'\n",
371 | " ' accurate counterfactual model rather than a balanced'\n",
372 | " ' assignment.'\n",
373 | " ),\n",
374 | " self.target_columns,\n",
375 | " self.control_columns,\n",
376 | " ]),\n",
377 | " ]\n",
378 | " )\n",
379 | " self.design_type.set_title(0, 'A: divide_equally')\n",
380 | " self.design_type.set_title(1, 'B: similarity_selection')\n",
381 | " self.design_type.set_title(2, 'C: target_share')\n",
382 | " self.design_type.set_title(3, 'D: pre-allocated')\n",
383 | "\n",
384 | " def _build_purpose_selection_tab(self):\n",
385 | " # UI for purpose (CausalImpact or Experimental Design)\n",
386 | " self.purpose_selection = ipywidgets.Tab()\n",
387 | " self.date_selection = ipywidgets.Tab()\n",
388 | " self.date_selection.children = [\n",
389 | " ipywidgets.VBox(\n",
390 | " [\n",
391 | " ipywidgets.HTML('The minimum date of the data is '\n",
392 | " 'selected as the start date.'),\n",
393 | " ipywidgets.HTML('The maximum date in the data is '\n",
394 | " 'selected as the end date.'),\n",
395 | " ]),\n",
396 | " ipywidgets.VBox(\n",
397 | " [\n",
398 | " self.start_date,\n",
399 | " self.end_date,\n",
400 | " ]\n",
401 | " )]\n",
402 | " self.date_selection.set_title(0, 'automatic selection')\n",
403 | " self.date_selection.set_title(1, 'manual input')\n",
404 | "\n",
405 | " self.purpose_selection.children = [\n",
406 | " # Causalimpact\n",
407 | " ipywidgets.VBox([\n",
408 | " PreProcess._apply_text_style(\n",
409 | " 15, '⑶ - a: Enter the Pre and Post the intervention.'\n",
410 | " ),\n",
411 | " self.pre_period_start,\n",
412 | " self.pre_period_end,\n",
413 | " self.post_period_start,\n",
414 | " self.post_period_end,\n",
415 | " PreProcess._apply_text_style(\n",
416 | " 15,\n",
417 | " '⑶ - b: Enter the number of periodicities in the'\n",
418 | " ' time series data.(default=1)',\n",
419 | " ),\n",
420 | " ipywidgets.VBox([self.num_of_seasons, self.credible_interval]),\n",
421 | " ]),\n",
422 | " # Experimental_Design\n",
423 | " ipywidgets.VBox([\n",
424 | " PreProcess._apply_text_style(\n",
425 | " 15,\n",
426 | " '⑶ - a: Please select date for experimental design',\n",
427 | " ),\n",
428 | " self.date_selection,\n",
429 | " PreProcess._apply_text_style(\n",
430 | " 15,\n",
431 | " '⑶ - b: Select the experimental design method and'\n",
432 | " ' enter the necessary items.',\n",
433 | " ),\n",
434 | " self.design_type,\n",
435 | " PreProcess._apply_text_style(\n",
436 | " 15,\n",
437 | " '⑶ - c: (Optional) Enter Estimated incremental CPA(Cost'\n",
438 | " ' of intervention ÷ Lift from intervention without bias) & the '\n",
439 | " 'number of periodicities in the time series data.',\n",
440 | " ),\n",
441 | " ipywidgets.VBox([\n",
442 | " self.estimate_icpa,\n",
443 | " self.num_of_seasons,\n",
444 | " self.credible_interval,\n",
445 | " ]),\n",
446 | " ]),\n",
447 | " ]\n",
448 | " self.purpose_selection.set_title(0, 'Causalimpact')\n",
449 | " self.purpose_selection.set_title(1, 'Experimental_Design')\n",
450 | "\n",
451 | " display(\n",
452 | " PreProcess._apply_text_style(18, '⑴ Please select a data source.'),\n",
453 | " self.soure_selection,\n",
454 | " Markdown('
'),\n",
455 | " PreProcess._apply_text_style(\n",
456 | " 18, '⑵ Please select wide or narrow data format.'\n",
457 | " ),\n",
458 | " self.data_type_selection,\n",
459 | " Markdown('
'),\n",
460 | " PreProcess._apply_text_style(\n",
461 | " 18, '⑶ Please select the purpose and set conditions.'\n",
462 | " ),\n",
463 | " self.purpose_selection,\n",
464 | " )\n",
465 | "\n",
466 | " def load_data(self):\n",
467 | " if self.soure_selection.selected_index == 0:\n",
468 | " try:\n",
469 | " self.loaded_df = self._load_data_from_sheet(\n",
470 | " self.sheet_url.value, self.sheet_name.value\n",
471 | " )\n",
472 | " except Exception as e:\n",
473 | " self._apply_text_style('failure', '\\n\\nFailure!!')\n",
474 | " print('Error: {}'.format(e))\n",
475 | " print('Please check the following:')\n",
476 | " print('* sheet url:{}'.format(self.sheet_url.value))\n",
477 | " print('* sheet name:{}'.format(self.sheet_name.value))\n",
478 | " raise Exception('Please check Failure')\n",
479 | "\n",
480 | " elif self.soure_selection.selected_index == 1:\n",
481 | " try:\n",
482 | " self.loaded_df = self._load_data_from_csv(self.csv_name.value)\n",
483 | " except Exception as e:\n",
484 | " self._apply_text_style('failure', '\\n\\nFailure!!')\n",
485 | " print('Error: {}'.format(e))\n",
486 | " print('Please check the following:')\n",
487 | " print('* There is something wrong with the CSV-related settings.')\n",
488 | " print('* CSV namel:{}'.format(self.csv_name.value))\n",
489 | " raise Exception('Please check Failure')\n",
490 | "\n",
491 | " elif self.soure_selection.selected_index == 2:\n",
492 | " try:\n",
493 | " self.loaded_df = self._load_data_from_bigquery(\n",
494 | " self.bq_project_id.value, self.bq_table_name.value\n",
495 | " )\n",
496 | " except Exception as e:\n",
497 | " self._apply_text_style('failure', '\\n\\nFailure!!')\n",
498 | " print('Error: {}'.format(e))\n",
499 | " print('Please check the following:')\n",
500 | " print('* There is something wrong with the bq-related settings.')\n",
501 | " print('* bq project id:{}'.format(self.bq_project_id.value))\n",
502 | " print('* bq table name :{}'.format(self.bq_table_name.value))\n",
503 | " raise Exception('Please check Failure')\n",
504 | "\n",
505 | " else:\n",
506 | " raise Exception('Please select a data souce at Step.1-2.')\n",
507 | "\n",
508 | " self._apply_text_style(\n",
509 | " 'success',\n",
510 | " 'Success! The target data has been loaded.')\n",
511 | " display(self.loaded_df.head(3))\n",
512 | "\n",
513 | " @staticmethod\n",
514 | " def _load_data_from_sheet(spreadsheet_url, sheet_name):\n",
515 | " \"\"\"load_data_from_sheet load data from spreadsheet.\n",
516 | "\n",
517 | " Args:\n",
518 | " spreadsheet_url: Spreadsheet url with data.\n",
519 | " sheet_name: Sheet name with data.\n",
520 | " \"\"\"\n",
521 | " auth.authenticate_user()\n",
522 | " creds, _ = default()\n",
523 | " gc = gspread.authorize(creds)\n",
524 | " _workbook = gc.open_by_url(spreadsheet_url)\n",
525 | " _worksheet = _workbook.worksheet(sheet_name)\n",
526 | " df_sheet = pd.DataFrame(_worksheet.get_all_values())\n",
527 | " df_sheet.columns = list(df_sheet.loc[0, :])\n",
528 | " df_sheet.drop(0, inplace=True)\n",
529 | " df_sheet.reset_index(drop=True, inplace=True)\n",
530 | " df_sheet.replace(',', '', regex=True, inplace=True)\n",
531 | " df_sheet.rename(columns=lambda x: x.replace(\" \", \"\"), inplace=True)\n",
532 | " df_sheet = df_sheet.apply(pd.to_numeric, errors='ignore')\n",
533 | " return df_sheet\n",
534 | "\n",
535 | " @staticmethod\n",
536 | " def _load_data_from_csv(csv_name):\n",
537 | " \"\"\"load_data_from_csv read data from csv.\n",
538 | "\n",
539 | " Args:\n",
540 | " csv_name: csv file name.\n",
541 | " \"\"\"\n",
542 | " uploaded = files.upload()\n",
543 | " df_csv = pd.read_csv(io.BytesIO(uploaded[csv_name]))\n",
544 | " df_csv.replace(',', '', regex=True, inplace=True)\n",
545 | " df_csv.rename(columns=lambda x: x.replace(\" \", \"\"), inplace=True)\n",
546 | " df_csv = df_csv.apply(pd.to_numeric, errors='ignore')\n",
547 | " return df_csv\n",
548 | "\n",
549 | " @staticmethod\n",
550 | " def _load_data_from_bigquery(bq_project_id, bq_table_name):\n",
551 | " \"\"\"_load_data_from_bigquery load data from bigquery.\n",
552 | "\n",
553 | " Args:\n",
554 | " bq_project_id: bigquery project id.\n",
555 | " bq_table_name: bigquery table name\n",
556 | " \"\"\"\n",
557 | " auth.authenticate_user()\n",
558 | " client = bigquery.Client(project=bq_project_id)\n",
559 | " query = 'SELECT * FROM `' + bq_table_name + '`;'\n",
560 | " df_bq = client.query(query).to_dataframe()\n",
561 | " df_bq.replace(',', '', regex=True, inplace=True)\n",
562 | " df_bq.rename(columns=lambda x: x.replace(\" \", \"\"), inplace=True)\n",
563 | " df_bq = df_bq.apply(pd.to_numeric, errors='ignore')\n",
564 | " return df_bq\n",
565 | "\n",
566 | " def format_data(self):\n",
567 | " \"\"\"Formats the loaded data for causal impact analysis or experimental design.\n",
568 | "\n",
569 | " This method performs several data transformation steps:\n",
570 | " 1. Cleans column names by removing spaces from `date_col`, `pivot_col`, and `kpi_col`.\n",
571 | " 2. Converts the data to a wide format if specified by `data_type_selection`.\n",
572 | " 3. Drops columns specified in `exclude_cols`.\n",
573 | " 4. Converts the date column to datetime objects and sets it as the DataFrame index.\n",
574 | " 5. Reindexes the DataFrame to ensure a continuous date range from the minimum to maximum date.\n",
575 | " 6. Calculates `tick_count` for visualization purposes.\n",
576 | " 7. Provides visual feedback on the data formatting success or failure.\n",
577 | " 8. Displays an overview of the formatted data, including index, date range, and missing values.\n",
578 | " 9. Visualizes data trends (total and individual) and descriptive statistics.\n",
579 | "\n",
580 | " Raises:\n",
581 | " Exception: If any error occurs during data formatting, often due to\n",
582 | " mismatched data format selection (wide/narrow) or incorrect\n",
583 | " column names. Provides specific error messages to guide debugging.\n",
584 | " \"\"\"\n",
585 | " self.date_col_name = self.date_col.value.replace(' ', '')\n",
586 | " self.pivot_col_name = self.pivot_col.value.replace(' ', '')\n",
587 | " self.kpi_col_name = self.kpi_col.value.replace(' ', '')\n",
588 | "\n",
589 | " try:\n",
590 | " if self.data_type_selection.selected_index == 0:\n",
591 | " self.formatted_data = self.loaded_df.copy()\n",
592 | " elif self.data_type_selection.selected_index == 1:\n",
593 | " self.formatted_data = self._shape_wide(\n",
594 | " self.loaded_df,\n",
595 | " self.date_col_name,\n",
596 | " self.pivot_col_name,\n",
597 | " self.kpi_col_name,\n",
598 | " )\n",
599 | "\n",
600 | " self.formatted_data.drop(\n",
601 | " self.exclude_cols.value.replace(', ', ',').split(','),\n",
602 | " axis=1,\n",
603 | " errors='ignore',\n",
604 | " inplace=True,\n",
605 | " )\n",
606 | " self.formatted_data[self.date_col_name] = pd.to_datetime(\n",
607 | " self.formatted_data[self.date_col_name]\n",
608 | " )\n",
609 | " self.formatted_data = self.formatted_data.set_index(self.date_col_name)\n",
610 | " self.formatted_data = self.formatted_data.reindex(\n",
611 | " pd.date_range(\n",
612 | " start=self.formatted_data.index.min(),\n",
613 | " end=self.formatted_data.index.max(),\n",
614 | " name=self.formatted_data.index.name))\n",
615 | " self.tick_count = len(self.formatted_data.resample('M')) - 1\n",
616 | " self._apply_text_style(\n",
617 | " 'success',\n",
618 | " '\\nSuccess! The data was formatted for analysis.'\n",
619 | " )\n",
620 | " display(self.formatted_data.head(3))\n",
621 | " self._apply_text_style(\n",
622 | " 'failure',\n",
623 | " '\\nCheck! Here is an overview of the data.'\n",
624 | " )\n",
625 | " print(\n",
626 | " 'Index name:{} | The earliest date: {} | The latest date: {}'.format(\n",
627 | " self.formatted_data.index.name,\n",
628 | " min(self.formatted_data.index),\n",
629 | " max(self.formatted_data.index)\n",
630 | " ))\n",
631 | " print('* Rows with missing values')\n",
632 | " self.missing_row = self.formatted_data[\n",
633 | " self.formatted_data.isnull().any(axis=1)]\n",
634 | " if len(self.missing_row) > 0:\n",
635 | " self.missing_row\n",
636 | " else:\n",
637 | " print('>> Does not include missing values')\n",
638 | "\n",
639 | " self._apply_text_style(\n",
640 | " 'failure',\n",
641 | " '\\nCheck! below [total_trend] / [each_trend] / [describe_data]'\n",
642 | " )\n",
643 | " self._trend_check(\n",
644 | " self.formatted_data,\n",
645 | " self.date_col_name,\n",
646 | " self.tick_count)\n",
647 | "\n",
648 | " except Exception as e:\n",
649 | " self._apply_text_style('failure', '\\n\\nFailure!!')\n",
650 | " print('Error: {}'.format(e))\n",
651 | " self._apply_text_style('failure', '\\nPlease check the following:')\n",
652 | " if self.data_type_selection.selected_index == 0:\n",
653 | " print('* Your selected data format: Wide format at (2)')\n",
654 | " print('1. Check if the data source is wide.')\n",
655 | " print('2. Compare \"date column\"( {} ) and \"data source\"'.format(\n",
656 | " self.date_col.value))\n",
657 | " print('\\n\\n')\n",
658 | " else:\n",
659 | " print('* Your selected data format: Narrow format at (2)')\n",
660 | " print('1. Check if the data source is narrow.')\n",
661 | " print('2. Compare \"your input\" and \"data source')\n",
662 | " print('>> date column: {}'.format(self.date_col.value))\n",
663 | " print('>> pivot column: {}'.format(self.pivot_col.value))\n",
664 | " print('>> kpi column: {}'.format(self.kpi_col.value))\n",
665 | " print('\\n\\n')\n",
666 | " raise Exception('Please check Failure')\n",
667 | "\n",
668 | " @staticmethod\n",
669 | " def _shape_wide(dataframe, date_column, pivot_column, kpi_column):\n",
670 | " \"\"\"shape_wide pivots the data in the specified column.\n",
671 | "\n",
672 | " Converts long data to wide data suitable for experiment design.\n",
673 | "\n",
674 | " Args:\n",
675 | " dataframe: The DataFrame to be pivoted.\n",
676 | " date_column: The name of the column that contains the dates.\n",
677 | " pivot_column: The name of the column that contains the pivot keys.\n",
678 | " kpi_column: The name of the column that contains the KPI values.\n",
679 | "\n",
680 | " Returns:\n",
681 | " A DataFrame with the pivoted data.\n",
682 | " \"\"\"\n",
683 | " # Check if the pivot_column is a single column or a list of columns.\n",
684 | " if ',' in pivot_column:\n",
685 | " group_cols = pivot_column.replace(', ', ',').split(',')\n",
686 | " else:\n",
687 | " group_cols = [pivot_column]\n",
688 | "\n",
689 | " pivoted_df = pd.pivot_table(\n",
690 | " (dataframe[[date_column] + [kpi_column] + group_cols])\n",
691 | " .groupby([date_column] + group_cols)\n",
692 | " .sum(),\n",
693 | " index=date_column,\n",
694 | " columns=group_cols,\n",
695 | " fill_value=0,\n",
696 | " )\n",
697 | " # Drop the first level of the column names.\n",
698 | " pivoted_df.columns = pivoted_df.columns.droplevel(0)\n",
699 | " # If there are multiple columns, convert the column names to a single string.\n",
700 | " if len(pivoted_df.columns.names) > 1:\n",
701 | " new_cols = [\n",
702 | " '_'.join([x.replace(',', '_') for x in y])\n",
703 | " for y in pivoted_df.columns.values\n",
704 | " ]\n",
705 | " pivoted_df.columns = new_cols\n",
706 | " pivoted_df = pivoted_df.reset_index()\n",
707 | " return pivoted_df\n",
708 | "\n",
709 | " @staticmethod\n",
710 | " def _trend_check(dataframe, date_col_name, tick_count):\n",
711 | " \"\"\"trend_check visualize daily trend, 7-day moving average\n",
712 | "\n",
713 | " Args:\n",
714 | " dataframe: Wide data to check the trend\n",
715 | " date_col_name: xxx\n",
716 | " \"\"\"\n",
717 | " df_each = pd.DataFrame(index=dataframe.index)\n",
718 | " col_list = list(dataframe.columns)\n",
719 | " for i in col_list:\n",
720 | " min_max = (\n",
721 | " dataframe[i] - dataframe[i].min()\n",
722 | " ) / (dataframe[i].max() - dataframe[i].min())\n",
723 | " df_each = pd.concat([df_each, min_max], axis = 1)\n",
724 | "\n",
725 | " metric = 'dtw'\n",
726 | " n_clusters = 5\n",
727 | " tskm_base = TimeSeriesKMeans(n_clusters=n_clusters, metric=metric,\n",
728 | " max_iter=100, random_state=42)\n",
729 | " df_cluster = pd.DataFrame({\n",
730 | " \"pivot\": col_list,\n",
731 | " \"cluster\": tskm_base.fit_predict(df_each.T).tolist()})\n",
732 | " cluster_counts = (\n",
733 | " df_cluster[\"cluster\"].value_counts().sort_values(ascending=True))\n",
734 | "\n",
735 | " cluster_text = []\n",
736 | " line_each = []\n",
737 | " for i in cluster_counts.index:\n",
738 | " clust_list = df_cluster.query(\"cluster == @i\")[\"pivot\"].to_list()\n",
739 | " source = df_each.filter(items=clust_list)\n",
740 | " cluster_text.append(str(clust_list).translate(\n",
741 | " str.maketrans({'[': '', ']': '', \"'\": ''})))\n",
742 | " line_each.append(\n",
743 | " alt.Chart(source.reset_index())\n",
744 | " .transform_fold(fold=clust_list, as_=['pivot', 'kpi'])\n",
745 | " .mark_line()\n",
746 | " .encode(\n",
747 | " alt.X(\n",
748 | " date_col_name + ':T',\n",
749 | " title=None,\n",
750 | " axis=alt.Axis(\n",
751 | " grid=False, format='%Y %b', tickCount=tick_count\n",
752 | " ),\n",
753 | " ),\n",
754 | " alt.Y('kpi:Q', stack=None, axis=None),\n",
755 | " alt.Color(str(i) + ':N', title=None, legend=None),\n",
756 | " alt.Row(\n",
757 | " 'pivot:N',\n",
758 | " title=None,\n",
759 | " header=alt.Header(labelAngle=0, labelAlign='left'),\n",
760 | " ),\n",
761 | " )\n",
762 | " .properties(bounds='flush', height=30)\n",
763 | " .configure_facet(spacing=0)\n",
764 | " .configure_view(stroke=None)\n",
765 | " .configure_title(anchor='end')\n",
766 | " )\n",
767 | "\n",
768 | " df_long = (\n",
769 | " pd.melt(dataframe.reset_index(), id_vars=date_col_name)\n",
770 | " .groupby(date_col_name)\n",
771 | " .sum(numeric_only=True)\n",
772 | " .reset_index()\n",
773 | " )\n",
774 | " line_total = (\n",
775 | " alt.Chart(df_long)\n",
776 | " .mark_line()\n",
777 | " .encode(\n",
778 | " x=alt.X(\n",
779 | " date_col_name + ':T',\n",
780 | " axis=alt.Axis(\n",
781 | " title='', format='%Y %b', tickCount=tick_count\n",
782 | " ),\n",
783 | " ),\n",
784 | " y=alt.Y('value:Q', axis=alt.Axis(title='kpi')),\n",
785 | " color=alt.value('#4285F4'),\n",
786 | " )\n",
787 | " )\n",
788 | " moving_average = (\n",
789 | " alt.Chart(df_long)\n",
790 | " .transform_window(\n",
791 | " rolling_mean='mean(value)',\n",
792 | " frame=[-4, 3],\n",
793 | " )\n",
794 | " .mark_line()\n",
795 | " .encode(\n",
796 | " x=alt.X(date_col_name + ':T'),\n",
797 | " y=alt.Y('rolling_mean:Q'),\n",
798 | " color=alt.value('#DB4437'),\n",
799 | " )\n",
800 | " )\n",
801 | " tab_total_trend = ipywidgets.Output()\n",
802 | " tab_each_trend = ipywidgets.Output()\n",
803 | " tab_describe_data = ipywidgets.Output()\n",
804 | " tab_result = ipywidgets.Tab(children = [\n",
805 | " tab_total_trend,\n",
806 | " tab_each_trend,\n",
807 | " tab_describe_data,\n",
808 | " ])\n",
809 | " tab_result.set_title(0, '>> total_trend')\n",
810 | " tab_result.set_title(1, '>> each_trend')\n",
811 | " tab_result.set_title(2, '>> describe_data')\n",
812 | " display(tab_result)\n",
813 | " with tab_total_trend:\n",
814 | " display(\n",
815 | " (line_total + moving_average).properties(\n",
816 | " width=700,\n",
817 | " height=200,\n",
818 | " title={\n",
819 | " 'text': ['Daily Trend(blue) & 7days moving average(red)'],\n",
820 | " },\n",
821 | " )\n",
822 | " )\n",
823 | " with tab_each_trend:\n",
824 | " for i in range(len(cluster_text)):\n",
825 | " print('cluster {}:{}'.format(i, cluster_text[i]))\n",
826 | " display(line_each[i].properties(width=700))\n",
827 | " with tab_describe_data:\n",
828 | " display(dataframe.describe(include='all'))\n",
829 | "\n",
830 | " @staticmethod\n",
831 | " def saving_params(instance):\n",
832 | " params_dict = {\n",
833 | " # section for data source\n",
834 | " 'soure_selection': instance.soure_selection.selected_index,\n",
835 | " 'sheet_url': instance.sheet_url.value,\n",
836 | " 'sheet_name': instance.sheet_name.value,\n",
837 | " 'csv_name': instance.csv_name.value,\n",
838 | " 'bq_project_id': instance.bq_project_id.value,\n",
839 | " 'bq_table_name': instance.bq_table_name.value,\n",
840 | "\n",
841 | " # section for data format(narrow or wide)\n",
842 | " 'data_type_selection': instance.data_type_selection.selected_index,\n",
843 | " 'date_col': instance.date_col.value,\n",
844 | " 'pivot_col': instance.pivot_col.value,\n",
845 | " 'kpi_col': instance.kpi_col.value,\n",
846 | "\n",
847 | " # section for porpose(CausalImpact or Experimental Design)\n",
848 | " 'purpose_selection': instance.purpose_selection.selected_index,\n",
849 | " 'pre_period_start': instance.pre_period_start.value,\n",
850 | " 'pre_period_end': instance.pre_period_end.value,\n",
851 | " 'post_period_start': instance.post_period_start.value,\n",
852 | " 'post_period_end': instance.post_period_end.value,\n",
853 | " 'start_date': instance.start_date.value,\n",
854 | " 'end_date': instance.end_date.value,\n",
855 | " 'depend_data': instance.depend_data.value,\n",
856 | "\n",
857 | " 'design_type': instance.design_type.selected_index,\n",
858 | " 'num_of_split': instance.num_of_split.value,\n",
859 | " 'target_columns': instance.target_columns.value,\n",
860 | " 'control_columns': instance.control_columns.value,\n",
861 | " 'num_of_pick_range': instance.num_of_pick_range.value,\n",
862 | " 'num_of_covariate': instance.num_of_covariate.value,\n",
863 | " 'target_share': instance.target_share.value,\n",
864 | " 'exclude_cols': instance.exclude_cols.value,\n",
865 | "\n",
866 | " 'num_of_seasons': instance.num_of_seasons.value,\n",
867 | " 'estimate_icpa': instance.estimate_icpa.value,\n",
868 | " 'credible_interval': instance.credible_interval.value,\n",
869 | " }\n",
870 | " return params_dict\n",
871 | "\n",
872 | " @staticmethod\n",
873 | " def set_params(instance, dict_params):\n",
874 | " # section for data source\n",
875 | " instance.soure_selection.selected_index = dict_params['soure_selection']\n",
876 | " instance.sheet_url.value = dict_params['sheet_url']\n",
877 | " instance.sheet_name.value = dict_params['sheet_name']\n",
878 | " instance.csv_name.value = dict_params['csv_name']\n",
879 | " instance.bq_project_id.value = dict_params['bq_project_id']\n",
880 | " instance.bq_table_name.value = dict_params['bq_table_name']\n",
881 | "\n",
882 | " # section for data format(narrow or wide)\n",
883 | " instance.data_type_selection.selected_index = dict_params['data_type_selection']\n",
884 | " instance.date_col.value = dict_params['date_col']\n",
885 | " instance.pivot_col.value = dict_params['pivot_col']\n",
886 | " instance.kpi_col.value = dict_params['kpi_col']\n",
887 | "\n",
888 | " # section for porpose(CausalImpact or Experimental Design)\n",
889 | " instance.purpose_selection.selected_index = dict_params['purpose_selection']\n",
890 | " instance.pre_period_start.value = dict_params['pre_period_start']\n",
891 | " instance.pre_period_end.value = dict_params['pre_period_end']\n",
892 | " instance.post_period_start.value = dict_params['post_period_start']\n",
893 | " instance.post_period_end.value = dict_params['post_period_end']\n",
894 | " instance.start_date.value = dict_params['start_date']\n",
895 | " instance.end_date.value = dict_params['end_date']\n",
896 | " instance.depend_data.value = dict_params['depend_data']\n",
897 | "\n",
898 | " instance.design_type.selected_index = dict_params['design_type']\n",
899 | " instance.num_of_split.value = dict_params['num_of_split']\n",
900 | " instance.target_columns.value = dict_params['target_columns']\n",
901 | " instance.control_columns.value = dict_params['control_columns']\n",
902 | " instance.num_of_pick_range.value = dict_params['num_of_pick_range']\n",
903 | " instance.num_of_covariate.value = dict_params['num_of_covariate']\n",
904 | " instance.target_share.value = dict_params['target_share']\n",
905 | " instance.exclude_cols.value = dict_params['exclude_cols']\n",
906 | "\n",
907 | " instance.num_of_seasons.value = dict_params['num_of_seasons']\n",
908 | " instance.estimate_icpa.value = dict_params['estimate_icpa']\n",
909 | " instance.credible_interval.value = dict_params['credible_interval']\n",
910 | "\n",
911 | "# @title dev\n",
912 | "class CausalImpact(PreProcess):\n",
913 | " \"\"\"CausalImpact analysis and experimental design on CausalImpact.\n",
914 | "\n",
915 | " CausalImpact Analysis performs a CausalImpact analysis on the given data and\n",
916 | " outputs the results. The experimental design will be based on N partitions,\n",
917 | " similarity, or share, with 1000 iterations of random sampling, and will output\n",
918 | " the three candidate groups with the closest DTW distance. A combination of\n",
919 | " increments and periods will be used to simulate and return which combination\n",
920 | " will result in a significantly different validation.\n",
921 | "\n",
922 | " Attributes:\n",
923 | " run_causalImpact: Runs CausalImpact on the given case.\n",
924 | " create_causalimpact_object:\n",
925 | " display_causalimpact_result:\n",
926 | " plot_causalimpact:\n",
927 | "\n",
928 | " Returns:\n",
929 | " The CausalImpact object.\n",
930 | " \"\"\"\n",
931 | "\n",
932 | " colors = [\n",
933 | " '#DB4437',\n",
934 | " '#AB47BC',\n",
935 | " '#4285F4',\n",
936 | " '#00ACC1',\n",
937 | " '#0F9D58',\n",
938 | " '#9E9D24',\n",
939 | " '#F4B400',\n",
940 | " '#FF7043',\n",
941 | " ]\n",
942 | " NUM_OF_ITERATION = 1000\n",
943 | " COMBINATION_TARGET = 10\n",
944 | " TREAT_DURATION = [14, 21, 28]\n",
945 | " TREAT_IMPACT = [1, 1.01, 1.03, 1.05, 1.10, 1.15]\n",
946 | " MAX_STRING_LENGTH = 150\n",
947 | "\n",
948 | " def __init__(self):\n",
949 | " super().__init__()\n",
950 | "\n",
951 | " def run_causalImpact(self):\n",
952 | " self.ci_objs = []\n",
953 | " try:\n",
954 | " self.ci_obj = self.create_causalimpact_object(\n",
955 | " self.formatted_data,\n",
956 | " self.date_col_name,\n",
957 | " self.pre_period_start.value,\n",
958 | " self.pre_period_end.value,\n",
959 | " self.post_period_start.value,\n",
960 | " self.post_period_end.value,\n",
961 | " self.num_of_seasons.value,\n",
962 | " self.credible_interval.value,\n",
963 | " )\n",
964 | " self.ci_objs.append(self.ci_obj)\n",
965 | " self._apply_text_style(\n",
966 | " 'success',\n",
967 | " '\\nSuccess! CausalImpact has been performed. Check the'\n",
968 | " ' results in the next cell.',\n",
969 | " )\n",
970 | "\n",
971 | " except Exception as e:\n",
972 | " self._apply_text_style('failure', '\\n\\nFailure!!')\n",
973 | " print('Error: {}'.format(e))\n",
974 | " print('Please check the following:')\n",
975 | " print('* Date source.')\n",
976 | " print('* Date Column Name.')\n",
977 | " print('* Duration of experiment (pre and post).')\n",
978 | " raise Exception('Please check Failure')\n",
979 | "\n",
980 | " @staticmethod\n",
981 | " def create_causalimpact_object(\n",
982 | " data,\n",
983 | " date_col,\n",
984 | " pre_start,\n",
985 | " pre_end,\n",
986 | " post_start,\n",
987 | " post_end,\n",
988 | " num_of_seasons,\n",
989 | " credible_interval):\n",
990 | " if data.index.name != date_col: data.set_index(date_col, inplace=True)\n",
991 | "\n",
992 | " if num_of_seasons == 1:\n",
993 | " causalimpact_object = causalimpact.fit_causalimpact(\n",
994 | " data=data,\n",
995 | " pre_period=(str(pre_start), str(pre_end)),\n",
996 | " post_period=(str(post_start), str(post_end)),\n",
997 | " alpha= 1 - credible_interval / 100,\n",
998 | " )\n",
999 | " else:\n",
1000 | " causalimpact_object = causalimpact.fit_causalimpact(\n",
1001 | " data=data,\n",
1002 | " pre_period=(str(pre_start), str(pre_end)),\n",
1003 | " post_period=(str(post_start), str(post_end)),\n",
1004 | " alpha= 1 - credible_interval / 100,\n",
1005 | " model_options=causalimpact.ModelOptions(\n",
1006 | " seasons=[\n",
1007 | " causalimpact.Seasons(num_seasons=num_of_seasons),\n",
1008 | " ]\n",
1009 | " ),\n",
1010 | " )\n",
1011 | " return causalimpact_object\n",
1012 | "\n",
1013 | " def display_causalimpact_result(self):\n",
1014 | " print('Test & Control Time Series')\n",
1015 | " line = (\n",
1016 | " alt.Chart(self.formatted_data.reset_index())\n",
1017 | " .transform_fold(list(self.formatted_data.columns))\n",
1018 | " .mark_line()\n",
1019 | " .encode(\n",
1020 | " alt.X(\n",
1021 | " self.date_col_name + ':T',\n",
1022 | " title=None,\n",
1023 | " axis=alt.Axis(format='%Y %b', tickCount=self.tick_count),\n",
1024 | " ),\n",
1025 | " y=alt.Y('value:Q', axis=alt.Axis(title='kpi')),\n",
1026 | " color=alt.Color(\n",
1027 | " 'key:N',\n",
1028 | " legend=alt.Legend(\n",
1029 | " title=None,\n",
1030 | " orient='none',\n",
1031 | " legendY=-20,\n",
1032 | " direction='horizontal',\n",
1033 | " titleAnchor='start',\n",
1034 | " ),\n",
1035 | " scale=alt.Scale(\n",
1036 | " domain=list(self.formatted_data.columns),\n",
1037 | " range=CausalImpact.colors,\n",
1038 | " ),\n",
1039 | " ),\n",
1040 | " )\n",
1041 | " .properties(height=200, width=600)\n",
1042 | " )\n",
1043 | " rule = (\n",
1044 | " alt.Chart(\n",
1045 | " pd.DataFrame({\n",
1046 | " 'Date': [\n",
1047 | " str(self.post_period_start.value),\n",
1048 | " str(self.post_period_end.value)\n",
1049 | " ],\n",
1050 | " 'color': ['red', 'orange'],\n",
1051 | " })\n",
1052 | " )\n",
1053 | " .mark_rule(strokeDash=[5, 5])\n",
1054 | " .encode(x='Date:T', color=alt.Color('color:N', scale=None))\n",
1055 | " )\n",
1056 | " display((line+rule).properties(height=200, width=600))\n",
1057 | " print('=' * 100)\n",
1058 | "\n",
1059 | " self.plot_causalimpact(\n",
1060 | " self.ci_objs[0],\n",
1061 | " self.pre_period_start.value,\n",
1062 | " self.pre_period_end.value,\n",
1063 | " self.post_period_start.value,\n",
1064 | " self.post_period_end.value,\n",
1065 | " self.credible_interval.value,\n",
1066 | " self.date_col_name,\n",
1067 | " self.tick_count,\n",
1068 | " self.purpose_selection.selected_index\n",
1069 | " )\n",
1070 | "\n",
1071 | " @staticmethod\n",
1072 | " def plot_causalimpact(\n",
1073 | " causalimpact_object,\n",
1074 | " pre_start,\n",
1075 | " pre_end,\n",
1076 | " tread_start,\n",
1077 | " treat_end,\n",
1078 | " credible_interval,\n",
1079 | " date_col_name,\n",
1080 | " tick_count,\n",
1081 | " purpose_selection\n",
1082 | " ):\n",
1083 | " causalimpact_df = causalimpact_object.series#.copy()\n",
1084 | " mape = mean_absolute_percentage_error(\n",
1085 | " causalimpact_df['observed'][str(pre_start) : str(pre_end)],\n",
1086 | " causalimpact_df['posterior_mean'][str(pre_start) : str(pre_end)],\n",
1087 | " )\n",
1088 | " threshold = round(1 - credible_interval / 100, 2)\n",
1089 | "\n",
1090 | " line_1 = (\n",
1091 | " alt.Chart(causalimpact_df.reset_index())\n",
1092 | " .transform_fold([\n",
1093 | " 'observed',\n",
1094 | " 'posterior_mean',\n",
1095 | " ])\n",
1096 | " .mark_line()\n",
1097 | " .encode(\n",
1098 | " x=alt.X(\n",
1099 | " 'yearmonthdate(' + date_col_name + ')',\n",
1100 | " axis=alt.Axis(\n",
1101 | " title='',\n",
1102 | " labels=False,\n",
1103 | " ticks=False,\n",
1104 | " format='%Y %b',\n",
1105 | " tickCount=tick_count,\n",
1106 | " ),\n",
1107 | " ),\n",
1108 | " y=alt.Y(\n",
1109 | " 'value:Q',\n",
1110 | " scale=alt.Scale(zero=False),\n",
1111 | " axis=alt.Axis(title=''),\n",
1112 | " ),\n",
1113 | " color=alt.Color(\n",
1114 | " 'key:N',\n",
1115 | " legend=alt.Legend(\n",
1116 | " title=None,\n",
1117 | " orient='none',\n",
1118 | " legendY=-20,\n",
1119 | " direction='horizontal',\n",
1120 | " titleAnchor='start',\n",
1121 | " ),\n",
1122 | " sort=['posterior_mean', 'observed'],\n",
1123 | " ),\n",
1124 | " strokeDash=alt.condition(\n",
1125 | " alt.datum.key == 'posterior_mean',\n",
1126 | " alt.value([5, 5]),\n",
1127 | " alt.value([0]),\n",
1128 | " ),\n",
1129 | " )\n",
1130 | " )\n",
1131 | " area_1 = (\n",
1132 | " alt.Chart(causalimpact_df.reset_index())\n",
1133 | " .mark_area(opacity=0.3)\n",
1134 | " .encode(\n",
1135 | " x=alt.X('yearmonthdate(' + date_col_name + ')'),\n",
1136 | " y=alt.Y('posterior_lower:Q', scale=alt.Scale(zero=False)),\n",
1137 | " y2=alt.Y2('posterior_upper:Q'),\n",
1138 | " )\n",
1139 | " )\n",
1140 | " line_2 = (\n",
1141 | " alt.Chart(causalimpact_df.reset_index())\n",
1142 | " .mark_line(strokeDash=[5, 5])\n",
1143 | " .encode(\n",
1144 | " x=alt.X(\n",
1145 | " 'yearmonthdate(' + date_col_name + ')',\n",
1146 | " axis=alt.Axis(\n",
1147 | " title='',\n",
1148 | " labels=False,\n",
1149 | " ticks=False,\n",
1150 | " format='%Y %b',\n",
1151 | " tickCount=tick_count,\n",
1152 | " ),\n",
1153 | " ),\n",
1154 | " y=alt.Y(\n",
1155 | " 'point_effects_mean:Q',\n",
1156 | " scale=alt.Scale(zero=False),\n",
1157 | " axis=alt.Axis(title=''),\n",
1158 | " ),\n",
1159 | " )\n",
1160 | " )\n",
1161 | " area_2 = (\n",
1162 | " alt.Chart(causalimpact_df.reset_index())\n",
1163 | " .mark_area(opacity=0.3)\n",
1164 | " .encode(\n",
1165 | " x=alt.X('yearmonthdate(' + date_col_name + ')'),\n",
1166 | " y=alt.Y('point_effects_lower:Q', scale=alt.Scale(zero=False)),\n",
1167 | " y2=alt.Y2('point_effects_upper:Q'),\n",
1168 | " )\n",
1169 | " )\n",
1170 | " line_3 = (\n",
1171 | " alt.Chart(causalimpact_df.reset_index())\n",
1172 | " .mark_line(strokeDash=[5, 5])\n",
1173 | " .encode(\n",
1174 | " x=alt.X(\n",
1175 | " 'yearmonthdate(' + date_col_name + ')',\n",
1176 | " axis=alt.Axis(title='', format='%Y %b', tickCount=tick_count),\n",
1177 | " ),\n",
1178 | " y=alt.Y(\n",
1179 | " 'cumulative_effects_mean:Q',\n",
1180 | " scale=alt.Scale(zero=False),\n",
1181 | " axis=alt.Axis(title=''),\n",
1182 | " ),\n",
1183 | " )\n",
1184 | " )\n",
1185 | " area_3 = (\n",
1186 | " alt.Chart(causalimpact_df.reset_index())\n",
1187 | " .mark_area(opacity=0.3)\n",
1188 | " .encode(\n",
1189 | " x=alt.X(\n",
1190 | " 'yearmonthdate(' + date_col_name + ')',\n",
1191 | " axis=alt.Axis(title='')),\n",
1192 | " y=alt.Y('cumulative_effects_lower:Q', scale=alt.Scale(zero=False),\n",
1193 | " axis=alt.Axis(title='')),\n",
1194 | " y2=alt.Y2('cumulative_effects_upper:Q'),\n",
1195 | " )\n",
1196 | " )\n",
1197 | " zero_line = (\n",
1198 | " alt.Chart(pd.DataFrame({'y': [0]}))\n",
1199 | " .mark_rule()\n",
1200 | " .encode(y='y', color=alt.value('gray'))\n",
1201 | " )\n",
1202 | " rules = (\n",
1203 | " alt.Chart(\n",
1204 | " pd.DataFrame({\n",
1205 | " 'Date': [str(tread_start), str(treat_end)],\n",
1206 | " 'color': ['red', 'orange'],\n",
1207 | " })\n",
1208 | " )\n",
1209 | " .mark_rule(strokeDash=[5, 5])\n",
1210 | " .encode(x='Date:T', color=alt.Color('color:N', scale=None))\n",
1211 | " )\n",
1212 | " watermark = alt.Chart(pd.DataFrame([1])).mark_text(\n",
1213 | " align='center',\n",
1214 | " dx=0,\n",
1215 | " dy=0,\n",
1216 | " fontSize=48,\n",
1217 | " text='mock experiment',\n",
1218 | " color='red'\n",
1219 | " ).encode(\n",
1220 | " opacity=alt.value(0.5)\n",
1221 | " )\n",
1222 | " if purpose_selection == 1:\n",
1223 | " cumulative = line_3 + area_3 + rules + zero_line + watermark\n",
1224 | " elif causalimpact_object.summary.p_value.average >= threshold:\n",
1225 | " cumulative = area_3 + rules + zero_line\n",
1226 | " else:\n",
1227 | " cumulative = line_3 + area_3 + rules + zero_line\n",
1228 | " plot = alt.vconcat(\n",
1229 | " (line_1 + area_1 + rules).properties(height=100, width=600),\n",
1230 | " (line_2 + area_2 + rules + zero_line).properties(height=100, width=600),\n",
1231 | " (cumulative).properties(height=100, width=600),\n",
1232 | " )\n",
1233 | "\n",
1234 | " tab_data = ipywidgets.Output()\n",
1235 | " tab_report = ipywidgets.Output()\n",
1236 | " tab_summary = ipywidgets.Output()\n",
1237 | " tab_result = ipywidgets.Tab(children = [tab_summary, tab_report, tab_data])\n",
1238 | " tab_result.set_title(0, '>> summary')\n",
1239 | " tab_result.set_title(1, '>> report')\n",
1240 | " tab_result.set_title(2, '>> data')\n",
1241 | " with tab_summary:\n",
1242 | " print('Approximate model accuracy >> MAPE:{:.2%}'.format(mape))\n",
1243 | " if mape <= 0.05:\n",
1244 | " PreProcess._apply_text_style(\n",
1245 | " 'success',\n",
1246 | " 'Very Good: The difference between actual and predicted values is slight.')\n",
1247 | " elif mape <= 0.10:\n",
1248 | " PreProcess._apply_text_style(\n",
1249 | " 'success',\n",
1250 | " 'Good: The difference between the actual and predicted values is within the acceptable range.')\n",
1251 | " elif mape <= 0.15:\n",
1252 | " PreProcess._apply_text_style(\n",
1253 | " 'failure',\n",
1254 | " 'Medium: he difference between the actual and predicted values ismoderate, so this is only a reference value.')\n",
1255 | " else:\n",
1256 | " PreProcess._apply_text_style(\n",
1257 | " 'failure',\n",
1258 | " 'Bad: The difference between actual and predicted values is large, so we do not recommend using it.')\n",
1259 | " if causalimpact_object.summary.p_value.average <= threshold:\n",
1260 | " PreProcess._apply_text_style('success', f'\\nP-Value is under {threshold}. There is a statistically significant difference.')\n",
1261 | " else:\n",
1262 | " PreProcess._apply_text_style('failure', f'\\nP-Value is over {threshold}. There is not a statistically significant difference.')\n",
1263 | "\n",
1264 | " print(causalimpact.summary(\n",
1265 | " causalimpact_object,\n",
1266 | " output_format='summary',\n",
1267 | " alpha= 1 - credible_interval / 100))\n",
1268 | " display(plot)\n",
1269 | " with tab_report:\n",
1270 | " print(causalimpact.summary(\n",
1271 | " causalimpact_object,\n",
1272 | " output_format=\"report\",\n",
1273 | " alpha= 1 - credible_interval / 100))\n",
1274 | " with tab_data:\n",
1275 | " df = causalimpact_object.series\n",
1276 | " df.insert(2, 'diff_percentage', df['point_effects_mean'] / df['observed'])\n",
1277 | " display(df)\n",
1278 | " display(tab_result)\n",
1279 | "\n",
1280 | " def run_experimental_design(self):\n",
1281 | " if self.date_selection.selected_index == 0:\n",
1282 | " self.start_date_value = min(self.formatted_data.index).date()\n",
1283 | " self.end_date_value = max(self.formatted_data.index).date()\n",
1284 | " else:\n",
1285 | " self.start_date_value = self.start_date.value\n",
1286 | " self.end_date_value = self.end_date.value\n",
1287 | "\n",
1288 | " if self.design_type.selected_index == 0:\n",
1289 | " self.distance_data = self._n_part_split(\n",
1290 | " self.formatted_data.query(\n",
1291 | " '@self.start_date_value <= index <= @self.end_date_value'\n",
1292 | " ),\n",
1293 | " self.num_of_split.value,\n",
1294 | " CausalImpact.NUM_OF_ITERATION\n",
1295 | " )\n",
1296 | " elif self.design_type.selected_index == 1:\n",
1297 | " self.distance_data = self._find_similar(\n",
1298 | " self.formatted_data.query(\n",
1299 | " '@self.start_date_value <= index <= @self.end_date_value'\n",
1300 | " ),\n",
1301 | " self.target_columns.value,\n",
1302 | " self.num_of_pick_range.value,\n",
1303 | " self.num_of_covariate.value\n",
1304 | " )\n",
1305 | " elif self.design_type.selected_index == 2:\n",
1306 | " self.distance_data = self._from_share(\n",
1307 | " self.formatted_data.query(\n",
1308 | " '@self.start_date_value <= index <= @self.end_date_value'\n",
1309 | " ),\n",
1310 | " self.target_share.value,\n",
1311 | " )\n",
1312 | " elif self.design_type.selected_index == 3:\n",
1313 | " self.distance_data = self._given_assignment(\n",
1314 | " self.target_columns.value,\n",
1315 | " self.control_columns.value,\n",
1316 | " )\n",
1317 | " else:\n",
1318 | " self._apply_text_style('failure', '\\n\\nFailure!!')\n",
1319 | " print('Please check the following:')\n",
1320 | " print('* There is something wrong with design type.')\n",
1321 | " raise Exception('Please check Failure')\n",
1322 | "\n",
1323 | " self._visualize_candidate(\n",
1324 | " self.formatted_data,\n",
1325 | " self.distance_data,\n",
1326 | " self.start_date_value,\n",
1327 | " self.end_date_value,\n",
1328 | " self.date_col_name,\n",
1329 | " self.tick_count\n",
1330 | " )\n",
1331 | " self._generate_choice()\n",
1332 | "\n",
1333 | " @staticmethod\n",
1334 | " def _n_part_split(dataframe, num_of_split, NUM_OF_ITERATION):\n",
1335 | " \"\"\"n_part_split\n",
1336 | "\n",
1337 | " Args:\n",
1338 | " dataframe: xxx.\n",
1339 | " num_of_split: xxx.\n",
1340 | " NUM_OF_ITERATION: xxx.\n",
1341 | " \"\"\"\n",
1342 | " distance_data = pd.DataFrame(columns=['distance'])\n",
1343 | " num_of_pick = len(dataframe.columns) // num_of_split\n",
1344 | "\n",
1345 | " for l in tqdm(range(NUM_OF_ITERATION)):\n",
1346 | " col_list = list(dataframe.columns)\n",
1347 | " picked_data = pd.DataFrame()\n",
1348 | "\n",
1349 | " # random pick\n",
1350 | " picks = []\n",
1351 | " for s in range(num_of_split):\n",
1352 | " random_pick = random.sample(col_list, num_of_pick)\n",
1353 | " picks.append(random_pick)\n",
1354 | " col_list = [i for i in col_list if i not in random_pick]\n",
1355 | " picks[0].extend(col_list)\n",
1356 | "\n",
1357 | " for i in range(len(picks)):\n",
1358 | " picked_data = pd.concat([\n",
1359 | " picked_data,\n",
1360 | " pd.DataFrame(dataframe[picks[i]].sum(axis=1), columns=[i])\n",
1361 | " ], axis=1)\n",
1362 | "\n",
1363 | " # calculate distance\n",
1364 | " distance = CausalImpact._calculate_distance(\n",
1365 | " picked_data.reset_index(drop=True)\n",
1366 | " )\n",
1367 | " distance_data.loc[l, 'distance'] = float(distance)\n",
1368 | " for j in range(len(picks)):\n",
1369 | " distance_data.at[l, j] = str(sorted(picks[j]))\n",
1370 | "\n",
1371 | " distance_data = (\n",
1372 | " distance_data.drop_duplicates()\n",
1373 | " .sort_values('distance')\n",
1374 | " .head(3)\n",
1375 | " .reset_index(drop=True)\n",
1376 | " )\n",
1377 | " return distance_data\n",
1378 | "\n",
1379 | " @staticmethod\n",
1380 | " def _find_similar(\n",
1381 | " dataframe,\n",
1382 | " target_columns,\n",
1383 | " num_of_pick_range,\n",
1384 | " num_of_covariate,\n",
1385 | " ):\n",
1386 | " distance_data = pd.DataFrame(columns=['distance'])\n",
1387 | " target_cols = target_columns.replace(', ', ',').split(',')\n",
1388 | "\n",
1389 | " # An error occurs when the number of candidates (max num_of_range times\n",
1390 | " # num_of_covariates) is greater than num_of_columns excluding target column.\n",
1391 | " if (\n",
1392 | " len(dataframe.columns) - len(target_cols)\n",
1393 | " >= num_of_pick_range[1] * num_of_covariate):\n",
1394 | " pass\n",
1395 | " else:\n",
1396 | " print('Please check the following:')\n",
1397 | " print('* There is something wrong with similarity settings.')\n",
1398 | " print('* Total number of columns ー the target = {}'.format(\n",
1399 | " len(dataframe.columns) - len(target_cols)))\n",
1400 | " print('* But your settings are {}(max pick#) × {}(covariate#)'.format(\n",
1401 | " num_of_pick_range[1], num_of_covariate))\n",
1402 | " print('* Please set it so that it does not exceed.')\n",
1403 | " PreProcess._apply_text_style('failure', '▲▲▲▲▲▲\\n\\n')\n",
1404 | " raise Exception('Please check Failure')\n",
1405 | "\n",
1406 | " for l in tqdm(range(CausalImpact.NUM_OF_ITERATION)):\n",
1407 | " picked_data = pd.DataFrame()\n",
1408 | " remained_list = [\n",
1409 | " i for i in list(dataframe.columns) if i not in target_cols\n",
1410 | " ]\n",
1411 | " picks = []\n",
1412 | " for s in range(num_of_covariate):\n",
1413 | " pick = random.sample(remained_list, random.randrange(\n",
1414 | " num_of_pick_range[0], num_of_pick_range[1] + 1, 1\n",
1415 | " )\n",
1416 | " )\n",
1417 | " picks.append(pick)\n",
1418 | " remained_list = [\n",
1419 | " ele for ele in remained_list if ele not in pick\n",
1420 | " ]\n",
1421 | " picks.insert(0, target_cols)\n",
1422 | " for i in range(len(picks)):\n",
1423 | " picked_data = pd.concat([\n",
1424 | " picked_data,\n",
1425 | " pd.DataFrame(dataframe[picks[i]].sum(axis=1), columns=[i])\n",
1426 | " ], axis=1)\n",
1427 | "\n",
1428 | " # calculate distance\n",
1429 | " distance = CausalImpact._calculate_distance(\n",
1430 | " picked_data.reset_index(drop=True)\n",
1431 | " )\n",
1432 | " distance_data.loc[l, 'distance'] = float(distance)\n",
1433 | " for j in range(len(picks)):\n",
1434 | " distance_data.at[l, j] = str(sorted(picks[j]))\n",
1435 | "\n",
1436 | " distance_data = (\n",
1437 | " distance_data.drop_duplicates()\n",
1438 | " .sort_values('distance')\n",
1439 | " .head(3)\n",
1440 | " .reset_index(drop=True)\n",
1441 | " )\n",
1442 | " return distance_data\n",
1443 | "\n",
1444 | " @staticmethod\n",
1445 | " def _from_share(\n",
1446 | " dataframe,\n",
1447 | " target_share\n",
1448 | " ):\n",
1449 | " distance_data = pd.DataFrame(columns=['distance'])\n",
1450 | " combinations = []\n",
1451 | "\n",
1452 | " n = CausalImpact.NUM_OF_ITERATION\n",
1453 | " while len(combinations) < CausalImpact.COMBINATION_TARGET:\n",
1454 | " n -= 1\n",
1455 | " picked_col = np.random.choice(\n",
1456 | " dataframe.columns,\n",
1457 | " # Shareは50%までなので列数を2分割\n",
1458 | " random.randint(1, len(dataframe.columns)//2 + 1),\n",
1459 | " replace=False)\n",
1460 | "\n",
1461 | " # (todo)@rhirota シェアを除外済みか全体か検討\n",
1462 | " if float(Decimal(dataframe[picked_col].sum().sum() / dataframe.sum().sum()\n",
1463 | " ).quantize(Decimal('0.1'), ROUND_HALF_UP)) == target_share:\n",
1464 | " combinations.append(sorted(set(picked_col)))\n",
1465 | " if n == 1:\n",
1466 | " PreProcess._apply_text_style('failure', '\\n\\nFailure!!')\n",
1467 | " print('Please check the following:')\n",
1468 | " print('* There is something wrong with design type C.')\n",
1469 | " print(\"* You couldn't find the right combination in the repetitions.\")\n",
1470 | " print('* Please re-try or re-set target share')\n",
1471 | " PreProcess._apply_text_style('failure', '▲▲▲▲▲▲\\n\\n')\n",
1472 | " raise Exception('Please check Failure')\n",
1473 | "\n",
1474 | " for comb in tqdm(combinations):\n",
1475 | " for l in tqdm(\n",
1476 | " range(\n",
1477 | " CausalImpact.NUM_OF_ITERATION // CausalImpact.COMBINATION_TARGET),\n",
1478 | " leave=False):\n",
1479 | " picked_data = pd.DataFrame()\n",
1480 | " remained_list = [\n",
1481 | " i for i in list(dataframe.columns) if i not in comb\n",
1482 | " ]\n",
1483 | " picks = []\n",
1484 | " picks.append(random.sample(remained_list, random.randrange(\n",
1485 | " # (todo)@rhirota 最小Pickを検討\n",
1486 | " 1, len(remained_list), 1\n",
1487 | " )\n",
1488 | " ))\n",
1489 | " picks.insert(0, comb)\n",
1490 | "\n",
1491 | " for i in range(len(picks)):\n",
1492 | " picked_data = pd.concat([\n",
1493 | " picked_data,\n",
1494 | " pd.DataFrame(dataframe[picks[i]].sum(axis=1), columns=[i])\n",
1495 | " ], axis=1)\n",
1496 | "\n",
1497 | " # calculate distance\n",
1498 | " distance = CausalImpact._calculate_distance(\n",
1499 | " picked_data.reset_index(drop=True)\n",
1500 | " )\n",
1501 | " distance_data.loc[l, 'distance'] = float(distance)\n",
1502 | " for j in range(len(picks)):\n",
1503 | " distance_data.at[l, j] = str(sorted(picks[j]))\n",
1504 | "\n",
1505 | " distance_data = (\n",
1506 | " distance_data.drop_duplicates()\n",
1507 | " .sort_values('distance')\n",
1508 | " .head(3)\n",
1509 | " .reset_index(drop=True)\n",
1510 | " )\n",
1511 | " return distance_data\n",
1512 | "\n",
1513 | " @staticmethod\n",
1514 | " def _given_assignment(target_columns, control_columns):\n",
1515 | " distance_data = pd.DataFrame(columns=['distance'])\n",
1516 | " distance_data.loc[0, 'distance'] = 0\n",
1517 | " distance_data.loc[0, 0] = str(target_columns.replace(', ', ',').split(','))\n",
1518 | " distance_data.loc[0, 1] = str(control_columns.replace(', ', ',').split(','))\n",
1519 | " return distance_data\n",
1520 | "\n",
1521 | " @staticmethod\n",
1522 | " def _calculate_distance(dataframe):\n",
1523 | " total_distance = 0\n",
1524 | " scaled_data = pd.DataFrame()\n",
1525 | " for col in dataframe:\n",
1526 | " scaled_data[col] = (dataframe[col] - dataframe[col].min()) / (\n",
1527 | " dataframe[col].max() - dataframe[col].min()\n",
1528 | " )\n",
1529 | " scaled_data = scaled_data.diff().reset_index().dropna()\n",
1530 | " for v in itertools.combinations(list(scaled_data.columns), 2):\n",
1531 | " distance, _ = fastdtw.fastdtw(\n",
1532 | " scaled_data.loc[:, ['index', v[0]]],\n",
1533 | " scaled_data.loc[:, ['index', v[1]]],\n",
1534 | " dist=euclidean,\n",
1535 | " )\n",
1536 | " total_distance = total_distance + distance\n",
1537 | " return total_distance\n",
1538 | "\n",
1539 | " @staticmethod\n",
1540 | " def _visualize_candidate(\n",
1541 | " dataframe,\n",
1542 | " distance_data,\n",
1543 | " start_date_value,\n",
1544 | " end_date_value,\n",
1545 | " date_col_name,\n",
1546 | " tick_count\n",
1547 | " ):\n",
1548 | " PreProcess._apply_text_style(\n",
1549 | " 'failure',\n",
1550 | " '\\nCheck! Experimental Design Parameters.'\n",
1551 | " )\n",
1552 | " print('* start_date_value: ' + str(start_date_value))\n",
1553 | " print('* end_date_value: ' + str(end_date_value))\n",
1554 | " print('* columns:')\n",
1555 | " l = []\n",
1556 | " for i in range(len(dataframe.columns)):\n",
1557 | " l.append(dataframe.columns[i])\n",
1558 | " if len(str(l)) >= CausalImpact.MAX_STRING_LENGTH:\n",
1559 | " print(str(l).translate(str.maketrans({'[': '', ']': '', \"'\": ''})))\n",
1560 | " l = []\n",
1561 | " print('\\n')\n",
1562 | "\n",
1563 | " sub_tab=[ipywidgets.Output() for i in distance_data.index.tolist()]\n",
1564 | " tab_option = ipywidgets.Tab(sub_tab)\n",
1565 | " for i in range (len(distance_data.index.tolist())):\n",
1566 | " tab_option.set_title(i,\"option_{}\".format(i+1))\n",
1567 | " with sub_tab[i]:\n",
1568 | " candidate_df = pd.DataFrame(index=dataframe.index)\n",
1569 | " for col in range(len(distance_data.columns) - 1):\n",
1570 | " print(\n",
1571 | " 'col_' + str(col + 1) + ': '+ distance_data.at[i, col].replace(\n",
1572 | " \"'\", \"\"))\n",
1573 | " candidate_df[col + 1] = list(\n",
1574 | " dataframe.loc[:, eval(distance_data.at[i, col])].sum(axis=1)\n",
1575 | " )\n",
1576 | " print('\\n')\n",
1577 | " candidate_df = candidate_df.add_prefix('col_')\n",
1578 | "\n",
1579 | " candidate_share = pd.DataFrame(\n",
1580 | " candidate_df.loc[str(start_date_value):str(end_date_value), :\n",
1581 | " ].sum(),\n",
1582 | " columns=['total'])\n",
1583 | " candidate_share['daily_average'] = candidate_share['total'] // (\n",
1584 | " end_date_value - start_date_value).days\n",
1585 | " candidate_share['share'] = candidate_share['total'] / (dataframe.query(\n",
1586 | " '@start_date_value <= index <= @end_date_value'\n",
1587 | " ).sum().sum())\n",
1588 | "\n",
1589 | " try:\n",
1590 | " for i in candidate_df.columns:\n",
1591 | " stl = STL(candidate_df[i], robust=True).fit()\n",
1592 | " candidate_share.loc[i, 'std'] = np.std(stl.seasonal + stl.resid)\n",
1593 | " display(\n",
1594 | " candidate_share[['daily_average', 'share', 'std']].style.format(\n",
1595 | " {\n",
1596 | " 'daily_average': '{:,.0f}',\n",
1597 | " 'share': '{:.1%}',\n",
1598 | " 'std': '{:,.0f}',\n",
1599 | " }))\n",
1600 | " except Exception as e:\n",
1601 | " print(e)\n",
1602 | " display(\n",
1603 | " candidate_share[['daily_average', 'share']].style.format({\n",
1604 | " 'daily_average': '{:,.0f}',\n",
1605 | " 'share': '{:.1%}',\n",
1606 | " }))\n",
1607 | "\n",
1608 | " chart_line = (\n",
1609 | " alt.Chart(candidate_df.reset_index())\n",
1610 | " .transform_fold(\n",
1611 | " fold=list(candidate_df.columns), as_=['pivot', 'kpi']\n",
1612 | " )\n",
1613 | " .mark_line()\n",
1614 | " .encode(\n",
1615 | " x=alt.X(\n",
1616 | " date_col_name + ':T',\n",
1617 | " title=None,\n",
1618 | " axis=alt.Axis(\n",
1619 | " grid=False, format='%Y %b', tickCount=tick_count\n",
1620 | " ),\n",
1621 | " ),\n",
1622 | " y=alt.Y('kpi:Q'),\n",
1623 | " color=alt.Color(\n",
1624 | " 'pivot:N',\n",
1625 | " legend=alt.Legend(\n",
1626 | " title=None,\n",
1627 | " orient='none',\n",
1628 | " legendY=-20,\n",
1629 | " direction='horizontal',\n",
1630 | " titleAnchor='start'),\n",
1631 | " scale=alt.Scale(\n",
1632 | " domain=list(candidate_df.columns),\n",
1633 | " range=CausalImpact.colors)),\n",
1634 | " )\n",
1635 | " .properties(width=600, height=200)\n",
1636 | " )\n",
1637 | "\n",
1638 | " rules = alt.Chart(\n",
1639 | " pd.DataFrame(\n",
1640 | " {\n",
1641 | " 'Date': [str(start_date_value), str(end_date_value)],\n",
1642 | " 'color': ['red', 'orange']\n",
1643 | " })\n",
1644 | " ).mark_rule(strokeDash=[5, 5]).encode(\n",
1645 | " x='Date:T',\n",
1646 | " color=alt.Color('color:N', scale=None))\n",
1647 | "\n",
1648 | " df_scaled = candidate_df.copy()\n",
1649 | " df_scaled[:] = MinMaxScaler().fit_transform(candidate_df)\n",
1650 | " chart_line_scaled = (\n",
1651 | " alt.Chart(df_scaled.reset_index())\n",
1652 | " .transform_fold(\n",
1653 | " fold=list(candidate_df.columns),\n",
1654 | " as_=['pivot', 'kpi']\n",
1655 | " )\n",
1656 | " .mark_line()\n",
1657 | " .encode(\n",
1658 | " x=alt.X(\n",
1659 | " date_col_name + ':T',\n",
1660 | " title=None,\n",
1661 | " axis=alt.Axis(\n",
1662 | " grid=False, format='%Y %b', tickCount=tick_count\n",
1663 | " ),\n",
1664 | " ),\n",
1665 | " y=alt.Y('kpi:Q'),\n",
1666 | " color=alt.Color(\n",
1667 | " 'pivot:N',\n",
1668 | " legend=alt.Legend(\n",
1669 | " title=None,\n",
1670 | " orient='none',\n",
1671 | " legendY=-20,\n",
1672 | " direction='horizontal',\n",
1673 | " titleAnchor='start'),\n",
1674 | " scale=alt.Scale(\n",
1675 | " domain=list(candidate_df.columns),\n",
1676 | " range=CausalImpact.colors)),\n",
1677 | " )\n",
1678 | " .properties(width=600, height=80)\n",
1679 | " )\n",
1680 | "\n",
1681 | " df_diff = pd.DataFrame(\n",
1682 | " np.diff(candidate_df, axis=0),\n",
1683 | " columns=candidate_df.columns.values,\n",
1684 | " )\n",
1685 | " scatter = (\n",
1686 | " alt.Chart(df_diff.reset_index())\n",
1687 | " .mark_circle()\n",
1688 | " .encode(\n",
1689 | " alt.X(alt.repeat('column'), type='quantitative'),\n",
1690 | " alt.Y(alt.repeat('row'), type='quantitative'),\n",
1691 | " )\n",
1692 | " .properties(width=80, height=80)\n",
1693 | " .repeat(\n",
1694 | " row=df_diff.columns.values,\n",
1695 | " column=df_diff.columns.values,\n",
1696 | " )\n",
1697 | " )\n",
1698 | " display(\n",
1699 | " alt.vconcat(chart_line + rules, chart_line_scaled) | scatter)\n",
1700 | " display(tab_option)\n",
1701 | "\n",
1702 | " def _generate_choice(self):\n",
1703 | " self.your_choice = ipywidgets.Dropdown(\n",
1704 | " options=['option_1', 'option_2', 'option_3'],\n",
1705 | " description='your choice:',\n",
1706 | " )\n",
1707 | " self.target_col_to_simulate = ipywidgets.SelectMultiple(\n",
1708 | " options=['col_1', 'col_2', 'col_3', 'col_4', 'col_5', 'col_6'],\n",
1709 | " description='target col:',\n",
1710 | " value=['col_1',],\n",
1711 | " )\n",
1712 | " self.covariate_col_to_simulate = ipywidgets.SelectMultiple(\n",
1713 | " options=['col_1', 'col_2', 'col_3', 'col_4', 'col_5', 'col_6'],\n",
1714 | " description='covatiate col:',\n",
1715 | " value=['col_2',],\n",
1716 | " style={'description_width': 'initial'},\n",
1717 | " )\n",
1718 | " display(\n",
1719 | " PreProcess._apply_text_style(\n",
1720 | " 18,\n",
1721 | " '⑷ Please select option, test column & control column(s).'),\n",
1722 | " ipywidgets.HBox([\n",
1723 | " self.your_choice,\n",
1724 | " self.target_col_to_simulate,\n",
1725 | " self.covariate_col_to_simulate,\n",
1726 | " ]),\n",
1727 | " )\n",
1728 | "\n",
1729 | " def generate_simulation(self):\n",
1730 | " self.test_data = self._extract_data_from_choice(\n",
1731 | " self.your_choice.value,\n",
1732 | " self.target_col_to_simulate.value,\n",
1733 | " self.covariate_col_to_simulate.value,\n",
1734 | " self.formatted_data,\n",
1735 | " self.distance_data,\n",
1736 | " )\n",
1737 | " self.simulation_params, self.ci_objs = self._execute_simulation(\n",
1738 | " self.test_data,\n",
1739 | " self.date_col_name,\n",
1740 | " self.start_date_value,\n",
1741 | " self.end_date_value,\n",
1742 | " self.num_of_seasons.value,\n",
1743 | " self.credible_interval.value,\n",
1744 | " CausalImpact.TREAT_DURATION,\n",
1745 | " CausalImpact.TREAT_IMPACT,\n",
1746 | " )\n",
1747 | " self._display_simulation_result(\n",
1748 | " self.simulation_params,\n",
1749 | " self.ci_objs,\n",
1750 | " self.estimate_icpa.value,\n",
1751 | " )\n",
1752 | " self._plot_simulation_result(\n",
1753 | " self.simulation_params,\n",
1754 | " self.ci_objs,\n",
1755 | " self.date_col_name,\n",
1756 | " self.tick_count,\n",
1757 | " self.purpose_selection.selected_index,\n",
1758 | " self.credible_interval.value,\n",
1759 | " )\n",
1760 | "\n",
1761 | " @staticmethod\n",
1762 | " def _extract_data_from_choice(\n",
1763 | " your_choice,\n",
1764 | " target_col_to_simulate,\n",
1765 | " covariate_col_to_simulate,\n",
1766 | " dataframe,\n",
1767 | " distance\n",
1768 | " ):\n",
1769 | " selection_row = int(your_choice.replace('option_', '')) - 1\n",
1770 | " selection_cols = [\n",
1771 | " [int(t.replace('col_', '')) - 1 for t in list(target_col_to_simulate)],\n",
1772 | " [int(t.replace('col_', '')) - 1 for t in list(covariate_col_to_simulate)\n",
1773 | " ]]\n",
1774 | " test_data = pd.DataFrame(index = dataframe.index)\n",
1775 | "\n",
1776 | " test_column = []\n",
1777 | " for i in selection_cols[0]:\n",
1778 | " test_column.extend(eval(distance.at[selection_row,i]))\n",
1779 | " test_data['test'] = dataframe.loc[\n",
1780 | " :, test_column\n",
1781 | " ].sum(axis=1)\n",
1782 | "\n",
1783 | " for col in selection_cols[1]:\n",
1784 | " test_data['col_'+ str(col+1)] = dataframe.loc[\n",
1785 | " :, eval(distance.at[selection_row, col])\n",
1786 | " ].sum(axis=1)\n",
1787 | "\n",
1788 | " print('* test: {}\\n'.format(str(test_column).replace(\"'\", \"\")))\n",
1789 | " print('* covariate')\n",
1790 | " for x,i in zip(test_data.columns[1:],selection_cols[1]):\n",
1791 | " print('> {}: {}'.format(\n",
1792 | " x,\n",
1793 | " str(eval(distance.at[selection_row, i]))).replace(\"'\", \"\")\n",
1794 | " )\n",
1795 | " return test_data\n",
1796 | "\n",
1797 | " @staticmethod\n",
1798 | " def _execute_simulation(\n",
1799 | " dataframe,\n",
1800 | " date_col_name,\n",
1801 | " start_date_value,\n",
1802 | " end_date_value,\n",
1803 | " num_of_seasons,\n",
1804 | " credible_interval,\n",
1805 | " TREAT_DURATION,\n",
1806 | " TREAT_IMPACT,\n",
1807 | " ):\n",
1808 | " ci_objs = []\n",
1809 | " simulation_params = []\n",
1810 | " adjusted_data = dataframe.copy()\n",
1811 | "\n",
1812 | " for duration in tqdm(TREAT_DURATION):\n",
1813 | " for impact in tqdm(TREAT_IMPACT, leave=False):\n",
1814 | " pre_end_date = end_date_value + datetime.timedelta(days=-duration)\n",
1815 | " post_start_date = pre_end_date + datetime.timedelta(days=1)\n",
1816 | " adjusted_data.loc[\n",
1817 | " np.datetime64(post_start_date) : np.datetime64(end_date_value),\n",
1818 | " 'test',] = (\n",
1819 | " dataframe.loc[\n",
1820 | " np.datetime64(post_start_date) : np.datetime64(end_date_value\n",
1821 | " ),\n",
1822 | " 'test',\n",
1823 | " ]\n",
1824 | " * impact\n",
1825 | " )\n",
1826 | "\n",
1827 | " ci_obj = CausalImpact.create_causalimpact_object(\n",
1828 | " adjusted_data,\n",
1829 | " date_col_name,\n",
1830 | " start_date_value,\n",
1831 | " pre_end_date,\n",
1832 | " post_start_date,\n",
1833 | " end_date_value,\n",
1834 | " num_of_seasons,\n",
1835 | " credible_interval,\n",
1836 | " )\n",
1837 | " simulation_params.append([\n",
1838 | " start_date_value,\n",
1839 | " pre_end_date,\n",
1840 | " post_start_date,\n",
1841 | " end_date_value,\n",
1842 | " impact,\n",
1843 | " duration,\n",
1844 | " ])\n",
1845 | " ci_objs.append(ci_obj)\n",
1846 | " return simulation_params, ci_objs\n",
1847 | "\n",
1848 | " @staticmethod\n",
1849 | " def _display_simulation_result(simulation_params, ci_objs, estimate_icpa):\n",
1850 | " simulation_df = pd.DataFrame(\n",
1851 | " index=[],\n",
1852 | " columns=[\n",
1853 | " 'mock_lift',\n",
1854 | " 'Days_simulated',\n",
1855 | " 'Pre_Period_MAPE',\n",
1856 | " 'Post_Period_MAPE',\n",
1857 | " 'Total_effect',\n",
1858 | " 'Average_effect',\n",
1859 | " 'Required_budget',\n",
1860 | " 'p_value',\n",
1861 | " 'predicted_lift'\n",
1862 | " ],\n",
1863 | " )\n",
1864 | " for i in range(len(ci_objs)):\n",
1865 | " impact_df = ci_objs[i].series\n",
1866 | " impact_dict = {\n",
1867 | " 'test_period':'('+str(simulation_params[i][5])+'d) '+str(simulation_params[i][2])+'~'+str(simulation_params[i][3]),\n",
1868 | " 'mock_lift_rate': simulation_params[i][4] - 1,\n",
1869 | " 'predicted_lift_rate': ci_objs[i].summary.loc['average', 'rel_effect'],\n",
1870 | " 'Days_simulated': simulation_params[i][5],\n",
1871 | " 'Pre_Period_MAPE': [\n",
1872 | " mean_absolute_percentage_error(\n",
1873 | " impact_df.loc[:, 'observed'][\n",
1874 | " str(simulation_params[i][0]) : str(\n",
1875 | " simulation_params[i][1]\n",
1876 | " )\n",
1877 | " ],\n",
1878 | " impact_df.loc[:, 'posterior_mean'][\n",
1879 | " str(simulation_params[i][0]) : str(\n",
1880 | " simulation_params[i][1]\n",
1881 | " )\n",
1882 | " ],\n",
1883 | " )\n",
1884 | " ],\n",
1885 | " 'Post_Period_MAPE': [\n",
1886 | " mean_absolute_percentage_error(\n",
1887 | " impact_df.loc[:, 'observed'][\n",
1888 | " str(simulation_params[i][2]) : str(\n",
1889 | " simulation_params[i][3]\n",
1890 | " )\n",
1891 | " ],\n",
1892 | " impact_df.loc[:, 'posterior_mean'][\n",
1893 | " str(simulation_params[i][2]) : str(\n",
1894 | " simulation_params[i][3]\n",
1895 | " )\n",
1896 | " ],\n",
1897 | " )\n",
1898 | " ],\n",
1899 | " 'Total_effect': ci_objs[i].summary.loc['cumulative', 'abs_effect'],\n",
1900 | " 'Average_effect': ci_objs[i].summary.loc['average', 'abs_effect'],\n",
1901 | " 'Required_budget': [\n",
1902 | " ci_objs[i].summary.loc['cumulative', 'abs_effect'] * estimate_icpa\n",
1903 | " ],\n",
1904 | " 'p_value': ci_objs[i].summary.loc['average', 'p_value'],\n",
1905 | "\n",
1906 | " }\n",
1907 | " simulation_df = pd.concat(\n",
1908 | " [simulation_df, pd.DataFrame.from_dict(impact_dict)],\n",
1909 | " ignore_index=True,\n",
1910 | " )\n",
1911 | " display(PreProcess._apply_text_style(\n",
1912 | " 18,\n",
1913 | " 'A/A Test: Check the error without intervention'))\n",
1914 | " print('> If p_value < 0.05, please suspect \"poor model accuracy\"(See Pre_Period_MAPE) or \"data drift\"(See Time Series Chart).\\n')\n",
1915 | " display(\n",
1916 | " simulation_df.query('mock_lift_rate == 0')[\n",
1917 | " ['test_period','Pre_Period_MAPE','Post_Period_MAPE','p_value']\n",
1918 | " ].style.format({\n",
1919 | " 'Pre_Period_MAPE': '{:.2%}',\n",
1920 | " 'Post_Period_MAPE': '{:.2%}',\n",
1921 | " 'p_value': '{:,.2f}',\n",
1922 | " }).hide()\n",
1923 | " )\n",
1924 | " print('\\n')\n",
1925 | " display(PreProcess._apply_text_style(\n",
1926 | " 18,\n",
1927 | " 'Simulation with increments as a mock experiment'))\n",
1928 | " for i in simulation_df.Days_simulated.unique():\n",
1929 | " print('\\n During the last {} days'.format(i))\n",
1930 | " display(\n",
1931 | " simulation_df.query('mock_lift_rate != 0 & Days_simulated == @i')[\n",
1932 | " [\n",
1933 | " 'mock_lift_rate',\n",
1934 | " 'predicted_lift_rate',\n",
1935 | " 'Pre_Period_MAPE',\n",
1936 | " 'Total_effect',\n",
1937 | " 'Average_effect',\n",
1938 | " 'Required_budget',\n",
1939 | " 'p_value',\n",
1940 | " ]\n",
1941 | " ].style.format({\n",
1942 | " 'mock_lift_rate': '{:+.0%}',\n",
1943 | " 'predicted_lift_rate': '{:+.1%}',\n",
1944 | " 'Pre_Period_MAPE': '{:.2%}',\n",
1945 | " 'Total_effect': '{:,.2f}',\n",
1946 | " 'Average_effect': '{:,.2f}',\n",
1947 | " 'Required_budget': '{:,.0f}',\n",
1948 | " 'p_value': '{:,.2f}',\n",
1949 | " }).hide()\n",
1950 | " )\n",
1951 | "\n",
1952 | " @staticmethod\n",
1953 | " def _plot_simulation_result(\n",
1954 | " simulation_params,\n",
1955 | " ci_objs,\n",
1956 | " date_col_name,\n",
1957 | " tick_count,\n",
1958 | " purpose_selection,\n",
1959 | " credible_interval,\n",
1960 | " ):\n",
1961 | "\n",
1962 | " mock_combinations = []\n",
1963 | " for i in range(len(simulation_params)):\n",
1964 | " mock_combinations.append(\n",
1965 | " [\n",
1966 | " '{}d:+{:.0%}'.format(\n",
1967 | " simulation_params[i][5],\n",
1968 | " simulation_params[i][4]-1)\n",
1969 | " ])\n",
1970 | " simulation_tb=[ipywidgets.Output() for tab in mock_combinations]\n",
1971 | " tab_simulation = ipywidgets.Tab(simulation_tb)\n",
1972 | " for id,name in enumerate(mock_combinations):\n",
1973 | " tab_simulation.set_title(id,name)\n",
1974 | " with simulation_tb[id]:\n",
1975 | " print(\n",
1976 | " 'Pre Period:{} ~ {}\\nPost Period:{} ~ {}'.format(\n",
1977 | " simulation_params[id][0],\n",
1978 | " simulation_params[id][1],\n",
1979 | " simulation_params[id][2],\n",
1980 | " simulation_params[id][3],\n",
1981 | " )\n",
1982 | " )\n",
1983 | " CausalImpact.plot_causalimpact(\n",
1984 | " ci_objs[id],\n",
1985 | " simulation_params[id][0],\n",
1986 | " simulation_params[id][1],\n",
1987 | " simulation_params[id][2],\n",
1988 | " simulation_params[id][3],\n",
1989 | " credible_interval,\n",
1990 | " date_col_name,\n",
1991 | " tick_count,\n",
1992 | " purpose_selection\n",
1993 | " )\n",
1994 | " display(tab_simulation)\n",
1995 | "\n",
1996 | "case_1 = CausalImpact()\n",
1997 | "case_1.generate_ui()\n",
1998 | "if 'dict_params' in globals():\n",
1999 | " CausalImpact.set_params(case_1, dict_params)\n",
2000 | "print('\\nExecution datetime(GMT):{}'.format(datetime.datetime.now()))\n"
2001 | ],
2002 | "metadata": {
2003 | "id": "_WR_6zEwE2yK",
2004 | "cellView": "form"
2005 | },
2006 | "execution_count": null,
2007 | "outputs": []
2008 | },
2009 | {
2010 | "cell_type": "code",
2011 | "source": [
2012 | "# @title Step.2\n",
2013 | "%%time\n",
2014 | "case_1.load_data()\n",
2015 | "case_1.format_data()\n",
2016 | "dict_params = PreProcess.saving_params(case_1)\n",
2017 | "\n",
2018 | "if case_1.purpose_selection.selected_index == 0:\n",
2019 | " case_1.run_causalImpact()\n",
2020 | "else:\n",
2021 | " case_1.run_experimental_design()\n",
2022 | "\n",
2023 | "print('\\nExecution datetime(GMT):{}'.format(datetime.datetime.now()))"
2024 | ],
2025 | "metadata": {
2026 | "id": "c94KKPvvlB3u",
2027 | "cellView": "form"
2028 | },
2029 | "execution_count": null,
2030 | "outputs": []
2031 | },
2032 | {
2033 | "cell_type": "code",
2034 | "source": [
2035 | "# @title Step.3\n",
2036 | "%%time\n",
2037 | "if case_1.purpose_selection.selected_index == 0:\n",
2038 | " case_1.display_causalimpact_result()\n",
2039 | "else:\n",
2040 | " case_1.generate_simulation()\n",
2041 | "\n",
2042 | "print('\\nExecution datetime(GMT):{}'.format(datetime.datetime.now()))"
2043 | ],
2044 | "metadata": {
2045 | "id": "yK5gZ0KioPP4",
2046 | "cellView": "form"
2047 | },
2048 | "execution_count": null,
2049 | "outputs": []
2050 | },
2051 | {
2052 | "cell_type": "markdown",
2053 | "source": [
2054 | "# (Optional) Case_2"
2055 | ],
2056 | "metadata": {
2057 | "id": "yRkmseYMdtfB"
2058 | }
2059 | },
2060 | {
2061 | "cell_type": "code",
2062 | "source": [
2063 | "# @title Case_2 Step.1\n",
2064 | "overwrite_pramas = True #@param {type:\"boolean\"}\n",
2065 | "case_2 = CausalImpact()\n",
2066 | "case_2.generate_ui()\n",
2067 | "if overwrite_pramas == True: PreProcess.set_params(case_2, dict_params)"
2068 | ],
2069 | "metadata": {
2070 | "cellView": "form",
2071 | "id": "PsQlufVpdxOD"
2072 | },
2073 | "execution_count": null,
2074 | "outputs": []
2075 | },
2076 | {
2077 | "cell_type": "code",
2078 | "source": [
2079 | "# @title Case_2 Step.2\n",
2080 | "%%time\n",
2081 | "case_2.load_data()\n",
2082 | "case_2.format_data()\n",
2083 | "\n",
2084 | "if case_2.purpose_selection.selected_index == 0:\n",
2085 | " case_2.run_causalImpact()\n",
2086 | "else:\n",
2087 | " case_2.run_experimental_design()\n",
2088 | "\n",
2089 | "print('\\nExecution datetime(GMT):{}'.format(datetime.datetime.now()))"
2090 | ],
2091 | "metadata": {
2092 | "cellView": "form",
2093 | "id": "rMgpKut9ewEy"
2094 | },
2095 | "execution_count": null,
2096 | "outputs": []
2097 | },
2098 | {
2099 | "cell_type": "code",
2100 | "source": [
2101 | "# @title Case_2 Step.3\n",
2102 | "%%time\n",
2103 | "if case_2.purpose_selection.selected_index == 0:\n",
2104 | " case_2.display_causalimpact_result()\n",
2105 | "else:\n",
2106 | " case_2.generate_simulation()\n",
2107 | "\n",
2108 | "print('\\nExecution datetime(GMT):{}'.format(datetime.datetime.now()))"
2109 | ],
2110 | "metadata": {
2111 | "cellView": "form",
2112 | "id": "L7H9OEhme7Wu"
2113 | },
2114 | "execution_count": null,
2115 | "outputs": []
2116 | },
2117 | {
2118 | "cell_type": "markdown",
2119 | "source": [
2120 | "# (Optional) Case_3"
2121 | ],
2122 | "metadata": {
2123 | "id": "wyh14BKUfKcD"
2124 | }
2125 | },
2126 | {
2127 | "cell_type": "code",
2128 | "source": [
2129 | "# @title Case_3 Step.1\n",
2130 | "overwrite_pramas = False #@param {type:\"boolean\"}\n",
2131 | "case_3 = CausalImpact()\n",
2132 | "case_3.generate_ui()\n",
2133 | "if overwrite_pramas == True: PreProcess.set_params(case_3, dict_params)"
2134 | ],
2135 | "metadata": {
2136 | "cellView": "form",
2137 | "id": "Gb_PkbFifKcE"
2138 | },
2139 | "execution_count": null,
2140 | "outputs": []
2141 | },
2142 | {
2143 | "cell_type": "code",
2144 | "source": [
2145 | "# @title Case_3 Step.2\n",
2146 | "%%time\n",
2147 | "case_3.load_data()\n",
2148 | "case_3.format_data()\n",
2149 | "\n",
2150 | "if case_3.purpose_selection.selected_index == 0:\n",
2151 | " case_3.run_causalImpact()\n",
2152 | "else:\n",
2153 | " case_3.run_experimental_design()\n",
2154 | "\n",
2155 | "print('\\nExecution datetime(GMT):{}'.format(datetime.datetime.now()))"
2156 | ],
2157 | "metadata": {
2158 | "cellView": "form",
2159 | "id": "UUKm41oWfKcF"
2160 | },
2161 | "execution_count": null,
2162 | "outputs": []
2163 | },
2164 | {
2165 | "cell_type": "code",
2166 | "source": [
2167 | "# @title Case_3 Step.3\n",
2168 | "%%time\n",
2169 | "if case_3.purpose_selection.selected_index == 0:\n",
2170 | " case_3.display_causalimpact_result()\n",
2171 | "else:\n",
2172 | " case_3.generate_simulation()\n",
2173 | "\n",
2174 | "print('\\nExecution datetime(GMT):{}'.format(datetime.datetime.now()))"
2175 | ],
2176 | "metadata": {
2177 | "cellView": "form",
2178 | "id": "7Ssv3wP9fKcF"
2179 | },
2180 | "execution_count": null,
2181 | "outputs": []
2182 | }
2183 | ],
2184 | "metadata": {
2185 | "colab": {
2186 | "provenance": [],
2187 | "include_colab_link": true
2188 | },
2189 | "kernelspec": {
2190 | "display_name": "Python 3",
2191 | "name": "python3"
2192 | },
2193 | "language_info": {
2194 | "name": "python"
2195 | }
2196 | },
2197 | "nbformat": 4,
2198 | "nbformat_minor": 0
2199 | }
--------------------------------------------------------------------------------