├── .github
└── workflows
│ ├── ci.yml
│ ├── regenerate-tutorials.yml
│ └── release.yml
├── CODEOWNERS
├── LICENSE
├── README.md
├── alloy
├── send-logs-to-loki
│ ├── finish.md
│ ├── index.json
│ ├── intro.md
│ ├── preprocessed.md
│ ├── step1.md
│ ├── step2.md
│ ├── step3.md
│ ├── step4.md
│ └── step5.md
├── send-metrics-to-prometheus
│ ├── finish.md
│ ├── index.json
│ ├── intro.md
│ ├── preprocessed.md
│ ├── previous-tutorial-setup.sh
│ ├── step1.md
│ ├── step2.md
│ ├── step3.md
│ └── step4.md
└── structure.json
├── assets
├── ILE.png
├── full-stack-ile.png
├── logo.png
├── loki-ile.png
└── loki-ile.svg
├── docs
├── examples
│ ├── complete-docs-example.md
│ ├── intro-to-logging-fluentd-fluent-bit.md
│ ├── k8s-monitoring-example.md
│ ├── sandbox-transformer-walk-through.md
│ └── using-defaults.md
└── transformer.md
├── full-stack
├── assets
│ ├── grafana_logo.png
│ ├── grot-4.png
│ └── mltp.png
├── intro-to-mltp
│ ├── finished.md
│ ├── index.json
│ ├── intro.md
│ ├── setup.sh
│ └── step1.md
├── structure.json
├── tutorial-enviroment-completed
│ ├── finished.md
│ ├── index.json
│ ├── intro.md
│ ├── setup.sh
│ └── step1.md
└── tutorial-enviroment
│ ├── finished.md
│ ├── index.json
│ ├── intro.md
│ ├── setup.sh
│ └── step1.md
├── grafana
├── alerting-get-started-pt2
│ ├── finish.md
│ ├── index.json
│ ├── intro.md
│ ├── preprocessed.md
│ ├── step1.md
│ ├── step2.md
│ ├── step3.md
│ ├── step4.md
│ ├── step5.md
│ ├── step6.md
│ ├── step7.md
│ └── step8.md
├── alerting-get-started-pt3
│ ├── finish.md
│ ├── index.json
│ ├── intro.md
│ ├── preprocessed.md
│ ├── step1.md
│ ├── step2.md
│ ├── step3.md
│ ├── step4.md
│ ├── step5.md
│ └── step6.md
├── alerting-get-started-pt4
│ ├── finish.md
│ ├── index.json
│ ├── intro.md
│ ├── preprocessed.md
│ ├── step1.md
│ ├── step2.md
│ ├── step3.md
│ ├── step4.md
│ ├── step5.md
│ └── step6.md
├── alerting-get-started-pt5
│ ├── finish.md
│ ├── index.json
│ ├── intro.md
│ ├── preprocessed.md
│ ├── step1.md
│ ├── step2.md
│ ├── step3.md
│ ├── step4.md
│ ├── step5.md
│ ├── step6.md
│ └── step7.md
├── alerting-get-started-pt6
│ ├── finish.md
│ ├── index.json
│ ├── intro.md
│ ├── preprocessed.md
│ ├── step1.md
│ ├── step2.md
│ ├── step3.md
│ ├── step4.md
│ ├── step5.md
│ ├── step6.md
│ └── step7.md
├── alerting-get-started
│ ├── finish.md
│ ├── index.json
│ ├── intro.md
│ ├── preprocessed.md
│ ├── step1.md
│ ├── step2.md
│ ├── step3.md
│ └── step4.md
├── alerting-loki-logs
│ ├── finish.md
│ ├── index.json
│ ├── intro.md
│ ├── preprocessed.md
│ ├── step1.md
│ ├── step2.md
│ ├── step3.md
│ ├── step4.md
│ └── step5.md
├── assets
│ ├── data_sources.png
│ ├── data_sources_list.png
│ ├── grafana_logo.png
│ ├── graph.png
│ ├── grot-4.png
│ ├── query.png
│ ├── save_and_test.png
│ └── search.png
├── fo11y
│ ├── finished.md
│ ├── index.json
│ ├── intro.md
│ ├── setup.sh
│ ├── step1.md
│ ├── step2.md
│ ├── step3.md
│ └── step4.md
├── grafana-basics
│ ├── assets
│ │ ├── prometheus.yml
│ │ └── prometheus_datasource.yml
│ ├── finished.md
│ ├── index.json
│ ├── intro.md
│ ├── step1.md
│ ├── step2.md
│ ├── step3.md
│ └── step4.md
├── grafana-fundamentals
│ ├── finish.md
│ ├── index.json
│ ├── intro.md
│ ├── preprocessed.md
│ ├── step1.md
│ ├── step10.md
│ ├── step2.md
│ ├── step3.md
│ ├── step4.md
│ ├── step5.md
│ ├── step6.md
│ ├── step7.md
│ ├── step8.md
│ └── step9.md
└── structure.json
├── loki
├── alloy-kafka-logs
│ ├── finish.md
│ ├── index.json
│ ├── intro.md
│ ├── preprocessed.md
│ ├── step1.md
│ ├── step2.md
│ ├── step3.md
│ └── step4.md
├── alloy-otel-logs
│ ├── finish.md
│ ├── index.json
│ ├── intro.md
│ ├── preprocessed.md
│ ├── step1.md
│ ├── step2.md
│ └── step3.md
├── assets
│ ├── grot-4.png
│ └── loki-logo.png
├── fluentbit-loki-tutorial
│ ├── finish.md
│ ├── index.json
│ ├── intro.md
│ ├── preprocessed.md
│ ├── step1.md
│ ├── step2.md
│ └── step3.md
├── intro-to-ingest-otel
│ ├── finished.md
│ ├── index.json
│ ├── intro.md
│ ├── setup.sh
│ ├── step1.md
│ ├── step2.md
│ └── step3.md
├── intro-to-ingest
│ ├── finished.md
│ ├── index.json
│ ├── intro.md
│ ├── setup.sh
│ ├── step1.md
│ ├── step2.md
│ ├── step3.md
│ └── step4.md
├── intro-to-logging-fluentd-fluentbit
│ ├── finish.md
│ ├── index.json
│ ├── intro.md
│ ├── step1.md
│ ├── step2.md
│ ├── step3.md
│ └── step4.md
├── intro-to-logging
│ ├── finished.md
│ ├── index.json
│ ├── intro.md
│ └── step1.md
├── k8s-monitoring-helm
│ ├── finish.md
│ ├── index.json
│ ├── intro.md
│ ├── preprocessed.md
│ ├── step1.md
│ ├── step2.md
│ ├── step3.md
│ ├── step4.md
│ ├── step5.md
│ ├── step6.md
│ ├── step7.md
│ └── step8.md
├── logcli-tutorial
│ ├── finish.md
│ ├── index.json
│ ├── intro.md
│ ├── preprocessed.md
│ ├── setup.sh
│ ├── step1.md
│ ├── step2.md
│ ├── step3.md
│ └── step4.md
├── loki-getting-started-tutorial
│ ├── finish.md
│ ├── index.json
│ ├── intro.md
│ ├── preprocessed.md
│ ├── setup.sh
│ ├── step1.md
│ ├── step2.md
│ ├── step3.md
│ ├── step4.md
│ ├── step5.md
│ ├── step6.md
│ ├── step7.md
│ └── step8.md
├── loki-quickstart
│ ├── finish.md
│ ├── index.json
│ ├── intro.md
│ ├── preprocessed.md
│ ├── setup.sh
│ ├── step1.md
│ └── step2.md
├── otel-collector-getting-started
│ ├── finish.md
│ ├── index.json
│ ├── intro.md
│ ├── preprocessed.md
│ ├── step1.md
│ ├── step2.md
│ └── step3.md
├── structure-of-logs
│ ├── finished.md
│ ├── index.json
│ ├── intro.md
│ ├── setup.sh
│ └── step1.md
├── structure.json
└── what-is-loki
│ ├── finished.md
│ ├── index.json
│ ├── intro.md
│ ├── setup.sh
│ ├── step1.md
│ └── step2.md
├── mimir
├── play-with-mimir
│ ├── docker-compose-update.sh
│ ├── finish.md
│ ├── index.json
│ ├── intro.md
│ ├── preprocessed.md
│ ├── step1.md
│ ├── step2.md
│ ├── step3.md
│ ├── step4.md
│ └── step5.md
└── structure.json
├── pyroscope
├── ride-share-tutorial
│ ├── docker-compose-update.sh
│ ├── finish.md
│ ├── index.json
│ ├── intro.md
│ ├── preprocessed.md
│ ├── step1.md
│ ├── step2.md
│ ├── step3.md
│ └── step4.md
└── structure.json
├── sandbox-developer
├── sandbox-transformer-walk-through
│ ├── finish.md
│ ├── index.json
│ ├── intro.md
│ ├── preprocessed.md
│ ├── step1.md
│ ├── step2.md
│ ├── step3.md
│ ├── step4.md
│ └── step5.md
└── structure.json
├── scripts
├── check-out-branch.bash
└── manage-pr.bash
├── tempo
├── quick-start
│ ├── docker-compose-update.sh
│ ├── finish.md
│ ├── index.json
│ ├── intro.md
│ ├── preprocessed.md
│ ├── step1.md
│ ├── step2.md
│ └── step3.md
└── structure.json
├── tools
├── alloy-proxy
│ ├── config.alloy
│ └── dockerfile
├── course-tracker
│ └── config.alloy
└── transformer
│ ├── .gitignore
│ ├── .golangci.yml
│ ├── directives.go
│ ├── extend.go
│ ├── go.mod
│ ├── go.sum
│ ├── goldmark
│ ├── extension
│ │ └── table.go
│ ├── goldmark.go
│ ├── killercoda
│ │ └── killercoda.go
│ └── renderer
│ │ └── markdown
│ │ ├── block.go
│ │ ├── block_test.go
│ │ ├── inline.go
│ │ ├── inline_test.go
│ │ └── markdown.go
│ ├── hack
│ └── generate-directives
│ │ └── main.go
│ ├── killercoda
│ └── index.go
│ ├── main.go
│ ├── preprocess.go
│ ├── preprocess_test.go
│ ├── transform.go
│ └── transform_test.go
└── workshops
├── adventure
├── docker-compose-update.sh
├── finish.md
├── index.json
├── intro.md
├── preprocessed.md
├── step1.md
└── step2.md
├── course-tracker-test
├── finish.md
├── index.json
├── intro.md
├── preprocessed.md
├── setup.sh
├── step1.md
├── step2.md
├── step3.md
├── step4.md
├── step5.md
├── step6.md
├── step7.md
└── step8.md
├── game-of-traces
├── docker-compose-update.sh
├── finish.md
├── index.json
├── intro.md
├── preprocessed.md
├── step1.md
├── step2.md
├── step3.md
└── step4.md
└── structure.json
/.github/workflows/ci.yml:
--------------------------------------------------------------------------------
1 | name: Run Continuous Integration
2 |
3 | permissions: {}
4 |
5 | on:
6 | pull_request:
7 |
8 | jobs:
9 | go-test:
10 | if: github.repository == 'grafana/killercoda'
11 | runs-on: ubuntu-latest
12 | steps:
13 | - uses: actions/checkout@11bd71901bbe5b1630ceea73d27597364c9af683 # v4.2.2
14 | with:
15 | path: killercoda
16 | persist-credentials: false
17 | - uses: actions/setup-go@3041bf56c941b39c61721a86cd11f3bb1338122a # v5.2.0
18 | with:
19 | go-version-file: killercoda/tools/transformer/go.mod
20 | - run: go test ./...
21 | working-directory: killercoda/tools/transformer
22 |
--------------------------------------------------------------------------------
/CODEOWNERS:
--------------------------------------------------------------------------------
1 | # Lines starting with '#' are comments.
2 | # Each line is a file pattern followed by one or more owners.
3 |
4 | # More details are here: https://help.github.com/articles/about-codeowners/
5 |
6 | # The '*' pattern is global owners.
7 |
8 | # Order is important. The last matching pattern has the most precedence.
9 | # The folders are ordered as follows:
10 |
11 | # In each subsection folders are ordered first by depth, then alphabetically.
12 | # This should make it easy to add new rules without breaking existing ones.
13 |
14 | * @Jayclifford345
15 |
16 | /.github/ @jdbaldry
17 | /CODEOWNERS/ @Jayclifford345 @jdbaldry
18 | /scripts/ @jdbaldry
19 | /tools/ @jdbaldry
20 | /transformer.md @jdbaldry
21 |
--------------------------------------------------------------------------------
/alloy/send-logs-to-loki/finish.md:
--------------------------------------------------------------------------------
1 | # Summary
2 |
3 | You have installed and configured Alloy, and sent logs from your local host to your local Grafana stack.
4 |
5 | In the [next tutorial](https://grafana.com/docs/alloy/latest/tutorials/send-metrics-to-prometheus/), you learn more about configuration concepts and metrics.
6 |
--------------------------------------------------------------------------------
/alloy/send-logs-to-loki/index.json:
--------------------------------------------------------------------------------
1 | {
2 | "title": "Use Grafana Alloy to send logs to Loki",
3 | "description": "Learn how to use Grafana Alloy to send logs to Loki",
4 | "details": {
5 | "intro": {
6 | "text": "intro.md"
7 | },
8 | "steps": [
9 | {
10 | "text": "step1.md"
11 | },
12 | {
13 | "text": "step2.md"
14 | },
15 | {
16 | "text": "step3.md"
17 | },
18 | {
19 | "text": "step4.md"
20 | },
21 | {
22 | "text": "step5.md"
23 | }
24 | ],
25 | "finish": {
26 | "text": "finish.md"
27 | }
28 | },
29 | "backend": {
30 | "imageid": "ubuntu"
31 | }
32 | }
33 |
--------------------------------------------------------------------------------
/alloy/send-logs-to-loki/intro.md:
--------------------------------------------------------------------------------
1 | # Use Grafana Alloy to send logs to Loki
2 |
3 | This tutorial shows you how to configure Alloy to collect logs from your local machine, filter non-essential log lines, send them to Loki, and use Grafana to explore the results.
4 |
5 | # Before you begin
6 |
7 | To complete this tutorial:
8 |
9 | - You must have a basic understanding of Alloy and telemetry collection in general.
10 | - You should be familiar with Prometheus, PromQL, Loki, LogQL, and basic Grafana navigation.
11 |
--------------------------------------------------------------------------------
/alloy/send-logs-to-loki/step1.md:
--------------------------------------------------------------------------------
1 | # Install Alloy and start the service
2 |
3 | > This online sandbox environment is based on an Ubuntu image and has Docker pre-installed. To install Alloy in the sandbox, perform the following steps.
4 |
5 | ## Linux
6 |
7 | Install and run Alloy on Linux.
8 |
9 | 1. [Install Alloy](https://grafana.com/docs/alloy/latest/set-up/install/linux/).
10 | 1. To view the Alloy UI within the sandbox, Alloy must run on all interfaces. Run the following command before you start the Alloy service.
11 |
12 | ```bash
13 | sed -i -e 's/CUSTOM_ARGS=""/CUSTOM_ARGS="--server.http.listen-addr=0.0.0.0:12345"/' /etc/default/alloy
14 | ```{{exec}}
15 | 1. [Run Alloy](https://grafana.com/docs/alloy/latest/set-up/run/linux/).
16 |
17 | You can access the Alloy UI at [http://localhost:12345]({{TRAFFIC_HOST1_12345}}).
18 |
--------------------------------------------------------------------------------
/alloy/send-logs-to-loki/step4.md:
--------------------------------------------------------------------------------
1 | # Reload the configuration
2 |
3 | 1. Copy your local `config.alloy`{{copy}} file into the default Alloy configuration file location.
4 |
5 | ```bash
6 | sudo cp config.alloy /etc/alloy/config.alloy
7 | ```{{exec}}
8 | 1. Call the `/-/reload`{{copy}} endpoint to tell Alloy to reload the configuration file without a system service restart.
9 |
10 | ```bash
11 | curl -X POST http://localhost:12345/-/reload
12 | ```{{exec}}
13 |
14 | > This step uses the Alloy UI on `localhost`{{copy}} port `12345`{{copy}}. If you chose to run Alloy in a Docker container, make sure you use the `--server.http.listen-addr=`{{copy}} argument. If you don't use this argument, the [debugging UI](https://grafana.com/docs/alloy/latest/troubleshoot/debug/#alloy-ui) won't be available outside of the Docker container.
15 | 1. Optional: You can do a system service restart Alloy and load the configuration file.
16 |
17 | ```bash
18 | sudo systemctl reload alloy
19 | ```{{exec}}
20 |
21 | # Inspect your configuration in the Alloy UI
22 |
23 | Open [http://localhost:12345]({{TRAFFIC_HOST1_12345}}) and click the **Graph** tab at the top.
24 | The graph should look similar to the following:
25 |
26 | 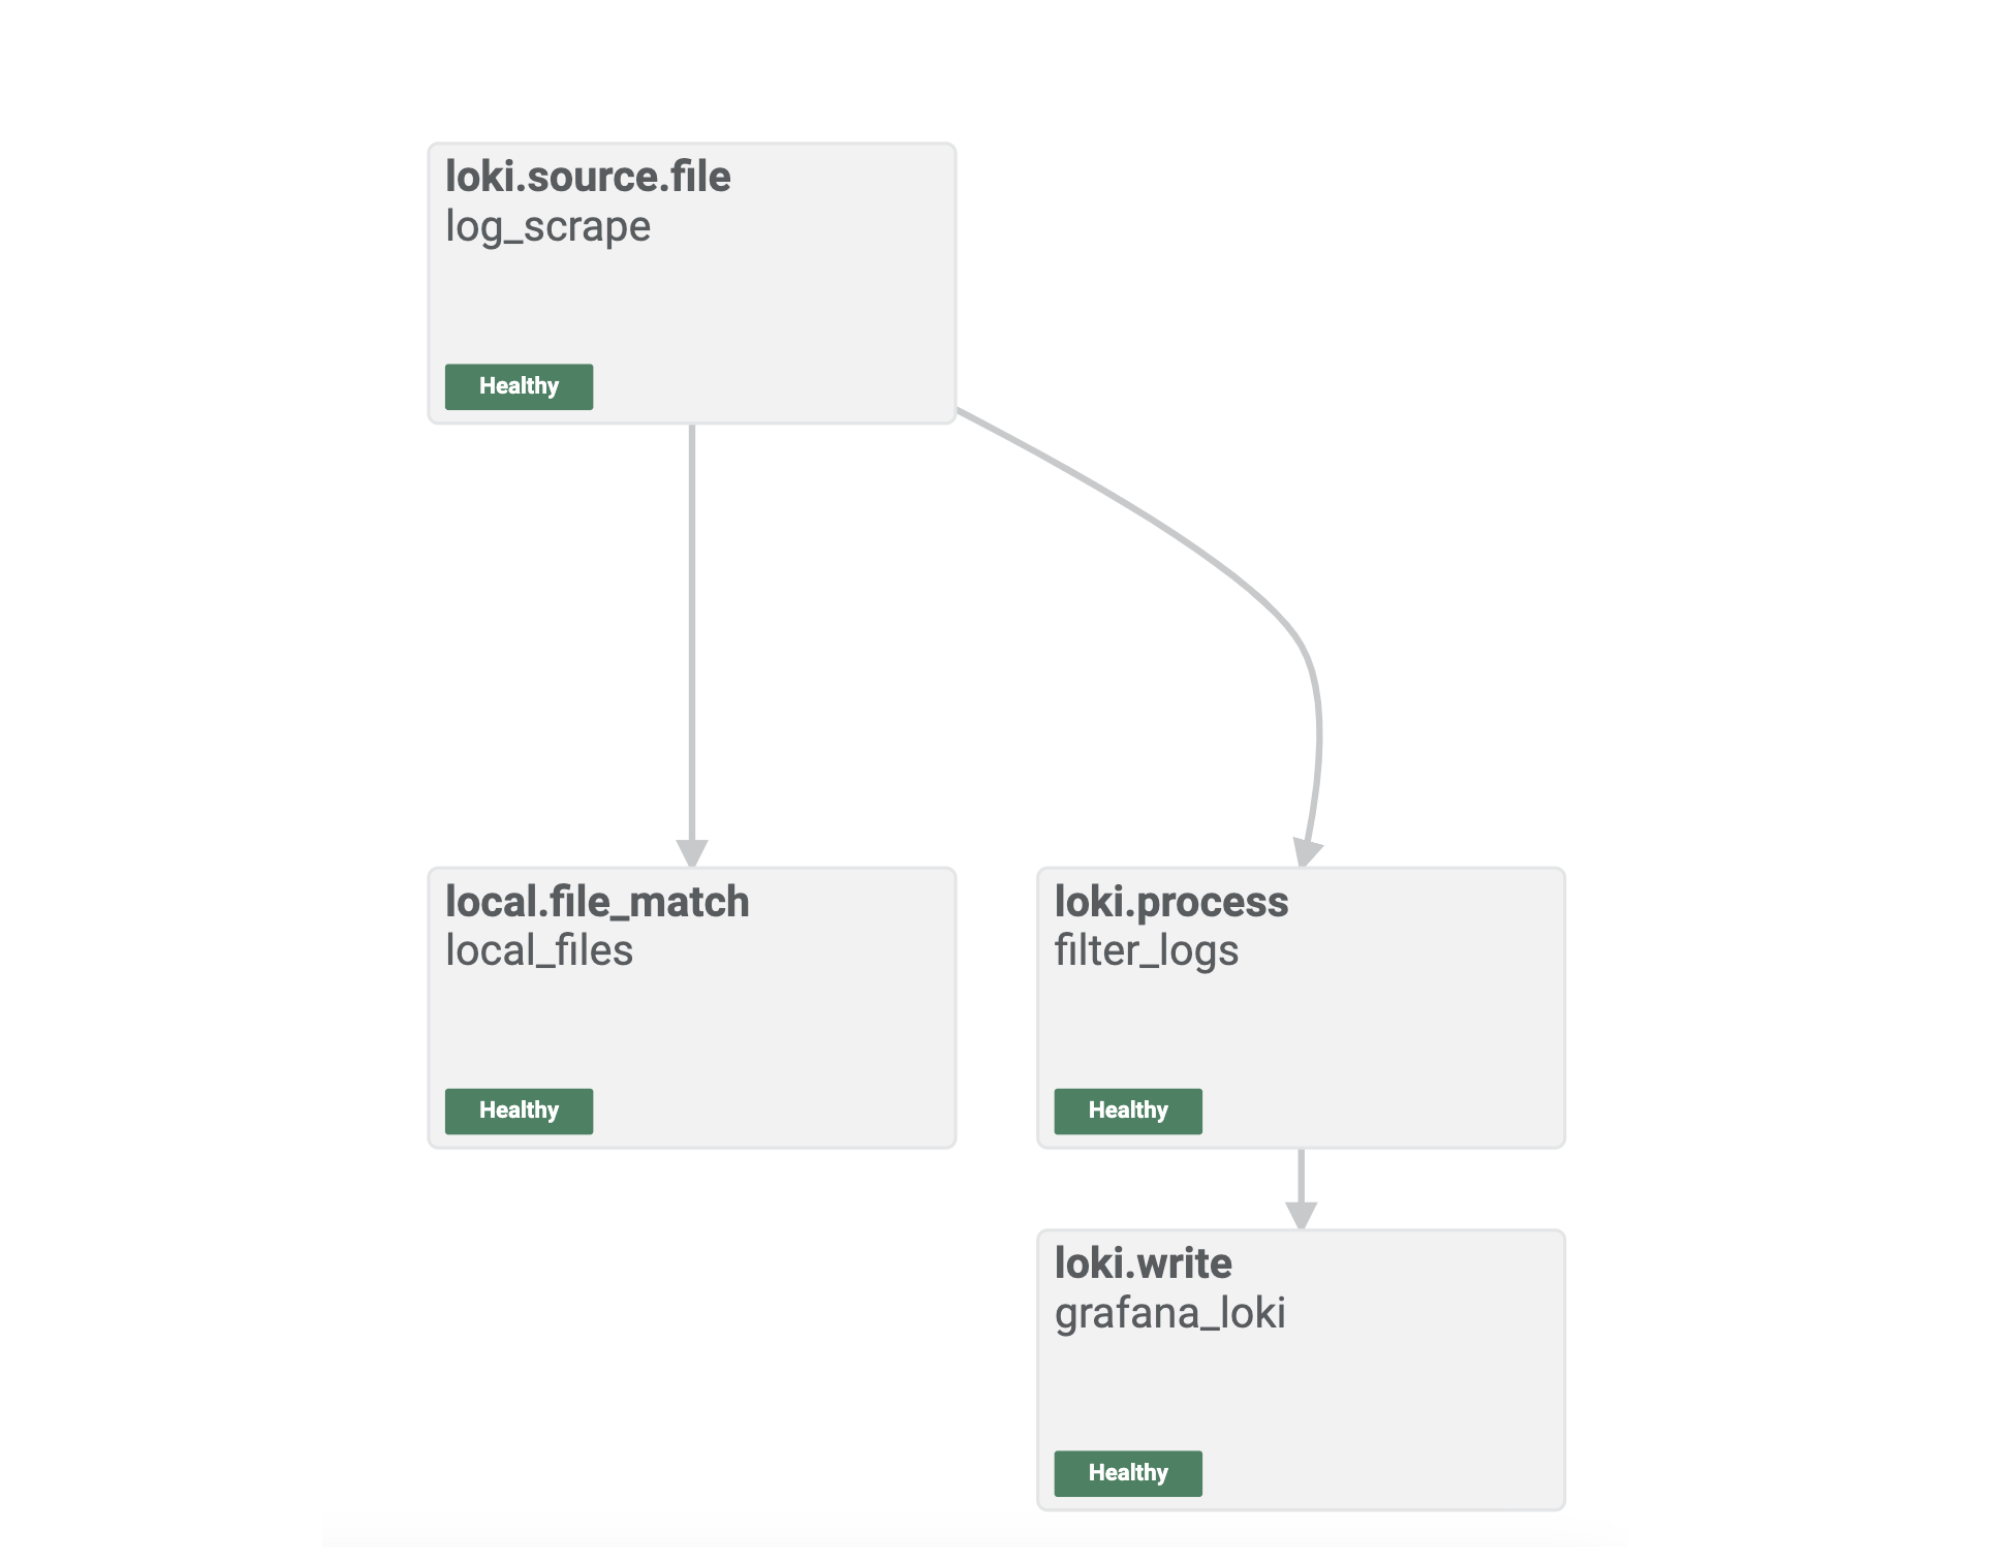
27 |
28 | The Alloy UI shows you a visual representation of the pipeline you built with your Alloy component configuration.
29 |
30 | You can see that the components are healthy, and you are ready to explore the logs in Grafana.
31 |
--------------------------------------------------------------------------------
/alloy/send-logs-to-loki/step5.md:
--------------------------------------------------------------------------------
1 | # Log in to Grafana and explore Loki logs
2 |
3 | Open [http://localhost:3000/explore]({{TRAFFIC_HOST1_3000}}/explore) to access **Explore** feature in Grafana.
4 |
5 | Select Loki as the data source and click the **Label Browser** button to select a file that Alloy has sent to Loki.
6 |
7 | Here you can see that logs are flowing through to Loki as expected, and the end-to-end configuration was successful.
8 |
9 | 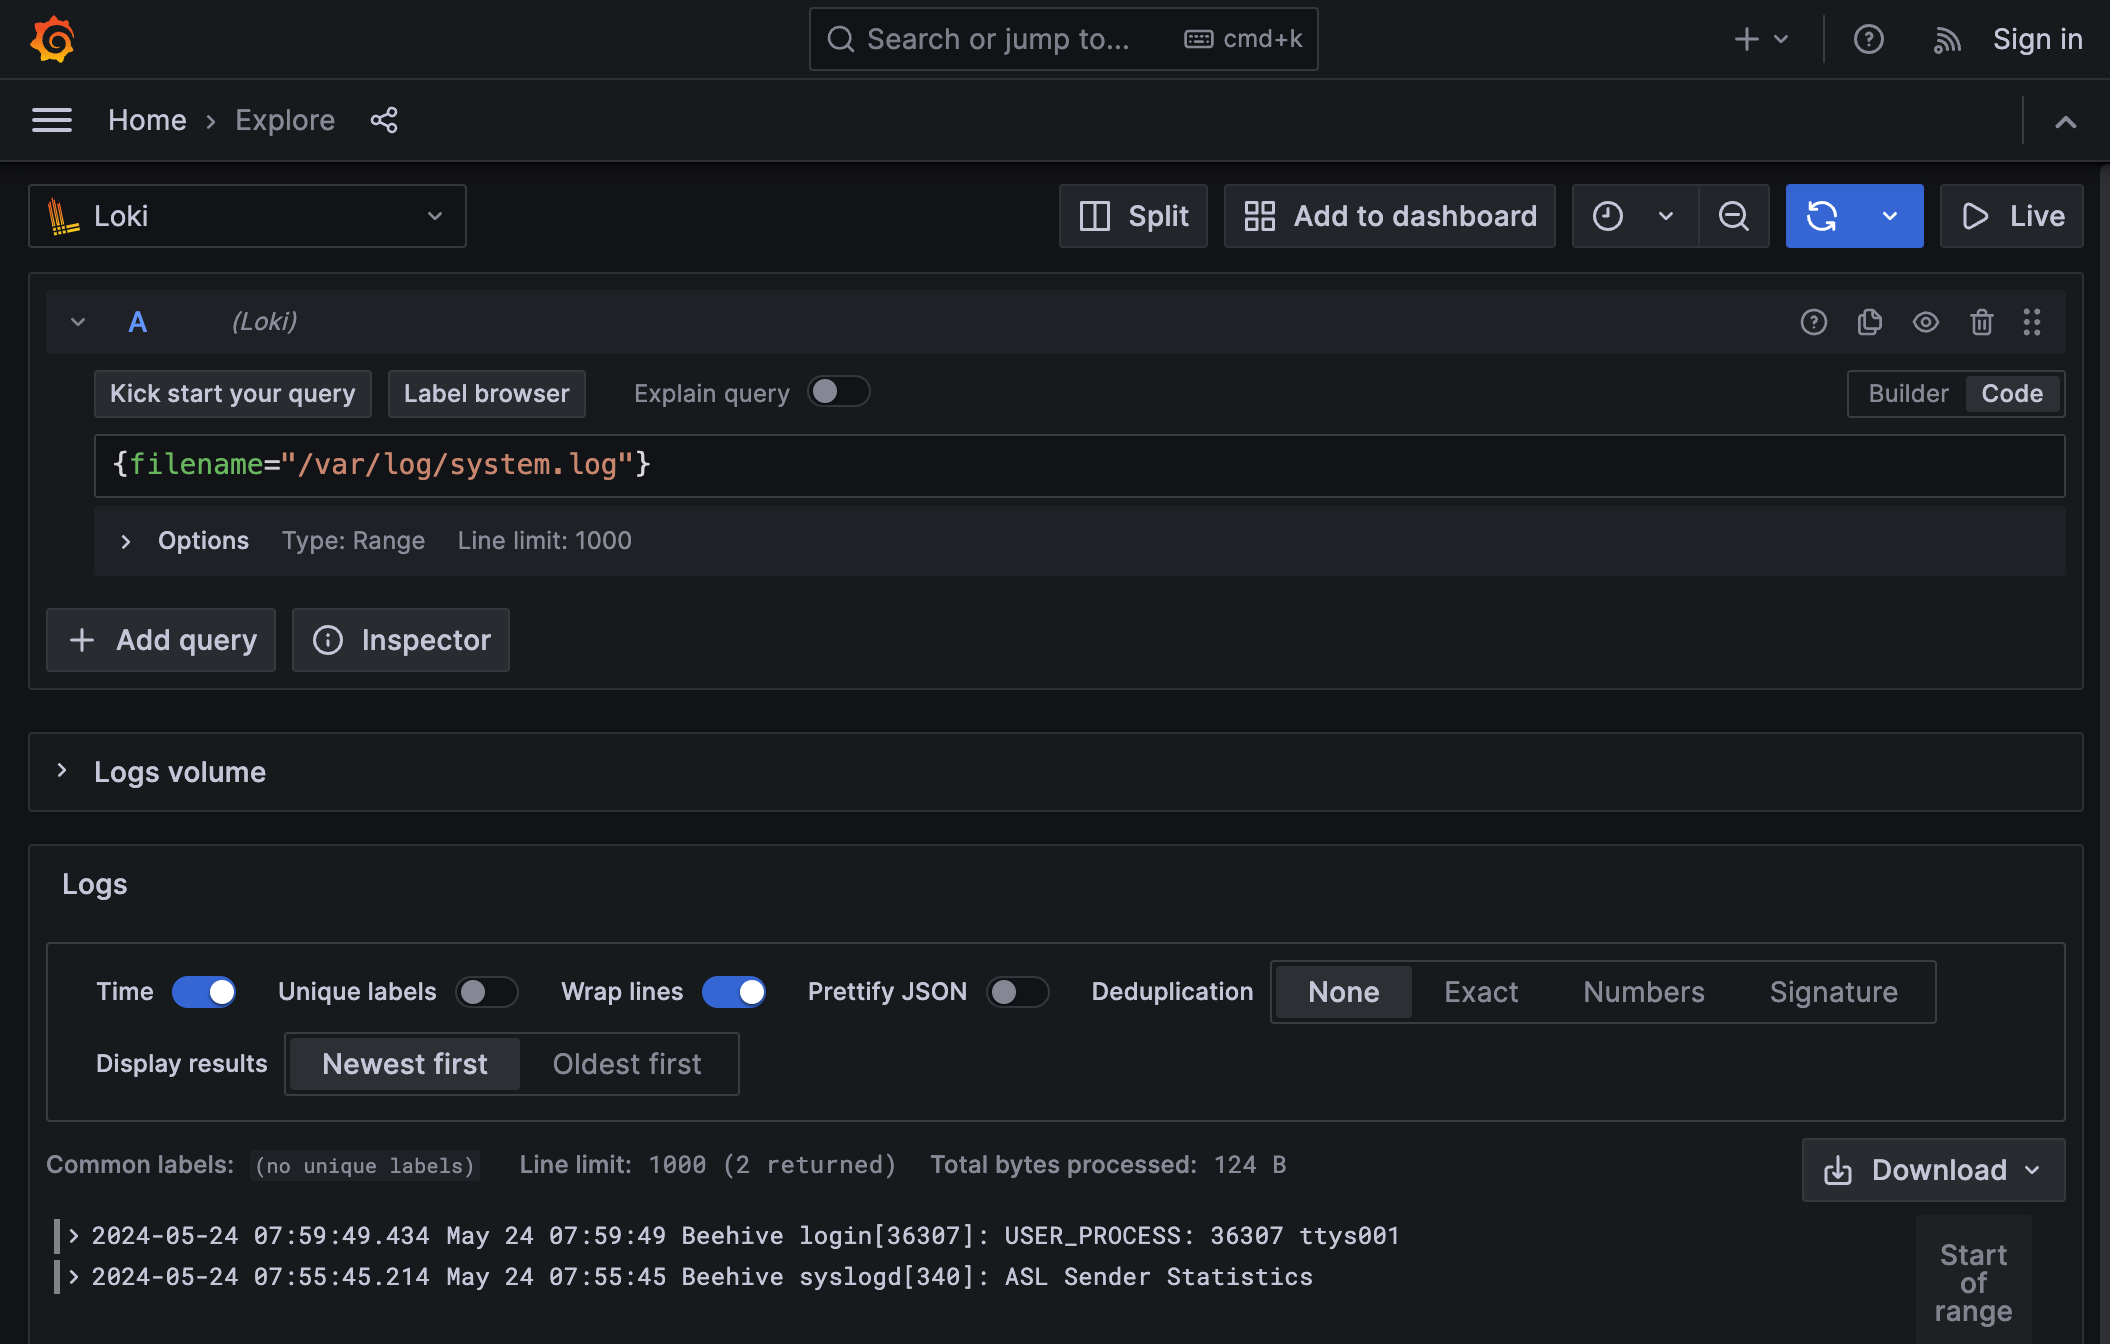
10 |
--------------------------------------------------------------------------------
/alloy/send-metrics-to-prometheus/finish.md:
--------------------------------------------------------------------------------
1 | # Summary
2 |
3 | You have configured Alloy to collect and process metrics from your local host and send them to your local Grafana stack.
4 |
--------------------------------------------------------------------------------
/alloy/send-metrics-to-prometheus/index.json:
--------------------------------------------------------------------------------
1 | {
2 | "title": "Use Grafana Alloy to send metrics to Prometheus",
3 | "description": "Learn how to send metrics to Prometheus",
4 | "details": {
5 | "intro": {
6 | "text": "intro.md",
7 | "foreground": "previous-tutorial-setup.sh"
8 | },
9 | "steps": [
10 | {
11 | "text": "step1.md"
12 | },
13 | {
14 | "text": "step2.md"
15 | },
16 | {
17 | "text": "step3.md"
18 | },
19 | {
20 | "text": "step4.md"
21 | }
22 | ],
23 | "finish": {
24 | "text": "finish.md"
25 | }
26 | },
27 | "backend": {
28 | "imageid": "ubuntu"
29 | }
30 | }
31 |
--------------------------------------------------------------------------------
/alloy/send-metrics-to-prometheus/intro.md:
--------------------------------------------------------------------------------
1 | # Use Grafana Alloy to send metrics to Prometheus
2 |
3 | In the [previous tutorial](https://grafana.com/docs/alloy/latest/tutorials/send-logs-to-loki/), you learned how to configure Alloy to collect and process logs from your local machine and send them to Loki.
4 |
5 | This tutorial shows you how to configure Alloy to collect and process metrics from your local machine, send them to Prometheus, and use Grafana to explore the results.
6 |
7 | > Since this tutorial builds on the previous one, a setup script is automatically run to ensure you have the necessary prerequisites in place. This should take no longer than 1 minute to complete. You may begin the tutorial when you see this message: `Installation script has now been completed. You may now begin the tutorial.`{{copy}}
8 |
--------------------------------------------------------------------------------
/alloy/send-metrics-to-prometheus/step2.md:
--------------------------------------------------------------------------------
1 | # Reload the configuration
2 |
3 | Copy your local `config.alloy`{{copy}} file into the default Alloy configuration file location.
4 |
5 | ```bash
6 | sudo cp config.alloy /etc/alloy/config.alloy
7 | ```{{exec}}
8 |
9 | Call the `/-/reload`{{copy}} endpoint to tell Alloy to reload the configuration file without a system service restart.
10 |
11 | ```bash
12 | curl -X POST http://localhost:12345/-/reload
13 | ```{{exec}}
14 |
15 | > This step uses the Alloy UI on `localhost`{{copy}} port `12345`{{copy}}. If you chose to run Alloy in a Docker container, make sure you use the `--server.http.listen-addr=`{{copy}} argument. If you don't use this argument, the [debugging UI](https://grafana.com/docs/alloy/latest/troubleshoot/debug/#alloy-ui) won't be available outside of the Docker container.
16 |
17 | Optional: You can do a system service restart Alloy and load the configuration file:
18 |
19 | ```bash
20 | sudo systemctl reload alloy
21 | ```{{exec}}
22 |
--------------------------------------------------------------------------------
/alloy/send-metrics-to-prometheus/step3.md:
--------------------------------------------------------------------------------
1 | # Inspect your configuration in the Alloy UI
2 |
3 | Open [http://localhost:12345]({{TRAFFIC_HOST1_12345}}) and click the **Graph** tab at the top.
4 | The graph should look similar to the following:
5 |
6 | 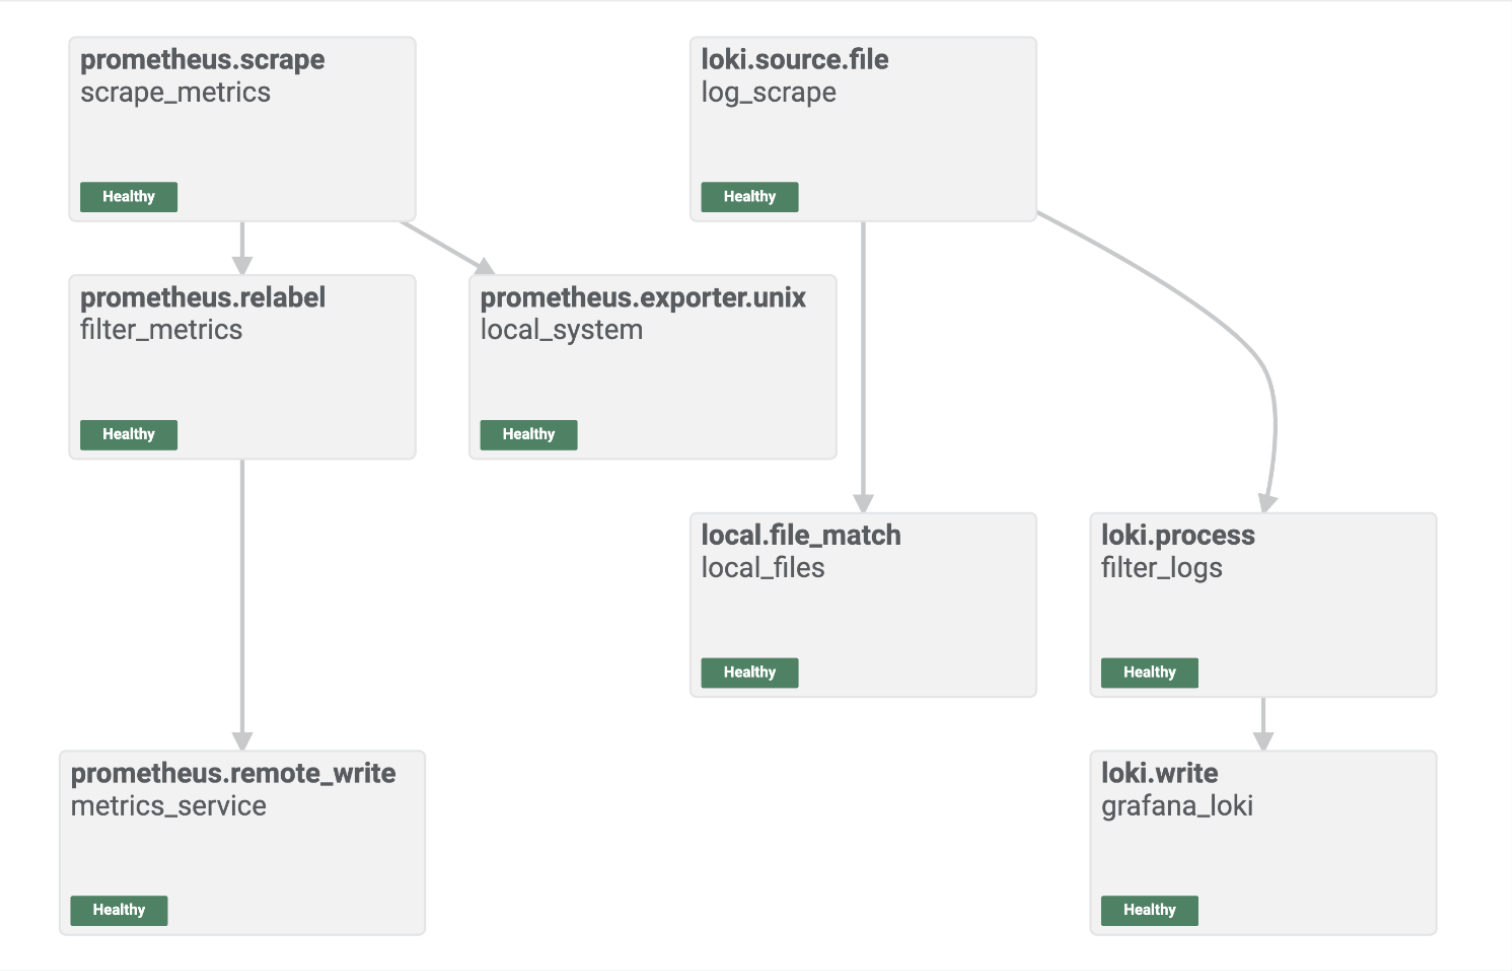
7 |
8 | The Alloy UI shows you a visual representation of the pipeline you built with your Alloy component configuration.
9 |
10 | You can see that the components are healthy, and you are ready to explore the metrics in Grafana.
11 |
--------------------------------------------------------------------------------
/alloy/send-metrics-to-prometheus/step4.md:
--------------------------------------------------------------------------------
1 | # Log into Grafana and explore metrics in Prometheus
2 |
3 | Open [http://localhost:3000/explore/metrics/]({{TRAFFIC_HOST1_3000}}/explore/metrics/) to access the **Metrics Drilldown** feature in Grafana.
4 |
5 | From here you can visually explore the metrics sent to Prometheus by Alloy.
6 |
7 | 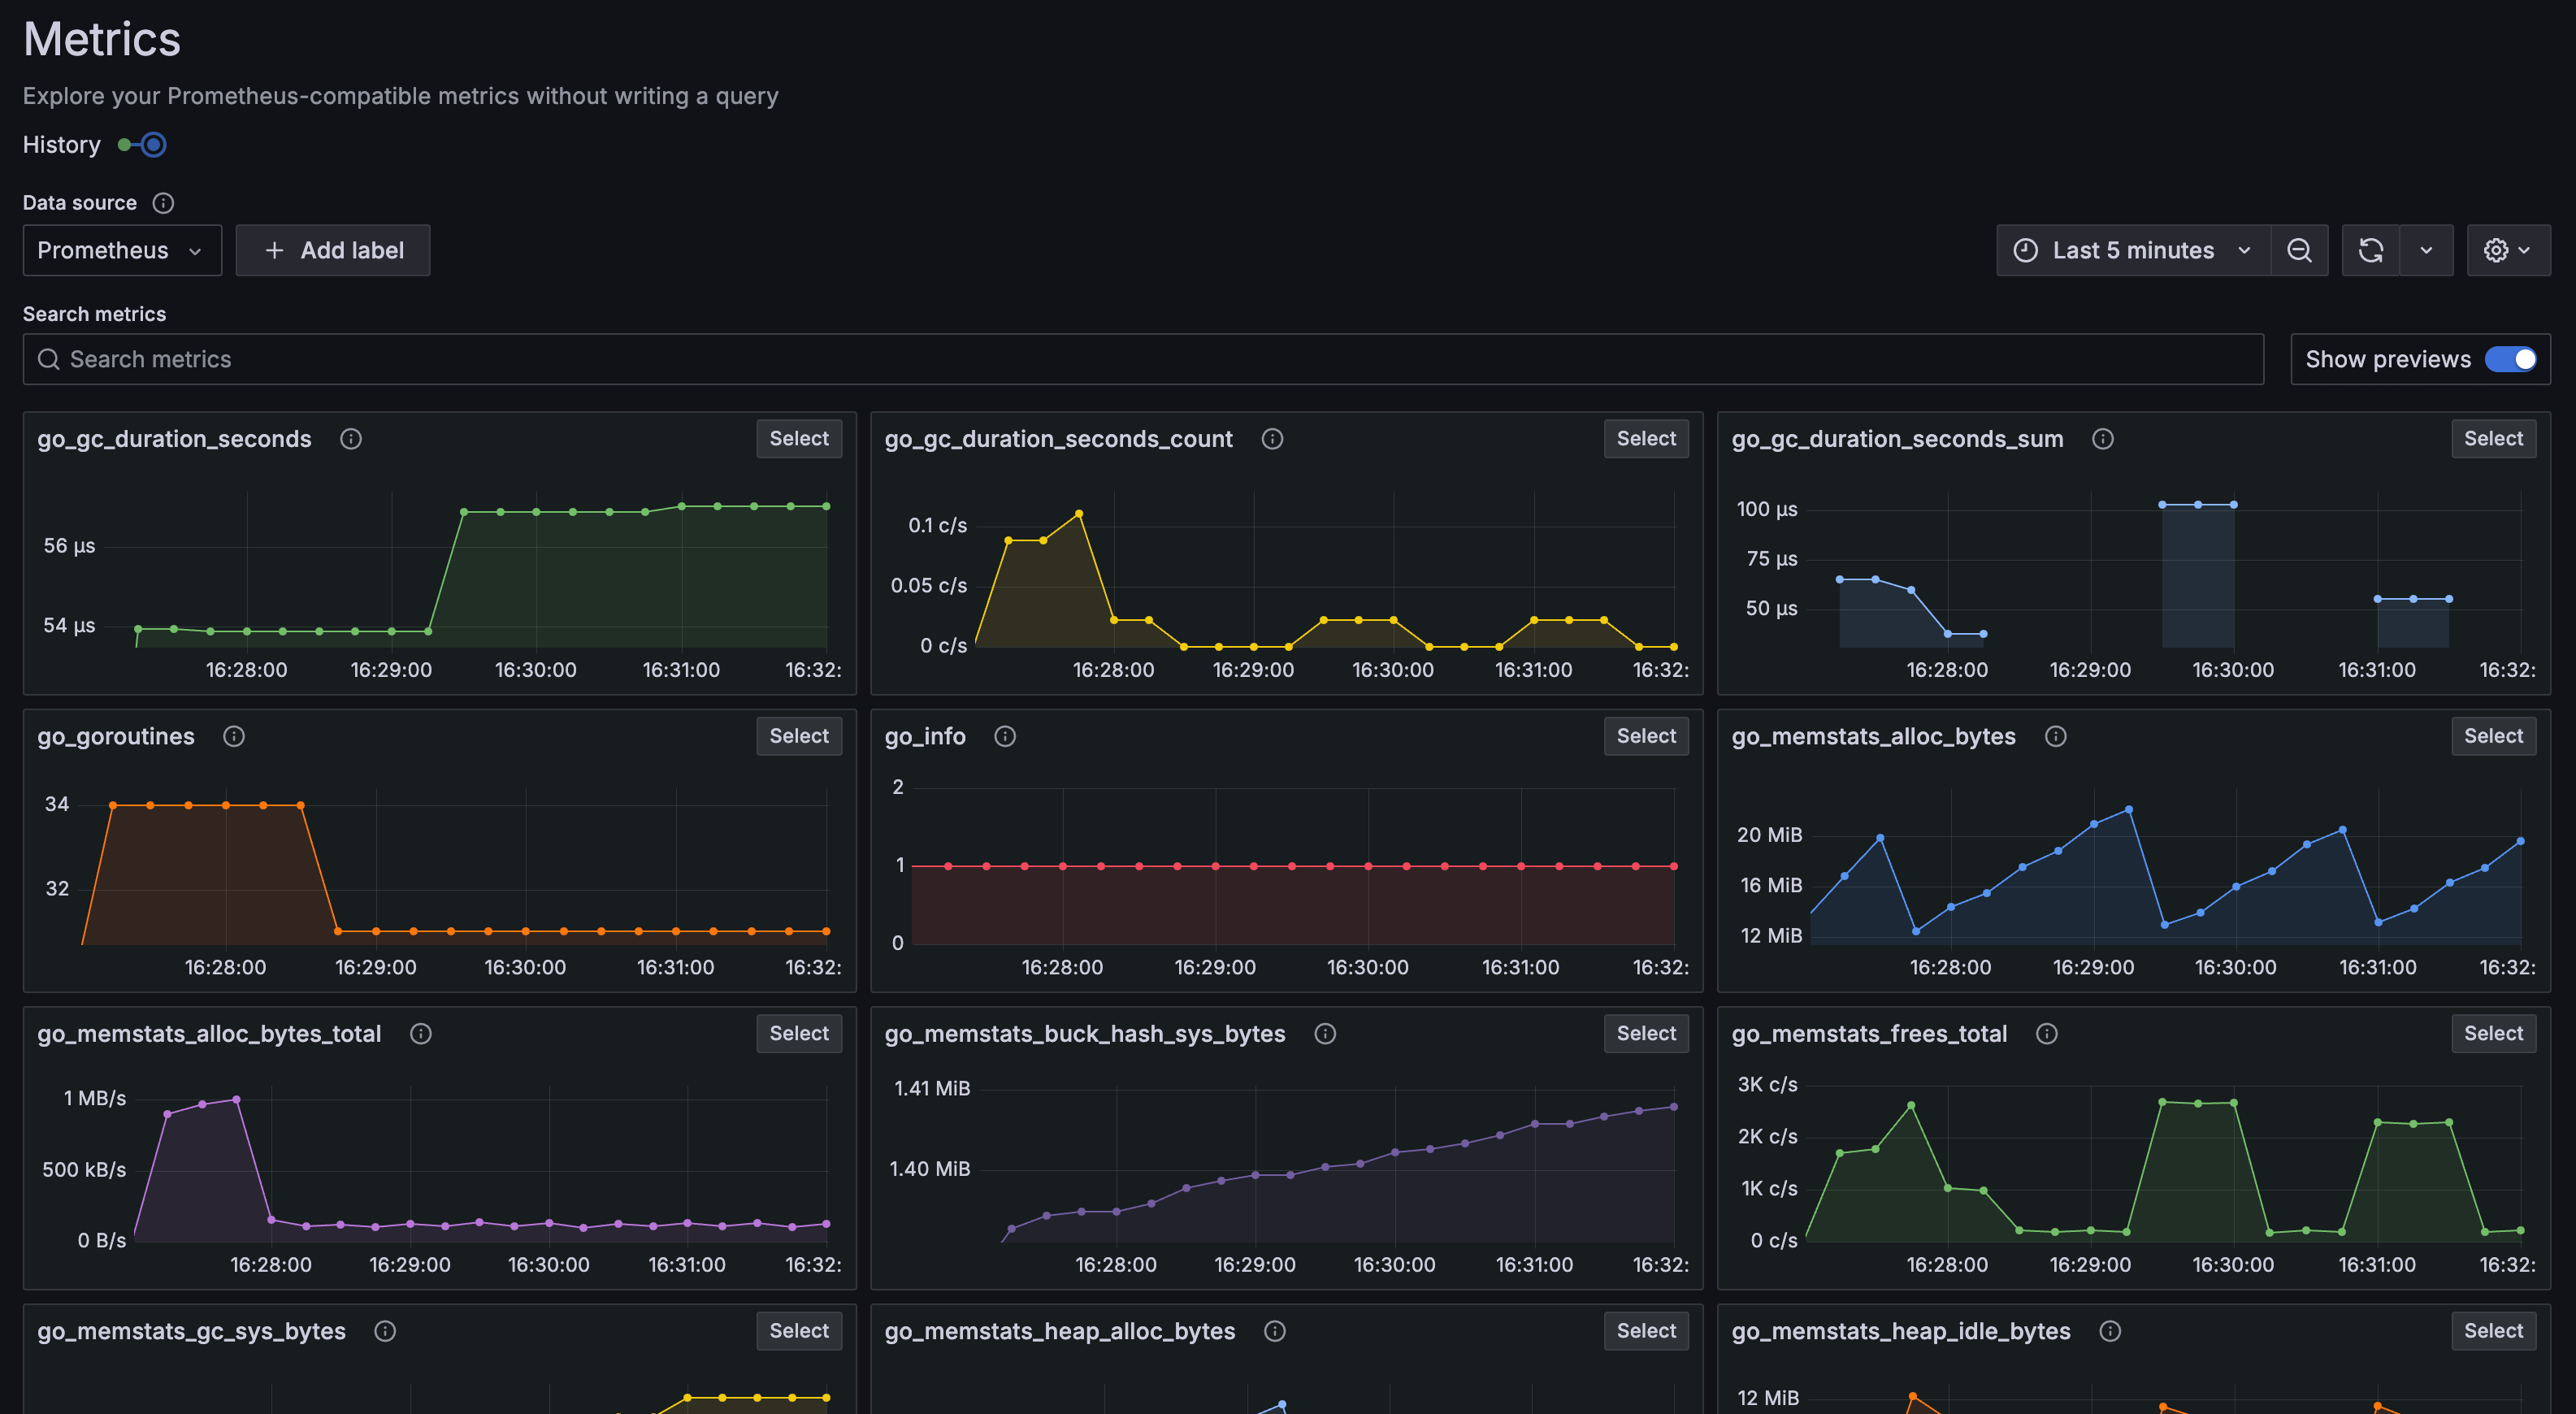
8 |
9 | You can also build PromQL queries manually to explore the data further.
10 |
11 | Open [http://localhost:3000/explore]({{TRAFFIC_HOST1_3000}}/explore) to access the **Explore** feature in Grafana.
12 |
13 | Select Prometheus as the data source and click the **Metrics Browser** button to select the metric, labels, and values for your labels.
14 |
15 | Here you can see that metrics are flowing through to Prometheus as expected, and the end-to-end configuration was successful.
16 |
--------------------------------------------------------------------------------
/alloy/structure.json:
--------------------------------------------------------------------------------
1 | {
2 | "items": [
3 | { "path": "send-logs-to-loki", "title": "Use Grafana Alloy to send logs to Loki"},
4 | { "path": "send-metrics-to-prometheus", "title": "Use Grafana Alloy to send metrics to Prometheus"}
5 | ]
6 | }
--------------------------------------------------------------------------------
/assets/ILE.png:
--------------------------------------------------------------------------------
https://raw.githubusercontent.com/grafana/killercoda/19bfb5e03680c28ae023eec22fe4531ea7467d22/assets/ILE.png
--------------------------------------------------------------------------------
/assets/full-stack-ile.png:
--------------------------------------------------------------------------------
https://raw.githubusercontent.com/grafana/killercoda/19bfb5e03680c28ae023eec22fe4531ea7467d22/assets/full-stack-ile.png
--------------------------------------------------------------------------------
/assets/logo.png:
--------------------------------------------------------------------------------
https://raw.githubusercontent.com/grafana/killercoda/19bfb5e03680c28ae023eec22fe4531ea7467d22/assets/logo.png
--------------------------------------------------------------------------------
/assets/loki-ile.png:
--------------------------------------------------------------------------------
https://raw.githubusercontent.com/grafana/killercoda/19bfb5e03680c28ae023eec22fe4531ea7467d22/assets/loki-ile.png
--------------------------------------------------------------------------------
/full-stack/assets/grafana_logo.png:
--------------------------------------------------------------------------------
https://raw.githubusercontent.com/grafana/killercoda/19bfb5e03680c28ae023eec22fe4531ea7467d22/full-stack/assets/grafana_logo.png
--------------------------------------------------------------------------------
/full-stack/assets/grot-4.png:
--------------------------------------------------------------------------------
https://raw.githubusercontent.com/grafana/killercoda/19bfb5e03680c28ae023eec22fe4531ea7467d22/full-stack/assets/grot-4.png
--------------------------------------------------------------------------------
/full-stack/assets/mltp.png:
--------------------------------------------------------------------------------
https://raw.githubusercontent.com/grafana/killercoda/19bfb5e03680c28ae023eec22fe4531ea7467d22/full-stack/assets/mltp.png
--------------------------------------------------------------------------------
/full-stack/intro-to-mltp/index.json:
--------------------------------------------------------------------------------
1 | {
2 | "title": "Introduction to Metrics, Logs, Traces and Profiles in Grafana",
3 | "description": "This demo provides an introduction to the concepts of Metrics, Logs, Traces and Profiles in Grafana.",
4 | "details": {
5 | "intro": {
6 | "text": "intro.md",
7 | "foreground": "setup.sh"
8 | },
9 | "steps": [
10 | {
11 | "text": "step1.md"
12 | }
13 | ],
14 | "finish": {
15 | "text": "finished.md"
16 | }
17 | }
18 | ,
19 | "backend": {
20 | "imageid": "ubuntu-4GB"
21 | }
22 | }
--------------------------------------------------------------------------------
/full-stack/intro-to-mltp/setup.sh:
--------------------------------------------------------------------------------
1 | #!/usr/bin/env bash
2 |
3 | echo "RUNNING SETUP SCRIPT"
4 |
5 | # Clone the tutorial environment repository if it doesn't already exist
6 | if [ ! -d "intro-to-mltp" ]; then
7 | git clone https://github.com/grafana/intro-to-mltp.git || { echo "Failed to clone repository"; exit 1; }
8 | fi
9 |
10 | # Enter the directory and switch to the required branch
11 | cd intro-to-mltp && git checkout killercoda || { echo "Moving directory"; exit 1; }
12 |
13 | echo "Building training instance...."
14 | docker-compose -f docker-compose-no-beyla.yml up -d
15 | echo "Catch any failed containers...."
16 | docker-compose -f docker-compose-no-beyla.yml up -d
17 |
18 |
19 | # Update and install required packages
20 | echo "Updating and installing required packages..."
21 | sudo apt-get update && sudo apt-get install -y figlet; clear; echo -e "\e[32m$(figlet -f standard 'Intro to')\e[0m"; echo -e "\e[33m$(figlet -f standard 'MLTP')\e[0m"
--------------------------------------------------------------------------------
/full-stack/intro-to-mltp/step1.md:
--------------------------------------------------------------------------------
1 |
2 | # Your Tutorial Environment
3 |
4 | Your tutorial environment is ready to go. You can find the tutorial environment navigation URLs below.
5 |
6 | **Note:** *You must use the URLs provided within this section as they automatically connect to the localhost of the virtual environment.*
7 |
8 | ## Tutorial Environment Navigation URLs
9 |
10 | Grafana: **[http://localhost:3000]({{TRAFFIC_HOST1_3000}})**
11 |
12 | This is the URL for the Grafana UI. This is where the majority of the tutorial will take place.
13 |
14 |
--------------------------------------------------------------------------------
/full-stack/structure.json:
--------------------------------------------------------------------------------
1 | {
2 | "items": [
3 | { "path": "tutorial-enviroment", "title": "Tutorial Enviroment"},
4 | { "path": "tutorial-enviroment-completed", "title": "Tutorial Enviroment (Completed)"},
5 | { "path": "intro-to-mltp", "title": "Introduction To MLTP"}
6 | ]
7 | }
--------------------------------------------------------------------------------
/full-stack/tutorial-enviroment-completed/finished.md:
--------------------------------------------------------------------------------
1 |
2 |  3 |
4 | # Tutorial: Grafana Fundamentals Complete
5 | This is the completed Grafana Fundamentals training environment. In this training environment, you learned the fundamentals of Grafana, a powerful open-source platform for visualizing and analyzing data. Whether you are a developer, system administrator, or data analyst, this course provided you with the knowledge and skills to effectively use Grafana for monitoring and visualization.
6 |
7 | ## What's Next?
8 | Now that you have completed the Grafana Basics course, you can explore more advanced topics such as:
9 | - [Grafana Plugins](https://grafana.com/grafana/plugins)
10 | - [Grafana Dashboards](https://grafana.com/docs/grafana/latest/dashboards)
11 | - [Grafana API](https://grafana.com/docs/grafana/latest/http_api)
12 |
13 |
3 |
4 | # Tutorial: Grafana Fundamentals Complete
5 | This is the completed Grafana Fundamentals training environment. In this training environment, you learned the fundamentals of Grafana, a powerful open-source platform for visualizing and analyzing data. Whether you are a developer, system administrator, or data analyst, this course provided you with the knowledge and skills to effectively use Grafana for monitoring and visualization.
6 |
7 | ## What's Next?
8 | Now that you have completed the Grafana Basics course, you can explore more advanced topics such as:
9 | - [Grafana Plugins](https://grafana.com/grafana/plugins)
10 | - [Grafana Dashboards](https://grafana.com/docs/grafana/latest/dashboards)
11 | - [Grafana API](https://grafana.com/docs/grafana/latest/http_api)
12 |
13 |  14 |
15 | ## Reporting Issues
16 | If you encounter any issues with the environment, please report them to the [GitHub repository](https://github.com/grafana/killercoda)
--------------------------------------------------------------------------------
/full-stack/tutorial-enviroment-completed/index.json:
--------------------------------------------------------------------------------
1 | {
2 | "title": "Grafana Fundamentals (Completed)",
3 | "description": "In this tutorial, you’ll learn how to use Grafana to set up a monitoring solution for your application. This training enviroment is completed.",
4 | "details": {
5 | "intro": {
6 | "text": "intro.md",
7 | "foreground": "setup.sh"
8 | },
9 | "steps": [
10 | {
11 | "text": "step1.md"
12 | }
13 | ],
14 | "finish": {
15 | "text": "finished.md"
16 | }
17 | }
18 | ,
19 | "backend": {
20 | "imageid": "ubuntu"
21 | }
22 | }
--------------------------------------------------------------------------------
/full-stack/tutorial-enviroment-completed/intro.md:
--------------------------------------------------------------------------------
1 |
2 |
3 |
4 | # Grafana Fundamentals (Completed)
5 |
6 | Welcome!
7 |
8 | In this training environment, you will learn the fundamentals of Grafana, a powerful open-source platform for visualizing and analyzing data. Whether you are a developer, system administrator, or data analyst, this course will provide you with the knowledge and skills to effectively use Grafana for monitoring and visualization.
9 |
10 | You can find the course content here: [Grafana Fundamentals](https://grafana.com/tutorials/grafana-fundamentals/).
11 |
12 | **Note:** *This is a completed environment, where all the steps have been completed for you. If you would like to complete the steps yourself, please go to the [Grafana Fundamentals](https://killercoda.com/grafana-labs/course/full-stack/tutorial-environment) course.*
13 |
14 | ## Housekeeping
15 |
16 | This environment runs an install script on startup automatically. Your training environment is ready to go once the script has completed and you see the following message:
17 |
18 | ```plaintext
19 | GRAFANA FUNDAMENTALS
20 | ```
21 |
22 | Continue to the next step to find the tutorial environment navigation URLs.
23 |
24 | ## Reporting Issues
25 | If you encounter any issues with the environment, please report them to the [GitHub repository](https://github.com/grafana/killercoda)
--------------------------------------------------------------------------------
/full-stack/tutorial-enviroment-completed/setup.sh:
--------------------------------------------------------------------------------
1 | #!/usr/bin/env bash
2 |
3 | echo "RUNNING SETUP SCRIPT"
4 |
5 | # Clone the tutorial environment repository if it doesn't already exist
6 | if [ ! -d "tutorial-environment" ]; then
7 | git clone https://github.com/grafana/tutorial-environment.git || { echo "Failed to clone repository"; exit 1; }
8 | fi
9 |
10 | # Enter the directory and switch to the required branch
11 | cd tutorial-environment && git checkout killercoda || { echo "Failed to checkout branch"; exit 1; }
12 |
13 | echo "Building training instance...."
14 | docker-compose up -d || { echo "Failed to start docker containers"; exit 1; }
15 |
16 | # Update and install required packages
17 | echo "Updating and installing required packages..."
18 | sudo apt-get update && sudo apt-get install -y figlet; clear; echo -e "\e[32m$(figlet -f standard 'Grafana')\e[0m"; echo -e "\e[33m$(figlet -f standard 'Fundamentals')\e[0m"
--------------------------------------------------------------------------------
/full-stack/tutorial-enviroment-completed/step1.md:
--------------------------------------------------------------------------------
1 |
2 | # Your Tutorial Environment
3 |
4 | Your tutorial environment is ready to go. You can find the tutorial environment navigation URLs below.
5 |
6 | **Note:** *You must use the URLs provided within this section as they automatically connect to the localhost of the virtual environment.*
7 |
8 | ## Tutorial Environment Navigation URLs
9 |
10 | Grafana: **[http://localhost:3000]({{TRAFFIC_HOST1_3000}})**
11 |
12 | This is the URL for the Grafana UI. From here, you can access the dashboards and data visualizations created in the tutorial.
13 |
14 | Grafana News: **[http://localhost:8081]({{TRAFFIC_HOST1_8081}})**
15 |
16 | This URL will direct you to the sample application for this tutorial. This simulator lets you post links and vote for the ones you like. This is important for generating traffic and errors to populate our Grafana dashboards.
17 |
--------------------------------------------------------------------------------
/full-stack/tutorial-enviroment/finished.md:
--------------------------------------------------------------------------------
1 |
2 |
3 |
4 | # Tutorial: Grafana Fundamentals Complete
5 | This is the completed Grafana Fundamentals training environment. In this training environment, you learned the fundamentals of Grafana, a powerful open-source platform for visualizing and analyzing data. Whether you are a developer, system administrator, or data analyst, this course provided you with the knowledge and skills to effectively use Grafana for monitoring and visualization.
6 |
7 | ## What's Next?
8 | Now that you have completed the Grafana Basics course, you can explore more advanced topics such as:
9 | - [Grafana Plugins](https://grafana.com/grafana/plugins)
10 | - [Grafana Dashboards](https://grafana.com/docs/grafana/latest/dashboards)
11 | - [Grafana API](https://grafana.com/docs/grafana/latest/http_api)
12 |
13 |
14 |
15 | ## Reporting Issues
16 | If you encounter any issues with the environment, please report them to the [GitHub repository](https://github.com/grafana/killercoda)
--------------------------------------------------------------------------------
/full-stack/tutorial-enviroment/index.json:
--------------------------------------------------------------------------------
1 | {
2 | "title": "Grafana Fundamentals",
3 | "description": "In this tutorial, you’ll learn how to use Grafana to set up a monitoring solution for your application.",
4 | "details": {
5 | "intro": {
6 | "text": "intro.md",
7 | "foreground": "setup.sh"
8 | },
9 | "steps": [
10 | {
11 | "text": "step1.md"
12 | }
13 | ],
14 | "finish": {
15 | "text": "finished.md"
16 | }
17 | }
18 | ,
19 | "backend": {
20 | "imageid": "ubuntu"
21 | }
22 | }
--------------------------------------------------------------------------------
/full-stack/tutorial-enviroment/intro.md:
--------------------------------------------------------------------------------
1 |
2 |
3 |
4 | # Grafana Fundamentals
5 |
6 | Welcome!
7 |
8 | In this training environment, you will learn the fundamentals of Grafana, a powerful open-source platform for visualizing and analyzing data. Whether you are a developer, system administrator, or data analyst, this course will provide you with the knowledge and skills to effectively use Grafana for monitoring and visualization.
9 |
10 | You can find the course content here: [Grafana Fundamentals](https://grafana.com/tutorials/grafana-fundamentals/).
11 |
12 | **Note:** *In this environment, we provide you with only the initial setup of the tutorial environment. You can then follow the steps in the Grafana Fundamentals to complete the tutorial. If you would like a completed version of the tutorial, please visit the [Grafana Fundamentals (Completed)](https://katacoda.com/full-stack/courses/tutorial-environment-completed) course.*
13 |
14 | ## Housekeeping
15 |
16 | This environment runs an install script on startup automatically. Your training environment is ready to go once the script has completed and you see the following message:
17 |
18 | ```plaintext
19 | GRAFANA FUNDAMENTALS
20 | ```
21 |
22 | Continue to the next step to find the tutorial environment navigation URLs.
23 |
24 | ## Reporting Issues
25 | If you encounter any issues with the environment, please report them to the [GitHub repository](https://github.com/grafana/killercoda)
--------------------------------------------------------------------------------
/full-stack/tutorial-enviroment/setup.sh:
--------------------------------------------------------------------------------
1 | #!/usr/bin/env bash
2 |
3 | echo "RUNNING SETUP SCRIPT"
4 |
5 | # Clone the tutorial environment repository if it doesn't already exist
6 | if [ ! -d "tutorial-environment" ]; then
7 | git clone https://github.com/grafana/tutorial-environment.git || { echo "Failed to clone repository"; exit 1; }
8 | fi
9 |
10 | # Enter the directory and switch to the required branch
11 | cd tutorial-environment || { echo "Failed to checkout branch"; exit 1; }
12 |
13 | echo "Building training instance...."
14 | docker-compose up -d || { echo "Failed to start docker containers"; exit 1; }
15 |
16 | # Update and install required packages
17 | echo "Updating and installing required packages..."
18 | sudo apt-get update && sudo apt-get install -y figlet; clear; echo -e "\e[32m$(figlet -f standard 'Grafana')\e[0m"; echo -e "\e[33m$(figlet -f standard 'Fundamentals')\e[0m"
--------------------------------------------------------------------------------
/full-stack/tutorial-enviroment/step1.md:
--------------------------------------------------------------------------------
1 |
2 | # Your Tutorial Environment
3 |
4 | Your tutorial environment is ready to go. You can find the tutorial environment navigation URLs below.
5 |
6 | **Note:** *You must use the URLs provided within this section as they automatically connect to the localhost of the virtual environment.*
7 |
8 | ## Tutorial Environment Navigation URLs
9 |
10 | Grafana: **[http://localhost:3000]({{TRAFFIC_HOST1_3000}})**
11 |
12 | This is the URL for the Grafana UI. This is where the majority of the tutorial will take place.
13 |
14 | Grafana News: **[http://localhost:8081]({{TRAFFIC_HOST1_8081}})**
15 |
16 | This URL will direct you to the sample application for this tutorial. This simulator lets you post links and vote for the ones you like. This is important for generating traffic and errors to populate our Grafana dashboards.
17 |
--------------------------------------------------------------------------------
/grafana/alerting-get-started-pt2/finish.md:
--------------------------------------------------------------------------------
1 | # Summary
2 |
3 | In this tutorial, you have learned how Grafana Alerting can route individual alert instances using the labels generated by the data-source query and match these labels with notification policies, which in turn routes alert notifications to specific contact points.
4 |
5 | If you run into any problems, you are welcome to post questions in our [Grafana Community forum](https://community.grafana.com/).
6 |
7 | # Learn more in [Grafana Alerting: Group alert notifications](http://www.grafana.com/tutorials/alerting-get-started-pt3/)
8 |
9 | In [Get started with Grafana Alerting: Group alert notifications](http://www.grafana.com/tutorials/alerting-get-started-pt3/) you learn how to group alert notifications effectively.
10 |
--------------------------------------------------------------------------------
/grafana/alerting-get-started-pt2/index.json:
--------------------------------------------------------------------------------
1 | {
2 | "title": "Get started with Grafana Alerting - Multi-dimensional alerts and how to route them",
3 | "description": "Learn to use alert instances and route notifications by labels to contacts.",
4 | "details": {
5 | "intro": {
6 | "text": "intro.md"
7 | },
8 | "steps": [
9 | {
10 | "text": "step1.md"
11 | },
12 | {
13 | "text": "step2.md"
14 | },
15 | {
16 | "text": "step3.md"
17 | },
18 | {
19 | "text": "step4.md"
20 | },
21 | {
22 | "text": "step5.md"
23 | },
24 | {
25 | "text": "step6.md"
26 | },
27 | {
28 | "text": "step7.md"
29 | },
30 | {
31 | "text": "step8.md"
32 | }
33 | ],
34 | "finish": {
35 | "text": "finish.md"
36 | }
37 | },
38 | "backend": {
39 | "imageid": "ubuntu"
40 | }
41 | }
42 |
--------------------------------------------------------------------------------
/grafana/alerting-get-started-pt2/intro.md:
--------------------------------------------------------------------------------
1 | This tutorial is a continuation of the [Grafana Alerting - Create and receive your first alert](http://www.grafana.com/tutorials/alerting-get-started/) tutorial.
2 |
3 | In this guide, we dig into more complex yet equally fundamental elements of Grafana Alerting: **alert instances** and **notification policies**.
4 |
5 | After introducing each component, you will learn how to:
6 |
7 | - Configure an alert rule that returns more than one alert instance
8 | - Create notification policies that route firing alert instances to different contact points
9 | - Use labels to match alert instances and notification policies
10 |
11 | Learning about alert instances and notification policies is useful if you have more than one contact point in your organization, or if your alert rule returns a number of metrics that you want to handle separately by routing each alert instance to a specific contact point. The tutorial will introduce each concept, followed by how to apply both concepts in a real-world scenario.
12 |
--------------------------------------------------------------------------------
/grafana/alerting-get-started-pt2/step1.md:
--------------------------------------------------------------------------------
1 | To demonstrate the observation of data using the Grafana stack, download and run the following files.
2 |
3 | 1. Clone the [tutorial environment repository](https://www.github.com/grafana/tutorial-environment).
4 |
5 | ```
6 | git clone https://github.com/grafana/tutorial-environment.git
7 | ```{{exec}}
8 | 1. Change to the directory where you cloned the repository:
9 |
10 | ```
11 | cd tutorial-environment
12 | ```{{exec}}
13 | 1. Run the Grafana stack:
14 |
15 | ```bash
16 | docker-compose up -d
17 | ```{{exec}}
18 |
19 | The first time you run `docker compose up -d`{{copy}}, Docker downloads all the necessary resources for the tutorial. This might take a few minutes, depending on your internet connection.
20 |
21 | NOTE:
22 |
23 | If you already have Grafana, Loki, or Prometheus running on your system, you might see errors, because the Docker image is trying to use ports that your local installations are already using. If this is the case, stop the services, then run the command again.
24 |
--------------------------------------------------------------------------------
/grafana/alerting-get-started-pt2/step2.md:
--------------------------------------------------------------------------------
1 | # Alert instances
2 |
3 | An [alert instance](https://grafana.com/docs/grafana/latest/alerting/fundamentals/#alert-instances) is an event that matches a metric returned by an alert rule query.
4 |
5 | Let's consider a scenario where you're monitoring website traffic using Grafana. You've set up an alert rule to trigger an alert instance if the number of page views exceeds a certain threshold (more than `1000`{{copy}} page views) within a specific time period, say, over the past `5`{{copy}} minutes.
6 |
7 | If the query returns more than one time-series, each time-series represents a different metric or aspect being monitored. In this case, the alert rule is applied individually to each time-series.
8 |
9 | 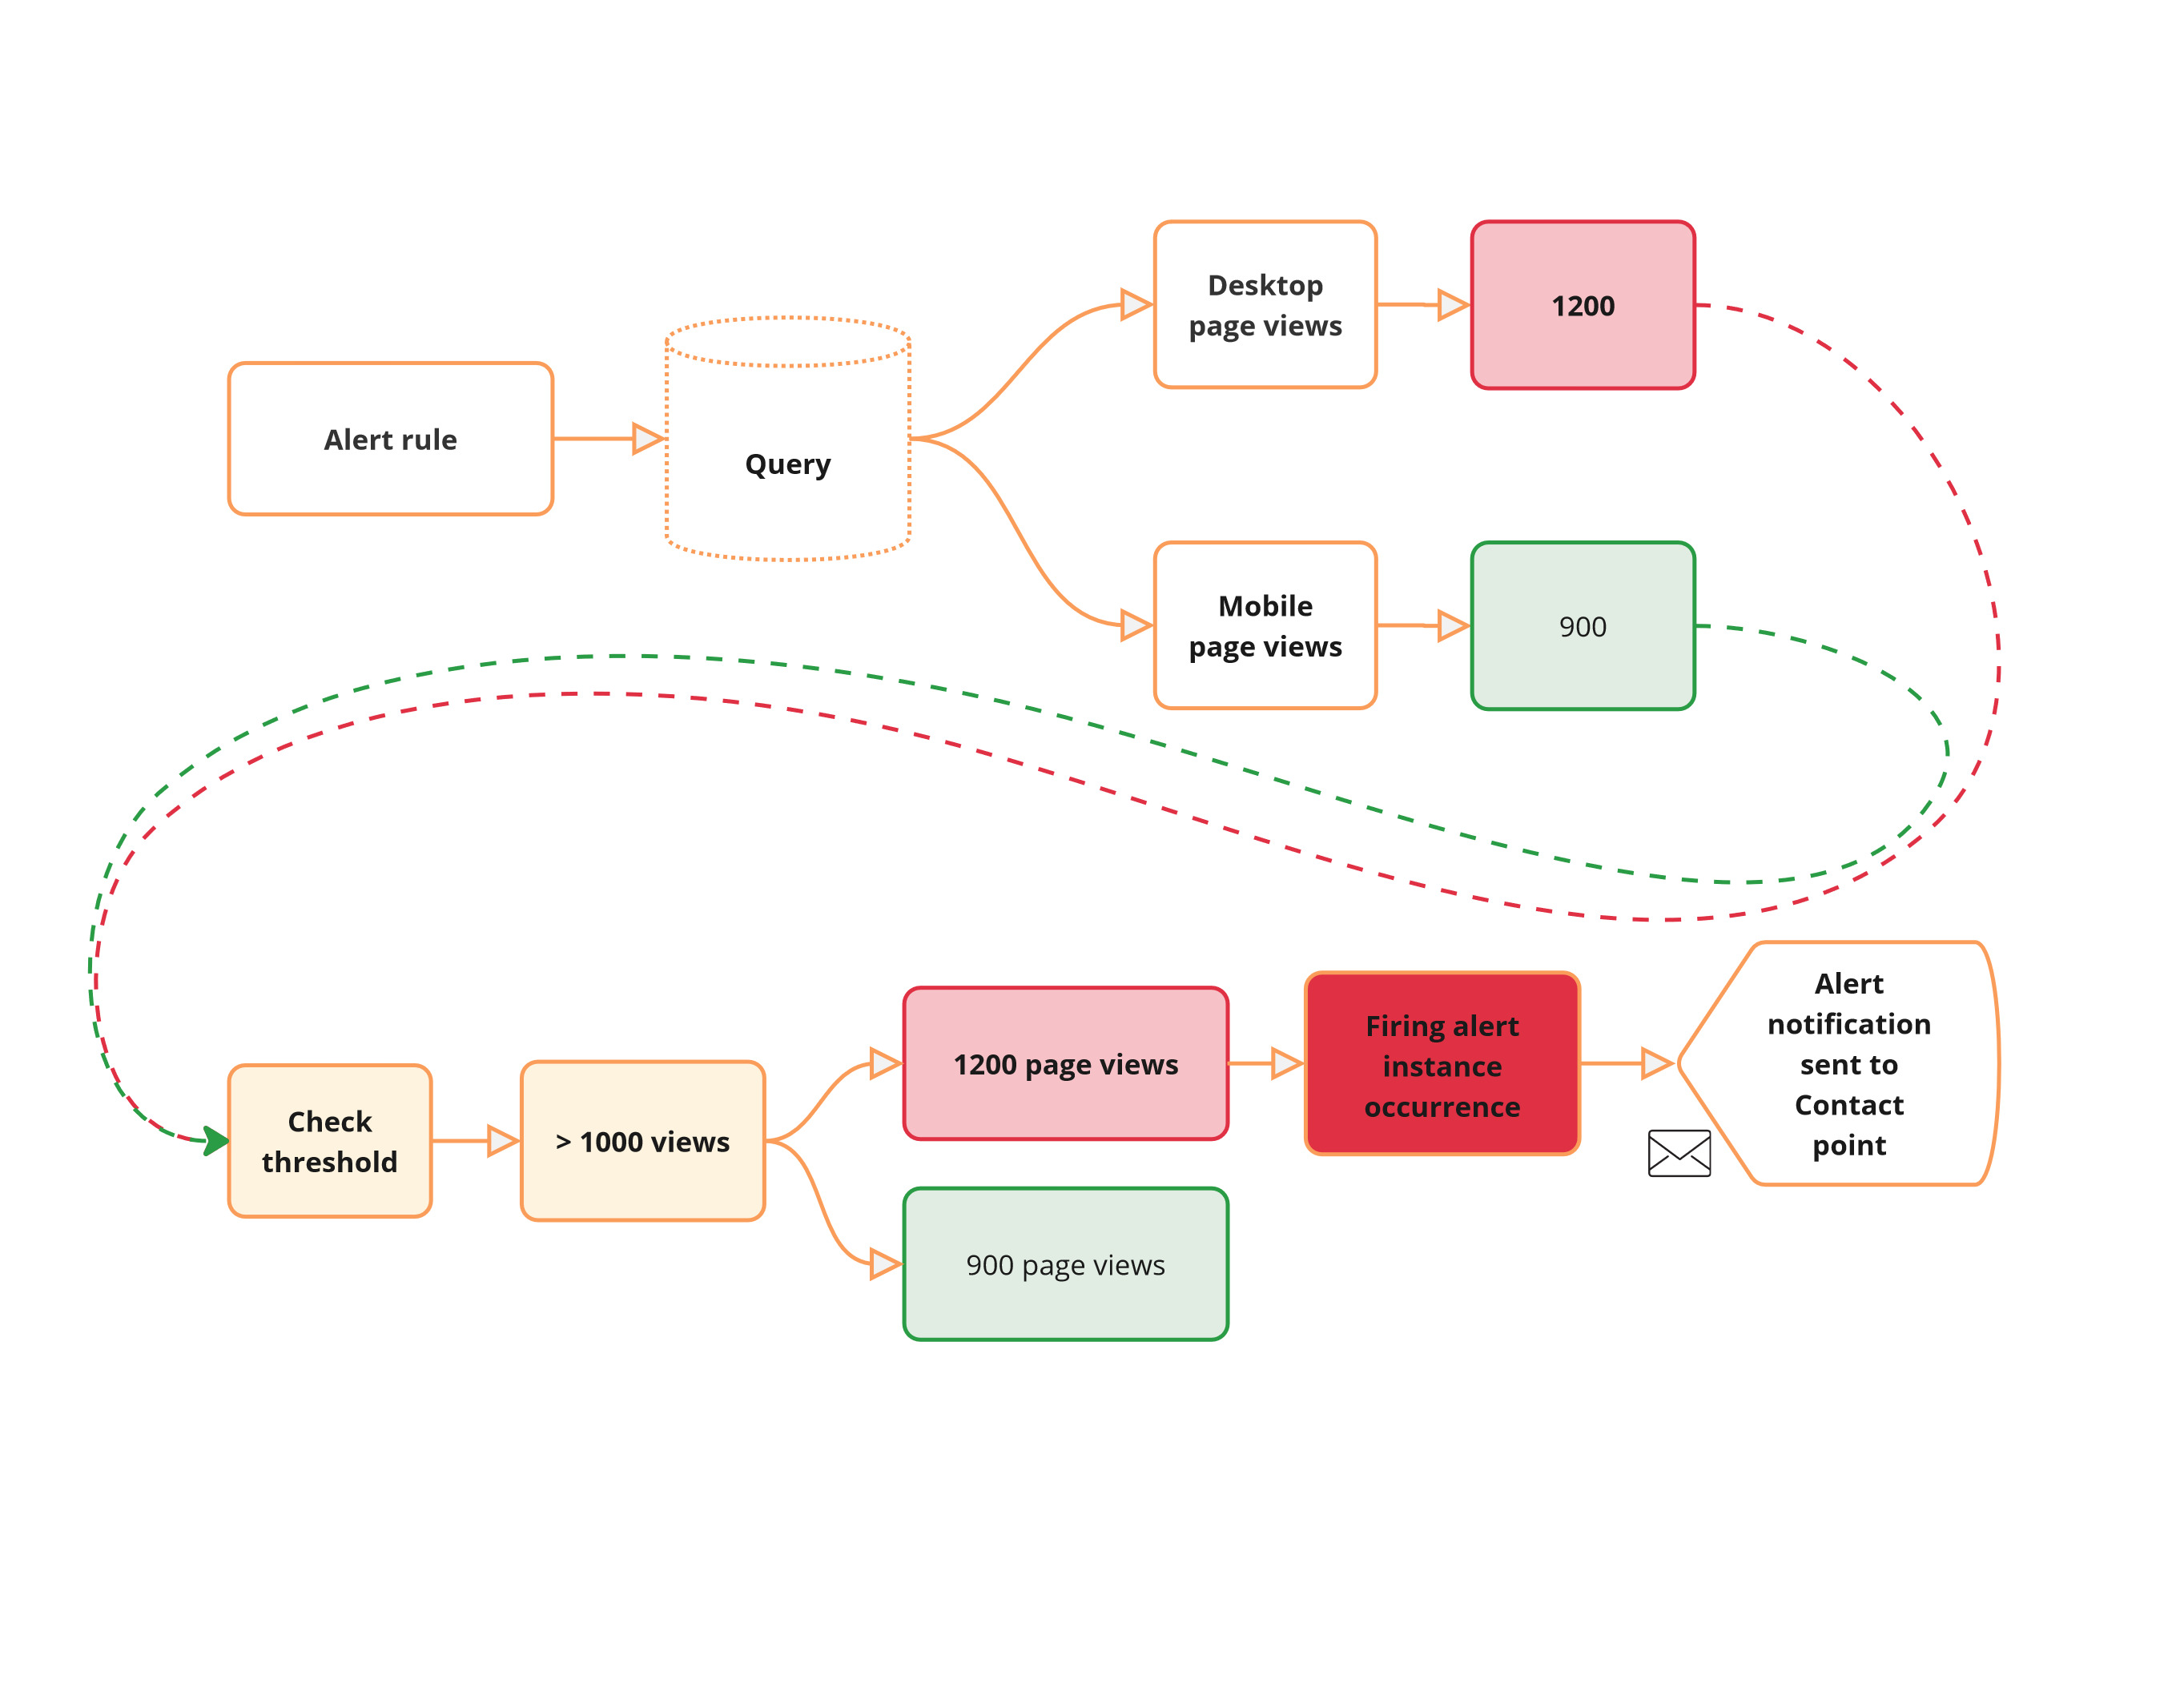
10 |
11 | In this scenario, each time-series is evaluated independently against the alert rule. It results in the creation of an alert instance for each time-series. The time-series corresponding to the desktop page views meets the threshold and, therefore, results in an alert instance in **Firing** state for which an alert notification is sent. The mobile alert instance state remains **Normal**.
12 |
--------------------------------------------------------------------------------
/grafana/alerting-get-started-pt2/step3.md:
--------------------------------------------------------------------------------
1 | # Notification policies
2 |
3 | [Notification policies](https://grafana.com/docs/grafana/latest/alerting/fundamentals/notifications/notification-policies/) route alerts to different communication channels, reducing alert noise and providing control over when and how alerts are sent. For example, you might use notification policies to ensure that critical alerts about server downtime are sent immediately to the on-call engineer. Another use case could be routing performance alerts to the development team for review and action.
4 |
5 | Key Characteristics:
6 |
7 | - Route alert notifications by matching alerts and policies with labels
8 | - Manage when to send notifications
9 |
10 | 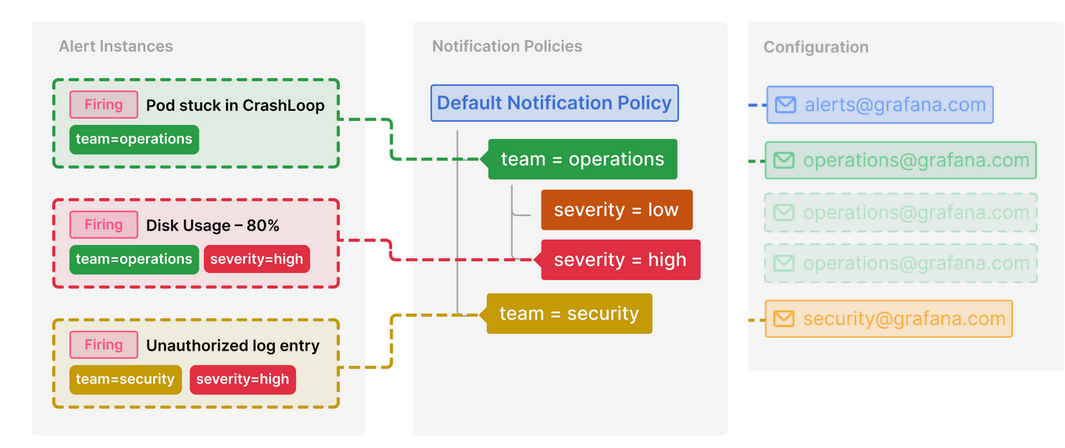
11 |
12 | In the above diagram, alert instances and notification policies are matched by labels. For instance, the label `team=operations`{{copy}} matches the alert instance “**Pod stuck in CrashLoop**” and “**Disk Usage -80%**” to child policies that send alert notifications to a particular contact point ().
13 |
--------------------------------------------------------------------------------
/grafana/alerting-get-started-pt2/step4.md:
--------------------------------------------------------------------------------
1 | # Create notification policies
2 |
3 | Create a notification policy if you want to handle metrics returned by alert rules separately by routing each alert instance to a specific contact point.
4 |
5 | 1. Visit [http://localhost:3000]({{TRAFFIC_HOST1_3000}}), where Grafana should be running
6 | 1. Navigate to **Alerts & IRM > Alerting > Notification policies**.
7 | 1. In the Default policy, click **+ New child policy**.
8 | 1. In the field **Label** enter `device`{{copy}}, and in the field **Value** enter `desktop`{{copy}}.
9 | 1. From the **Contact point** drop-down, choose **Webhook**.
10 |
11 | If you don’t have any contact points, add a [Contact point](https://grafana.com/tutorials/alerting-get-started/#create-a-contact-point).
12 | 1. Click **Save Policy**.
13 |
14 | This new child policy routes alerts that match the label `device=desktop`{{copy}} to the Webhook contact point.
15 | 1. **Repeat the steps above to create a second child policy** to match another alert instance. For labels use: `device=mobile`{{copy}}. Use the Webhook integration for the contact point. Alternatively, experiment by using a different Webhook endpoint or a [different integration](https://grafana.com/docs/grafana/latest/alerting/configure-notifications/manage-contact-points/#supported-contact-point-integrations).
16 |
--------------------------------------------------------------------------------
/grafana/alerting-get-started-pt2/step5.md:
--------------------------------------------------------------------------------
1 | # Create an alert rule that returns alert instances
2 |
3 | The alert rule that you are about to create is meant to monitor web traffic page views. The objective is to explore what an alert instance is and how to leverage routing individual alert instances by using label matchers and notification policies.
4 |
--------------------------------------------------------------------------------
/grafana/alerting-get-started-pt2/step8.md:
--------------------------------------------------------------------------------
1 | # Receive alert notifications
2 |
3 | Now that the alert rule has been configured, you should receive alert [notifications](http://grafana.com/docs/grafana/next/alerting/fundamentals/alert-rule-evaluation/state-and-health/#notifications) in the contact point whenever the alert triggers and gets resolved. In our example, each alert instance should be routed separately as we configured labels to match notification policies. Once the evaluation interval has concluded (1m), you should receive an alert notification in the Webhook endpoint.
4 |
5 | 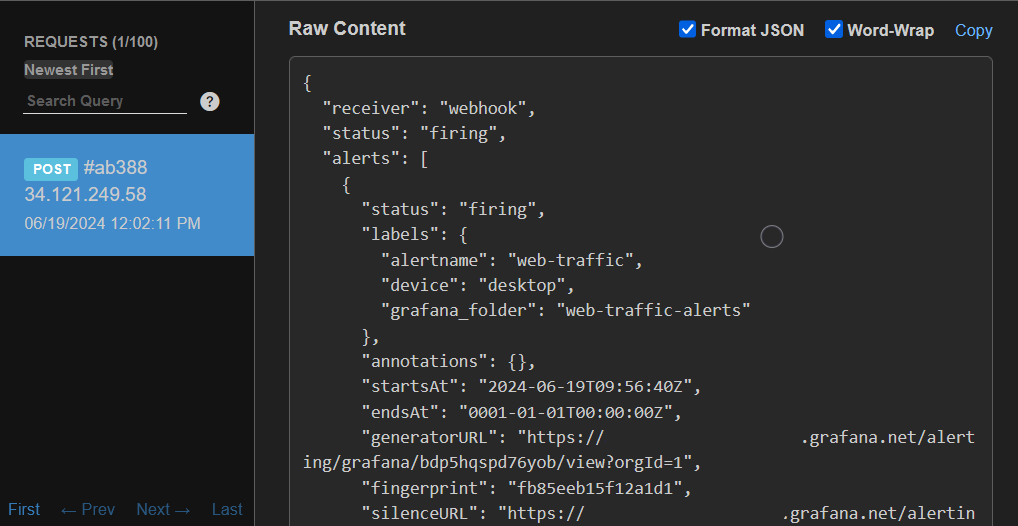
6 |
7 | The alert notification details show that the alert instance corresponding to the website views from desktop devices was correctly routed through the notification policy to the Webhook contact point. The notification also shows that the instance is in **Firing** state, as well as it includes the label `device=desktop`{{copy}}, which makes the routing of the alert instance possible.
8 |
9 | Feel free to change the CSV data in the alert rule to trigger the routing of the alert instance that matches the label `device=mobile`{{copy}}.
10 |
--------------------------------------------------------------------------------
/grafana/alerting-get-started-pt3/finish.md:
--------------------------------------------------------------------------------
1 | # Conclusion
2 |
3 | By configuring **notification policies** and using **labels** (such as _region_), you can group alert notifications based on specific criteria and route them to the appropriate teams. Fine-tuning **timing options**—including group wait, group interval, and repeat interval—further can reduce noise and ensures notifications remain actionable without overwhelming on-call engineers.
4 |
5 | # Learn more in [Grafana Alerting: Template your alert notifications](http://www.grafana.com/tutorials/alerting-get-started-pt4/)
6 |
7 | In [Get started with Grafana Alerting: Template your alert notifications](http://www.grafana.com/tutorials/alerting-get-started-pt4/) you learn how to use templates to create customized and concise notifications.
8 |
--------------------------------------------------------------------------------
/grafana/alerting-get-started-pt3/index.json:
--------------------------------------------------------------------------------
1 | {
2 | "title": "Get started with Grafana Alerting - Group alert notifications",
3 | "description": "Learn how to group alert notifications effectively to reduce noise and streamline communication in Grafana Alerting.",
4 | "details": {
5 | "intro": {
6 | "text": "intro.md"
7 | },
8 | "steps": [
9 | {
10 | "text": "step1.md"
11 | },
12 | {
13 | "text": "step2.md"
14 | },
15 | {
16 | "text": "step3.md"
17 | },
18 | {
19 | "text": "step4.md"
20 | },
21 | {
22 | "text": "step5.md"
23 | },
24 | {
25 | "text": "step6.md"
26 | }
27 | ],
28 | "finish": {
29 | "text": "finish.md"
30 | }
31 | },
32 | "backend": {
33 | "imageid": "ubuntu"
34 | }
35 | }
36 |
--------------------------------------------------------------------------------
/grafana/alerting-get-started-pt3/intro.md:
--------------------------------------------------------------------------------
1 | This tutorial is a continuation of the [Get started with Grafana Alerting - Alert routing](http://www.grafana.com/tutorials/alerting-get-started-pt2/) tutorial.
2 |
3 | Grouping in Grafana Alerting reduces notification noise by combining related alert instances into a single, concise notification. This is useful for on-call engineers, ensuring they focus on resolving incidents instead of sorting through a flood of notifications.
4 |
5 | Grouping is configured using labels in the notification policy. These labels reference those generated by alert instances or configured by the user.
6 |
7 | Notification policies also allow you to define how often notifications are sent for each group of alert instances.
8 |
9 | In this tutorial, you will:
10 |
11 | - Learn how alert rule grouping works.
12 | - Create a notification policy to handle grouping.
13 | - Define alert rules for a real-world scenario.
14 | - Receive and review grouped alert notifications.
15 |
--------------------------------------------------------------------------------
/grafana/alerting-get-started-pt3/step1.md:
--------------------------------------------------------------------------------
1 | To demonstrate the observation of data using the Grafana stack, download and run the following files.
2 |
3 | 1. Clone the [tutorial environment repository](https://www.github.com/grafana/tutorial-environment).
4 |
5 | ```
6 | git clone https://github.com/grafana/tutorial-environment.git
7 | ```{{exec}}
8 | 1. Change to the directory where you cloned the repository:
9 |
10 | ```
11 | cd tutorial-environment
12 | ```{{exec}}
13 | 1. Run the Grafana stack:
14 |
15 | ```bash
16 | docker-compose up -d
17 | ```{{exec}}
18 |
19 | The first time you run `docker compose up -d`{{copy}}, Docker downloads all the necessary resources for the tutorial. This might take a few minutes, depending on your internet connection.
20 |
21 | NOTE:
22 |
23 | If you already have Grafana, Loki, or Prometheus running on your system, you might see errors, because the Docker image is trying to use ports that your local installations are already using. If this is the case, stop the services, then run the command again.
24 |
--------------------------------------------------------------------------------
/grafana/alerting-get-started-pt3/step2.md:
--------------------------------------------------------------------------------
1 | # How alert rule grouping works
2 |
3 | Alert notification grouping is configured with **labels** and **timing options**:
4 |
5 | - **Labels** map the alert rule with the notification policy and define the grouping.
6 | - **Timing options** control when and how often notifications are sent.
7 |
8 | 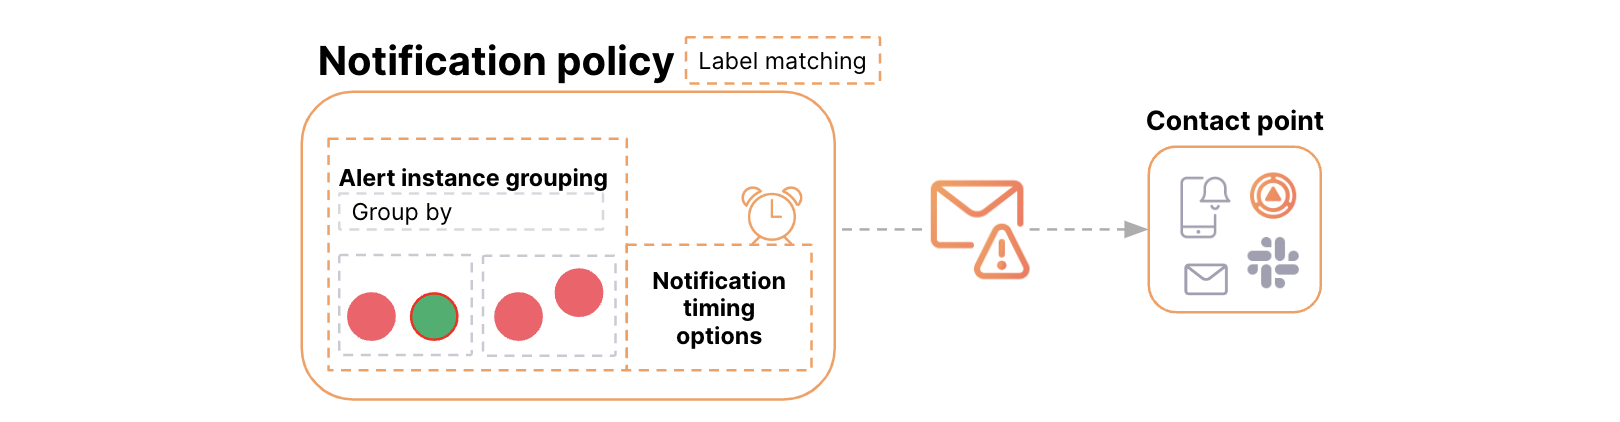
9 |
10 | ## Types of Labels
11 |
12 | **Reserved labels** (default):
13 |
14 | - Automatically generated by Grafana, e.g., `alertname`{{copy}}, `grafana_folder`{{copy}}.
15 | - Example: `alertname="High CPU usage"`{{copy}}.
16 |
17 | **User-configured labels**:
18 |
19 | - Added manually to the alert rule.
20 | - Example: `severity`{{copy}}, `priority`{{copy}}.
21 |
22 | **Query labels**:
23 |
24 | - Returned by the data source query.
25 | - Example: `region`{{copy}}, `service`{{copy}}, `environment`{{copy}}.
26 |
27 | ## Timing Options
28 |
29 | **Group wait**: Time before sending the first notification.
30 | **Group interval**: Time between notifications for a group.
31 | **Repeat interval**: Time before resending notifications for an unchanged group.
32 |
33 | Alerts sharing the **same label values** are grouped together, and timing options determine notification frequency.
34 |
35 | For more details, see:
36 |
37 | - [Grouping Alerts](https://grafana.com/docs/grafana/latest/alerting/fundamentals/notifications/group-alert-notifications/)
38 | - [Alert Labels](https://grafana.com/docs/grafana/latest/alerting/fundamentals/alert-rules/annotation-label/#label-types)
39 |
--------------------------------------------------------------------------------
/grafana/alerting-get-started-pt3/step3.md:
--------------------------------------------------------------------------------
1 | # A real-world example of alert grouping in action
2 |
3 | ## Scenario: monitoring a distributed application
4 |
5 | You’re monitoring metrics like CPU usage, memory utilization, and network latency across multiple regions. Some of these alert rules include labels such as `region: us-west`{{copy}} and `region: us-east`{{copy}}. If multiple alert rules trigger across these regions, they can result in notification floods.
6 |
7 | ## How to manage grouping
8 |
9 | To group alert rule notifications:
10 |
11 | 1. **Define labels**: Use `region`{{copy}}, `metric`{{copy}}, or `instance`{{copy}} labels to categorize alerts.
12 | 1. **Configure Notification policies**:
13 | - Group alerts by the **query label** "region".
14 | - Example:
15 | - Alert notifications for `region: us-west`{{copy}} go to the West Coast team.
16 | - Alert notifications for `region: us-east`{{copy}} go to the East Coast team.
17 | 1. Specify the **timing options** for sending notifications to control their frequency.
18 | - Example:
19 | - **Group interval**: setting determines how often updates for the same alert group are sent. By default, this interval is set to 5 minutes, but you can customize it to be shorter or longer based on your needs.
20 |
--------------------------------------------------------------------------------
/grafana/alerting-get-started-pt4/index.json:
--------------------------------------------------------------------------------
1 | {
2 | "title": "Get started with Grafana Alerting - Template your alert notifications",
3 | "description": "Learn how to use templates to create customized and concise notifications.",
4 | "details": {
5 | "intro": {
6 | "text": "intro.md"
7 | },
8 | "steps": [
9 | {
10 | "text": "step1.md"
11 | },
12 | {
13 | "text": "step2.md"
14 | },
15 | {
16 | "text": "step3.md"
17 | },
18 | {
19 | "text": "step4.md"
20 | },
21 | {
22 | "text": "step5.md"
23 | },
24 | {
25 | "text": "step6.md"
26 | }
27 | ],
28 | "finish": {
29 | "text": "finish.md"
30 | }
31 | },
32 | "backend": {
33 | "imageid": "ubuntu"
34 | }
35 | }
36 |
--------------------------------------------------------------------------------
/grafana/alerting-get-started-pt4/intro.md:
--------------------------------------------------------------------------------
1 | This tutorial is a continuation of the [Get started with Grafana Alerting - Grouping notifications](http://www.grafana.com/tutorials/alerting-get-started-pt3/) tutorial.
2 |
3 | In this tutorial, you will learn:
4 |
5 | - The two types of templates in Grafana Alerting: labels and annotations and notification templates.
6 | - How to configure alert rules with summary and description annotations.
7 | - How to create a notification template that integrates with alert rule annotations.
8 | - How to use a built-in notification template to group and format multiple alert instances.
9 | - How to preview alert notifications by leveraging alert instances in the notification template payload.
10 |
--------------------------------------------------------------------------------
/grafana/alerting-get-started-pt4/step1.md:
--------------------------------------------------------------------------------
1 | To demonstrate the observation of data using the Grafana stack, download and run the following files.
2 |
3 | 1. Clone the [tutorial environment repository](https://www.github.com/grafana/tutorial-environment).
4 |
5 | ```
6 | git clone https://github.com/grafana/tutorial-environment.git
7 | ```{{exec}}
8 | 1. Change to the directory where you cloned the repository:
9 |
10 | ```
11 | cd tutorial-environment
12 | ```{{exec}}
13 | 1. Run the Grafana stack:
14 |
15 | ```bash
16 | docker-compose up -d
17 | ```{{exec}}
18 |
19 | The first time you run `docker compose up -d`{{copy}}, Docker downloads all the necessary resources for the tutorial. This might take a few minutes, depending on your internet connection.
20 |
21 | NOTE:
22 |
23 | If you already have Grafana, Loki, or Prometheus running on your system, you might see errors, because the Docker image is trying to use ports that your local installations are already using. If this is the case, stop the services, then run the command again.
24 |
--------------------------------------------------------------------------------
/grafana/alerting-get-started-pt4/step5.md:
--------------------------------------------------------------------------------
1 | # Apply the template to your contact point
2 |
3 | 1. Apply the template to your contact point.
4 | - Navigate to **Alerts & IRM** > **Alerting** > **Contact points**.
5 | - Edit your contact point.
6 | 1. **Optional** [email] **settings** section:
7 | - Click **Edit Message**.
8 | - Under **Select notification template**, search `custom.firing_and_resolved_alerts`{{copy}}.
9 | - Click **Save**.
10 | 1. Save your contact point.
11 |
--------------------------------------------------------------------------------
/grafana/alerting-get-started-pt4/step6.md:
--------------------------------------------------------------------------------
1 | # Receiving notifications
2 |
3 | Now that the template has been applied to the contact point, you should receive notifications in the specified contact point.
4 |
5 | Note: you might need to pause the alert rule evaluation and resume it to trigger the notification.
6 |
7 | 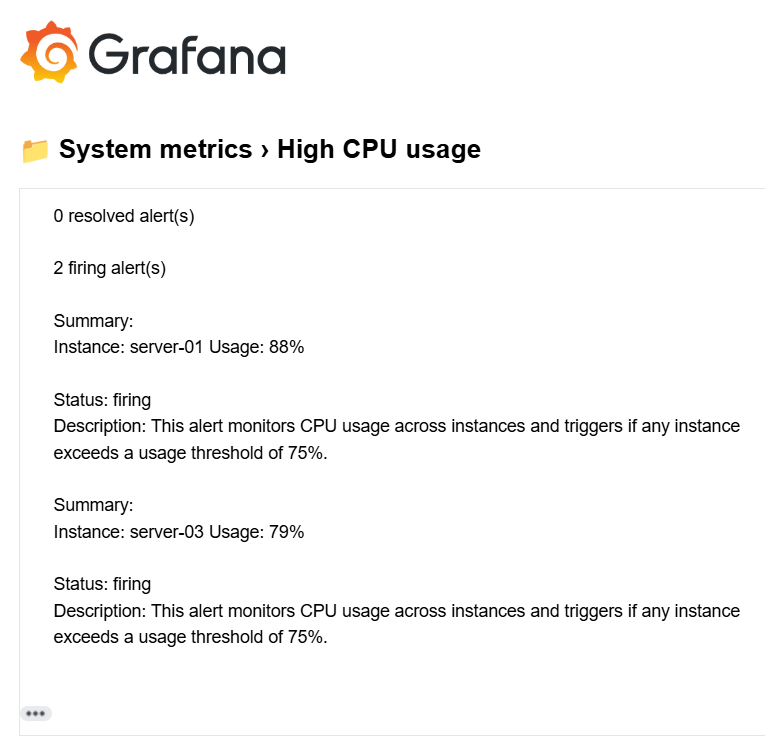
8 |
9 | In the screen capture, you can see how the notification template groups the alert instances into two sections: **firing alerts** and **resolved alerts**. Each section includes only the key details for each alert, ensuring the message remains concise and focused. Additionally, the summary and description annotations we created earlier are included, providing affected instance and CPU usage.
10 |
--------------------------------------------------------------------------------
/grafana/alerting-get-started-pt5/finish.md:
--------------------------------------------------------------------------------
1 | # Conclusion
2 |
3 | By using notification policies, you can route alerts based on query values, directing them to the appropriate teams.
4 |
5 | # Learn more in [Grafana Alerting - Link alerts to visualizations](http://www.grafana.com/tutorials/alerting-get-started-pt6/)
6 |
7 | In [Grafana Alerting - Link alerts to visualizations](http://www.grafana.com/tutorials/alerting-get-started-pt6/) you will create alerts using Prometheus data and link them to your graphs.
8 |
9 | Explore related topics covered in this tutorial:
10 |
11 | - Understand how alert routing works in [Get started with Grafana Alerting - Alert routing](http://www.grafana.com/tutorials/alerting-get-started-pt2/).
12 | - Learn how templating works in [Get started with Grafana Alerting - Templating](http://www.grafana.com/tutorials/alerting-get-started-pt4/).
13 | - More [examples on templating labels](https://grafana.com/docs/grafana/latest/alerting/alerting-rules/templates/examples/).
14 |
--------------------------------------------------------------------------------
/grafana/alerting-get-started-pt5/index.json:
--------------------------------------------------------------------------------
1 | {
2 | "title": "Get started with Grafana Alerting - Route alerts using dynamic labels",
3 | "description": "Learn how to dynamically route alert notifications.",
4 | "details": {
5 | "intro": {
6 | "text": "intro.md"
7 | },
8 | "steps": [
9 | {
10 | "text": "step1.md"
11 | },
12 | {
13 | "text": "step2.md"
14 | },
15 | {
16 | "text": "step3.md"
17 | },
18 | {
19 | "text": "step4.md"
20 | },
21 | {
22 | "text": "step5.md"
23 | },
24 | {
25 | "text": "step6.md"
26 | }
27 | ],
28 | "finish": {
29 | "text": "finish.md"
30 | }
31 | },
32 | "backend": {
33 | "imageid": "ubuntu"
34 | }
35 | }
36 |
--------------------------------------------------------------------------------
/grafana/alerting-get-started-pt5/intro.md:
--------------------------------------------------------------------------------
1 | The Get started with Grafana Alerting - Dynamic routing tutorial is a continuation of the [Get started with Grafana Alerting - Templating](http://www.grafana.com/tutorials/alerting-get-started-pt4/) tutorial.
2 |
3 | Imagine you are managing a web application or a fleet of servers, tracking critical metrics such as CPU, memory, and disk usage. While monitoring is essential, managing alerts allows your team to act on issues without necessarily feeling overwhelmed by the noise.
4 |
5 | In this tutorial you will learn how to:
6 |
7 | - Leverage notification policies for **dynamic routing based on query values**: Use notification policies to route alerts based on dynamically generated labels, in a way that critical alerts reach the on-call team and less urgent ones go to a general monitoring channel.
8 |
--------------------------------------------------------------------------------
/grafana/alerting-get-started-pt5/step1.md:
--------------------------------------------------------------------------------
1 | # Set up the Grafana stack
2 |
3 | To observe data using the Grafana stack, download and run the following files.
4 |
5 | 1. Clone the [tutorial environment repository](https://github.com/tonypowa/grafana-prometheus-alerting-demo.git).
6 |
7 | ```bash
8 | git clone https://github.com/tonypowa/grafana-prometheus-alerting-demo.git
9 | ```{{exec}}
10 | 1. Change to the directory where you cloned the repository:
11 |
12 | ```bash
13 | cd grafana-prometheus-alerting-demo
14 | ```{{exec}}
15 | 1. Build the Grafana stack:
16 |
17 | ```bash
18 | docker-compose build
19 | ```{{exec}}
20 | 1. Bring up the containers:
21 |
22 | ```bash
23 | docker-compose up -d
24 | ```{{exec}}
25 |
26 | The first time you run `docker compose up -d`{{copy}}, Docker downloads all the necessary resources for the tutorial. This might take a few minutes, depending on your internet connection.
27 |
28 | NOTE:
29 |
30 | If you already have Grafana, Loki, or Prometheus running on your system, you might see errors, because the Docker image is trying to use ports that your local installations are already using. If this is the case, stop the services, then run the command again.
31 |
--------------------------------------------------------------------------------
/grafana/alerting-get-started-pt5/step6.md:
--------------------------------------------------------------------------------
1 | # Done! Your alerts are now dynamically routed
2 |
3 | Based on your query's `instance`{{copy}} label values (which contain keywords like _prod_ or _staging_ ), Grafana dynamically assigns the value `production`{{copy}}, `staging`{{copy}} or `development`{{copy}} to the custom **environment** label using the template. This dynamic label then matches the label matchers in your notification policies, which route alerts to the correct contact points.
4 |
5 | To see this in action go to **Alerts & IRM > Alerting > Active notifications**
6 |
7 | This page shows grouped alerts that are currently triggering notifications. If you click on any alert group to view its label set, contact point, and number of alert instances. Notice that the **environment** label has been dynamically populated with values like `production`{{copy}}.
8 |
9 | 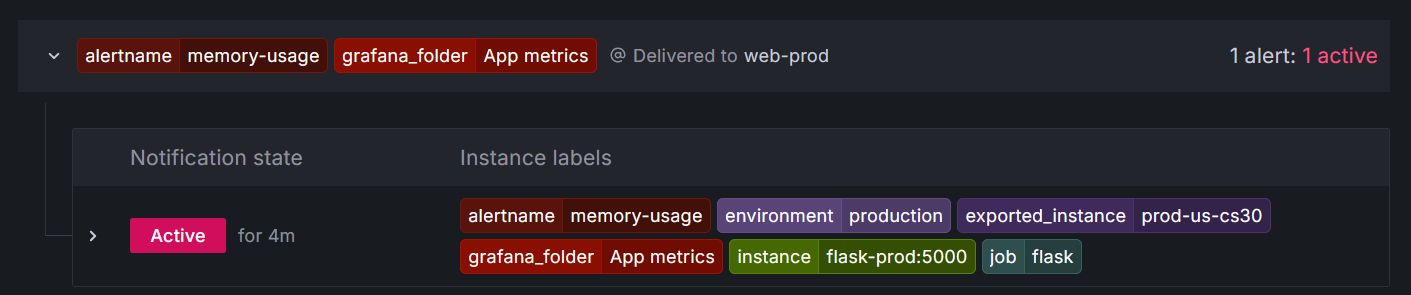
10 |
11 | Finally, you should receive notifications at the contact point associated with either `prod`{{copy}} or `staging`{{copy}}.
12 |
13 | Feel free to experiment by changing the template to match other labels that contain any of the watched keywords. For example, you could reference:
14 |
15 | ```go
16 | $labels.deployment
17 | ```{{copy}}
18 |
19 | The template should be flexible enough to capture the target keywords (e.g., prod, staging) by adjusting which label the[`$labels`{{copy}}](https://grafana.com/docs/grafana/latest/alerting/alerting-rules/templates/reference/#labels) is referencing.
20 |
--------------------------------------------------------------------------------
/grafana/alerting-get-started-pt5/step7.md:
--------------------------------------------------------------------------------
1 | # Create mute timings
2 |
3 | Now that we've set up notification policies, we can demonstrate how to mute alerts for recurring periods of time. You can mute notifications for either the production or staging policies, depending on your needs.
4 |
5 | Mute timings are useful for suppressing alerts with certain labels during maintenance windows or weekends.
6 |
7 | 1. Navigate to **Alerts & IRM > Alerting > Notification Policies**.
8 | - Enter a name, e.g. `Planned downtime`{{copy}} or `Non-business hours`{{copy}}.
9 | - Select **Sat** and **Sun**, to apply the mute timing to all Saturdays and Sundays.
10 | - Click **Save mute timing**.
11 | 1. Add mute timing to the desired policy:
12 | - Go to the notification policy that routes instances with the `staging`{{copy}} label.
13 | - Select **More > Edit**.
14 | - Choose the mute timing from the drop-down menu
15 | - Click **Update policy**.
16 |
17 | This mute timing will apply to any alerts from the staging environment that trigger on Saturdays and Sundays.
18 |
--------------------------------------------------------------------------------
/grafana/alerting-get-started-pt6/finish.md:
--------------------------------------------------------------------------------
1 | # Conclusion
2 |
3 | You’ve now linked Prometheus-based alert rules to your Grafana visualizations, giving your dashboards real-time context with alert annotations and health indicators. By visualizing alerts alongside metrics, responders can quickly understand what’s happening and when. You also saw how alert notifications can include direct links to the affected dashboard or panel, helping teams jump straight into the right time window for faster troubleshooting.
4 |
5 | Have feedback or ideas to improve this tutorial? [Let us know](https://github.com/grafana/tutorials/issues/new).
6 |
--------------------------------------------------------------------------------
/grafana/alerting-get-started-pt6/index.json:
--------------------------------------------------------------------------------
1 | {
2 | "title": "Get started with Grafana Alerting - Link alerts to visualizations",
3 | "description": "Create alerts using Prometheus data and link them to your visualizations.",
4 | "details": {
5 | "intro": {
6 | "text": "intro.md"
7 | },
8 | "steps": [
9 | {
10 | "text": "step1.md"
11 | },
12 | {
13 | "text": "step2.md"
14 | },
15 | {
16 | "text": "step3.md"
17 | },
18 | {
19 | "text": "step4.md"
20 | },
21 | {
22 | "text": "step5.md"
23 | },
24 | {
25 | "text": "step6.md"
26 | },
27 | {
28 | "text": "step7.md"
29 | }
30 | ],
31 | "finish": {
32 | "text": "finish.md"
33 | }
34 | },
35 | "backend": {
36 | "imageid": "ubuntu"
37 | }
38 | }
39 |
--------------------------------------------------------------------------------
/grafana/alerting-get-started-pt6/intro.md:
--------------------------------------------------------------------------------
1 | This tutorial is a continuation of the [Get started with Grafana Alerting - Route alerts using dynamic labels](http://www.grafana.com/tutorials/alerting-get-started-pt5/) tutorial.
2 |
3 |
4 |
5 | In this tutorial you will learn how to:
6 |
7 | - Link alert rules to time series panels for better visualization
8 | - View alert annotations directly on dashboards for better context
9 | - Write Prometheus queries
10 |
--------------------------------------------------------------------------------
/grafana/alerting-get-started-pt6/step1.md:
--------------------------------------------------------------------------------
1 | # Set up the Grafana stack
2 |
3 | To observe data using the Grafana stack, download and run the following files.
4 |
5 | 1. Clone the [tutorial environment repository](https://github.com/tonypowa/grafana-prometheus-alerting-demo.git).
6 |
7 | ```bash
8 | git clone https://github.com/tonypowa/grafana-prometheus-alerting-demo.git
9 | ```{{exec}}
10 | 1. Change to the directory where you cloned the repository:
11 |
12 | ```bash
13 | cd grafana-prometheus-alerting-demo
14 | ```{{exec}}
15 | 1. Build the Grafana stack:
16 |
17 | ```bash
18 | docker-compose build
19 | ```{{exec}}
20 | 1. Bring up the containers:
21 |
22 | ```bash
23 | docker-compose up -d
24 | ```{{exec}}
25 |
26 | The first time you run `docker compose up -d`{{copy}}, Docker downloads all the necessary resources for the tutorial. This might take a few minutes, depending on your internet connection.
27 |
28 | NOTE:
29 |
30 | If you already have Grafana, Loki, or Prometheus running on your system, you might see errors, because the Docker image is trying to use ports that your local installations are already using. If this is the case, stop the services, then run the command again.
31 |
--------------------------------------------------------------------------------
/grafana/alerting-get-started-pt6/step2.md:
--------------------------------------------------------------------------------
1 | # Use case: monitoring and alerting for system health with Prometheus and Grafana
2 |
3 | In this use case, we focus on monitoring the system's CPU, memory, and disk usage as part of a monitoring setup. The [demo app](https://github.com/tonypowa/grafana-prometheus-alerting-demo), launches a stack that includes a Python script to simulate metrics, which Grafana collects and visualizes as a time-series visualization.
4 |
5 | The script simulates random CPU and memory usage values (10% to 100%) every **10 seconds** and exposes them as Prometheus metrics.
6 |
7 | ## Objective
8 |
9 | You'll build a time series visualization to monitor CPU and memory usage, define alert rules with threshold-based conditions, and link those alerts to your dashboards to display real-time annotations when thresholds are breached.
10 |
--------------------------------------------------------------------------------
/grafana/alerting-get-started-pt6/step4.md:
--------------------------------------------------------------------------------
1 | # Step 2: Create alert rules
2 |
3 | Follow these steps to manually create alert rules and link them to a visualization.
4 |
5 | # Create an alert rule for CPU usage
6 |
7 | 1. Navigate to **Alerts & IRM > Alerting > Alert rules** from the Grafana sidebar.
8 | 1. Click **+ New alert rule** rule to create a new alert.
9 |
10 | ## Enter alert rule name
11 |
12 | Make it short and descriptive, as this will appear in your alert notification. For instance, `cpu-usage`{{copy}} .
13 |
14 | ## Define query and alert condition
15 |
16 | 1. Select **Prometheus** data source from the drop-down menu.
17 | 1. In the query section, enter the following query:
18 |
19 | ** switch to **Code** mode if not already selected **
20 |
21 | ```
22 | flask_app_cpu_usage{instance="flask-prod:5000"}
23 | ```{{copy}}
24 | 1. **Alert condition**
25 |
26 | - Enter 75 as the value for **WHEN QUERY IS ABOVE** to set the threshold for the alert.
27 | - Click **Preview alert rule condition** to run the queries.
28 |
29 | 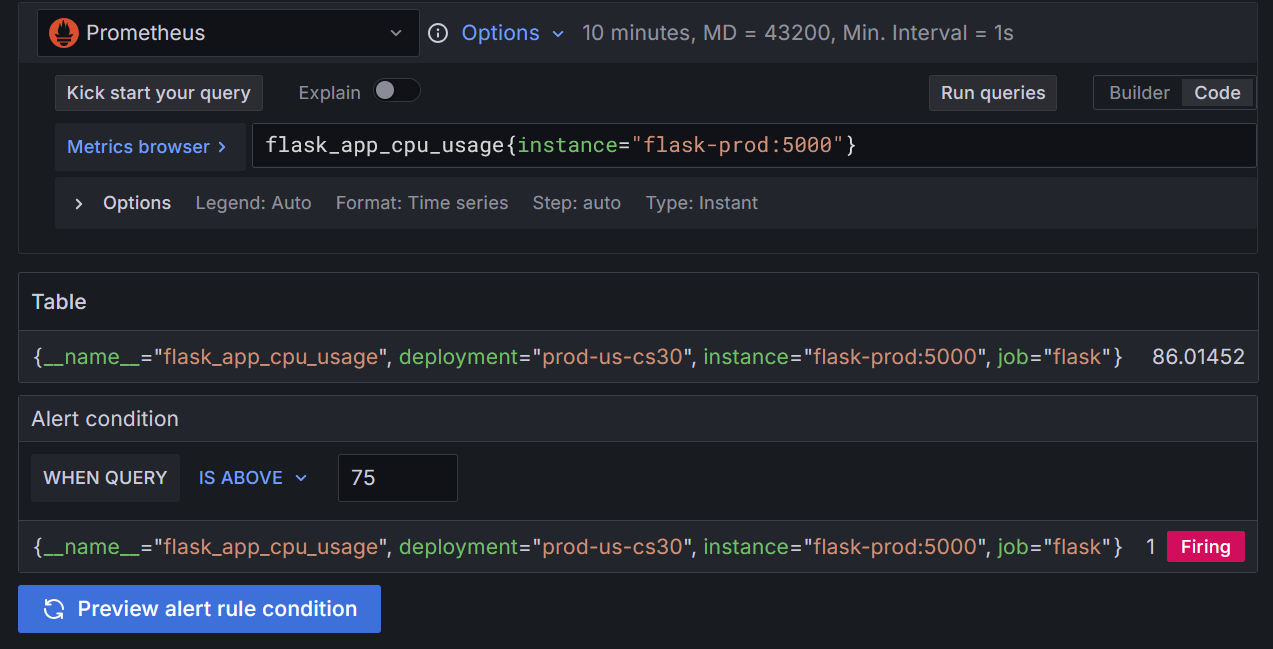
30 |
31 | The query returns the CPU usage of the Flask application in the production environment. In this case, the usage is `86.01%`{{copy}}, which exceeds the configured threshold of `75%`{{copy}}, causing the alert to fire.
32 |
--------------------------------------------------------------------------------
/grafana/alerting-get-started-pt6/step6.md:
--------------------------------------------------------------------------------
1 | # Step 3: Visualizing metrics and alert annotations
2 |
3 | After the alert rules are linked to visualization, they should appear as **health indicators** (colored heart icons: a red heart when the alert is in **Alerting** state, and a green heart when in **Normal** state) on the linked panel. In addition, annotations provide helpful context, such as the time the alert was triggered.
4 |
5 | 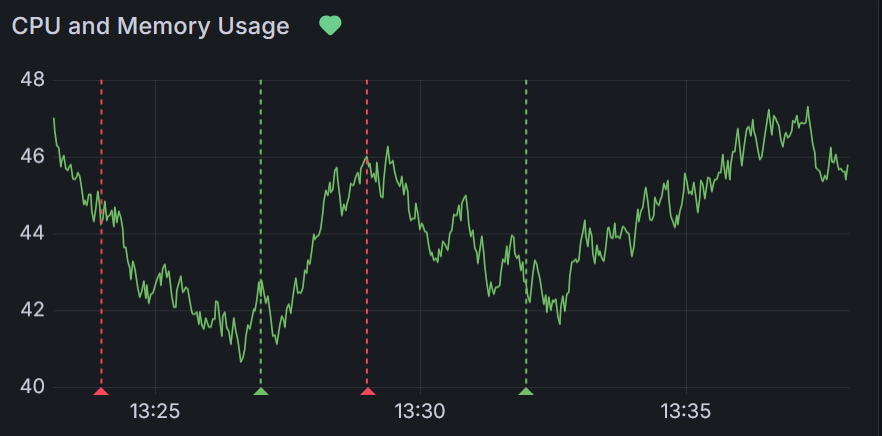
6 |
--------------------------------------------------------------------------------
/grafana/alerting-get-started-pt6/step7.md:
--------------------------------------------------------------------------------
1 | # Step 4: Receiving notifications
2 |
3 | Finally, as part of the alerting process, you should receive notifications at the associated contact point. If you're receiving alerts via email, the default email template will include two buttons:
4 |
5 | - **View dashboard**: links to the dashboard that contains the alerting panel
6 | - **View panel**: links directly to the individual panel where the alert was triggered
7 |
8 | 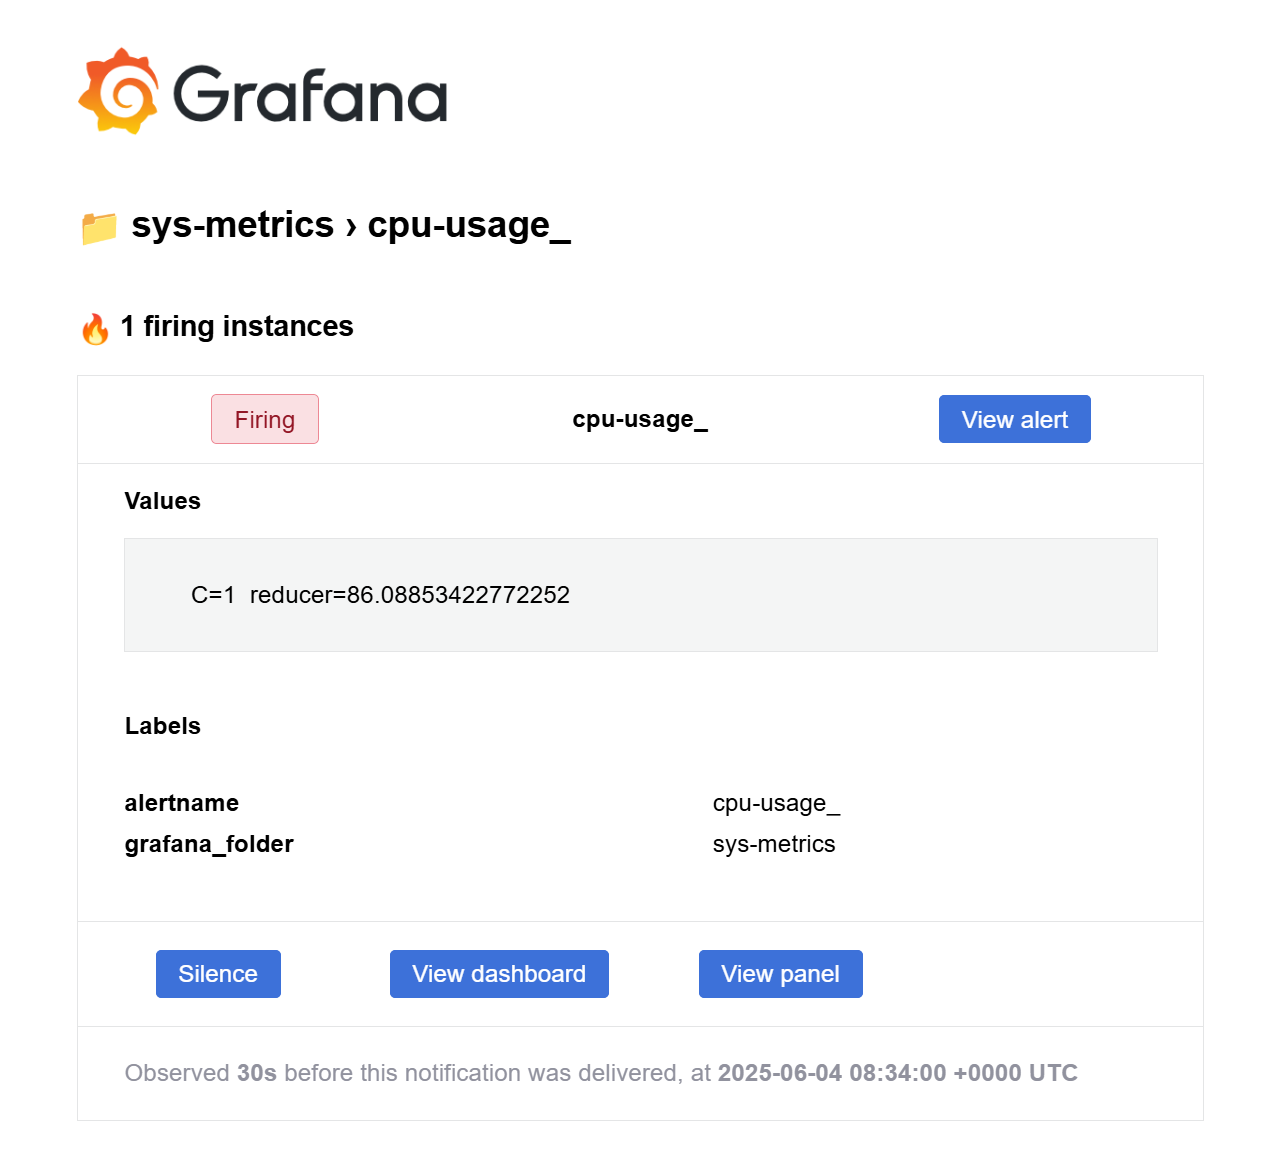
9 |
10 | Clicking either button opens Grafana with a pre-applied time range relevant to the alert.
11 |
12 | By default, this URL includes `from`{{copy}} and `to`{{copy}} query [parameters](https://grafana.com/docs/grafana/latest/alerting/configure-notifications/template-notifications/reference/#alert) that reflect the time window around the alert event (one hour before and after the alert). This helps you land directly in the time window where the alert occurred, making it easier to analyze what happened.
13 |
14 | If you want to define a more intentional time range, you can customize your notifications using a [notification template](https://grafana.com/docs/grafana/latest/alerting/configure-notifications/template-notifications/examples/#print-a-link-to-a-dashboard-with-time-range). With a template, you can explicitly set `from`{{copy}} and `to`{{copy}} values for more precise control over what users see when they follow the dashboard link. The final URL is constructed using a custom annotation (e.g., `MyDashboardURL`{{copy}}) along with the `from`{{copy}} and `to`{{copy}} parameters, which are calculated in the notification template.
15 |
--------------------------------------------------------------------------------
/grafana/alerting-get-started/finish.md:
--------------------------------------------------------------------------------
1 | # Learn more in [Grafana Alerting: Multi-dimensional alerts and how to route them](http://www.grafana.com/tutorials/alerting-get-started-pt2/)
2 |
3 | In [Grafana Alerting: Multi-dimensional alerts and how to route them](http://www.grafana.com/tutorials/alerting-get-started-pt2/) you'll learn to use alert instances and route notifications by labels to contacts.
4 |
--------------------------------------------------------------------------------
/grafana/alerting-get-started/index.json:
--------------------------------------------------------------------------------
1 | {
2 | "title": "Get started with Grafana Alerting - Create and receive your first alert",
3 | "description": "Get started with Grafana Alerting by creating your first alert rule, sending notifications to a webhook, and generating data to test it live.",
4 | "details": {
5 | "intro": {
6 | "text": "intro.md"
7 | },
8 | "steps": [
9 | {
10 | "text": "step1.md"
11 | },
12 | {
13 | "text": "step2.md"
14 | },
15 | {
16 | "text": "step3.md"
17 | },
18 | {
19 | "text": "step4.md"
20 | }
21 | ],
22 | "finish": {
23 | "text": "finish.md"
24 | }
25 | },
26 | "backend": {
27 | "imageid": "ubuntu"
28 | }
29 | }
30 |
--------------------------------------------------------------------------------
/grafana/alerting-get-started/intro.md:
--------------------------------------------------------------------------------
1 | In this tutorial, we walk you through the process of setting up your first alert in just a few minutes. You'll witness your alert in action with real-time data, as well as sending alert notifications.
2 |
3 | In this tutorial you will:
4 |
5 | - Create a contact point.
6 | - Set up an alert rule.
7 | - Receive firing and resolved alert notifications in a public webhook.
8 |
9 | > After you have completed Part 1, don’t forget to explore the advanced but essential alerting topics in [Multi-dimensional alerts and how to route them](http://www.grafana.com/tutorials/alerting-get-started-pt2/).
10 |
--------------------------------------------------------------------------------
/grafana/alerting-get-started/step1.md:
--------------------------------------------------------------------------------
1 | To demonstrate the observation of data using the Grafana stack, download and run the following files.
2 |
3 | 1. Clone the [tutorial environment repository](https://www.github.com/grafana/tutorial-environment).
4 |
5 | ```
6 | git clone https://github.com/grafana/tutorial-environment.git
7 | ```{{exec}}
8 | 1. Change to the directory where you cloned the repository:
9 |
10 | ```
11 | cd tutorial-environment
12 | ```{{exec}}
13 | 1. Run the Grafana stack:
14 |
15 | ```bash
16 | docker-compose up -d
17 | ```{{exec}}
18 |
19 | The first time you run `docker compose up -d`{{copy}}, Docker downloads all the necessary resources for the tutorial. This might take a few minutes, depending on your internet connection.
20 |
21 | NOTE:
22 |
23 | If you already have Grafana, Loki, or Prometheus running on your system, you might see errors, because the Docker image is trying to use ports that your local installations are already using. If this is the case, stop the services, then run the command again.
24 |
--------------------------------------------------------------------------------
/grafana/alerting-get-started/step4.md:
--------------------------------------------------------------------------------
1 | # Trigger and resolve an alert
2 |
3 | Now that the alert rule has been configured, you should receive alert [notifications](http://grafana.com/docs/grafana/next/alerting/fundamentals/alert-rule-evaluation/state-and-health/#notifications) in the contact point whenever alerts trigger and get resolved.
4 |
5 | ## Trigger an alert
6 |
7 | Since the alert rule that you have created has been configured to always fire, once the evaluation interval has concluded, you should receive an alert notification in the Webhook endpoint.
8 |
9 | 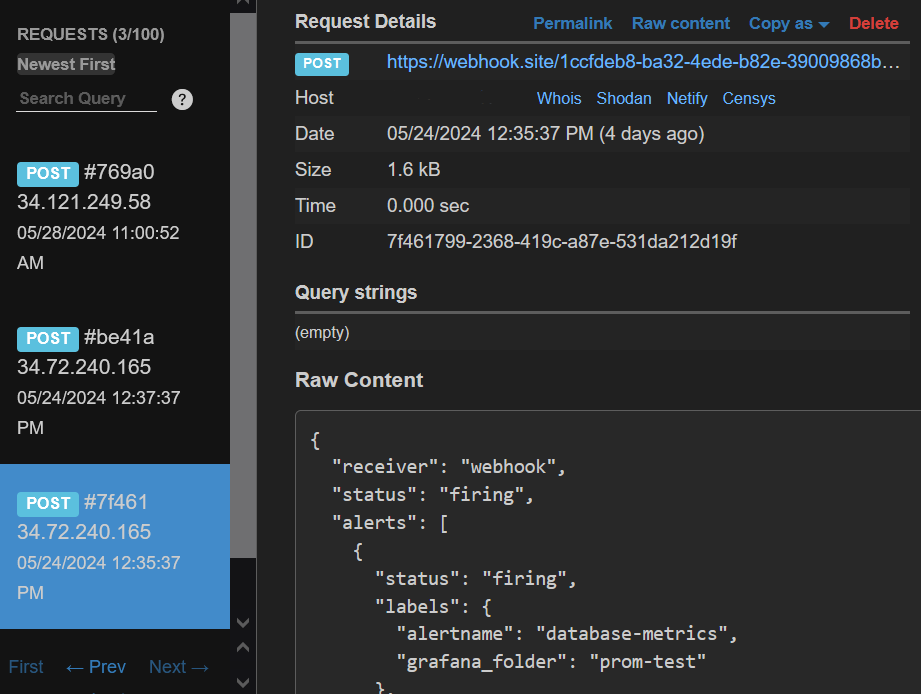
10 |
11 | The alert notification details show that the alert rule state is Firing , and it includes the value that made the rule trigger by exceeding the threshold of the alert rule condition. The notification also includes links to see the alert rule details, and another link to add a [Silence](http://grafana.com/docs/grafana/next/alerting/configure-notifications/create-silence/) to it.
12 |
13 | ## Resolve an alert
14 |
15 | To see how a resolved alert notification looks like, you can modify the current alert rule threshold.
16 |
17 | To edit the Alert rule:
18 |
19 | 1. **Navigate to Alerting** > **Alert rules**.
20 | 1. Click on the metric-alerts folder to display the alert that you created earlier
21 | 1. Click the **edit** button on the right hand side of the screen
22 | 1. Increment the Threshold expression to 1.
23 | 1. Click **Save rule and exit**.
24 |
25 | By incrementing the threshold, the condition is no longer met, and after the evaluation interval has concluded (1 minute approx.), you should receive an alert notification with status **“Resolved”**.
26 |
--------------------------------------------------------------------------------
/grafana/alerting-loki-logs/finish.md:
--------------------------------------------------------------------------------
1 | > In [Get started with Grafana Alerting - Part 2](http://www.grafana.com/tutorials/alerting-get-started-pt2/) you can advance your skills by exploring alert instances and notification routing.
2 |
--------------------------------------------------------------------------------
/grafana/alerting-loki-logs/index.json:
--------------------------------------------------------------------------------
1 | {
2 | "title": "How to create alert rules with log data",
3 | "description": "Learn how to use Loki with Grafana Alerting to keep track of what’s happening in your environment with real log data.",
4 | "details": {
5 | "intro": {
6 | "text": "intro.md"
7 | },
8 | "steps": [
9 | {
10 | "text": "step1.md"
11 | },
12 | {
13 | "text": "step2.md"
14 | },
15 | {
16 | "text": "step3.md"
17 | },
18 | {
19 | "text": "step4.md"
20 | },
21 | {
22 | "text": "step5.md"
23 | }
24 | ],
25 | "finish": {
26 | "text": "finish.md"
27 | }
28 | },
29 | "backend": {
30 | "imageid": "ubuntu"
31 | }
32 | }
33 |
--------------------------------------------------------------------------------
/grafana/alerting-loki-logs/intro.md:
--------------------------------------------------------------------------------
1 | # How to create alert rules with log data
2 |
3 | Loki stores your logs and only indexes labels for each log stream. Using Loki with Grafana Alerting is a powerful way to keep track of what’s happening in your environment. You can create metric alert rules based on content in your log lines to notify your team. What’s even better is that you can add label data from the log message directly into your alert notification.
4 |
5 | In this tutorial, you'll:
6 |
7 | - Generate sample logs and pull them with Promtail to Grafana.
8 | - Create an alert rule based on a Loki query (LogQL).
9 | - Create a Webhook contact point to send alert notifications to.
10 |
11 | > In [Get started with Grafana Alerting - Part 2](http://www.grafana.com/tutorials/alerting-get-started-pt2/) you can advance your skills by exploring alert instances and notification routing.
12 |
--------------------------------------------------------------------------------
/grafana/alerting-loki-logs/step1.md:
--------------------------------------------------------------------------------
1 | # Before you begin
2 |
3 | To demonstrate the observation of data using the Grafana stack, download and run the following files.
4 |
5 | 1. Download and save a Docker compose file to run Grafana, Loki and Promtail.
6 |
7 | ```bash
8 | wget https://raw.githubusercontent.com/grafana/loki/refs/heads/main/production/docker-compose.yaml -O docker-compose.yaml
9 | ```{{exec}}
10 | 1. Run the Grafana stack.
11 |
12 | ```bash
13 | docker-compose up -d
14 | ```{{exec}}
15 |
16 | The first time you run `docker-compose up -d`{{copy}}, Docker downloads all the necessary resources for the tutorial. This might take a few minutes, depending on your internet connection.
17 |
18 | > If you already have Grafana, Loki, or Prometheus running on your system, you might see errors, because the Docker image is trying to use ports that your local installations are already using. If this is the case, stop the services, then run the command again.
19 |
--------------------------------------------------------------------------------
/grafana/alerting-loki-logs/step2.md:
--------------------------------------------------------------------------------
1 | # Generate sample logs
2 |
3 | To demonstrate how to create alert rules based on logs, you’ll use a script that generates realistic log entries to simulate typical monitoring data in Grafana. Running this script outputs logs continuously, each containing a timestamp, HTTP method (either GET or POST), status code (200 for success or 500 for failures), and request duration in milliseconds.
4 |
5 | 1. Download and save a Python file that generates logs.
6 |
7 | ```bash
8 | wget https://raw.githubusercontent.com/grafana/tutorial-environment/master/app/loki/web-server-logs-simulator.py
9 | ```{{exec}}
10 | 1. Execute the log-generating Python script.
11 |
12 | ```bash
13 | python3 ./web-server-logs-simulator.py | sudo tee -a /var/log/web_requests.log
14 | ```{{exec}}
15 |
16 | ## Troubleshooting the script
17 |
18 | If you don't see the sample logs in Explore:
19 |
20 | - Does the output file exist, check `/var/log/web_requests.log`{{copy}} to see if it contains logs.
21 | - If the file is empty, check that you followed the steps above to create the file.
22 | - If the file exists, verify that promtail container is running.
23 | - In Grafana Explore, check that the time range is only for the last 5 minutes.
24 |
--------------------------------------------------------------------------------
/grafana/alerting-loki-logs/step5.md:
--------------------------------------------------------------------------------
1 | # Trigger the alert rule
2 |
3 | Since the Python script continues to generate log data that matches the alert rule condition, once the evaluation interval has concluded, you should receive an alert notification in the Webhook endpoint.
4 |
5 | 
6 |
--------------------------------------------------------------------------------
/grafana/assets/data_sources.png:
--------------------------------------------------------------------------------
https://raw.githubusercontent.com/grafana/killercoda/19bfb5e03680c28ae023eec22fe4531ea7467d22/grafana/assets/data_sources.png
--------------------------------------------------------------------------------
/grafana/assets/data_sources_list.png:
--------------------------------------------------------------------------------
https://raw.githubusercontent.com/grafana/killercoda/19bfb5e03680c28ae023eec22fe4531ea7467d22/grafana/assets/data_sources_list.png
--------------------------------------------------------------------------------
/grafana/assets/grafana_logo.png:
--------------------------------------------------------------------------------
https://raw.githubusercontent.com/grafana/killercoda/19bfb5e03680c28ae023eec22fe4531ea7467d22/grafana/assets/grafana_logo.png
--------------------------------------------------------------------------------
/grafana/assets/graph.png:
--------------------------------------------------------------------------------
https://raw.githubusercontent.com/grafana/killercoda/19bfb5e03680c28ae023eec22fe4531ea7467d22/grafana/assets/graph.png
--------------------------------------------------------------------------------
/grafana/assets/grot-4.png:
--------------------------------------------------------------------------------
https://raw.githubusercontent.com/grafana/killercoda/19bfb5e03680c28ae023eec22fe4531ea7467d22/grafana/assets/grot-4.png
--------------------------------------------------------------------------------
/grafana/assets/query.png:
--------------------------------------------------------------------------------
https://raw.githubusercontent.com/grafana/killercoda/19bfb5e03680c28ae023eec22fe4531ea7467d22/grafana/assets/query.png
--------------------------------------------------------------------------------
/grafana/assets/save_and_test.png:
--------------------------------------------------------------------------------
https://raw.githubusercontent.com/grafana/killercoda/19bfb5e03680c28ae023eec22fe4531ea7467d22/grafana/assets/save_and_test.png
--------------------------------------------------------------------------------
/grafana/assets/search.png:
--------------------------------------------------------------------------------
https://raw.githubusercontent.com/grafana/killercoda/19bfb5e03680c28ae023eec22fe4531ea7467d22/grafana/assets/search.png
--------------------------------------------------------------------------------
/grafana/fo11y/index.json:
--------------------------------------------------------------------------------
1 | {
2 | "title": "Frontend Observability",
3 | "description": "In this demo you'll learn how to instrument a React application with Grafana Frontend Observability in Grafana Cloud.",
4 | "details": {
5 | "intro": {
6 | "text": "intro.md",
7 | "foreground": "setup.sh"
8 | },
9 | "steps": [
10 | {
11 | "text": "step1.md"
12 | },
13 | {
14 | "text": "step2.md"
15 | },
16 | {
17 | "text": "step3.md"
18 | },
19 | {
20 | "text": "step4.md"
21 | }
22 | ],
23 | "finish": {
24 | "text": "finished.md"
25 | },
26 | "assets": {
27 | "host01": [
28 | {"file": "*", "target": "/education"}
29 | ]
30 | }
31 | }
32 | ,
33 | "backend": {
34 | "imageid": "ubuntu"
35 | }
36 | }
--------------------------------------------------------------------------------
/grafana/fo11y/setup.sh:
--------------------------------------------------------------------------------
1 | curl -o- https://raw.githubusercontent.com/nvm-sh/nvm/v0.39.7/install.sh | bash
2 |
3 | export NVM_DIR="$([ -z "${XDG_CONFIG_HOME-}" ] && printf %s "${HOME}/.nvm" || printf %s "${XDG_CONFIG_HOME}/nvm")"
4 | [ -s "$NVM_DIR/nvm.sh" ] && \. "$NVM_DIR/nvm.sh" # This loads nvm
5 |
6 | nvm install 20
7 | nvm alias default 20
8 | nvm use
--------------------------------------------------------------------------------
/grafana/fo11y/step2.md:
--------------------------------------------------------------------------------
1 | # Creating the Frontend Observability App in Grafana Cloud
2 |
3 | Now that you have both the frontend and backend applications running, the next thing we need to do is create the Frontend Observability app in your Grafana Cloud instance.
4 | If you haven't done so already, open your Grafana Cloud instance.
5 |
6 | *Note: If you haven't created a Grafana Cloud instance yet, do that now by [signing in or registering](https://grafana.com/auth/sign-in/) and creating a new stack.*
7 |
8 | ## Adding the Frontend Observability application in Grafana Cloud
9 |
10 | On the left hand side navigation, expand the **Frontend** section and click on **Frontend Apps**.
11 |
12 | Next, in the right hand panel, click on the **Create New** button.
13 |
14 | Fill in the following information:
15 |
16 | - **App Name:** (e.g. fo11y-demo)
17 | - **CORS Allowed Origins:** {{TRAFFIC_HOST1_3000}}
18 | - **Default Attributes:** Add an attribute with a name of `application_name` with a value of `fo11y-demo`
19 | - **Acknowledge cloud costs:** Tick the box
20 |
21 | Then click on **Create**.
22 |
23 | In the next section, we'll instrument our React application to begin pushing data to our Grafana Cloud instance.
--------------------------------------------------------------------------------
/grafana/grafana-basics/assets/prometheus.yml:
--------------------------------------------------------------------------------
1 | # my global config
2 | global:
3 | scrape_interval: 5s # Set the scrape interval to every 15 seconds. Default is every 1 minute.
4 | evaluation_interval: 5s # Evaluate rules every 15 seconds. The default is every 1 minute.
5 | # scrape_timeout is set to the global default (10s).
6 |
7 | # Alertmanager configuration
8 | alerting:
9 | alertmanagers:
10 | - static_configs:
11 | - targets:
12 | # - alertmanager:9093
13 |
14 | # Load rules once and periodically evaluate them according to the global 'evaluation_interval'.
15 | rule_files:
16 | # - "first_rules.yml"
17 | # - "second_rules.yml"
18 |
19 | # A scrape configuration containing exactly one endpoint to scrape:
20 | scrape_configs:
21 | # The job name is added as a label `job=` to any timeseries scraped from this config.
22 | - job_name: "Node Exporter"
23 |
24 | # metrics_path defaults to '/metrics'
25 | # scheme defaults to 'http'.
26 |
27 | static_configs:
28 | - targets: ["0.0.0.0:9100"]
29 |
--------------------------------------------------------------------------------
/grafana/grafana-basics/assets/prometheus_datasource.yml:
--------------------------------------------------------------------------------
1 | apiVersion: 1
2 |
3 | datasources:
4 | - name: Prometheus
5 | type: prometheus
6 | access: proxy
7 | orgId: 1
8 | url: http://localhost:9090
9 | basicAuth: false
10 | isDefault: true
11 | version: 1
12 | editable: true
13 |
--------------------------------------------------------------------------------
/grafana/grafana-basics/finished.md:
--------------------------------------------------------------------------------
1 |
2 |
3 |
4 | # Tutiorial: Grafana Basics Complete
5 | You have completed the Grafana Basics course. In this course, you learned the fundamentals of Grafana, a powerful open-source platform for visualizing and analyzing data. Whether you are a developer, system administrator, or data analyst, this course provided you with the knowledge and skills to effectively use Grafana for monitoring and visualization.
6 |
7 | ## What's Next?
8 | Now that you have completed the Grafana Basics course, you can explore more advanced topics such as:
9 | - [Grafana Plugins](https://grafana.com/grafana/plugins)
10 | - [Grafana Dashboards](https://grafana.com/docs/grafana/latest/dashboards)
11 | - [Grafana API](https://grafana.com/docs/grafana/latest/http_api)
12 |
13 |
14 |
15 |
--------------------------------------------------------------------------------
/grafana/grafana-basics/index.json:
--------------------------------------------------------------------------------
1 | {
2 | "title": "Grafana Basics",
3 | "description": "In this demo learn how to install and configure Grafana",
4 | "details": {
5 | "intro": {
6 | "text": "intro.md"
7 | },
8 | "steps": [
9 | {
10 | "text": "step1.md"
11 | },
12 | {
13 | "text": "step2.md"
14 | },
15 | {
16 | "text": "step3.md"
17 | },
18 | {
19 | "text": "step4.md"
20 | }
21 | ],
22 | "finish": {
23 | "text": "finished.md"
24 | },
25 | "assets": {
26 | "host01": [
27 | {"file": "*", "target": "/education"}
28 | ]
29 | }
30 | }
31 | ,
32 | "backend": {
33 | "imageid": "ubuntu"
34 | }
35 | }
--------------------------------------------------------------------------------
/grafana/grafana-basics/intro.md:
--------------------------------------------------------------------------------
1 |
2 |
3 |
4 | # Welcome to the Grafana Basics Course
5 |
6 | In this course, you will learn the fundamentals of Grafana, a powerful open-source platform for visualizing and analyzing data. Whether you are a developer, system administrator, or data analyst, this course will provide you with the knowledge and skills to effectively use Grafana for monitoring and visualization.
7 |
8 | ## What is Grafana?
9 |
10 | Grafana is a leading data visualization and monitoring tool that allows you to create interactive dashboards and graphs to gain insights from your data. It supports a wide range of data sources, including databases, cloud services, and time series databases like Prometheus and InfluxDB.
11 |
12 | [](https://www.youtube.com/watch?v=4-z1-eEHhvs)
13 |
14 |
15 | ## Course Overview
16 |
17 | Throughout this course, you will learn the following:
18 |
19 | 1. How to install Grafana on your local machine or server.
20 | 2. The basics of configuring Grafana and connecting it to a data source such as Prometheus.
21 | 3. Creating a basic dashboard to visualize your data.
22 |
23 | By the end of this course, you will have a solid understanding of Grafana and be able to create your own monitoring dashboard to gain valuable insights from your data.
24 |
25 | Let's get started!
26 |
--------------------------------------------------------------------------------
/grafana/grafana-basics/step2.md:
--------------------------------------------------------------------------------
1 | # Step 2: Installing Grafana
2 | In this step, we will install Grafana on within our virtual environment. Grafana is an open-source platform for monitoring and observability that allows you to create, explore, and share dashboards and data visualizations.
3 |
4 | ## Installing Grafana
5 | 1. Lets install Grafana via apt install.
6 | ```
7 | sudo apt-get install -y apt-transport-https software-properties-common wget &&
8 | sudo mkdir -p /etc/apt/keyrings/ &&
9 | wget -q -O - https://apt.grafana.com/gpg.key | gpg --dearmor | sudo tee /etc/apt/keyrings/grafana.gpg > /dev/null &&
10 | echo "deb [signed-by=/etc/apt/keyrings/grafana.gpg] https://apt.grafana.com stable main" | sudo tee -a /etc/apt/sources.list.d/grafana.list &&
11 | sudo apt-get update && sudo apt-get install -y grafana
12 | ```{{execute}}
13 |
14 | 2. Lets make sure our Grafana service is running.
15 | ```
16 | sudo systemctl start grafana-server && sudo systemctl status grafana-server
17 | ```{{execute}}
18 |
19 | We should now be able to access Grafana by visiting the following URL in your browser: [http://localhost:3000]({{TRAFFIC_HOST1_3000}}). If you see a page with a login prompt, then Grafana is running correctly.
20 |
--------------------------------------------------------------------------------
/grafana/grafana-fundamentals/finish.md:
--------------------------------------------------------------------------------
1 | # Summary
2 |
3 | In this tutorial you learned about fundamental features of Grafana.
4 |
5 | ## Learn more
6 |
7 | Check out the links below to continue your learning journey with Grafana's LGTM stack.
8 |
9 | - [Prometheus](https://grafana.com/docs/grafana/latest/features/datasources/prometheus/)
10 | - [Loki](https://grafana.com/docs/grafana/latest/features/datasources/loki/)
11 | - [Explore](https://grafana.com/docs/grafana/latest/explore/)
12 | - [Alerting Overview](https://grafana.com/docs/grafana/latest/alerting/)
13 | - [Alert rules](https://grafana.com/docs/grafana/latest/alerting/create-alerts/)
14 | - [Contact points](https://grafana.com/docs/grafana/latest/alerting/fundamentals/contact-points/)
15 |
--------------------------------------------------------------------------------
/grafana/grafana-fundamentals/index.json:
--------------------------------------------------------------------------------
1 | {
2 | "title": "Grafana fundamentals",
3 | "description": "Learn how to use Grafana to set up a monitoring solution for your application. You will explore metrics and logs, build and annotate dashboards, and set up alert rules.",
4 | "details": {
5 | "intro": {
6 | "text": "intro.md"
7 | },
8 | "steps": [
9 | {
10 | "text": "step1.md"
11 | },
12 | {
13 | "text": "step2.md"
14 | },
15 | {
16 | "text": "step3.md"
17 | },
18 | {
19 | "text": "step4.md"
20 | },
21 | {
22 | "text": "step5.md"
23 | },
24 | {
25 | "text": "step6.md"
26 | },
27 | {
28 | "text": "step7.md"
29 | },
30 | {
31 | "text": "step8.md"
32 | },
33 | {
34 | "text": "step9.md"
35 | },
36 | {
37 | "text": "step10.md"
38 | }
39 | ],
40 | "finish": {
41 | "text": "finish.md"
42 | }
43 | },
44 | "backend": {
45 | "imageid": "ubuntu"
46 | }
47 | }
48 |
--------------------------------------------------------------------------------
/grafana/grafana-fundamentals/intro.md:
--------------------------------------------------------------------------------
1 | # Introduction
2 |
3 | In this tutorial, you'll learn how to use Grafana to set up a monitoring solution for your application, and:
4 |
5 | - Explore metrics and logs
6 | - Build dashboards
7 | - Annotate dashboards
8 | - Set up alert rules
9 |
--------------------------------------------------------------------------------
/grafana/grafana-fundamentals/step2.md:
--------------------------------------------------------------------------------
1 | # Open Grafana
2 |
3 | Grafana is an open source platform for monitoring and observability that lets you visualize and explore the state of your systems.
4 |
5 | 1. Browse to [http://localhost:3000]({{TRAFFIC_HOST1_3000}}).
6 |
--------------------------------------------------------------------------------
/grafana/grafana-fundamentals/step4.md:
--------------------------------------------------------------------------------
1 | # Add a logging data source
2 |
3 | Grafana supports log data sources, like [Loki](https://grafana.com/oss/loki/). Just like for metrics, you first need to add your data source to Grafana.
4 |
5 | 1. Click the menu icon and, in the sidebar, click **Connections** and then **Data sources**.
6 | 1. Click **+ Add new data source**.
7 | 1. In the list of data sources, click **Loki**.
8 | 1. In the URL box, enter `http://loki:3100`{{copy}}
9 | 1. Scroll to the bottom of the page and click **Save & Test** to save your changes.
10 |
11 | You should see the message "Data source successfully connected." Loki is now available as a data source in Grafana.
12 |
--------------------------------------------------------------------------------
/grafana/grafana-fundamentals/step6.md:
--------------------------------------------------------------------------------
1 | # Build a dashboard
2 |
3 | A _dashboard_ gives you an at-a-glance view of your data and lets you track metrics through different visualizations.
4 |
5 | Dashboards consist of _panels_, each representing a part of the story you want your dashboard to tell.
6 |
7 | Every panel consists of a _query_ and a _visualization_. The query defines _what_ data you want to display, whereas the visualization defines _how_ the data is displayed.
8 |
9 | 1. Click the menu icon and, in the sidebar, click **Dashboards**.
10 | 1. On the **Dashboards** page, click **New** in top right corner and select **New Dashboard** in the drop-down.
11 | 1. Click **+ Add visualization**.
12 | 1. In the modal that opens, select the Prometheus data source that you just added.
13 | 1. In the **Query** tab below the graph, enter the query from earlier and then press Shift + Enter:
14 |
15 | ```
16 | sum(rate(tns_request_duration_seconds_count[5m])) by(route)
17 | ```{{copy}}
18 | 1. In the panel editor on the right, under **Panel options**, change the panel title to "Traffic".
19 | 1. Click **Apply** in the top-right corner to save the panel and go back to the dashboard view.
20 | 1. Click the **Save dashboard** (disk) icon at the top of the dashboard to save your dashboard.
21 | 1. Enter a name in the **Dashboard name** field and then click **Save**.
22 |
23 | You should now have a panel added to your dashboard.
24 |
25 | 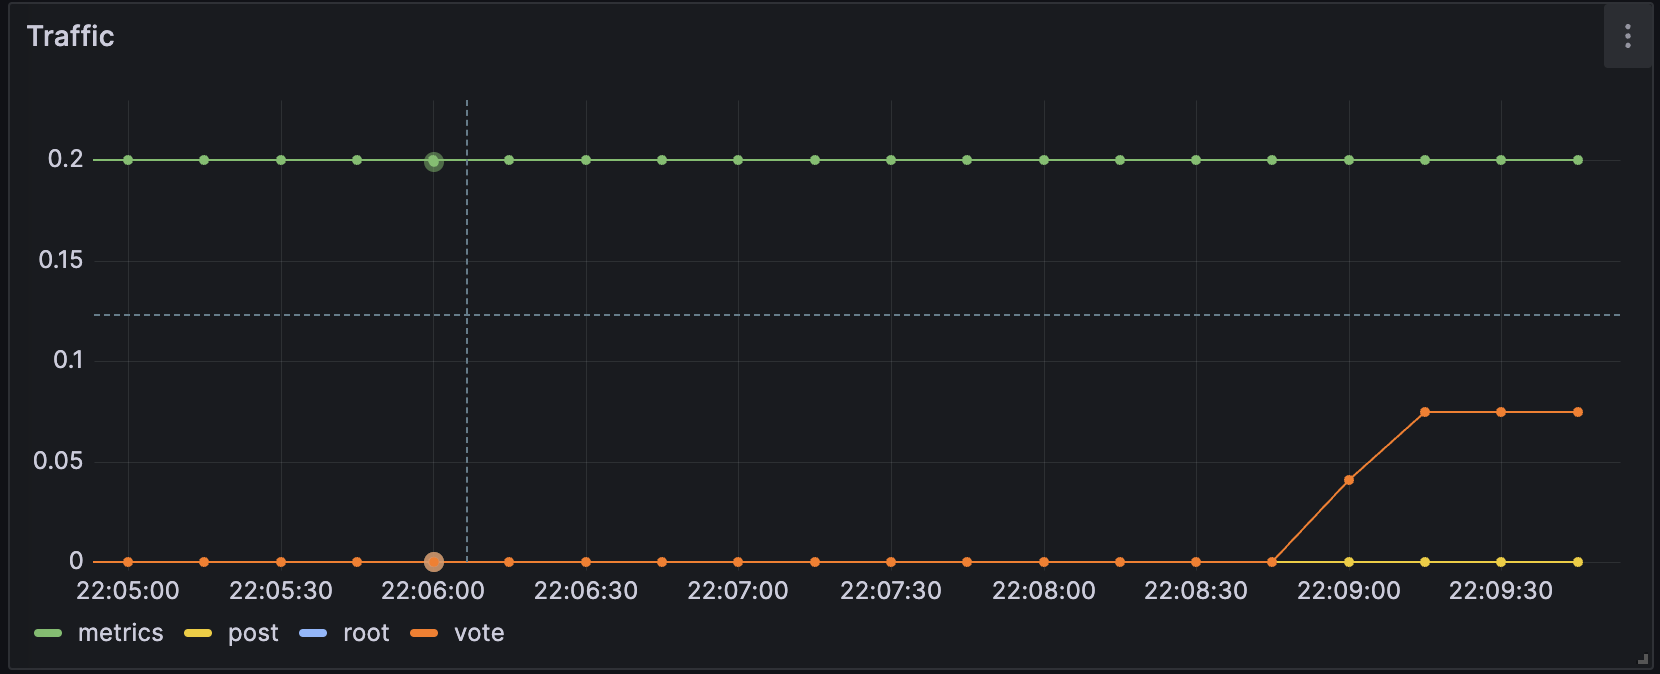
26 |
--------------------------------------------------------------------------------
/grafana/grafana-fundamentals/step9.md:
--------------------------------------------------------------------------------
1 | # Create a contact point for Grafana-managed alert rules
2 |
3 | In this step, we set up a new contact point. This contact point uses the _webhooks_ channel. In order to make this work, we also need an endpoint for our webhook channel to receive the alert notification. We can use [Webhook.site](https://webhook.site/) to quickly set up that test endpoint. This way we can make sure that our alert manager is actually sending a notification somewhere.
4 |
5 | 1. Browse to [Webhook.site](https://webhook.site/).
6 | 1. Copy Your unique URL.
7 |
8 | Your webhook endpoint is now waiting for the first request.
9 |
10 | Next, let's configure a Contact Point in Grafana's Alerting UI to send notifications to our webhook endpoint.
11 |
12 | 1. Return to Grafana. In Grafana's sidebar, hover over the **Alerting** (bell) icon and then click **Manage Contact points**.
13 | 1. Click **+ Add contact point**.
14 | 1. In **Name**, write **Webhook**.
15 | 1. In **Integration**, choose **Webhook**.
16 | 1. In **URL**, paste the endpoint to your webhook endpoint.
17 | 1. Click **Test**, and then click **Send test notification** to send a test alert notification to your webhook endpoint.
18 | 1. Navigate back to the webhook endpoint you created earlier. On the left side, there's now a `POST /`{{copy}} entry. Click it to see what information Grafana sent.
19 | 1. Return to Grafana and click **Save contact point**.
20 |
21 | We have now created a dummy webhook endpoint and created a new Alerting Contact Point in Grafana. Now we can create an alert rule and link it to this new channel.
22 |
--------------------------------------------------------------------------------
/grafana/structure.json:
--------------------------------------------------------------------------------
1 | {
2 | "items": [
3 | { "path": "grafana-basics", "title": "Grafana Basics"},
4 | { "path": "alerting-get-started", "title": "Get started with Grafana Alerting"},
5 | { "path": "alerting-get-started-pt2", "title": "Get started with Grafana Alerting - Part 2"},
6 | { "path": "alerting-get-started-pt3", "title": "Get started with Grafana Alerting - Part 3"},
7 | { "path": "alerting-get-started-pt4", "title": "Get started with Grafana Alerting - Part 4"},
8 | { "path": "alerting-get-started-pt5", "title": "Get started with Grafana Alerting - Part 5"},
9 | { "path": "alerting-get-started-pt6", "title": "Get started with Grafana Alerting - Part 6"},
10 | { "path": "alerting-loki-logs", "title": "Create alert rules with logs"},
11 | { "path": "grafana-fundamentals", "title": "Grafana Fundamentals"},
12 | { "path": "fo11y", "title": "Frontend Observability"}
13 | ]
14 | }
15 |
--------------------------------------------------------------------------------
/loki/alloy-kafka-logs/finish.md:
--------------------------------------------------------------------------------
1 | # Summary
2 |
3 | In this example, we configured Alloy to ingest logs via Kafka. We configured Alloy to ingest logs in two different formats: raw logs and OpenTelemetry logs. Where to go next?
4 |
5 | ## Back to docs
6 |
7 | Head back to where you started from to continue with the Loki documentation: [Loki documentation](https://grafana.com/docs/loki/latest/send-data/alloy)
8 |
9 | # Further reading
10 |
11 | For more information on Grafana Alloy, refer to the following resources:
12 |
13 | - [Grafana Alloy getting started examples](https://grafana.com/docs/alloy/latest/tutorials/)
14 | - [Grafana Alloy component reference](https://grafana.com/docs/alloy/latest/reference/components/)
15 |
16 | # Complete metrics, logs, traces, and profiling example
17 |
18 | If you would like to use a demo that includes Mimir, Loki, Tempo, and Grafana, you can use [Introduction to Metrics, Logs, Traces, and Profiling in Grafana](https://github.com/grafana/intro-to-mlt). `Intro-to-mltp`{{copy}} provides a self-contained environment for learning about Mimir, Loki, Tempo, and Grafana.
19 |
20 | The project includes detailed explanations of each component and annotated configurations for a single-instance deployment. Data from `intro-to-mltp`{{copy}} can also be pushed to Grafana Cloud.
21 |
--------------------------------------------------------------------------------
/loki/alloy-kafka-logs/index.json:
--------------------------------------------------------------------------------
1 | {
2 | "title": "Sending Logs to Loki via Kafka using Alloy",
3 | "description": "Configuring Grafana Alloy to receive logs via Kafka and send them to Loki.",
4 | "details": {
5 | "intro": {
6 | "text": "intro.md"
7 | },
8 | "steps": [
9 | {
10 | "text": "step1.md"
11 | },
12 | {
13 | "text": "step2.md"
14 | },
15 | {
16 | "text": "step3.md"
17 | },
18 | {
19 | "text": "step4.md"
20 | }
21 | ],
22 | "finish": {
23 | "text": "finish.md"
24 | }
25 | },
26 | "backend": {
27 | "imageid": "ubuntu"
28 | }
29 | }
30 |
--------------------------------------------------------------------------------
/loki/alloy-kafka-logs/step1.md:
--------------------------------------------------------------------------------
1 | # Step 1: Environment setup
2 |
3 | In this step, we will set up our environment by cloning the repository that contains our demo application and spinning up our observability stack using Docker Compose.
4 |
5 | 1. To get started, clone the repository that contains our demo application:
6 |
7 | ```bash
8 | git clone -b microservice-kafka https://github.com/grafana/loki-fundamentals.git
9 | ```{{exec}}
10 | 1. Next we will spin up our observability stack using Docker Compose:
11 |
12 | ```bash
13 | docker-compose -f loki-fundamentals/docker-compose.yml up -d
14 | ```{{exec}}
15 |
16 | This will spin up the following services:
17 |
18 | ```console
19 | ✔ Container loki-fundamentals-grafana-1 Started
20 | ✔ Container loki-fundamentals-loki-1 Started
21 | ✔ Container loki-fundamentals-alloy-1 Started
22 | ✔ Container loki-fundamentals-zookeeper-1 Started
23 | ✔ Container loki-fundamentals-kafka-1 Started
24 | ```{{copy}}
25 |
26 | We will be access two UI interfaces:
27 |
28 | - Alloy at [http://localhost:12345]({{TRAFFIC_HOST1_12345}})
29 | - Grafana at [http://localhost:3000]({{TRAFFIC_HOST1_3000}})
30 |
--------------------------------------------------------------------------------
/loki/alloy-kafka-logs/step4.md:
--------------------------------------------------------------------------------
1 | # Step 3: Start the Carnivorous Greenhouse
2 |
3 | In this step, we will start the Carnivorous Greenhouse application. To start the application, run the following command:
4 |
5 | **Note: This docker-compose file relies on the `loki-fundamentals_loki`{{copy}} docker network. If you have not started the observability stack, you will need to start it first.**
6 |
7 | ```bash
8 | docker-compose -f loki-fundamentals/greenhouse/docker-compose-micro.yml up -d --build
9 | ```{{exec}}
10 |
11 | This will start the following services:
12 |
13 | ```console
14 | ✔ Container greenhouse-db-1 Started
15 | ✔ Container greenhouse-websocket_service-1 Started
16 | ✔ Container greenhouse-bug_service-1 Started
17 | ✔ Container greenhouse-user_service-1 Started
18 | ✔ Container greenhouse-plant_service-1 Started
19 | ✔ Container greenhouse-simulation_service-1 Started
20 | ✔ Container greenhouse-main_app-1 Started
21 | ```{{copy}}
22 |
23 | Once started, you can access the Carnivorous Greenhouse application at [http://localhost:5005]({{TRAFFIC_HOST1_5005}}). Generate some logs by interacting with the application in the following ways:
24 |
25 | - Create a user
26 | - Log in
27 | - Create a few plants to monitor
28 | - Enable bug mode to activate the bug service. This will cause services to fail and generate additional logs.
29 |
30 | Finally to view the logs in Loki, navigate to the Loki Logs Explore view in Grafana at [http://localhost:3000/a/grafana-lokiexplore-app/explore]({{TRAFFIC_HOST1_3000}}/a/grafana-lokiexplore-app/explore).
31 |
--------------------------------------------------------------------------------
/loki/alloy-otel-logs/finish.md:
--------------------------------------------------------------------------------
1 | # Summary
2 |
3 | In this example, we configured Alloy to ingest OpenTelemetry logs and send them to Loki. This was a simple example to demonstrate how to send logs from an application instrumented with OpenTelemetry to Loki using Alloy. Where to go next?
4 |
5 | ## Back to docs
6 |
7 | Head back to where you started from to continue with the Loki documentation: [Loki documentation](https://grafana.com/docs/loki/latest/send-data/alloy)
8 |
9 | # Further reading
10 |
11 | For more information on Grafana Alloy, refer to the following resources:
12 |
13 | - [Grafana Alloy getting started examples](https://grafana.com/docs/alloy/latest/tutorials/)
14 | - [Grafana Alloy component reference](https://grafana.com/docs/alloy/latest/reference/components/)
15 |
16 | # Complete metrics, logs, traces, and profiling example
17 |
18 | If you would like to use a demo that includes Mimir, Loki, Tempo, and Grafana, you can use [Introduction to Metrics, Logs, Traces, and Profiling in Grafana](https://github.com/grafana/intro-to-mlt). `Intro-to-mltp`{{copy}} provides a self-contained environment for learning about Mimir, Loki, Tempo, and Grafana.
19 |
20 | The project includes detailed explanations of each component and annotated configurations for a single-instance deployment. Data from `intro-to-mltp`{{copy}} can also be pushed to Grafana Cloud.
21 |
--------------------------------------------------------------------------------
/loki/alloy-otel-logs/index.json:
--------------------------------------------------------------------------------
1 | {
2 | "title": "Sending OpenTelemetry logs to Loki using Alloy",
3 | "description": "Configuring Grafana Alloy to send OpenTelemetry logs to Loki.",
4 | "details": {
5 | "intro": {
6 | "text": "intro.md"
7 | },
8 | "steps": [
9 | {
10 | "text": "step1.md"
11 | },
12 | {
13 | "text": "step2.md"
14 | },
15 | {
16 | "text": "step3.md"
17 | }
18 | ],
19 | "finish": {
20 | "text": "finish.md"
21 | }
22 | },
23 | "backend": {
24 | "imageid": "ubuntu"
25 | }
26 | }
27 |
--------------------------------------------------------------------------------
/loki/alloy-otel-logs/step1.md:
--------------------------------------------------------------------------------
1 | # Step 1: Environment setup
2 |
3 | In this step, we will set up our environment by cloning the repository that contains our demo application and spinning up our observability stack using Docker Compose.
4 |
5 | 1. To get started, clone the repository that contains our demo application:
6 |
7 | ```bash
8 | git clone -b microservice-otel https://github.com/grafana/loki-fundamentals.git
9 | ```{{exec}}
10 | 1. Next we will spin up our observability stack using Docker Compose:
11 |
12 | ```bash
13 | docker-compose -f loki-fundamentals/docker-compose.yml up -d
14 | ```{{exec}}
15 |
16 | This will spin up the following services:
17 |
18 | ```console
19 | ✔ Container loki-fundamentals-grafana-1 Started
20 | ✔ Container loki-fundamentals-loki-1 Started
21 | ✔ Container loki-fundamentals-alloy-1 Started
22 | ```{{copy}}
23 |
24 | We will be access two UI interfaces:
25 |
26 | - Alloy at [http://localhost:12345]({{TRAFFIC_HOST1_12345}})
27 | - Grafana at [http://localhost:3000]({{TRAFFIC_HOST1_3000}})
28 |
--------------------------------------------------------------------------------
/loki/alloy-otel-logs/step3.md:
--------------------------------------------------------------------------------
1 | # Step 3: Start the Carnivorous Greenhouse
2 |
3 | In this step, we will start the Carnivorous Greenhouse application. To start the application, run the following command:
4 |
5 | **Note: This docker-compose file relies on the `loki-fundamentals_loki`{{copy}} docker network. If you have not started the observability stack, you will need to start it first.**
6 |
7 | ```bash
8 | docker-compose -f loki-fundamentals/greenhouse/docker-compose-micro.yml up -d --build
9 | ```{{exec}}
10 |
11 | This will start the following services:
12 |
13 | ```bash
14 | ✔ Container greenhouse-db-1 Started
15 | ✔ Container greenhouse-websocket_service-1 Started
16 | ✔ Container greenhouse-bug_service-1 Started
17 | ✔ Container greenhouse-user_service-1 Started
18 | ✔ Container greenhouse-plant_service-1 Started
19 | ✔ Container greenhouse-simulation_service-1 Started
20 | ✔ Container greenhouse-main_app-1 Started
21 | ```{{exec}}
22 |
23 | Once started, you can access the Carnivorous Greenhouse application at [http://localhost:5005]({{TRAFFIC_HOST1_5005}}). Generate some logs by interacting with the application in the following ways:
24 |
25 | - Create a user
26 | - Log in
27 | - Create a few plants to monitor
28 | - Enable bug mode to activate the bug service. This will cause services to fail and generate additional logs.
29 |
30 | Finally to view the logs in Loki, navigate to the Loki Logs Explore view in Grafana at [http://localhost:3000/a/grafana-lokiexplore-app/explore]({{TRAFFIC_HOST1_3000}}/a/grafana-lokiexplore-app/explore).
31 |
--------------------------------------------------------------------------------
/loki/assets/grot-4.png:
--------------------------------------------------------------------------------
https://raw.githubusercontent.com/grafana/killercoda/19bfb5e03680c28ae023eec22fe4531ea7467d22/loki/assets/grot-4.png
--------------------------------------------------------------------------------
/loki/assets/loki-logo.png:
--------------------------------------------------------------------------------
https://raw.githubusercontent.com/grafana/killercoda/19bfb5e03680c28ae023eec22fe4531ea7467d22/loki/assets/loki-logo.png
--------------------------------------------------------------------------------
/loki/fluentbit-loki-tutorial/finish.md:
--------------------------------------------------------------------------------
1 | # Summary
2 |
3 | In this tutorial, you learned how to send logs to Loki using Fluent Bit. You configured Fluent Bit to receive logs from the Carnivorous Greenhouse application and export logs to Loki using the official Loki output plugin. Where to next?
4 |
5 | ## Back to Docs
6 |
7 | Head back to where you started from to continue with the [Loki documentation](https://grafana.com/docs/loki/latest/send-data/alloy).
8 |
9 | # Further reading
10 |
11 | For more information on Fluent Bit, refer to the following resources:
12 |
13 | - [Fluent Bit documentation](https://docs.fluentbit.io/manual/)
14 | - [Other examples of Fluent Bit configurations](https://grafana.com/docs/loki/latest/send-data/fluentbit/)
15 |
16 | # Complete metrics, logs, traces, and profiling example
17 |
18 | If you would like to use a demo that includes Mimir, Loki, Tempo, and Grafana, you can use [Introduction to Metrics, Logs, Traces, and Profiling in Grafana](https://github.com/grafana/intro-to-mlt). `Intro-to-mltp`{{copy}} provides a self-contained environment for learning about Mimir, Loki, Tempo, and Grafana.
19 |
20 | The project includes detailed explanations of each component and annotated configurations for a single-instance deployment. Data from `intro-to-mltp`{{copy}} can also be pushed to Grafana Cloud.
21 |
--------------------------------------------------------------------------------
/loki/fluentbit-loki-tutorial/index.json:
--------------------------------------------------------------------------------
1 | {
2 | "title": "Sending logs to Loki using Fluent Bit tutorial",
3 | "description": "Sending logs to Loki using Fluent Bit using the official Fluent Bit Loki output plugin.",
4 | "details": {
5 | "intro": {
6 | "text": "intro.md"
7 | },
8 | "steps": [
9 | {
10 | "text": "step1.md"
11 | },
12 | {
13 | "text": "step2.md"
14 | },
15 | {
16 | "text": "step3.md"
17 | }
18 | ],
19 | "finish": {
20 | "text": "finish.md"
21 | }
22 | },
23 | "backend": {
24 | "imageid": "ubuntu"
25 | }
26 | }
27 |
--------------------------------------------------------------------------------
/loki/fluentbit-loki-tutorial/intro.md:
--------------------------------------------------------------------------------
1 | # Sending logs to Loki using Fluent Bit tutorial
2 |
3 | In this tutorial, you will learn how to send logs to Loki using Fluent Bit. Fluent Bit is a lightweight and fast log processor and forwarder that can collect, process, and deliver logs to various destinations. We will use the official Fluent Bit Loki output plugin to send logs to Loki.
4 |
5 | ## Scenario
6 |
7 | In this scenario, we have a microservices application called the Carnivorous Greenhouse. This application consists of the following services:
8 |
9 | - **User Service:** Manages user data and authentication for the application. Such as creating users and logging in.
10 | - **Plant Service:** Manages the creation of new plants and updates other services when a new plant is created.
11 | - **Simulation Service:** Generates sensor data for each plant.
12 | - **Websocket Service:** Manages the websocket connections for the application.
13 | - **Bug Service:** A service that when enabled, randomly causes services to fail and generate additional logs.
14 | - **Main App:** The main application that ties all the services together.
15 | - **Database:** A database that stores user and plant data.
16 |
17 | Each service has been instrumented with the Fluent Bit logging framework to generate logs. If you would like to learn more about how the Carnivorous Greenhouse application was instrumented with Fluent Bit, refer to the [Carnivorous Greenhouse repository](https://github.com/grafana/loki-fundamentals/blob/fluentbit-official/greenhouse/loggingfw.py).
18 |
--------------------------------------------------------------------------------
/loki/fluentbit-loki-tutorial/step1.md:
--------------------------------------------------------------------------------
1 | # Step 1: Environment setup
2 |
3 | In this step, we will set up our environment by cloning the repository that contains our demo application and spinning up our observability stack using Docker Compose.
4 |
5 | 1. To get started, clone the repository that contains our demo application:
6 |
7 | ```bash
8 | git clone -b fluentbit-official https://github.com/grafana/loki-fundamentals.git
9 | ```{{exec}}
10 | 1. Next we will spin up our observability stack using Docker Compose:
11 |
12 | ```bash
13 | docker-compose -f loki-fundamentals/docker-compose.yml up -d
14 | ```{{exec}}
15 |
16 | This will spin up the following services:
17 |
18 | ```console
19 | ✔ Container loki-fundamentals-grafana-1 Started
20 | ✔ Container loki-fundamentals-loki-1 Started
21 | ✔ Container loki-fundamentals_fluent-bit_1 Started
22 | ```{{copy}}
23 |
24 | Once we have finished configuring the Fluent Bit agent and sending logs to Loki, we will be able to view the logs in Grafana. To check if Grafana is up and running, navigate to the following URL: [http://localhost:3000]({{TRAFFIC_HOST1_3000}})
25 |
--------------------------------------------------------------------------------
/loki/fluentbit-loki-tutorial/step3.md:
--------------------------------------------------------------------------------
1 | # Step 3: Start the Carnivorous Greenhouse
2 |
3 | In this step, we will start the Carnivorous Greenhouse application. To start the application, run the following command:
4 |
5 | > Note: This docker-compose file relies on the `loki-fundamentals_loki`{{copy}} docker network. If you have not started the observability stack, you will need to start it first.
6 |
7 | ```bash
8 | docker-compose -f loki-fundamentals/greenhouse/docker-compose-micro.yml up -d --build
9 | ```{{exec}}
10 |
11 | This will start the following services:
12 |
13 | ```bash
14 | ✔ Container greenhouse-db-1 Started
15 | ✔ Container greenhouse-websocket_service-1 Started
16 | ✔ Container greenhouse-bug_service-1 Started
17 | ✔ Container greenhouse-user_service-1 Started
18 | ✔ Container greenhouse-plant_service-1 Started
19 | ✔ Container greenhouse-simulation_service-1 Started
20 | ✔ Container greenhouse-main_app-1 Started
21 | ```{{exec}}
22 |
23 | Once started, you can access the Carnivorous Greenhouse application at [http://localhost:5005]({{TRAFFIC_HOST1_5005}}). Generate some logs by interacting with the application in the following ways:
24 |
25 | 1. Create a user.
26 | 1. Log in.
27 | 1. Create a few plants to monitor.
28 | 1. Enable bug mode to activate the bug service. This will cause services to fail and generate additional logs.
29 |
30 | Finally to view the logs in Loki, navigate to the Loki Logs Explore view in Grafana at [http://localhost:3000/a/grafana-lokiexplore-app/explore]({{TRAFFIC_HOST1_3000}}/a/grafana-lokiexplore-app/explore).
31 |
--------------------------------------------------------------------------------
/loki/intro-to-ingest-otel/finished.md:
--------------------------------------------------------------------------------
1 | 
2 |
3 | # Congratulations! You have completed the Introduction to Ingesting Logs with Loki (Otel) scenario.
4 |
5 | You have successfully learned how to ingest logs into Loki using the OpenTelemetry Collector.
6 |
7 | ## What's Next?
8 |
9 | Head back to the video to continue with Introduction to Ingesting Logs using OpenTelemetry with Loki.
10 |
11 | [](https://www.youtube.com/watch?v=snXhe1fDDa8)
12 |
--------------------------------------------------------------------------------
/loki/intro-to-ingest-otel/index.json:
--------------------------------------------------------------------------------
1 | {
2 | "title": "Intro to Ingesting with OpenTelemetry",
3 | "description": "A sandbox enviroment to introduce users to the basics of ingesting data into Loki using OpenTelemetry",
4 | "details": {
5 | "intro": {
6 | "text": "intro.md",
7 | "foreground": "setup.sh"
8 | },
9 | "steps": [
10 | {
11 | "text": "step1.md"
12 | },
13 | {
14 | "text": "step2.md"
15 | },
16 | {
17 | "text": "step3.md"
18 | }
19 | ],
20 | "finish": {
21 | "text": "finished.md"
22 | }
23 | }
24 | ,
25 | "backend": {
26 | "imageid": "ubuntu"
27 | }
28 | }
--------------------------------------------------------------------------------
/loki/intro-to-ingest-otel/setup.sh:
--------------------------------------------------------------------------------
1 | #!/usr/bin/env bash
2 |
3 | echo "RUNNING SETUP SCRIPT"
4 |
5 | # Clone the tutorial environment repository if it doesn't already exist
6 | if [ ! -d "loki-fundamentals" ]; then
7 | git clone https://github.com/grafana/loki-fundamentals.git || { echo "Failed to clone repository"; exit 1; }
8 | fi
9 |
10 | # Enter the directory and switch to the required branch
11 | cd loki-fundamentals && git checkout intro-to-otel || { echo "Failed to checkout branch"; exit 1; }
12 |
13 | echo "Building training instance...."
14 |
15 | # Update and install required packages
16 | echo "Updating and installing required packages..."
17 | sudo apt-get update && sudo apt-get install -y python3-venv figlet; clear; echo -e "\e[32m$(figlet -f standard 'Intro to ingesting using')\e[0m"; echo -e "\e[33m$(figlet -f standard 'OpenTelemetry')\e[0m"
--------------------------------------------------------------------------------
/loki/intro-to-ingest-otel/step1.md:
--------------------------------------------------------------------------------
1 |
2 | # Step 1: Preparing our Python application
3 |
4 | For this demo, we will be using a simple Python application called Carnivorous Greenhouse. This application generates logs that we will be ingesting into Loki. This application will be installed locally on the sandbox environment.
5 |
6 | ## Package Installation
7 |
8 | First we will create our Python virtual environment. We will use the following command to create our virtual environment:
9 |
10 | ```bash
11 | python3 -m venv .venv
12 | source ./.venv/bin/activate
13 | ```{{execute}}
14 |
15 | The carniverous greenhouse application relies on a few Python packages. We will install these packages using the following command:
16 |
17 | ```bash
18 | pip install -r requirements.txt
19 | ```{{execute}}
20 |
21 | Next we will install the requried OpenTelemetry packages to instrument our application:
22 | * Opentelemetry-distro: This contains OpenTelemetry API, SDK
23 | * Opentelemetry-exporter-otlp: This package allows us to export these logs within the OTLP format otherwise known as OpenTelemtry Protocol more on where we are sending our log entries later.
24 | We will use the following command to install the required packages:
25 |
26 | ```bash
27 | pip install opentelemetry-distro opentelemetry-exporter-otlp
28 | ```{{execute}}
29 |
30 |
31 |
32 |
33 |
--------------------------------------------------------------------------------
/loki/intro-to-ingest-otel/step3.md:
--------------------------------------------------------------------------------
1 |
2 | # Step 3: Running our stack
3 |
4 | We are now ready to run our stack. We will start the OpenTelemetry Collector, Loki, and Grafana.
5 |
6 | ## Starting the observability stack
7 |
8 | To start the observability stack, run the following command:
9 |
10 | ```bash
11 | docker-compose up -d
12 | ```{{execute}}
13 |
14 | ## Run our Python application
15 |
16 | Next, we will run our Python application. We will use the following command to run the application:
17 |
18 | ```bash
19 | python app.py
20 | ```{{execute}}
21 |
22 | ## Accessing the Carnivorous Greenhouse application
23 |
24 | The Carnivorous Greenhouse application is now running. You can access the application by clicking on the following link:
25 | [http://localhost:5005]({{TRAFFIC_HOST1_5005}})
26 |
27 | Create an account, login, and collect metrics from a series of hungry plants. All of these actions generate logs that are sent to Loki. The application can also be toggled to generate errors.
28 |
29 | ## Accessing logs in Grafana
30 |
31 | The logs generated by the Carnivorous Greenhouse application are sent to Loki. You can access the logs in Grafana by clicking on the following link:
32 |
33 | [http://localhost:3000/explore]({{TRAFFIC_HOST1_3000}}/explore)
34 |
--------------------------------------------------------------------------------
/loki/intro-to-ingest/finished.md:
--------------------------------------------------------------------------------
1 | 
2 |
3 | # Introduction to Ingesting Logs with Loki (Alloy)
4 |
5 | You have successfully completed the Introduction to Ingesting Logs with Loki (Alloy) scenario.
6 |
7 | ## What's Next?
8 |
9 | Head back to the video to continue with Introduction to Ingesting Logs with Loki.
10 |
11 | [](https://www.youtube.com/watch?v=xtEppndO7F8)
12 |
--------------------------------------------------------------------------------
/loki/intro-to-ingest/index.json:
--------------------------------------------------------------------------------
1 | {
2 | "title": "Intro to Ingesting",
3 | "description": "A sandbox enviroment to introduce users to the basics of ingesting data into Loki using Grafana Alloy",
4 | "details": {
5 | "intro": {
6 | "text": "intro.md",
7 | "foreground": "setup.sh"
8 | },
9 | "steps": [
10 | {
11 | "text": "step1.md"
12 | },
13 | {
14 | "text": "step2.md"
15 | },
16 | {
17 | "text": "step3.md"
18 | },
19 | {
20 | "text": "step4.md"
21 | }
22 | ],
23 | "finish": {
24 | "text": "finished.md"
25 | }
26 | }
27 | ,
28 | "backend": {
29 | "imageid": "ubuntu"
30 | }
31 | }
--------------------------------------------------------------------------------
/loki/intro-to-ingest/setup.sh:
--------------------------------------------------------------------------------
1 | #!/usr/bin/env bash
2 |
3 | echo "RUNNING SETUP SCRIPT"
4 |
5 | # Clone the tutorial environment repository if it doesn't already exist
6 | if [ ! -d "loki-fundamentals" ]; then
7 | git clone https://github.com/grafana/loki-fundamentals.git || { echo "Failed to clone repository"; exit 1; }
8 | fi
9 |
10 | # Enter the directory and switch to the required branch
11 | cd loki-fundamentals && git checkout intro-to-ingesting || { echo "Failed to checkout branch"; exit 1; }
12 |
13 | echo "Building training instance...."
14 |
15 | # Update and install required packages
16 | echo "Updating and installing required packages..."
17 | sudo apt-get update && apt install gpg -y; sudo mkdir -p /etc/apt/keyrings/; wget -q -O - https://apt.grafana.com/gpg.key | gpg --dearmor | sudo tee /etc/apt/keyrings/grafana.gpg > /dev/null; echo "deb [signed-by=/etc/apt/keyrings/grafana.gpg] https://apt.grafana.com stable main" | sudo tee /etc/apt/sources.list.d/grafana.list; sudo apt-get update && sudo apt-get install alloy; sudo apt-get install -y figlet; clear; echo -e "\e[32m$(figlet -f standard 'Intro to')\e[0m"; echo -e "\e[33m$(figlet -f standard 'Ingesting')\e[0m"
--------------------------------------------------------------------------------
/loki/intro-to-ingest/step1.md:
--------------------------------------------------------------------------------
1 |
2 | # Step 1: Demo environment setup
3 |
4 | The first thing we are going to do manually is spin up our Docker environment. This environment will be used to demonstrate how to ingest logs into Loki using the new Grafana Labs Alloy collector.
5 |
6 | ## Docker Compose
7 |
8 | We will be using Docker Compose to spin up our environment. Run the following command to start the environment:
9 |
10 | ```bash
11 | docker-compose up -d
12 | ```{{exec}}
13 | This will build the Docker images and start the containers. Once the containers are up and running. To check the status of the containers, run the following command:
14 |
15 | ```bash
16 | docker ps
17 | ```{{exec}}
18 |
19 | Which should output something similar to:
20 |
21 | ```plaintext
22 | CONTAINER ID IMAGE ... STATUS
23 | 392f00a18cf4 grafana/alloy:latest ... Up 34 seconds
24 | 60f6abe649a5 loki-fundamentals_carnivorous-garden ... Up 36 seconds
25 | c4a9ca220b0f grafana/loki:main-e9b6ce9 ... Up 36 seconds
26 | a32e179a44af grafana/grafana:11.0.0 ... Up 35 seconds
27 | ```
28 |
29 | ## Access our applications
30 |
31 | There are three application UI's that we will be using in this demo: Grafana, Alloy, and Carnivorous Greenhouse. Lets check if they are up and running:
32 | * Grafana: [http://localhost:3000]({{TRAFFIC_HOST1_3000}})
33 | * Alloy: [http://localhost:12345]({{TRAFFIC_HOST1_12345}})
34 | * Carnivorous Greenhouse: [http://localhost:5005]({{TRAFFIC_HOST1_5005}})
35 |
36 |
37 |
38 |
--------------------------------------------------------------------------------
/loki/intro-to-ingest/step4.md:
--------------------------------------------------------------------------------
1 | # Step 4: Alloy Migration Tool
2 |
3 | Lastly we are going to look at an example of how you can use the Alloy Migration tool to migrate your existing:
4 | * Promtail
5 | * OpenTelemetry Collector
6 | * Grafana Agent
7 | Configurations to Alloy..
8 |
9 | ## Alloy Migration Tool (Promtail)
10 |
11 | We have an example promtail config located in `promtail/config.yml`. We can use the Alloy Migration tool to convert this to an Alloy config.
12 |
13 | Lets first take a look at the promtail config:
14 | ```bash
15 | cat ./promtail/config.yml
16 | ```{{exec}}
17 |
18 | Next lets run the Alloy Migration tool to convert this to an Alloy config:
19 | ```bash
20 | alloy convert --source-format=promtail --output=./promtail/config.alloy ./promtail/config.yml
21 | ```{{exec}}
22 |
23 | Now we can take a look at the converted Alloy config:
24 | ```bash
25 | cat ./promtail/config.alloy
26 | ```{{exec}}
27 |
28 |
29 |
30 |
--------------------------------------------------------------------------------
/loki/intro-to-logging-fluentd-fluentbit/finish.md:
--------------------------------------------------------------------------------
1 | # Summary
2 |
3 | 
4 |
5 | Congratulations! You have completed the Introduction to Ingesting Logs with Loki (Otel) scenario.
6 |
7 | You have successfully learned how to ingest logs into Loki using the OpenTelemetry Collector.
8 |
9 | # What’s Next?
10 |
11 | Head back to the video to continue with Introduction to Ingesting Logs using OpenTelemetry with Loki.
12 |
13 | [](https://www.youtube.com/watch?v=snXhe1fDDa8)
14 |
--------------------------------------------------------------------------------
/loki/intro-to-logging-fluentd-fluentbit/index.json:
--------------------------------------------------------------------------------
1 | {
2 | "title": "Introduction to ingesting logs into Loki using Fluentd and Fluent Bit",
3 | "description": "Configuring Fluentd and Fluent bit to send logs to Loki.",
4 | "details": {
5 | "intro": {
6 | "text": "intro.md"
7 | },
8 | "steps": [
9 | {
10 | "text": "step1.md"
11 | },
12 | {
13 | "text": "step2.md"
14 | },
15 | {
16 | "text": "step3.md"
17 | },
18 | {
19 | "text": "step4.md"
20 | }
21 | ],
22 | "finish": {
23 | "text": "finish.md"
24 | }
25 | },
26 | "backend": {
27 | "imageid": "ubuntu"
28 | }
29 | }
30 |
--------------------------------------------------------------------------------
/loki/intro-to-logging-fluentd-fluentbit/step1.md:
--------------------------------------------------------------------------------
1 | # Step 1: Environment setup
2 |
3 | In this step, we will set up our environment by cloning the repository that contains our demo application and spinning up our observability stack using Docker Compose.
4 |
5 | 1. To get started, clone the repository that contains our demo application:
6 |
7 | ```bash
8 | git clone -b microservice-fluentd-fluentbit https://github.com/grafana/loki-fundamentals.git
9 | ```{{exec}}
10 |
11 | 1. Next we will spin up our observability stack using Docker Compose:
12 |
13 | ```bash
14 | docker-compose -f loki-fundamentals/docker-compose.yml up -d
15 | ```{{exec}}
16 |
17 | This will spin up the following services:
18 |
19 | ```bash
20 | ✔ Container loki-fundamentals_grafana_1 Started
21 | ✔ Container loki-fundamentals_loki_1 Started
22 | ✔ Container loki-fundamentals_fluentd_1 Started
23 | ✔ Container loki-fundamentals_fluent-bit_1 Started
24 | ```{{copy}}
25 |
--------------------------------------------------------------------------------
/loki/intro-to-logging-fluentd-fluentbit/step4.md:
--------------------------------------------------------------------------------
1 | # Step 4: Start the Carnivorous Greenhouse
2 |
3 | In this step, we will start the Carnivorous Greenhouse application. To start the application, run the following command:
4 |
5 | **Note: This docker-compose file relies on the `loki-fundamentals_loki`{{copy}} docker network. If you have not started the observability stack, you will need to start it first.**
6 |
7 | ```bash
8 | docker-compose -f loki-fundamentals/greenhouse/docker-compose-micro.yml up -d --build
9 | ```{{exec}}
10 |
11 | This will start the following services:
12 |
13 | ```bash
14 | ✔ Container greenhouse-db-1 Started
15 | ✔ Container greenhouse-websocket_service-1 Started
16 | ✔ Container greenhouse-bug_service-1 Started
17 | ✔ Container greenhouse-user_service-1 Started
18 | ✔ Container greenhouse-plant_service-1 Started
19 | ✔ Container greenhouse-simulation_service-1 Started
20 | ✔ Container greenhouse-main_app-1 Started
21 | ```{{copy}}
22 |
23 | Once started, you can access the Carnivorous Greenhouse application at [http://localhost:5005]({{TRAFFIC_HOST1_5005}}). Generate some logs by interacting with the application in the following ways:
24 |
25 | - Create a user
26 |
27 | - Log in
28 |
29 | - Create a few plants to monitor
30 |
31 | - Enable bug mode to activate the bug service. This will cause services to fail and generate additional logs.
32 |
33 | Finally to view the logs in Loki, navigate to the Loki Logs Explore view in Grafana at [http://localhost:3000/a/grafana-lokiexplore-app/explore]({{TRAFFIC_HOST1_3000}}/a/grafana-lokiexplore-app/explore).
34 |
--------------------------------------------------------------------------------
/loki/intro-to-logging/finished.md:
--------------------------------------------------------------------------------
1 | 
2 |
3 | # Intro to Logging
4 |
5 | You have completed the **Intro to Logging** task. This course is part of an **Intro to Grafana Loki** series. In this course, you learned the basics of logging and how to use Grafana Loki to store and query your logs.
6 |
7 | ## What's Next?
8 |
9 | Head back to the video to continue with Intro to logging.
10 |
11 | [](https://www.youtube.com/watch?v=TLnH7efQNd0)
12 |
13 |
--------------------------------------------------------------------------------
/loki/intro-to-logging/index.json:
--------------------------------------------------------------------------------
1 | {
2 | "title": "Intro to Logging",
3 | "description": "This sandbox will teach you how to locate logs on an a Linux server.",
4 | "details": {
5 | "intro": {
6 | "text": "intro.md"
7 | },
8 | "steps": [
9 | {
10 | "text": "step1.md"
11 | }
12 | ],
13 | "finish": {
14 | "text": "finished.md"
15 | }
16 | }
17 | ,
18 | "backend": {
19 | "imageid": "ubuntu"
20 | }
21 | }
--------------------------------------------------------------------------------
/loki/intro-to-logging/intro.md:
--------------------------------------------------------------------------------
1 | 
2 |
3 |
4 | # Welcome to Intro to Logging
5 |
6 | This course is part of an **Intro to Grafana Loki** series. In this course, you will learn the basics of logging and how to use Grafana Loki to store and query your logs.
7 |
8 | ## The Video
9 |
10 | [](https://www.youtube.com/watch?v=TLnH7efQNd0)
11 |
12 |
13 | ## Sandbox Overview
14 |
15 | This sandbox will teach you how to locate logs on an a Linux server.
16 |
--------------------------------------------------------------------------------
/loki/intro-to-logging/step1.md:
--------------------------------------------------------------------------------
1 | # Step 1: Common Log locations
2 |
3 | The first step in locating logs is to know where to look. In this lesson, we will cover the most common log locations on a Linux server.
4 |
5 | ## /var/log
6 |
7 | The `/var/log` directory is the most common location for log files on a Linux server. This directory contains log files for various system services, including the kernel, system, and application logs.
8 |
9 | Lets take a look at the contents of the `/var/log` directory:
10 |
11 | ```
12 | ls /var/log
13 | ```{{exec}}
14 |
15 | ## /var/log/syslog
16 |
17 | The `/var/log/syslog` file contains messages from the Linux kernel and system services. This file is a good place to start when troubleshooting system issues.
18 |
19 | Lets take a look at the contents of the `/var/log/syslog` file:
20 |
21 | ```
22 | cat /var/log/syslog
23 | ```{{exec}}
24 |
25 |
26 |
27 |
--------------------------------------------------------------------------------
/loki/k8s-monitoring-helm/finish.md:
--------------------------------------------------------------------------------
1 | # Conclusion
2 |
3 | In this tutorial, you learned how to deploy Loki, Grafana, and the Kubernetes Monitoring Helm chart to collect and store logs from a Kubernetes cluster. We have deployed a minimal test version of each of these Helm charts to demonstrate how quickly you can get started with Loki. It is now worth exploring each of these Helm charts in more detail to understand how to scale them to meet your production needs:
4 |
5 | - [Loki Helm chart](https://grafana.com/docs/loki/latest/setup/install/helm/)
6 | - [Grafana Helm chart](https://grafana.com/docs/grafana/latest/installation/helm/)
7 | - [Kubernetes Monitoring Helm chart](https://grafana.com/docs/grafana-cloud/monitor-infrastructure/kubernetes-monitoring/)
8 |
--------------------------------------------------------------------------------
/loki/k8s-monitoring-helm/index.json:
--------------------------------------------------------------------------------
1 | {
2 | "title": "Kubernetes Monitoring Helm",
3 | "description": "Learn how to collect and store logs from your Kubernetes cluster using Loki.",
4 | "details": {
5 | "intro": {
6 | "text": "intro.md"
7 | },
8 | "steps": [
9 | {
10 | "text": "step1.md"
11 | },
12 | {
13 | "text": "step2.md"
14 | },
15 | {
16 | "text": "step3.md"
17 | },
18 | {
19 | "text": "step4.md"
20 | },
21 | {
22 | "text": "step5.md"
23 | },
24 | {
25 | "text": "step6.md"
26 | },
27 | {
28 | "text": "step7.md"
29 | },
30 | {
31 | "text": "step8.md"
32 | }
33 | ],
34 | "finish": {
35 | "text": "finish.md"
36 | }
37 | },
38 | "backend": {
39 | "imageid": "kubernetes-kubeadm-2nodes"
40 | }
41 | }
42 |
--------------------------------------------------------------------------------
/loki/k8s-monitoring-helm/step1.md:
--------------------------------------------------------------------------------
1 | # Create the `meta`{{copy}} and `prod`{{copy}} namespaces
2 |
3 | The K8s Monitoring Helm chart will monitor two namespaces: `meta`{{copy}} and `prod`{{copy}}:
4 |
5 | - `meta`{{copy}} namespace: This namespace will be used to deploy Loki, Grafana, and Alloy.
6 | - `prod`{{copy}} namespace: This namespace will be used to deploy the sample application that will generate logs.
7 |
8 | Create the `meta`{{copy}} and `prod`{{copy}} namespaces by running the following command:
9 |
10 | ```bash
11 | kubectl create namespace meta && kubectl create namespace prod
12 | ```{{exec}}
13 |
--------------------------------------------------------------------------------
/loki/k8s-monitoring-helm/step2.md:
--------------------------------------------------------------------------------
1 | # Add the Grafana Helm repository
2 |
3 | All three Helm charts (Loki, Grafana, and the Kubernetes Monitoring Helm) are available in the Grafana Helm repository. Add the Grafana Helm repository by running the following command:
4 |
5 | ```bash
6 | helm repo add grafana https://grafana.github.io/helm-charts && helm repo update
7 | ```{{exec}}
8 |
9 | As well as adding the repo to your local helm list, you should also run `helm repo update`{{copy}} to ensure you have the latest version of the charts.
10 |
11 | # Clone the tutorial repository
12 |
13 | Clone the tutorial repository by running the following command:
14 |
15 | ```bash
16 | git clone https://github.com/grafana/alloy-scenarios.git
17 | ```{{exec}}
18 |
19 | Then change directories to the `alloy-scenarios/k8s/logs`{{copy}} directory:
20 |
21 | ```bash
22 | cd alloy-scenarios/k8s/logs
23 | ```{{exec}}
24 |
25 | **The rest of this tutorial assumes you are in the `alloy-scenarios/k8s/logs`{{copy}} directory.**
26 |
--------------------------------------------------------------------------------
/loki/k8s-monitoring-helm/step3.md:
--------------------------------------------------------------------------------
1 | # Deploy Loki
2 |
3 | Grafana Loki will be used to store our collected logs. In this tutorial we will deploy Loki with a minimal footprint and use the default storage backend provided by the Loki Helm chart, MinIO.
4 |
5 | > **Note**: Due to the resource constraints of the Kubernetes cluster running in the playground, we are deploying Loki using a custom values file. This values file reduces the resource requirements of Loki. This turns off features such as cache and Loki Canary, and runs Loki with limited resources. This can take up to **1 minute** to complete.
6 |
7 | To deploy Loki run the following command:
8 |
9 | ```bash
10 | helm install --values killercoda/loki-values.yml loki grafana/loki -n meta
11 | ```{{exec}}
12 |
13 | This command will deploy Loki in the `meta`{{copy}} namespace. The command also includes a `values`{{copy}} file that specifies the configuration for Loki. For more details on how to configure the Loki Helm chart refer to the Loki Helm [documentation](https://grafana.com/docs/loki/latest/setup/install/helm).
14 |
--------------------------------------------------------------------------------
/loki/k8s-monitoring-helm/step6.md:
--------------------------------------------------------------------------------
1 | # Accessing Grafana
2 |
3 | To access Grafana, you will need to port-forward the Grafana service to your local machine. To do this, run the following command:
4 |
5 | ```bash
6 | export POD_NAME=$(kubectl get pods --namespace meta -l "app.kubernetes.io/name=grafana,app.kubernetes.io/instance=grafana" -o jsonpath="{.items[0].metadata.name}") && \
7 | kubectl --namespace meta port-forward $POD_NAME 3000 --address 0.0.0.0
8 | ```{{exec}}
9 |
10 | > **Tip:**
11 | > This will make your terminal unusable until you stop the port-forwarding process. To stop the process, press `Ctrl + C`{{copy}}.
12 |
13 | This command will port-forward the Grafana service to your local machine on port `3000`{{copy}}.
14 |
15 | You can now access Grafana by navigating to [http://localhost:3000]({{TRAFFIC_HOST1_3000}}) in your browser. The default credentials are `admin`{{copy}} and `adminadminadmin`{{copy}}.
16 |
17 | One of the first places you should visit is Logs Drilldown which lets you automatically visualize and explore your logs without having to write queries:
18 | [http://localhost:3000/a/grafana-lokiexplore-app]({{TRAFFIC_HOST1_3000}}/a/grafana-lokiexplore-app)
19 |
20 | 
21 |
--------------------------------------------------------------------------------
/loki/k8s-monitoring-helm/step7.md:
--------------------------------------------------------------------------------
1 | # (Optional) View the Alloy UI
2 |
3 | The Kubernetes Monitoring Helm chart deploys Grafana Alloy to collect and forward telemetry data from the Kubernetes cluster. The Helm chart is designed to abstract you away from creating an Alloy configuration file. However if you would like to understand the pipeline you can view the Alloy UI. To access the Alloy UI, you will need to port-forward the Alloy service to your local machine. To do this, run the following command:
4 |
5 | ```bash
6 | export POD_NAME=$(kubectl get pods --namespace meta -l "app.kubernetes.io/name=alloy-logs,app.kubernetes.io/instance=k8s" -o jsonpath="{.items[0].metadata.name}") && \
7 | kubectl --namespace meta port-forward $POD_NAME 12345 --address 0.0.0.0
8 | ```{{exec}}
9 |
10 | > **Tip:**
11 | > This will make your terminal unusable until you stop the port-forwarding process. To stop the process, press `Ctrl + C`{{copy}}.
12 |
13 | This command will port-forward the Alloy service to your local machine on port `12345`{{copy}}. You can access the Alloy UI by navigating to [http://localhost:12345]({{TRAFFIC_HOST1_12345}}) in your browser.
14 |
15 | 
16 |
--------------------------------------------------------------------------------
/loki/k8s-monitoring-helm/step8.md:
--------------------------------------------------------------------------------
1 | # Adding a sample application to `prod`{{copy}}
2 |
3 | Finally, lets deploy a sample application to the `prod`{{copy}} namespace that will generate some logs. To deploy the sample application run the following command:
4 |
5 | ```bash
6 | helm install tempo grafana/tempo-distributed -n prod
7 | ```{{exec}}
8 |
9 | This will deploy a default version of Grafana Tempo to the `prod`{{copy}} namespace. Tempo is a distributed tracing backend that is used to store and query traces. Normally Tempo would sit alongside Loki and Grafana in the `meta`{{copy}} namespace, but for the purpose of this tutorial, we will pretend this is the primary application generating logs.
10 |
11 | Once deployed lets expose Grafana once more:
12 |
13 | ```bash
14 | export POD_NAME=$(kubectl get pods --namespace meta -l "app.kubernetes.io/name=grafana,app.kubernetes.io/instance=grafana" -o jsonpath="{.items[0].metadata.name}") && \
15 | kubectl --namespace meta port-forward $POD_NAME 3000 --address 0.0.0.0
16 | ```{{exec}}
17 |
18 | and navigate to [http://localhost:3000/a/grafana-lokiexplore-app]({{TRAFFIC_HOST1_3000}}/a/grafana-lokiexplore-app) to view Grafana Tempo logs.
19 |
20 | 
21 |
--------------------------------------------------------------------------------
/loki/logcli-tutorial/finish.md:
--------------------------------------------------------------------------------
1 | # Conclusion
2 |
3 | In this tutorial as site manager for a logistics company, we have successfully used LogCLI to query logs and build a report on the overall health of the shipments. We have also used meta queries to better understand our data cleanliness and query performance. The LogCLI is a powerful tool for understanding your logs and how they are stored in Loki, as you continue to scale your solution remember to keep LogCLI in mind to monitor cardinality and query performance.
4 |
--------------------------------------------------------------------------------
/loki/logcli-tutorial/index.json:
--------------------------------------------------------------------------------
1 | {
2 | "title": "LogCLI tutorial",
3 | "description": "Learn how to use LogCLI to query logs in Grafana Loki.",
4 | "details": {
5 | "intro": {
6 | "text": "intro.md",
7 | "foreground": "setup.sh"
8 | },
9 | "steps": [
10 | {
11 | "text": "step1.md"
12 | },
13 | {
14 | "text": "step2.md"
15 | },
16 | {
17 | "text": "step3.md"
18 | },
19 | {
20 | "text": "step4.md"
21 | }
22 | ],
23 | "finish": {
24 | "text": "finish.md"
25 | }
26 | },
27 | "backend": {
28 | "imageid": "ubuntu"
29 | }
30 | }
31 |
--------------------------------------------------------------------------------
/loki/logcli-tutorial/intro.md:
--------------------------------------------------------------------------------
1 | # LogCLI tutorial
2 |
3 | This [LogCLI](https://grafana.com/docs/loki/latest/query/logcli/) tutorial will walk you through the following concepts:
4 |
5 | - Querying logs
6 | - Meta Queries against your Loki instance
7 | - Queries against static log files
8 |
9 | ## Scenario
10 |
11 | You are a site manager for a new logistics company. The company uses structured logs to keep track of every shipment sent and received. The payload format looks like this:
12 |
13 | ```json
14 | {"timestamp": "2024-11-22T13:22:56.377884", "state": "New York", "city": "Buffalo", "package_id": "PKG34245", "package_type": "Documents", "package_size": "Medium", "package_status": "error", "note": "Out for delivery", "sender": {"name": "Sender27", "address": "144 Elm St, Buffalo, New York"}, "receiver": {"name": "Receiver4", "address": "260 Cedar Blvd, New York City, New York"}}
15 | ```{{copy}}
16 |
17 | The logs are processed from Grafana Alloy to extract labels and structured metadata before they're stored in Loki. You have been tasked with monitoring the logs using the LogCLI and build a report on the overall health of the shipments.
18 |
--------------------------------------------------------------------------------
/loki/logcli-tutorial/setup.sh:
--------------------------------------------------------------------------------
1 | #!/bin/sh
2 | set -euf
3 | (set -o pipefail 2> /dev/null) && set -o pipefail
4 | sudo install -m 0755 -d /etc/apt/keyrings
5 | sudo curl -fsSL https://download.docker.com/linux/ubuntu/gpg -o /etc/apt/keyrings/docker.asc
6 | sudo chmod a+r /etc/apt/keyrings/docker.asc
7 | ARCH="$(dpkg --print-architecture)"
8 | VERSION_CODENAME="$(source /etc/os-release && echo "${VERSION_CODENAME}")"
9 | readonly ARCH VERSION_CODENAME
10 | printf 'deb [arch=%s signed-by=/etc/apt/keyrings/docker.asc] https://download.docker.com/linux/ubuntu %s stable' "${ARCH}" "${VERSION_CODENAME}" | sudo tee /etc/apt/sources.list.d/docker.list > /dev/null
11 | sudo apt-get update && sudo apt-get install -y docker-compose-plugin && \
12 | wget https://github.com/grafana/loki/releases/download/v3.3.0/logcli_3.3.0_amd64.deb && \
13 | sudo dpkg -i logcli_3.3.0_amd64.deb && clear && echo "Setup complete. You may now begin the tutorial."
--------------------------------------------------------------------------------
/loki/logcli-tutorial/step4.md:
--------------------------------------------------------------------------------
1 | # Queries against static log files
2 |
3 | In addition to querying logs from Loki, LogCLI also supports querying static log files. This can be useful for querying logs that are not stored in Loki. Earlier in the tutorial we stored the logs in the `./inventory`{{copy}} directory. Lets run a similar query but pipe it into a log file:
4 |
5 | ```bash
6 | logcli query \
7 | --timezone=UTC \
8 | --parallel-duration="12h" \
9 | --parallel-max-workers="4" \
10 | --part-path-prefix="./inventory/inv" \
11 | --since=24h \
12 | --merge-parts \
13 | --output=raw \
14 | '{service_name="Delivery World"}' > ./inventory/complete.log
15 | ```{{exec}}
16 |
17 | Next lets run a query against the static log file:
18 |
19 | ```bash
20 | cat ./inventory/complete.log | logcli --stdin query '{service_name="Delivery World"} | json | package_status="critical"'
21 | ```{{exec}}
22 |
23 | Note that since we are querying a static log file, labels are not automatically detected:
24 |
25 | - `{service_name="Delivery World"}`{{copy}} is optional in this case but is recommended for clarity.
26 | - `json`{{copy}} is required to parse the log file as JSON. This lets us extract the `package_status`{{copy}} field.
27 |
28 | For example, suppose we try to query the log file without the `json`{{copy}} filter:
29 |
30 | ```bash
31 | cat ./inventory/complete.log | logcli --stdin query '{service_name="Delivery World"} | package_status="critical"'
32 | ```{{exec}}
33 |
34 | This will return no results as the `package_status`{{copy}} field is not detected.
35 |
--------------------------------------------------------------------------------
/loki/loki-getting-started-tutorial/index.json:
--------------------------------------------------------------------------------
1 | {
2 | "title": "Loki Tutorial",
3 | "description": "An expanded quick start tutorial taking you though core functions of the Loki stack.",
4 | "details": {
5 | "intro": {
6 | "text": "intro.md",
7 | "foreground": "setup.sh"
8 | },
9 | "steps": [
10 | {
11 | "text": "step1.md"
12 | },
13 | {
14 | "text": "step2.md"
15 | },
16 | {
17 | "text": "step3.md"
18 | },
19 | {
20 | "text": "step4.md"
21 | },
22 | {
23 | "text": "step5.md"
24 | },
25 | {
26 | "text": "step6.md"
27 | },
28 | {
29 | "text": "step7.md"
30 | },
31 | {
32 | "text": "step8.md"
33 | }
34 | ],
35 | "finish": {
36 | "text": "finish.md"
37 | }
38 | },
39 | "backend": {
40 | "imageid": "ubuntu"
41 | }
42 | }
43 |
--------------------------------------------------------------------------------
/loki/loki-getting-started-tutorial/intro.md:
--------------------------------------------------------------------------------
1 | # Loki Tutorial
2 |
3 | This quickstart guide will walk you through deploying Loki in single binary mode (also known as [monolithic mode](https://grafana.com/docs/loki/latest/get-started/deployment-modes/#monolithic-mode)) using Docker Compose. Grafana Loki is only one component of the Grafana observability stack for logs. In this tutorial we will refer to this stack as the **Loki stack**.
4 |
5 | 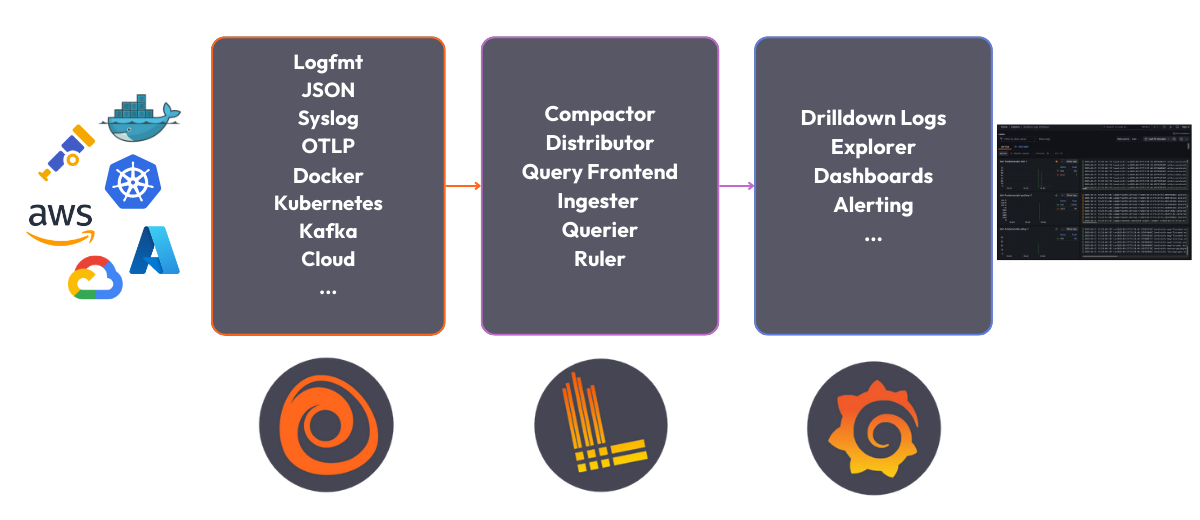
6 |
7 | The Loki stack consists of the following components:
8 |
9 | - **Alloy**: [Grafana Alloy](https://grafana.com/docs/alloy/latest/) is an open source telemetry collector for metrics, logs, traces, and continuous profiles. In this quickstart guide Grafana Alloy has been configured to tail logs from all Docker containers and forward them to Loki.
10 | - **Loki**: A log aggregation system to store the collected logs. For more information on what Loki is, see the [Loki overview](https://grafana.com/docs/loki/latest/get-started/overview/).
11 | - **Grafana**: [Grafana](https://grafana.com/docs/grafana/latest/) is an open-source platform for monitoring and observability. Grafana will be used to query and visualize the logs stored in Loki.
12 |
--------------------------------------------------------------------------------
/loki/loki-getting-started-tutorial/setup.sh:
--------------------------------------------------------------------------------
1 | #!/bin/sh
2 |
3 | set -euf
4 | # shellcheck disable=SC3040
5 | (set -o pipefail 2> /dev/null) && set -o pipefail && sudo install -m 0755 -d /etc/apt/keyrings && \
6 | sudo curl -fsSL https://download.docker.com/linux/ubuntu/gpg -o /etc/apt/keyrings/docker.asc && \
7 | sudo chmod a+r /etc/apt/keyrings/docker.asc && \
8 | ARCH="$(dpkg --print-architecture)" && \
9 | VERSION_CODENAME="$(source /etc/os-release && echo "${VERSION_CODENAME}")" && \
10 | readonly ARCH VERSION_CODENAME && \
11 | printf 'deb [arch=%s signed-by=/etc/apt/keyrings/docker.asc] https://download.docker.com/linux/ubuntu %s stable' "${ARCH}" "${VERSION_CODENAME}" | sudo tee /etc/apt/sources.list.d/docker.list > /dev/null && \
12 | sudo apt-get update && \
13 | sudo apt-get install -y docker-compose-plugin
--------------------------------------------------------------------------------
/loki/loki-getting-started-tutorial/step1.md:
--------------------------------------------------------------------------------
1 | # Deploy the Loki stack
2 |
3 | **To deploy the Loki stack locally, follow these steps:**
4 |
5 | 1. Clone the Loki fundamentals repository and check out the getting-started branch:
6 |
7 | ```bash
8 | git clone https://github.com/grafana/loki-fundamentals.git -b getting-started
9 | ```{{exec}}
10 | 1. Change to the `loki-fundamentals`{{copy}} directory:
11 |
12 | ```bash
13 | cd loki-fundamentals
14 | ```{{exec}}
15 | 1. With `loki-fundamentals`{{copy}} as the current working directory deploy Loki, Alloy, and Grafana using Docker Compose:
16 |
17 | ```bash
18 | docker compose up -d
19 | ```{{exec}}
20 |
21 | After running the command, you should see a similar output:
22 |
23 | ```console
24 | ✔ Container loki-fundamentals-grafana-1 Started 0.3s
25 | ✔ Container loki-fundamentals-loki-1 Started 0.3s
26 | ✔ Container loki-fundamentals-alloy-1 Started 0.4s
27 | ```{{copy}}
28 | 1. With the Loki stack running, you can now verify each component is up and running:
29 |
30 | - **Alloy**: Open a browser and navigate to [http://localhost:12345/graph]({{TRAFFIC_HOST1_12345}}/graph). You should see the Alloy UI.
31 | - **Grafana**: Open a browser and navigate to [http://localhost:3000]({{TRAFFIC_HOST1_3000}}). You should see the Grafana home page.
32 | - **Loki**: Open a browser and navigate to [http://localhost:3100/metrics]({{TRAFFIC_HOST1_3100}}/metrics). You should see the Loki metrics page.
33 |
--------------------------------------------------------------------------------
/loki/loki-getting-started-tutorial/step2.md:
--------------------------------------------------------------------------------
1 | Since Grafana Alloy is configured to tail logs from all Docker containers, Loki should already be receiving logs. The best place to verify log collection is using the Grafana Logs Drilldown feature. To do this, navigate to [http://localhost:3000/drilldown]({{TRAFFIC_HOST1_3000}}/drilldown). Select **Logs**. You should see the Grafana Logs Drilldown page.
2 |
3 | 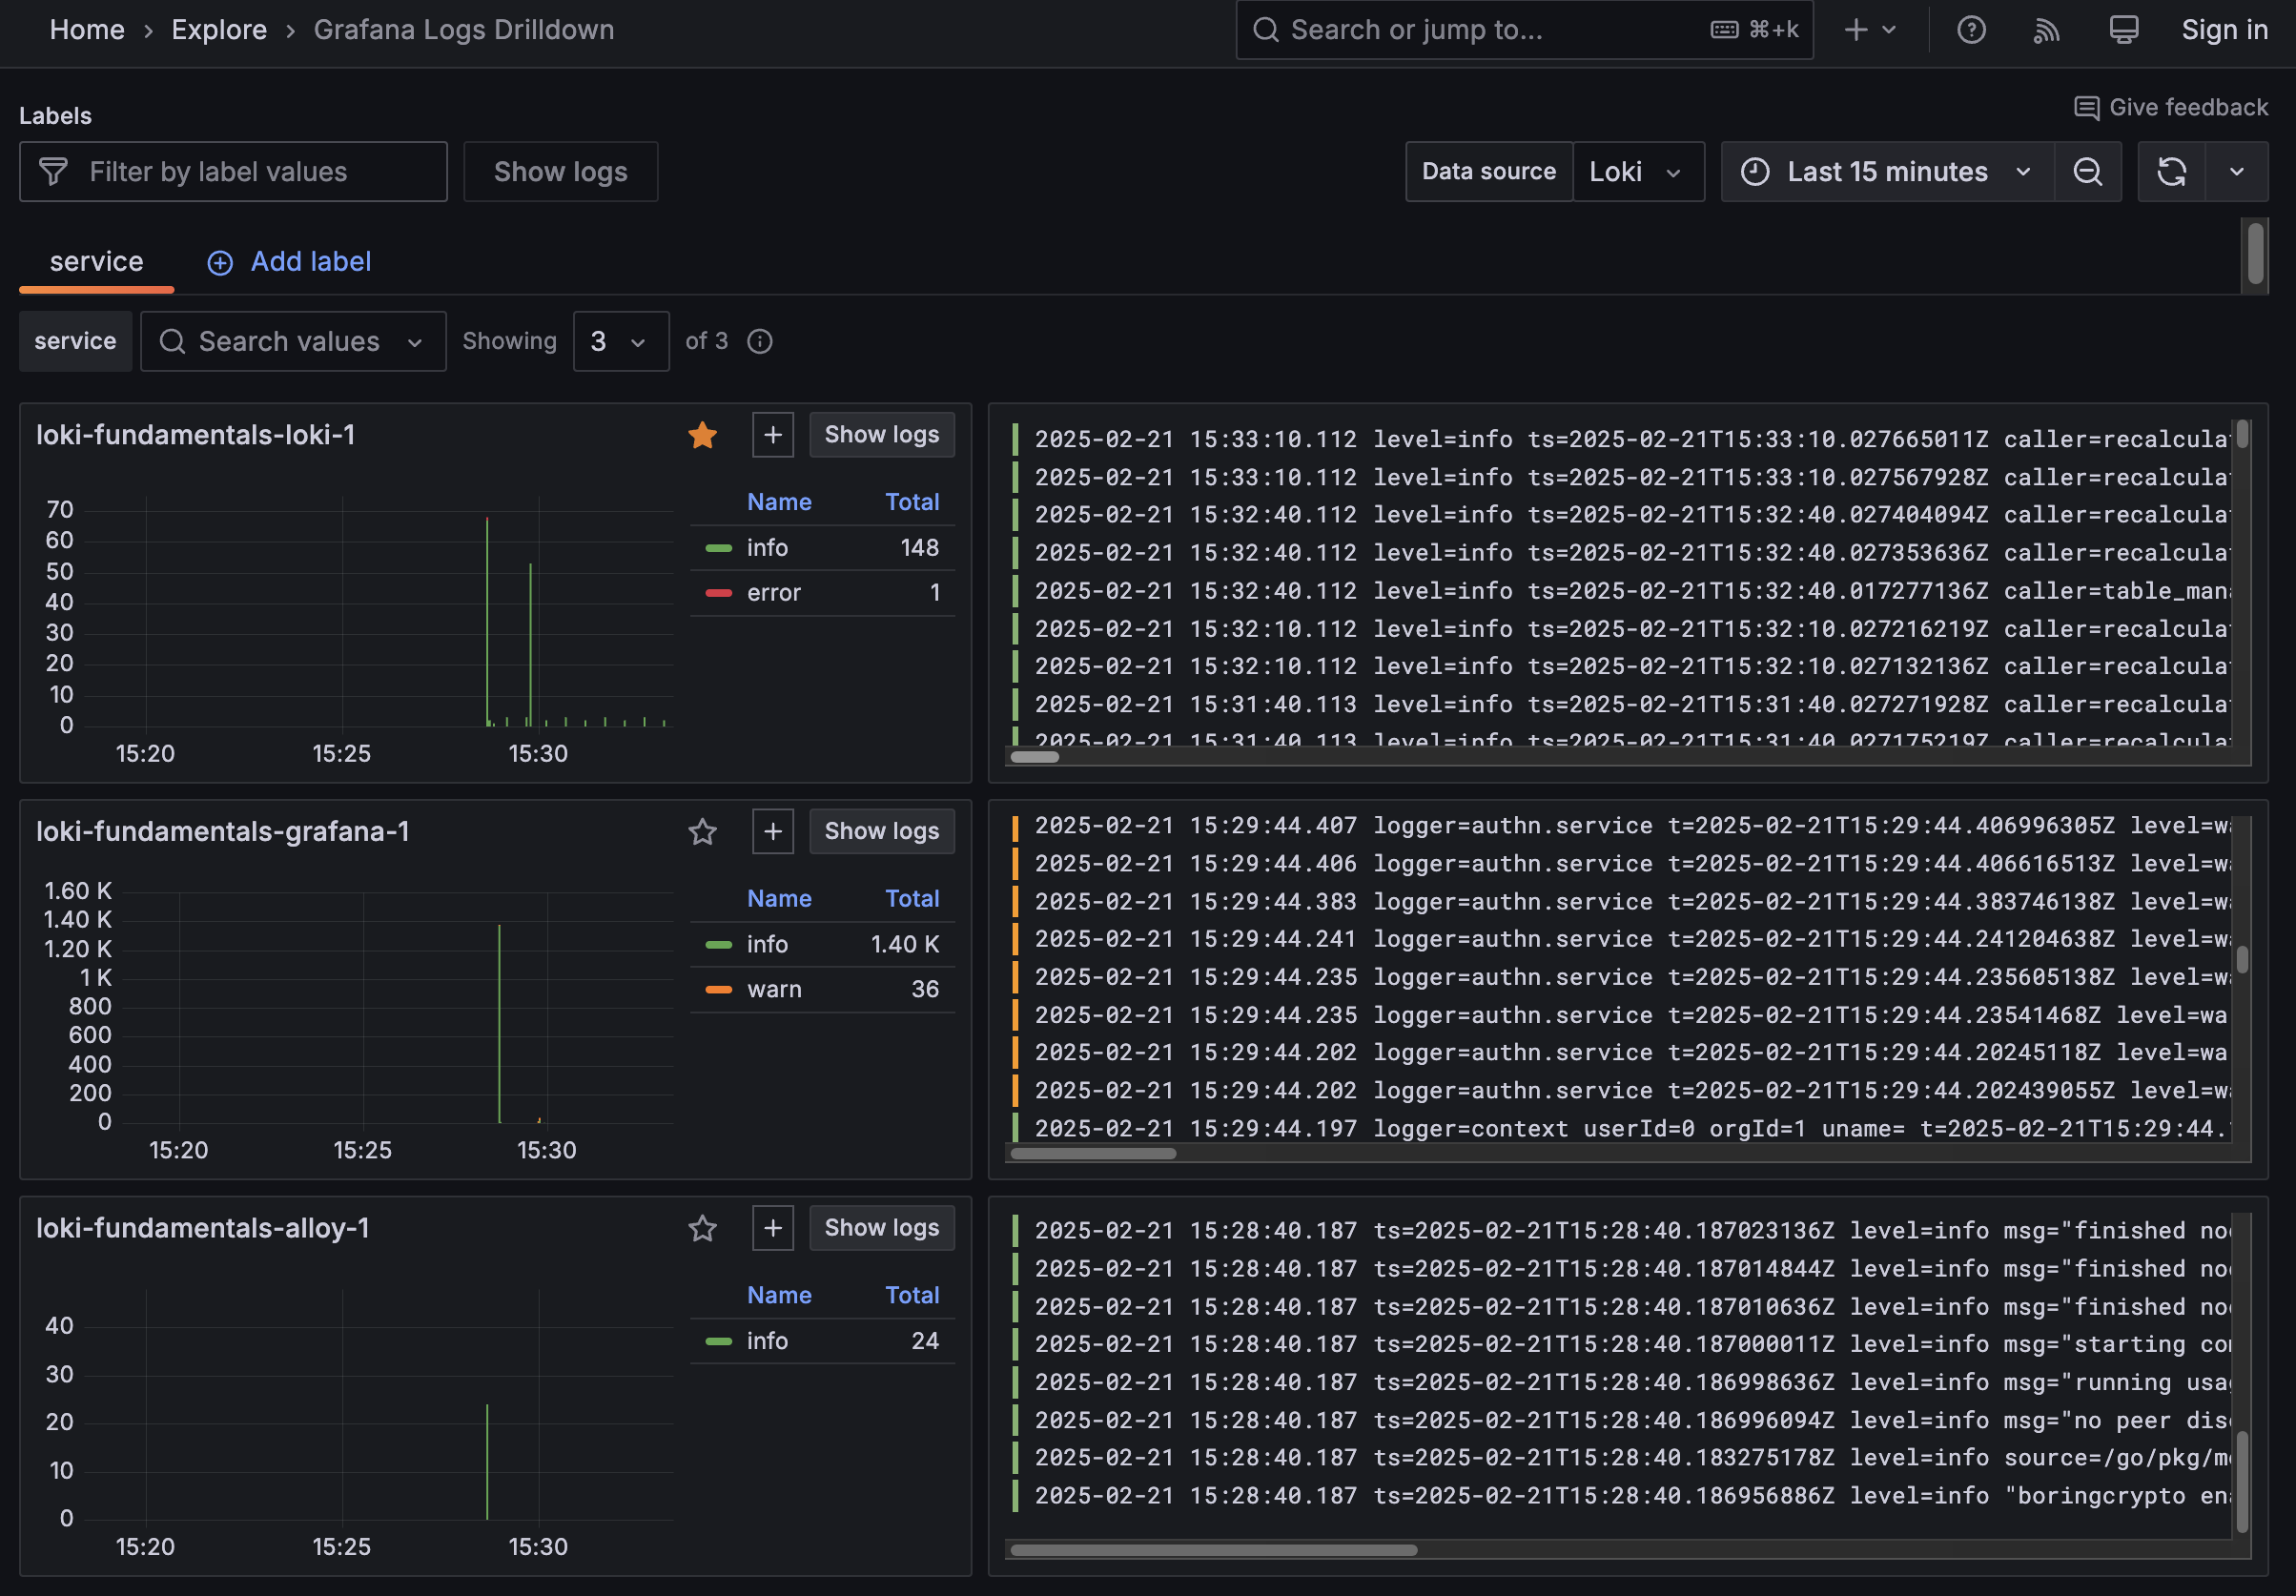
4 |
5 | If you have only the getting started demo deployed in your Docker environment, you should see three containers and their logs; `loki-fundamentals-alloy-1`{{copy}}, `loki-fundamentals-grafana-1`{{copy}} and `loki-fundamentals-loki-1`{{copy}}. In the `loki-fundamentals-loki-1`{{copy}} container, click **Show Logs** to drill down into the logs for that container.
6 |
7 | 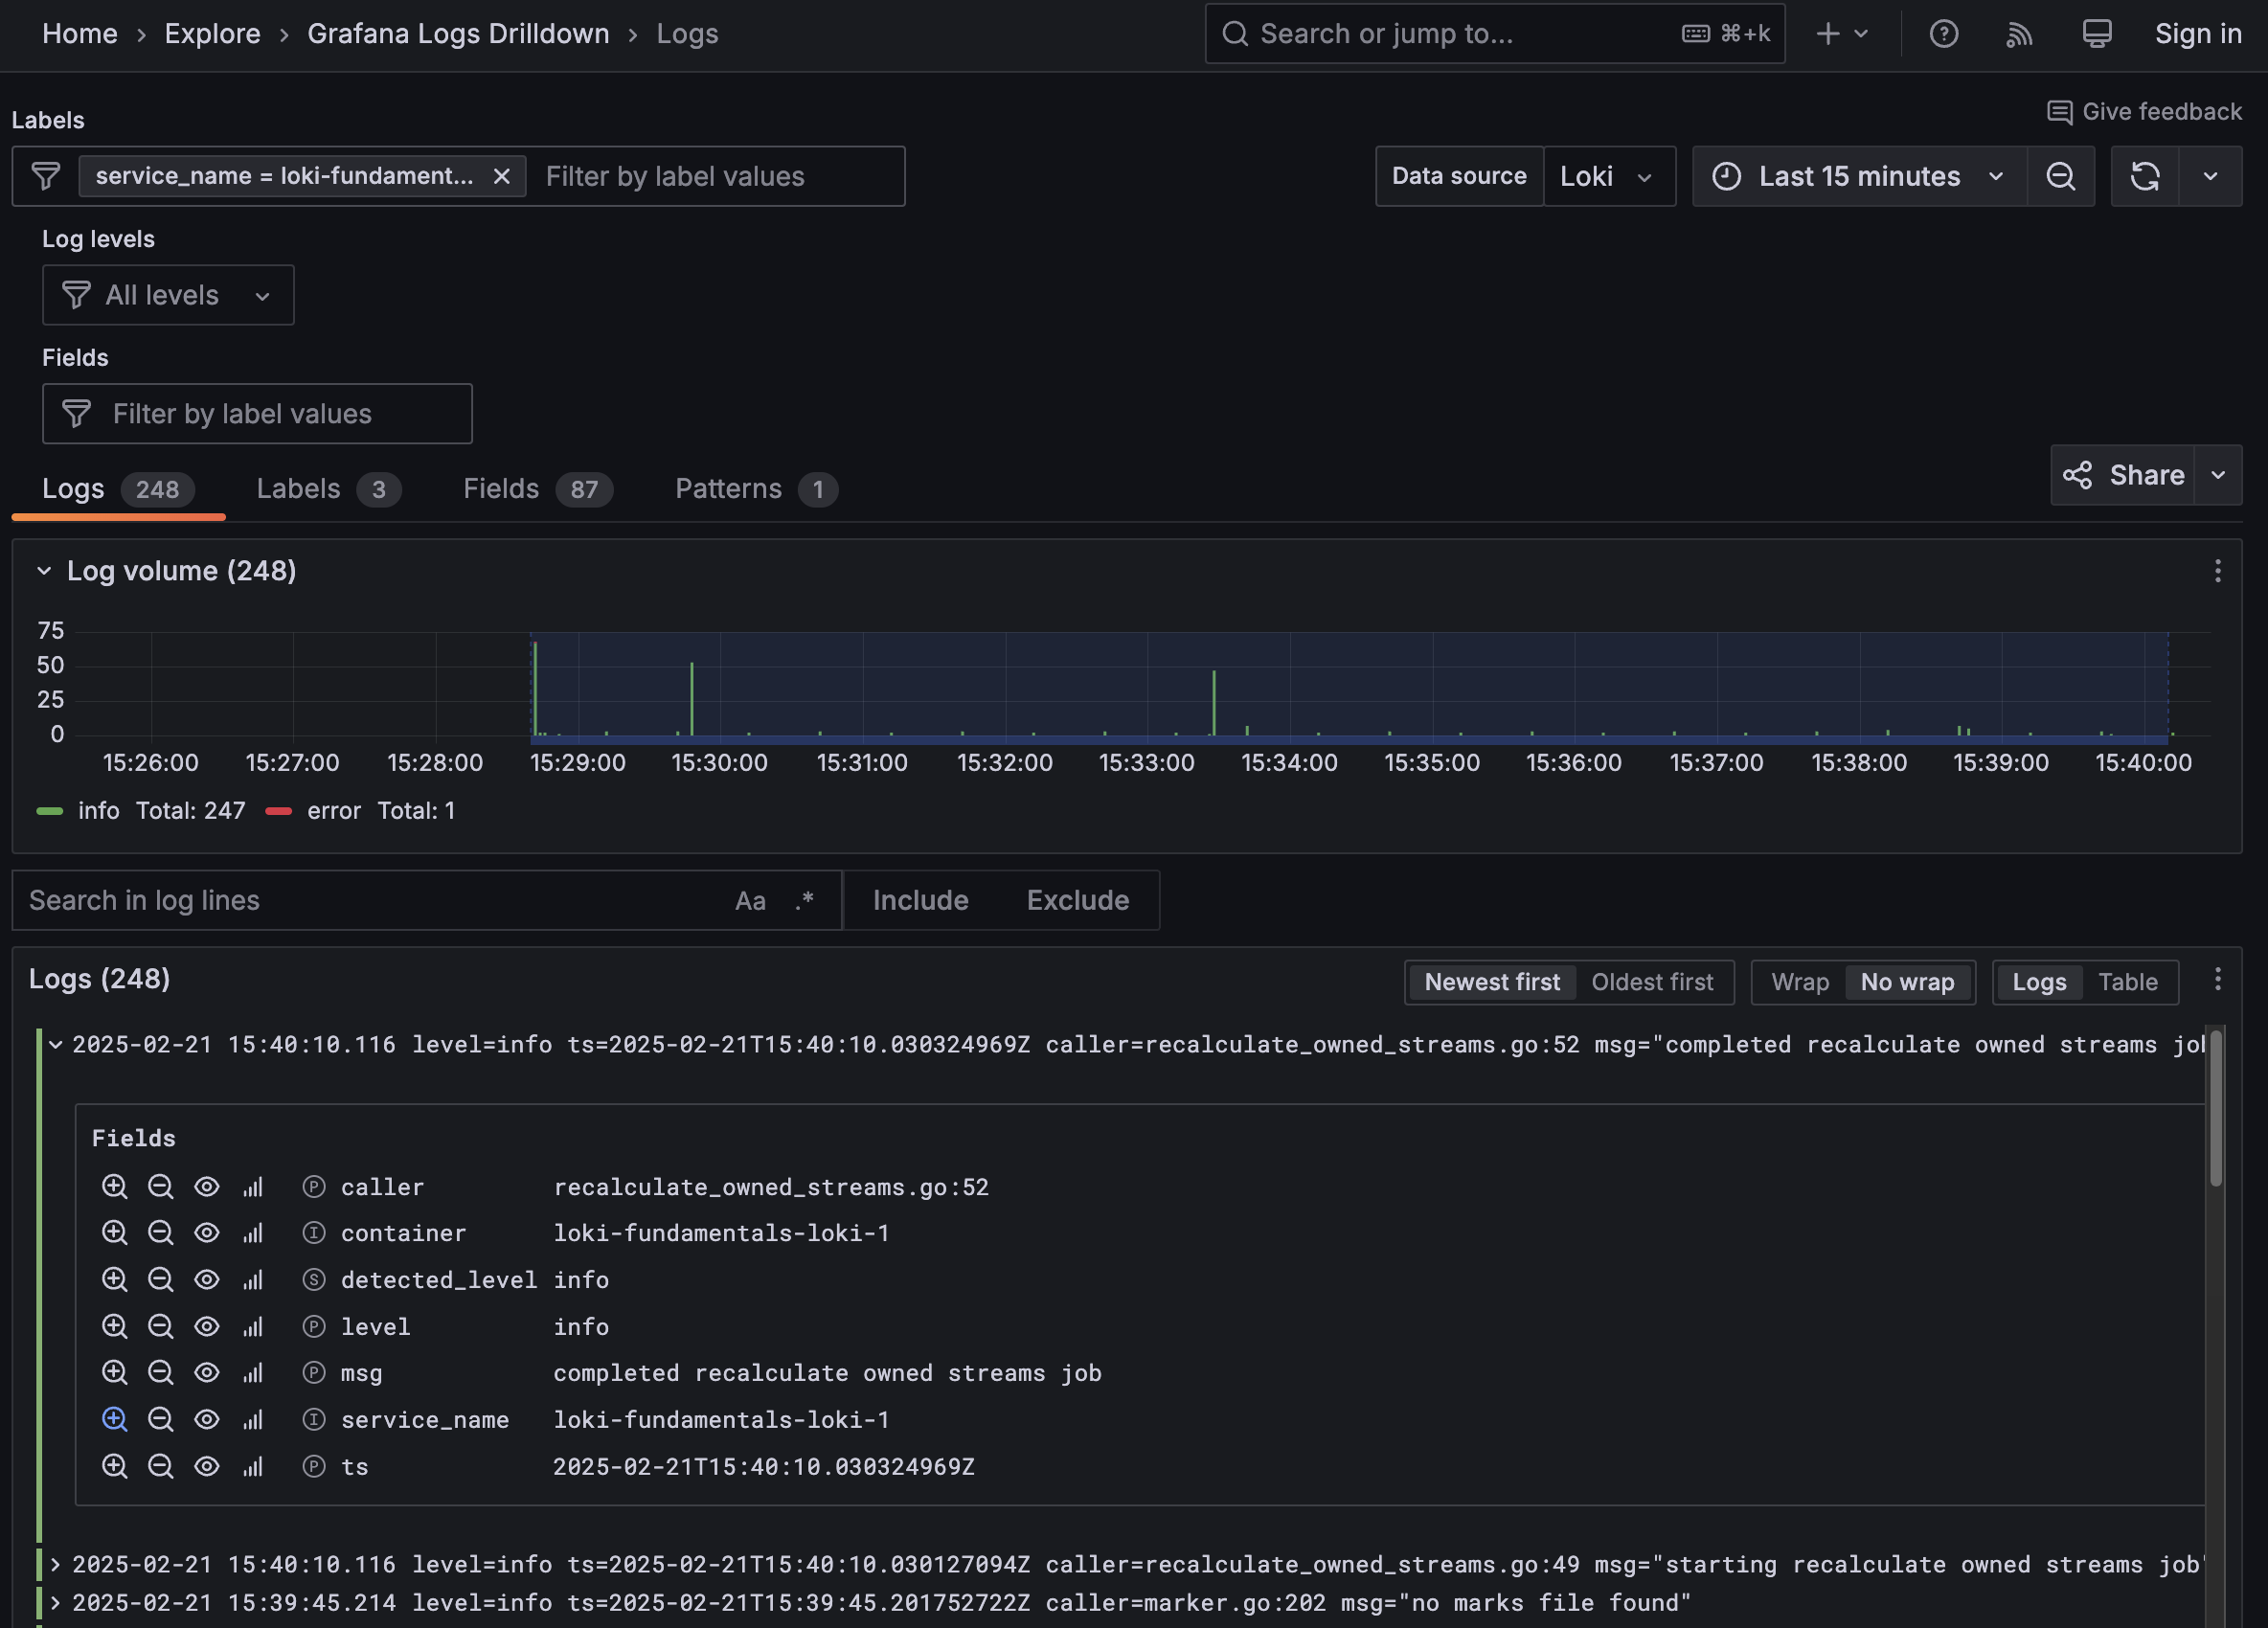
8 |
9 | We will not cover the rest of the Grafana Logs Drilldown features in this quickstart guide. For more information on how to use the Grafana Logs Drilldown feature, refer to [Get started with Grafana Logs Drilldown](https://grafana.com/docs/grafana/latest/explore/simplified-exploration/logs/get-started/).
10 |
--------------------------------------------------------------------------------
/loki/loki-quickstart/finish.md:
--------------------------------------------------------------------------------
1 | # Complete metrics, logs, traces, and profiling example
2 |
3 | You have completed the Loki Quickstart demo. So where to go next?
4 |
5 | # Back to docs
6 |
7 | Head back to where you started from to continue with the Loki documentation: [Loki documentation](https://grafana.com/docs/loki/latest/get-started/quick-start/).
8 |
9 | If you would like to run a demonstration environment that includes Mimir, Loki, Tempo, and Grafana, you can use [Introduction to Metrics, Logs, Traces, and Profiling in Grafana](https://github.com/grafana/intro-to-mlt).
10 | It's a self-contained environment for learning about Mimir, Loki, Tempo, and Grafana.
11 |
12 | The project includes detailed explanations of each component and annotated configurations for a single-instance deployment.
13 | You can also push the data from the environment to [Grafana Cloud](https://grafana.com/cloud/).
14 |
--------------------------------------------------------------------------------
/loki/loki-quickstart/index.json:
--------------------------------------------------------------------------------
1 | {
2 | "title": "Loki Quickstart Demo",
3 | "description": "This sandbox provides an online enviroment for testing the Loki quickstart demo.",
4 | "details": {
5 | "intro": {
6 | "text": "intro.md",
7 | "foreground": "setup.sh"
8 | },
9 | "steps": [
10 | {
11 | "text": "step1.md"
12 | },
13 | {
14 | "text": "step2.md"
15 | }
16 | ],
17 | "finish": {
18 | "text": "finish.md"
19 | }
20 | },
21 | "backend": {
22 | "imageid": "ubuntu"
23 | }
24 | }
25 |
--------------------------------------------------------------------------------
/loki/loki-quickstart/intro.md:
--------------------------------------------------------------------------------
1 | # Quickstart to run Loki locally
2 |
3 | If you want to experiment with Loki, you can run Loki locally using the Docker Compose file that ships with Loki. It runs Loki in a [monolithic deployment](https://grafana.com/docs/loki/latest/get-started/deployment-modes/#monolithic-mode) mode and includes a sample application to generate logs.
4 |
5 | The Docker Compose configuration runs the following components, each in its own container:
6 |
7 | - **flog**: which generates log lines.
8 | [flog](https://github.com/mingrammer/flog) is a log generator for common log formats.
9 | - **Grafana Alloy**: which scrapes the log lines from flog, and pushes them to Loki through the gateway.
10 | - **Gateway** (nginx) which receives requests and redirects them to the appropriate container based on the request's URL.
11 | - **Loki read component**: which runs a Query Frontend and a Querier.
12 | - **Loki write component**: which runs a Distributor and an Ingester.
13 | - **Loki backend component**: which runs an Index Gateway, Compactor, Ruler, Bloom Planner (experimental), Bloom Builder (experimental), and Bloom Gateway (experimental).
14 | - **Minio**: which Loki uses to store its index and chunks.
15 | - **Grafana**: which provides visualization of the log lines captured within Loki.
16 |
17 | 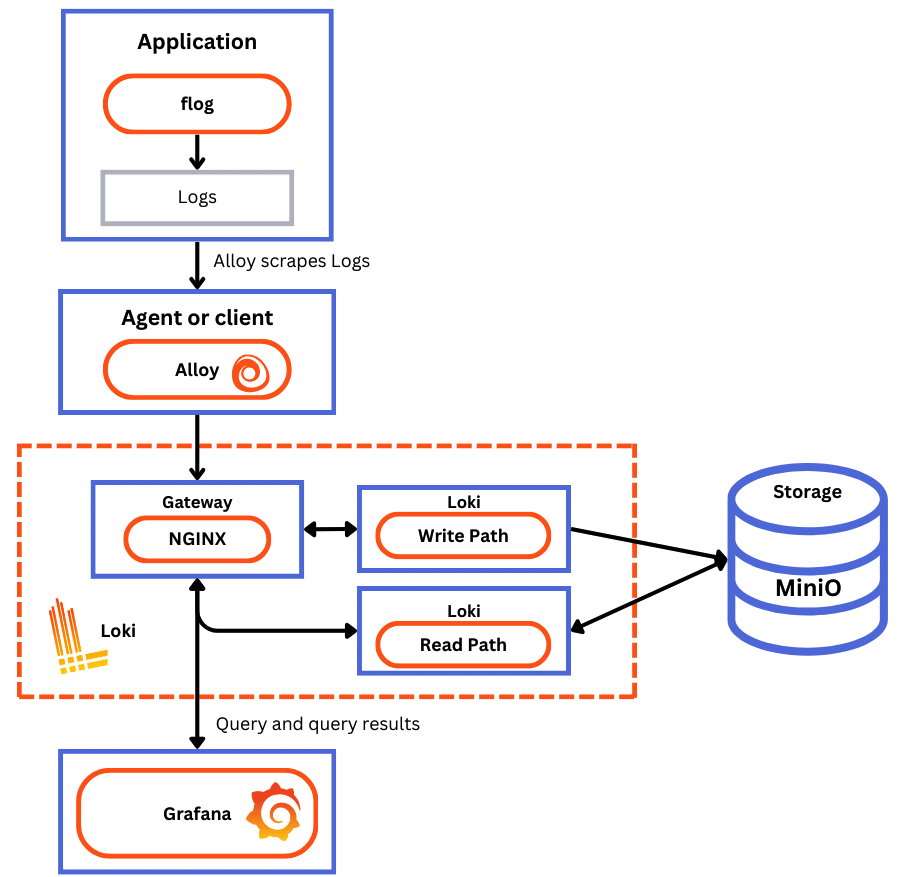
18 |
--------------------------------------------------------------------------------
/loki/loki-quickstart/setup.sh:
--------------------------------------------------------------------------------
1 | #!/bin/sh
2 |
3 | set -euf
4 | # shellcheck disable=SC3040
5 | (set -o pipefail 2> /dev/null) && set -o pipefail
6 |
7 |
8 | sudo install -m 0755 -d /etc/apt/keyrings
9 | sudo curl -fsSL https://download.docker.com/linux/ubuntu/gpg -o /etc/apt/keyrings/docker.asc
10 | sudo chmod a+r /etc/apt/keyrings/docker.asc
11 |
12 | ARCH="$(dpkg --print-architecture)"
13 | VERSION_CODENAME="$(source /etc/os-release && echo "${VERSION_CODENAME}")"
14 | readonly ARCH VERSION_CODENAME
15 |
16 | printf 'deb [arch=%s signed-by=/etc/apt/keyrings/docker.asc] https://download.docker.com/linux/ubuntu %s stable' "${ARCH}" "${VERSION_CODENAME}" | sudo tee /etc/apt/sources.list.d/docker.list > /dev/null
17 |
18 | sudo apt-get update
19 | sudo apt-get install -y docker-compose-plugin && clear && echo "Setup complete. You may now begin the tutorial."
--------------------------------------------------------------------------------
/loki/otel-collector-getting-started/finish.md:
--------------------------------------------------------------------------------
1 | # Summary
2 |
3 | In this example, we configured the OpenTelemetry Collector to receive logs from an example application and send them to Loki using the native OTLP endpoint. Make sure to also consult the Loki configuration file `loki-config.yaml`{{copy}} to understand how we have configured Loki to receive logs from the OpenTelemetry Collector.
4 |
5 | ## Back to docs
6 |
7 | Head back to where you started from to continue with the [Loki documentation](https://grafana.com/docs/loki/latest/send-data/otel).
8 |
9 | # Further reading
10 |
11 | For more information on the OpenTelemetry Collector and the native OTLP endpoint of Loki, refer to the following resources:
12 |
13 | - [Loki OTLP endpoint](https://grafana.com/docs/loki/latest/send-data/otel/)
14 | - [How is native OTLP endpoint different from Loki Exporter](https://grafana.com/docs/loki/latest/send-data/otel/native_otlp_vs_loki_exporter)
15 | - [OpenTelemetry Collector Configuration](https://opentelemetry.io/docs/collector/configuration/)
16 |
17 | # Complete metrics, logs, traces, and profiling example
18 |
19 | If you would like to use a demo that includes Mimir, Loki, Tempo, and Grafana, you can use [Introduction to Metrics, Logs, Traces, and Profiling in Grafana](https://github.com/grafana/intro-to-mlt). `Intro-to-mltp`{{copy}} provides a self-contained environment for learning about Mimir, Loki, Tempo, and Grafana.
20 |
21 | The project includes detailed explanations of each component and annotated configurations for a single-instance deployment. Data from `intro-to-mltp`{{copy}} can also be pushed to Grafana Cloud.
22 |
--------------------------------------------------------------------------------
/loki/otel-collector-getting-started/index.json:
--------------------------------------------------------------------------------
1 | {
2 | "title": "Getting started with the OpenTelemetry Collector and Loki tutorial",
3 | "description": "A Tutorial configuring the OpenTelemetry Collector to send OpenTelemetry logs to Loki",
4 | "details": {
5 | "intro": {
6 | "text": "intro.md"
7 | },
8 | "steps": [
9 | {
10 | "text": "step1.md"
11 | },
12 | {
13 | "text": "step2.md"
14 | },
15 | {
16 | "text": "step3.md"
17 | }
18 | ],
19 | "finish": {
20 | "text": "finish.md"
21 | }
22 | },
23 | "backend": {
24 | "imageid": "ubuntu"
25 | }
26 | }
27 |
--------------------------------------------------------------------------------
/loki/otel-collector-getting-started/step1.md:
--------------------------------------------------------------------------------
1 | # Step 1: Environment setup
2 |
3 | In this step, we will set up our environment by cloning the repository that contains our demo application and spinning up our observability stack using Docker Compose.
4 |
5 | 1. To get started, clone the repository that contains our demo application:
6 |
7 | ```bash
8 | git clone -b microservice-otel-collector https://github.com/grafana/loki-fundamentals.git
9 | ```{{exec}}
10 | 1. Next we will spin up our observability stack using Docker Compose:
11 |
12 | ```bash
13 | docker-compose -f loki-fundamentals/docker-compose.yml up -d
14 | ```{{exec}}
15 |
16 | To check the status of services we can run the following command:
17 |
18 | ```bash
19 | docker ps -a
20 | ```{{exec}}
21 |
22 | After we've finished configuring the OpenTelemetry Collector and sending logs to Loki, we will be able to view the logs in Grafana. To check if Grafana is up and running, navigate to the following URL: [http://localhost:3000]({{TRAFFIC_HOST1_3000}})
23 |
--------------------------------------------------------------------------------
/loki/otel-collector-getting-started/step3.md:
--------------------------------------------------------------------------------
1 | # Step 3: Start the Carnivorous Greenhouse
2 |
3 | In this step, we will start the Carnivorous Greenhouse application. To start the application, run the following command:
4 |
5 | **Note: This docker-compose file relies on the `loki-fundamentals_loki`{{copy}} docker network. If you have not started the observability stack, you will need to start it first.**
6 |
7 | ```bash
8 | docker-compose -f loki-fundamentals/greenhouse/docker-compose-micro.yml up -d --build
9 | ```{{exec}}
10 |
11 | This will start the following services:
12 |
13 | ```console
14 | ✔ Container greenhouse-db-1 Started
15 | ✔ Container greenhouse-websocket_service-1 Started
16 | ✔ Container greenhouse-bug_service-1 Started
17 | ✔ Container greenhouse-user_service-1 Started
18 | ✔ Container greenhouse-plant_service-1 Started
19 | ✔ Container greenhouse-simulation_service-1 Started
20 | ✔ Container greenhouse-main_app-1 Started
21 | ```{{copy}}
22 |
23 | Once started, you can access the Carnivorous Greenhouse application at [http://localhost:5005]({{TRAFFIC_HOST1_5005}}). Generate some logs by interacting with the application in the following ways:
24 |
25 | 1. Create a user.
26 | 1. Log in.
27 | 1. Create a few plants to monitor.
28 | 1. Enable bug mode to activate the bug service. This will cause services to fail and generate additional logs.
29 |
30 | Finally to view the logs in Loki, navigate to the Loki Logs Explore view in Grafana at [http://localhost:3000/a/grafana-lokiexplore-app/explore]({{TRAFFIC_HOST1_3000}}/a/grafana-lokiexplore-app/explore).
31 |
--------------------------------------------------------------------------------
/loki/structure-of-logs/finished.md:
--------------------------------------------------------------------------------
1 | 
2 |
3 | # Structure of log
4 |
5 | You have completed the **Structure of logs* demo. This course is part of an **Intro to Grafana Loki** series. In this course, you learned the basics of log components and how they are structured.
6 |
7 | ## What's Next?
8 |
9 | Head back to the video to continue with Structure of Logging.
10 |
11 | [)](https://www.youtube.com/watch?v=8_JyqEqaHiw)
12 |
13 |
--------------------------------------------------------------------------------
/loki/structure-of-logs/index.json:
--------------------------------------------------------------------------------
1 | {
2 | "title": "Structure of Logs",
3 | "description": "This sandbox will teach you how to open an interpret an applications logs.",
4 | "details": {
5 | "intro": {
6 | "text": "intro.md",
7 | "foreground": "setup.sh"
8 | },
9 | "steps": [
10 | {
11 | "text": "step1.md"
12 | }
13 | ],
14 | "finish": {
15 | "text": "finished.md"
16 | }
17 | }
18 | ,
19 | "backend": {
20 | "imageid": "ubuntu"
21 | }
22 | }
--------------------------------------------------------------------------------
/loki/structure-of-logs/intro.md:
--------------------------------------------------------------------------------
1 | 
2 |
3 |
4 | # Welcome to the Structure of Logs demo
5 |
6 | This course is part of an **Intro to Grafana Loki** series. In this course, you will learn the basics of logging and how to use Grafana Loki to store and query your logs.
7 |
8 | ## The Video
9 |
10 | [)](https://www.youtube.com/watch?v=8_JyqEqaHiw)
11 |
12 |
13 | ## Sandbox Overview
14 |
15 | This sandbox will teach you how application log are generated.
16 |
--------------------------------------------------------------------------------
/loki/structure-of-logs/setup.sh:
--------------------------------------------------------------------------------
1 | #!/usr/bin/env bash
2 |
3 | echo "RUNNING SETUP SCRIPT"
4 |
5 | # Clone the tutorial environment repository if it doesn't already exist
6 | if [ ! -d "tutorial-environment" ]; then
7 | git clone https://github.com/grafana/loki-tutorial-enviroment.git || { echo "Failed to clone repository"; exit 1; }
8 | fi
9 |
10 | # Enter the directory and switch to the required branch
11 | cd loki-tutorial-enviroment && git checkout structure-of-logs || { echo "Failed to checkout branch"; exit 1; }
12 |
13 | echo "Building training instance...."
14 | docker-compose up -d || { echo "Failed to start docker containers"; exit 1; }
15 |
16 | # Update and install required packages
17 | echo "Updating and installing required packages..."
18 | sudo apt-get update && sudo apt-get install -y figlet; clear; echo -e "\e[32m$(figlet -f standard 'Structure of')\e[0m"; echo -e "\e[33m$(figlet -f standard 'Logs')\e[0m"
--------------------------------------------------------------------------------
/loki/structure-of-logs/step1.md:
--------------------------------------------------------------------------------
1 | # Running the demo
2 |
3 | ## Step 1: Check out the application
4 |
5 | In this demo, we will be working with a simple application that generates logs. We have created a small messaging board application similar to Hacker News or Reddit. The idea is users can post messages and upvote posts they like.
6 |
7 | To access the application click this link to Grafana News: **[http://localhost:8081]({{TRAFFIC_HOST1_8081}})**
8 |
9 | ## Step 2: Generate some logs
10 |
11 | Start to interact with the application by posting messages and upvoting posts. This will generate logs that we can explore in the next steps.
12 |
13 | **Top Tip:** *Try to post a message without a URL.*
14 |
15 | ## Step 3: Explore the logs
16 |
17 | Our application generates logs in a specific format (a hybrid between plain text and structured since it utilises key-value pairs). The log is located in the `logs` directory of the application.
18 |
19 | To print the logs, run the following command:
20 |
21 | ```bash
22 | cat ./logs/tns-app.log
23 | ```{{exec}}
24 |
25 |
26 |
27 |
--------------------------------------------------------------------------------
/loki/structure.json:
--------------------------------------------------------------------------------
1 | {
2 | "items": [
3 | { "path": "intro-to-logging", "title": "Intro to logging"},
4 | { "path": "structure-of-logs", "title": "Structure of logs"},
5 | { "path": "loki-quickstart", "title": "Loki Quickstart Demo"},
6 | { "path": "loki-getting-started-tutorial", "title": "Loki Getting Started Tutorial"},
7 | { "path": "what-is-loki", "title": "What is Loki?"},
8 | { "path": "intro-to-ingest", "title": "Intro to Ingesting"},
9 | { "path": "intro-to-ingest-otel", "title": "Intro to Ingesting with OpenTelemetry"},
10 | { "path": "alloy-otel-logs", "title": "Ingesting OpenTelemetry logs to Loki using Alloy"},
11 | { "path": "alloy-kafka-logs", "title": "Configuring Grafana Alloy to recive logs via Kafka and send them to Loki."},
12 | { "path": "intro-to-logging-fluentd-fluentbit", "title": "Configuring Fluentd and Fluent bit to send logs to Loki."},
13 | { "path": "otel-collector-getting-started", "title": "Getting started with the OpenTelemetry Collector and Loki tutorial"},
14 | { "path": "fluentbit-loki-tutorial", "title": "Sending logs to Loki using Fluent Bit tutorial"},
15 | { "path": "logcli-tutorial", "title": "LogCLI tutorial"},
16 | { "path": "k8s-monitoring-helm", "title": "Kubernetes Monitoring Helm"}
17 | ]
18 | }
--------------------------------------------------------------------------------
/loki/what-is-loki/finished.md:
--------------------------------------------------------------------------------
1 | 
2 |
3 | # What is Loki?
4 |
5 | You have completed the **What is loki** demo. This course is part of an **Intro to Grafana Loki** series. In this course, you learned the basics of Grafana Loki and how it can be used to store and query logs.
6 |
7 | ## What's Next?
8 |
9 | Head back to the video to continue with What is Loki.
10 |
11 | [](https://www.youtube.com/watch?v=1uk8LtQqsZQ)
12 |
--------------------------------------------------------------------------------
/loki/what-is-loki/index.json:
--------------------------------------------------------------------------------
1 | {
2 | "title": "What is Loki?",
3 | "description": "A sandbox enviroment to introduce Loki to new users. This sandbox will guide you through the basics of Loki and how to use it.",
4 | "details": {
5 | "intro": {
6 | "text": "intro.md",
7 | "foreground": "setup.sh"
8 | },
9 | "steps": [
10 | {
11 | "text": "step1.md"
12 | },
13 | {
14 | "text": "step2.md"
15 | }
16 | ],
17 | "finish": {
18 | "text": "finished.md"
19 | }
20 | }
21 | ,
22 | "backend": {
23 | "imageid": "ubuntu"
24 | }
25 | }
--------------------------------------------------------------------------------
/loki/what-is-loki/setup.sh:
--------------------------------------------------------------------------------
1 | #!/usr/bin/env bash
2 |
3 | echo "RUNNING SETUP SCRIPT"
4 |
5 | # Clone the tutorial environment repository if it doesn't already exist
6 | if [ ! -d "loki-fundamentals" ]; then
7 | git clone https://github.com/grafana/loki-fundamentals.git || { echo "Failed to clone repository"; exit 1; }
8 | fi
9 |
10 | # Enter the directory and switch to the required branch
11 | cd loki-fundamentals && git checkout what-is-loki || { echo "Failed to checkout branch"; exit 1; }
12 |
13 | echo "Building training instance...."
14 | docker-compose up -d || { echo "Failed to start docker containers"; exit 1; }
15 |
16 | # Update and install required packages
17 | echo "Updating and installing required packages..."
18 | sudo apt-get update && sudo apt-get install -y figlet; clear; echo -e "\e[32m$(figlet -f standard 'What is')\e[0m"; echo -e "\e[33m$(figlet -f standard 'Loki?')\e[0m"
--------------------------------------------------------------------------------
/loki/what-is-loki/step1.md:
--------------------------------------------------------------------------------
1 |
2 | # Step 1: Generating some logs
3 |
4 | In this step, we will generate some logs using the Carnivorous Greenhouse application. This application generates logs when you create an account, login, and collect metrics from a series of hungry plants. The logs are sent to Loki.
5 |
6 | To access the application, click this link to Carnivorous Greenhouse: **[http://localhost:5005]({{TRAFFIC_HOST1_5005}})**
7 |
8 | ## Generate some logs
9 |
10 | 1. Create an account by clicking the **Sign Up** button.
11 | 2. Create a user by entering a username and password.
12 | 3. Log in by clicking the **Login** button.
13 | 4. Create your first plant by:
14 | * Adding a name
15 | * Selecting a plant type
16 | * Clicking the **Add Plant** button.
17 |
18 | ### Optional: Generate errors
19 |
20 | The plants do a good job eating all the bugs, but sometimes they get a little too hungry and cause errors. To generate an error, toggle the **Toggle Error mode**. This will cause a variety of errors to occure such as; sign up errors, login errors, and plant creation errors. These errors can be investigated in the logs.
21 |
22 |
23 |
--------------------------------------------------------------------------------
/loki/what-is-loki/step2.md:
--------------------------------------------------------------------------------
1 |
2 | # Step 2: Investigating the logs
3 |
4 | In the previous step, we generated logs using the Carnivorous Greenhouse application. In this step, we will investigate the logs that were generated. These logs where tailed by Alloy and sent to Loki. Let's explore the logs.
5 |
6 | ## Explore the logs
7 |
8 | To start exploring the logs, we will use the Grafana Explore Logs view. This is a new queriless way to explore logs in Grafana.
9 |
10 | 1. To access this view, follow this link: **[http://localhost:3000/a/grafana-lokiexplore-app/explore]({{TRAFFIC_HOST1_3000}}/a/grafana-lokiexplore-app/explore)**
11 |
12 | 2. From there experiment with the different options available to you. Drill down into the logs and see what you can find.
13 |
14 |
15 | ### Open In Explore
16 |
17 | You all also have the option to open your current log view in Explore. This will allow you to continue your investigation in the Explore view. To do this, click the **Open in Explore** button.
18 |
19 |
--------------------------------------------------------------------------------
/mimir/play-with-mimir/docker-compose-update.sh:
--------------------------------------------------------------------------------
1 | #!/bin/sh
2 |
3 | set -euf
4 | # shellcheck disable=SC3040
5 | (set -o pipefail 2> /dev/null) && set -o pipefail && sudo install -m 0755 -d /etc/apt/keyrings && \
6 | sudo curl -fsSL https://download.docker.com/linux/ubuntu/gpg -o /etc/apt/keyrings/docker.asc && \
7 | sudo chmod a+r /etc/apt/keyrings/docker.asc && \
8 | ARCH="$(dpkg --print-architecture)" && \
9 | VERSION_CODENAME="$(source /etc/os-release && echo "${VERSION_CODENAME}")" && \
10 | readonly ARCH VERSION_CODENAME && \
11 | printf 'deb [arch=%s signed-by=/etc/apt/keyrings/docker.asc] https://download.docker.com/linux/ubuntu %s stable' "${ARCH}" "${VERSION_CODENAME}" | sudo tee /etc/apt/sources.list.d/docker.list > /dev/null && \
12 | sudo apt-get update && \
13 | sudo apt-get install -y docker-compose-plugin
--------------------------------------------------------------------------------
/mimir/play-with-mimir/finish.md:
--------------------------------------------------------------------------------
1 | # Summary
2 |
3 | In this tutorial you started Grafana Mimir locally in a high-available setup as well as a Prometheus instance that remote wrote
4 | some metrics to Grafana Mimir. You then queried those metrics stored in Mimir using Grafana, and visualized them in some Grafana dashboards.
5 | Lastly, you configured a recording rule and an alert via the Grafana Alerting UI and verified that the alert fired as expected when the condition was met.
6 |
--------------------------------------------------------------------------------
/mimir/play-with-mimir/index.json:
--------------------------------------------------------------------------------
1 | {
2 | "title": "Play with Mimir",
3 | "description": "Learn about Grafana Mimir, which provides distributed, horizontally scalable, and highly available long term storage for Prometheus.",
4 | "details": {
5 | "intro": {
6 | "text": "intro.md",
7 | "foreground": "docker-compose-update.sh"
8 | },
9 | "steps": [
10 | {
11 | "text": "step1.md"
12 | },
13 | {
14 | "text": "step2.md"
15 | },
16 | {
17 | "text": "step3.md"
18 | },
19 | {
20 | "text": "step4.md"
21 | },
22 | {
23 | "text": "step5.md"
24 | }
25 | ],
26 | "finish": {
27 | "text": "finish.md"
28 | }
29 | },
30 | "backend": {
31 | "imageid": "ubuntu"
32 | }
33 | }
34 |
--------------------------------------------------------------------------------
/mimir/play-with-mimir/intro.md:
--------------------------------------------------------------------------------
1 | # Play with Mimir
2 |
3 | Grafana Mimir is a distributed, horizontally scalable, and highly available long term storage for [Prometheus](https://prometheus.io).
4 |
5 | In this tutorial, you'll:
6 |
7 | - Run Grafana Mimir locally with Docker Compose
8 | - Run Prometheus to scrape some metrics and remote write to Grafana Mimir
9 | - Run Grafana to explore Grafana Mimir dashboards
10 | - Configure a testing recording rule and alert in Grafana Mimir
11 |
--------------------------------------------------------------------------------
/mimir/play-with-mimir/step1.md:
--------------------------------------------------------------------------------
1 | # Download tutorial configuration
2 |
3 | 1. Create a copy of the Grafana Mimir repository using the Git command line:
4 | ```bash
5 | git clone https://github.com/grafana/mimir.git
6 | cd mimir
7 | ```{{exec}}
8 | 1. Navigate to the tutorial directory:
9 | ```bash
10 | cd docs/sources/mimir/get-started/play-with-grafana-mimir/
11 | ```{{exec}}
12 |
13 | > **Note:**
14 | > The instructions in this tutorial assume that your working directory is `docs/sources/mimir/get-started/play-with-grafana-mimir/`{{copy}}.
15 |
--------------------------------------------------------------------------------
/mimir/play-with-mimir/step2.md:
--------------------------------------------------------------------------------
1 | # Start Grafana Mimir and dependencies
2 |
3 | Start running your local setup with the following Docker command:
4 |
5 | ```bash
6 | docker compose up -d
7 | ```{{exec}}
8 |
9 | This command starts:
10 |
11 | - Grafana Mimir
12 | - Three instances of monolithic-mode Mimir to provide high availability
13 | - Multi-tenancy enabled (tenant ID is `demo`{{copy}})
14 | - [Minio](https://min.io/)
15 | - S3-compatible persistent storage for blocks, rules, and alerts
16 | - Prometheus
17 | - Scrapes Grafana Mimir metrics, then writes them back to Grafana Mimir to ensure availability of ingested metrics
18 | - Grafana
19 | - Includes a preinstalled datasource to query Grafana Mimir
20 | - Includes preinstalled dashboards for monitoring Grafana Mimir
21 | - Load balancer
22 | - A simple NGINX-based load balancer that exposes Grafana Mimir endpoints on the host
23 |
24 | The diagram below illustrates the relationship between these components:
25 | 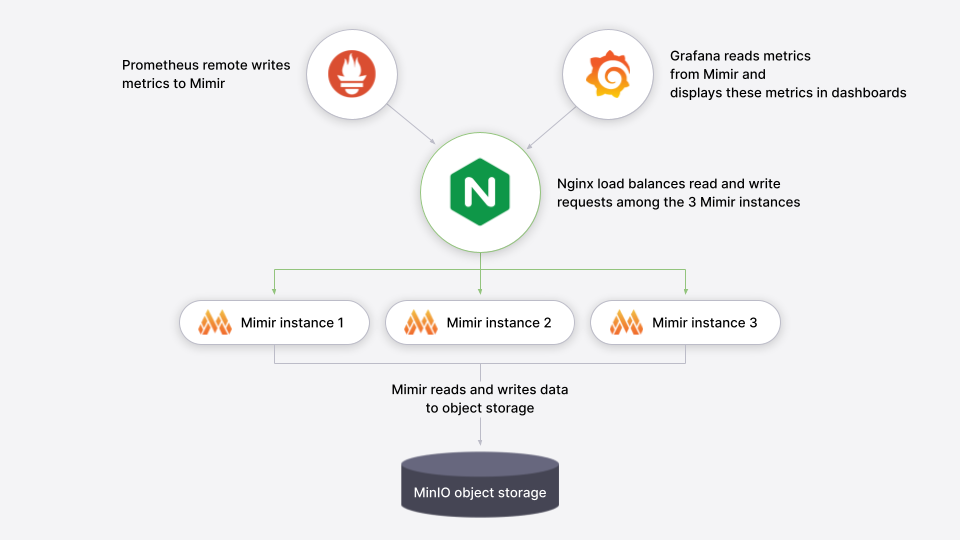
26 |
27 | The following ports will be exposed on the host:
28 |
29 | - Grafana on [`http://localhost:9000`{{copy}}]({{TRAFFIC_HOST1_9000}})
30 | - Grafana Mimir on [`http://localhost:9009`{{copy}}]({{TRAFFIC_HOST1_9009}})
31 |
32 | To learn more about the Grafana Mimir configuration, you can review the configuration file `config/mimir.yaml`{{copy}}.
33 |
--------------------------------------------------------------------------------
/mimir/play-with-mimir/step3.md:
--------------------------------------------------------------------------------
1 | # Explore Grafana Mimir dashboards
2 |
3 | > **Note:**
4 | > Sandbox users: If you're using the interactive learning environment, you can access all links directly by clicking on them. This will redirect you to the VM's localhost where the services are running.
5 |
6 | Open Grafana on your local host [`http://localhost:9000`{{copy}}]({{TRAFFIC_HOST1_9000}}) and view dashboards showing the status
7 | and health of your Grafana Mimir cluster. The dashboards query Grafana Mimir for the metrics they display.
8 |
9 | To start, we recommend looking at these dashboards:
10 |
11 | - [Writes]({{TRAFFIC_HOST1_9000}}/d/8280707b8f16e7b87b840fc1cc92d4c5/mimir-writes)
12 | - [Reads]({{TRAFFIC_HOST1_9000}}/d/e327503188913dc38ad571c647eef643/mimir-reads)
13 | - [Queries]({{TRAFFIC_HOST1_9000}}/d/b3abe8d5c040395cc36615cb4334c92d/mimir-queries)
14 | - [Object Store]({{TRAFFIC_HOST1_9000}}/d/e1324ee2a434f4158c00a9ee279d3292/mimir-object-store)
15 |
16 | A couple of caveats:
17 |
18 | - It typically takes a few minutes after Grafana Mimir starts to display meaningful metrics in the dashboards.
19 | - Because this tutorial runs Grafana Mimir without any query-scheduler, or memcached, the related panels are expected to be empty.
20 |
21 | The dashboards installed in the Grafana are taken from the Grafana Mimir mixin which packages up Grafana Labs' best practice dashboards, recording rules, and alerts for monitoring Grafana Mimir. To learn more about the mixin, check out the Grafana Mimir mixin documentation. To learn more about how Grafana is connecting to Grafana Mimir, review the [Mimir datasource]({{TRAFFIC_HOST1_9000}}/datasources).
22 |
--------------------------------------------------------------------------------
/mimir/play-with-mimir/step4.md:
--------------------------------------------------------------------------------
1 | # Configure your first recording rule
2 |
3 | Recording rules allow you to precompute frequently needed or computationally expensive expressions and save their result
4 | as a new set of time series. In this section you're going to configure a recording rule in Grafana Mimir using tooling
5 | offered by Grafana.
6 |
7 | 1. Open [Grafana Alerting]({{TRAFFIC_HOST1_9000}}/alerting/list).
8 | 1. Click **New recording rule**, which also allows you to configure recording rules.
9 | 1. Configure the recording rule:
10 | 1. Give the rule a name, such as `sum:up`{{copy}}.
11 | 1. Choose **Mimir** in the **Select data source** field.
12 | 1. Choose **Code** in the **Builder | Code** field on the right.
13 | 1. Type `sum(up)`{{copy}} in the **Metrics browser** query field.
14 | 1. Type `example-namespace`{{copy}} in the **Namespace** field.
15 | 1. Type `example-group`{{copy}} in the **Group** field.
16 | 1. From the upper-right corner, click the **Save and exit** button.
17 |
18 | Your `sum:up`{{copy}} recording rule will show the number of Mimir instances that are `up`{{copy}}, meaning reachable to be scraped. The
19 | rule is now being created in Grafana Mimir ruler and will be soon available for querying:
20 |
21 | 1. Open [Grafana Explore]({{TRAFFIC_HOST1_9000}}/explore)
22 | and query the resulting series from the recording rule, which may require up to one minute to display after configuration:
23 | ```
24 | sum:up
25 | ```{{copy}}
26 | 1. Confirm the query returns a value of `3`{{copy}} which is the number of Mimir instances currently running in your local setup.
27 |
--------------------------------------------------------------------------------
/mimir/structure.json:
--------------------------------------------------------------------------------
1 | {
2 | "items": [
3 | { "path": "play-with-mimir", "title": "Play with Mimir"}
4 | ]
5 | }
--------------------------------------------------------------------------------
/pyroscope/ride-share-tutorial/docker-compose-update.sh:
--------------------------------------------------------------------------------
1 | #!/bin/sh
2 |
3 | set -euf
4 | # shellcheck disable=SC3040
5 | (set -o pipefail 2> /dev/null) && set -o pipefail && sudo install -m 0755 -d /etc/apt/keyrings && \
6 | sudo curl -fsSL https://download.docker.com/linux/ubuntu/gpg -o /etc/apt/keyrings/docker.asc && \
7 | sudo chmod a+r /etc/apt/keyrings/docker.asc && \
8 | ARCH="$(dpkg --print-architecture)" && \
9 | VERSION_CODENAME="$(source /etc/os-release && echo "${VERSION_CODENAME}")" && \
10 | readonly ARCH VERSION_CODENAME && \
11 | printf 'deb [arch=%s signed-by=/etc/apt/keyrings/docker.asc] https://download.docker.com/linux/ubuntu %s stable' "${ARCH}" "${VERSION_CODENAME}" | sudo tee /etc/apt/sources.list.d/docker.list > /dev/null && \
12 | sudo apt-get update && \
13 | sudo apt-get install -y docker-compose-plugin
--------------------------------------------------------------------------------
/pyroscope/ride-share-tutorial/finish.md:
--------------------------------------------------------------------------------
1 | # Summary
2 |
3 | In this tutorial, you learned how to profile a simple "Ride Share" application using Pyroscope.
4 | You have learned some of the core instrumentation concepts such as tagging and how to use Profiles Drilldown identify performance bottlenecks.
5 |
6 | ## Next steps
7 |
8 | - Learn more about the Pyroscope SDKs and how to [instrument your application with Pyroscope](https://grafana.com/docs/pyroscope/latest/configure-client/).
9 | - Deploy Pyroscope in a production environment using the [Pyroscope Helm chart](https://grafana.com/docs/pyroscope/latest/deploy-kubernetes/).
10 | - Continue exploring your profile data using [Profiles Drilldown](https://grafana.com/docs/grafana/latest/explore/simplified-exploration/profiles/investigate/)
11 |
--------------------------------------------------------------------------------
/pyroscope/ride-share-tutorial/index.json:
--------------------------------------------------------------------------------
1 | {
2 | "title": "Ride share tutorial",
3 | "description": "Learn how to get started with Pyroscope using a simple Ride share app.",
4 | "details": {
5 | "intro": {
6 | "text": "intro.md",
7 | "foreground": "docker-compose-update.sh"
8 | },
9 | "steps": [
10 | {
11 | "text": "step1.md"
12 | },
13 | {
14 | "text": "step2.md"
15 | },
16 | {
17 | "text": "step3.md"
18 | },
19 | {
20 | "text": "step4.md"
21 | }
22 | ],
23 | "finish": {
24 | "text": "finish.md"
25 | }
26 | },
27 | "backend": {
28 | "imageid": "ubuntu"
29 | }
30 | }
31 |
--------------------------------------------------------------------------------
/pyroscope/ride-share-tutorial/step1.md:
--------------------------------------------------------------------------------
1 | # Clone the repository
2 |
3 | 1. Clone the repository to your local machine:
4 |
5 | ```bash
6 | git clone https://github.com/grafana/pyroscope.git && cd pyroscope
7 | ```{{exec}}
8 | 1. Navigate to the tutorial directory:
9 |
10 | ```bash
11 | cd examples/language-sdk-instrumentation/python/rideshare/flask
12 | ```{{exec}}
13 |
14 | # Start the application
15 |
16 | Start the application using Docker Compose:
17 |
18 | ```bash
19 | docker compose up -d
20 | ```{{exec}}
21 |
22 | This may take a few minutes to download the required images and build the demo application. Once ready, you will see the following output:
23 |
24 | ```console
25 | ✔ Network flask_default Created
26 | ✔ Container flask-ap-south-1 Started
27 | ✔ Container flask-grafana-1 Started
28 | ✔ Container flask-pyroscope-1 Started
29 | ✔ Container flask-load-generator-1 Started
30 | ✔ Container flask-eu-north-1 Started
31 | ✔ Container flask-us-east-1 Started
32 | ```{{copy}}
33 |
34 | Optional: To verify the containers are running, run:
35 |
36 | ```bash
37 | docker ps -a
38 | ```{{exec}}
39 |
--------------------------------------------------------------------------------
/pyroscope/ride-share-tutorial/step4.md:
--------------------------------------------------------------------------------
1 | # How was Pyroscope integrated with Grafana in this tutorial?
2 |
3 | The `docker-compose.yml`{{copy}} file includes a Grafana container that's pre-configured with the Pyroscope plugin:
4 |
5 | ```yaml
6 | grafana:
7 | image: grafana/grafana:latest
8 | environment:
9 | - GF_INSTALL_PLUGINS=grafana-pyroscope-app
10 | - GF_AUTH_ANONYMOUS_ENABLED=true
11 | - GF_AUTH_ANONYMOUS_ORG_ROLE=Admin
12 | - GF_AUTH_DISABLE_LOGIN_FORM=true
13 | volumes:
14 | - ./grafana-provisioning:/etc/grafana/provisioning
15 | ports:
16 | - 3000:3000
17 | ```{{copy}}
18 |
19 | Grafana is also pre-configured with the Pyroscope data source.
20 |
21 | ## Challenge
22 |
23 | As a challenge, see if you can generate a similar comparison with the `vehicle`{{copy}} tag.
24 |
--------------------------------------------------------------------------------
/pyroscope/structure.json:
--------------------------------------------------------------------------------
1 | {
2 | "items": [
3 | { "path": "ride-share-tutorial", "title": "Ride share tutorial"}
4 | ]
5 | }
--------------------------------------------------------------------------------
/sandbox-developer/sandbox-transformer-walk-through/finish.md:
--------------------------------------------------------------------------------
1 | # Conclusion
2 |
3 | In this tutorial, you learned how to use the Sandbox Transformer to turn Markdown docs into a course. You learned how to build the transformer, the basic meta syntax, and how to use the transformer to create a course. You also learned how to test the course using your own Killercoda instance.
4 |
5 | ## Next steps
6 |
7 | When you are ready, you can open a PR to the `killercoda`{{copy}} repository to add your course. We are excited to see what you create and to get your feedback on the Sandbox Transformer.
8 |
--------------------------------------------------------------------------------
/sandbox-developer/sandbox-transformer-walk-through/index.json:
--------------------------------------------------------------------------------
1 | {
2 | "title": "Learn how to use the Sandbox Transformer",
3 | "description": "Learn how to use the Sandbox Transformer to turn hugo docs into a course",
4 | "details": {
5 | "intro": {
6 | "text": "intro.md"
7 | },
8 | "steps": [
9 | {
10 | "text": "step1.md"
11 | },
12 | {
13 | "text": "step2.md"
14 | },
15 | {
16 | "text": "step3.md"
17 | },
18 | {
19 | "text": "step4.md"
20 | }
21 | ],
22 | "finish": {
23 | "text": "finish.md"
24 | }
25 | },
26 | "backend": {
27 | "imageid": "ubuntu"
28 | }
29 | }
30 |
--------------------------------------------------------------------------------
/sandbox-developer/sandbox-transformer-walk-through/intro.md:
--------------------------------------------------------------------------------
1 | # Learn how to use the Sandbox Transformer
2 |
3 | The Sandbox Transformer is an experimental tool created by Grafana Labs to turn **Hugo Markdown** files into Killercoda courses. This tool is still in development, but we’re excited to share it with you and get your feedback. In this tutorial, you will learn how to use the Sandbox Transformer to turn Hugo docs into a course.
4 |
5 | > **Note:** This tutorial can also work with non-Hugo Markdown files but it requires that each file has certain [Hugo front matter metadata](https://gohugo.io/content-management/front-matter/).
6 | > This front matter may interfere with the rendering of the original Markdown file.
7 |
8 | ## What you will learn
9 |
10 | - How to build the Sandbox Transformer
11 |
12 | - Learn the basic meta syntax
13 |
14 | - How to use the Sandbox Transformer to turn Hugo docs into a course
15 |
--------------------------------------------------------------------------------
/sandbox-developer/sandbox-transformer-walk-through/step1.md:
--------------------------------------------------------------------------------
1 | # Prerequisites
2 |
3 | In this section we will cover the prerequisites you need to have in place in order to download and run the Sandbox Transformer.
4 |
5 | ## Download the transformer
6 |
7 | The Sandbox Transformer is written in Go and is distributed as a binary. You may also build the transformer from source if you prefer.
8 |
9 | 1. Download the Transformer binary from the [releases page](https://github.com/grafana/killercoda/releases):
10 |
11 | ```bash
12 | wget https://github.com/grafana/killercoda/releases/download/v0.1.5/transformer-linux-amd64 -O transformer
13 | ```{{exec}}
14 |
15 | 1. Make the binary executable:
16 |
17 | ```bash
18 | chmod +x transformer
19 | ```{{exec}}
20 |
21 | ## Clone the repository
22 |
23 | You will also need to clone the repository to your local machine. You can do this by running the following command:
24 |
25 | ```bash
26 | git clone https://github.com/grafana/killercoda.git && cd killercoda
27 | ```{{exec}}
28 |
29 | Its best practise to create a new branch for each new course you create. You can do this by running the following command:
30 |
31 | ```bash
32 | git checkout -b my-new-course
33 | ```{{exec}}
34 |
--------------------------------------------------------------------------------
/sandbox-developer/sandbox-transformer-walk-through/step4.md:
--------------------------------------------------------------------------------
1 | # Test the course
2 |
3 | Before you open a PR to the `killercoda`{{copy}} repository, you should test the course to make sure it works as expected. The easiest way to do this is to run the course via your own Killercoda instance. To do this follow these steps:
4 |
5 | 1. [Fork the `killercoda`{{copy}}{{copy}} repository](https://github.com/grafana/killercoda/fork) to your own GitHub account. This will provide you with a URL to your forked repository.
6 |
7 | ```
8 | https://github.com//killercoda.git
9 | ```{{copy}}
10 |
11 | 1. change back to the `killercoda`{{copy}} repository:
12 |
13 | ```bash
14 | cd killercoda
15 | ```{{exec}}
16 |
17 | 1. Add the forked repository as a remote to your local repository:
18 |
19 | ```bash
20 | git remote add forked https://github.com//killercoda.git
21 | ```{{copy}}
22 |
23 | 1. Add the changes to your forked repository:
24 |
25 | ```bash
26 | git add .
27 | git commit -m "Add new course"
28 | ```{{exec}}
29 |
30 | 1. Push the changes to your forked repository:
31 |
32 | ```bash
33 | git push forked my-new-course
34 | ```{{exec}}
35 |
36 | 1. Create a Killercoda account: [https://killercoda.com/login](https://killercoda.com/login)
37 |
38 | 1. Then head to: [https://killercoda.com/creator/repository](https://killercoda.com/creator/repository) and add your forked repository.
39 |
40 | 1. After you save, you should see your course in the list of courses. Click on the course to open it.
41 |
--------------------------------------------------------------------------------
/sandbox-developer/sandbox-transformer-walk-through/step5.md:
--------------------------------------------------------------------------------
1 | # Test the course
2 |
3 | Before you open a PR to the `killercoda`{{copy}} repository, you should test the course to make sure it works as expected. The easiest way to do this is to run the course via your own Killercoda instance. To do this follow these steps:
4 |
5 | 1. [Fork the `killercoda`{{copy}} repository](https://github.com/grafana/killercoda/fork) to your own GitHub account. This will provide you with a URL to your forked repository.
6 |
7 | ```
8 | https://github.com//killercoda.git
9 | ```{{copy}}
10 |
11 | 1. Add the forked repository as a remote to your local repository:
12 |
13 | ```bash
14 | git remote add forked https://github.com//killercoda.git
15 | ```{{copy}}
16 |
17 | 1. Add the changes to your forked repository:
18 |
19 | ```bash
20 | git add .
21 | git commit -m "Add new course"
22 | ```{{exec}}
23 |
24 | 1. Push the changes to your forked repository:
25 |
26 | ```bash
27 | git push forked my-new-course
28 | ```{{exec}}
29 |
30 | 1. Create a Killercoda account: [https://killercoda.com/login](https://killercoda.com/login)
31 |
32 | 1. Then head to: [https://killercoda.com/creator/repository](https://killercoda.com/creator/repository) and add your forked repository.
33 |
34 | 1. After you save, you should see your course in the list of courses. Click on the course to open it.
35 |
--------------------------------------------------------------------------------
/sandbox-developer/structure.json:
--------------------------------------------------------------------------------
1 | {
2 | "items": [
3 | { "path": "sandbox-transformer-walk-through", "title": "Learn how to use the Sandbox Transformer"}
4 | ]
5 | }
--------------------------------------------------------------------------------
/scripts/check-out-branch.bash:
--------------------------------------------------------------------------------
1 | #!/usr/bin/env bash
2 |
3 | set -euf -o pipefail
4 |
5 | function usage {
6 | cat < /dev/null) && set -o pipefail && sudo install -m 0755 -d /etc/apt/keyrings && \
6 | sudo curl -fsSL https://download.docker.com/linux/ubuntu/gpg -o /etc/apt/keyrings/docker.asc && \
7 | sudo chmod a+r /etc/apt/keyrings/docker.asc && \
8 | ARCH="$(dpkg --print-architecture)" && \
9 | VERSION_CODENAME="$(source /etc/os-release && echo "${VERSION_CODENAME}")" && \
10 | readonly ARCH VERSION_CODENAME && \
11 | printf 'deb [arch=%s signed-by=/etc/apt/keyrings/docker.asc] https://download.docker.com/linux/ubuntu %s stable' "${ARCH}" "${VERSION_CODENAME}" | sudo tee /etc/apt/sources.list.d/docker.list > /dev/null && \
12 | sudo apt-get update && \
13 | sudo apt-get install -y docker-compose-plugin
--------------------------------------------------------------------------------
/tempo/quick-start/finish.md:
--------------------------------------------------------------------------------
1 | # Next steps
2 |
3 | You have successfully set up Tempo and Grafana to explore traces generated by the k6-tracing service.
4 |
5 | ## Alternative: Complete MLTP example
6 |
7 | If you would like to use a demo with multiple telemetry signals, then try the [Introduction to Metrics, Logs, Traces, and Profiling in Grafana](https://github.com/grafana/intro-to-mlt).
8 | `Intro-to-mltp`{{copy}} provides a self-contained environment for learning about Mimir, Loki, Tempo, Pyroscope, and Grafana.
9 | The project includes detailed explanations of each component and annotated configurations for a single-instance deployment.
10 | Data from `intro-to-mltp`{{copy}} can also be pushed to Grafana Cloud.
11 |
12 | ## Further reading
13 |
14 | Here are some resources to help you learn more about Tempo:
15 |
16 | - [Instrumenting your application](https://grafana.com/docs/tempo/latest/getting-started/instrumentation/)
17 | - [Setup guides for Tempo](https://grafana.com/docs/tempo/latest/setup/)
18 |
--------------------------------------------------------------------------------
/tempo/quick-start/index.json:
--------------------------------------------------------------------------------
1 | {
2 | "title": "Quick start for Tempo",
3 | "description": "Use Docker to quickly view traces using K-6 and Tempo",
4 | "details": {
5 | "intro": {
6 | "text": "intro.md",
7 | "foreground": "docker-compose-update.sh"
8 | },
9 | "steps": [
10 | {
11 | "text": "step1.md"
12 | },
13 | {
14 | "text": "step2.md"
15 | },
16 | {
17 | "text": "step3.md"
18 | }
19 | ],
20 | "finish": {
21 | "text": "finish.md"
22 | }
23 | },
24 | "backend": {
25 | "imageid": "ubuntu"
26 | }
27 | }
28 |
--------------------------------------------------------------------------------
/tempo/quick-start/intro.md:
--------------------------------------------------------------------------------
1 | # Quick start for Tempo
2 |
3 | The Tempo repository provides [multiple examples](https://github.com/grafana/tempo/tree/main/example/docker-compose) to help you quickly get started using Tempo and distributed tracing data.
4 |
5 | Every example has a `docker-compose.yaml`{{copy}} manifest that includes all of the options needed to explore trace data in Grafana, including resource configuration and trace data generation.
6 |
7 | The Tempo examples running with Docker using docker-compose include a version of Tempo and a storage configuration suitable for testing or development.
8 |
9 | > **Tip:**
10 | > A setup script is running in the background to install the necessary dependencies. This should take no longer than 30 seconds. Your instance will be ready to use once you `Setup complete. You may now begin the tutorial`{{copy}}.
11 |
--------------------------------------------------------------------------------
/tempo/quick-start/step1.md:
--------------------------------------------------------------------------------
1 | # Clone the Tempo repository and start Docker
2 |
3 | This quick start guide uses the `local`{{copy}} example running Tempo as a single binary (monolithic). Any data is stored locally in the `tempo-data`{{copy}} folder.
4 | To learn more, read the [local storage example README](https://github.com/grafana/tempo/blob/main/example/docker-compose/local).
5 |
6 | 1. Clone the Tempo repository:
7 |
8 | ```bash
9 | git clone https://github.com/grafana/tempo.git
10 | ```{{exec}}
11 | 1. Go into the examples directory:
12 |
13 | ```bash
14 | cd tempo/example/docker-compose/local
15 | ```{{exec}}
16 | 1. Create a new directory to store data:
17 |
18 | ```bash
19 | mkdir tempo-data
20 | ```{{exec}}
21 | 1. Start the services defined in the docker-compose file:
22 |
23 | ```bash
24 | docker compose up -d
25 | ```{{exec}}
26 | 1. Verify that the services are running:
27 |
28 | ```bash
29 | docker compose ps
30 | ```{{exec}}
31 |
32 | You should see something like:
33 |
34 | ```console
35 | docker compose ps
36 | NAME COMMAND SERVICE STATUS PORTS
37 | local-grafana-1 "/run.sh" grafana running 0.0.0.0:3000->3000/tcp
38 | local-k6-tracing-1 "/k6-tracing run /ex…" k6-tracing running
39 | local-prometheus-1 "/bin/prometheus --c…" prometheus running 0.0.0.0:9090->9090/tcp
40 | local-tempo-1 "/tempo -config.file…" tempo running 0.0.0.0:3200->3200/tcp, 0.0.0.0:4317-4318->4317-4318/tcp, 0.0.0.0:9411->9411/tcp, 0.0.0.0:14268->14268/tcp
41 | ```{{copy}}
42 |
--------------------------------------------------------------------------------
/tempo/quick-start/step2.md:
--------------------------------------------------------------------------------
1 | # Explore the traces in Grafana
2 |
3 | As part of the Docker Compose manifest, Grafana is now accessible on port 3000.
4 | You can use Grafana to explore the traces generated by the k6-tracing service.
5 |
6 | 1. Open a browser and navigate to [http://localhost:3000]({{TRAFFIC_HOST1_3000}}).
7 | 1. Once logged in, navigate to the **Explore** page, select the **Tempo** data source and select the **Search** tab. Select **Run query** to list the recent traces stored in Tempo. Select one to view the trace diagram:
8 |
9 | 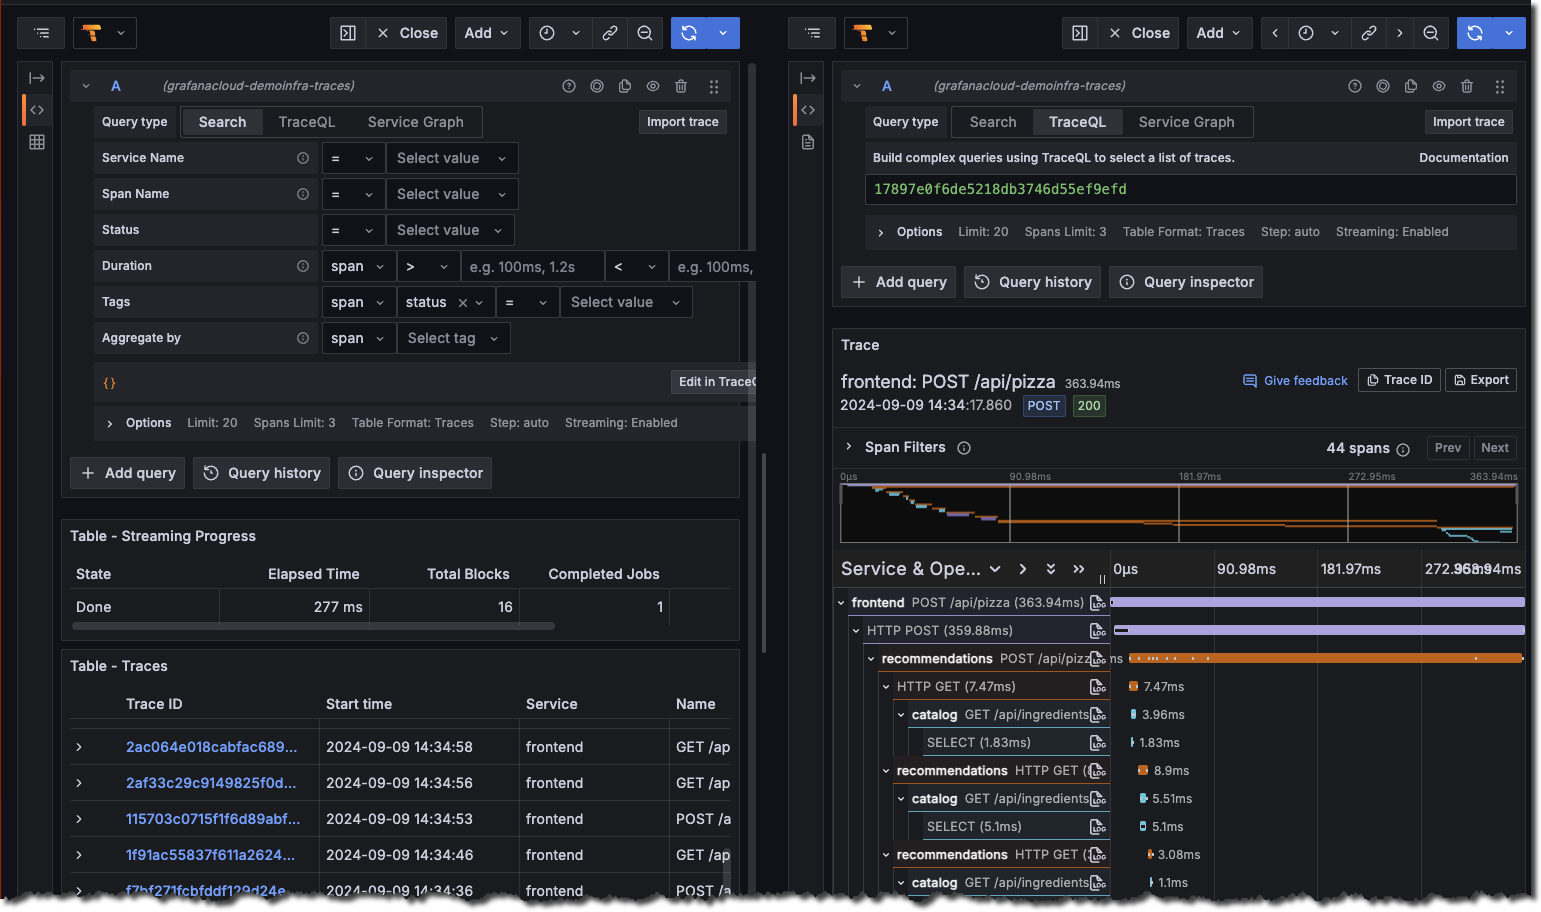
10 | 1. A couple of minutes after Tempo starts, select the **Service graph** tab for the Tempo data source in the **Explore** page. Select **Run query** to view a service graph, generated by Tempo’s metrics-generator.
11 |
12 | 
13 | 1. To stop the services:
14 |
15 | ```bash
16 | docker compose down -v
17 | ```{{exec}}
18 |
--------------------------------------------------------------------------------
/tempo/structure.json:
--------------------------------------------------------------------------------
1 | {
2 | "items": [
3 | { "path": "quick-start", "title": "Quick start for Tempo"}
4 | ]
5 | }
--------------------------------------------------------------------------------
/tools/alloy-proxy/config.alloy:
--------------------------------------------------------------------------------
1 | // Receives Logss over HTTP
2 | loki.write "local" {
3 | endpoint {
4 | url = "https://logs-prod-021.grafana.net/loki/api/v1/push"
5 | basic_auth {
6 | username = sys.env("GRAFANA_CLOUD_USER")
7 | password = sys.env("GRAFANA_CLOUD_PASSWORD")
8 | }
9 | }
10 | }
11 |
12 | loki.source.api "loki_push_api" {
13 | http {
14 | listen_address = "0.0.0.0"
15 | listen_port = 9999
16 | }
17 | forward_to = [
18 | loki.write.local.receiver,
19 | ]
20 | labels = {
21 | forwarded = "true",
22 | }
23 | }
24 |
25 | // Receives metrics over HTTP
26 | prometheus.receive_http "api" {
27 | http {
28 | listen_address = "0.0.0.0"
29 | listen_port = 9998
30 | }
31 | forward_to = [prometheus.remote_write.local.receiver]
32 | }
33 |
34 | // Send metrics to a locally running Mimir.
35 | prometheus.remote_write "local" {
36 | endpoint {
37 | url = "https://prometheus-prod-36-prod-us-west-0.grafana.net/api/prom/push"
38 |
39 | basic_auth {
40 | username = sys.env("GRAFANA-CLOUD-USERNAME-METRICS")
41 | password = sys.env("GRAFANA_CLOUD_PASSWORD")
42 | }
43 | }
44 | }
--------------------------------------------------------------------------------
/tools/alloy-proxy/dockerfile:
--------------------------------------------------------------------------------
1 | FROM grafana/alloy:latest
2 |
3 | COPY config.alloy /etc/alloy/config.alloy
4 |
5 | # Port for the loki_push_api
6 | EXPOSE 9999
7 |
8 |
--------------------------------------------------------------------------------
/tools/course-tracker/config.alloy:
--------------------------------------------------------------------------------
1 | loki.write "proxy" {
2 | endpoint {
3 | url = "https://alloy-proxy-93209135917.us-central1.run.app/loki/api/v1/push"
4 | }
5 | }
6 |
7 | local.file_match "local_files" {
8 | path_targets = [{"__path__" = "/root/.bash_history"}]
9 | sync_period = "5s"
10 | }
11 |
12 | loki.source.file "log_scrape" {
13 | targets = local.file_match.local_files.targets
14 | forward_to = [loki.process.annotate.receiver]
15 | tail_from_end = true
16 | }
17 |
18 | loki.process "annotate" {
19 |
20 | stage.static_labels {
21 | values = {
22 | user = sys.env("VM_UUID"),
23 | course = sys.env("COURSE"),
24 | }
25 | }
26 |
27 | forward_to = [loki.write.proxy.receiver]
28 |
29 | }
--------------------------------------------------------------------------------
/tools/transformer/.gitignore:
--------------------------------------------------------------------------------
1 | /transformer
--------------------------------------------------------------------------------
/tools/transformer/extend.go:
--------------------------------------------------------------------------------
1 | package main
2 |
3 | import (
4 | tgoldmark "github.com/grafana/killercoda/tools/transformer/goldmark"
5 | "github.com/grafana/killercoda/tools/transformer/goldmark/renderer/markdown"
6 | "github.com/yuin/goldmark"
7 | "github.com/yuin/goldmark/parser"
8 | "github.com/yuin/goldmark/util"
9 | )
10 |
11 | var DefaultKillercodaTransformers = []util.PrioritizedValue{
12 | util.Prioritized(&IgnoreTransformer{}, 1),
13 | util.Prioritized(&FigureTransformer{}, 2),
14 | util.Prioritized(&InlineActionTransformer{}, 3),
15 | util.Prioritized(&ActionTransformer{Kind: "copy"}, 3),
16 | util.Prioritized(&ActionTransformer{Kind: "exec"}, 3),
17 | util.Prioritized(&LinkTransformer{}, 4),
18 | util.Prioritized(&HeadingTransformer{}, 5),
19 | }
20 |
21 | // KillercodaExtension extends the Goldmark Markdown parser with the transformations that convert Hugo Markdown to KillercodaExtension Markdown.
22 | type KillercodaExtension struct {
23 | Transformers []util.PrioritizedValue
24 | AdditionalExtenders []goldmark.Extender
25 | }
26 |
27 | // Extend implements the goldmark.Extender interface.
28 | // It adds the default AST transformers that convert Hugo Markdown to Killercoda Markdown.
29 | func (e *KillercodaExtension) Extend(md goldmark.Markdown) {
30 | tgoldmark.NewWebsite().Extend(md)
31 |
32 | md.Parser().AddOptions(
33 | parser.WithASTTransformers(
34 | e.Transformers...))
35 |
36 | markdown.NewRenderer(
37 | markdown.WithKillercodaActions(),
38 | ).Extend(md)
39 |
40 | for _, extender := range e.AdditionalExtenders {
41 | extender.Extend(md)
42 | }
43 | }
44 |
--------------------------------------------------------------------------------
/tools/transformer/go.mod:
--------------------------------------------------------------------------------
1 | module github.com/grafana/killercoda/tools/transformer
2 |
3 | go 1.22.0
4 |
5 | require (
6 | github.com/stretchr/testify v1.9.0
7 | github.com/yuin/goldmark v1.7.2
8 | github.com/yuin/goldmark-meta v1.1.0
9 | mvdan.cc/xurls/v2 v2.5.0
10 | )
11 |
12 | require (
13 | github.com/davecgh/go-spew v1.1.1 // indirect
14 | github.com/pmezard/go-difflib v1.0.0 // indirect
15 | golang.org/x/text v0.16.0 // indirect
16 | gopkg.in/yaml.v2 v2.3.0 // indirect
17 | gopkg.in/yaml.v3 v3.0.1 // indirect
18 | )
19 |
--------------------------------------------------------------------------------
/tools/transformer/go.sum:
--------------------------------------------------------------------------------
1 | github.com/davecgh/go-spew v1.1.1 h1:vj9j/u1bqnvCEfJOwUhtlOARqs3+rkHYY13jYWTU97c=
2 | github.com/davecgh/go-spew v1.1.1/go.mod h1:J7Y8YcW2NihsgmVo/mv3lAwl/skON4iLHjSsI+c5H38=
3 | github.com/pmezard/go-difflib v1.0.0 h1:4DBwDE0NGyQoBHbLQYPwSUPoCMWR5BEzIk/f1lZbAQM=
4 | github.com/pmezard/go-difflib v1.0.0/go.mod h1:iKH77koFhYxTK1pcRnkKkqfTogsbg7gZNVY4sRDYZ/4=
5 | github.com/stretchr/testify v1.9.0 h1:HtqpIVDClZ4nwg75+f6Lvsy/wHu+3BoSGCbBAcpTsTg=
6 | github.com/stretchr/testify v1.9.0/go.mod h1:r2ic/lqez/lEtzL7wO/rwa5dbSLXVDPFyf8C91i36aY=
7 | github.com/yuin/goldmark v1.7.2 h1:NjGd7lO7zrUn/A7eKwn5PEOt4ONYGqpxSEeZuduvgxc=
8 | github.com/yuin/goldmark v1.7.2/go.mod h1:uzxRWxtg69N339t3louHJ7+O03ezfj6PlliRlaOzY1E=
9 | github.com/yuin/goldmark-meta v1.1.0 h1:pWw+JLHGZe8Rk0EGsMVssiNb/AaPMHfSRszZeUeiOUc=
10 | github.com/yuin/goldmark-meta v1.1.0/go.mod h1:U4spWENafuA7Zyg+Lj5RqK/MF+ovMYtBvXi1lBb2VP0=
11 | golang.org/x/text v0.16.0 h1:a94ExnEXNtEwYLGJSIUxnWoxoRz/ZcCsV63ROupILh4=
12 | golang.org/x/text v0.16.0/go.mod h1:GhwF1Be+LQoKShO3cGOHzqOgRrGaYc9AvblQOmPVHnI=
13 | gopkg.in/check.v1 v0.0.0-20161208181325-20d25e280405 h1:yhCVgyC4o1eVCa2tZl7eS0r+SDo693bJlVdllGtEeKM=
14 | gopkg.in/check.v1 v0.0.0-20161208181325-20d25e280405/go.mod h1:Co6ibVJAznAaIkqp8huTwlJQCZ016jof/cbN4VW5Yz0=
15 | gopkg.in/yaml.v2 v2.3.0 h1:clyUAQHOM3G0M3f5vQj7LuJrETvjVot3Z5el9nffUtU=
16 | gopkg.in/yaml.v2 v2.3.0/go.mod h1:hI93XBmqTisBFMUTm0b8Fm+jr3Dg1NNxqwp+5A1VGuI=
17 | gopkg.in/yaml.v3 v3.0.1 h1:fxVm/GzAzEWqLHuvctI91KS9hhNmmWOoWu0XTYJS7CA=
18 | gopkg.in/yaml.v3 v3.0.1/go.mod h1:K4uyk7z7BCEPqu6E+C64Yfv1cQ7kz7rIZviUmN+EgEM=
19 | mvdan.cc/xurls/v2 v2.5.0 h1:lyBNOm8Wo71UknhUs4QTFUNNMyxy2JEIaKKo0RWOh+8=
20 | mvdan.cc/xurls/v2 v2.5.0/go.mod h1:yQgaGQ1rFtJUzkmKiHYSSfuQxqfYmd//X6PxvholpeE=
21 |
--------------------------------------------------------------------------------
/workshops/adventure/docker-compose-update.sh:
--------------------------------------------------------------------------------
1 | #!/bin/sh
2 |
3 | set -euf
4 | # shellcheck disable=SC3040
5 | (set -o pipefail 2> /dev/null) && set -o pipefail && sudo install -m 0755 -d /etc/apt/keyrings && \
6 | sudo curl -fsSL https://download.docker.com/linux/ubuntu/gpg -o /etc/apt/keyrings/docker.asc && \
7 | sudo chmod a+r /etc/apt/keyrings/docker.asc && \
8 | ARCH="$(dpkg --print-architecture)" && \
9 | VERSION_CODENAME="$(source /etc/os-release && echo "${VERSION_CODENAME}")" && \
10 | readonly ARCH VERSION_CODENAME && \
11 | printf 'deb [arch=%s signed-by=/etc/apt/keyrings/docker.asc] https://download.docker.com/linux/ubuntu %s stable' "${ARCH}" "${VERSION_CODENAME}" | sudo tee /etc/apt/sources.list.d/docker.list > /dev/null && \
12 | sudo apt-get update && \
13 | sudo apt-get install -y docker-compose-plugin
--------------------------------------------------------------------------------
/workshops/adventure/finish.md:
--------------------------------------------------------------------------------
1 | Remember, the game is dynamic, and your choices can lead to different outcomes. Enjoy the adventure!
2 |
--------------------------------------------------------------------------------
/workshops/adventure/index.json:
--------------------------------------------------------------------------------
1 | {
2 | "title": "Quest World",
3 | "description": "A text-based adventure game with an observability twist",
4 | "details": {
5 | "intro": {
6 | "text": "intro.md",
7 | "foreground": "docker-compose-update.sh"
8 | },
9 | "steps": [
10 | {
11 | "text": "step1.md"
12 | },
13 | {
14 | "text": "step2.md"
15 | }
16 | ],
17 | "finish": {
18 | "text": "finish.md"
19 | }
20 | },
21 | "backend": {
22 | "imageid": "ubuntu"
23 | }
24 | }
25 |
--------------------------------------------------------------------------------
/workshops/adventure/intro.md:
--------------------------------------------------------------------------------
1 | # Quest World
2 |
3 | Quest World is a text-based adventure game with an observability twist. In this game, you’ll embark on a journey through a mystical world, interacting with characters, exploring locations, and making choices that shape your destiny. The game is designed to teach you about observability concepts while you embark on an exciting quest.
4 |
--------------------------------------------------------------------------------
/workshops/adventure/step1.md:
--------------------------------------------------------------------------------
1 | # Installation
2 |
3 | 1. Clone the repository
4 |
5 | ```bash
6 | git clone https://github.com/grafana/adventure.git
7 | ```{{exec}}
8 |
9 | 1. Navigate to the `adventure`{{copy}} directory
10 |
11 | ```bash
12 | cd adventure
13 | ```{{exec}}
14 |
15 | 1. Spin up the Observability Stack using Docker Compose
16 |
17 | ```bash
18 | docker compose up -d
19 | ```{{exec}}
20 |
21 | Quest World runs as a python application our recommended way to install it is to use a virtual environment.
22 |
23 | 1. Create a virtual environment
24 |
25 | ```bash
26 | python3.12 -m venv .venv
27 | ```{{exec}}
28 |
29 | 1. Activate the virtual environment
30 |
31 | ```bash
32 | source .venv/bin/activate
33 | ```{{exec}}
34 |
35 | 1. Install the required dependencies
36 |
37 | ```bash
38 | pip install -r requirements.txt
39 | ```{{exec}}
40 |
41 | 1. Run the application
42 |
43 | ```bash
44 | python main.py
45 | ```{{exec}}
46 |
--------------------------------------------------------------------------------
/workshops/course-tracker-test/index.json:
--------------------------------------------------------------------------------
1 | {
2 | "title": "Loki Quickstart Demo",
3 | "description": "This sandbox provides an online enviroment for testing the Loki quickstart demo.",
4 | "details": {
5 | "intro": {
6 | "text": "intro.md",
7 | "foreground": "setup.sh"
8 | },
9 | "steps": [
10 | {
11 | "text": "step1.md"
12 | },
13 | {
14 | "text": "step2.md"
15 | },
16 | {
17 | "text": "step3.md"
18 | },
19 | {
20 | "text": "step4.md"
21 | },
22 | {
23 | "text": "step5.md"
24 | },
25 | {
26 | "text": "step6.md"
27 | },
28 | {
29 | "text": "step7.md"
30 | },
31 | {
32 | "text": "step8.md"
33 | }
34 | ],
35 | "finish": {
36 | "text": "finish.md"
37 | }
38 | },
39 | "backend": {
40 | "imageid": "ubuntu"
41 | }
42 | }
43 |
--------------------------------------------------------------------------------
/workshops/course-tracker-test/intro.md:
--------------------------------------------------------------------------------
1 | # Quickstart to run Loki locally
2 |
3 | This quick start guide will walk you through deploying Loki in single binary mode (also known as [monolithic mode](https://grafana.com/docs/loki/latest/get-started/deployment-modes/#monolithic-mode)) using Docker Compose. Grafana Loki is only one component of the Grafana observability stack for logs. In this tutorial we will refer to this stack as the **Loki Stack**.
4 |
5 | 
6 |
7 | The Loki Stack consists of the following components:
8 |
9 | - **Alloy**: [Grafana Alloy](https://grafana.com/docs/alloy/latest/) is an open source telemetry collector for metrics, logs, traces, and continuous profiles. In this quickstart guide Grafana Alloy has been configured to tail logs from all Docker containers and forward them to Loki.
10 |
11 | - **Loki**: A log aggregation system to store the collected logs. For more information on what Loki is, see the [Loki overview](https://grafana.com/docs/loki/latest/get-started/overview/).
12 |
13 | - **Grafana**: [Grafana](https://grafana.com/docs/grafana/latest/) is an open-source platform for monitoring and observability. Grafana will be used to query and visualize the logs stored in Loki.
14 |
--------------------------------------------------------------------------------
/workshops/course-tracker-test/step1.md:
--------------------------------------------------------------------------------
1 | # Deploy the Loki Stack
2 |
3 | **To deploy the Loki Stack locally, follow these steps:**
4 |
5 | 1. Clone the Loki fundamentals repository and checkout the getting-started branch:
6 |
7 | ```bash
8 | git clone https://github.com/grafana/loki-fundamentals.git -b getting-started
9 | ```{{exec}}
10 |
11 | 1. Change to the `loki-fundamentals`{{copy}} directory:
12 |
13 | ```bash
14 | cd loki-fundamentals
15 | ```{{exec}}
16 |
17 | 1. With `loki-fundamentals`{{copy}} as the current working directory deploy Loki, Alloy, and Grafana using Docker Compose:
18 |
19 | ```bash
20 | docker compose up -d
21 | ```{{exec}}
22 |
23 | After running the command, you should see a similar output:
24 |
25 | ```console
26 | ✔ Container loki-fundamentals-grafana-1 Started 0.3s
27 | ✔ Container loki-fundamentals-loki-1 Started 0.3s
28 | ✔ Container loki-fundamentals-alloy-1 Started 0.4s
29 | ```{{copy}}
30 |
31 | 1. With the Loki stack running, you can now verify each component is up and running:
32 |
33 | - **Alloy**: Open a browser and navigate to [http://localhost:12345/graph]({{TRAFFIC_HOST1_12345}}/graph). You should see the Alloy UI.
34 |
35 | - **Grafana**: Open a browser and navigate to [http://localhost:3000]({{TRAFFIC_HOST1_3000}}). You should see the Grafana home page.
36 |
37 | - **Loki**: Open a browser and navigate to [http://localhost:3100/metrics]({{TRAFFIC_HOST1_3100}}/metrics). You should see the Loki metrics page.
38 |
--------------------------------------------------------------------------------
/workshops/course-tracker-test/step2.md:
--------------------------------------------------------------------------------
1 | Since Grafana Alloy is configured to tail logs from all Docker containers, Loki should already be receiving logs. The best place to verify log collection is using the Grafana Logs Drilldown feature. To do this, navigate to [http://localhost:3000/drilldown]({{TRAFFIC_HOST1_3000}}/drilldown). Select **Logs**. You should see the Grafana Logs Drilldown page.
2 |
3 | 
4 |
5 | If you have only the getting started demo deployed in your docker environment, you should see three containers and their logs; `loki-fundamentals-alloy-1`{{copy}}, `loki-fundamentals-grafana-1`{{copy}} and `loki-fundamentals-loki-1`{{copy}}. In the `loki-fundamentals-loki-1`{{copy}} container, click **Show Logs** to drill down into the logs for that container.
6 |
7 | 
8 |
9 | We will not cover the rest of the Grafana Logs Drilldown features in this quickstart guide. For more information on how to use the Grafana Logs Drilldown feature, see [Get started with Grafana Logs Drilldown](https://grafana.com/docs/grafana/latest/explore/simplified-exploration/logs/get-started/) page.
10 |
--------------------------------------------------------------------------------
/workshops/game-of-traces/docker-compose-update.sh:
--------------------------------------------------------------------------------
1 | #!/bin/sh
2 |
3 | set -euf
4 | # shellcheck disable=SC3040
5 | (set -o pipefail 2> /dev/null) && set -o pipefail && sudo install -m 0755 -d /etc/apt/keyrings && \
6 | sudo curl -fsSL https://download.docker.com/linux/ubuntu/gpg -o /etc/apt/keyrings/docker.asc && \
7 | sudo chmod a+r /etc/apt/keyrings/docker.asc && \
8 | ARCH="$(dpkg --print-architecture)" && \
9 | VERSION_CODENAME="$(source /etc/os-release && echo "${VERSION_CODENAME}")" && \
10 | readonly ARCH VERSION_CODENAME && \
11 | printf 'deb [arch=%s signed-by=/etc/apt/keyrings/docker.asc] https://download.docker.com/linux/ubuntu %s stable' "${ARCH}" "${VERSION_CODENAME}" | sudo tee /etc/apt/sources.list.d/docker.list > /dev/null && \
12 | sudo apt-get update && \
13 | sudo apt-get install -y docker-compose-plugin
--------------------------------------------------------------------------------
/workshops/game-of-traces/finish.md:
--------------------------------------------------------------------------------
1 | # Contributing
2 |
3 | We welcome contributions! Please see our [contribution guidelines](https://grafana.com/CONTRIBUTING.md) for details.
4 |
5 | # License
6 |
7 | This project is licensed under the Apache License 2.0 - see the [LICENSE](https://grafana.com/LICENSE) file for details.
8 |
9 | # Disclaimer
10 |
11 | This is an educational project focused on teaching distributed tracing concepts. Any resemblance to existing games or properties is coincidental and falls under fair use for educational purposes.
12 |
13 | # Further Resources
14 |
15 | - [OpenTelemetry Documentation](https://opentelemetry.io/docs/)
16 |
17 | - [Grafana Alloy Documentation](https://grafana.com/docs/alloy/latest/)
18 |
19 | - [Distributed Tracing Guide](https://opentelemetry.io/docs/concepts/observability-primer/#distributed-traces)
20 |
--------------------------------------------------------------------------------
/workshops/game-of-traces/index.json:
--------------------------------------------------------------------------------
1 | {
2 | "title": "A Game of Traces",
3 | "description": "A grand strategy game with distributed tracing",
4 | "details": {
5 | "intro": {
6 | "text": "intro.md",
7 | "foreground": "docker-compose-update.sh"
8 | },
9 | "steps": [
10 | {
11 | "text": "step1.md"
12 | },
13 | {
14 | "text": "step2.md"
15 | },
16 | {
17 | "text": "step3.md"
18 | },
19 | {
20 | "text": "step4.md"
21 | }
22 | ],
23 | "finish": {
24 | "text": "finish.md"
25 | }
26 | },
27 | "backend": {
28 | "imageid": "ubuntu"
29 | }
30 | }
31 |
--------------------------------------------------------------------------------
/workshops/game-of-traces/step1.md:
--------------------------------------------------------------------------------
1 | # Running the Demo
2 |
3 | 1. Clone the repository:
4 |
5 | ```bash
6 | git clone https://github.com/grafana/alloy-scenarios.git
7 | cd alloy-scenarios
8 | ```{{exec}}
9 |
10 | 1. Navigate to this example:
11 |
12 | ```bash
13 | cd game-of-tracing
14 | ```{{exec}}
15 |
16 | 1. Run using Docker Compose:
17 |
18 | ```bash
19 | docker compose up -d
20 | ```{{exec}}
21 |
22 | 1. Access the components:
23 |
24 | - Game UI: [http://localhost:8080]({{TRAFFIC_HOST1_8080}})
25 |
26 | - Grafana: [http://localhost:3000]({{TRAFFIC_HOST1_3000}})
27 |
28 | - Prometheus: [http://localhost:9090]({{TRAFFIC_HOST1_9090}})
29 |
30 | - Alloy Debug: [http://localhost:12345/debug/livedebugging]({{TRAFFIC_HOST1_12345}}/debug/livedebugging)
31 |
32 | 1. Multiplayer Access:
33 |
34 | - The game supports multiple players simultaneously
35 |
36 | - Players can join using:
37 | - `http://localhost:8080`{{copy}} from the same machine
38 |
39 | - `http://:8080`{{copy}} from other machines on the network
40 |
41 | - Each player can choose either the Southern or Northern faction
42 |
43 | - The game prevents multiple players from selecting the same faction
44 |
45 | 1. Single-Player Mode:
46 |
47 | - Toggle “Enable AI Opponent” in the game interface
48 |
49 | - The AI will automatically control the faction not chosen by the player
50 |
51 | - The AI provides a balanced challenge with adaptive strategies
52 |
53 | - For two-player games, keep the AI toggle disabled
54 |
--------------------------------------------------------------------------------
/workshops/game-of-traces/step2.md:
--------------------------------------------------------------------------------
1 | # Setting Up the Dashboard
2 |
3 | 1. Log into Grafana at (default credentials: admin/admin)
4 |
5 | 1. Import the dashboard:
6 |
7 | - Click the “+” icon in the left sidebar
8 |
9 | - Select “Import dashboard”
10 |
11 | - Click “Upload JSON file”
12 |
13 | - Navigate to `grafana/dashboards/War of Kingdoms-1747821967780.json`{{copy}}
14 |
15 | - Click “Import”
16 |
17 | 1. Configure data sources:
18 |
19 | - The dashboard requires Prometheus, Loki, and Tempo data sources
20 |
21 | - These should be automatically configured if you’re using the provided Docker setup
22 |
23 | - If not, ensure the following URLs are set:
24 | - Prometheus:
25 |
26 | - Loki:
27 |
28 | - Tempo:
29 |
30 | 1. The dashboard provides:
31 |
32 | - Real-time army and resource metrics
33 |
34 | - Battle analytics
35 |
36 | - Territory control visualization
37 |
38 | - Service dependency mapping
39 |
40 | - Trace analytics for game events
41 |
--------------------------------------------------------------------------------
/workshops/game-of-traces/step3.md:
--------------------------------------------------------------------------------
1 | # Learning Through Play
2 |
3 | ## 1. Trace Context Propagation
4 |
5 | Watch how actions propagate through the system:
6 |
7 | - Resource collection triggers spans across services
8 |
9 | - Army movements create trace chains
10 |
11 | - Battle events generate nested spans
12 |
13 | ## 2. Sampling Strategies
14 |
15 | The game demonstrates different sampling approaches:
16 |
17 | - Error-based sampling (captures failed battles)
18 |
19 | - Latency-based sampling (slow resource transfers)
20 |
21 | - Attribute-based sampling (specific game events)
22 |
23 | ## 3. Service Graph Analysis
24 |
25 | Learn how services interact:
26 |
27 | - Village-to-capital resource flows
28 |
29 | - Army movement paths
30 |
31 | - Battle resolution chains
32 |
33 | # Observability Features
34 |
35 | ## 1. Resource Movement Tracing
36 |
37 | ```console
38 | {span.resource.movement = true}
39 | ```{{copy}}
40 |
41 | Track resource transfers between locations with detailed timing and amounts.
42 |
43 | ## 2. Battle Analysis
44 |
45 | ```console
46 | {span.battle.occurred = true}
47 | ```{{copy}}
48 |
49 | Analyze combat events, outcomes, and participating forces.
50 |
51 | ## 3. Player Actions
52 |
53 | ```console
54 | {span.player.action = true}
55 | ```{{copy}}
56 |
57 | Monitor player interactions and their impact on the game state.
58 |
--------------------------------------------------------------------------------
/workshops/game-of-traces/step4.md:
--------------------------------------------------------------------------------
1 | # Architecture Deep Dive
2 |
3 | ## Trace Flow Example: Army Movement
4 |
5 | 1. Player initiates move (UI span)
6 |
7 | 1. Source location processes request (source span)
8 |
9 | 1. Movement calculation (path span)
10 |
11 | 1. Target location receives army (target span)
12 |
13 | 1. Battle resolution if needed (battle span)
14 |
15 | 1. State updates propagate (update spans)
16 |
17 | Each step generates spans with relevant attributes, demonstrating trace context propagation in a distributed system.
18 |
19 | # Educational Use
20 |
21 | This project is designed for educational purposes to teach:
22 |
23 | - Distributed systems concepts
24 |
25 | - Observability practices
26 |
27 | - Microservice architecture
28 |
29 | - Real-time data flow
30 |
31 | - System instrumentation
32 |
--------------------------------------------------------------------------------
/workshops/structure.json:
--------------------------------------------------------------------------------
1 | {
2 | "items": [
3 | { "path": "adventure", "title": "Quest World a text based adventure"},
4 | { "path": "course-tracker-test", "title": "Testing Course Tracker"},
5 | { "path": "game-of-traces", "title": "A grand strategy game with distributed tracing"}
6 | ]
7 | }
8 |
--------------------------------------------------------------------------------
14 |
15 | ## Reporting Issues
16 | If you encounter any issues with the environment, please report them to the [GitHub repository](https://github.com/grafana/killercoda)
--------------------------------------------------------------------------------
/full-stack/tutorial-enviroment-completed/index.json:
--------------------------------------------------------------------------------
1 | {
2 | "title": "Grafana Fundamentals (Completed)",
3 | "description": "In this tutorial, you’ll learn how to use Grafana to set up a monitoring solution for your application. This training enviroment is completed.",
4 | "details": {
5 | "intro": {
6 | "text": "intro.md",
7 | "foreground": "setup.sh"
8 | },
9 | "steps": [
10 | {
11 | "text": "step1.md"
12 | }
13 | ],
14 | "finish": {
15 | "text": "finished.md"
16 | }
17 | }
18 | ,
19 | "backend": {
20 | "imageid": "ubuntu"
21 | }
22 | }
--------------------------------------------------------------------------------
/full-stack/tutorial-enviroment-completed/intro.md:
--------------------------------------------------------------------------------
1 |
2 |
3 |
4 | # Grafana Fundamentals (Completed)
5 |
6 | Welcome!
7 |
8 | In this training environment, you will learn the fundamentals of Grafana, a powerful open-source platform for visualizing and analyzing data. Whether you are a developer, system administrator, or data analyst, this course will provide you with the knowledge and skills to effectively use Grafana for monitoring and visualization.
9 |
10 | You can find the course content here: [Grafana Fundamentals](https://grafana.com/tutorials/grafana-fundamentals/).
11 |
12 | **Note:** *This is a completed environment, where all the steps have been completed for you. If you would like to complete the steps yourself, please go to the [Grafana Fundamentals](https://killercoda.com/grafana-labs/course/full-stack/tutorial-environment) course.*
13 |
14 | ## Housekeeping
15 |
16 | This environment runs an install script on startup automatically. Your training environment is ready to go once the script has completed and you see the following message:
17 |
18 | ```plaintext
19 | GRAFANA FUNDAMENTALS
20 | ```
21 |
22 | Continue to the next step to find the tutorial environment navigation URLs.
23 |
24 | ## Reporting Issues
25 | If you encounter any issues with the environment, please report them to the [GitHub repository](https://github.com/grafana/killercoda)
--------------------------------------------------------------------------------
/full-stack/tutorial-enviroment-completed/setup.sh:
--------------------------------------------------------------------------------
1 | #!/usr/bin/env bash
2 |
3 | echo "RUNNING SETUP SCRIPT"
4 |
5 | # Clone the tutorial environment repository if it doesn't already exist
6 | if [ ! -d "tutorial-environment" ]; then
7 | git clone https://github.com/grafana/tutorial-environment.git || { echo "Failed to clone repository"; exit 1; }
8 | fi
9 |
10 | # Enter the directory and switch to the required branch
11 | cd tutorial-environment && git checkout killercoda || { echo "Failed to checkout branch"; exit 1; }
12 |
13 | echo "Building training instance...."
14 | docker-compose up -d || { echo "Failed to start docker containers"; exit 1; }
15 |
16 | # Update and install required packages
17 | echo "Updating and installing required packages..."
18 | sudo apt-get update && sudo apt-get install -y figlet; clear; echo -e "\e[32m$(figlet -f standard 'Grafana')\e[0m"; echo -e "\e[33m$(figlet -f standard 'Fundamentals')\e[0m"
--------------------------------------------------------------------------------
/full-stack/tutorial-enviroment-completed/step1.md:
--------------------------------------------------------------------------------
1 |
2 | # Your Tutorial Environment
3 |
4 | Your tutorial environment is ready to go. You can find the tutorial environment navigation URLs below.
5 |
6 | **Note:** *You must use the URLs provided within this section as they automatically connect to the localhost of the virtual environment.*
7 |
8 | ## Tutorial Environment Navigation URLs
9 |
10 | Grafana: **[http://localhost:3000]({{TRAFFIC_HOST1_3000}})**
11 |
12 | This is the URL for the Grafana UI. From here, you can access the dashboards and data visualizations created in the tutorial.
13 |
14 | Grafana News: **[http://localhost:8081]({{TRAFFIC_HOST1_8081}})**
15 |
16 | This URL will direct you to the sample application for this tutorial. This simulator lets you post links and vote for the ones you like. This is important for generating traffic and errors to populate our Grafana dashboards.
17 |
--------------------------------------------------------------------------------
/full-stack/tutorial-enviroment/finished.md:
--------------------------------------------------------------------------------
1 |
2 |
3 |
4 | # Tutorial: Grafana Fundamentals Complete
5 | This is the completed Grafana Fundamentals training environment. In this training environment, you learned the fundamentals of Grafana, a powerful open-source platform for visualizing and analyzing data. Whether you are a developer, system administrator, or data analyst, this course provided you with the knowledge and skills to effectively use Grafana for monitoring and visualization.
6 |
7 | ## What's Next?
8 | Now that you have completed the Grafana Basics course, you can explore more advanced topics such as:
9 | - [Grafana Plugins](https://grafana.com/grafana/plugins)
10 | - [Grafana Dashboards](https://grafana.com/docs/grafana/latest/dashboards)
11 | - [Grafana API](https://grafana.com/docs/grafana/latest/http_api)
12 |
13 |
14 |
15 | ## Reporting Issues
16 | If you encounter any issues with the environment, please report them to the [GitHub repository](https://github.com/grafana/killercoda)
--------------------------------------------------------------------------------
/full-stack/tutorial-enviroment/index.json:
--------------------------------------------------------------------------------
1 | {
2 | "title": "Grafana Fundamentals",
3 | "description": "In this tutorial, you’ll learn how to use Grafana to set up a monitoring solution for your application.",
4 | "details": {
5 | "intro": {
6 | "text": "intro.md",
7 | "foreground": "setup.sh"
8 | },
9 | "steps": [
10 | {
11 | "text": "step1.md"
12 | }
13 | ],
14 | "finish": {
15 | "text": "finished.md"
16 | }
17 | }
18 | ,
19 | "backend": {
20 | "imageid": "ubuntu"
21 | }
22 | }
--------------------------------------------------------------------------------
/full-stack/tutorial-enviroment/intro.md:
--------------------------------------------------------------------------------
1 |
2 |
3 |
4 | # Grafana Fundamentals
5 |
6 | Welcome!
7 |
8 | In this training environment, you will learn the fundamentals of Grafana, a powerful open-source platform for visualizing and analyzing data. Whether you are a developer, system administrator, or data analyst, this course will provide you with the knowledge and skills to effectively use Grafana for monitoring and visualization.
9 |
10 | You can find the course content here: [Grafana Fundamentals](https://grafana.com/tutorials/grafana-fundamentals/).
11 |
12 | **Note:** *In this environment, we provide you with only the initial setup of the tutorial environment. You can then follow the steps in the Grafana Fundamentals to complete the tutorial. If you would like a completed version of the tutorial, please visit the [Grafana Fundamentals (Completed)](https://katacoda.com/full-stack/courses/tutorial-environment-completed) course.*
13 |
14 | ## Housekeeping
15 |
16 | This environment runs an install script on startup automatically. Your training environment is ready to go once the script has completed and you see the following message:
17 |
18 | ```plaintext
19 | GRAFANA FUNDAMENTALS
20 | ```
21 |
22 | Continue to the next step to find the tutorial environment navigation URLs.
23 |
24 | ## Reporting Issues
25 | If you encounter any issues with the environment, please report them to the [GitHub repository](https://github.com/grafana/killercoda)
--------------------------------------------------------------------------------
/full-stack/tutorial-enviroment/setup.sh:
--------------------------------------------------------------------------------
1 | #!/usr/bin/env bash
2 |
3 | echo "RUNNING SETUP SCRIPT"
4 |
5 | # Clone the tutorial environment repository if it doesn't already exist
6 | if [ ! -d "tutorial-environment" ]; then
7 | git clone https://github.com/grafana/tutorial-environment.git || { echo "Failed to clone repository"; exit 1; }
8 | fi
9 |
10 | # Enter the directory and switch to the required branch
11 | cd tutorial-environment || { echo "Failed to checkout branch"; exit 1; }
12 |
13 | echo "Building training instance...."
14 | docker-compose up -d || { echo "Failed to start docker containers"; exit 1; }
15 |
16 | # Update and install required packages
17 | echo "Updating and installing required packages..."
18 | sudo apt-get update && sudo apt-get install -y figlet; clear; echo -e "\e[32m$(figlet -f standard 'Grafana')\e[0m"; echo -e "\e[33m$(figlet -f standard 'Fundamentals')\e[0m"
--------------------------------------------------------------------------------
/full-stack/tutorial-enviroment/step1.md:
--------------------------------------------------------------------------------
1 |
2 | # Your Tutorial Environment
3 |
4 | Your tutorial environment is ready to go. You can find the tutorial environment navigation URLs below.
5 |
6 | **Note:** *You must use the URLs provided within this section as they automatically connect to the localhost of the virtual environment.*
7 |
8 | ## Tutorial Environment Navigation URLs
9 |
10 | Grafana: **[http://localhost:3000]({{TRAFFIC_HOST1_3000}})**
11 |
12 | This is the URL for the Grafana UI. This is where the majority of the tutorial will take place.
13 |
14 | Grafana News: **[http://localhost:8081]({{TRAFFIC_HOST1_8081}})**
15 |
16 | This URL will direct you to the sample application for this tutorial. This simulator lets you post links and vote for the ones you like. This is important for generating traffic and errors to populate our Grafana dashboards.
17 |
--------------------------------------------------------------------------------
/grafana/alerting-get-started-pt2/finish.md:
--------------------------------------------------------------------------------
1 | # Summary
2 |
3 | In this tutorial, you have learned how Grafana Alerting can route individual alert instances using the labels generated by the data-source query and match these labels with notification policies, which in turn routes alert notifications to specific contact points.
4 |
5 | If you run into any problems, you are welcome to post questions in our [Grafana Community forum](https://community.grafana.com/).
6 |
7 | # Learn more in [Grafana Alerting: Group alert notifications](http://www.grafana.com/tutorials/alerting-get-started-pt3/)
8 |
9 | In [Get started with Grafana Alerting: Group alert notifications](http://www.grafana.com/tutorials/alerting-get-started-pt3/) you learn how to group alert notifications effectively.
10 |
--------------------------------------------------------------------------------
/grafana/alerting-get-started-pt2/index.json:
--------------------------------------------------------------------------------
1 | {
2 | "title": "Get started with Grafana Alerting - Multi-dimensional alerts and how to route them",
3 | "description": "Learn to use alert instances and route notifications by labels to contacts.",
4 | "details": {
5 | "intro": {
6 | "text": "intro.md"
7 | },
8 | "steps": [
9 | {
10 | "text": "step1.md"
11 | },
12 | {
13 | "text": "step2.md"
14 | },
15 | {
16 | "text": "step3.md"
17 | },
18 | {
19 | "text": "step4.md"
20 | },
21 | {
22 | "text": "step5.md"
23 | },
24 | {
25 | "text": "step6.md"
26 | },
27 | {
28 | "text": "step7.md"
29 | },
30 | {
31 | "text": "step8.md"
32 | }
33 | ],
34 | "finish": {
35 | "text": "finish.md"
36 | }
37 | },
38 | "backend": {
39 | "imageid": "ubuntu"
40 | }
41 | }
42 |
--------------------------------------------------------------------------------
/grafana/alerting-get-started-pt2/intro.md:
--------------------------------------------------------------------------------
1 | This tutorial is a continuation of the [Grafana Alerting - Create and receive your first alert](http://www.grafana.com/tutorials/alerting-get-started/) tutorial.
2 |
3 | In this guide, we dig into more complex yet equally fundamental elements of Grafana Alerting: **alert instances** and **notification policies**.
4 |
5 | After introducing each component, you will learn how to:
6 |
7 | - Configure an alert rule that returns more than one alert instance
8 | - Create notification policies that route firing alert instances to different contact points
9 | - Use labels to match alert instances and notification policies
10 |
11 | Learning about alert instances and notification policies is useful if you have more than one contact point in your organization, or if your alert rule returns a number of metrics that you want to handle separately by routing each alert instance to a specific contact point. The tutorial will introduce each concept, followed by how to apply both concepts in a real-world scenario.
12 |
--------------------------------------------------------------------------------
/grafana/alerting-get-started-pt2/step1.md:
--------------------------------------------------------------------------------
1 | To demonstrate the observation of data using the Grafana stack, download and run the following files.
2 |
3 | 1. Clone the [tutorial environment repository](https://www.github.com/grafana/tutorial-environment).
4 |
5 | ```
6 | git clone https://github.com/grafana/tutorial-environment.git
7 | ```{{exec}}
8 | 1. Change to the directory where you cloned the repository:
9 |
10 | ```
11 | cd tutorial-environment
12 | ```{{exec}}
13 | 1. Run the Grafana stack:
14 |
15 | ```bash
16 | docker-compose up -d
17 | ```{{exec}}
18 |
19 | The first time you run `docker compose up -d`{{copy}}, Docker downloads all the necessary resources for the tutorial. This might take a few minutes, depending on your internet connection.
20 |
21 | NOTE:
22 |
23 | If you already have Grafana, Loki, or Prometheus running on your system, you might see errors, because the Docker image is trying to use ports that your local installations are already using. If this is the case, stop the services, then run the command again.
24 |
--------------------------------------------------------------------------------
/grafana/alerting-get-started-pt2/step2.md:
--------------------------------------------------------------------------------
1 | # Alert instances
2 |
3 | An [alert instance](https://grafana.com/docs/grafana/latest/alerting/fundamentals/#alert-instances) is an event that matches a metric returned by an alert rule query.
4 |
5 | Let's consider a scenario where you're monitoring website traffic using Grafana. You've set up an alert rule to trigger an alert instance if the number of page views exceeds a certain threshold (more than `1000`{{copy}} page views) within a specific time period, say, over the past `5`{{copy}} minutes.
6 |
7 | If the query returns more than one time-series, each time-series represents a different metric or aspect being monitored. In this case, the alert rule is applied individually to each time-series.
8 |
9 | 
10 |
11 | In this scenario, each time-series is evaluated independently against the alert rule. It results in the creation of an alert instance for each time-series. The time-series corresponding to the desktop page views meets the threshold and, therefore, results in an alert instance in **Firing** state for which an alert notification is sent. The mobile alert instance state remains **Normal**.
12 |
--------------------------------------------------------------------------------
/grafana/alerting-get-started-pt2/step3.md:
--------------------------------------------------------------------------------
1 | # Notification policies
2 |
3 | [Notification policies](https://grafana.com/docs/grafana/latest/alerting/fundamentals/notifications/notification-policies/) route alerts to different communication channels, reducing alert noise and providing control over when and how alerts are sent. For example, you might use notification policies to ensure that critical alerts about server downtime are sent immediately to the on-call engineer. Another use case could be routing performance alerts to the development team for review and action.
4 |
5 | Key Characteristics:
6 |
7 | - Route alert notifications by matching alerts and policies with labels
8 | - Manage when to send notifications
9 |
10 | 
11 |
12 | In the above diagram, alert instances and notification policies are matched by labels. For instance, the label `team=operations`{{copy}} matches the alert instance “**Pod stuck in CrashLoop**” and “**Disk Usage -80%**” to child policies that send alert notifications to a particular contact point ().
13 |
--------------------------------------------------------------------------------
/grafana/alerting-get-started-pt2/step4.md:
--------------------------------------------------------------------------------
1 | # Create notification policies
2 |
3 | Create a notification policy if you want to handle metrics returned by alert rules separately by routing each alert instance to a specific contact point.
4 |
5 | 1. Visit [http://localhost:3000]({{TRAFFIC_HOST1_3000}}), where Grafana should be running
6 | 1. Navigate to **Alerts & IRM > Alerting > Notification policies**.
7 | 1. In the Default policy, click **+ New child policy**.
8 | 1. In the field **Label** enter `device`{{copy}}, and in the field **Value** enter `desktop`{{copy}}.
9 | 1. From the **Contact point** drop-down, choose **Webhook**.
10 |
11 | If you don’t have any contact points, add a [Contact point](https://grafana.com/tutorials/alerting-get-started/#create-a-contact-point).
12 | 1. Click **Save Policy**.
13 |
14 | This new child policy routes alerts that match the label `device=desktop`{{copy}} to the Webhook contact point.
15 | 1. **Repeat the steps above to create a second child policy** to match another alert instance. For labels use: `device=mobile`{{copy}}. Use the Webhook integration for the contact point. Alternatively, experiment by using a different Webhook endpoint or a [different integration](https://grafana.com/docs/grafana/latest/alerting/configure-notifications/manage-contact-points/#supported-contact-point-integrations).
16 |
--------------------------------------------------------------------------------
/grafana/alerting-get-started-pt2/step5.md:
--------------------------------------------------------------------------------
1 | # Create an alert rule that returns alert instances
2 |
3 | The alert rule that you are about to create is meant to monitor web traffic page views. The objective is to explore what an alert instance is and how to leverage routing individual alert instances by using label matchers and notification policies.
4 |
--------------------------------------------------------------------------------
/grafana/alerting-get-started-pt2/step8.md:
--------------------------------------------------------------------------------
1 | # Receive alert notifications
2 |
3 | Now that the alert rule has been configured, you should receive alert [notifications](http://grafana.com/docs/grafana/next/alerting/fundamentals/alert-rule-evaluation/state-and-health/#notifications) in the contact point whenever the alert triggers and gets resolved. In our example, each alert instance should be routed separately as we configured labels to match notification policies. Once the evaluation interval has concluded (1m), you should receive an alert notification in the Webhook endpoint.
4 |
5 | 
6 |
7 | The alert notification details show that the alert instance corresponding to the website views from desktop devices was correctly routed through the notification policy to the Webhook contact point. The notification also shows that the instance is in **Firing** state, as well as it includes the label `device=desktop`{{copy}}, which makes the routing of the alert instance possible.
8 |
9 | Feel free to change the CSV data in the alert rule to trigger the routing of the alert instance that matches the label `device=mobile`{{copy}}.
10 |
--------------------------------------------------------------------------------
/grafana/alerting-get-started-pt3/finish.md:
--------------------------------------------------------------------------------
1 | # Conclusion
2 |
3 | By configuring **notification policies** and using **labels** (such as _region_), you can group alert notifications based on specific criteria and route them to the appropriate teams. Fine-tuning **timing options**—including group wait, group interval, and repeat interval—further can reduce noise and ensures notifications remain actionable without overwhelming on-call engineers.
4 |
5 | # Learn more in [Grafana Alerting: Template your alert notifications](http://www.grafana.com/tutorials/alerting-get-started-pt4/)
6 |
7 | In [Get started with Grafana Alerting: Template your alert notifications](http://www.grafana.com/tutorials/alerting-get-started-pt4/) you learn how to use templates to create customized and concise notifications.
8 |
--------------------------------------------------------------------------------
/grafana/alerting-get-started-pt3/index.json:
--------------------------------------------------------------------------------
1 | {
2 | "title": "Get started with Grafana Alerting - Group alert notifications",
3 | "description": "Learn how to group alert notifications effectively to reduce noise and streamline communication in Grafana Alerting.",
4 | "details": {
5 | "intro": {
6 | "text": "intro.md"
7 | },
8 | "steps": [
9 | {
10 | "text": "step1.md"
11 | },
12 | {
13 | "text": "step2.md"
14 | },
15 | {
16 | "text": "step3.md"
17 | },
18 | {
19 | "text": "step4.md"
20 | },
21 | {
22 | "text": "step5.md"
23 | },
24 | {
25 | "text": "step6.md"
26 | }
27 | ],
28 | "finish": {
29 | "text": "finish.md"
30 | }
31 | },
32 | "backend": {
33 | "imageid": "ubuntu"
34 | }
35 | }
36 |
--------------------------------------------------------------------------------
/grafana/alerting-get-started-pt3/intro.md:
--------------------------------------------------------------------------------
1 | This tutorial is a continuation of the [Get started with Grafana Alerting - Alert routing](http://www.grafana.com/tutorials/alerting-get-started-pt2/) tutorial.
2 |
3 | Grouping in Grafana Alerting reduces notification noise by combining related alert instances into a single, concise notification. This is useful for on-call engineers, ensuring they focus on resolving incidents instead of sorting through a flood of notifications.
4 |
5 | Grouping is configured using labels in the notification policy. These labels reference those generated by alert instances or configured by the user.
6 |
7 | Notification policies also allow you to define how often notifications are sent for each group of alert instances.
8 |
9 | In this tutorial, you will:
10 |
11 | - Learn how alert rule grouping works.
12 | - Create a notification policy to handle grouping.
13 | - Define alert rules for a real-world scenario.
14 | - Receive and review grouped alert notifications.
15 |
--------------------------------------------------------------------------------
/grafana/alerting-get-started-pt3/step1.md:
--------------------------------------------------------------------------------
1 | To demonstrate the observation of data using the Grafana stack, download and run the following files.
2 |
3 | 1. Clone the [tutorial environment repository](https://www.github.com/grafana/tutorial-environment).
4 |
5 | ```
6 | git clone https://github.com/grafana/tutorial-environment.git
7 | ```{{exec}}
8 | 1. Change to the directory where you cloned the repository:
9 |
10 | ```
11 | cd tutorial-environment
12 | ```{{exec}}
13 | 1. Run the Grafana stack:
14 |
15 | ```bash
16 | docker-compose up -d
17 | ```{{exec}}
18 |
19 | The first time you run `docker compose up -d`{{copy}}, Docker downloads all the necessary resources for the tutorial. This might take a few minutes, depending on your internet connection.
20 |
21 | NOTE:
22 |
23 | If you already have Grafana, Loki, or Prometheus running on your system, you might see errors, because the Docker image is trying to use ports that your local installations are already using. If this is the case, stop the services, then run the command again.
24 |
--------------------------------------------------------------------------------
/grafana/alerting-get-started-pt3/step2.md:
--------------------------------------------------------------------------------
1 | # How alert rule grouping works
2 |
3 | Alert notification grouping is configured with **labels** and **timing options**:
4 |
5 | - **Labels** map the alert rule with the notification policy and define the grouping.
6 | - **Timing options** control when and how often notifications are sent.
7 |
8 | 
9 |
10 | ## Types of Labels
11 |
12 | **Reserved labels** (default):
13 |
14 | - Automatically generated by Grafana, e.g., `alertname`{{copy}}, `grafana_folder`{{copy}}.
15 | - Example: `alertname="High CPU usage"`{{copy}}.
16 |
17 | **User-configured labels**:
18 |
19 | - Added manually to the alert rule.
20 | - Example: `severity`{{copy}}, `priority`{{copy}}.
21 |
22 | **Query labels**:
23 |
24 | - Returned by the data source query.
25 | - Example: `region`{{copy}}, `service`{{copy}}, `environment`{{copy}}.
26 |
27 | ## Timing Options
28 |
29 | **Group wait**: Time before sending the first notification.
30 | **Group interval**: Time between notifications for a group.
31 | **Repeat interval**: Time before resending notifications for an unchanged group.
32 |
33 | Alerts sharing the **same label values** are grouped together, and timing options determine notification frequency.
34 |
35 | For more details, see:
36 |
37 | - [Grouping Alerts](https://grafana.com/docs/grafana/latest/alerting/fundamentals/notifications/group-alert-notifications/)
38 | - [Alert Labels](https://grafana.com/docs/grafana/latest/alerting/fundamentals/alert-rules/annotation-label/#label-types)
39 |
--------------------------------------------------------------------------------
/grafana/alerting-get-started-pt3/step3.md:
--------------------------------------------------------------------------------
1 | # A real-world example of alert grouping in action
2 |
3 | ## Scenario: monitoring a distributed application
4 |
5 | You’re monitoring metrics like CPU usage, memory utilization, and network latency across multiple regions. Some of these alert rules include labels such as `region: us-west`{{copy}} and `region: us-east`{{copy}}. If multiple alert rules trigger across these regions, they can result in notification floods.
6 |
7 | ## How to manage grouping
8 |
9 | To group alert rule notifications:
10 |
11 | 1. **Define labels**: Use `region`{{copy}}, `metric`{{copy}}, or `instance`{{copy}} labels to categorize alerts.
12 | 1. **Configure Notification policies**:
13 | - Group alerts by the **query label** "region".
14 | - Example:
15 | - Alert notifications for `region: us-west`{{copy}} go to the West Coast team.
16 | - Alert notifications for `region: us-east`{{copy}} go to the East Coast team.
17 | 1. Specify the **timing options** for sending notifications to control their frequency.
18 | - Example:
19 | - **Group interval**: setting determines how often updates for the same alert group are sent. By default, this interval is set to 5 minutes, but you can customize it to be shorter or longer based on your needs.
20 |
--------------------------------------------------------------------------------
/grafana/alerting-get-started-pt4/index.json:
--------------------------------------------------------------------------------
1 | {
2 | "title": "Get started with Grafana Alerting - Template your alert notifications",
3 | "description": "Learn how to use templates to create customized and concise notifications.",
4 | "details": {
5 | "intro": {
6 | "text": "intro.md"
7 | },
8 | "steps": [
9 | {
10 | "text": "step1.md"
11 | },
12 | {
13 | "text": "step2.md"
14 | },
15 | {
16 | "text": "step3.md"
17 | },
18 | {
19 | "text": "step4.md"
20 | },
21 | {
22 | "text": "step5.md"
23 | },
24 | {
25 | "text": "step6.md"
26 | }
27 | ],
28 | "finish": {
29 | "text": "finish.md"
30 | }
31 | },
32 | "backend": {
33 | "imageid": "ubuntu"
34 | }
35 | }
36 |
--------------------------------------------------------------------------------
/grafana/alerting-get-started-pt4/intro.md:
--------------------------------------------------------------------------------
1 | This tutorial is a continuation of the [Get started with Grafana Alerting - Grouping notifications](http://www.grafana.com/tutorials/alerting-get-started-pt3/) tutorial.
2 |
3 | In this tutorial, you will learn:
4 |
5 | - The two types of templates in Grafana Alerting: labels and annotations and notification templates.
6 | - How to configure alert rules with summary and description annotations.
7 | - How to create a notification template that integrates with alert rule annotations.
8 | - How to use a built-in notification template to group and format multiple alert instances.
9 | - How to preview alert notifications by leveraging alert instances in the notification template payload.
10 |
--------------------------------------------------------------------------------
/grafana/alerting-get-started-pt4/step1.md:
--------------------------------------------------------------------------------
1 | To demonstrate the observation of data using the Grafana stack, download and run the following files.
2 |
3 | 1. Clone the [tutorial environment repository](https://www.github.com/grafana/tutorial-environment).
4 |
5 | ```
6 | git clone https://github.com/grafana/tutorial-environment.git
7 | ```{{exec}}
8 | 1. Change to the directory where you cloned the repository:
9 |
10 | ```
11 | cd tutorial-environment
12 | ```{{exec}}
13 | 1. Run the Grafana stack:
14 |
15 | ```bash
16 | docker-compose up -d
17 | ```{{exec}}
18 |
19 | The first time you run `docker compose up -d`{{copy}}, Docker downloads all the necessary resources for the tutorial. This might take a few minutes, depending on your internet connection.
20 |
21 | NOTE:
22 |
23 | If you already have Grafana, Loki, or Prometheus running on your system, you might see errors, because the Docker image is trying to use ports that your local installations are already using. If this is the case, stop the services, then run the command again.
24 |
--------------------------------------------------------------------------------
/grafana/alerting-get-started-pt4/step5.md:
--------------------------------------------------------------------------------
1 | # Apply the template to your contact point
2 |
3 | 1. Apply the template to your contact point.
4 | - Navigate to **Alerts & IRM** > **Alerting** > **Contact points**.
5 | - Edit your contact point.
6 | 1. **Optional** [email] **settings** section:
7 | - Click **Edit Message**.
8 | - Under **Select notification template**, search `custom.firing_and_resolved_alerts`{{copy}}.
9 | - Click **Save**.
10 | 1. Save your contact point.
11 |
--------------------------------------------------------------------------------
/grafana/alerting-get-started-pt4/step6.md:
--------------------------------------------------------------------------------
1 | # Receiving notifications
2 |
3 | Now that the template has been applied to the contact point, you should receive notifications in the specified contact point.
4 |
5 | Note: you might need to pause the alert rule evaluation and resume it to trigger the notification.
6 |
7 | 
8 |
9 | In the screen capture, you can see how the notification template groups the alert instances into two sections: **firing alerts** and **resolved alerts**. Each section includes only the key details for each alert, ensuring the message remains concise and focused. Additionally, the summary and description annotations we created earlier are included, providing affected instance and CPU usage.
10 |
--------------------------------------------------------------------------------
/grafana/alerting-get-started-pt5/finish.md:
--------------------------------------------------------------------------------
1 | # Conclusion
2 |
3 | By using notification policies, you can route alerts based on query values, directing them to the appropriate teams.
4 |
5 | # Learn more in [Grafana Alerting - Link alerts to visualizations](http://www.grafana.com/tutorials/alerting-get-started-pt6/)
6 |
7 | In [Grafana Alerting - Link alerts to visualizations](http://www.grafana.com/tutorials/alerting-get-started-pt6/) you will create alerts using Prometheus data and link them to your graphs.
8 |
9 | Explore related topics covered in this tutorial:
10 |
11 | - Understand how alert routing works in [Get started with Grafana Alerting - Alert routing](http://www.grafana.com/tutorials/alerting-get-started-pt2/).
12 | - Learn how templating works in [Get started with Grafana Alerting - Templating](http://www.grafana.com/tutorials/alerting-get-started-pt4/).
13 | - More [examples on templating labels](https://grafana.com/docs/grafana/latest/alerting/alerting-rules/templates/examples/).
14 |
--------------------------------------------------------------------------------
/grafana/alerting-get-started-pt5/index.json:
--------------------------------------------------------------------------------
1 | {
2 | "title": "Get started with Grafana Alerting - Route alerts using dynamic labels",
3 | "description": "Learn how to dynamically route alert notifications.",
4 | "details": {
5 | "intro": {
6 | "text": "intro.md"
7 | },
8 | "steps": [
9 | {
10 | "text": "step1.md"
11 | },
12 | {
13 | "text": "step2.md"
14 | },
15 | {
16 | "text": "step3.md"
17 | },
18 | {
19 | "text": "step4.md"
20 | },
21 | {
22 | "text": "step5.md"
23 | },
24 | {
25 | "text": "step6.md"
26 | }
27 | ],
28 | "finish": {
29 | "text": "finish.md"
30 | }
31 | },
32 | "backend": {
33 | "imageid": "ubuntu"
34 | }
35 | }
36 |
--------------------------------------------------------------------------------
/grafana/alerting-get-started-pt5/intro.md:
--------------------------------------------------------------------------------
1 | The Get started with Grafana Alerting - Dynamic routing tutorial is a continuation of the [Get started with Grafana Alerting - Templating](http://www.grafana.com/tutorials/alerting-get-started-pt4/) tutorial.
2 |
3 | Imagine you are managing a web application or a fleet of servers, tracking critical metrics such as CPU, memory, and disk usage. While monitoring is essential, managing alerts allows your team to act on issues without necessarily feeling overwhelmed by the noise.
4 |
5 | In this tutorial you will learn how to:
6 |
7 | - Leverage notification policies for **dynamic routing based on query values**: Use notification policies to route alerts based on dynamically generated labels, in a way that critical alerts reach the on-call team and less urgent ones go to a general monitoring channel.
8 |
--------------------------------------------------------------------------------
/grafana/alerting-get-started-pt5/step1.md:
--------------------------------------------------------------------------------
1 | # Set up the Grafana stack
2 |
3 | To observe data using the Grafana stack, download and run the following files.
4 |
5 | 1. Clone the [tutorial environment repository](https://github.com/tonypowa/grafana-prometheus-alerting-demo.git).
6 |
7 | ```bash
8 | git clone https://github.com/tonypowa/grafana-prometheus-alerting-demo.git
9 | ```{{exec}}
10 | 1. Change to the directory where you cloned the repository:
11 |
12 | ```bash
13 | cd grafana-prometheus-alerting-demo
14 | ```{{exec}}
15 | 1. Build the Grafana stack:
16 |
17 | ```bash
18 | docker-compose build
19 | ```{{exec}}
20 | 1. Bring up the containers:
21 |
22 | ```bash
23 | docker-compose up -d
24 | ```{{exec}}
25 |
26 | The first time you run `docker compose up -d`{{copy}}, Docker downloads all the necessary resources for the tutorial. This might take a few minutes, depending on your internet connection.
27 |
28 | NOTE:
29 |
30 | If you already have Grafana, Loki, or Prometheus running on your system, you might see errors, because the Docker image is trying to use ports that your local installations are already using. If this is the case, stop the services, then run the command again.
31 |
--------------------------------------------------------------------------------
/grafana/alerting-get-started-pt5/step6.md:
--------------------------------------------------------------------------------
1 | # Done! Your alerts are now dynamically routed
2 |
3 | Based on your query's `instance`{{copy}} label values (which contain keywords like _prod_ or _staging_ ), Grafana dynamically assigns the value `production`{{copy}}, `staging`{{copy}} or `development`{{copy}} to the custom **environment** label using the template. This dynamic label then matches the label matchers in your notification policies, which route alerts to the correct contact points.
4 |
5 | To see this in action go to **Alerts & IRM > Alerting > Active notifications**
6 |
7 | This page shows grouped alerts that are currently triggering notifications. If you click on any alert group to view its label set, contact point, and number of alert instances. Notice that the **environment** label has been dynamically populated with values like `production`{{copy}}.
8 |
9 | 
10 |
11 | Finally, you should receive notifications at the contact point associated with either `prod`{{copy}} or `staging`{{copy}}.
12 |
13 | Feel free to experiment by changing the template to match other labels that contain any of the watched keywords. For example, you could reference:
14 |
15 | ```go
16 | $labels.deployment
17 | ```{{copy}}
18 |
19 | The template should be flexible enough to capture the target keywords (e.g., prod, staging) by adjusting which label the[`$labels`{{copy}}](https://grafana.com/docs/grafana/latest/alerting/alerting-rules/templates/reference/#labels) is referencing.
20 |
--------------------------------------------------------------------------------
/grafana/alerting-get-started-pt5/step7.md:
--------------------------------------------------------------------------------
1 | # Create mute timings
2 |
3 | Now that we've set up notification policies, we can demonstrate how to mute alerts for recurring periods of time. You can mute notifications for either the production or staging policies, depending on your needs.
4 |
5 | Mute timings are useful for suppressing alerts with certain labels during maintenance windows or weekends.
6 |
7 | 1. Navigate to **Alerts & IRM > Alerting > Notification Policies**.
8 | - Enter a name, e.g. `Planned downtime`{{copy}} or `Non-business hours`{{copy}}.
9 | - Select **Sat** and **Sun**, to apply the mute timing to all Saturdays and Sundays.
10 | - Click **Save mute timing**.
11 | 1. Add mute timing to the desired policy:
12 | - Go to the notification policy that routes instances with the `staging`{{copy}} label.
13 | - Select **More > Edit**.
14 | - Choose the mute timing from the drop-down menu
15 | - Click **Update policy**.
16 |
17 | This mute timing will apply to any alerts from the staging environment that trigger on Saturdays and Sundays.
18 |
--------------------------------------------------------------------------------
/grafana/alerting-get-started-pt6/finish.md:
--------------------------------------------------------------------------------
1 | # Conclusion
2 |
3 | You’ve now linked Prometheus-based alert rules to your Grafana visualizations, giving your dashboards real-time context with alert annotations and health indicators. By visualizing alerts alongside metrics, responders can quickly understand what’s happening and when. You also saw how alert notifications can include direct links to the affected dashboard or panel, helping teams jump straight into the right time window for faster troubleshooting.
4 |
5 | Have feedback or ideas to improve this tutorial? [Let us know](https://github.com/grafana/tutorials/issues/new).
6 |
--------------------------------------------------------------------------------
/grafana/alerting-get-started-pt6/index.json:
--------------------------------------------------------------------------------
1 | {
2 | "title": "Get started with Grafana Alerting - Link alerts to visualizations",
3 | "description": "Create alerts using Prometheus data and link them to your visualizations.",
4 | "details": {
5 | "intro": {
6 | "text": "intro.md"
7 | },
8 | "steps": [
9 | {
10 | "text": "step1.md"
11 | },
12 | {
13 | "text": "step2.md"
14 | },
15 | {
16 | "text": "step3.md"
17 | },
18 | {
19 | "text": "step4.md"
20 | },
21 | {
22 | "text": "step5.md"
23 | },
24 | {
25 | "text": "step6.md"
26 | },
27 | {
28 | "text": "step7.md"
29 | }
30 | ],
31 | "finish": {
32 | "text": "finish.md"
33 | }
34 | },
35 | "backend": {
36 | "imageid": "ubuntu"
37 | }
38 | }
39 |
--------------------------------------------------------------------------------
/grafana/alerting-get-started-pt6/intro.md:
--------------------------------------------------------------------------------
1 | This tutorial is a continuation of the [Get started with Grafana Alerting - Route alerts using dynamic labels](http://www.grafana.com/tutorials/alerting-get-started-pt5/) tutorial.
2 |
3 |
4 |
5 | In this tutorial you will learn how to:
6 |
7 | - Link alert rules to time series panels for better visualization
8 | - View alert annotations directly on dashboards for better context
9 | - Write Prometheus queries
10 |
--------------------------------------------------------------------------------
/grafana/alerting-get-started-pt6/step1.md:
--------------------------------------------------------------------------------
1 | # Set up the Grafana stack
2 |
3 | To observe data using the Grafana stack, download and run the following files.
4 |
5 | 1. Clone the [tutorial environment repository](https://github.com/tonypowa/grafana-prometheus-alerting-demo.git).
6 |
7 | ```bash
8 | git clone https://github.com/tonypowa/grafana-prometheus-alerting-demo.git
9 | ```{{exec}}
10 | 1. Change to the directory where you cloned the repository:
11 |
12 | ```bash
13 | cd grafana-prometheus-alerting-demo
14 | ```{{exec}}
15 | 1. Build the Grafana stack:
16 |
17 | ```bash
18 | docker-compose build
19 | ```{{exec}}
20 | 1. Bring up the containers:
21 |
22 | ```bash
23 | docker-compose up -d
24 | ```{{exec}}
25 |
26 | The first time you run `docker compose up -d`{{copy}}, Docker downloads all the necessary resources for the tutorial. This might take a few minutes, depending on your internet connection.
27 |
28 | NOTE:
29 |
30 | If you already have Grafana, Loki, or Prometheus running on your system, you might see errors, because the Docker image is trying to use ports that your local installations are already using. If this is the case, stop the services, then run the command again.
31 |
--------------------------------------------------------------------------------
/grafana/alerting-get-started-pt6/step2.md:
--------------------------------------------------------------------------------
1 | # Use case: monitoring and alerting for system health with Prometheus and Grafana
2 |
3 | In this use case, we focus on monitoring the system's CPU, memory, and disk usage as part of a monitoring setup. The [demo app](https://github.com/tonypowa/grafana-prometheus-alerting-demo), launches a stack that includes a Python script to simulate metrics, which Grafana collects and visualizes as a time-series visualization.
4 |
5 | The script simulates random CPU and memory usage values (10% to 100%) every **10 seconds** and exposes them as Prometheus metrics.
6 |
7 | ## Objective
8 |
9 | You'll build a time series visualization to monitor CPU and memory usage, define alert rules with threshold-based conditions, and link those alerts to your dashboards to display real-time annotations when thresholds are breached.
10 |
--------------------------------------------------------------------------------
/grafana/alerting-get-started-pt6/step4.md:
--------------------------------------------------------------------------------
1 | # Step 2: Create alert rules
2 |
3 | Follow these steps to manually create alert rules and link them to a visualization.
4 |
5 | # Create an alert rule for CPU usage
6 |
7 | 1. Navigate to **Alerts & IRM > Alerting > Alert rules** from the Grafana sidebar.
8 | 1. Click **+ New alert rule** rule to create a new alert.
9 |
10 | ## Enter alert rule name
11 |
12 | Make it short and descriptive, as this will appear in your alert notification. For instance, `cpu-usage`{{copy}} .
13 |
14 | ## Define query and alert condition
15 |
16 | 1. Select **Prometheus** data source from the drop-down menu.
17 | 1. In the query section, enter the following query:
18 |
19 | ** switch to **Code** mode if not already selected **
20 |
21 | ```
22 | flask_app_cpu_usage{instance="flask-prod:5000"}
23 | ```{{copy}}
24 | 1. **Alert condition**
25 |
26 | - Enter 75 as the value for **WHEN QUERY IS ABOVE** to set the threshold for the alert.
27 | - Click **Preview alert rule condition** to run the queries.
28 |
29 | 
30 |
31 | The query returns the CPU usage of the Flask application in the production environment. In this case, the usage is `86.01%`{{copy}}, which exceeds the configured threshold of `75%`{{copy}}, causing the alert to fire.
32 |
--------------------------------------------------------------------------------
/grafana/alerting-get-started-pt6/step6.md:
--------------------------------------------------------------------------------
1 | # Step 3: Visualizing metrics and alert annotations
2 |
3 | After the alert rules are linked to visualization, they should appear as **health indicators** (colored heart icons: a red heart when the alert is in **Alerting** state, and a green heart when in **Normal** state) on the linked panel. In addition, annotations provide helpful context, such as the time the alert was triggered.
4 |
5 | 
6 |
--------------------------------------------------------------------------------
/grafana/alerting-get-started-pt6/step7.md:
--------------------------------------------------------------------------------
1 | # Step 4: Receiving notifications
2 |
3 | Finally, as part of the alerting process, you should receive notifications at the associated contact point. If you're receiving alerts via email, the default email template will include two buttons:
4 |
5 | - **View dashboard**: links to the dashboard that contains the alerting panel
6 | - **View panel**: links directly to the individual panel where the alert was triggered
7 |
8 | 
9 |
10 | Clicking either button opens Grafana with a pre-applied time range relevant to the alert.
11 |
12 | By default, this URL includes `from`{{copy}} and `to`{{copy}} query [parameters](https://grafana.com/docs/grafana/latest/alerting/configure-notifications/template-notifications/reference/#alert) that reflect the time window around the alert event (one hour before and after the alert). This helps you land directly in the time window where the alert occurred, making it easier to analyze what happened.
13 |
14 | If you want to define a more intentional time range, you can customize your notifications using a [notification template](https://grafana.com/docs/grafana/latest/alerting/configure-notifications/template-notifications/examples/#print-a-link-to-a-dashboard-with-time-range). With a template, you can explicitly set `from`{{copy}} and `to`{{copy}} values for more precise control over what users see when they follow the dashboard link. The final URL is constructed using a custom annotation (e.g., `MyDashboardURL`{{copy}}) along with the `from`{{copy}} and `to`{{copy}} parameters, which are calculated in the notification template.
15 |
--------------------------------------------------------------------------------
/grafana/alerting-get-started/finish.md:
--------------------------------------------------------------------------------
1 | # Learn more in [Grafana Alerting: Multi-dimensional alerts and how to route them](http://www.grafana.com/tutorials/alerting-get-started-pt2/)
2 |
3 | In [Grafana Alerting: Multi-dimensional alerts and how to route them](http://www.grafana.com/tutorials/alerting-get-started-pt2/) you'll learn to use alert instances and route notifications by labels to contacts.
4 |
--------------------------------------------------------------------------------
/grafana/alerting-get-started/index.json:
--------------------------------------------------------------------------------
1 | {
2 | "title": "Get started with Grafana Alerting - Create and receive your first alert",
3 | "description": "Get started with Grafana Alerting by creating your first alert rule, sending notifications to a webhook, and generating data to test it live.",
4 | "details": {
5 | "intro": {
6 | "text": "intro.md"
7 | },
8 | "steps": [
9 | {
10 | "text": "step1.md"
11 | },
12 | {
13 | "text": "step2.md"
14 | },
15 | {
16 | "text": "step3.md"
17 | },
18 | {
19 | "text": "step4.md"
20 | }
21 | ],
22 | "finish": {
23 | "text": "finish.md"
24 | }
25 | },
26 | "backend": {
27 | "imageid": "ubuntu"
28 | }
29 | }
30 |
--------------------------------------------------------------------------------
/grafana/alerting-get-started/intro.md:
--------------------------------------------------------------------------------
1 | In this tutorial, we walk you through the process of setting up your first alert in just a few minutes. You'll witness your alert in action with real-time data, as well as sending alert notifications.
2 |
3 | In this tutorial you will:
4 |
5 | - Create a contact point.
6 | - Set up an alert rule.
7 | - Receive firing and resolved alert notifications in a public webhook.
8 |
9 | > After you have completed Part 1, don’t forget to explore the advanced but essential alerting topics in [Multi-dimensional alerts and how to route them](http://www.grafana.com/tutorials/alerting-get-started-pt2/).
10 |
--------------------------------------------------------------------------------
/grafana/alerting-get-started/step1.md:
--------------------------------------------------------------------------------
1 | To demonstrate the observation of data using the Grafana stack, download and run the following files.
2 |
3 | 1. Clone the [tutorial environment repository](https://www.github.com/grafana/tutorial-environment).
4 |
5 | ```
6 | git clone https://github.com/grafana/tutorial-environment.git
7 | ```{{exec}}
8 | 1. Change to the directory where you cloned the repository:
9 |
10 | ```
11 | cd tutorial-environment
12 | ```{{exec}}
13 | 1. Run the Grafana stack:
14 |
15 | ```bash
16 | docker-compose up -d
17 | ```{{exec}}
18 |
19 | The first time you run `docker compose up -d`{{copy}}, Docker downloads all the necessary resources for the tutorial. This might take a few minutes, depending on your internet connection.
20 |
21 | NOTE:
22 |
23 | If you already have Grafana, Loki, or Prometheus running on your system, you might see errors, because the Docker image is trying to use ports that your local installations are already using. If this is the case, stop the services, then run the command again.
24 |
--------------------------------------------------------------------------------
/grafana/alerting-get-started/step4.md:
--------------------------------------------------------------------------------
1 | # Trigger and resolve an alert
2 |
3 | Now that the alert rule has been configured, you should receive alert [notifications](http://grafana.com/docs/grafana/next/alerting/fundamentals/alert-rule-evaluation/state-and-health/#notifications) in the contact point whenever alerts trigger and get resolved.
4 |
5 | ## Trigger an alert
6 |
7 | Since the alert rule that you have created has been configured to always fire, once the evaluation interval has concluded, you should receive an alert notification in the Webhook endpoint.
8 |
9 | 
10 |
11 | The alert notification details show that the alert rule state is Firing , and it includes the value that made the rule trigger by exceeding the threshold of the alert rule condition. The notification also includes links to see the alert rule details, and another link to add a [Silence](http://grafana.com/docs/grafana/next/alerting/configure-notifications/create-silence/) to it.
12 |
13 | ## Resolve an alert
14 |
15 | To see how a resolved alert notification looks like, you can modify the current alert rule threshold.
16 |
17 | To edit the Alert rule:
18 |
19 | 1. **Navigate to Alerting** > **Alert rules**.
20 | 1. Click on the metric-alerts folder to display the alert that you created earlier
21 | 1. Click the **edit** button on the right hand side of the screen
22 | 1. Increment the Threshold expression to 1.
23 | 1. Click **Save rule and exit**.
24 |
25 | By incrementing the threshold, the condition is no longer met, and after the evaluation interval has concluded (1 minute approx.), you should receive an alert notification with status **“Resolved”**.
26 |
--------------------------------------------------------------------------------
/grafana/alerting-loki-logs/finish.md:
--------------------------------------------------------------------------------
1 | > In [Get started with Grafana Alerting - Part 2](http://www.grafana.com/tutorials/alerting-get-started-pt2/) you can advance your skills by exploring alert instances and notification routing.
2 |
--------------------------------------------------------------------------------
/grafana/alerting-loki-logs/index.json:
--------------------------------------------------------------------------------
1 | {
2 | "title": "How to create alert rules with log data",
3 | "description": "Learn how to use Loki with Grafana Alerting to keep track of what’s happening in your environment with real log data.",
4 | "details": {
5 | "intro": {
6 | "text": "intro.md"
7 | },
8 | "steps": [
9 | {
10 | "text": "step1.md"
11 | },
12 | {
13 | "text": "step2.md"
14 | },
15 | {
16 | "text": "step3.md"
17 | },
18 | {
19 | "text": "step4.md"
20 | },
21 | {
22 | "text": "step5.md"
23 | }
24 | ],
25 | "finish": {
26 | "text": "finish.md"
27 | }
28 | },
29 | "backend": {
30 | "imageid": "ubuntu"
31 | }
32 | }
33 |
--------------------------------------------------------------------------------
/grafana/alerting-loki-logs/intro.md:
--------------------------------------------------------------------------------
1 | # How to create alert rules with log data
2 |
3 | Loki stores your logs and only indexes labels for each log stream. Using Loki with Grafana Alerting is a powerful way to keep track of what’s happening in your environment. You can create metric alert rules based on content in your log lines to notify your team. What’s even better is that you can add label data from the log message directly into your alert notification.
4 |
5 | In this tutorial, you'll:
6 |
7 | - Generate sample logs and pull them with Promtail to Grafana.
8 | - Create an alert rule based on a Loki query (LogQL).
9 | - Create a Webhook contact point to send alert notifications to.
10 |
11 | > In [Get started with Grafana Alerting - Part 2](http://www.grafana.com/tutorials/alerting-get-started-pt2/) you can advance your skills by exploring alert instances and notification routing.
12 |
--------------------------------------------------------------------------------
/grafana/alerting-loki-logs/step1.md:
--------------------------------------------------------------------------------
1 | # Before you begin
2 |
3 | To demonstrate the observation of data using the Grafana stack, download and run the following files.
4 |
5 | 1. Download and save a Docker compose file to run Grafana, Loki and Promtail.
6 |
7 | ```bash
8 | wget https://raw.githubusercontent.com/grafana/loki/refs/heads/main/production/docker-compose.yaml -O docker-compose.yaml
9 | ```{{exec}}
10 | 1. Run the Grafana stack.
11 |
12 | ```bash
13 | docker-compose up -d
14 | ```{{exec}}
15 |
16 | The first time you run `docker-compose up -d`{{copy}}, Docker downloads all the necessary resources for the tutorial. This might take a few minutes, depending on your internet connection.
17 |
18 | > If you already have Grafana, Loki, or Prometheus running on your system, you might see errors, because the Docker image is trying to use ports that your local installations are already using. If this is the case, stop the services, then run the command again.
19 |
--------------------------------------------------------------------------------
/grafana/alerting-loki-logs/step2.md:
--------------------------------------------------------------------------------
1 | # Generate sample logs
2 |
3 | To demonstrate how to create alert rules based on logs, you’ll use a script that generates realistic log entries to simulate typical monitoring data in Grafana. Running this script outputs logs continuously, each containing a timestamp, HTTP method (either GET or POST), status code (200 for success or 500 for failures), and request duration in milliseconds.
4 |
5 | 1. Download and save a Python file that generates logs.
6 |
7 | ```bash
8 | wget https://raw.githubusercontent.com/grafana/tutorial-environment/master/app/loki/web-server-logs-simulator.py
9 | ```{{exec}}
10 | 1. Execute the log-generating Python script.
11 |
12 | ```bash
13 | python3 ./web-server-logs-simulator.py | sudo tee -a /var/log/web_requests.log
14 | ```{{exec}}
15 |
16 | ## Troubleshooting the script
17 |
18 | If you don't see the sample logs in Explore:
19 |
20 | - Does the output file exist, check `/var/log/web_requests.log`{{copy}} to see if it contains logs.
21 | - If the file is empty, check that you followed the steps above to create the file.
22 | - If the file exists, verify that promtail container is running.
23 | - In Grafana Explore, check that the time range is only for the last 5 minutes.
24 |
--------------------------------------------------------------------------------
/grafana/alerting-loki-logs/step5.md:
--------------------------------------------------------------------------------
1 | # Trigger the alert rule
2 |
3 | Since the Python script continues to generate log data that matches the alert rule condition, once the evaluation interval has concluded, you should receive an alert notification in the Webhook endpoint.
4 |
5 | 
6 |
--------------------------------------------------------------------------------
/grafana/assets/data_sources.png:
--------------------------------------------------------------------------------
https://raw.githubusercontent.com/grafana/killercoda/19bfb5e03680c28ae023eec22fe4531ea7467d22/grafana/assets/data_sources.png
--------------------------------------------------------------------------------
/grafana/assets/data_sources_list.png:
--------------------------------------------------------------------------------
https://raw.githubusercontent.com/grafana/killercoda/19bfb5e03680c28ae023eec22fe4531ea7467d22/grafana/assets/data_sources_list.png
--------------------------------------------------------------------------------
/grafana/assets/grafana_logo.png:
--------------------------------------------------------------------------------
https://raw.githubusercontent.com/grafana/killercoda/19bfb5e03680c28ae023eec22fe4531ea7467d22/grafana/assets/grafana_logo.png
--------------------------------------------------------------------------------
/grafana/assets/graph.png:
--------------------------------------------------------------------------------
https://raw.githubusercontent.com/grafana/killercoda/19bfb5e03680c28ae023eec22fe4531ea7467d22/grafana/assets/graph.png
--------------------------------------------------------------------------------
/grafana/assets/grot-4.png:
--------------------------------------------------------------------------------
https://raw.githubusercontent.com/grafana/killercoda/19bfb5e03680c28ae023eec22fe4531ea7467d22/grafana/assets/grot-4.png
--------------------------------------------------------------------------------
/grafana/assets/query.png:
--------------------------------------------------------------------------------
https://raw.githubusercontent.com/grafana/killercoda/19bfb5e03680c28ae023eec22fe4531ea7467d22/grafana/assets/query.png
--------------------------------------------------------------------------------
/grafana/assets/save_and_test.png:
--------------------------------------------------------------------------------
https://raw.githubusercontent.com/grafana/killercoda/19bfb5e03680c28ae023eec22fe4531ea7467d22/grafana/assets/save_and_test.png
--------------------------------------------------------------------------------
/grafana/assets/search.png:
--------------------------------------------------------------------------------
https://raw.githubusercontent.com/grafana/killercoda/19bfb5e03680c28ae023eec22fe4531ea7467d22/grafana/assets/search.png
--------------------------------------------------------------------------------
/grafana/fo11y/index.json:
--------------------------------------------------------------------------------
1 | {
2 | "title": "Frontend Observability",
3 | "description": "In this demo you'll learn how to instrument a React application with Grafana Frontend Observability in Grafana Cloud.",
4 | "details": {
5 | "intro": {
6 | "text": "intro.md",
7 | "foreground": "setup.sh"
8 | },
9 | "steps": [
10 | {
11 | "text": "step1.md"
12 | },
13 | {
14 | "text": "step2.md"
15 | },
16 | {
17 | "text": "step3.md"
18 | },
19 | {
20 | "text": "step4.md"
21 | }
22 | ],
23 | "finish": {
24 | "text": "finished.md"
25 | },
26 | "assets": {
27 | "host01": [
28 | {"file": "*", "target": "/education"}
29 | ]
30 | }
31 | }
32 | ,
33 | "backend": {
34 | "imageid": "ubuntu"
35 | }
36 | }
--------------------------------------------------------------------------------
/grafana/fo11y/setup.sh:
--------------------------------------------------------------------------------
1 | curl -o- https://raw.githubusercontent.com/nvm-sh/nvm/v0.39.7/install.sh | bash
2 |
3 | export NVM_DIR="$([ -z "${XDG_CONFIG_HOME-}" ] && printf %s "${HOME}/.nvm" || printf %s "${XDG_CONFIG_HOME}/nvm")"
4 | [ -s "$NVM_DIR/nvm.sh" ] && \. "$NVM_DIR/nvm.sh" # This loads nvm
5 |
6 | nvm install 20
7 | nvm alias default 20
8 | nvm use
--------------------------------------------------------------------------------
/grafana/fo11y/step2.md:
--------------------------------------------------------------------------------
1 | # Creating the Frontend Observability App in Grafana Cloud
2 |
3 | Now that you have both the frontend and backend applications running, the next thing we need to do is create the Frontend Observability app in your Grafana Cloud instance.
4 | If you haven't done so already, open your Grafana Cloud instance.
5 |
6 | *Note: If you haven't created a Grafana Cloud instance yet, do that now by [signing in or registering](https://grafana.com/auth/sign-in/) and creating a new stack.*
7 |
8 | ## Adding the Frontend Observability application in Grafana Cloud
9 |
10 | On the left hand side navigation, expand the **Frontend** section and click on **Frontend Apps**.
11 |
12 | Next, in the right hand panel, click on the **Create New** button.
13 |
14 | Fill in the following information:
15 |
16 | - **App Name:** (e.g. fo11y-demo)
17 | - **CORS Allowed Origins:** {{TRAFFIC_HOST1_3000}}
18 | - **Default Attributes:** Add an attribute with a name of `application_name` with a value of `fo11y-demo`
19 | - **Acknowledge cloud costs:** Tick the box
20 |
21 | Then click on **Create**.
22 |
23 | In the next section, we'll instrument our React application to begin pushing data to our Grafana Cloud instance.
--------------------------------------------------------------------------------
/grafana/grafana-basics/assets/prometheus.yml:
--------------------------------------------------------------------------------
1 | # my global config
2 | global:
3 | scrape_interval: 5s # Set the scrape interval to every 15 seconds. Default is every 1 minute.
4 | evaluation_interval: 5s # Evaluate rules every 15 seconds. The default is every 1 minute.
5 | # scrape_timeout is set to the global default (10s).
6 |
7 | # Alertmanager configuration
8 | alerting:
9 | alertmanagers:
10 | - static_configs:
11 | - targets:
12 | # - alertmanager:9093
13 |
14 | # Load rules once and periodically evaluate them according to the global 'evaluation_interval'.
15 | rule_files:
16 | # - "first_rules.yml"
17 | # - "second_rules.yml"
18 |
19 | # A scrape configuration containing exactly one endpoint to scrape:
20 | scrape_configs:
21 | # The job name is added as a label `job=` to any timeseries scraped from this config.
22 | - job_name: "Node Exporter"
23 |
24 | # metrics_path defaults to '/metrics'
25 | # scheme defaults to 'http'.
26 |
27 | static_configs:
28 | - targets: ["0.0.0.0:9100"]
29 |
--------------------------------------------------------------------------------
/grafana/grafana-basics/assets/prometheus_datasource.yml:
--------------------------------------------------------------------------------
1 | apiVersion: 1
2 |
3 | datasources:
4 | - name: Prometheus
5 | type: prometheus
6 | access: proxy
7 | orgId: 1
8 | url: http://localhost:9090
9 | basicAuth: false
10 | isDefault: true
11 | version: 1
12 | editable: true
13 |
--------------------------------------------------------------------------------
/grafana/grafana-basics/finished.md:
--------------------------------------------------------------------------------
1 |
2 |
3 |
4 | # Tutiorial: Grafana Basics Complete
5 | You have completed the Grafana Basics course. In this course, you learned the fundamentals of Grafana, a powerful open-source platform for visualizing and analyzing data. Whether you are a developer, system administrator, or data analyst, this course provided you with the knowledge and skills to effectively use Grafana for monitoring and visualization.
6 |
7 | ## What's Next?
8 | Now that you have completed the Grafana Basics course, you can explore more advanced topics such as:
9 | - [Grafana Plugins](https://grafana.com/grafana/plugins)
10 | - [Grafana Dashboards](https://grafana.com/docs/grafana/latest/dashboards)
11 | - [Grafana API](https://grafana.com/docs/grafana/latest/http_api)
12 |
13 |
14 |
15 |
--------------------------------------------------------------------------------
/grafana/grafana-basics/index.json:
--------------------------------------------------------------------------------
1 | {
2 | "title": "Grafana Basics",
3 | "description": "In this demo learn how to install and configure Grafana",
4 | "details": {
5 | "intro": {
6 | "text": "intro.md"
7 | },
8 | "steps": [
9 | {
10 | "text": "step1.md"
11 | },
12 | {
13 | "text": "step2.md"
14 | },
15 | {
16 | "text": "step3.md"
17 | },
18 | {
19 | "text": "step4.md"
20 | }
21 | ],
22 | "finish": {
23 | "text": "finished.md"
24 | },
25 | "assets": {
26 | "host01": [
27 | {"file": "*", "target": "/education"}
28 | ]
29 | }
30 | }
31 | ,
32 | "backend": {
33 | "imageid": "ubuntu"
34 | }
35 | }
--------------------------------------------------------------------------------
/grafana/grafana-basics/intro.md:
--------------------------------------------------------------------------------
1 |
2 |
3 |
4 | # Welcome to the Grafana Basics Course
5 |
6 | In this course, you will learn the fundamentals of Grafana, a powerful open-source platform for visualizing and analyzing data. Whether you are a developer, system administrator, or data analyst, this course will provide you with the knowledge and skills to effectively use Grafana for monitoring and visualization.
7 |
8 | ## What is Grafana?
9 |
10 | Grafana is a leading data visualization and monitoring tool that allows you to create interactive dashboards and graphs to gain insights from your data. It supports a wide range of data sources, including databases, cloud services, and time series databases like Prometheus and InfluxDB.
11 |
12 | [](https://www.youtube.com/watch?v=4-z1-eEHhvs)
13 |
14 |
15 | ## Course Overview
16 |
17 | Throughout this course, you will learn the following:
18 |
19 | 1. How to install Grafana on your local machine or server.
20 | 2. The basics of configuring Grafana and connecting it to a data source such as Prometheus.
21 | 3. Creating a basic dashboard to visualize your data.
22 |
23 | By the end of this course, you will have a solid understanding of Grafana and be able to create your own monitoring dashboard to gain valuable insights from your data.
24 |
25 | Let's get started!
26 |
--------------------------------------------------------------------------------
/grafana/grafana-basics/step2.md:
--------------------------------------------------------------------------------
1 | # Step 2: Installing Grafana
2 | In this step, we will install Grafana on within our virtual environment. Grafana is an open-source platform for monitoring and observability that allows you to create, explore, and share dashboards and data visualizations.
3 |
4 | ## Installing Grafana
5 | 1. Lets install Grafana via apt install.
6 | ```
7 | sudo apt-get install -y apt-transport-https software-properties-common wget &&
8 | sudo mkdir -p /etc/apt/keyrings/ &&
9 | wget -q -O - https://apt.grafana.com/gpg.key | gpg --dearmor | sudo tee /etc/apt/keyrings/grafana.gpg > /dev/null &&
10 | echo "deb [signed-by=/etc/apt/keyrings/grafana.gpg] https://apt.grafana.com stable main" | sudo tee -a /etc/apt/sources.list.d/grafana.list &&
11 | sudo apt-get update && sudo apt-get install -y grafana
12 | ```{{execute}}
13 |
14 | 2. Lets make sure our Grafana service is running.
15 | ```
16 | sudo systemctl start grafana-server && sudo systemctl status grafana-server
17 | ```{{execute}}
18 |
19 | We should now be able to access Grafana by visiting the following URL in your browser: [http://localhost:3000]({{TRAFFIC_HOST1_3000}}). If you see a page with a login prompt, then Grafana is running correctly.
20 |
--------------------------------------------------------------------------------
/grafana/grafana-fundamentals/finish.md:
--------------------------------------------------------------------------------
1 | # Summary
2 |
3 | In this tutorial you learned about fundamental features of Grafana.
4 |
5 | ## Learn more
6 |
7 | Check out the links below to continue your learning journey with Grafana's LGTM stack.
8 |
9 | - [Prometheus](https://grafana.com/docs/grafana/latest/features/datasources/prometheus/)
10 | - [Loki](https://grafana.com/docs/grafana/latest/features/datasources/loki/)
11 | - [Explore](https://grafana.com/docs/grafana/latest/explore/)
12 | - [Alerting Overview](https://grafana.com/docs/grafana/latest/alerting/)
13 | - [Alert rules](https://grafana.com/docs/grafana/latest/alerting/create-alerts/)
14 | - [Contact points](https://grafana.com/docs/grafana/latest/alerting/fundamentals/contact-points/)
15 |
--------------------------------------------------------------------------------
/grafana/grafana-fundamentals/index.json:
--------------------------------------------------------------------------------
1 | {
2 | "title": "Grafana fundamentals",
3 | "description": "Learn how to use Grafana to set up a monitoring solution for your application. You will explore metrics and logs, build and annotate dashboards, and set up alert rules.",
4 | "details": {
5 | "intro": {
6 | "text": "intro.md"
7 | },
8 | "steps": [
9 | {
10 | "text": "step1.md"
11 | },
12 | {
13 | "text": "step2.md"
14 | },
15 | {
16 | "text": "step3.md"
17 | },
18 | {
19 | "text": "step4.md"
20 | },
21 | {
22 | "text": "step5.md"
23 | },
24 | {
25 | "text": "step6.md"
26 | },
27 | {
28 | "text": "step7.md"
29 | },
30 | {
31 | "text": "step8.md"
32 | },
33 | {
34 | "text": "step9.md"
35 | },
36 | {
37 | "text": "step10.md"
38 | }
39 | ],
40 | "finish": {
41 | "text": "finish.md"
42 | }
43 | },
44 | "backend": {
45 | "imageid": "ubuntu"
46 | }
47 | }
48 |
--------------------------------------------------------------------------------
/grafana/grafana-fundamentals/intro.md:
--------------------------------------------------------------------------------
1 | # Introduction
2 |
3 | In this tutorial, you'll learn how to use Grafana to set up a monitoring solution for your application, and:
4 |
5 | - Explore metrics and logs
6 | - Build dashboards
7 | - Annotate dashboards
8 | - Set up alert rules
9 |
--------------------------------------------------------------------------------
/grafana/grafana-fundamentals/step2.md:
--------------------------------------------------------------------------------
1 | # Open Grafana
2 |
3 | Grafana is an open source platform for monitoring and observability that lets you visualize and explore the state of your systems.
4 |
5 | 1. Browse to [http://localhost:3000]({{TRAFFIC_HOST1_3000}}).
6 |
--------------------------------------------------------------------------------
/grafana/grafana-fundamentals/step4.md:
--------------------------------------------------------------------------------
1 | # Add a logging data source
2 |
3 | Grafana supports log data sources, like [Loki](https://grafana.com/oss/loki/). Just like for metrics, you first need to add your data source to Grafana.
4 |
5 | 1. Click the menu icon and, in the sidebar, click **Connections** and then **Data sources**.
6 | 1. Click **+ Add new data source**.
7 | 1. In the list of data sources, click **Loki**.
8 | 1. In the URL box, enter `http://loki:3100`{{copy}}
9 | 1. Scroll to the bottom of the page and click **Save & Test** to save your changes.
10 |
11 | You should see the message "Data source successfully connected." Loki is now available as a data source in Grafana.
12 |
--------------------------------------------------------------------------------
/grafana/grafana-fundamentals/step6.md:
--------------------------------------------------------------------------------
1 | # Build a dashboard
2 |
3 | A _dashboard_ gives you an at-a-glance view of your data and lets you track metrics through different visualizations.
4 |
5 | Dashboards consist of _panels_, each representing a part of the story you want your dashboard to tell.
6 |
7 | Every panel consists of a _query_ and a _visualization_. The query defines _what_ data you want to display, whereas the visualization defines _how_ the data is displayed.
8 |
9 | 1. Click the menu icon and, in the sidebar, click **Dashboards**.
10 | 1. On the **Dashboards** page, click **New** in top right corner and select **New Dashboard** in the drop-down.
11 | 1. Click **+ Add visualization**.
12 | 1. In the modal that opens, select the Prometheus data source that you just added.
13 | 1. In the **Query** tab below the graph, enter the query from earlier and then press Shift + Enter:
14 |
15 | ```
16 | sum(rate(tns_request_duration_seconds_count[5m])) by(route)
17 | ```{{copy}}
18 | 1. In the panel editor on the right, under **Panel options**, change the panel title to "Traffic".
19 | 1. Click **Apply** in the top-right corner to save the panel and go back to the dashboard view.
20 | 1. Click the **Save dashboard** (disk) icon at the top of the dashboard to save your dashboard.
21 | 1. Enter a name in the **Dashboard name** field and then click **Save**.
22 |
23 | You should now have a panel added to your dashboard.
24 |
25 | 
26 |
--------------------------------------------------------------------------------
/grafana/grafana-fundamentals/step9.md:
--------------------------------------------------------------------------------
1 | # Create a contact point for Grafana-managed alert rules
2 |
3 | In this step, we set up a new contact point. This contact point uses the _webhooks_ channel. In order to make this work, we also need an endpoint for our webhook channel to receive the alert notification. We can use [Webhook.site](https://webhook.site/) to quickly set up that test endpoint. This way we can make sure that our alert manager is actually sending a notification somewhere.
4 |
5 | 1. Browse to [Webhook.site](https://webhook.site/).
6 | 1. Copy Your unique URL.
7 |
8 | Your webhook endpoint is now waiting for the first request.
9 |
10 | Next, let's configure a Contact Point in Grafana's Alerting UI to send notifications to our webhook endpoint.
11 |
12 | 1. Return to Grafana. In Grafana's sidebar, hover over the **Alerting** (bell) icon and then click **Manage Contact points**.
13 | 1. Click **+ Add contact point**.
14 | 1. In **Name**, write **Webhook**.
15 | 1. In **Integration**, choose **Webhook**.
16 | 1. In **URL**, paste the endpoint to your webhook endpoint.
17 | 1. Click **Test**, and then click **Send test notification** to send a test alert notification to your webhook endpoint.
18 | 1. Navigate back to the webhook endpoint you created earlier. On the left side, there's now a `POST /`{{copy}} entry. Click it to see what information Grafana sent.
19 | 1. Return to Grafana and click **Save contact point**.
20 |
21 | We have now created a dummy webhook endpoint and created a new Alerting Contact Point in Grafana. Now we can create an alert rule and link it to this new channel.
22 |
--------------------------------------------------------------------------------
/grafana/structure.json:
--------------------------------------------------------------------------------
1 | {
2 | "items": [
3 | { "path": "grafana-basics", "title": "Grafana Basics"},
4 | { "path": "alerting-get-started", "title": "Get started with Grafana Alerting"},
5 | { "path": "alerting-get-started-pt2", "title": "Get started with Grafana Alerting - Part 2"},
6 | { "path": "alerting-get-started-pt3", "title": "Get started with Grafana Alerting - Part 3"},
7 | { "path": "alerting-get-started-pt4", "title": "Get started with Grafana Alerting - Part 4"},
8 | { "path": "alerting-get-started-pt5", "title": "Get started with Grafana Alerting - Part 5"},
9 | { "path": "alerting-get-started-pt6", "title": "Get started with Grafana Alerting - Part 6"},
10 | { "path": "alerting-loki-logs", "title": "Create alert rules with logs"},
11 | { "path": "grafana-fundamentals", "title": "Grafana Fundamentals"},
12 | { "path": "fo11y", "title": "Frontend Observability"}
13 | ]
14 | }
15 |
--------------------------------------------------------------------------------
/loki/alloy-kafka-logs/finish.md:
--------------------------------------------------------------------------------
1 | # Summary
2 |
3 | In this example, we configured Alloy to ingest logs via Kafka. We configured Alloy to ingest logs in two different formats: raw logs and OpenTelemetry logs. Where to go next?
4 |
5 | ## Back to docs
6 |
7 | Head back to where you started from to continue with the Loki documentation: [Loki documentation](https://grafana.com/docs/loki/latest/send-data/alloy)
8 |
9 | # Further reading
10 |
11 | For more information on Grafana Alloy, refer to the following resources:
12 |
13 | - [Grafana Alloy getting started examples](https://grafana.com/docs/alloy/latest/tutorials/)
14 | - [Grafana Alloy component reference](https://grafana.com/docs/alloy/latest/reference/components/)
15 |
16 | # Complete metrics, logs, traces, and profiling example
17 |
18 | If you would like to use a demo that includes Mimir, Loki, Tempo, and Grafana, you can use [Introduction to Metrics, Logs, Traces, and Profiling in Grafana](https://github.com/grafana/intro-to-mlt). `Intro-to-mltp`{{copy}} provides a self-contained environment for learning about Mimir, Loki, Tempo, and Grafana.
19 |
20 | The project includes detailed explanations of each component and annotated configurations for a single-instance deployment. Data from `intro-to-mltp`{{copy}} can also be pushed to Grafana Cloud.
21 |
--------------------------------------------------------------------------------
/loki/alloy-kafka-logs/index.json:
--------------------------------------------------------------------------------
1 | {
2 | "title": "Sending Logs to Loki via Kafka using Alloy",
3 | "description": "Configuring Grafana Alloy to receive logs via Kafka and send them to Loki.",
4 | "details": {
5 | "intro": {
6 | "text": "intro.md"
7 | },
8 | "steps": [
9 | {
10 | "text": "step1.md"
11 | },
12 | {
13 | "text": "step2.md"
14 | },
15 | {
16 | "text": "step3.md"
17 | },
18 | {
19 | "text": "step4.md"
20 | }
21 | ],
22 | "finish": {
23 | "text": "finish.md"
24 | }
25 | },
26 | "backend": {
27 | "imageid": "ubuntu"
28 | }
29 | }
30 |
--------------------------------------------------------------------------------
/loki/alloy-kafka-logs/step1.md:
--------------------------------------------------------------------------------
1 | # Step 1: Environment setup
2 |
3 | In this step, we will set up our environment by cloning the repository that contains our demo application and spinning up our observability stack using Docker Compose.
4 |
5 | 1. To get started, clone the repository that contains our demo application:
6 |
7 | ```bash
8 | git clone -b microservice-kafka https://github.com/grafana/loki-fundamentals.git
9 | ```{{exec}}
10 | 1. Next we will spin up our observability stack using Docker Compose:
11 |
12 | ```bash
13 | docker-compose -f loki-fundamentals/docker-compose.yml up -d
14 | ```{{exec}}
15 |
16 | This will spin up the following services:
17 |
18 | ```console
19 | ✔ Container loki-fundamentals-grafana-1 Started
20 | ✔ Container loki-fundamentals-loki-1 Started
21 | ✔ Container loki-fundamentals-alloy-1 Started
22 | ✔ Container loki-fundamentals-zookeeper-1 Started
23 | ✔ Container loki-fundamentals-kafka-1 Started
24 | ```{{copy}}
25 |
26 | We will be access two UI interfaces:
27 |
28 | - Alloy at [http://localhost:12345]({{TRAFFIC_HOST1_12345}})
29 | - Grafana at [http://localhost:3000]({{TRAFFIC_HOST1_3000}})
30 |
--------------------------------------------------------------------------------
/loki/alloy-kafka-logs/step4.md:
--------------------------------------------------------------------------------
1 | # Step 3: Start the Carnivorous Greenhouse
2 |
3 | In this step, we will start the Carnivorous Greenhouse application. To start the application, run the following command:
4 |
5 | **Note: This docker-compose file relies on the `loki-fundamentals_loki`{{copy}} docker network. If you have not started the observability stack, you will need to start it first.**
6 |
7 | ```bash
8 | docker-compose -f loki-fundamentals/greenhouse/docker-compose-micro.yml up -d --build
9 | ```{{exec}}
10 |
11 | This will start the following services:
12 |
13 | ```console
14 | ✔ Container greenhouse-db-1 Started
15 | ✔ Container greenhouse-websocket_service-1 Started
16 | ✔ Container greenhouse-bug_service-1 Started
17 | ✔ Container greenhouse-user_service-1 Started
18 | ✔ Container greenhouse-plant_service-1 Started
19 | ✔ Container greenhouse-simulation_service-1 Started
20 | ✔ Container greenhouse-main_app-1 Started
21 | ```{{copy}}
22 |
23 | Once started, you can access the Carnivorous Greenhouse application at [http://localhost:5005]({{TRAFFIC_HOST1_5005}}). Generate some logs by interacting with the application in the following ways:
24 |
25 | - Create a user
26 | - Log in
27 | - Create a few plants to monitor
28 | - Enable bug mode to activate the bug service. This will cause services to fail and generate additional logs.
29 |
30 | Finally to view the logs in Loki, navigate to the Loki Logs Explore view in Grafana at [http://localhost:3000/a/grafana-lokiexplore-app/explore]({{TRAFFIC_HOST1_3000}}/a/grafana-lokiexplore-app/explore).
31 |
--------------------------------------------------------------------------------
/loki/alloy-otel-logs/finish.md:
--------------------------------------------------------------------------------
1 | # Summary
2 |
3 | In this example, we configured Alloy to ingest OpenTelemetry logs and send them to Loki. This was a simple example to demonstrate how to send logs from an application instrumented with OpenTelemetry to Loki using Alloy. Where to go next?
4 |
5 | ## Back to docs
6 |
7 | Head back to where you started from to continue with the Loki documentation: [Loki documentation](https://grafana.com/docs/loki/latest/send-data/alloy)
8 |
9 | # Further reading
10 |
11 | For more information on Grafana Alloy, refer to the following resources:
12 |
13 | - [Grafana Alloy getting started examples](https://grafana.com/docs/alloy/latest/tutorials/)
14 | - [Grafana Alloy component reference](https://grafana.com/docs/alloy/latest/reference/components/)
15 |
16 | # Complete metrics, logs, traces, and profiling example
17 |
18 | If you would like to use a demo that includes Mimir, Loki, Tempo, and Grafana, you can use [Introduction to Metrics, Logs, Traces, and Profiling in Grafana](https://github.com/grafana/intro-to-mlt). `Intro-to-mltp`{{copy}} provides a self-contained environment for learning about Mimir, Loki, Tempo, and Grafana.
19 |
20 | The project includes detailed explanations of each component and annotated configurations for a single-instance deployment. Data from `intro-to-mltp`{{copy}} can also be pushed to Grafana Cloud.
21 |
--------------------------------------------------------------------------------
/loki/alloy-otel-logs/index.json:
--------------------------------------------------------------------------------
1 | {
2 | "title": "Sending OpenTelemetry logs to Loki using Alloy",
3 | "description": "Configuring Grafana Alloy to send OpenTelemetry logs to Loki.",
4 | "details": {
5 | "intro": {
6 | "text": "intro.md"
7 | },
8 | "steps": [
9 | {
10 | "text": "step1.md"
11 | },
12 | {
13 | "text": "step2.md"
14 | },
15 | {
16 | "text": "step3.md"
17 | }
18 | ],
19 | "finish": {
20 | "text": "finish.md"
21 | }
22 | },
23 | "backend": {
24 | "imageid": "ubuntu"
25 | }
26 | }
27 |
--------------------------------------------------------------------------------
/loki/alloy-otel-logs/step1.md:
--------------------------------------------------------------------------------
1 | # Step 1: Environment setup
2 |
3 | In this step, we will set up our environment by cloning the repository that contains our demo application and spinning up our observability stack using Docker Compose.
4 |
5 | 1. To get started, clone the repository that contains our demo application:
6 |
7 | ```bash
8 | git clone -b microservice-otel https://github.com/grafana/loki-fundamentals.git
9 | ```{{exec}}
10 | 1. Next we will spin up our observability stack using Docker Compose:
11 |
12 | ```bash
13 | docker-compose -f loki-fundamentals/docker-compose.yml up -d
14 | ```{{exec}}
15 |
16 | This will spin up the following services:
17 |
18 | ```console
19 | ✔ Container loki-fundamentals-grafana-1 Started
20 | ✔ Container loki-fundamentals-loki-1 Started
21 | ✔ Container loki-fundamentals-alloy-1 Started
22 | ```{{copy}}
23 |
24 | We will be access two UI interfaces:
25 |
26 | - Alloy at [http://localhost:12345]({{TRAFFIC_HOST1_12345}})
27 | - Grafana at [http://localhost:3000]({{TRAFFIC_HOST1_3000}})
28 |
--------------------------------------------------------------------------------
/loki/alloy-otel-logs/step3.md:
--------------------------------------------------------------------------------
1 | # Step 3: Start the Carnivorous Greenhouse
2 |
3 | In this step, we will start the Carnivorous Greenhouse application. To start the application, run the following command:
4 |
5 | **Note: This docker-compose file relies on the `loki-fundamentals_loki`{{copy}} docker network. If you have not started the observability stack, you will need to start it first.**
6 |
7 | ```bash
8 | docker-compose -f loki-fundamentals/greenhouse/docker-compose-micro.yml up -d --build
9 | ```{{exec}}
10 |
11 | This will start the following services:
12 |
13 | ```bash
14 | ✔ Container greenhouse-db-1 Started
15 | ✔ Container greenhouse-websocket_service-1 Started
16 | ✔ Container greenhouse-bug_service-1 Started
17 | ✔ Container greenhouse-user_service-1 Started
18 | ✔ Container greenhouse-plant_service-1 Started
19 | ✔ Container greenhouse-simulation_service-1 Started
20 | ✔ Container greenhouse-main_app-1 Started
21 | ```{{exec}}
22 |
23 | Once started, you can access the Carnivorous Greenhouse application at [http://localhost:5005]({{TRAFFIC_HOST1_5005}}). Generate some logs by interacting with the application in the following ways:
24 |
25 | - Create a user
26 | - Log in
27 | - Create a few plants to monitor
28 | - Enable bug mode to activate the bug service. This will cause services to fail and generate additional logs.
29 |
30 | Finally to view the logs in Loki, navigate to the Loki Logs Explore view in Grafana at [http://localhost:3000/a/grafana-lokiexplore-app/explore]({{TRAFFIC_HOST1_3000}}/a/grafana-lokiexplore-app/explore).
31 |
--------------------------------------------------------------------------------
/loki/assets/grot-4.png:
--------------------------------------------------------------------------------
https://raw.githubusercontent.com/grafana/killercoda/19bfb5e03680c28ae023eec22fe4531ea7467d22/loki/assets/grot-4.png
--------------------------------------------------------------------------------
/loki/assets/loki-logo.png:
--------------------------------------------------------------------------------
https://raw.githubusercontent.com/grafana/killercoda/19bfb5e03680c28ae023eec22fe4531ea7467d22/loki/assets/loki-logo.png
--------------------------------------------------------------------------------
/loki/fluentbit-loki-tutorial/finish.md:
--------------------------------------------------------------------------------
1 | # Summary
2 |
3 | In this tutorial, you learned how to send logs to Loki using Fluent Bit. You configured Fluent Bit to receive logs from the Carnivorous Greenhouse application and export logs to Loki using the official Loki output plugin. Where to next?
4 |
5 | ## Back to Docs
6 |
7 | Head back to where you started from to continue with the [Loki documentation](https://grafana.com/docs/loki/latest/send-data/alloy).
8 |
9 | # Further reading
10 |
11 | For more information on Fluent Bit, refer to the following resources:
12 |
13 | - [Fluent Bit documentation](https://docs.fluentbit.io/manual/)
14 | - [Other examples of Fluent Bit configurations](https://grafana.com/docs/loki/latest/send-data/fluentbit/)
15 |
16 | # Complete metrics, logs, traces, and profiling example
17 |
18 | If you would like to use a demo that includes Mimir, Loki, Tempo, and Grafana, you can use [Introduction to Metrics, Logs, Traces, and Profiling in Grafana](https://github.com/grafana/intro-to-mlt). `Intro-to-mltp`{{copy}} provides a self-contained environment for learning about Mimir, Loki, Tempo, and Grafana.
19 |
20 | The project includes detailed explanations of each component and annotated configurations for a single-instance deployment. Data from `intro-to-mltp`{{copy}} can also be pushed to Grafana Cloud.
21 |
--------------------------------------------------------------------------------
/loki/fluentbit-loki-tutorial/index.json:
--------------------------------------------------------------------------------
1 | {
2 | "title": "Sending logs to Loki using Fluent Bit tutorial",
3 | "description": "Sending logs to Loki using Fluent Bit using the official Fluent Bit Loki output plugin.",
4 | "details": {
5 | "intro": {
6 | "text": "intro.md"
7 | },
8 | "steps": [
9 | {
10 | "text": "step1.md"
11 | },
12 | {
13 | "text": "step2.md"
14 | },
15 | {
16 | "text": "step3.md"
17 | }
18 | ],
19 | "finish": {
20 | "text": "finish.md"
21 | }
22 | },
23 | "backend": {
24 | "imageid": "ubuntu"
25 | }
26 | }
27 |
--------------------------------------------------------------------------------
/loki/fluentbit-loki-tutorial/intro.md:
--------------------------------------------------------------------------------
1 | # Sending logs to Loki using Fluent Bit tutorial
2 |
3 | In this tutorial, you will learn how to send logs to Loki using Fluent Bit. Fluent Bit is a lightweight and fast log processor and forwarder that can collect, process, and deliver logs to various destinations. We will use the official Fluent Bit Loki output plugin to send logs to Loki.
4 |
5 | ## Scenario
6 |
7 | In this scenario, we have a microservices application called the Carnivorous Greenhouse. This application consists of the following services:
8 |
9 | - **User Service:** Manages user data and authentication for the application. Such as creating users and logging in.
10 | - **Plant Service:** Manages the creation of new plants and updates other services when a new plant is created.
11 | - **Simulation Service:** Generates sensor data for each plant.
12 | - **Websocket Service:** Manages the websocket connections for the application.
13 | - **Bug Service:** A service that when enabled, randomly causes services to fail and generate additional logs.
14 | - **Main App:** The main application that ties all the services together.
15 | - **Database:** A database that stores user and plant data.
16 |
17 | Each service has been instrumented with the Fluent Bit logging framework to generate logs. If you would like to learn more about how the Carnivorous Greenhouse application was instrumented with Fluent Bit, refer to the [Carnivorous Greenhouse repository](https://github.com/grafana/loki-fundamentals/blob/fluentbit-official/greenhouse/loggingfw.py).
18 |
--------------------------------------------------------------------------------
/loki/fluentbit-loki-tutorial/step1.md:
--------------------------------------------------------------------------------
1 | # Step 1: Environment setup
2 |
3 | In this step, we will set up our environment by cloning the repository that contains our demo application and spinning up our observability stack using Docker Compose.
4 |
5 | 1. To get started, clone the repository that contains our demo application:
6 |
7 | ```bash
8 | git clone -b fluentbit-official https://github.com/grafana/loki-fundamentals.git
9 | ```{{exec}}
10 | 1. Next we will spin up our observability stack using Docker Compose:
11 |
12 | ```bash
13 | docker-compose -f loki-fundamentals/docker-compose.yml up -d
14 | ```{{exec}}
15 |
16 | This will spin up the following services:
17 |
18 | ```console
19 | ✔ Container loki-fundamentals-grafana-1 Started
20 | ✔ Container loki-fundamentals-loki-1 Started
21 | ✔ Container loki-fundamentals_fluent-bit_1 Started
22 | ```{{copy}}
23 |
24 | Once we have finished configuring the Fluent Bit agent and sending logs to Loki, we will be able to view the logs in Grafana. To check if Grafana is up and running, navigate to the following URL: [http://localhost:3000]({{TRAFFIC_HOST1_3000}})
25 |
--------------------------------------------------------------------------------
/loki/fluentbit-loki-tutorial/step3.md:
--------------------------------------------------------------------------------
1 | # Step 3: Start the Carnivorous Greenhouse
2 |
3 | In this step, we will start the Carnivorous Greenhouse application. To start the application, run the following command:
4 |
5 | > Note: This docker-compose file relies on the `loki-fundamentals_loki`{{copy}} docker network. If you have not started the observability stack, you will need to start it first.
6 |
7 | ```bash
8 | docker-compose -f loki-fundamentals/greenhouse/docker-compose-micro.yml up -d --build
9 | ```{{exec}}
10 |
11 | This will start the following services:
12 |
13 | ```bash
14 | ✔ Container greenhouse-db-1 Started
15 | ✔ Container greenhouse-websocket_service-1 Started
16 | ✔ Container greenhouse-bug_service-1 Started
17 | ✔ Container greenhouse-user_service-1 Started
18 | ✔ Container greenhouse-plant_service-1 Started
19 | ✔ Container greenhouse-simulation_service-1 Started
20 | ✔ Container greenhouse-main_app-1 Started
21 | ```{{exec}}
22 |
23 | Once started, you can access the Carnivorous Greenhouse application at [http://localhost:5005]({{TRAFFIC_HOST1_5005}}). Generate some logs by interacting with the application in the following ways:
24 |
25 | 1. Create a user.
26 | 1. Log in.
27 | 1. Create a few plants to monitor.
28 | 1. Enable bug mode to activate the bug service. This will cause services to fail and generate additional logs.
29 |
30 | Finally to view the logs in Loki, navigate to the Loki Logs Explore view in Grafana at [http://localhost:3000/a/grafana-lokiexplore-app/explore]({{TRAFFIC_HOST1_3000}}/a/grafana-lokiexplore-app/explore).
31 |
--------------------------------------------------------------------------------
/loki/intro-to-ingest-otel/finished.md:
--------------------------------------------------------------------------------
1 | 
2 |
3 | # Congratulations! You have completed the Introduction to Ingesting Logs with Loki (Otel) scenario.
4 |
5 | You have successfully learned how to ingest logs into Loki using the OpenTelemetry Collector.
6 |
7 | ## What's Next?
8 |
9 | Head back to the video to continue with Introduction to Ingesting Logs using OpenTelemetry with Loki.
10 |
11 | [](https://www.youtube.com/watch?v=snXhe1fDDa8)
12 |
--------------------------------------------------------------------------------
/loki/intro-to-ingest-otel/index.json:
--------------------------------------------------------------------------------
1 | {
2 | "title": "Intro to Ingesting with OpenTelemetry",
3 | "description": "A sandbox enviroment to introduce users to the basics of ingesting data into Loki using OpenTelemetry",
4 | "details": {
5 | "intro": {
6 | "text": "intro.md",
7 | "foreground": "setup.sh"
8 | },
9 | "steps": [
10 | {
11 | "text": "step1.md"
12 | },
13 | {
14 | "text": "step2.md"
15 | },
16 | {
17 | "text": "step3.md"
18 | }
19 | ],
20 | "finish": {
21 | "text": "finished.md"
22 | }
23 | }
24 | ,
25 | "backend": {
26 | "imageid": "ubuntu"
27 | }
28 | }
--------------------------------------------------------------------------------
/loki/intro-to-ingest-otel/setup.sh:
--------------------------------------------------------------------------------
1 | #!/usr/bin/env bash
2 |
3 | echo "RUNNING SETUP SCRIPT"
4 |
5 | # Clone the tutorial environment repository if it doesn't already exist
6 | if [ ! -d "loki-fundamentals" ]; then
7 | git clone https://github.com/grafana/loki-fundamentals.git || { echo "Failed to clone repository"; exit 1; }
8 | fi
9 |
10 | # Enter the directory and switch to the required branch
11 | cd loki-fundamentals && git checkout intro-to-otel || { echo "Failed to checkout branch"; exit 1; }
12 |
13 | echo "Building training instance...."
14 |
15 | # Update and install required packages
16 | echo "Updating and installing required packages..."
17 | sudo apt-get update && sudo apt-get install -y python3-venv figlet; clear; echo -e "\e[32m$(figlet -f standard 'Intro to ingesting using')\e[0m"; echo -e "\e[33m$(figlet -f standard 'OpenTelemetry')\e[0m"
--------------------------------------------------------------------------------
/loki/intro-to-ingest-otel/step1.md:
--------------------------------------------------------------------------------
1 |
2 | # Step 1: Preparing our Python application
3 |
4 | For this demo, we will be using a simple Python application called Carnivorous Greenhouse. This application generates logs that we will be ingesting into Loki. This application will be installed locally on the sandbox environment.
5 |
6 | ## Package Installation
7 |
8 | First we will create our Python virtual environment. We will use the following command to create our virtual environment:
9 |
10 | ```bash
11 | python3 -m venv .venv
12 | source ./.venv/bin/activate
13 | ```{{execute}}
14 |
15 | The carniverous greenhouse application relies on a few Python packages. We will install these packages using the following command:
16 |
17 | ```bash
18 | pip install -r requirements.txt
19 | ```{{execute}}
20 |
21 | Next we will install the requried OpenTelemetry packages to instrument our application:
22 | * Opentelemetry-distro: This contains OpenTelemetry API, SDK
23 | * Opentelemetry-exporter-otlp: This package allows us to export these logs within the OTLP format otherwise known as OpenTelemtry Protocol more on where we are sending our log entries later.
24 | We will use the following command to install the required packages:
25 |
26 | ```bash
27 | pip install opentelemetry-distro opentelemetry-exporter-otlp
28 | ```{{execute}}
29 |
30 |
31 |
32 |
33 |
--------------------------------------------------------------------------------
/loki/intro-to-ingest-otel/step3.md:
--------------------------------------------------------------------------------
1 |
2 | # Step 3: Running our stack
3 |
4 | We are now ready to run our stack. We will start the OpenTelemetry Collector, Loki, and Grafana.
5 |
6 | ## Starting the observability stack
7 |
8 | To start the observability stack, run the following command:
9 |
10 | ```bash
11 | docker-compose up -d
12 | ```{{execute}}
13 |
14 | ## Run our Python application
15 |
16 | Next, we will run our Python application. We will use the following command to run the application:
17 |
18 | ```bash
19 | python app.py
20 | ```{{execute}}
21 |
22 | ## Accessing the Carnivorous Greenhouse application
23 |
24 | The Carnivorous Greenhouse application is now running. You can access the application by clicking on the following link:
25 | [http://localhost:5005]({{TRAFFIC_HOST1_5005}})
26 |
27 | Create an account, login, and collect metrics from a series of hungry plants. All of these actions generate logs that are sent to Loki. The application can also be toggled to generate errors.
28 |
29 | ## Accessing logs in Grafana
30 |
31 | The logs generated by the Carnivorous Greenhouse application are sent to Loki. You can access the logs in Grafana by clicking on the following link:
32 |
33 | [http://localhost:3000/explore]({{TRAFFIC_HOST1_3000}}/explore)
34 |
--------------------------------------------------------------------------------
/loki/intro-to-ingest/finished.md:
--------------------------------------------------------------------------------
1 | 
2 |
3 | # Introduction to Ingesting Logs with Loki (Alloy)
4 |
5 | You have successfully completed the Introduction to Ingesting Logs with Loki (Alloy) scenario.
6 |
7 | ## What's Next?
8 |
9 | Head back to the video to continue with Introduction to Ingesting Logs with Loki.
10 |
11 | [](https://www.youtube.com/watch?v=xtEppndO7F8)
12 |
--------------------------------------------------------------------------------
/loki/intro-to-ingest/index.json:
--------------------------------------------------------------------------------
1 | {
2 | "title": "Intro to Ingesting",
3 | "description": "A sandbox enviroment to introduce users to the basics of ingesting data into Loki using Grafana Alloy",
4 | "details": {
5 | "intro": {
6 | "text": "intro.md",
7 | "foreground": "setup.sh"
8 | },
9 | "steps": [
10 | {
11 | "text": "step1.md"
12 | },
13 | {
14 | "text": "step2.md"
15 | },
16 | {
17 | "text": "step3.md"
18 | },
19 | {
20 | "text": "step4.md"
21 | }
22 | ],
23 | "finish": {
24 | "text": "finished.md"
25 | }
26 | }
27 | ,
28 | "backend": {
29 | "imageid": "ubuntu"
30 | }
31 | }
--------------------------------------------------------------------------------
/loki/intro-to-ingest/setup.sh:
--------------------------------------------------------------------------------
1 | #!/usr/bin/env bash
2 |
3 | echo "RUNNING SETUP SCRIPT"
4 |
5 | # Clone the tutorial environment repository if it doesn't already exist
6 | if [ ! -d "loki-fundamentals" ]; then
7 | git clone https://github.com/grafana/loki-fundamentals.git || { echo "Failed to clone repository"; exit 1; }
8 | fi
9 |
10 | # Enter the directory and switch to the required branch
11 | cd loki-fundamentals && git checkout intro-to-ingesting || { echo "Failed to checkout branch"; exit 1; }
12 |
13 | echo "Building training instance...."
14 |
15 | # Update and install required packages
16 | echo "Updating and installing required packages..."
17 | sudo apt-get update && apt install gpg -y; sudo mkdir -p /etc/apt/keyrings/; wget -q -O - https://apt.grafana.com/gpg.key | gpg --dearmor | sudo tee /etc/apt/keyrings/grafana.gpg > /dev/null; echo "deb [signed-by=/etc/apt/keyrings/grafana.gpg] https://apt.grafana.com stable main" | sudo tee /etc/apt/sources.list.d/grafana.list; sudo apt-get update && sudo apt-get install alloy; sudo apt-get install -y figlet; clear; echo -e "\e[32m$(figlet -f standard 'Intro to')\e[0m"; echo -e "\e[33m$(figlet -f standard 'Ingesting')\e[0m"
--------------------------------------------------------------------------------
/loki/intro-to-ingest/step1.md:
--------------------------------------------------------------------------------
1 |
2 | # Step 1: Demo environment setup
3 |
4 | The first thing we are going to do manually is spin up our Docker environment. This environment will be used to demonstrate how to ingest logs into Loki using the new Grafana Labs Alloy collector.
5 |
6 | ## Docker Compose
7 |
8 | We will be using Docker Compose to spin up our environment. Run the following command to start the environment:
9 |
10 | ```bash
11 | docker-compose up -d
12 | ```{{exec}}
13 | This will build the Docker images and start the containers. Once the containers are up and running. To check the status of the containers, run the following command:
14 |
15 | ```bash
16 | docker ps
17 | ```{{exec}}
18 |
19 | Which should output something similar to:
20 |
21 | ```plaintext
22 | CONTAINER ID IMAGE ... STATUS
23 | 392f00a18cf4 grafana/alloy:latest ... Up 34 seconds
24 | 60f6abe649a5 loki-fundamentals_carnivorous-garden ... Up 36 seconds
25 | c4a9ca220b0f grafana/loki:main-e9b6ce9 ... Up 36 seconds
26 | a32e179a44af grafana/grafana:11.0.0 ... Up 35 seconds
27 | ```
28 |
29 | ## Access our applications
30 |
31 | There are three application UI's that we will be using in this demo: Grafana, Alloy, and Carnivorous Greenhouse. Lets check if they are up and running:
32 | * Grafana: [http://localhost:3000]({{TRAFFIC_HOST1_3000}})
33 | * Alloy: [http://localhost:12345]({{TRAFFIC_HOST1_12345}})
34 | * Carnivorous Greenhouse: [http://localhost:5005]({{TRAFFIC_HOST1_5005}})
35 |
36 |
37 |
38 |
--------------------------------------------------------------------------------
/loki/intro-to-ingest/step4.md:
--------------------------------------------------------------------------------
1 | # Step 4: Alloy Migration Tool
2 |
3 | Lastly we are going to look at an example of how you can use the Alloy Migration tool to migrate your existing:
4 | * Promtail
5 | * OpenTelemetry Collector
6 | * Grafana Agent
7 | Configurations to Alloy..
8 |
9 | ## Alloy Migration Tool (Promtail)
10 |
11 | We have an example promtail config located in `promtail/config.yml`. We can use the Alloy Migration tool to convert this to an Alloy config.
12 |
13 | Lets first take a look at the promtail config:
14 | ```bash
15 | cat ./promtail/config.yml
16 | ```{{exec}}
17 |
18 | Next lets run the Alloy Migration tool to convert this to an Alloy config:
19 | ```bash
20 | alloy convert --source-format=promtail --output=./promtail/config.alloy ./promtail/config.yml
21 | ```{{exec}}
22 |
23 | Now we can take a look at the converted Alloy config:
24 | ```bash
25 | cat ./promtail/config.alloy
26 | ```{{exec}}
27 |
28 |
29 |
30 |
--------------------------------------------------------------------------------
/loki/intro-to-logging-fluentd-fluentbit/finish.md:
--------------------------------------------------------------------------------
1 | # Summary
2 |
3 | 
4 |
5 | Congratulations! You have completed the Introduction to Ingesting Logs with Loki (Otel) scenario.
6 |
7 | You have successfully learned how to ingest logs into Loki using the OpenTelemetry Collector.
8 |
9 | # What’s Next?
10 |
11 | Head back to the video to continue with Introduction to Ingesting Logs using OpenTelemetry with Loki.
12 |
13 | [](https://www.youtube.com/watch?v=snXhe1fDDa8)
14 |
--------------------------------------------------------------------------------
/loki/intro-to-logging-fluentd-fluentbit/index.json:
--------------------------------------------------------------------------------
1 | {
2 | "title": "Introduction to ingesting logs into Loki using Fluentd and Fluent Bit",
3 | "description": "Configuring Fluentd and Fluent bit to send logs to Loki.",
4 | "details": {
5 | "intro": {
6 | "text": "intro.md"
7 | },
8 | "steps": [
9 | {
10 | "text": "step1.md"
11 | },
12 | {
13 | "text": "step2.md"
14 | },
15 | {
16 | "text": "step3.md"
17 | },
18 | {
19 | "text": "step4.md"
20 | }
21 | ],
22 | "finish": {
23 | "text": "finish.md"
24 | }
25 | },
26 | "backend": {
27 | "imageid": "ubuntu"
28 | }
29 | }
30 |
--------------------------------------------------------------------------------
/loki/intro-to-logging-fluentd-fluentbit/step1.md:
--------------------------------------------------------------------------------
1 | # Step 1: Environment setup
2 |
3 | In this step, we will set up our environment by cloning the repository that contains our demo application and spinning up our observability stack using Docker Compose.
4 |
5 | 1. To get started, clone the repository that contains our demo application:
6 |
7 | ```bash
8 | git clone -b microservice-fluentd-fluentbit https://github.com/grafana/loki-fundamentals.git
9 | ```{{exec}}
10 |
11 | 1. Next we will spin up our observability stack using Docker Compose:
12 |
13 | ```bash
14 | docker-compose -f loki-fundamentals/docker-compose.yml up -d
15 | ```{{exec}}
16 |
17 | This will spin up the following services:
18 |
19 | ```bash
20 | ✔ Container loki-fundamentals_grafana_1 Started
21 | ✔ Container loki-fundamentals_loki_1 Started
22 | ✔ Container loki-fundamentals_fluentd_1 Started
23 | ✔ Container loki-fundamentals_fluent-bit_1 Started
24 | ```{{copy}}
25 |
--------------------------------------------------------------------------------
/loki/intro-to-logging-fluentd-fluentbit/step4.md:
--------------------------------------------------------------------------------
1 | # Step 4: Start the Carnivorous Greenhouse
2 |
3 | In this step, we will start the Carnivorous Greenhouse application. To start the application, run the following command:
4 |
5 | **Note: This docker-compose file relies on the `loki-fundamentals_loki`{{copy}} docker network. If you have not started the observability stack, you will need to start it first.**
6 |
7 | ```bash
8 | docker-compose -f loki-fundamentals/greenhouse/docker-compose-micro.yml up -d --build
9 | ```{{exec}}
10 |
11 | This will start the following services:
12 |
13 | ```bash
14 | ✔ Container greenhouse-db-1 Started
15 | ✔ Container greenhouse-websocket_service-1 Started
16 | ✔ Container greenhouse-bug_service-1 Started
17 | ✔ Container greenhouse-user_service-1 Started
18 | ✔ Container greenhouse-plant_service-1 Started
19 | ✔ Container greenhouse-simulation_service-1 Started
20 | ✔ Container greenhouse-main_app-1 Started
21 | ```{{copy}}
22 |
23 | Once started, you can access the Carnivorous Greenhouse application at [http://localhost:5005]({{TRAFFIC_HOST1_5005}}). Generate some logs by interacting with the application in the following ways:
24 |
25 | - Create a user
26 |
27 | - Log in
28 |
29 | - Create a few plants to monitor
30 |
31 | - Enable bug mode to activate the bug service. This will cause services to fail and generate additional logs.
32 |
33 | Finally to view the logs in Loki, navigate to the Loki Logs Explore view in Grafana at [http://localhost:3000/a/grafana-lokiexplore-app/explore]({{TRAFFIC_HOST1_3000}}/a/grafana-lokiexplore-app/explore).
34 |
--------------------------------------------------------------------------------
/loki/intro-to-logging/finished.md:
--------------------------------------------------------------------------------
1 | 
2 |
3 | # Intro to Logging
4 |
5 | You have completed the **Intro to Logging** task. This course is part of an **Intro to Grafana Loki** series. In this course, you learned the basics of logging and how to use Grafana Loki to store and query your logs.
6 |
7 | ## What's Next?
8 |
9 | Head back to the video to continue with Intro to logging.
10 |
11 | [](https://www.youtube.com/watch?v=TLnH7efQNd0)
12 |
13 |
--------------------------------------------------------------------------------
/loki/intro-to-logging/index.json:
--------------------------------------------------------------------------------
1 | {
2 | "title": "Intro to Logging",
3 | "description": "This sandbox will teach you how to locate logs on an a Linux server.",
4 | "details": {
5 | "intro": {
6 | "text": "intro.md"
7 | },
8 | "steps": [
9 | {
10 | "text": "step1.md"
11 | }
12 | ],
13 | "finish": {
14 | "text": "finished.md"
15 | }
16 | }
17 | ,
18 | "backend": {
19 | "imageid": "ubuntu"
20 | }
21 | }
--------------------------------------------------------------------------------
/loki/intro-to-logging/intro.md:
--------------------------------------------------------------------------------
1 | 
2 |
3 |
4 | # Welcome to Intro to Logging
5 |
6 | This course is part of an **Intro to Grafana Loki** series. In this course, you will learn the basics of logging and how to use Grafana Loki to store and query your logs.
7 |
8 | ## The Video
9 |
10 | [](https://www.youtube.com/watch?v=TLnH7efQNd0)
11 |
12 |
13 | ## Sandbox Overview
14 |
15 | This sandbox will teach you how to locate logs on an a Linux server.
16 |
--------------------------------------------------------------------------------
/loki/intro-to-logging/step1.md:
--------------------------------------------------------------------------------
1 | # Step 1: Common Log locations
2 |
3 | The first step in locating logs is to know where to look. In this lesson, we will cover the most common log locations on a Linux server.
4 |
5 | ## /var/log
6 |
7 | The `/var/log` directory is the most common location for log files on a Linux server. This directory contains log files for various system services, including the kernel, system, and application logs.
8 |
9 | Lets take a look at the contents of the `/var/log` directory:
10 |
11 | ```
12 | ls /var/log
13 | ```{{exec}}
14 |
15 | ## /var/log/syslog
16 |
17 | The `/var/log/syslog` file contains messages from the Linux kernel and system services. This file is a good place to start when troubleshooting system issues.
18 |
19 | Lets take a look at the contents of the `/var/log/syslog` file:
20 |
21 | ```
22 | cat /var/log/syslog
23 | ```{{exec}}
24 |
25 |
26 |
27 |
--------------------------------------------------------------------------------
/loki/k8s-monitoring-helm/finish.md:
--------------------------------------------------------------------------------
1 | # Conclusion
2 |
3 | In this tutorial, you learned how to deploy Loki, Grafana, and the Kubernetes Monitoring Helm chart to collect and store logs from a Kubernetes cluster. We have deployed a minimal test version of each of these Helm charts to demonstrate how quickly you can get started with Loki. It is now worth exploring each of these Helm charts in more detail to understand how to scale them to meet your production needs:
4 |
5 | - [Loki Helm chart](https://grafana.com/docs/loki/latest/setup/install/helm/)
6 | - [Grafana Helm chart](https://grafana.com/docs/grafana/latest/installation/helm/)
7 | - [Kubernetes Monitoring Helm chart](https://grafana.com/docs/grafana-cloud/monitor-infrastructure/kubernetes-monitoring/)
8 |
--------------------------------------------------------------------------------
/loki/k8s-monitoring-helm/index.json:
--------------------------------------------------------------------------------
1 | {
2 | "title": "Kubernetes Monitoring Helm",
3 | "description": "Learn how to collect and store logs from your Kubernetes cluster using Loki.",
4 | "details": {
5 | "intro": {
6 | "text": "intro.md"
7 | },
8 | "steps": [
9 | {
10 | "text": "step1.md"
11 | },
12 | {
13 | "text": "step2.md"
14 | },
15 | {
16 | "text": "step3.md"
17 | },
18 | {
19 | "text": "step4.md"
20 | },
21 | {
22 | "text": "step5.md"
23 | },
24 | {
25 | "text": "step6.md"
26 | },
27 | {
28 | "text": "step7.md"
29 | },
30 | {
31 | "text": "step8.md"
32 | }
33 | ],
34 | "finish": {
35 | "text": "finish.md"
36 | }
37 | },
38 | "backend": {
39 | "imageid": "kubernetes-kubeadm-2nodes"
40 | }
41 | }
42 |
--------------------------------------------------------------------------------
/loki/k8s-monitoring-helm/step1.md:
--------------------------------------------------------------------------------
1 | # Create the `meta`{{copy}} and `prod`{{copy}} namespaces
2 |
3 | The K8s Monitoring Helm chart will monitor two namespaces: `meta`{{copy}} and `prod`{{copy}}:
4 |
5 | - `meta`{{copy}} namespace: This namespace will be used to deploy Loki, Grafana, and Alloy.
6 | - `prod`{{copy}} namespace: This namespace will be used to deploy the sample application that will generate logs.
7 |
8 | Create the `meta`{{copy}} and `prod`{{copy}} namespaces by running the following command:
9 |
10 | ```bash
11 | kubectl create namespace meta && kubectl create namespace prod
12 | ```{{exec}}
13 |
--------------------------------------------------------------------------------
/loki/k8s-monitoring-helm/step2.md:
--------------------------------------------------------------------------------
1 | # Add the Grafana Helm repository
2 |
3 | All three Helm charts (Loki, Grafana, and the Kubernetes Monitoring Helm) are available in the Grafana Helm repository. Add the Grafana Helm repository by running the following command:
4 |
5 | ```bash
6 | helm repo add grafana https://grafana.github.io/helm-charts && helm repo update
7 | ```{{exec}}
8 |
9 | As well as adding the repo to your local helm list, you should also run `helm repo update`{{copy}} to ensure you have the latest version of the charts.
10 |
11 | # Clone the tutorial repository
12 |
13 | Clone the tutorial repository by running the following command:
14 |
15 | ```bash
16 | git clone https://github.com/grafana/alloy-scenarios.git
17 | ```{{exec}}
18 |
19 | Then change directories to the `alloy-scenarios/k8s/logs`{{copy}} directory:
20 |
21 | ```bash
22 | cd alloy-scenarios/k8s/logs
23 | ```{{exec}}
24 |
25 | **The rest of this tutorial assumes you are in the `alloy-scenarios/k8s/logs`{{copy}} directory.**
26 |
--------------------------------------------------------------------------------
/loki/k8s-monitoring-helm/step3.md:
--------------------------------------------------------------------------------
1 | # Deploy Loki
2 |
3 | Grafana Loki will be used to store our collected logs. In this tutorial we will deploy Loki with a minimal footprint and use the default storage backend provided by the Loki Helm chart, MinIO.
4 |
5 | > **Note**: Due to the resource constraints of the Kubernetes cluster running in the playground, we are deploying Loki using a custom values file. This values file reduces the resource requirements of Loki. This turns off features such as cache and Loki Canary, and runs Loki with limited resources. This can take up to **1 minute** to complete.
6 |
7 | To deploy Loki run the following command:
8 |
9 | ```bash
10 | helm install --values killercoda/loki-values.yml loki grafana/loki -n meta
11 | ```{{exec}}
12 |
13 | This command will deploy Loki in the `meta`{{copy}} namespace. The command also includes a `values`{{copy}} file that specifies the configuration for Loki. For more details on how to configure the Loki Helm chart refer to the Loki Helm [documentation](https://grafana.com/docs/loki/latest/setup/install/helm).
14 |
--------------------------------------------------------------------------------
/loki/k8s-monitoring-helm/step6.md:
--------------------------------------------------------------------------------
1 | # Accessing Grafana
2 |
3 | To access Grafana, you will need to port-forward the Grafana service to your local machine. To do this, run the following command:
4 |
5 | ```bash
6 | export POD_NAME=$(kubectl get pods --namespace meta -l "app.kubernetes.io/name=grafana,app.kubernetes.io/instance=grafana" -o jsonpath="{.items[0].metadata.name}") && \
7 | kubectl --namespace meta port-forward $POD_NAME 3000 --address 0.0.0.0
8 | ```{{exec}}
9 |
10 | > **Tip:**
11 | > This will make your terminal unusable until you stop the port-forwarding process. To stop the process, press `Ctrl + C`{{copy}}.
12 |
13 | This command will port-forward the Grafana service to your local machine on port `3000`{{copy}}.
14 |
15 | You can now access Grafana by navigating to [http://localhost:3000]({{TRAFFIC_HOST1_3000}}) in your browser. The default credentials are `admin`{{copy}} and `adminadminadmin`{{copy}}.
16 |
17 | One of the first places you should visit is Logs Drilldown which lets you automatically visualize and explore your logs without having to write queries:
18 | [http://localhost:3000/a/grafana-lokiexplore-app]({{TRAFFIC_HOST1_3000}}/a/grafana-lokiexplore-app)
19 |
20 | 
21 |
--------------------------------------------------------------------------------
/loki/k8s-monitoring-helm/step7.md:
--------------------------------------------------------------------------------
1 | # (Optional) View the Alloy UI
2 |
3 | The Kubernetes Monitoring Helm chart deploys Grafana Alloy to collect and forward telemetry data from the Kubernetes cluster. The Helm chart is designed to abstract you away from creating an Alloy configuration file. However if you would like to understand the pipeline you can view the Alloy UI. To access the Alloy UI, you will need to port-forward the Alloy service to your local machine. To do this, run the following command:
4 |
5 | ```bash
6 | export POD_NAME=$(kubectl get pods --namespace meta -l "app.kubernetes.io/name=alloy-logs,app.kubernetes.io/instance=k8s" -o jsonpath="{.items[0].metadata.name}") && \
7 | kubectl --namespace meta port-forward $POD_NAME 12345 --address 0.0.0.0
8 | ```{{exec}}
9 |
10 | > **Tip:**
11 | > This will make your terminal unusable until you stop the port-forwarding process. To stop the process, press `Ctrl + C`{{copy}}.
12 |
13 | This command will port-forward the Alloy service to your local machine on port `12345`{{copy}}. You can access the Alloy UI by navigating to [http://localhost:12345]({{TRAFFIC_HOST1_12345}}) in your browser.
14 |
15 | 
16 |
--------------------------------------------------------------------------------
/loki/k8s-monitoring-helm/step8.md:
--------------------------------------------------------------------------------
1 | # Adding a sample application to `prod`{{copy}}
2 |
3 | Finally, lets deploy a sample application to the `prod`{{copy}} namespace that will generate some logs. To deploy the sample application run the following command:
4 |
5 | ```bash
6 | helm install tempo grafana/tempo-distributed -n prod
7 | ```{{exec}}
8 |
9 | This will deploy a default version of Grafana Tempo to the `prod`{{copy}} namespace. Tempo is a distributed tracing backend that is used to store and query traces. Normally Tempo would sit alongside Loki and Grafana in the `meta`{{copy}} namespace, but for the purpose of this tutorial, we will pretend this is the primary application generating logs.
10 |
11 | Once deployed lets expose Grafana once more:
12 |
13 | ```bash
14 | export POD_NAME=$(kubectl get pods --namespace meta -l "app.kubernetes.io/name=grafana,app.kubernetes.io/instance=grafana" -o jsonpath="{.items[0].metadata.name}") && \
15 | kubectl --namespace meta port-forward $POD_NAME 3000 --address 0.0.0.0
16 | ```{{exec}}
17 |
18 | and navigate to [http://localhost:3000/a/grafana-lokiexplore-app]({{TRAFFIC_HOST1_3000}}/a/grafana-lokiexplore-app) to view Grafana Tempo logs.
19 |
20 | 
21 |
--------------------------------------------------------------------------------
/loki/logcli-tutorial/finish.md:
--------------------------------------------------------------------------------
1 | # Conclusion
2 |
3 | In this tutorial as site manager for a logistics company, we have successfully used LogCLI to query logs and build a report on the overall health of the shipments. We have also used meta queries to better understand our data cleanliness and query performance. The LogCLI is a powerful tool for understanding your logs and how they are stored in Loki, as you continue to scale your solution remember to keep LogCLI in mind to monitor cardinality and query performance.
4 |
--------------------------------------------------------------------------------
/loki/logcli-tutorial/index.json:
--------------------------------------------------------------------------------
1 | {
2 | "title": "LogCLI tutorial",
3 | "description": "Learn how to use LogCLI to query logs in Grafana Loki.",
4 | "details": {
5 | "intro": {
6 | "text": "intro.md",
7 | "foreground": "setup.sh"
8 | },
9 | "steps": [
10 | {
11 | "text": "step1.md"
12 | },
13 | {
14 | "text": "step2.md"
15 | },
16 | {
17 | "text": "step3.md"
18 | },
19 | {
20 | "text": "step4.md"
21 | }
22 | ],
23 | "finish": {
24 | "text": "finish.md"
25 | }
26 | },
27 | "backend": {
28 | "imageid": "ubuntu"
29 | }
30 | }
31 |
--------------------------------------------------------------------------------
/loki/logcli-tutorial/intro.md:
--------------------------------------------------------------------------------
1 | # LogCLI tutorial
2 |
3 | This [LogCLI](https://grafana.com/docs/loki/latest/query/logcli/) tutorial will walk you through the following concepts:
4 |
5 | - Querying logs
6 | - Meta Queries against your Loki instance
7 | - Queries against static log files
8 |
9 | ## Scenario
10 |
11 | You are a site manager for a new logistics company. The company uses structured logs to keep track of every shipment sent and received. The payload format looks like this:
12 |
13 | ```json
14 | {"timestamp": "2024-11-22T13:22:56.377884", "state": "New York", "city": "Buffalo", "package_id": "PKG34245", "package_type": "Documents", "package_size": "Medium", "package_status": "error", "note": "Out for delivery", "sender": {"name": "Sender27", "address": "144 Elm St, Buffalo, New York"}, "receiver": {"name": "Receiver4", "address": "260 Cedar Blvd, New York City, New York"}}
15 | ```{{copy}}
16 |
17 | The logs are processed from Grafana Alloy to extract labels and structured metadata before they're stored in Loki. You have been tasked with monitoring the logs using the LogCLI and build a report on the overall health of the shipments.
18 |
--------------------------------------------------------------------------------
/loki/logcli-tutorial/setup.sh:
--------------------------------------------------------------------------------
1 | #!/bin/sh
2 | set -euf
3 | (set -o pipefail 2> /dev/null) && set -o pipefail
4 | sudo install -m 0755 -d /etc/apt/keyrings
5 | sudo curl -fsSL https://download.docker.com/linux/ubuntu/gpg -o /etc/apt/keyrings/docker.asc
6 | sudo chmod a+r /etc/apt/keyrings/docker.asc
7 | ARCH="$(dpkg --print-architecture)"
8 | VERSION_CODENAME="$(source /etc/os-release && echo "${VERSION_CODENAME}")"
9 | readonly ARCH VERSION_CODENAME
10 | printf 'deb [arch=%s signed-by=/etc/apt/keyrings/docker.asc] https://download.docker.com/linux/ubuntu %s stable' "${ARCH}" "${VERSION_CODENAME}" | sudo tee /etc/apt/sources.list.d/docker.list > /dev/null
11 | sudo apt-get update && sudo apt-get install -y docker-compose-plugin && \
12 | wget https://github.com/grafana/loki/releases/download/v3.3.0/logcli_3.3.0_amd64.deb && \
13 | sudo dpkg -i logcli_3.3.0_amd64.deb && clear && echo "Setup complete. You may now begin the tutorial."
--------------------------------------------------------------------------------
/loki/logcli-tutorial/step4.md:
--------------------------------------------------------------------------------
1 | # Queries against static log files
2 |
3 | In addition to querying logs from Loki, LogCLI also supports querying static log files. This can be useful for querying logs that are not stored in Loki. Earlier in the tutorial we stored the logs in the `./inventory`{{copy}} directory. Lets run a similar query but pipe it into a log file:
4 |
5 | ```bash
6 | logcli query \
7 | --timezone=UTC \
8 | --parallel-duration="12h" \
9 | --parallel-max-workers="4" \
10 | --part-path-prefix="./inventory/inv" \
11 | --since=24h \
12 | --merge-parts \
13 | --output=raw \
14 | '{service_name="Delivery World"}' > ./inventory/complete.log
15 | ```{{exec}}
16 |
17 | Next lets run a query against the static log file:
18 |
19 | ```bash
20 | cat ./inventory/complete.log | logcli --stdin query '{service_name="Delivery World"} | json | package_status="critical"'
21 | ```{{exec}}
22 |
23 | Note that since we are querying a static log file, labels are not automatically detected:
24 |
25 | - `{service_name="Delivery World"}`{{copy}} is optional in this case but is recommended for clarity.
26 | - `json`{{copy}} is required to parse the log file as JSON. This lets us extract the `package_status`{{copy}} field.
27 |
28 | For example, suppose we try to query the log file without the `json`{{copy}} filter:
29 |
30 | ```bash
31 | cat ./inventory/complete.log | logcli --stdin query '{service_name="Delivery World"} | package_status="critical"'
32 | ```{{exec}}
33 |
34 | This will return no results as the `package_status`{{copy}} field is not detected.
35 |
--------------------------------------------------------------------------------
/loki/loki-getting-started-tutorial/index.json:
--------------------------------------------------------------------------------
1 | {
2 | "title": "Loki Tutorial",
3 | "description": "An expanded quick start tutorial taking you though core functions of the Loki stack.",
4 | "details": {
5 | "intro": {
6 | "text": "intro.md",
7 | "foreground": "setup.sh"
8 | },
9 | "steps": [
10 | {
11 | "text": "step1.md"
12 | },
13 | {
14 | "text": "step2.md"
15 | },
16 | {
17 | "text": "step3.md"
18 | },
19 | {
20 | "text": "step4.md"
21 | },
22 | {
23 | "text": "step5.md"
24 | },
25 | {
26 | "text": "step6.md"
27 | },
28 | {
29 | "text": "step7.md"
30 | },
31 | {
32 | "text": "step8.md"
33 | }
34 | ],
35 | "finish": {
36 | "text": "finish.md"
37 | }
38 | },
39 | "backend": {
40 | "imageid": "ubuntu"
41 | }
42 | }
43 |
--------------------------------------------------------------------------------
/loki/loki-getting-started-tutorial/intro.md:
--------------------------------------------------------------------------------
1 | # Loki Tutorial
2 |
3 | This quickstart guide will walk you through deploying Loki in single binary mode (also known as [monolithic mode](https://grafana.com/docs/loki/latest/get-started/deployment-modes/#monolithic-mode)) using Docker Compose. Grafana Loki is only one component of the Grafana observability stack for logs. In this tutorial we will refer to this stack as the **Loki stack**.
4 |
5 | 
6 |
7 | The Loki stack consists of the following components:
8 |
9 | - **Alloy**: [Grafana Alloy](https://grafana.com/docs/alloy/latest/) is an open source telemetry collector for metrics, logs, traces, and continuous profiles. In this quickstart guide Grafana Alloy has been configured to tail logs from all Docker containers and forward them to Loki.
10 | - **Loki**: A log aggregation system to store the collected logs. For more information on what Loki is, see the [Loki overview](https://grafana.com/docs/loki/latest/get-started/overview/).
11 | - **Grafana**: [Grafana](https://grafana.com/docs/grafana/latest/) is an open-source platform for monitoring and observability. Grafana will be used to query and visualize the logs stored in Loki.
12 |
--------------------------------------------------------------------------------
/loki/loki-getting-started-tutorial/setup.sh:
--------------------------------------------------------------------------------
1 | #!/bin/sh
2 |
3 | set -euf
4 | # shellcheck disable=SC3040
5 | (set -o pipefail 2> /dev/null) && set -o pipefail && sudo install -m 0755 -d /etc/apt/keyrings && \
6 | sudo curl -fsSL https://download.docker.com/linux/ubuntu/gpg -o /etc/apt/keyrings/docker.asc && \
7 | sudo chmod a+r /etc/apt/keyrings/docker.asc && \
8 | ARCH="$(dpkg --print-architecture)" && \
9 | VERSION_CODENAME="$(source /etc/os-release && echo "${VERSION_CODENAME}")" && \
10 | readonly ARCH VERSION_CODENAME && \
11 | printf 'deb [arch=%s signed-by=/etc/apt/keyrings/docker.asc] https://download.docker.com/linux/ubuntu %s stable' "${ARCH}" "${VERSION_CODENAME}" | sudo tee /etc/apt/sources.list.d/docker.list > /dev/null && \
12 | sudo apt-get update && \
13 | sudo apt-get install -y docker-compose-plugin
--------------------------------------------------------------------------------
/loki/loki-getting-started-tutorial/step1.md:
--------------------------------------------------------------------------------
1 | # Deploy the Loki stack
2 |
3 | **To deploy the Loki stack locally, follow these steps:**
4 |
5 | 1. Clone the Loki fundamentals repository and check out the getting-started branch:
6 |
7 | ```bash
8 | git clone https://github.com/grafana/loki-fundamentals.git -b getting-started
9 | ```{{exec}}
10 | 1. Change to the `loki-fundamentals`{{copy}} directory:
11 |
12 | ```bash
13 | cd loki-fundamentals
14 | ```{{exec}}
15 | 1. With `loki-fundamentals`{{copy}} as the current working directory deploy Loki, Alloy, and Grafana using Docker Compose:
16 |
17 | ```bash
18 | docker compose up -d
19 | ```{{exec}}
20 |
21 | After running the command, you should see a similar output:
22 |
23 | ```console
24 | ✔ Container loki-fundamentals-grafana-1 Started 0.3s
25 | ✔ Container loki-fundamentals-loki-1 Started 0.3s
26 | ✔ Container loki-fundamentals-alloy-1 Started 0.4s
27 | ```{{copy}}
28 | 1. With the Loki stack running, you can now verify each component is up and running:
29 |
30 | - **Alloy**: Open a browser and navigate to [http://localhost:12345/graph]({{TRAFFIC_HOST1_12345}}/graph). You should see the Alloy UI.
31 | - **Grafana**: Open a browser and navigate to [http://localhost:3000]({{TRAFFIC_HOST1_3000}}). You should see the Grafana home page.
32 | - **Loki**: Open a browser and navigate to [http://localhost:3100/metrics]({{TRAFFIC_HOST1_3100}}/metrics). You should see the Loki metrics page.
33 |
--------------------------------------------------------------------------------
/loki/loki-getting-started-tutorial/step2.md:
--------------------------------------------------------------------------------
1 | Since Grafana Alloy is configured to tail logs from all Docker containers, Loki should already be receiving logs. The best place to verify log collection is using the Grafana Logs Drilldown feature. To do this, navigate to [http://localhost:3000/drilldown]({{TRAFFIC_HOST1_3000}}/drilldown). Select **Logs**. You should see the Grafana Logs Drilldown page.
2 |
3 | 
4 |
5 | If you have only the getting started demo deployed in your Docker environment, you should see three containers and their logs; `loki-fundamentals-alloy-1`{{copy}}, `loki-fundamentals-grafana-1`{{copy}} and `loki-fundamentals-loki-1`{{copy}}. In the `loki-fundamentals-loki-1`{{copy}} container, click **Show Logs** to drill down into the logs for that container.
6 |
7 | 
8 |
9 | We will not cover the rest of the Grafana Logs Drilldown features in this quickstart guide. For more information on how to use the Grafana Logs Drilldown feature, refer to [Get started with Grafana Logs Drilldown](https://grafana.com/docs/grafana/latest/explore/simplified-exploration/logs/get-started/).
10 |
--------------------------------------------------------------------------------
/loki/loki-quickstart/finish.md:
--------------------------------------------------------------------------------
1 | # Complete metrics, logs, traces, and profiling example
2 |
3 | You have completed the Loki Quickstart demo. So where to go next?
4 |
5 | # Back to docs
6 |
7 | Head back to where you started from to continue with the Loki documentation: [Loki documentation](https://grafana.com/docs/loki/latest/get-started/quick-start/).
8 |
9 | If you would like to run a demonstration environment that includes Mimir, Loki, Tempo, and Grafana, you can use [Introduction to Metrics, Logs, Traces, and Profiling in Grafana](https://github.com/grafana/intro-to-mlt).
10 | It's a self-contained environment for learning about Mimir, Loki, Tempo, and Grafana.
11 |
12 | The project includes detailed explanations of each component and annotated configurations for a single-instance deployment.
13 | You can also push the data from the environment to [Grafana Cloud](https://grafana.com/cloud/).
14 |
--------------------------------------------------------------------------------
/loki/loki-quickstart/index.json:
--------------------------------------------------------------------------------
1 | {
2 | "title": "Loki Quickstart Demo",
3 | "description": "This sandbox provides an online enviroment for testing the Loki quickstart demo.",
4 | "details": {
5 | "intro": {
6 | "text": "intro.md",
7 | "foreground": "setup.sh"
8 | },
9 | "steps": [
10 | {
11 | "text": "step1.md"
12 | },
13 | {
14 | "text": "step2.md"
15 | }
16 | ],
17 | "finish": {
18 | "text": "finish.md"
19 | }
20 | },
21 | "backend": {
22 | "imageid": "ubuntu"
23 | }
24 | }
25 |
--------------------------------------------------------------------------------
/loki/loki-quickstart/intro.md:
--------------------------------------------------------------------------------
1 | # Quickstart to run Loki locally
2 |
3 | If you want to experiment with Loki, you can run Loki locally using the Docker Compose file that ships with Loki. It runs Loki in a [monolithic deployment](https://grafana.com/docs/loki/latest/get-started/deployment-modes/#monolithic-mode) mode and includes a sample application to generate logs.
4 |
5 | The Docker Compose configuration runs the following components, each in its own container:
6 |
7 | - **flog**: which generates log lines.
8 | [flog](https://github.com/mingrammer/flog) is a log generator for common log formats.
9 | - **Grafana Alloy**: which scrapes the log lines from flog, and pushes them to Loki through the gateway.
10 | - **Gateway** (nginx) which receives requests and redirects them to the appropriate container based on the request's URL.
11 | - **Loki read component**: which runs a Query Frontend and a Querier.
12 | - **Loki write component**: which runs a Distributor and an Ingester.
13 | - **Loki backend component**: which runs an Index Gateway, Compactor, Ruler, Bloom Planner (experimental), Bloom Builder (experimental), and Bloom Gateway (experimental).
14 | - **Minio**: which Loki uses to store its index and chunks.
15 | - **Grafana**: which provides visualization of the log lines captured within Loki.
16 |
17 | 
18 |
--------------------------------------------------------------------------------
/loki/loki-quickstart/setup.sh:
--------------------------------------------------------------------------------
1 | #!/bin/sh
2 |
3 | set -euf
4 | # shellcheck disable=SC3040
5 | (set -o pipefail 2> /dev/null) && set -o pipefail
6 |
7 |
8 | sudo install -m 0755 -d /etc/apt/keyrings
9 | sudo curl -fsSL https://download.docker.com/linux/ubuntu/gpg -o /etc/apt/keyrings/docker.asc
10 | sudo chmod a+r /etc/apt/keyrings/docker.asc
11 |
12 | ARCH="$(dpkg --print-architecture)"
13 | VERSION_CODENAME="$(source /etc/os-release && echo "${VERSION_CODENAME}")"
14 | readonly ARCH VERSION_CODENAME
15 |
16 | printf 'deb [arch=%s signed-by=/etc/apt/keyrings/docker.asc] https://download.docker.com/linux/ubuntu %s stable' "${ARCH}" "${VERSION_CODENAME}" | sudo tee /etc/apt/sources.list.d/docker.list > /dev/null
17 |
18 | sudo apt-get update
19 | sudo apt-get install -y docker-compose-plugin && clear && echo "Setup complete. You may now begin the tutorial."
--------------------------------------------------------------------------------
/loki/otel-collector-getting-started/finish.md:
--------------------------------------------------------------------------------
1 | # Summary
2 |
3 | In this example, we configured the OpenTelemetry Collector to receive logs from an example application and send them to Loki using the native OTLP endpoint. Make sure to also consult the Loki configuration file `loki-config.yaml`{{copy}} to understand how we have configured Loki to receive logs from the OpenTelemetry Collector.
4 |
5 | ## Back to docs
6 |
7 | Head back to where you started from to continue with the [Loki documentation](https://grafana.com/docs/loki/latest/send-data/otel).
8 |
9 | # Further reading
10 |
11 | For more information on the OpenTelemetry Collector and the native OTLP endpoint of Loki, refer to the following resources:
12 |
13 | - [Loki OTLP endpoint](https://grafana.com/docs/loki/latest/send-data/otel/)
14 | - [How is native OTLP endpoint different from Loki Exporter](https://grafana.com/docs/loki/latest/send-data/otel/native_otlp_vs_loki_exporter)
15 | - [OpenTelemetry Collector Configuration](https://opentelemetry.io/docs/collector/configuration/)
16 |
17 | # Complete metrics, logs, traces, and profiling example
18 |
19 | If you would like to use a demo that includes Mimir, Loki, Tempo, and Grafana, you can use [Introduction to Metrics, Logs, Traces, and Profiling in Grafana](https://github.com/grafana/intro-to-mlt). `Intro-to-mltp`{{copy}} provides a self-contained environment for learning about Mimir, Loki, Tempo, and Grafana.
20 |
21 | The project includes detailed explanations of each component and annotated configurations for a single-instance deployment. Data from `intro-to-mltp`{{copy}} can also be pushed to Grafana Cloud.
22 |
--------------------------------------------------------------------------------
/loki/otel-collector-getting-started/index.json:
--------------------------------------------------------------------------------
1 | {
2 | "title": "Getting started with the OpenTelemetry Collector and Loki tutorial",
3 | "description": "A Tutorial configuring the OpenTelemetry Collector to send OpenTelemetry logs to Loki",
4 | "details": {
5 | "intro": {
6 | "text": "intro.md"
7 | },
8 | "steps": [
9 | {
10 | "text": "step1.md"
11 | },
12 | {
13 | "text": "step2.md"
14 | },
15 | {
16 | "text": "step3.md"
17 | }
18 | ],
19 | "finish": {
20 | "text": "finish.md"
21 | }
22 | },
23 | "backend": {
24 | "imageid": "ubuntu"
25 | }
26 | }
27 |
--------------------------------------------------------------------------------
/loki/otel-collector-getting-started/step1.md:
--------------------------------------------------------------------------------
1 | # Step 1: Environment setup
2 |
3 | In this step, we will set up our environment by cloning the repository that contains our demo application and spinning up our observability stack using Docker Compose.
4 |
5 | 1. To get started, clone the repository that contains our demo application:
6 |
7 | ```bash
8 | git clone -b microservice-otel-collector https://github.com/grafana/loki-fundamentals.git
9 | ```{{exec}}
10 | 1. Next we will spin up our observability stack using Docker Compose:
11 |
12 | ```bash
13 | docker-compose -f loki-fundamentals/docker-compose.yml up -d
14 | ```{{exec}}
15 |
16 | To check the status of services we can run the following command:
17 |
18 | ```bash
19 | docker ps -a
20 | ```{{exec}}
21 |
22 | After we've finished configuring the OpenTelemetry Collector and sending logs to Loki, we will be able to view the logs in Grafana. To check if Grafana is up and running, navigate to the following URL: [http://localhost:3000]({{TRAFFIC_HOST1_3000}})
23 |
--------------------------------------------------------------------------------
/loki/otel-collector-getting-started/step3.md:
--------------------------------------------------------------------------------
1 | # Step 3: Start the Carnivorous Greenhouse
2 |
3 | In this step, we will start the Carnivorous Greenhouse application. To start the application, run the following command:
4 |
5 | **Note: This docker-compose file relies on the `loki-fundamentals_loki`{{copy}} docker network. If you have not started the observability stack, you will need to start it first.**
6 |
7 | ```bash
8 | docker-compose -f loki-fundamentals/greenhouse/docker-compose-micro.yml up -d --build
9 | ```{{exec}}
10 |
11 | This will start the following services:
12 |
13 | ```console
14 | ✔ Container greenhouse-db-1 Started
15 | ✔ Container greenhouse-websocket_service-1 Started
16 | ✔ Container greenhouse-bug_service-1 Started
17 | ✔ Container greenhouse-user_service-1 Started
18 | ✔ Container greenhouse-plant_service-1 Started
19 | ✔ Container greenhouse-simulation_service-1 Started
20 | ✔ Container greenhouse-main_app-1 Started
21 | ```{{copy}}
22 |
23 | Once started, you can access the Carnivorous Greenhouse application at [http://localhost:5005]({{TRAFFIC_HOST1_5005}}). Generate some logs by interacting with the application in the following ways:
24 |
25 | 1. Create a user.
26 | 1. Log in.
27 | 1. Create a few plants to monitor.
28 | 1. Enable bug mode to activate the bug service. This will cause services to fail and generate additional logs.
29 |
30 | Finally to view the logs in Loki, navigate to the Loki Logs Explore view in Grafana at [http://localhost:3000/a/grafana-lokiexplore-app/explore]({{TRAFFIC_HOST1_3000}}/a/grafana-lokiexplore-app/explore).
31 |
--------------------------------------------------------------------------------
/loki/structure-of-logs/finished.md:
--------------------------------------------------------------------------------
1 | 
2 |
3 | # Structure of log
4 |
5 | You have completed the **Structure of logs* demo. This course is part of an **Intro to Grafana Loki** series. In this course, you learned the basics of log components and how they are structured.
6 |
7 | ## What's Next?
8 |
9 | Head back to the video to continue with Structure of Logging.
10 |
11 | [)](https://www.youtube.com/watch?v=8_JyqEqaHiw)
12 |
13 |
--------------------------------------------------------------------------------
/loki/structure-of-logs/index.json:
--------------------------------------------------------------------------------
1 | {
2 | "title": "Structure of Logs",
3 | "description": "This sandbox will teach you how to open an interpret an applications logs.",
4 | "details": {
5 | "intro": {
6 | "text": "intro.md",
7 | "foreground": "setup.sh"
8 | },
9 | "steps": [
10 | {
11 | "text": "step1.md"
12 | }
13 | ],
14 | "finish": {
15 | "text": "finished.md"
16 | }
17 | }
18 | ,
19 | "backend": {
20 | "imageid": "ubuntu"
21 | }
22 | }
--------------------------------------------------------------------------------
/loki/structure-of-logs/intro.md:
--------------------------------------------------------------------------------
1 | 
2 |
3 |
4 | # Welcome to the Structure of Logs demo
5 |
6 | This course is part of an **Intro to Grafana Loki** series. In this course, you will learn the basics of logging and how to use Grafana Loki to store and query your logs.
7 |
8 | ## The Video
9 |
10 | [)](https://www.youtube.com/watch?v=8_JyqEqaHiw)
11 |
12 |
13 | ## Sandbox Overview
14 |
15 | This sandbox will teach you how application log are generated.
16 |
--------------------------------------------------------------------------------
/loki/structure-of-logs/setup.sh:
--------------------------------------------------------------------------------
1 | #!/usr/bin/env bash
2 |
3 | echo "RUNNING SETUP SCRIPT"
4 |
5 | # Clone the tutorial environment repository if it doesn't already exist
6 | if [ ! -d "tutorial-environment" ]; then
7 | git clone https://github.com/grafana/loki-tutorial-enviroment.git || { echo "Failed to clone repository"; exit 1; }
8 | fi
9 |
10 | # Enter the directory and switch to the required branch
11 | cd loki-tutorial-enviroment && git checkout structure-of-logs || { echo "Failed to checkout branch"; exit 1; }
12 |
13 | echo "Building training instance...."
14 | docker-compose up -d || { echo "Failed to start docker containers"; exit 1; }
15 |
16 | # Update and install required packages
17 | echo "Updating and installing required packages..."
18 | sudo apt-get update && sudo apt-get install -y figlet; clear; echo -e "\e[32m$(figlet -f standard 'Structure of')\e[0m"; echo -e "\e[33m$(figlet -f standard 'Logs')\e[0m"
--------------------------------------------------------------------------------
/loki/structure-of-logs/step1.md:
--------------------------------------------------------------------------------
1 | # Running the demo
2 |
3 | ## Step 1: Check out the application
4 |
5 | In this demo, we will be working with a simple application that generates logs. We have created a small messaging board application similar to Hacker News or Reddit. The idea is users can post messages and upvote posts they like.
6 |
7 | To access the application click this link to Grafana News: **[http://localhost:8081]({{TRAFFIC_HOST1_8081}})**
8 |
9 | ## Step 2: Generate some logs
10 |
11 | Start to interact with the application by posting messages and upvoting posts. This will generate logs that we can explore in the next steps.
12 |
13 | **Top Tip:** *Try to post a message without a URL.*
14 |
15 | ## Step 3: Explore the logs
16 |
17 | Our application generates logs in a specific format (a hybrid between plain text and structured since it utilises key-value pairs). The log is located in the `logs` directory of the application.
18 |
19 | To print the logs, run the following command:
20 |
21 | ```bash
22 | cat ./logs/tns-app.log
23 | ```{{exec}}
24 |
25 |
26 |
27 |
--------------------------------------------------------------------------------
/loki/structure.json:
--------------------------------------------------------------------------------
1 | {
2 | "items": [
3 | { "path": "intro-to-logging", "title": "Intro to logging"},
4 | { "path": "structure-of-logs", "title": "Structure of logs"},
5 | { "path": "loki-quickstart", "title": "Loki Quickstart Demo"},
6 | { "path": "loki-getting-started-tutorial", "title": "Loki Getting Started Tutorial"},
7 | { "path": "what-is-loki", "title": "What is Loki?"},
8 | { "path": "intro-to-ingest", "title": "Intro to Ingesting"},
9 | { "path": "intro-to-ingest-otel", "title": "Intro to Ingesting with OpenTelemetry"},
10 | { "path": "alloy-otel-logs", "title": "Ingesting OpenTelemetry logs to Loki using Alloy"},
11 | { "path": "alloy-kafka-logs", "title": "Configuring Grafana Alloy to recive logs via Kafka and send them to Loki."},
12 | { "path": "intro-to-logging-fluentd-fluentbit", "title": "Configuring Fluentd and Fluent bit to send logs to Loki."},
13 | { "path": "otel-collector-getting-started", "title": "Getting started with the OpenTelemetry Collector and Loki tutorial"},
14 | { "path": "fluentbit-loki-tutorial", "title": "Sending logs to Loki using Fluent Bit tutorial"},
15 | { "path": "logcli-tutorial", "title": "LogCLI tutorial"},
16 | { "path": "k8s-monitoring-helm", "title": "Kubernetes Monitoring Helm"}
17 | ]
18 | }
--------------------------------------------------------------------------------
/loki/what-is-loki/finished.md:
--------------------------------------------------------------------------------
1 | 
2 |
3 | # What is Loki?
4 |
5 | You have completed the **What is loki** demo. This course is part of an **Intro to Grafana Loki** series. In this course, you learned the basics of Grafana Loki and how it can be used to store and query logs.
6 |
7 | ## What's Next?
8 |
9 | Head back to the video to continue with What is Loki.
10 |
11 | [](https://www.youtube.com/watch?v=1uk8LtQqsZQ)
12 |
--------------------------------------------------------------------------------
/loki/what-is-loki/index.json:
--------------------------------------------------------------------------------
1 | {
2 | "title": "What is Loki?",
3 | "description": "A sandbox enviroment to introduce Loki to new users. This sandbox will guide you through the basics of Loki and how to use it.",
4 | "details": {
5 | "intro": {
6 | "text": "intro.md",
7 | "foreground": "setup.sh"
8 | },
9 | "steps": [
10 | {
11 | "text": "step1.md"
12 | },
13 | {
14 | "text": "step2.md"
15 | }
16 | ],
17 | "finish": {
18 | "text": "finished.md"
19 | }
20 | }
21 | ,
22 | "backend": {
23 | "imageid": "ubuntu"
24 | }
25 | }
--------------------------------------------------------------------------------
/loki/what-is-loki/setup.sh:
--------------------------------------------------------------------------------
1 | #!/usr/bin/env bash
2 |
3 | echo "RUNNING SETUP SCRIPT"
4 |
5 | # Clone the tutorial environment repository if it doesn't already exist
6 | if [ ! -d "loki-fundamentals" ]; then
7 | git clone https://github.com/grafana/loki-fundamentals.git || { echo "Failed to clone repository"; exit 1; }
8 | fi
9 |
10 | # Enter the directory and switch to the required branch
11 | cd loki-fundamentals && git checkout what-is-loki || { echo "Failed to checkout branch"; exit 1; }
12 |
13 | echo "Building training instance...."
14 | docker-compose up -d || { echo "Failed to start docker containers"; exit 1; }
15 |
16 | # Update and install required packages
17 | echo "Updating and installing required packages..."
18 | sudo apt-get update && sudo apt-get install -y figlet; clear; echo -e "\e[32m$(figlet -f standard 'What is')\e[0m"; echo -e "\e[33m$(figlet -f standard 'Loki?')\e[0m"
--------------------------------------------------------------------------------
/loki/what-is-loki/step1.md:
--------------------------------------------------------------------------------
1 |
2 | # Step 1: Generating some logs
3 |
4 | In this step, we will generate some logs using the Carnivorous Greenhouse application. This application generates logs when you create an account, login, and collect metrics from a series of hungry plants. The logs are sent to Loki.
5 |
6 | To access the application, click this link to Carnivorous Greenhouse: **[http://localhost:5005]({{TRAFFIC_HOST1_5005}})**
7 |
8 | ## Generate some logs
9 |
10 | 1. Create an account by clicking the **Sign Up** button.
11 | 2. Create a user by entering a username and password.
12 | 3. Log in by clicking the **Login** button.
13 | 4. Create your first plant by:
14 | * Adding a name
15 | * Selecting a plant type
16 | * Clicking the **Add Plant** button.
17 |
18 | ### Optional: Generate errors
19 |
20 | The plants do a good job eating all the bugs, but sometimes they get a little too hungry and cause errors. To generate an error, toggle the **Toggle Error mode**. This will cause a variety of errors to occure such as; sign up errors, login errors, and plant creation errors. These errors can be investigated in the logs.
21 |
22 |
23 |
--------------------------------------------------------------------------------
/loki/what-is-loki/step2.md:
--------------------------------------------------------------------------------
1 |
2 | # Step 2: Investigating the logs
3 |
4 | In the previous step, we generated logs using the Carnivorous Greenhouse application. In this step, we will investigate the logs that were generated. These logs where tailed by Alloy and sent to Loki. Let's explore the logs.
5 |
6 | ## Explore the logs
7 |
8 | To start exploring the logs, we will use the Grafana Explore Logs view. This is a new queriless way to explore logs in Grafana.
9 |
10 | 1. To access this view, follow this link: **[http://localhost:3000/a/grafana-lokiexplore-app/explore]({{TRAFFIC_HOST1_3000}}/a/grafana-lokiexplore-app/explore)**
11 |
12 | 2. From there experiment with the different options available to you. Drill down into the logs and see what you can find.
13 |
14 |
15 | ### Open In Explore
16 |
17 | You all also have the option to open your current log view in Explore. This will allow you to continue your investigation in the Explore view. To do this, click the **Open in Explore** button.
18 |
19 |
--------------------------------------------------------------------------------
/mimir/play-with-mimir/docker-compose-update.sh:
--------------------------------------------------------------------------------
1 | #!/bin/sh
2 |
3 | set -euf
4 | # shellcheck disable=SC3040
5 | (set -o pipefail 2> /dev/null) && set -o pipefail && sudo install -m 0755 -d /etc/apt/keyrings && \
6 | sudo curl -fsSL https://download.docker.com/linux/ubuntu/gpg -o /etc/apt/keyrings/docker.asc && \
7 | sudo chmod a+r /etc/apt/keyrings/docker.asc && \
8 | ARCH="$(dpkg --print-architecture)" && \
9 | VERSION_CODENAME="$(source /etc/os-release && echo "${VERSION_CODENAME}")" && \
10 | readonly ARCH VERSION_CODENAME && \
11 | printf 'deb [arch=%s signed-by=/etc/apt/keyrings/docker.asc] https://download.docker.com/linux/ubuntu %s stable' "${ARCH}" "${VERSION_CODENAME}" | sudo tee /etc/apt/sources.list.d/docker.list > /dev/null && \
12 | sudo apt-get update && \
13 | sudo apt-get install -y docker-compose-plugin
--------------------------------------------------------------------------------
/mimir/play-with-mimir/finish.md:
--------------------------------------------------------------------------------
1 | # Summary
2 |
3 | In this tutorial you started Grafana Mimir locally in a high-available setup as well as a Prometheus instance that remote wrote
4 | some metrics to Grafana Mimir. You then queried those metrics stored in Mimir using Grafana, and visualized them in some Grafana dashboards.
5 | Lastly, you configured a recording rule and an alert via the Grafana Alerting UI and verified that the alert fired as expected when the condition was met.
6 |
--------------------------------------------------------------------------------
/mimir/play-with-mimir/index.json:
--------------------------------------------------------------------------------
1 | {
2 | "title": "Play with Mimir",
3 | "description": "Learn about Grafana Mimir, which provides distributed, horizontally scalable, and highly available long term storage for Prometheus.",
4 | "details": {
5 | "intro": {
6 | "text": "intro.md",
7 | "foreground": "docker-compose-update.sh"
8 | },
9 | "steps": [
10 | {
11 | "text": "step1.md"
12 | },
13 | {
14 | "text": "step2.md"
15 | },
16 | {
17 | "text": "step3.md"
18 | },
19 | {
20 | "text": "step4.md"
21 | },
22 | {
23 | "text": "step5.md"
24 | }
25 | ],
26 | "finish": {
27 | "text": "finish.md"
28 | }
29 | },
30 | "backend": {
31 | "imageid": "ubuntu"
32 | }
33 | }
34 |
--------------------------------------------------------------------------------
/mimir/play-with-mimir/intro.md:
--------------------------------------------------------------------------------
1 | # Play with Mimir
2 |
3 | Grafana Mimir is a distributed, horizontally scalable, and highly available long term storage for [Prometheus](https://prometheus.io).
4 |
5 | In this tutorial, you'll:
6 |
7 | - Run Grafana Mimir locally with Docker Compose
8 | - Run Prometheus to scrape some metrics and remote write to Grafana Mimir
9 | - Run Grafana to explore Grafana Mimir dashboards
10 | - Configure a testing recording rule and alert in Grafana Mimir
11 |
--------------------------------------------------------------------------------
/mimir/play-with-mimir/step1.md:
--------------------------------------------------------------------------------
1 | # Download tutorial configuration
2 |
3 | 1. Create a copy of the Grafana Mimir repository using the Git command line:
4 | ```bash
5 | git clone https://github.com/grafana/mimir.git
6 | cd mimir
7 | ```{{exec}}
8 | 1. Navigate to the tutorial directory:
9 | ```bash
10 | cd docs/sources/mimir/get-started/play-with-grafana-mimir/
11 | ```{{exec}}
12 |
13 | > **Note:**
14 | > The instructions in this tutorial assume that your working directory is `docs/sources/mimir/get-started/play-with-grafana-mimir/`{{copy}}.
15 |
--------------------------------------------------------------------------------
/mimir/play-with-mimir/step2.md:
--------------------------------------------------------------------------------
1 | # Start Grafana Mimir and dependencies
2 |
3 | Start running your local setup with the following Docker command:
4 |
5 | ```bash
6 | docker compose up -d
7 | ```{{exec}}
8 |
9 | This command starts:
10 |
11 | - Grafana Mimir
12 | - Three instances of monolithic-mode Mimir to provide high availability
13 | - Multi-tenancy enabled (tenant ID is `demo`{{copy}})
14 | - [Minio](https://min.io/)
15 | - S3-compatible persistent storage for blocks, rules, and alerts
16 | - Prometheus
17 | - Scrapes Grafana Mimir metrics, then writes them back to Grafana Mimir to ensure availability of ingested metrics
18 | - Grafana
19 | - Includes a preinstalled datasource to query Grafana Mimir
20 | - Includes preinstalled dashboards for monitoring Grafana Mimir
21 | - Load balancer
22 | - A simple NGINX-based load balancer that exposes Grafana Mimir endpoints on the host
23 |
24 | The diagram below illustrates the relationship between these components:
25 | 
26 |
27 | The following ports will be exposed on the host:
28 |
29 | - Grafana on [`http://localhost:9000`{{copy}}]({{TRAFFIC_HOST1_9000}})
30 | - Grafana Mimir on [`http://localhost:9009`{{copy}}]({{TRAFFIC_HOST1_9009}})
31 |
32 | To learn more about the Grafana Mimir configuration, you can review the configuration file `config/mimir.yaml`{{copy}}.
33 |
--------------------------------------------------------------------------------
/mimir/play-with-mimir/step3.md:
--------------------------------------------------------------------------------
1 | # Explore Grafana Mimir dashboards
2 |
3 | > **Note:**
4 | > Sandbox users: If you're using the interactive learning environment, you can access all links directly by clicking on them. This will redirect you to the VM's localhost where the services are running.
5 |
6 | Open Grafana on your local host [`http://localhost:9000`{{copy}}]({{TRAFFIC_HOST1_9000}}) and view dashboards showing the status
7 | and health of your Grafana Mimir cluster. The dashboards query Grafana Mimir for the metrics they display.
8 |
9 | To start, we recommend looking at these dashboards:
10 |
11 | - [Writes]({{TRAFFIC_HOST1_9000}}/d/8280707b8f16e7b87b840fc1cc92d4c5/mimir-writes)
12 | - [Reads]({{TRAFFIC_HOST1_9000}}/d/e327503188913dc38ad571c647eef643/mimir-reads)
13 | - [Queries]({{TRAFFIC_HOST1_9000}}/d/b3abe8d5c040395cc36615cb4334c92d/mimir-queries)
14 | - [Object Store]({{TRAFFIC_HOST1_9000}}/d/e1324ee2a434f4158c00a9ee279d3292/mimir-object-store)
15 |
16 | A couple of caveats:
17 |
18 | - It typically takes a few minutes after Grafana Mimir starts to display meaningful metrics in the dashboards.
19 | - Because this tutorial runs Grafana Mimir without any query-scheduler, or memcached, the related panels are expected to be empty.
20 |
21 | The dashboards installed in the Grafana are taken from the Grafana Mimir mixin which packages up Grafana Labs' best practice dashboards, recording rules, and alerts for monitoring Grafana Mimir. To learn more about the mixin, check out the Grafana Mimir mixin documentation. To learn more about how Grafana is connecting to Grafana Mimir, review the [Mimir datasource]({{TRAFFIC_HOST1_9000}}/datasources).
22 |
--------------------------------------------------------------------------------
/mimir/play-with-mimir/step4.md:
--------------------------------------------------------------------------------
1 | # Configure your first recording rule
2 |
3 | Recording rules allow you to precompute frequently needed or computationally expensive expressions and save their result
4 | as a new set of time series. In this section you're going to configure a recording rule in Grafana Mimir using tooling
5 | offered by Grafana.
6 |
7 | 1. Open [Grafana Alerting]({{TRAFFIC_HOST1_9000}}/alerting/list).
8 | 1. Click **New recording rule**, which also allows you to configure recording rules.
9 | 1. Configure the recording rule:
10 | 1. Give the rule a name, such as `sum:up`{{copy}}.
11 | 1. Choose **Mimir** in the **Select data source** field.
12 | 1. Choose **Code** in the **Builder | Code** field on the right.
13 | 1. Type `sum(up)`{{copy}} in the **Metrics browser** query field.
14 | 1. Type `example-namespace`{{copy}} in the **Namespace** field.
15 | 1. Type `example-group`{{copy}} in the **Group** field.
16 | 1. From the upper-right corner, click the **Save and exit** button.
17 |
18 | Your `sum:up`{{copy}} recording rule will show the number of Mimir instances that are `up`{{copy}}, meaning reachable to be scraped. The
19 | rule is now being created in Grafana Mimir ruler and will be soon available for querying:
20 |
21 | 1. Open [Grafana Explore]({{TRAFFIC_HOST1_9000}}/explore)
22 | and query the resulting series from the recording rule, which may require up to one minute to display after configuration:
23 | ```
24 | sum:up
25 | ```{{copy}}
26 | 1. Confirm the query returns a value of `3`{{copy}} which is the number of Mimir instances currently running in your local setup.
27 |
--------------------------------------------------------------------------------
/mimir/structure.json:
--------------------------------------------------------------------------------
1 | {
2 | "items": [
3 | { "path": "play-with-mimir", "title": "Play with Mimir"}
4 | ]
5 | }
--------------------------------------------------------------------------------
/pyroscope/ride-share-tutorial/docker-compose-update.sh:
--------------------------------------------------------------------------------
1 | #!/bin/sh
2 |
3 | set -euf
4 | # shellcheck disable=SC3040
5 | (set -o pipefail 2> /dev/null) && set -o pipefail && sudo install -m 0755 -d /etc/apt/keyrings && \
6 | sudo curl -fsSL https://download.docker.com/linux/ubuntu/gpg -o /etc/apt/keyrings/docker.asc && \
7 | sudo chmod a+r /etc/apt/keyrings/docker.asc && \
8 | ARCH="$(dpkg --print-architecture)" && \
9 | VERSION_CODENAME="$(source /etc/os-release && echo "${VERSION_CODENAME}")" && \
10 | readonly ARCH VERSION_CODENAME && \
11 | printf 'deb [arch=%s signed-by=/etc/apt/keyrings/docker.asc] https://download.docker.com/linux/ubuntu %s stable' "${ARCH}" "${VERSION_CODENAME}" | sudo tee /etc/apt/sources.list.d/docker.list > /dev/null && \
12 | sudo apt-get update && \
13 | sudo apt-get install -y docker-compose-plugin
--------------------------------------------------------------------------------
/pyroscope/ride-share-tutorial/finish.md:
--------------------------------------------------------------------------------
1 | # Summary
2 |
3 | In this tutorial, you learned how to profile a simple "Ride Share" application using Pyroscope.
4 | You have learned some of the core instrumentation concepts such as tagging and how to use Profiles Drilldown identify performance bottlenecks.
5 |
6 | ## Next steps
7 |
8 | - Learn more about the Pyroscope SDKs and how to [instrument your application with Pyroscope](https://grafana.com/docs/pyroscope/latest/configure-client/).
9 | - Deploy Pyroscope in a production environment using the [Pyroscope Helm chart](https://grafana.com/docs/pyroscope/latest/deploy-kubernetes/).
10 | - Continue exploring your profile data using [Profiles Drilldown](https://grafana.com/docs/grafana/latest/explore/simplified-exploration/profiles/investigate/)
11 |
--------------------------------------------------------------------------------
/pyroscope/ride-share-tutorial/index.json:
--------------------------------------------------------------------------------
1 | {
2 | "title": "Ride share tutorial",
3 | "description": "Learn how to get started with Pyroscope using a simple Ride share app.",
4 | "details": {
5 | "intro": {
6 | "text": "intro.md",
7 | "foreground": "docker-compose-update.sh"
8 | },
9 | "steps": [
10 | {
11 | "text": "step1.md"
12 | },
13 | {
14 | "text": "step2.md"
15 | },
16 | {
17 | "text": "step3.md"
18 | },
19 | {
20 | "text": "step4.md"
21 | }
22 | ],
23 | "finish": {
24 | "text": "finish.md"
25 | }
26 | },
27 | "backend": {
28 | "imageid": "ubuntu"
29 | }
30 | }
31 |
--------------------------------------------------------------------------------
/pyroscope/ride-share-tutorial/step1.md:
--------------------------------------------------------------------------------
1 | # Clone the repository
2 |
3 | 1. Clone the repository to your local machine:
4 |
5 | ```bash
6 | git clone https://github.com/grafana/pyroscope.git && cd pyroscope
7 | ```{{exec}}
8 | 1. Navigate to the tutorial directory:
9 |
10 | ```bash
11 | cd examples/language-sdk-instrumentation/python/rideshare/flask
12 | ```{{exec}}
13 |
14 | # Start the application
15 |
16 | Start the application using Docker Compose:
17 |
18 | ```bash
19 | docker compose up -d
20 | ```{{exec}}
21 |
22 | This may take a few minutes to download the required images and build the demo application. Once ready, you will see the following output:
23 |
24 | ```console
25 | ✔ Network flask_default Created
26 | ✔ Container flask-ap-south-1 Started
27 | ✔ Container flask-grafana-1 Started
28 | ✔ Container flask-pyroscope-1 Started
29 | ✔ Container flask-load-generator-1 Started
30 | ✔ Container flask-eu-north-1 Started
31 | ✔ Container flask-us-east-1 Started
32 | ```{{copy}}
33 |
34 | Optional: To verify the containers are running, run:
35 |
36 | ```bash
37 | docker ps -a
38 | ```{{exec}}
39 |
--------------------------------------------------------------------------------
/pyroscope/ride-share-tutorial/step4.md:
--------------------------------------------------------------------------------
1 | # How was Pyroscope integrated with Grafana in this tutorial?
2 |
3 | The `docker-compose.yml`{{copy}} file includes a Grafana container that's pre-configured with the Pyroscope plugin:
4 |
5 | ```yaml
6 | grafana:
7 | image: grafana/grafana:latest
8 | environment:
9 | - GF_INSTALL_PLUGINS=grafana-pyroscope-app
10 | - GF_AUTH_ANONYMOUS_ENABLED=true
11 | - GF_AUTH_ANONYMOUS_ORG_ROLE=Admin
12 | - GF_AUTH_DISABLE_LOGIN_FORM=true
13 | volumes:
14 | - ./grafana-provisioning:/etc/grafana/provisioning
15 | ports:
16 | - 3000:3000
17 | ```{{copy}}
18 |
19 | Grafana is also pre-configured with the Pyroscope data source.
20 |
21 | ## Challenge
22 |
23 | As a challenge, see if you can generate a similar comparison with the `vehicle`{{copy}} tag.
24 |
--------------------------------------------------------------------------------
/pyroscope/structure.json:
--------------------------------------------------------------------------------
1 | {
2 | "items": [
3 | { "path": "ride-share-tutorial", "title": "Ride share tutorial"}
4 | ]
5 | }
--------------------------------------------------------------------------------
/sandbox-developer/sandbox-transformer-walk-through/finish.md:
--------------------------------------------------------------------------------
1 | # Conclusion
2 |
3 | In this tutorial, you learned how to use the Sandbox Transformer to turn Markdown docs into a course. You learned how to build the transformer, the basic meta syntax, and how to use the transformer to create a course. You also learned how to test the course using your own Killercoda instance.
4 |
5 | ## Next steps
6 |
7 | When you are ready, you can open a PR to the `killercoda`{{copy}} repository to add your course. We are excited to see what you create and to get your feedback on the Sandbox Transformer.
8 |
--------------------------------------------------------------------------------
/sandbox-developer/sandbox-transformer-walk-through/index.json:
--------------------------------------------------------------------------------
1 | {
2 | "title": "Learn how to use the Sandbox Transformer",
3 | "description": "Learn how to use the Sandbox Transformer to turn hugo docs into a course",
4 | "details": {
5 | "intro": {
6 | "text": "intro.md"
7 | },
8 | "steps": [
9 | {
10 | "text": "step1.md"
11 | },
12 | {
13 | "text": "step2.md"
14 | },
15 | {
16 | "text": "step3.md"
17 | },
18 | {
19 | "text": "step4.md"
20 | }
21 | ],
22 | "finish": {
23 | "text": "finish.md"
24 | }
25 | },
26 | "backend": {
27 | "imageid": "ubuntu"
28 | }
29 | }
30 |
--------------------------------------------------------------------------------
/sandbox-developer/sandbox-transformer-walk-through/intro.md:
--------------------------------------------------------------------------------
1 | # Learn how to use the Sandbox Transformer
2 |
3 | The Sandbox Transformer is an experimental tool created by Grafana Labs to turn **Hugo Markdown** files into Killercoda courses. This tool is still in development, but we’re excited to share it with you and get your feedback. In this tutorial, you will learn how to use the Sandbox Transformer to turn Hugo docs into a course.
4 |
5 | > **Note:** This tutorial can also work with non-Hugo Markdown files but it requires that each file has certain [Hugo front matter metadata](https://gohugo.io/content-management/front-matter/).
6 | > This front matter may interfere with the rendering of the original Markdown file.
7 |
8 | ## What you will learn
9 |
10 | - How to build the Sandbox Transformer
11 |
12 | - Learn the basic meta syntax
13 |
14 | - How to use the Sandbox Transformer to turn Hugo docs into a course
15 |
--------------------------------------------------------------------------------
/sandbox-developer/sandbox-transformer-walk-through/step1.md:
--------------------------------------------------------------------------------
1 | # Prerequisites
2 |
3 | In this section we will cover the prerequisites you need to have in place in order to download and run the Sandbox Transformer.
4 |
5 | ## Download the transformer
6 |
7 | The Sandbox Transformer is written in Go and is distributed as a binary. You may also build the transformer from source if you prefer.
8 |
9 | 1. Download the Transformer binary from the [releases page](https://github.com/grafana/killercoda/releases):
10 |
11 | ```bash
12 | wget https://github.com/grafana/killercoda/releases/download/v0.1.5/transformer-linux-amd64 -O transformer
13 | ```{{exec}}
14 |
15 | 1. Make the binary executable:
16 |
17 | ```bash
18 | chmod +x transformer
19 | ```{{exec}}
20 |
21 | ## Clone the repository
22 |
23 | You will also need to clone the repository to your local machine. You can do this by running the following command:
24 |
25 | ```bash
26 | git clone https://github.com/grafana/killercoda.git && cd killercoda
27 | ```{{exec}}
28 |
29 | Its best practise to create a new branch for each new course you create. You can do this by running the following command:
30 |
31 | ```bash
32 | git checkout -b my-new-course
33 | ```{{exec}}
34 |
--------------------------------------------------------------------------------
/sandbox-developer/sandbox-transformer-walk-through/step4.md:
--------------------------------------------------------------------------------
1 | # Test the course
2 |
3 | Before you open a PR to the `killercoda`{{copy}} repository, you should test the course to make sure it works as expected. The easiest way to do this is to run the course via your own Killercoda instance. To do this follow these steps:
4 |
5 | 1. [Fork the `killercoda`{{copy}}{{copy}} repository](https://github.com/grafana/killercoda/fork) to your own GitHub account. This will provide you with a URL to your forked repository.
6 |
7 | ```
8 | https://github.com//killercoda.git
9 | ```{{copy}}
10 |
11 | 1. change back to the `killercoda`{{copy}} repository:
12 |
13 | ```bash
14 | cd killercoda
15 | ```{{exec}}
16 |
17 | 1. Add the forked repository as a remote to your local repository:
18 |
19 | ```bash
20 | git remote add forked https://github.com//killercoda.git
21 | ```{{copy}}
22 |
23 | 1. Add the changes to your forked repository:
24 |
25 | ```bash
26 | git add .
27 | git commit -m "Add new course"
28 | ```{{exec}}
29 |
30 | 1. Push the changes to your forked repository:
31 |
32 | ```bash
33 | git push forked my-new-course
34 | ```{{exec}}
35 |
36 | 1. Create a Killercoda account: [https://killercoda.com/login](https://killercoda.com/login)
37 |
38 | 1. Then head to: [https://killercoda.com/creator/repository](https://killercoda.com/creator/repository) and add your forked repository.
39 |
40 | 1. After you save, you should see your course in the list of courses. Click on the course to open it.
41 |
--------------------------------------------------------------------------------
/sandbox-developer/sandbox-transformer-walk-through/step5.md:
--------------------------------------------------------------------------------
1 | # Test the course
2 |
3 | Before you open a PR to the `killercoda`{{copy}} repository, you should test the course to make sure it works as expected. The easiest way to do this is to run the course via your own Killercoda instance. To do this follow these steps:
4 |
5 | 1. [Fork the `killercoda`{{copy}} repository](https://github.com/grafana/killercoda/fork) to your own GitHub account. This will provide you with a URL to your forked repository.
6 |
7 | ```
8 | https://github.com//killercoda.git
9 | ```{{copy}}
10 |
11 | 1. Add the forked repository as a remote to your local repository:
12 |
13 | ```bash
14 | git remote add forked https://github.com//killercoda.git
15 | ```{{copy}}
16 |
17 | 1. Add the changes to your forked repository:
18 |
19 | ```bash
20 | git add .
21 | git commit -m "Add new course"
22 | ```{{exec}}
23 |
24 | 1. Push the changes to your forked repository:
25 |
26 | ```bash
27 | git push forked my-new-course
28 | ```{{exec}}
29 |
30 | 1. Create a Killercoda account: [https://killercoda.com/login](https://killercoda.com/login)
31 |
32 | 1. Then head to: [https://killercoda.com/creator/repository](https://killercoda.com/creator/repository) and add your forked repository.
33 |
34 | 1. After you save, you should see your course in the list of courses. Click on the course to open it.
35 |
--------------------------------------------------------------------------------
/sandbox-developer/structure.json:
--------------------------------------------------------------------------------
1 | {
2 | "items": [
3 | { "path": "sandbox-transformer-walk-through", "title": "Learn how to use the Sandbox Transformer"}
4 | ]
5 | }
--------------------------------------------------------------------------------
/scripts/check-out-branch.bash:
--------------------------------------------------------------------------------
1 | #!/usr/bin/env bash
2 |
3 | set -euf -o pipefail
4 |
5 | function usage {
6 | cat < /dev/null) && set -o pipefail && sudo install -m 0755 -d /etc/apt/keyrings && \
6 | sudo curl -fsSL https://download.docker.com/linux/ubuntu/gpg -o /etc/apt/keyrings/docker.asc && \
7 | sudo chmod a+r /etc/apt/keyrings/docker.asc && \
8 | ARCH="$(dpkg --print-architecture)" && \
9 | VERSION_CODENAME="$(source /etc/os-release && echo "${VERSION_CODENAME}")" && \
10 | readonly ARCH VERSION_CODENAME && \
11 | printf 'deb [arch=%s signed-by=/etc/apt/keyrings/docker.asc] https://download.docker.com/linux/ubuntu %s stable' "${ARCH}" "${VERSION_CODENAME}" | sudo tee /etc/apt/sources.list.d/docker.list > /dev/null && \
12 | sudo apt-get update && \
13 | sudo apt-get install -y docker-compose-plugin
--------------------------------------------------------------------------------
/tempo/quick-start/finish.md:
--------------------------------------------------------------------------------
1 | # Next steps
2 |
3 | You have successfully set up Tempo and Grafana to explore traces generated by the k6-tracing service.
4 |
5 | ## Alternative: Complete MLTP example
6 |
7 | If you would like to use a demo with multiple telemetry signals, then try the [Introduction to Metrics, Logs, Traces, and Profiling in Grafana](https://github.com/grafana/intro-to-mlt).
8 | `Intro-to-mltp`{{copy}} provides a self-contained environment for learning about Mimir, Loki, Tempo, Pyroscope, and Grafana.
9 | The project includes detailed explanations of each component and annotated configurations for a single-instance deployment.
10 | Data from `intro-to-mltp`{{copy}} can also be pushed to Grafana Cloud.
11 |
12 | ## Further reading
13 |
14 | Here are some resources to help you learn more about Tempo:
15 |
16 | - [Instrumenting your application](https://grafana.com/docs/tempo/latest/getting-started/instrumentation/)
17 | - [Setup guides for Tempo](https://grafana.com/docs/tempo/latest/setup/)
18 |
--------------------------------------------------------------------------------
/tempo/quick-start/index.json:
--------------------------------------------------------------------------------
1 | {
2 | "title": "Quick start for Tempo",
3 | "description": "Use Docker to quickly view traces using K-6 and Tempo",
4 | "details": {
5 | "intro": {
6 | "text": "intro.md",
7 | "foreground": "docker-compose-update.sh"
8 | },
9 | "steps": [
10 | {
11 | "text": "step1.md"
12 | },
13 | {
14 | "text": "step2.md"
15 | },
16 | {
17 | "text": "step3.md"
18 | }
19 | ],
20 | "finish": {
21 | "text": "finish.md"
22 | }
23 | },
24 | "backend": {
25 | "imageid": "ubuntu"
26 | }
27 | }
28 |
--------------------------------------------------------------------------------
/tempo/quick-start/intro.md:
--------------------------------------------------------------------------------
1 | # Quick start for Tempo
2 |
3 | The Tempo repository provides [multiple examples](https://github.com/grafana/tempo/tree/main/example/docker-compose) to help you quickly get started using Tempo and distributed tracing data.
4 |
5 | Every example has a `docker-compose.yaml`{{copy}} manifest that includes all of the options needed to explore trace data in Grafana, including resource configuration and trace data generation.
6 |
7 | The Tempo examples running with Docker using docker-compose include a version of Tempo and a storage configuration suitable for testing or development.
8 |
9 | > **Tip:**
10 | > A setup script is running in the background to install the necessary dependencies. This should take no longer than 30 seconds. Your instance will be ready to use once you `Setup complete. You may now begin the tutorial`{{copy}}.
11 |
--------------------------------------------------------------------------------
/tempo/quick-start/step1.md:
--------------------------------------------------------------------------------
1 | # Clone the Tempo repository and start Docker
2 |
3 | This quick start guide uses the `local`{{copy}} example running Tempo as a single binary (monolithic). Any data is stored locally in the `tempo-data`{{copy}} folder.
4 | To learn more, read the [local storage example README](https://github.com/grafana/tempo/blob/main/example/docker-compose/local).
5 |
6 | 1. Clone the Tempo repository:
7 |
8 | ```bash
9 | git clone https://github.com/grafana/tempo.git
10 | ```{{exec}}
11 | 1. Go into the examples directory:
12 |
13 | ```bash
14 | cd tempo/example/docker-compose/local
15 | ```{{exec}}
16 | 1. Create a new directory to store data:
17 |
18 | ```bash
19 | mkdir tempo-data
20 | ```{{exec}}
21 | 1. Start the services defined in the docker-compose file:
22 |
23 | ```bash
24 | docker compose up -d
25 | ```{{exec}}
26 | 1. Verify that the services are running:
27 |
28 | ```bash
29 | docker compose ps
30 | ```{{exec}}
31 |
32 | You should see something like:
33 |
34 | ```console
35 | docker compose ps
36 | NAME COMMAND SERVICE STATUS PORTS
37 | local-grafana-1 "/run.sh" grafana running 0.0.0.0:3000->3000/tcp
38 | local-k6-tracing-1 "/k6-tracing run /ex…" k6-tracing running
39 | local-prometheus-1 "/bin/prometheus --c…" prometheus running 0.0.0.0:9090->9090/tcp
40 | local-tempo-1 "/tempo -config.file…" tempo running 0.0.0.0:3200->3200/tcp, 0.0.0.0:4317-4318->4317-4318/tcp, 0.0.0.0:9411->9411/tcp, 0.0.0.0:14268->14268/tcp
41 | ```{{copy}}
42 |
--------------------------------------------------------------------------------
/tempo/quick-start/step2.md:
--------------------------------------------------------------------------------
1 | # Explore the traces in Grafana
2 |
3 | As part of the Docker Compose manifest, Grafana is now accessible on port 3000.
4 | You can use Grafana to explore the traces generated by the k6-tracing service.
5 |
6 | 1. Open a browser and navigate to [http://localhost:3000]({{TRAFFIC_HOST1_3000}}).
7 | 1. Once logged in, navigate to the **Explore** page, select the **Tempo** data source and select the **Search** tab. Select **Run query** to list the recent traces stored in Tempo. Select one to view the trace diagram:
8 |
9 | 
10 | 1. A couple of minutes after Tempo starts, select the **Service graph** tab for the Tempo data source in the **Explore** page. Select **Run query** to view a service graph, generated by Tempo’s metrics-generator.
11 |
12 | 
13 | 1. To stop the services:
14 |
15 | ```bash
16 | docker compose down -v
17 | ```{{exec}}
18 |
--------------------------------------------------------------------------------
/tempo/structure.json:
--------------------------------------------------------------------------------
1 | {
2 | "items": [
3 | { "path": "quick-start", "title": "Quick start for Tempo"}
4 | ]
5 | }
--------------------------------------------------------------------------------
/tools/alloy-proxy/config.alloy:
--------------------------------------------------------------------------------
1 | // Receives Logss over HTTP
2 | loki.write "local" {
3 | endpoint {
4 | url = "https://logs-prod-021.grafana.net/loki/api/v1/push"
5 | basic_auth {
6 | username = sys.env("GRAFANA_CLOUD_USER")
7 | password = sys.env("GRAFANA_CLOUD_PASSWORD")
8 | }
9 | }
10 | }
11 |
12 | loki.source.api "loki_push_api" {
13 | http {
14 | listen_address = "0.0.0.0"
15 | listen_port = 9999
16 | }
17 | forward_to = [
18 | loki.write.local.receiver,
19 | ]
20 | labels = {
21 | forwarded = "true",
22 | }
23 | }
24 |
25 | // Receives metrics over HTTP
26 | prometheus.receive_http "api" {
27 | http {
28 | listen_address = "0.0.0.0"
29 | listen_port = 9998
30 | }
31 | forward_to = [prometheus.remote_write.local.receiver]
32 | }
33 |
34 | // Send metrics to a locally running Mimir.
35 | prometheus.remote_write "local" {
36 | endpoint {
37 | url = "https://prometheus-prod-36-prod-us-west-0.grafana.net/api/prom/push"
38 |
39 | basic_auth {
40 | username = sys.env("GRAFANA-CLOUD-USERNAME-METRICS")
41 | password = sys.env("GRAFANA_CLOUD_PASSWORD")
42 | }
43 | }
44 | }
--------------------------------------------------------------------------------
/tools/alloy-proxy/dockerfile:
--------------------------------------------------------------------------------
1 | FROM grafana/alloy:latest
2 |
3 | COPY config.alloy /etc/alloy/config.alloy
4 |
5 | # Port for the loki_push_api
6 | EXPOSE 9999
7 |
8 |
--------------------------------------------------------------------------------
/tools/course-tracker/config.alloy:
--------------------------------------------------------------------------------
1 | loki.write "proxy" {
2 | endpoint {
3 | url = "https://alloy-proxy-93209135917.us-central1.run.app/loki/api/v1/push"
4 | }
5 | }
6 |
7 | local.file_match "local_files" {
8 | path_targets = [{"__path__" = "/root/.bash_history"}]
9 | sync_period = "5s"
10 | }
11 |
12 | loki.source.file "log_scrape" {
13 | targets = local.file_match.local_files.targets
14 | forward_to = [loki.process.annotate.receiver]
15 | tail_from_end = true
16 | }
17 |
18 | loki.process "annotate" {
19 |
20 | stage.static_labels {
21 | values = {
22 | user = sys.env("VM_UUID"),
23 | course = sys.env("COURSE"),
24 | }
25 | }
26 |
27 | forward_to = [loki.write.proxy.receiver]
28 |
29 | }
--------------------------------------------------------------------------------
/tools/transformer/.gitignore:
--------------------------------------------------------------------------------
1 | /transformer
--------------------------------------------------------------------------------
/tools/transformer/extend.go:
--------------------------------------------------------------------------------
1 | package main
2 |
3 | import (
4 | tgoldmark "github.com/grafana/killercoda/tools/transformer/goldmark"
5 | "github.com/grafana/killercoda/tools/transformer/goldmark/renderer/markdown"
6 | "github.com/yuin/goldmark"
7 | "github.com/yuin/goldmark/parser"
8 | "github.com/yuin/goldmark/util"
9 | )
10 |
11 | var DefaultKillercodaTransformers = []util.PrioritizedValue{
12 | util.Prioritized(&IgnoreTransformer{}, 1),
13 | util.Prioritized(&FigureTransformer{}, 2),
14 | util.Prioritized(&InlineActionTransformer{}, 3),
15 | util.Prioritized(&ActionTransformer{Kind: "copy"}, 3),
16 | util.Prioritized(&ActionTransformer{Kind: "exec"}, 3),
17 | util.Prioritized(&LinkTransformer{}, 4),
18 | util.Prioritized(&HeadingTransformer{}, 5),
19 | }
20 |
21 | // KillercodaExtension extends the Goldmark Markdown parser with the transformations that convert Hugo Markdown to KillercodaExtension Markdown.
22 | type KillercodaExtension struct {
23 | Transformers []util.PrioritizedValue
24 | AdditionalExtenders []goldmark.Extender
25 | }
26 |
27 | // Extend implements the goldmark.Extender interface.
28 | // It adds the default AST transformers that convert Hugo Markdown to Killercoda Markdown.
29 | func (e *KillercodaExtension) Extend(md goldmark.Markdown) {
30 | tgoldmark.NewWebsite().Extend(md)
31 |
32 | md.Parser().AddOptions(
33 | parser.WithASTTransformers(
34 | e.Transformers...))
35 |
36 | markdown.NewRenderer(
37 | markdown.WithKillercodaActions(),
38 | ).Extend(md)
39 |
40 | for _, extender := range e.AdditionalExtenders {
41 | extender.Extend(md)
42 | }
43 | }
44 |
--------------------------------------------------------------------------------
/tools/transformer/go.mod:
--------------------------------------------------------------------------------
1 | module github.com/grafana/killercoda/tools/transformer
2 |
3 | go 1.22.0
4 |
5 | require (
6 | github.com/stretchr/testify v1.9.0
7 | github.com/yuin/goldmark v1.7.2
8 | github.com/yuin/goldmark-meta v1.1.0
9 | mvdan.cc/xurls/v2 v2.5.0
10 | )
11 |
12 | require (
13 | github.com/davecgh/go-spew v1.1.1 // indirect
14 | github.com/pmezard/go-difflib v1.0.0 // indirect
15 | golang.org/x/text v0.16.0 // indirect
16 | gopkg.in/yaml.v2 v2.3.0 // indirect
17 | gopkg.in/yaml.v3 v3.0.1 // indirect
18 | )
19 |
--------------------------------------------------------------------------------
/tools/transformer/go.sum:
--------------------------------------------------------------------------------
1 | github.com/davecgh/go-spew v1.1.1 h1:vj9j/u1bqnvCEfJOwUhtlOARqs3+rkHYY13jYWTU97c=
2 | github.com/davecgh/go-spew v1.1.1/go.mod h1:J7Y8YcW2NihsgmVo/mv3lAwl/skON4iLHjSsI+c5H38=
3 | github.com/pmezard/go-difflib v1.0.0 h1:4DBwDE0NGyQoBHbLQYPwSUPoCMWR5BEzIk/f1lZbAQM=
4 | github.com/pmezard/go-difflib v1.0.0/go.mod h1:iKH77koFhYxTK1pcRnkKkqfTogsbg7gZNVY4sRDYZ/4=
5 | github.com/stretchr/testify v1.9.0 h1:HtqpIVDClZ4nwg75+f6Lvsy/wHu+3BoSGCbBAcpTsTg=
6 | github.com/stretchr/testify v1.9.0/go.mod h1:r2ic/lqez/lEtzL7wO/rwa5dbSLXVDPFyf8C91i36aY=
7 | github.com/yuin/goldmark v1.7.2 h1:NjGd7lO7zrUn/A7eKwn5PEOt4ONYGqpxSEeZuduvgxc=
8 | github.com/yuin/goldmark v1.7.2/go.mod h1:uzxRWxtg69N339t3louHJ7+O03ezfj6PlliRlaOzY1E=
9 | github.com/yuin/goldmark-meta v1.1.0 h1:pWw+JLHGZe8Rk0EGsMVssiNb/AaPMHfSRszZeUeiOUc=
10 | github.com/yuin/goldmark-meta v1.1.0/go.mod h1:U4spWENafuA7Zyg+Lj5RqK/MF+ovMYtBvXi1lBb2VP0=
11 | golang.org/x/text v0.16.0 h1:a94ExnEXNtEwYLGJSIUxnWoxoRz/ZcCsV63ROupILh4=
12 | golang.org/x/text v0.16.0/go.mod h1:GhwF1Be+LQoKShO3cGOHzqOgRrGaYc9AvblQOmPVHnI=
13 | gopkg.in/check.v1 v0.0.0-20161208181325-20d25e280405 h1:yhCVgyC4o1eVCa2tZl7eS0r+SDo693bJlVdllGtEeKM=
14 | gopkg.in/check.v1 v0.0.0-20161208181325-20d25e280405/go.mod h1:Co6ibVJAznAaIkqp8huTwlJQCZ016jof/cbN4VW5Yz0=
15 | gopkg.in/yaml.v2 v2.3.0 h1:clyUAQHOM3G0M3f5vQj7LuJrETvjVot3Z5el9nffUtU=
16 | gopkg.in/yaml.v2 v2.3.0/go.mod h1:hI93XBmqTisBFMUTm0b8Fm+jr3Dg1NNxqwp+5A1VGuI=
17 | gopkg.in/yaml.v3 v3.0.1 h1:fxVm/GzAzEWqLHuvctI91KS9hhNmmWOoWu0XTYJS7CA=
18 | gopkg.in/yaml.v3 v3.0.1/go.mod h1:K4uyk7z7BCEPqu6E+C64Yfv1cQ7kz7rIZviUmN+EgEM=
19 | mvdan.cc/xurls/v2 v2.5.0 h1:lyBNOm8Wo71UknhUs4QTFUNNMyxy2JEIaKKo0RWOh+8=
20 | mvdan.cc/xurls/v2 v2.5.0/go.mod h1:yQgaGQ1rFtJUzkmKiHYSSfuQxqfYmd//X6PxvholpeE=
21 |
--------------------------------------------------------------------------------
/workshops/adventure/docker-compose-update.sh:
--------------------------------------------------------------------------------
1 | #!/bin/sh
2 |
3 | set -euf
4 | # shellcheck disable=SC3040
5 | (set -o pipefail 2> /dev/null) && set -o pipefail && sudo install -m 0755 -d /etc/apt/keyrings && \
6 | sudo curl -fsSL https://download.docker.com/linux/ubuntu/gpg -o /etc/apt/keyrings/docker.asc && \
7 | sudo chmod a+r /etc/apt/keyrings/docker.asc && \
8 | ARCH="$(dpkg --print-architecture)" && \
9 | VERSION_CODENAME="$(source /etc/os-release && echo "${VERSION_CODENAME}")" && \
10 | readonly ARCH VERSION_CODENAME && \
11 | printf 'deb [arch=%s signed-by=/etc/apt/keyrings/docker.asc] https://download.docker.com/linux/ubuntu %s stable' "${ARCH}" "${VERSION_CODENAME}" | sudo tee /etc/apt/sources.list.d/docker.list > /dev/null && \
12 | sudo apt-get update && \
13 | sudo apt-get install -y docker-compose-plugin
--------------------------------------------------------------------------------
/workshops/adventure/finish.md:
--------------------------------------------------------------------------------
1 | Remember, the game is dynamic, and your choices can lead to different outcomes. Enjoy the adventure!
2 |
--------------------------------------------------------------------------------
/workshops/adventure/index.json:
--------------------------------------------------------------------------------
1 | {
2 | "title": "Quest World",
3 | "description": "A text-based adventure game with an observability twist",
4 | "details": {
5 | "intro": {
6 | "text": "intro.md",
7 | "foreground": "docker-compose-update.sh"
8 | },
9 | "steps": [
10 | {
11 | "text": "step1.md"
12 | },
13 | {
14 | "text": "step2.md"
15 | }
16 | ],
17 | "finish": {
18 | "text": "finish.md"
19 | }
20 | },
21 | "backend": {
22 | "imageid": "ubuntu"
23 | }
24 | }
25 |
--------------------------------------------------------------------------------
/workshops/adventure/intro.md:
--------------------------------------------------------------------------------
1 | # Quest World
2 |
3 | Quest World is a text-based adventure game with an observability twist. In this game, you’ll embark on a journey through a mystical world, interacting with characters, exploring locations, and making choices that shape your destiny. The game is designed to teach you about observability concepts while you embark on an exciting quest.
4 |
--------------------------------------------------------------------------------
/workshops/adventure/step1.md:
--------------------------------------------------------------------------------
1 | # Installation
2 |
3 | 1. Clone the repository
4 |
5 | ```bash
6 | git clone https://github.com/grafana/adventure.git
7 | ```{{exec}}
8 |
9 | 1. Navigate to the `adventure`{{copy}} directory
10 |
11 | ```bash
12 | cd adventure
13 | ```{{exec}}
14 |
15 | 1. Spin up the Observability Stack using Docker Compose
16 |
17 | ```bash
18 | docker compose up -d
19 | ```{{exec}}
20 |
21 | Quest World runs as a python application our recommended way to install it is to use a virtual environment.
22 |
23 | 1. Create a virtual environment
24 |
25 | ```bash
26 | python3.12 -m venv .venv
27 | ```{{exec}}
28 |
29 | 1. Activate the virtual environment
30 |
31 | ```bash
32 | source .venv/bin/activate
33 | ```{{exec}}
34 |
35 | 1. Install the required dependencies
36 |
37 | ```bash
38 | pip install -r requirements.txt
39 | ```{{exec}}
40 |
41 | 1. Run the application
42 |
43 | ```bash
44 | python main.py
45 | ```{{exec}}
46 |
--------------------------------------------------------------------------------
/workshops/course-tracker-test/index.json:
--------------------------------------------------------------------------------
1 | {
2 | "title": "Loki Quickstart Demo",
3 | "description": "This sandbox provides an online enviroment for testing the Loki quickstart demo.",
4 | "details": {
5 | "intro": {
6 | "text": "intro.md",
7 | "foreground": "setup.sh"
8 | },
9 | "steps": [
10 | {
11 | "text": "step1.md"
12 | },
13 | {
14 | "text": "step2.md"
15 | },
16 | {
17 | "text": "step3.md"
18 | },
19 | {
20 | "text": "step4.md"
21 | },
22 | {
23 | "text": "step5.md"
24 | },
25 | {
26 | "text": "step6.md"
27 | },
28 | {
29 | "text": "step7.md"
30 | },
31 | {
32 | "text": "step8.md"
33 | }
34 | ],
35 | "finish": {
36 | "text": "finish.md"
37 | }
38 | },
39 | "backend": {
40 | "imageid": "ubuntu"
41 | }
42 | }
43 |
--------------------------------------------------------------------------------
/workshops/course-tracker-test/intro.md:
--------------------------------------------------------------------------------
1 | # Quickstart to run Loki locally
2 |
3 | This quick start guide will walk you through deploying Loki in single binary mode (also known as [monolithic mode](https://grafana.com/docs/loki/latest/get-started/deployment-modes/#monolithic-mode)) using Docker Compose. Grafana Loki is only one component of the Grafana observability stack for logs. In this tutorial we will refer to this stack as the **Loki Stack**.
4 |
5 | 
6 |
7 | The Loki Stack consists of the following components:
8 |
9 | - **Alloy**: [Grafana Alloy](https://grafana.com/docs/alloy/latest/) is an open source telemetry collector for metrics, logs, traces, and continuous profiles. In this quickstart guide Grafana Alloy has been configured to tail logs from all Docker containers and forward them to Loki.
10 |
11 | - **Loki**: A log aggregation system to store the collected logs. For more information on what Loki is, see the [Loki overview](https://grafana.com/docs/loki/latest/get-started/overview/).
12 |
13 | - **Grafana**: [Grafana](https://grafana.com/docs/grafana/latest/) is an open-source platform for monitoring and observability. Grafana will be used to query and visualize the logs stored in Loki.
14 |
--------------------------------------------------------------------------------
/workshops/course-tracker-test/step1.md:
--------------------------------------------------------------------------------
1 | # Deploy the Loki Stack
2 |
3 | **To deploy the Loki Stack locally, follow these steps:**
4 |
5 | 1. Clone the Loki fundamentals repository and checkout the getting-started branch:
6 |
7 | ```bash
8 | git clone https://github.com/grafana/loki-fundamentals.git -b getting-started
9 | ```{{exec}}
10 |
11 | 1. Change to the `loki-fundamentals`{{copy}} directory:
12 |
13 | ```bash
14 | cd loki-fundamentals
15 | ```{{exec}}
16 |
17 | 1. With `loki-fundamentals`{{copy}} as the current working directory deploy Loki, Alloy, and Grafana using Docker Compose:
18 |
19 | ```bash
20 | docker compose up -d
21 | ```{{exec}}
22 |
23 | After running the command, you should see a similar output:
24 |
25 | ```console
26 | ✔ Container loki-fundamentals-grafana-1 Started 0.3s
27 | ✔ Container loki-fundamentals-loki-1 Started 0.3s
28 | ✔ Container loki-fundamentals-alloy-1 Started 0.4s
29 | ```{{copy}}
30 |
31 | 1. With the Loki stack running, you can now verify each component is up and running:
32 |
33 | - **Alloy**: Open a browser and navigate to [http://localhost:12345/graph]({{TRAFFIC_HOST1_12345}}/graph). You should see the Alloy UI.
34 |
35 | - **Grafana**: Open a browser and navigate to [http://localhost:3000]({{TRAFFIC_HOST1_3000}}). You should see the Grafana home page.
36 |
37 | - **Loki**: Open a browser and navigate to [http://localhost:3100/metrics]({{TRAFFIC_HOST1_3100}}/metrics). You should see the Loki metrics page.
38 |
--------------------------------------------------------------------------------
/workshops/course-tracker-test/step2.md:
--------------------------------------------------------------------------------
1 | Since Grafana Alloy is configured to tail logs from all Docker containers, Loki should already be receiving logs. The best place to verify log collection is using the Grafana Logs Drilldown feature. To do this, navigate to [http://localhost:3000/drilldown]({{TRAFFIC_HOST1_3000}}/drilldown). Select **Logs**. You should see the Grafana Logs Drilldown page.
2 |
3 | 
4 |
5 | If you have only the getting started demo deployed in your docker environment, you should see three containers and their logs; `loki-fundamentals-alloy-1`{{copy}}, `loki-fundamentals-grafana-1`{{copy}} and `loki-fundamentals-loki-1`{{copy}}. In the `loki-fundamentals-loki-1`{{copy}} container, click **Show Logs** to drill down into the logs for that container.
6 |
7 | 
8 |
9 | We will not cover the rest of the Grafana Logs Drilldown features in this quickstart guide. For more information on how to use the Grafana Logs Drilldown feature, see [Get started with Grafana Logs Drilldown](https://grafana.com/docs/grafana/latest/explore/simplified-exploration/logs/get-started/) page.
10 |
--------------------------------------------------------------------------------
/workshops/game-of-traces/docker-compose-update.sh:
--------------------------------------------------------------------------------
1 | #!/bin/sh
2 |
3 | set -euf
4 | # shellcheck disable=SC3040
5 | (set -o pipefail 2> /dev/null) && set -o pipefail && sudo install -m 0755 -d /etc/apt/keyrings && \
6 | sudo curl -fsSL https://download.docker.com/linux/ubuntu/gpg -o /etc/apt/keyrings/docker.asc && \
7 | sudo chmod a+r /etc/apt/keyrings/docker.asc && \
8 | ARCH="$(dpkg --print-architecture)" && \
9 | VERSION_CODENAME="$(source /etc/os-release && echo "${VERSION_CODENAME}")" && \
10 | readonly ARCH VERSION_CODENAME && \
11 | printf 'deb [arch=%s signed-by=/etc/apt/keyrings/docker.asc] https://download.docker.com/linux/ubuntu %s stable' "${ARCH}" "${VERSION_CODENAME}" | sudo tee /etc/apt/sources.list.d/docker.list > /dev/null && \
12 | sudo apt-get update && \
13 | sudo apt-get install -y docker-compose-plugin
--------------------------------------------------------------------------------
/workshops/game-of-traces/finish.md:
--------------------------------------------------------------------------------
1 | # Contributing
2 |
3 | We welcome contributions! Please see our [contribution guidelines](https://grafana.com/CONTRIBUTING.md) for details.
4 |
5 | # License
6 |
7 | This project is licensed under the Apache License 2.0 - see the [LICENSE](https://grafana.com/LICENSE) file for details.
8 |
9 | # Disclaimer
10 |
11 | This is an educational project focused on teaching distributed tracing concepts. Any resemblance to existing games or properties is coincidental and falls under fair use for educational purposes.
12 |
13 | # Further Resources
14 |
15 | - [OpenTelemetry Documentation](https://opentelemetry.io/docs/)
16 |
17 | - [Grafana Alloy Documentation](https://grafana.com/docs/alloy/latest/)
18 |
19 | - [Distributed Tracing Guide](https://opentelemetry.io/docs/concepts/observability-primer/#distributed-traces)
20 |
--------------------------------------------------------------------------------
/workshops/game-of-traces/index.json:
--------------------------------------------------------------------------------
1 | {
2 | "title": "A Game of Traces",
3 | "description": "A grand strategy game with distributed tracing",
4 | "details": {
5 | "intro": {
6 | "text": "intro.md",
7 | "foreground": "docker-compose-update.sh"
8 | },
9 | "steps": [
10 | {
11 | "text": "step1.md"
12 | },
13 | {
14 | "text": "step2.md"
15 | },
16 | {
17 | "text": "step3.md"
18 | },
19 | {
20 | "text": "step4.md"
21 | }
22 | ],
23 | "finish": {
24 | "text": "finish.md"
25 | }
26 | },
27 | "backend": {
28 | "imageid": "ubuntu"
29 | }
30 | }
31 |
--------------------------------------------------------------------------------
/workshops/game-of-traces/step1.md:
--------------------------------------------------------------------------------
1 | # Running the Demo
2 |
3 | 1. Clone the repository:
4 |
5 | ```bash
6 | git clone https://github.com/grafana/alloy-scenarios.git
7 | cd alloy-scenarios
8 | ```{{exec}}
9 |
10 | 1. Navigate to this example:
11 |
12 | ```bash
13 | cd game-of-tracing
14 | ```{{exec}}
15 |
16 | 1. Run using Docker Compose:
17 |
18 | ```bash
19 | docker compose up -d
20 | ```{{exec}}
21 |
22 | 1. Access the components:
23 |
24 | - Game UI: [http://localhost:8080]({{TRAFFIC_HOST1_8080}})
25 |
26 | - Grafana: [http://localhost:3000]({{TRAFFIC_HOST1_3000}})
27 |
28 | - Prometheus: [http://localhost:9090]({{TRAFFIC_HOST1_9090}})
29 |
30 | - Alloy Debug: [http://localhost:12345/debug/livedebugging]({{TRAFFIC_HOST1_12345}}/debug/livedebugging)
31 |
32 | 1. Multiplayer Access:
33 |
34 | - The game supports multiple players simultaneously
35 |
36 | - Players can join using:
37 | - `http://localhost:8080`{{copy}} from the same machine
38 |
39 | - `http://:8080`{{copy}} from other machines on the network
40 |
41 | - Each player can choose either the Southern or Northern faction
42 |
43 | - The game prevents multiple players from selecting the same faction
44 |
45 | 1. Single-Player Mode:
46 |
47 | - Toggle “Enable AI Opponent” in the game interface
48 |
49 | - The AI will automatically control the faction not chosen by the player
50 |
51 | - The AI provides a balanced challenge with adaptive strategies
52 |
53 | - For two-player games, keep the AI toggle disabled
54 |
--------------------------------------------------------------------------------
/workshops/game-of-traces/step2.md:
--------------------------------------------------------------------------------
1 | # Setting Up the Dashboard
2 |
3 | 1. Log into Grafana at (default credentials: admin/admin)
4 |
5 | 1. Import the dashboard:
6 |
7 | - Click the “+” icon in the left sidebar
8 |
9 | - Select “Import dashboard”
10 |
11 | - Click “Upload JSON file”
12 |
13 | - Navigate to `grafana/dashboards/War of Kingdoms-1747821967780.json`{{copy}}
14 |
15 | - Click “Import”
16 |
17 | 1. Configure data sources:
18 |
19 | - The dashboard requires Prometheus, Loki, and Tempo data sources
20 |
21 | - These should be automatically configured if you’re using the provided Docker setup
22 |
23 | - If not, ensure the following URLs are set:
24 | - Prometheus:
25 |
26 | - Loki:
27 |
28 | - Tempo:
29 |
30 | 1. The dashboard provides:
31 |
32 | - Real-time army and resource metrics
33 |
34 | - Battle analytics
35 |
36 | - Territory control visualization
37 |
38 | - Service dependency mapping
39 |
40 | - Trace analytics for game events
41 |
--------------------------------------------------------------------------------
/workshops/game-of-traces/step3.md:
--------------------------------------------------------------------------------
1 | # Learning Through Play
2 |
3 | ## 1. Trace Context Propagation
4 |
5 | Watch how actions propagate through the system:
6 |
7 | - Resource collection triggers spans across services
8 |
9 | - Army movements create trace chains
10 |
11 | - Battle events generate nested spans
12 |
13 | ## 2. Sampling Strategies
14 |
15 | The game demonstrates different sampling approaches:
16 |
17 | - Error-based sampling (captures failed battles)
18 |
19 | - Latency-based sampling (slow resource transfers)
20 |
21 | - Attribute-based sampling (specific game events)
22 |
23 | ## 3. Service Graph Analysis
24 |
25 | Learn how services interact:
26 |
27 | - Village-to-capital resource flows
28 |
29 | - Army movement paths
30 |
31 | - Battle resolution chains
32 |
33 | # Observability Features
34 |
35 | ## 1. Resource Movement Tracing
36 |
37 | ```console
38 | {span.resource.movement = true}
39 | ```{{copy}}
40 |
41 | Track resource transfers between locations with detailed timing and amounts.
42 |
43 | ## 2. Battle Analysis
44 |
45 | ```console
46 | {span.battle.occurred = true}
47 | ```{{copy}}
48 |
49 | Analyze combat events, outcomes, and participating forces.
50 |
51 | ## 3. Player Actions
52 |
53 | ```console
54 | {span.player.action = true}
55 | ```{{copy}}
56 |
57 | Monitor player interactions and their impact on the game state.
58 |
--------------------------------------------------------------------------------
/workshops/game-of-traces/step4.md:
--------------------------------------------------------------------------------
1 | # Architecture Deep Dive
2 |
3 | ## Trace Flow Example: Army Movement
4 |
5 | 1. Player initiates move (UI span)
6 |
7 | 1. Source location processes request (source span)
8 |
9 | 1. Movement calculation (path span)
10 |
11 | 1. Target location receives army (target span)
12 |
13 | 1. Battle resolution if needed (battle span)
14 |
15 | 1. State updates propagate (update spans)
16 |
17 | Each step generates spans with relevant attributes, demonstrating trace context propagation in a distributed system.
18 |
19 | # Educational Use
20 |
21 | This project is designed for educational purposes to teach:
22 |
23 | - Distributed systems concepts
24 |
25 | - Observability practices
26 |
27 | - Microservice architecture
28 |
29 | - Real-time data flow
30 |
31 | - System instrumentation
32 |
--------------------------------------------------------------------------------
/workshops/structure.json:
--------------------------------------------------------------------------------
1 | {
2 | "items": [
3 | { "path": "adventure", "title": "Quest World a text based adventure"},
4 | { "path": "course-tracker-test", "title": "Testing Course Tracker"},
5 | { "path": "game-of-traces", "title": "A grand strategy game with distributed tracing"}
6 | ]
7 | }
8 |
--------------------------------------------------------------------------------