└── README.md
/README.md:
--------------------------------------------------------------------------------
1 | # Python Plots
2 | Created in Jupyter Notebooks
3 |
4 | Basic Shot Map with matplotlib
5 |
6 | 
7 |
8 | 
9 |
10 | ------------------------------------------------------------------------------------------------------------------------------------------------------------------------------
11 |
12 | xG Trendline using StatsBomb/FBref data
13 |
14 | 
15 |
16 |
17 |
18 | # R Plots
19 | All plots created in Rstudio using ggplot2.
20 |
21 |
22 | Waffle plot on how Premier League teams conceded goals in the 2021/22 season.
23 |
24 | 
25 |
26 | ------------------------------------------------------------------------------------------------------------------------------------------------------------------------------
27 |
28 | Comet Chart showing the difference in npxG of teams in two seasons.
29 |
30 | 
31 |
32 | ------------------------------------------------------------------------------------------------------------------------------------------------------------------------------
33 |
34 | Using k-means algorithm to cluster progressive passes from the StatsBomb open dataset. All calculations and model implemented in R as well.
35 |
36 | 
37 |
38 | 
39 |
40 | ------------------------------------------------------------------------------------------------------------------------------------------------------------------------------
41 |
42 | Passflow map of Borussia Dortmund 2020/21 [Made using ggshakeR]
43 |
44 | 
45 |
46 | ------------------------------------------------------------------------------------------------------------------------------------------------------------------------------
47 |
48 | Pizza plots (single player and comparison type) of specific player's using StatsBomb/FBref data
49 |
50 | 
51 |
52 | 
53 |
54 | ------------------------------------------------------------------------------------------------------------------------------------------------------------------------------
55 |
56 | Pass Sonar's of specific player's using event data [2020/21, Dortmund, Bundesliga]
57 |
58 | 
59 |
60 | ------------------------------------------------------------------------------------------------------------------------------------------------------------------------------
61 |
62 | Cumulative transfer spendings of Premier League clubs from 1992-2021
63 |
64 | 
65 |
66 | ------------------------------------------------------------------------------------------------------------------------------------------------------------------------------
67 |
68 | Dumbbell chart showing the spread of minutes played by Mason Greenwood over the course of his career.
69 |
70 | 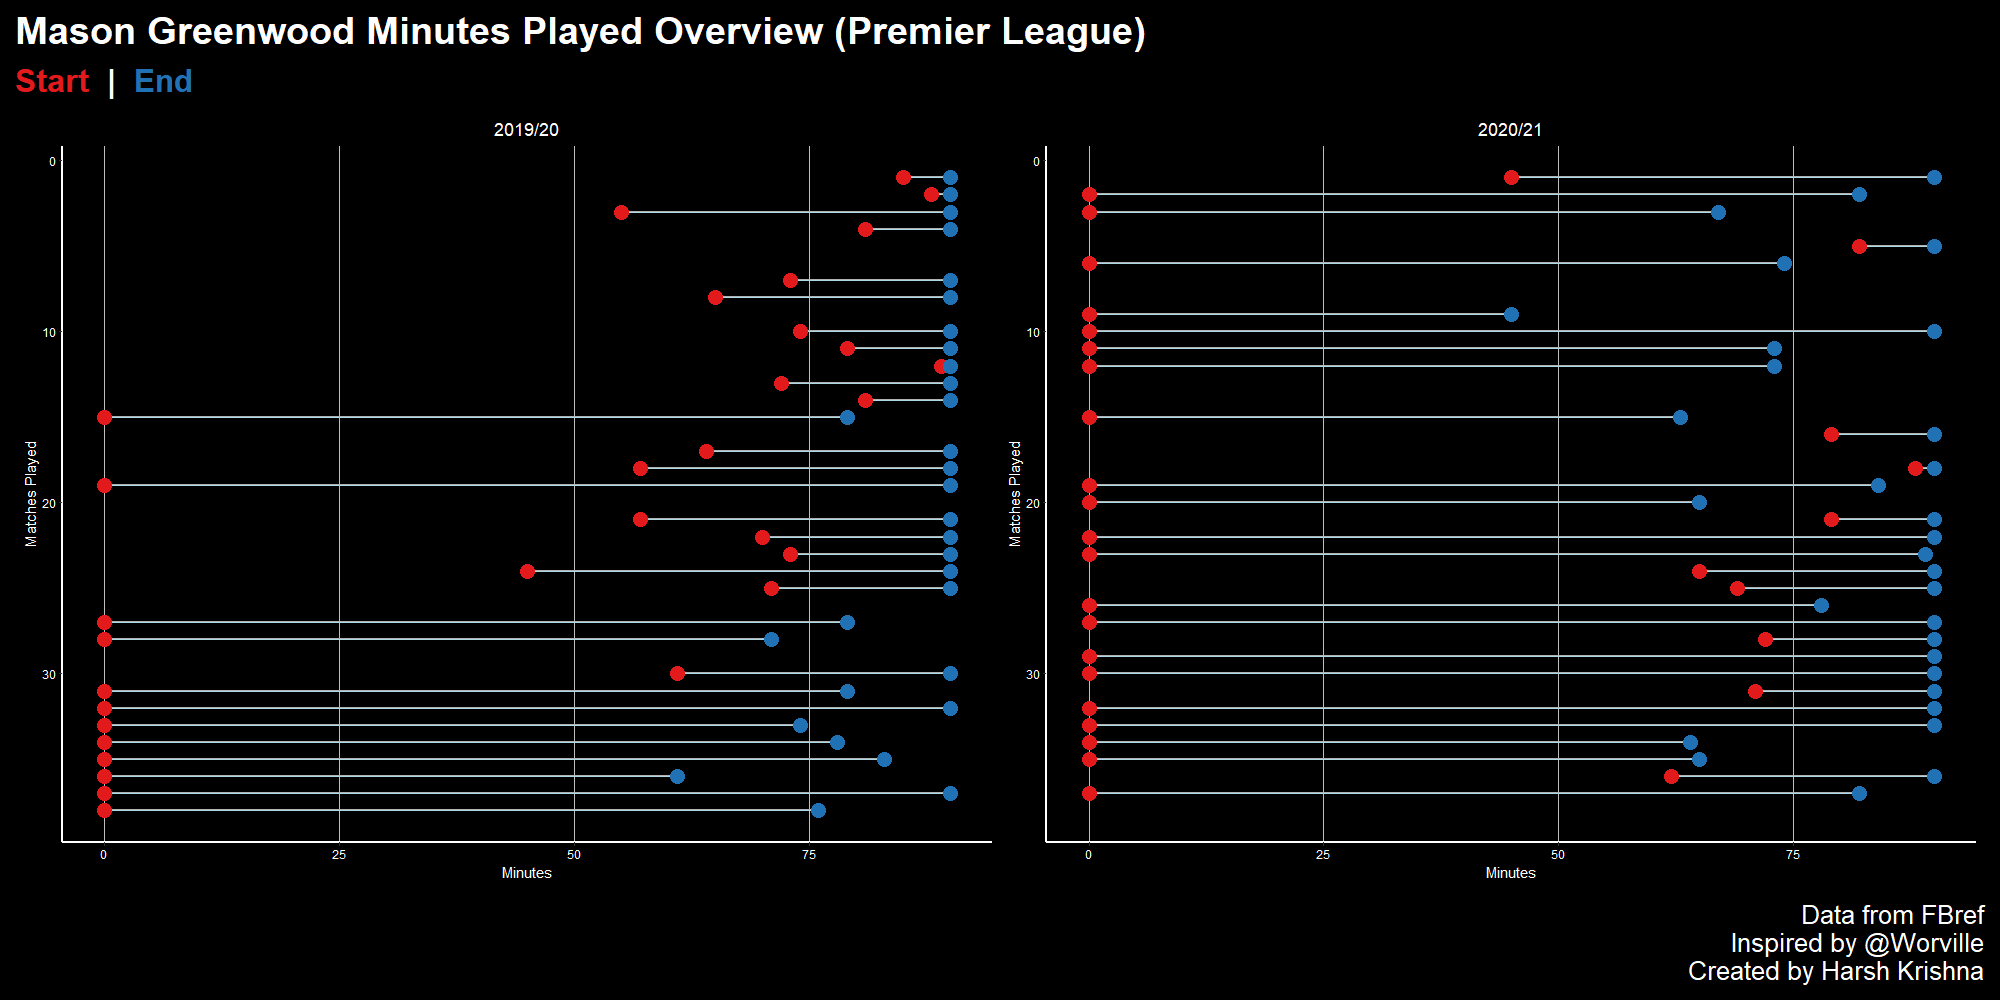
71 |
72 | ------------------------------------------------------------------------------------------------------------------------------------------------------------------------------
73 |
74 | xG Trendline of Lyon over the past 4 seasons.
75 |
76 | 
77 |
78 | ------------------------------------------------------------------------------------------------------------------------------------------------------------------------------
79 |
80 | Line chart showing the trend of Man Utd's SPI over the years of 2016-2020.
81 |
82 | 
83 |
84 | ------------------------------------------------------------------------------------------------------------------------------------------------------------------------------
85 |
86 | Dumbbell chart plotting the performance of Ligue 1 teams with respect to their GD and xGD.
87 |
88 | 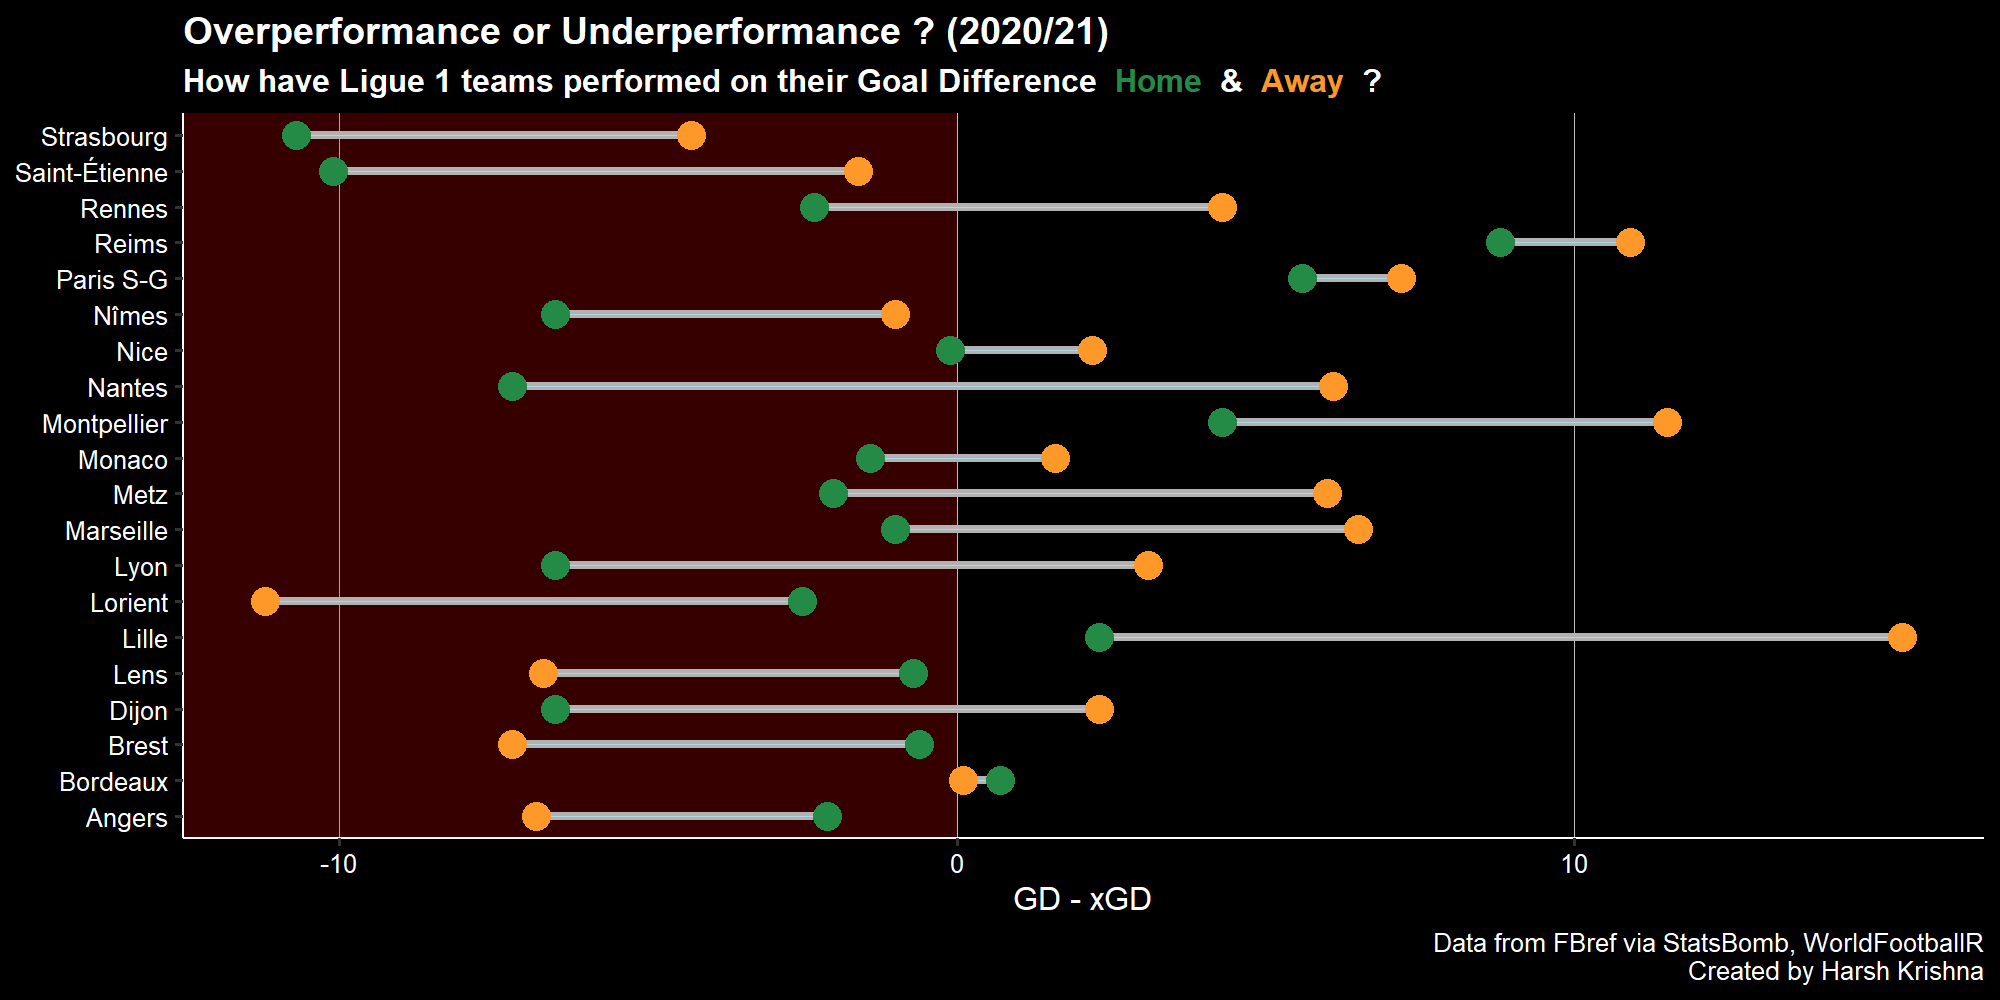
89 |
90 | ------------------------------------------------------------------------------------------------------------------------------------------------------------------------------
91 |
92 | Vizualizing how finishing varies over time with Danny Ings as an example.
93 |
94 | 
95 |
96 |
97 |
98 | # Tableau Plots
99 | Data visualizations created using Tableau Public.
100 |
101 |
102 | xG accumulation of team's in given time periods.
103 |
104 |  105 |
106 | ------------------------------------------------------------------------------------------------------------------------------------------------------------------------------
107 |
108 | Upset plot showing the top shot combinations between Manchester United's attackers for the 2020/21 season.
109 |
110 |
105 |
106 | ------------------------------------------------------------------------------------------------------------------------------------------------------------------------------
107 |
108 | Upset plot showing the top shot combinations between Manchester United's attackers for the 2020/21 season.
109 |
110 |  111 |
112 | ------------------------------------------------------------------------------------------------------------------------------------------------------------------------------
113 |
114 | Bump chart showing the matchweek-by-matchweek position of the traditional "big 6" clubs of the Premier League in the 2020/21 season.
115 |
116 | 
117 |
118 | ------------------------------------------------------------------------------------------------------------------------------------------------------------------------------
119 |
120 | Waffle plot with the top 5 midfielders in terms of SCA generated in the big 5 European leagues during the 2020/21 season.
121 |
122 | 
123 |
124 | ------------------------------------------------------------------------------------------------------------------------------------------------------------------------------
125 |
126 | Dumbbel chart showing the home-away form of Premier League clubs in the 2020/21 season.
127 |
128 | 
129 |
130 | ------------------------------------------------------------------------------------------------------------------------------------------------------------------------------
131 |
132 | Involvement and creativity of midfielders in the top 5 leagues (2020/21).
133 |
134 |  
135 |
136 | ------------------------------------------------------------------------------------------------------------------------------------------------------------------------------
137 |
138 | Shot-heat-Maps of specific players (2020/21)
139 |
140 | 
141 |
142 | ------------------------------------------------------------------------------------------------------------------------------------------------------------------------------
143 |
144 | Visualizing ambidexterity in players through passes attempted by foot (2020/21)
145 |
146 | 
147 | 
148 | 
149 |
150 | ------------------------------------------------------------------------------------------------------------------------------------------------------------------------------
151 |
152 | Involvement of Paul Pogba in his teams play over the past 7 years.
153 |
154 | 
155 |
156 | ------------------------------------------------------------------------------------------------------------------------------------------------------------------------------
157 |
158 | Involvement and creativity of forwards in the top 5 leagues (2020/21)
159 |
160 | 
161 |
162 | ------------------------------------------------------------------------------------------------------------------------------------------------------------------------------
163 |
164 | Shot-heat-maps of Cristiano Ronaldo's open-play shots over the years.
165 |
166 | 
167 |
168 | ------------------------------------------------------------------------------------------------------------------------------------------------------------------------------
169 |
170 | Mason Greenwood's career shots taken, didvided by season and type of shot.
171 |
172 | 
173 | 
174 |
175 | ------------------------------------------------------------------------------------------------------------------------------------------------------------------------------
176 |
177 | Jadon Sancho dashboard (2020/21)
178 |
179 | 
180 |
181 | ------------------------------------------------------------------------------------------------------------------------------------------------------------------------------
182 |
183 | Manchester United shot map (2020/21)
184 |
185 | 
186 |
--------------------------------------------------------------------------------
111 |
112 | ------------------------------------------------------------------------------------------------------------------------------------------------------------------------------
113 |
114 | Bump chart showing the matchweek-by-matchweek position of the traditional "big 6" clubs of the Premier League in the 2020/21 season.
115 |
116 | 
117 |
118 | ------------------------------------------------------------------------------------------------------------------------------------------------------------------------------
119 |
120 | Waffle plot with the top 5 midfielders in terms of SCA generated in the big 5 European leagues during the 2020/21 season.
121 |
122 | 
123 |
124 | ------------------------------------------------------------------------------------------------------------------------------------------------------------------------------
125 |
126 | Dumbbel chart showing the home-away form of Premier League clubs in the 2020/21 season.
127 |
128 | 
129 |
130 | ------------------------------------------------------------------------------------------------------------------------------------------------------------------------------
131 |
132 | Involvement and creativity of midfielders in the top 5 leagues (2020/21).
133 |
134 |  
135 |
136 | ------------------------------------------------------------------------------------------------------------------------------------------------------------------------------
137 |
138 | Shot-heat-Maps of specific players (2020/21)
139 |
140 | 
141 |
142 | ------------------------------------------------------------------------------------------------------------------------------------------------------------------------------
143 |
144 | Visualizing ambidexterity in players through passes attempted by foot (2020/21)
145 |
146 | 
147 | 
148 | 
149 |
150 | ------------------------------------------------------------------------------------------------------------------------------------------------------------------------------
151 |
152 | Involvement of Paul Pogba in his teams play over the past 7 years.
153 |
154 | 
155 |
156 | ------------------------------------------------------------------------------------------------------------------------------------------------------------------------------
157 |
158 | Involvement and creativity of forwards in the top 5 leagues (2020/21)
159 |
160 | 
161 |
162 | ------------------------------------------------------------------------------------------------------------------------------------------------------------------------------
163 |
164 | Shot-heat-maps of Cristiano Ronaldo's open-play shots over the years.
165 |
166 | 
167 |
168 | ------------------------------------------------------------------------------------------------------------------------------------------------------------------------------
169 |
170 | Mason Greenwood's career shots taken, didvided by season and type of shot.
171 |
172 | 
173 | 
174 |
175 | ------------------------------------------------------------------------------------------------------------------------------------------------------------------------------
176 |
177 | Jadon Sancho dashboard (2020/21)
178 |
179 | 
180 |
181 | ------------------------------------------------------------------------------------------------------------------------------------------------------------------------------
182 |
183 | Manchester United shot map (2020/21)
184 |
185 | 
186 |
--------------------------------------------------------------------------------