2 | Waiting to write data to client/application.
3 | Generally caused by application retriving large amount of data at ones.
--------------------------------------------------------------------------------
/docs/events/CPU.html:
--------------------------------------------------------------------------------
1 |
CPU Usage
2 |
This is the CPU / Computation time
3 |
**This may contain the time spend on something which cannot be accomodated in any other wait events.
2 | WAL Sender process is waiting in the main loop
3 | This can be considered as idle state. It is waiting for new WAL data to send to reciver.
--------------------------------------------------------------------------------
/docs/events/WALRECEIVERMAIN.html:
--------------------------------------------------------------------------------
1 |
WalReceiverMain
2 | WAL receiver process is waiting for WAL data from the primary server.
3 | This can be considered as idle state of the WAL receiver process.
--------------------------------------------------------------------------------
/docs/params/bgwriter_lru_maxpages.md:
--------------------------------------------------------------------------------
1 | # bgwriter_lru_maxpages
2 |
3 | The bgwriter need to be sufficiently active and agreesive.
4 | otherwise,major load of eviction (flushing the dirty pages) will be on the checkpointer and connection backends.
--------------------------------------------------------------------------------
/docs/_config.yml:
--------------------------------------------------------------------------------
1 | title: pg_gather
2 | #remote_theme: zendesk/jekyll-theme-zendesk-garden@main
3 | remote_theme: jobinau/pg_gather_zendesk-garden@main
4 | plugins:
5 | - jekyll-remote-theme # add this line to the plugins list if you already have one
6 |
--------------------------------------------------------------------------------
/docs/events/BUFFERIO.html:
--------------------------------------------------------------------------------
1 |
IO:BufferIO
2 | Backends will be trying to clear the Buffers. High value indicates that there is not sufficient shared_buffers.
3 | Generally it is expected to have assoicated DataFileRead also
--------------------------------------------------------------------------------
/dev/build.md:
--------------------------------------------------------------------------------
1 | # Files for developers
2 | Files in this directory are for developers of this pg_gather using a html tempalte and awk script
3 |
4 | ```
5 | cat gather_report.tpl.html | awk -f apply_template.awk > report.sql; psql -X -f report.sql > out.html
6 |
7 | ```
8 |
--------------------------------------------------------------------------------
/docs/events/BUFFERPIN.html:
--------------------------------------------------------------------------------
1 |
BufferPin:BufferPin
2 | BufferPin indicates that the process is waiting to acquire an exclusive pin on a buffer.
3 | An open cursor or frequent HOT updates could be holding BufferPins on Buffer pages.
4 | Buffer pinning can prevent VACUUM FREEZE operation on those pages.
--------------------------------------------------------------------------------
/docs/params/log_lock_waits.md:
--------------------------------------------------------------------------------
1 | # log_lock_waits
2 | Incidents/cases where a session need to wait more than `deadlock_timeout` must be logged.
3 | long waits are often causes poor performance and concurrency.
4 | On a long term, PostgreSQL log will have information about all the victims of this concurrency problem
5 |
--------------------------------------------------------------------------------
/docs/demo.md:
--------------------------------------------------------------------------------
1 | # Topics
2 | ## 1 [How to generate report on the PG host itsef](https://youtu.be/XiadIIA5QnU)
3 | Please watch the demo [video](https://youtu.be/XiadIIA5QnU) to understand how to generate a report on the databse host machine itself and possible demertis.
4 | The idea is to spin up a small temporary instance which runs on another port and use it for generating report.
5 | ## 2
--------------------------------------------------------------------------------
/docs/params/lock_timeout.md:
--------------------------------------------------------------------------------
1 | # lock_timeout
2 |
3 | A session of indefinitely waiting for necessary locks needs to be avoided. Such sessions could appear to be hanging.
4 | It is far better to cancel itself and come out reporting the problem.
5 | A general suggestion is to wait a maximum of 1 minute to get the necessary locks.
6 | ```
7 | ALTER SYSTEM SET lock_timeout = '1min';
8 | ```
9 |
--------------------------------------------------------------------------------
/docs/events/BUFFERMAPPING.html:
--------------------------------------------------------------------------------
1 |
2 |
Lwlock:BufferMapping
3 | This indicates the heavy activity in shared_buffers.
4 | Loading or removing pages from shared_buffers requires exclusive lock on the page. Each session also can put a shared lock on the page.
5 | High BufferMapping can indicate that big working-set-of-data by each session which the system is struggling to accomodate.
6 | Excessive indexes and bloated indexes and unpartitioned huge tables are the common reasons.
--------------------------------------------------------------------------------
/docs/events/BUFFILEREAD.html:
--------------------------------------------------------------------------------
1 |
IO:BufFileRead
2 | BufFileRead happens when temporary files generated for SQL execution are read back to memory.
3 | Generally this happens after BuffileWrite.
4 | BufFileRead means that PostgreSQL is Reading from buffered Temporary Files.
5 | All sorts of temporary files including the one used for sort and hashjoins, parallel execution, And files used by single sessions (refer: buffile.c) can be responsible for this.
6 | Query tuning effort is suggestable.
--------------------------------------------------------------------------------
/dev/README.md:
--------------------------------------------------------------------------------
1 | # Documentation for Developers
2 |
3 | ## How to build
4 | The project uses tempate for writing report generation code. please refer the file `gather_report.tpl.html`
5 | The AWK script `apply_template.awk` is used for generating the report.sql (or ../gather_report.sql)
6 | ```
7 | cat gather_report.tpl.html | awk -f apply_template.awk > report.sql; psql -X -f report.sql > out.html
8 | ```
9 | ## SQL Statement Documentation
10 | Please refer [SQL documentation](SQLstatement.md) on SQL statement used in this project.
--------------------------------------------------------------------------------
/docs/pgGather.svg:
--------------------------------------------------------------------------------
1 |
--------------------------------------------------------------------------------
/docs/params/wal_recycle.md:
--------------------------------------------------------------------------------
1 | # wal_recycle
2 | If set to `on` (the default), this option causes WAL files to be recycled by renaming them, avoiding the need to create new ones. On CoW file systems like ZFS / BTRFS, it may be faster to create new ones, so the option is given to disable this behavior.
3 |
4 | ## Reference
5 | * [feature commit](https://git.postgresql.org/gitweb/?p=postgresql.git;a=commitdiff;h=475861b26)
6 | * [Discussions 1](https://www.postgresql.org/message-id/flat/CACPQ5Fo00QR7LNAcd1ZjgoBi4y97%2BK760YABs0vQHH5dLdkkMA%40mail.gmail.com)
7 |
--------------------------------------------------------------------------------
/docs/replication.md:
--------------------------------------------------------------------------------
1 | # Replication
2 | This analysis collects information from `pg_stat_replication` and `pg_replication_slots`
3 |
4 | ## Report details explained
5 | Uniits used are : 1. Bytes for "Size" 2. XMIN differences with latest known XMINs for all "Age"
6 |
7 |
8 | ## Base pg_gather tables
9 | 1. pg_replication_stat
10 | 2. pg_get_slots
11 |
12 | Raw Information imported in to above mentioned tables can be used for direct SQL queries.
13 | In case of partial and continuous gather, the information will be imported to tables with same name in `history` schema
--------------------------------------------------------------------------------
/docs/params/min_wal_size.md:
--------------------------------------------------------------------------------
1 | # min_wal_size
2 | This parameter determines how many WAL files need to be retained for recycling rather than removed.
3 | PostgreSQL will try to avoid the usage of the `pg_wal` directory falling below this limit by preserving old WAL segment files.
4 | WAL file recycling reduces the overhead and fragmentation at the filesystem level.
5 | The biggest advantage of a sufficiently big `min_wal_size` is that it can ensure that there is sufficient space reserved for `pg_wal`.
6 |
7 | ## Recommendation
8 | Generally, we recommend half the size of the `max_wal_size`.
--------------------------------------------------------------------------------
/docs/events/BUFFERCONTENT.html:
--------------------------------------------------------------------------------
1 |
Lwlock:BufferContent
2 | BufferContent happens when a sessions which want to modify a buffer is aquring lock on buffers.
3 | This might indicate when there is high concurrency.
4 |
Solution:
5 | 1. Reduce the number of connections. Multiplex large number of application connection over few database connections using transaction level pooling.
6 | 2. Reduce the size of the table (Archive / Purge) to fit in to memory
7 | 3. Partition the table.
8 | 4. Reduce the data integrity checks in the database side including foreign keys, check contraints and triggers
--------------------------------------------------------------------------------
/docs/events/DATAFILESYNC.html:
--------------------------------------------------------------------------------
1 |
IO:DataFileSync
2 | This is the wait event that occurs when a backend process is waiting for a data file to be synchronized to disk.
3 | This is expected during the durable writes, which flushes the dirty pages in the buffers to disk. This typically expected during a checkpoint.
4 |
5 |
Monitoring
6 | During the checkpoint operation, The checkpointer process is expected to show upto 3% of wait time on this event.
7 | If processes are showing high wait time on this event, It indicates that the storage is slow in synchronizing the data files to disk.
8 |
9 |
--------------------------------------------------------------------------------
/docs/versionpolicy.md:
--------------------------------------------------------------------------------
1 | # pg_gather version policy
2 |
3 | Each pg_gather release invalidates all the previous versions. Data collections using older versions may or may not work with new analytical logic and can result in misleading inferences. There will be many corrections and improvements with every release. You may refer to the [release notes](https://github.com/jobinau/pg_gather/releases) for details.
4 | So, it is always important to use the latest version, and using older versions is highly discouraged.
5 | All PostgreSQL server versions above 10 are supported. However, the client utility : `psql` should be of minimum version 11
--------------------------------------------------------------------------------
/dev/Calculations.md:
--------------------------------------------------------------------------------
1 | # FILLFACTOR RECOMMENDATION
2 |
3 | Max 20% of space is considered for HOT updates (Redution in fill factor)
4 | So fillfactor : 100 - 20% max
5 | What is the proportion of new tuples coming due to UPDATES. reduce the above mentioned 20% if UPDATES are less.
6 | So fillfactor : 100 - 20%*UPDATES/(UPDATES+INSERTS)
7 | Even if updates are high, lot of hot updates are already happening, the additional the fraction of free space can be reduced according to the ratio of HOTUPDATE/UPDATES
8 | 20%*UPDATES/(UPDATES+INSERTS) * HOTUPDATE/UPDATE
9 | So fillfactor : 100 - 20%*UPDATES/(UPDATES+INSERTS) + 20%*UPDATES/(UPDATES+INSERTS) * HOTUPDATE/UPDATE
--------------------------------------------------------------------------------
/docs/events/BUFFILEWRITE.html:
--------------------------------------------------------------------------------
1 |
IO:BuffileWrite
2 | This waitevent occurs when PostgreSQL needs to write data to temporary files on disk as part of SQL execution.
3 | This typically happens when operations require more memory than the work_mem parameter allows, causing the system to spill data to disk.
4 | From SQL tuning perspective, We need to check whether large amount of data is pulled into memory for sort and join operations. Good filtering conditions are important.
5 |
6 | For Further reading: [IO:BufFileRead and IO:BufFileWrite]
--------------------------------------------------------------------------------
/docs/events/AUTOVACUUMMAIN.html:
--------------------------------------------------------------------------------
1 |
AutoVacuumMain
2 | It occurs when the Autovacuum Launcher process is idling between its scheduled searches for tables that need vacuuming or analyzing.
3 | There is a persistent background process in PostgreSQL called the Autovacuum Launcher, which is responsible for periodically checking the database for tables that require maintenance tasks such as vacuuming or analyzing.
4 | When the Launcher has finished checking the database and has spawned all necessary worker processes (up to the limit defined by autovacuum_max_workers), it enters a sleep state. During this sleep period, its wait event is recorded as AutoVacuumMain.
5 |
6 |
--------------------------------------------------------------------------------
/docs/params/idle_in_transaction_session_timeout.md:
--------------------------------------------------------------------------------
1 | # idle_in_transaction_session_timeout
2 |
3 | It is important to protect the system from "idle in transaction" sessions. The sessions which are not completing the transactions quickly are dangerous for the health of the database. The default value is zero (0) which disables this timeout and that is not a good configuration for most of the enviroments.
4 | Such "idle in transaction" sessions are often found to cause blockages in databases, causing poor performance and even outages.
5 | It is suggestable to timeout such sessions in 5 mintues **at the maximum**, hence the suggession
6 | ```
7 | ALTER SYSTEM SET idle_in_transaction_session_timeout='5min';
8 | ```
9 | Consider smaller values wherever applicable.
--------------------------------------------------------------------------------
/docs/params/max_wal_size.md:
--------------------------------------------------------------------------------
1 | # max_wal_size
2 | This is the maximum size the `pg_wal` directory is allowed to grow. This is soft limit given to PostgreSQL so that PostgreSQL can plan for checkpointing sufficiently early to avoid the space consumption going above this limit.
3 | The default is 1GB., which is too small for any production system.
4 |
5 | ## Recommendation
6 | Ideally there should be sufficinet space for holding atleast 1 hour worth WAL files. So Wal generation need to be monitored before deciding on the value fo `max_wal_size`.
7 | Smaller sizes may trigger forced checkpoints much earlier.
8 | Poorly tuned systems may experience back-to-back checkpointing and associated instability. So consider giving bigger size for `max_wal_size` to handle occational spikes in WAL generation.
9 |
10 |
11 |
--------------------------------------------------------------------------------
/docs/InvalidIndexes.md:
--------------------------------------------------------------------------------
1 | # Invalid Indexes
2 | Invalid Indexes are the corrupt unusable indexes, Which need to be dropped off or recreated
3 |
4 | ## Query to find Invalid indexes details from pg_gather data
5 | ```
6 | SELECT ind.relname index, indexrelid indexoid,tab.relname table ,indrelid tableoid
7 | FROM pg_get_index i
8 | LEFT JOIN pg_get_class ind ON i.indexrelid = ind.reloid
9 | LEFT JOIN pg_get_class tab ON i.indrelid = tab.reloid
10 | WHERE i.indisvalid=false;
11 | ```
12 |
13 | ## Query to find Invalid indexes from the current databasae
14 | ```
15 | SELECT ind.relname index, indexrelid indexoid,tab.relname table ,indrelid tableoid, pg_get_indexdef(ind.oid)
16 | FROM pg_index i
17 | LEFT JOIN pg_class ind ON i.indexrelid = ind.oid
18 | LEFT JOIN pg_class tab ON i.indrelid = tab.oid
19 | WHERE i.indisvalid=false;
20 | ```
--------------------------------------------------------------------------------
/docs/params/wal_sender_timeout.md:
--------------------------------------------------------------------------------
1 | # wal_sender_timeout
2 |
3 | This parameter specifies the maximum time (in milliseconds) that a replication connection can remain inactive before the server terminates it. This helps the primary detect when a standby is disconnected due to crash or network failure.
4 |
5 | - **Default**: 60000 ms (60 seconds)
6 | - **Value 0**: Disables timeout (connection waits indefinitely)
7 | - **Impact**: Terminates only the WAL sender process, not the replication slot
8 | - **Shutdown consideration**: There could be cascading effect as explained below.
9 |
10 | ## Why it is important
11 | There could be cascading effect for this parameter.For example, The checkpointer will wait for all WAL senders to finish. However, a graceful shutdown will wait for checkpointer to finish first. So if there is no timeout happening, it could lead to shutdown taking too long.
--------------------------------------------------------------------------------
/docs/params/work_mem.md:
--------------------------------------------------------------------------------
1 | # work_mem
2 |
3 | The setting of `work_mem` needs to be done very carefully. A big value can cause severe memory pressure on the server, slow down the entire database and even trigger out-of-memory (OOM) conditions. On the other hand, A small value can result in many temporary file generations for specific SQL statements, resulting in more IO.
4 | So, the general advice is to avoid specifying more than 64MB at the instance level, which could affect all the sessions. However, there could be specific SQL statements which require higher `work_mem`; please consider setting a bigger value for those specific SQL statements with a lower scope. For example, The value of `work_mem` can be specified at the transaction level such that the setting will have an effect only on that transaction
5 | ```
6 | SET LOCAL work_mem = '200MB';
7 | ```
8 | or at session level
9 | ```
10 | SET work_mem = '150MB';
11 | ```
12 |
13 |
--------------------------------------------------------------------------------
/docs/CONTRIBUTING:
--------------------------------------------------------------------------------
1 | # Contributors Guide
2 |
3 | Two core philosophies:
4 | 1. The data collection should remain lightweight on the environment from where data is collected.
5 | 2. Collect only very specific information, which is essential for analysis.
6 |
7 | ## Key guidelines for Pull Requests:
8 | 1. Data collection (gather.sql) needs to remain minimalistic. We should avoid collecting additional info from the user environments unless it is unavoidable.
9 | I would appreciate a discussion before adding more data collection points.
10 | 2. SQL statements with joins and sort operations must be avoided during the data collection.
11 | 3. "SELECT * " is not allowed. Columns/attributes need to be listed explicitly.
12 | 4. All joins and sort operations can be done during the analysis phase (gather_report.sql). There is no restriction there.
13 | 5. Data collection should run smoothly from PG 10 onwards, and Report generation using PG 13+
14 |
--------------------------------------------------------------------------------
/docs/events/DATAFILEPREFETCH.html:
--------------------------------------------------------------------------------
1 |
IO:DataFilePrefetch
2 |
DataFilePrefetch indicates:
3 | 1. PostgreSQL is performing read-ahead operations to prefetch data blocks from disk into shared buffers before they're actually needed
4 | 2. The system is waiting for these asynchronous I/O operations to finish
5 | 3. It's part of PostgreSQL's optimization to reduce I/O wait times for subsequent queries
6 |
When It Occurs
7 | DataFilePrefetch typically happens during:
8 | 1. Large sequential scans
9 | 2. Index scans that will need many blocks
10 | 3. Operations where PostgreSQL predicts future block needs
11 |
Performance Implications
12 | Some DataFilePrefetch waits are normal and indicate the prefetch system is working,However, Excessive waits might suggest:
13 | 1. Slow storage subsystem
14 | 2. Need to tune shared_buffers or maintenance_work_mem
15 | 3. High concurrent I/O load
16 |
--------------------------------------------------------------------------------
/docs/params/parallel_leader_participation.md:
--------------------------------------------------------------------------------
1 | # parallel_leader_participation
2 |
3 | By default, the leader of the parallel execution participates in the execution of plan nodes under "Gather" by collecting data from underlying tables/partitions, just like any parallel worker. Meanwhile, the leader process needs to perform additional work, such as collecting data from each parallel worker and " gathering" it in a single place.
4 | However, for an OLAP / DCS system, it would be better to have the leader process dedicated only to gathering the data from workers. This would be helpful if the following conditions are met
5 |
6 | * The host machine has a sufficiently high number of CPUs
7 | * There is not much concurrency, but few bulk SQLs are executed
8 | * Tables participating in SQL are partitioned.
9 | * The data is too big to fit into memory.
10 |
11 | ## Reference :
12 | https://kmoppel.github.io/2025-01-22-dont-forget-about-postgres-parallel-leader-participation/
13 |
--------------------------------------------------------------------------------
/docs/params/hot_standby_feedback.md:
--------------------------------------------------------------------------------
1 | # hot_standby_feedback
2 | This parameter MUST be `on` if the standby is used for executing SQL statements. Else, query cancellation due to conflict should be expected.
3 |
4 | ## Suggestion
5 | It is highly recommended to keep this parameter `on` if the standby is used for SQL statements.
6 | Again, it is recommended to keep the same value on both Primary and Standby.
7 | Along with the parameters `max_standby_archive_delay` and `max_standby_streaming_delay`, this parameter can allow a long-running SQL statement on the standby to wait before applying changes and acknowledging the replication position to the primary.
8 | This can prevent the primary from cleaning up tuple versions which are required on the standby side.
9 |
10 | ## Caution
11 | If the values of `max_standby_archive_delay` and `max_standby_streaming_delay` are high, the primary could end up holding old tuple versions, preventing autovacuum / vacuum from cleaning them up. This may potentially result in bloat on the primary.
--------------------------------------------------------------------------------
/LICENSE.md:
--------------------------------------------------------------------------------
1 | Postgres License
2 | pg_gather is released under the PostgreSQL Licence. a liberal Open Source license, similar to the MIT license
3 |
4 | Copyright (c) 2020-2025 Jobin Augustine
5 |
6 | Permission to use, copy, modify, and distribute this software and its documentation for any purpose,
7 | without fee, and without a written agreement is hereby granted, provided that the above copyright notice
8 | and this paragraph and the following two paragraphs appear in all copies.
9 |
10 | IN NO EVENT SHALL THE COPYRIGHT OWNERS, AUTHORS, CONTRIBUTORS OR THE COMPANY/ENTITY THEY ARE WORKING FOR, BE LIABLE
11 | TO ANY PARTY FOR DIRECT, INDIRECT, SPECIAL, INCIDENTAL, OR CONSEQUENTIAL DAMAGES, INCLUDING LOST PROFITS, ARISING
12 | OUT OF THE USE OF THIS SOFTWARE AND ITS DOCUMENTATION, EVEN IF THE PERSON OR ENTITY HAS BEEN ADVISED OF THE POSSIBILITY OF SUCH DAMAGE.
13 |
14 | THE SOFTWARE PROVIDED HEREUNDER IS ON AN "AS IS" BASIS, AND NO ENTITY HAS ANY OBLIGATIONS TO PROVIDE MAINTENANCE, SUPPORT, UPDATES,
15 | ENHANCEMENTS, OR MODIFICATIONS.
16 |
--------------------------------------------------------------------------------
/docs/dygraphs/graph.html:
--------------------------------------------------------------------------------
1 |
2 |
4 |
6 |
7 |
8 |
9 |
10 |
35 |
--------------------------------------------------------------------------------
/docs/unloggedtables.md:
--------------------------------------------------------------------------------
1 | # Unlogged tables
2 | Unlogged tables are the tables for which no WAL will be generated. They are ephemeral
3 | means data in the tables might be lost, if there is a crash / unclean-shutdown or a switchover to standbuy
4 | Since there is no WAL records gets generated these taables won't be able to participate in replication. no data will be replicated.
5 |
6 |
7 | ## List of unlogged tables From pg_gather data
8 |
9 | ```
10 | SELECT c.relname "Tab Name",c.relkind,r.tab_ind_size "Tab + Ind",ct.relname "Toast name",rt.tab_ind_size "Toast + T.Ind"
11 | FROM pg_get_class c
12 | JOIN pg_get_rel r ON r.relid = c.reloid
13 | LEFT JOIN pg_get_toast t ON r.relid = t.relid
14 | LEFT JOIN pg_get_class ct ON t.toastid = ct.reloid
15 | LEFT JOIN pg_get_rel rt ON rt.relid = t.toastid
16 | WHERE c.relkind='r' AND c.relpersistence='u';
17 | ```
18 |
19 | ## List of unlogged tables from database
20 | ```
21 | SELECT c.relname,c.relkind,pg_total_relation_size(c.oid), tc.relname "TOAST",pg_total_relation_size(tc.oid) "TOAST + TInd"
22 | FROM pg_class c
23 | JOIN pg_class tc ON c.reltoastrelid = tc.oid
24 | WHERE c.relkind='r' AND c.relpersistence='u';
25 | ```
--------------------------------------------------------------------------------
/docs/params/wal_init_zero.md:
--------------------------------------------------------------------------------
1 | # wal_init_zero
2 | If set to `on` (the default), this option causes new WAL files to be filled with zeroes. On some file systems, this ensures that space is allocated before we need to write WAL records. However, Copy-On-Write (COW) file systems may not benefit from this technique, so the option is given to skip the unnecessary work. If set to `off`
3 |
4 | On the other hand turning it `off` on regular filesystems could cause performance regressions. Because when wal_init_zero is off, PostgreSQL creates new WAL segments by simply `lseek`ing to the end of the file or using `fallocate()` without actually writing data to zero out the underlying blocks. On many common filesystems (like ext4/xfs), this creates "holes" in the file. When data is subsequently written to these "holey" blocks, the filesystem has to perform additional work, resulting in multiple disk operations.
5 |
6 | ## Reference
7 | * [feature commit](https://git.postgresql.org/gitweb/?p=postgresql.git;a=commitdiff;h=475861b26)
8 | * [Discussions 1](https://www.postgresql.org/message-id/flat/CACPQ5Fo00QR7LNAcd1ZjgoBi4y97%2BK760YABs0vQHH5dLdkkMA%40mail.gmail.com)
9 | * [Discussions 2](https://www.postgresql.org/message-id/flat/87a5bs5tla.fsf%40163.com)
--------------------------------------------------------------------------------
/docs/params/checkpoint_timeout.md:
--------------------------------------------------------------------------------
1 | # checkpoint_timeout
2 | PostgreSQL performs a checkpoint every 5 minutes, as per the default settings. Checkpointing every 5 minutes is a very high frequency for a production system.
3 | In practical world, if there is a database outage, the HA will be failover to standby. So, the time it takes for a crash recovery becomes meaningless.
4 |
5 | PostgreSQL must flush out all dirty buffers to the disk to complete the checkpoint. if there is a good chance of the same pages getting modified again, this effort will be meaningless
6 | The biggest disadvantage of frequent checkpoints is the full-page write of every page getting modified is required after the checkpoint. In a system with a large amount of memory and many pages being modified, the impact will be huge. Often, that causes a huge spike in IO and a drop in database throughput.
7 |
8 |
9 | ## Recommendation
10 | Overall, checkpointing is a heavy and resource-intensive activity in the system. Reduce its frequency to get better performance and stability.
11 | Considering all the factors and real world feedback, we recommend checkpointing in every half an hour to one hour duration.
12 | ```
13 | checkpoint_timeout = 1800
14 | ```
15 | The value is specified in seconds.
16 |
--------------------------------------------------------------------------------
/docs/params/random_page_cost.md:
--------------------------------------------------------------------------------
1 | # random_page_cost - Cost of Randomly accessing a memory block
2 | It is costly to access random pages in a magnetic disk because of the seek time ( track-to-track seek) and additional rotational latency to reach the track.
3 | Random accesss can be 10s of magnitude costly than sequently reading data from the same track. PostgreSQL by default considers that random access is 4x time costly than sequential access (value of random_page_cost), which is a generally accepted good balance.
4 | Hoever nowadays most of the environments has SSDs or NVMes or Storage which behave like SSDs where the random access is as cheap as sequential access.
5 |
6 | # Implications on Database performnace
7 | The Index scans are generally random access (B-Tree). If the random access is costly, the PostgreSQL planner (cost based planner) will take plans which could reduce the use of Indexes. Effectively we might see less use of indexes.
8 |
9 | # Suggessions
10 | 1. If The storage is using local SSD/NVMe, The `random_page_cost` can be almost same as `seq_page_cost`. A value between 1 to 1.2 is generally suggested
11 | 2. If the storage is SAN drive with memory caches, A value around 1.5 would be good.
12 | 3. if the storage is a Magnetic disk, The default value of 4 would be sufficient.
13 |
--------------------------------------------------------------------------------
/docs/params/jit.md:
--------------------------------------------------------------------------------
1 | # jit (Just In Time compilation)
2 | PostgreSQL is capable of doing just in time compilation of the SQL statements from PostgreSQL version 12.
3 | This uses LLVM infrasructure available on the host machine.
4 | However, Due to initial compilation overhead, it is seldom gives any advantage. There could be very specific cases where this gives some advantage.
5 |
6 | # Disadvantages
7 | 1. Very rarely it gives any performance advatage.
8 | 2. LLVM infra can cause memory and CPU overhead.
9 | 3. Memory leaks are reported.
10 | 4. JIT is reported to cause crash in few enviroments.
11 |
12 | # Suggession
13 | 1. Disable JIT at global level (At instance level)
14 | 2. If there are specific SQL statements which has some advatage in terms of performance, Plase consider enabling the parameter at lower scope (At transaction level or Session level). [PostgreSQL Parameters: Scope and Priority Users Should Know](https://www.percona.com/blog/postgresql-parameters-scope-and-priority-users-should-know/)
15 |
16 | ## Additional references
17 | 1. [backend crash caused by query in llvm on arm64](https://bugs.debian.org/cgi-bin/bugreport.cgi?bug=1059476)
18 | 2. [BUG #18503: Reproducible 'Segmentation fault' in 16.3 on ARM64](https://www.postgresql.org/message-id/flat/18503-6e0f5ab2f9c319c1%40postgresql.org)
--------------------------------------------------------------------------------
/docs/missingstats.md:
--------------------------------------------------------------------------------
1 | # Tables missing statistics
2 |
3 | Missing Statistics on tables can result in poor execution planning.
4 | Generally Statistics will be collected by autovacuum runs or explicit ANALYZE command.
5 | But in rare conditions, There could be tables without any statics leading to poor query planning.
6 |
7 | ## Tables without statistics (From pg_gather data)
8 | Following query can be executed on the database where pg_gather data is imported.
9 |
10 | ```
11 | SELECT nsname "Schema" , relname "Table",n_live_tup "Tuples"
12 | FROM pg_get_class c LEFT JOIN pg_get_ns n ON c.relnamespace = n.nsoid
13 | JOIN pg_get_rel r ON c.reloid = r.relid AND relkind='r' AND r.n_live_tup != 0
14 | WHERE NOT EXISTS (select table_oid from pg_tab_bloat WHERE table_oid=c.reloid)
15 | AND nsname <> ALL (ARRAY['pg_catalog'::name, 'information_schema'::name]);
16 | ```
17 |
18 | ## Tables without statistics (Directly from catalog)
19 | Following query can be executed on the *target database* to get the list of tables for which stats need to be collected using ANALYZE
20 | ```
21 | SELECT c.oid,nspname "Schema",relname "Table",pg_stat_get_live_tuples(c.oid) "Tuples"
22 | FROM pg_class c
23 | JOIN pg_namespace as n ON relkind = 'r' AND n.oid = c.relnamespace
24 | AND n.nspname <> ALL (ARRAY['pg_catalog'::name, 'information_schema'::name])
25 | WHERE NOT EXISTS (SELECT starelid FROM pg_statistic WHERE starelid=c.oid)
26 | AND pg_stat_get_live_tuples(c.oid) != 0;
27 | ```
28 |
--------------------------------------------------------------------------------
/docs/NetDelay.md:
--------------------------------------------------------------------------------
1 | # Net / Delay
2 | [](https://youtu.be/v5Y9YT44rOY)
3 |
4 | Network or Delay. This is the time spent without doing anything. Waiting for something to happen.
5 | Common causes are:
6 | 1. **High network latency**
7 | Not every "Network/Delay" won't always result in "ClientRead" because the network delay can affect select statements also, which are independent of the transaction block.
8 | 2. **Connection poolers/proxies**
9 | Proxies standing in between the application server and the database can cause delays.
10 | 3. **Application design**
11 | If the Application becomes too chatty (Many back and forth communication), database sessions start spending more time waiting for communication.
12 | 4. **Application side processing time.**
13 | For example, An application executes a SELECT statement and receives a result set. Subsequently, a period of time may be required to process these results before the next statement is sent. This intermittent idling between transactions is also a factor to consider.
14 | for this category.
15 | 5. **Overloaded servers** - Waiting for scheduling
16 | On an overloaded application or database server, processes spend more time waiting in the run queue to be executed, because run queue gets longer. This increased wait time is known as run "*queue latency*" or "*CPU contention*". ("*CPU wait*" as per Oracle terminology).
17 | Such waiting time also accounted in Net/Delay.
18 |
--------------------------------------------------------------------------------
/docs/params/max_standby_archive_delay.md:
--------------------------------------------------------------------------------
1 | # max_standby_archive_delay
2 | WAL applied on standby can be delayed by the amount of time specified in this parameter. The default is 30 seconds (30000 ms). PostgreSQL will hold the WAL apply if there is a conflicting statement already running on the standby side. This parameter comes into effect when WAL is **retrieved from the archive location**. So if the replication is a streaming replication, the value of this parameter won't be considered, instead the the value of [max_standby_streaming_delay](./max_standby_streaming_delay.md) will be in use.
3 |
4 | # Suggessions:
5 | One should increase this parameter if there are long-running statements on the standby side and frequent problems of statement cancellation due to conflicts. However, that comes with a cost of replication delay. These two requirements put opposite considerations into this parameter.
6 | One common strategy is to divide the sessions connecting to the standby side into multiple standby nodes, so that statements with longer duration are redirected to one standby and Statements that need to see near real-time data are redirected to another standby. The standby where long-running statements can have a bigger value for this parameter.
7 | Unless such strategies are used, the same value for this parameter and [max_standby_streaming_delay](./max_standby_streaming_delay.md) is a common practice.
8 | It is not recommended that this parameter have too big a value. Instead, statements that are taking too long to complete should be investigated for tuning.
--------------------------------------------------------------------------------
/docs/params/log_temp_files.md:
--------------------------------------------------------------------------------
1 | # log_temp_files
2 | Heavy SQL statements which fetch large volumes of data and perform join or sort operations on that data may not be able to fit the data into `work_mem`, and consequently, PostgreSQL may spill it to disk. These files are called temp files. This could result in unwated I/O and performance degradation in PostgreSQL.The parameter `log_temp_files` will help generate entries in the PostgreSQL log with details of the SQL statement that caused the temp file generation. Setting this value to "0" might cause a lot of entries in PostgreSQL log and resulting in big size log files.
3 | ## Recommendation
4 | All SQL statements that generate excessive temp files need to be identified and addressed. Some of the SQL statements might need to be rewritten. Those statements that cannot be further simplified but need more `work_mem` needs special attention. Please refer to the [work_mem](work_mem.md) section for further details on how to handle this. In order to identify the problematic SQL statements, Start with those SQL statements which generate more than 100MB files
5 | ```
6 | log_temp_files = '100MB';
7 | ```
8 | Once all those queries are addressed, this size can be further reduced to `50MB`. Keep reducing until objective is achived.
9 |
10 | ## References
11 | 1. [PostgreSQL documentation on log_temp_files](https://www.postgresql.org/docs/current/runtime-config-logging.html#GUC-LOG-TEMP-FILES)
12 | 2. [AWS documentation](https://docs.aws.amazon.com/prescriptive-guidance/latest/tuning-postgresql-parameters/log-temp-files.html)
--------------------------------------------------------------------------------
/docs/events/EXTENSION.html:
--------------------------------------------------------------------------------
1 |
Extension
2 |
The server process is waiting for some condition defined by an extension module
3 | In other words, The PostgreSQL process is waiting for an operation defined by an installed Extension (add-on module) to complete.
4 | The core database engine is "handing over the wheel" to an external module.
5 | If you see high waits here, the bottleneck is not in standard PostgreSQL features (like tables or indexes), but in the specific logic of the extension you are using.
6 |
7 |
Why it is happening (Root Causes)
8 | Following extensions are some of the common trouble makers that can cause waits in this category:
9 |
10 |
Foreign Data Wrappers (postgres_fdw, oracle_fdw):
11 | This is the most common cause. If you query a remote table, your local PostgreSQL waits for the remote server to reply.
12 | While waiting for the network packet, the wait event is often "Extension".
13 |
14 | Distributed Databases (Citus/TimescaleDB):
15 | If you use Citus, the "Coordinator" node must wait for "Worker" nodes to process data and send it back.
16 | That wait is often recorded as an Extension event.
17 |
18 |
19 | Logical Replication Plugins:
20 | Custom logical decoders (used for CDC - Change Data Capture) might wait on external systems to acknowledge data receipt.
21 |
22 |
23 | Background Workers (pg_cron):
24 | Tools like pg_cron sleep while waiting for the next scheduled job time. This sleep is technically a wait event.
25 |
26 |
27 |
28 |
--------------------------------------------------------------------------------
/docs/params/track_io_timing.md:
--------------------------------------------------------------------------------
1 | # track_io_timing - Capture timing information of I/O
2 | PostgreSQL will caputre and populate I/O related counters if this parameter is enabled.
3 | This parameter is `off` by default, as it will repeatedly query the operating system for the current time, which may cause significant overhead on some platforms.
4 | However most of the modern CPUs (Intel/AMD and ARM) for database servers, the overhead is very low.
5 |
6 | # Suggession
7 | Run the `pg_test_timing` which comes along with the PostgreSQL installation.
8 | Please proceed to enable this parameter ("on"). If the results indicates that 95% of the calls has less than 1 microsecond delay
9 | Here is a sample result
10 | ```
11 | $pg_test_timing
12 | Testing timing overhead for 3 seconds.
13 | Per loop time including overhead: 22.23 ns
14 | Histogram of timing durations:
15 | < us % of total count
16 | 1 97.78015 131942883
17 | 2 2.21770 2992526
18 | 4 0.00196 2643
19 | 8 0.00018 245
20 | 16 0.00001 13
21 | 32 0.00000 3
22 | ```
23 |
24 | # Benefit
25 | The additional information it catpures enables users to undstand I/O related latency better.
26 | 1. I/O timing information is displayed in `pg_stat_database`, `pg_stat_io`
27 | 2. I/O timing information in the output of EXPLAIN when the BUFFERS option is used,
28 | 3. I/O timing information in the output of VACUUM when the VERBOSE option is used, by autovacuum for auto-vacuums and auto-analyzes, when log_autovacuum_min_duration is set and by pg_stat_statements
29 |
--------------------------------------------------------------------------------
/docs/table_object.md:
--------------------------------------------------------------------------------
1 | # Tables and Objects in a Database
2 | A PostgreSQL Database can typically contain different types of objects
3 |
4 | 1. Tables, where data is stored
5 | 2. Toasts, which acts as extension to tables
6 | 3. Indexes, which are associated with tables and their columns
7 | 4. Native Partitioned table, which contains only the defenitions
8 | 5. Materialized Views
9 | 6. Sequnces
10 | 7. composite types
11 | 8. Foregin tables
12 | etc..
13 |
14 | Having too many objects in a single database increases the metadata, which adversily impact the overall database performance and response.
15 | Less that thousand database objects are most ideal.
16 |
17 | # Get the list of objects and their details from pg_gather data
18 | Please run the following query on the database where the pg_gather data is imported
19 | ```
20 | SELECT c.relname "Name",c.relkind "Kind",r.relnamespace "Schema",r.blks,r.n_live_tup "Live tup",r.n_dead_tup "Dead tup", CASE WHEN r.n_live_tup <> 0 THEN ROUND((r.n_dead_tup::real/r.n_live_tup::real)::numeric,4) END "Dead/Live",
21 | r.rel_size "Rel size",r.tot_tab_size "Tot.Tab size",r.tab_ind_size "Tab+Ind size",r.rel_age,r.last_vac "Last vacuum",r.last_anlyze "Last analyze",r.vac_nos,
22 | ct.relname "Toast name",rt.tab_ind_size "Toast+Ind" ,rt.rel_age "Toast Age",GREATEST(r.rel_age,rt.rel_age) "Max age"
23 | FROM pg_get_rel r
24 | JOIN pg_get_class c ON r.relid = c.reloid AND c.relkind NOT IN ('t','p')
25 | LEFT JOIN pg_get_toast t ON r.relid = t.relid
26 | LEFT JOIN pg_get_class ct ON t.toastid = ct.reloid
27 | LEFT JOIN pg_get_rel rt ON rt.relid = t.toastid
28 | ORDER BY r.tab_ind_size DESC;
29 | ```
30 |
--------------------------------------------------------------------------------
/docs/events/OIDGEN.html:
--------------------------------------------------------------------------------
1 |
LWLock:OidGen
2 |
The process is waiting for exclusive access to the OID Counter to assign a unique Object Identifier (OID)
3 | to a new database object (like a table, a type, or a TOAST value).
4 | If it takes time, It may indicates that address space contention (32bit)
5 | It has been Reported that toast chucks which uses oid, when runs out of available oids, this wait event appears.
6 |
Why it is happening (Root Causes)
7 |
8 |
The 32-Bit Limit:
9 | PostgreSQL OIDs are 4-byte integers (max value ~4 billion). When the counter reaches the maximum, it wraps back to the beginning.
10 |
11 |
The "Wraparound" Performance Cliff:
12 | Normal Mode: "Give me an OID" → Counter++. (Fast)
13 | Wraparound Mode: "Give me an OID" → Counter++ → "Does this exist?" → Check Internal Hash/Index → "Yes, it exists, try next."
14 | This "check if exists" loop is what causes the wait event to spike.
15 |
16 |
The TOAST / Large Object Connection
17 | Since PostgreSQL 12, standard user table rows do not have OIDs. Inserting a million normal rows generally does not touch this lock.
18 | However, when you store a large text or binary file, it is "TOASTed" (compressed and sliced). The system assigns a chunk_id to these pieces. This chunk_id is an OID.
19 | If you have an application doing massive insertions of large text/BLOB data (Heavy TOAST usage), you burn through OIDs rapidly.
20 | If you hit the wraparound point, every single large insert has to "hunt" for a free OID, causing the OidGenLock to become a bottleneck.
21 |
2 | The SubtransBuffer event occurs when a backend process is waiting to read or write a data page in the pg_subtrans SLRU (Simple Least Recently Used) cache.
3 | Waiting for I/O on a sub-transaction SLRU buffer.
4 | The SubtransBuffer wait event is often considered as the early indicators of architectural issues within your application.
5 | While most developers are familiar with standard transaction locks, SubtransBuffer indicates a bottleneck in how PostgreSQL tracks the relationship between transactions and their subtransactions.
6 |
Common Causes of High SubtransBuffer Waits
7 |
8 |
SAVEPOINT and ROLLBACK TO SAVEPOINT commands.
9 |
EXCEPTION blocks in PL/pgSQL (every block with an EXCEPTION clause creates an internal subtransaction).
10 |
Certain ORM or driver features (like the JDBC autosave setting).
11 |
High transaction nesting: If your application has a lot of nested transactions, it can lead to increased SubtransBuffer wait times.
12 |
Insufficient SLRU buffer size: If the SLRU buffer is too small, it can lead to frequent flushes and increased wait times.
13 |
14 | PostgreSQL uses the pg_subtrans directory to maintain a mapping of every subtransaction ID (subXID) to its parent transaction ID.
15 | This mapping is vital for MVCC (Multi-Version Concurrency Control)—the database needs it to determine if a row version (tuple) created by a subtransaction should be visible to other sessions.
16 | This wait event may appear along with SubtransSLRU wait events. If yes, Please refer to SubtransSLRU for more details
17 |
--------------------------------------------------------------------------------
/docs/params/max_standby_streaming_delay.md:
--------------------------------------------------------------------------------
1 | # max_standby_streaming_delay
2 | WAL applied on standby can be delayed by the amount of time specified in this parameter. The default is 30 seconds (30000 ms). PostgreSQL will hold the WAL apply if there is a conflicting statement already running on the standby side. This parameter comes into effect when WAL is **fetched though streaming replication from primary**.
3 |
4 |
5 | One should increase this parameter if there are long-running statements on the standby side and frequent problems of statement cancellation due to conflicts. However, that comes with a cost of replication delay, if there is a conflict. These two requirements put opposite considerations into this parameter.
6 | In Summary, **A big value can cause replication delays and Small values can cause statement cancellations.**
7 |
8 | # Suggessions:
9 | There won't be a single value which could work great in all environments. Careful study and adjustment is required. If the standby is used for long running SQL statements, Strategic decisions may be required.
10 | One common strategy is to divide the sessions connecting to the standby side into multiple standby nodes, so that statements with longer duration are redirected to one standby and Statements that need to see near real-time data are redirected to another standby. The standby where long-running statements can have a bigger value for this parameter.
11 | Unless such strategies are used, the same value for this parameter and [max_standby_archive_delay](./max_standby_archive_delay.md) is a common practice.
12 | It is not recommended that this parameter have too big a value. Instead, statements that are taking too long to complete should be investigated for tuning.
--------------------------------------------------------------------------------
/docs/xidhorizon.md:
--------------------------------------------------------------------------------
1 | # TransactionID Snapshot Horizon.
2 | Long-running transactions are problematic for any ACID-compliant database system because the system needs to track the snapshot of data to which every currently running transaction refers. PostgreSQL is no different and is expected to have many types of troubles if there are long-running transactions or statements.
3 |
4 | ## How to check
5 |
6 | Under the main Head information presented at the top of the pg_gather report, the "Oldest xid ref" is the oldest/earliest transaction ID (txid) that is still active. This is the oldest xid horizon which PostgreSQL is currently tracking. All earlier transactions than this will either be committed and visible or rolled back and dead.
7 |
8 | Again under "Sessions" details, Details like each sessions, the statment they are running and the xid age of the snapshot each of those sessions are refering, duration of the statement etc will be displayed.
9 |
10 | ## Dangers of long-running transactions.
11 | 1. Uncommitted transactions can cause contention in the system, resulting in overall slow performance.
12 | 2. They commonly cause concurrency issues, system blocking, sometimes hanging sessions, and even database outages.
13 | 3. Vacuum/autovacuum won't be able to clean up dead tuples generated after the oldest xmin reference, which results ub poor query performance and reduces the chance of Index-only scans.
14 | 5. System may reach high xid age and possibliy wraparound stages if the vacuum/autovacuum is not able to clean up old tuples. Systems with long running sessions.
15 | Wraparound prevention autovacuum (aggressive mode autovacuum) is frequently reported in systems which has long-running transactions
16 | 6. Tables and indexes are more prone to bloating as the vacuum becomes inefficient.
--------------------------------------------------------------------------------
/docs/crosstab.sql:
--------------------------------------------------------------------------------
1 | --------- Crosstab report for continuous data collection -----------
2 | -- This requires tablefunc contrib extension to be created --
3 | -- tablefunc is part of PostgreSQL contrib modules --
4 | --------------------------------------------------------------------
5 | --Findout the wait events and prepare the columns for the crosstab report
6 | SELECT STRING_AGG(col,',') AS cols FROM
7 | (SELECT COALESCE(wait_event,'CPU') || ' int' "col"
8 | FROM history.pg_pid_wait WHERE wait_event IS NULL OR
9 | wait_event NOT IN ('ArchiverMain','AutoVacuumMain','BgWriterHibernate','BgWriterMain','CheckpointerMain','LogicalApplyMain','LogicalLauncherMain','RecoveryWalStream','SysLoggerMain','WalReceiverMain','WalSenderMain','WalWriterMain','CheckpointWriteDelay','PgSleep','VacuumDelay')
10 | GROUP BY wait_event ORDER BY 1) as A \gset
11 | --Run a crosstab query
12 | SELECT *
13 | FROM crosstab(
14 | $$ SELECT collect_ts,COALESCE(wait_event,'CPU') "Event", count(*) FROM history.pg_pid_wait
15 | WHERE wait_event IS NULL OR wait_event NOT IN ('ArchiverMain','AutoVacuumMain','BgWriterHibernate','BgWriterMain','CheckpointerMain','LogicalApplyMain','LogicalLauncherMain','RecoveryWalStream','SysLoggerMain','WalReceiverMain','WalSenderMain','WalWriterMain','CheckpointWriteDelay','PgSleep','VacuumDelay')
16 | GROUP BY 1,2 ORDER BY 1, 2 $$,
17 | $$ SELECT COALESCE(wait_event,'CPU')
18 | FROM history.pg_pid_wait WHERE wait_event IS NULL OR
19 | wait_event NOT IN ('ArchiverMain','AutoVacuumMain','BgWriterHibernate','BgWriterMain','CheckpointerMain','LogicalApplyMain','LogicalLauncherMain','RecoveryWalStream','SysLoggerMain','WalReceiverMain','WalSenderMain','WalWriterMain','CheckpointWriteDelay','PgSleep','VacuumDelay')
20 | GROUP BY wait_event ORDER BY 1 $$)
21 | AS ct (Collect_Time timestamp with time zone,:cols);
22 |
23 |
--------------------------------------------------------------------------------
/docs/events/DATAFILEREAD.html:
--------------------------------------------------------------------------------
1 |
IO:DataFileRead
2 | DataFileRead occurs when a connection needs to access a specific data page that is not currently present in the PostgreSQL Shared Buffers.
3 | The process must wait while the operating system reads the page from the disk (or filesystem cache) into memory.
4 |
5 |
Implication:
6 | While some disk reads are normal, a high percentage of these wait events typically indicates that your active dataset (working set) is larger than your available memory,
7 | or that inefficient queries are forcing unnecessary disk reads.
8 |
9 |
Why it is happening (Root Causes)
10 | If this event is dominating, look for these culprits:
11 |
12 |
Sequential Scans (Missing Indexes):
13 | If a query scans a whole table because it lacks an index, it forces PostgreSQL to read old/unused data from the disk churning the cache.
14 | Missing or inefficient indexes are a common cause of high DataFileRead events.
15 |
16 |
Insufficient Memory:
17 | The shared_buffers (PostgreSQL's cache) or the OS Page Cache (System RAM) is too small to hold the "hot" (frequently accessed) data.
18 |
19 |
20 | Cold Cache:
21 | This is normal immediately after a database restart because the memory is empty.
22 |
23 |
24 | Bloat:
25 | If tables/indexes are bloated with dead rows, PostgreSQL has to read more pages from the disk to get the same amount of live data.
26 |
27 |
28 |
29 |
Comparison: IO:DataFileRead vs. IO:DataFilePrefetch
30 | It is important not to confuse this with Prefetching.
31 |
32 |
DataFileRead: The process is stuck waiting for a specific page it needs right now.
33 |
DataFilePrefetch: The OS is reading pages ahead of time because it anticipates you will need them (an optimization).
This event occurs when a transaction has completed locally and is waiting for confirmation from a remote standby server before it can return "Success" to the client.
3 | PostgreSQL "Synchronous Replication" is technically Asynchronous Replication + A Wait. The database does not "write successfully to both places at the exact same instant." Instead,
4 | it writes locally, streams the data asynchronously to the standby, and then pauses the user session (generating this wait event) until the standby sends a "Thumbs Up" acknowledgment.
5 |
6 |
Why it is happening (Root Causes)
7 |
8 |
The "Lie" of Sync Replication:
9 | PostgreSQL does not slow down your INSERT or UPDATE statements while they are running.
10 | The data transmission to the standby happens in the background (by WAL Senders).
11 | The IPC:SyncRep wait only kicks in at the very end, during COMMIT.
12 |
Network Latency (RTT):
13 | Since the primary must send a message and receive a reply, the minimum duration of this wait is the Round Trip Time (RTT) between servers.
14 | If your servers are 50ms apart, every commit will wait at least 50ms.
15 |
16 | Standby Performance Issues:
17 | If the Standby server is overloaded or has slow disks, it cannot write the WAL data fast enough to send the acknowledgment back.
18 | The Primary waits in IPC:SyncRep while the Standby struggles to catch up.
19 |
26 |
27 |
--------------------------------------------------------------------------------
/docs/schema.md:
--------------------------------------------------------------------------------
1 | # Schema / Namespace
2 |
3 | ## From pg_gather data
4 | ### 1. list of schema/namespace present in the database
5 | ```
6 | SELECT nsoid,nsname,
7 | CASE WHEN nsname IN ('pg_toast','pg_catalog','information_schema') THEN 'System'
8 | WHEN nsname LIKE 'pg_toast_temp%' THEN 'TempToast'
9 | WHEN nsname LIKE 'pg_temp%' THEN 'Temp'
10 | ELSE 'User' END
11 | FROM pg_get_ns;
12 | ```
13 | ### 2. Grops of Namespaces
14 | ```
15 | WITH ns AS (SELECT nsoid,nsname,
16 | CASE WHEN nsname IN ('pg_toast','pg_catalog','information_schema') THEN 'System'
17 | WHEN nsname LIKE 'pg_toast_temp%' THEN 'TempToast'
18 | WHEN nsname LIKE 'pg_temp%' THEN 'Temp'
19 | ELSE 'User' END AS nstype
20 | FROM pg_get_ns)
21 | SELECT nstype,count(*) FROM ns GROUP BY nstype;
22 | ```
23 | ### 3. List of Schema of "User" schema
24 | List of schema which doesn't include temp or temp toast or system schema.
25 | Meaning, list of schema explicity created by users.
26 | ```
27 | WITH ns AS (SELECT nsoid,nsname,
28 | CASE WHEN nsname IN ('pg_toast','pg_catalog','information_schema') THEN 'System'
29 | WHEN nsname LIKE 'pg_toast_temp%' THEN 'TempToast'
30 | WHEN nsname LIKE 'pg_temp%' THEN 'Temp'
31 | ELSE 'User' END AS nstype
32 | FROM pg_get_ns)
33 | SELECT * FROM ns WHERE nstype='User';
34 | ```
35 |
36 | ### 4. Schema wise, count and size
37 | ```
38 | WITH ns AS (SELECT nsoid,nsname
39 | FROM pg_get_ns WHERE nsname NOT LIKE 'pg_temp%' AND nsname NOT LIKE 'pg_toast_temp%'
40 | AND nsname NOT IN ('pg_toast','pg_catalog','information_schema')),
41 | sumry AS (SELECT r.relnamespace, count(*) AS "Tables", sum(r.rel_size) "Tot.Rel.size",sum(r.tot_tab_size) "Tot.Tab.size",sum(r.tab_ind_size) "Tab+Ind.size"
42 | FROM pg_get_rel r
43 | JOIN pg_get_class c ON r.relid = c.reloid AND c.relkind NOT IN ('t','p')
44 | GROUP BY r.relnamespace)
45 | SELECT nsoid,nsname,"Tables","Tot.Rel.size","Tot.Tab.size","Tab+Ind.size",pg_size_pretty("Tab+Ind.size") as "Size"
46 | FROM ns LEFT JOIN sumry ON ns.nsoid = sumry.relnamespace
47 | ORDER BY 6 DESC NULLS LAST;
48 | ```
49 | ** use JOIN instead of LEFT JOIN to eleminate emtpy schemas
--------------------------------------------------------------------------------
/docs/Requirements.md:
--------------------------------------------------------------------------------
1 | Requirements
2 | --------------------
3 | 1. No download cases. Database Servers may not have net connection and admins may not be allowed to download script from public net for using in production.
4 | Expected : Need to share the script over official mail / ticket
5 | 2. No executables allowed. Secured enviroment with security scanners and auditing in place.
6 | DBAs are allowed to execute simple SQL statements.
7 | 3. No password authentication - Peer / ssl certificate authentication
8 | The data collection tool should work with any PostgreSQL authentication
9 | 4. Windows laptop and RDS instance.
10 | Windows client connecting to RDS
11 | 5. PostgreSQL on Windows
12 | Unix tools are completely helpless.
13 | 6. Aurora and other PostgreSQL like softwares
14 | Many PostreSQL like softwares started appearing without full compatibility. many catalog views and stats views are missing. Tool should just skip over what is missing than a hard stop with error.
15 | 7. ARM processor - No information about the processor architecutre when customer reports a problem.
16 | For example, Customer just reports a problem like "database is slow". The data collection step should be independent of the processor architecture.
17 | 8. PG in Container and different shell.
18 | In addition to Shell, Unix tools / Perl scripts won't help as many of them are missing in many containers.
19 | 9. Customer who collects data may not have privilege to execute query on many PostgreSQL views.
20 | Many SQL statments are expected to fail in unprivilaged user environrment. But tool should proceed with what it can.
21 | 10. Should be very light weight. Completely avoid any complex analysis queries on the system to be scanned
22 | Practically Users have 2 vcpu machines with 4GB ram for their micro services.
23 | 11. Seperation of data collection and analysis
24 | Collected data should be available in row format for in-depeth analysis and complex SQL statements
25 | 12. The collected data should be captured in a smallest file possible. Eleminate every data redundancy over each version.
26 |
--------------------------------------------------------------------------------
/docs/params/huge_pages.md:
--------------------------------------------------------------------------------
1 | # huge_pages - Use Linux hugepages
2 |
3 | ### Warning: Critical Impact of Not Using Hugepages
4 | Failure to implement Hugepages is a primary cause of stability and reliability issues in PostgreSQL database systems. Memory-related problems and out-of-memory (OOM) terminations are frequently reported in systems that do not utilize Hugepages. Additionally, connection issues and inconsistent execution times are also prevalent.
5 | Without Hugepages, memory management and accounting become significantly more complex, leading to increased risk of system instability and performance degradation. The use of Hugepages is essential for optimal memory management and is a critical OS-level tuning requirement for handling database workloads.
6 | Failure to implement this feature may result in severe performance issues - occational drop in performance, stalls, connection failures and system instability.
7 |
8 | Detailed discussion of the importance of hugepages is beyond the scope of this summary info. Following blog post is highly recommend for further reading :
9 | **[Why Linux HugePages are Super Important for Database Servers: A Case with PostgreSQL](https://www.percona.com/blog/why-linux-hugepages-are-super-important-for-database-servers-a-case-with-postgresql/)**
10 |
11 | ## Warning about Missleading Benchmarks
12 | Synthentic benchmarks often consideres only speed, without considering other stability / reliablity aspect of the database system on the long run. Many of the synthetic benchmarks may not be able to demonstrate any considerable speed difference after enabling Hugepages.
13 |
14 | # Suggessions
15 | 1. Disable THP (Trasperent huge pages), preferably on the bootloader level of Linux
16 | 2. Eanable regular HugePages (2MB Size) with sufficient number of huge pages. Please refer the above blog post for details of the calculations.
17 | 3. Change the parameter `huge_pages` to `on` at PostgreSQL Instance to make sure that PostgreSQL will allocate sufficient huge pages on startup. It is good to prevent PostgreSQL startup with wrong settings, rather than a startup with wrong settings and troubles later.
--------------------------------------------------------------------------------
/docs/events/TRANSACTIONID.html:
--------------------------------------------------------------------------------
1 |
Lock:transactionid
2 |
3 | Session waiting for other session to complete the transaction. (Session is blocked).
4 | The transactionid wait event in PostgreSQL occurs when a backend process is blocked while waiting for a specific transaction to complete.
5 | For example, Updating the same rows of a table from multiple sessions can lead to this situation.
6 | This is one of the more serious wait events that can significantly impact database performance.
7 | This waitevent indicates that:
8 |
9 |
One transaction is waiting for another transaction to finish (commit or abort)
10 |
There is direct transaction ID dependency between sessions
11 |
This typically involves row-level locking scenarios where MVCC (Multi-Version Concurrency Control) can't resolve the conflict
12 |
13 |
14 |
Why it is happening (Root Causes)
15 | Following are common scenarios that lead to transactionid waits:
16 |
17 |
Lock Contention: When Transaction A holds locks that Transaction B needs
18 | Example: Long-running UPDATE blocking another UPDATE/DELETE on same rows
19 |
Foreign Key Operations: When checking referential integrity during updates/deletes
20 |
Prepared Transactions: Waiting for a prepared transaction (2PC) to commit/rollback
21 |
Serializable Isolation Level: In SERIALIZABLE isolation, waiting for a potentially conflicting transaction to complete
22 |
VACUUM Operations: When VACUUM is blocked by long-running transactions
23 |
24 |
25 |
Performance Implications
26 |
27 |
More severe than tuple waits as it involves entire transactions rather than individual rows
28 |
Can lead to transaction chains where multiple sessions wait in sequence
29 |
30 |
Often indicates:
31 |
32 |
Long-running transactions holding locks
33 |
Application logic issues (transactions staying open too long)
34 |
Insufficient vacuuming leading to transaction ID wraparound prevention
3 | This event occurs when a PostgreSQL backend process is waiting to receive data or a new command from the connected client application.
4 | Essentially, the database has finished its previous task and is asking, "What should I do next?"
5 |
6 | Big precentage of ClientRead indicates that the response from application is not fast enough. It is wasting wall-clock time and potentially holding locks.
7 | "ClientRead" wait-event combined with "idle-in-transaction" can cause contention in the server.
8 | Two reasons generally cause high values for this wait-event
9 |
Why it is happening (Root Causes)
10 |
1. Network Latency (The "Slow Road"):
11 | The communication channel between the database and the application/client may have low bandwith or high latency.
12 | For example, there could be too many network hops. Many of the Cloud, Virtualization, Containerization, Firewall, and Routing (sometimes multi-layer routing) are found to cause high network latency.
13 | Latency has nothing to do with network bandwidth. Even a very high bandwidth connection can have high latency and affect the database performance.
14 | Please remember that the network related waits within the trasactions are generally accounted as "ClientRead"
15 |
2. Application Logic (The "Long Pause"):
16 | This is the most dangerous cause. It happens when an application starts a transaction (BEGIN), performs a SQL command, and then pauses to do non-database work
17 | (like sending an email, processing a file, or calling an external API) before sending the next SQL command or COMMIT.
18 | During this pause, the database is left waiting for the next command from the application, leading to "ClientRead" waits.
19 | This situation is particularly problematic because it can lead to long-held locks and increased contention within the database.
20 |
3. Human Error:
21 | A user with interactive login access may start a transaction and then get distracted or take a long time to issue the next command or COMMIT.
22 |
--------------------------------------------------------------------------------
/docs/walarchive.md:
--------------------------------------------------------------------------------
1 | # WAL archive failure and lag
2 | WAL files are pushed to external backup repositories where backup is maintained.
3 | Due various reasons the WAL archivings could be failing or delaying behind the current WAL generation (lag).
4 | Following SQLs could help to analyze the archiving failures and delays.
5 | If WAL archive is not healthy, Backups also might fail and Point-in-time-Recovery won't be possible.
6 |
7 | ## From pg_gather data
8 | ```SQL
9 | SELECT collect_ts "collect_time", current_wal "current_lsn", last_archived_wal
10 | , coalesce(nullif(CASE WHEN length(last_archived_wal) < 24 THEN '' ELSE ltrim(substring(last_archived_wal, 9, 8), '0') END, ''), '0') || '/' || substring(last_archived_wal, 23, 2) || '000001' "last_archived_lsn"
11 | , last_archived_time::text || ' (' || CASE WHEN EXTRACT(EPOCH FROM(collect_ts - last_archived_time)) < 0 THEN 'Right Now'::text ELSE (collect_ts - last_archived_time)::text END || ')' "last_archived_time"
12 | , pg_wal_lsn_diff( current_wal, (coalesce(nullif(CASE WHEN length(last_archived_wal) < 24 THEN '' ELSE ltrim(substring(last_archived_wal, 9, 8), '0') END, ''), '0') || '/' || substring(last_archived_wal, 23, 2) || '000001') :: pg_lsn )
13 | ,last_failed_wal,last_failed_time
14 | FROM pg_gather, pg_archiver_stat;
15 | ```
16 |
17 | ## From PostgreSQL Directly
18 | ```SQL
19 | SELECT CURRENT_TIMESTAMP,pg_current_wal_lsn()
20 | ,coalesce(nullif(CASE WHEN length(last_archived_wal) < 24 THEN '' ELSE ltrim(substring(last_archived_wal, 9, 8), '0') END, ''), '0') || '/' || substring(last_archived_wal, 23, 2) || '000001' "last_archived_lsn"
21 | , last_archived_time::text || ' (' || CASE WHEN EXTRACT(EPOCH FROM(CURRENT_TIMESTAMP - last_archived_time)) < 0 THEN 'Right Now'::text ELSE (CURRENT_TIMESTAMP - last_archived_time)::text END || ')' "last_archived_time"
22 | , pg_size_pretty(pg_wal_lsn_diff( pg_current_wal_lsn(), (coalesce(nullif(CASE WHEN length(last_archived_wal) < 24 THEN '' ELSE ltrim(substring(last_archived_wal, 9, 8), '0') END, ''), '0') || '/' || substring(last_archived_wal, 23, 2) || '000001') :: pg_lsn )) archive_lag
23 | ,last_failed_wal,last_failed_time
24 | FROM pg_stat_archiver;
25 | ```
--------------------------------------------------------------------------------
/dev/apply_template.awk:
--------------------------------------------------------------------------------
1 | #################################################################
2 | # AWK script by Nickolay Ihalainen
3 | # Generate the SQL script (report.sql) for final analysis report
4 | # Using HTML Template by replacing markers
5 | #################################################################
6 |
7 | function psql_echo_escape() {
8 | in_double_quotes = 0
9 | split($0, chars, "")
10 | for (i=1; i <= length($0); i++) {
11 | ch = chars[i]
12 | if (ch == "\"" && in_double_quotes == 0) {
13 | in_double_quotes = 1
14 | printf("%s", "\"")
15 | } else if (ch == "\"" && in_double_quotes == 1) {
16 | in_double_quotes = 0
17 | printf("%s", "\"")
18 | }
19 | #else if (ch == "'" && in_double_quotes == 0) {
20 | # printf("%s", "''")
21 | #}
22 | else {
23 | printf("%s", chars[i])
24 | }
25 | }
26 | }
27 |
28 | BEGIN {
29 | tpl = 0
30 | }
31 | {
32 | if (tpl == 0) {
33 | if ( /^<%.*%>/ ) { ## Single line SQL statement/psql command
34 | sub(/<%\s*/, "");
35 | sub(/\s*%>/, "");
36 | print
37 | } else if ( /^<%/ ) { ## Multi line SQL statement starting
38 | tpl = 1;
39 | sub(/<%\s*/, "");
40 | print
41 | } else if ( /^\s*$/ ) { ## Empty lines for readability can be removed
42 | #print
43 | } else if ( /^\s*\/\// ) { ## Comments with double slash can be removed
44 |
45 | } else { ## Remaining lines (HTML tags) echo as it is
46 | sub(/^/, "\\echo ");
47 | split($0,a,/[^:]\/\//); ##split the line based an in-line comments with //, except ://
48 | $0=a[1]; ##Remove the inline comment part
49 | psql_echo_escape() ## Replace single quotes outside double quotes with escaped value
50 | printf("\n")
51 | }
52 | } else { ## Following lines of Multi line SQL statement
53 | if ( /%>/ ) { ## Last line of the Multi line SQL statement
54 | tpl = 0;
55 | sub(/%>/, "");
56 | print
57 | } else { ## All lines in between starting and last line of multi line statement
58 | print
59 | }
60 | }
61 | }
62 |
--------------------------------------------------------------------------------
/docs/unusedIndexes.md:
--------------------------------------------------------------------------------
1 | # Unused Indexes
2 |
3 | Unused indexes cause severe penalties in the system: It slow down DML operations for no benefit, They consume more memory, They Cause more IO, Generate more WAL, and Autovacuum will have more work to do.
4 |
5 | ## From pg_gather
6 |
7 | Following SQL statement can be used against the database where the pg_gather data is imported.
8 |
9 | ```
10 | SELECT ns.nsname AS "Schema",ci.relname as "Index", ct.relname AS "Table", ptab.relname "TOAST of Table",
11 | indisunique as "UK?",indisprimary as "PK?",numscans as "Scans",size,ci.blocks_fetched "Fetch",ci.blocks_hit*100/nullif(ci.blocks_fetched,0) "C.Hit%", to_char(i.lastuse,'YYYY-MM-DD HH24:MI:SS') "Last Use"
12 | FROM pg_get_index i
13 | JOIN pg_get_class ct ON i.indrelid = ct.reloid
14 | JOIN pg_get_ns ns ON ct.relnamespace = ns.nsoid
15 | JOIN pg_get_class ci ON i.indexrelid = ci.reloid
16 | LEFT JOIN pg_get_toast tst ON ct.reloid = tst.toastid
17 | LEFT JOIN pg_get_class ptab ON tst.relid = ptab.reloid
18 | WHERE tst.relid IS NULL OR ptab.reloid IS NOT NULL
19 | ORDER BY size DESC;
20 | ```
21 |
22 | ## From database
23 | Following SQL statement can be used agains the target database
24 | ```
25 | SELECT n.nspname AS schema,relid::regclass as table, indexrelid::regclass as index, indisunique, indisprimary
26 | FROM pg_stat_user_indexes
27 | JOIN pg_index i USING (indexrelid)
28 | JOIN pg_class c ON i.indexrelid = c.oid
29 | JOIN pg_namespace n ON c.relnamespace = n.oid
30 | WHERE idx_scan = 0;
31 | ```
32 | OR more detailed (TOAST and TOAST index)
33 | ```
34 | SELECT n.nspname AS schema,t.relname "table", c.relname as index, tst.relname "TOAST",
35 | tst.oid "TOAST ID 1",
36 | tstind.relid "TOAST ID 2",
37 | tstind.indexrelname "TOAST Index",
38 | tstind.indexrelid "TOST INDEX relid",
39 | i.indisunique, i.indisprimary,pg_stat_user_indexes.idx_scan "Index usage", tstind.idx_scan "Toast index usage"
40 | FROM pg_stat_user_indexes
41 | JOIN pg_index i USING (indexrelid)
42 | JOIN pg_class c ON i.indexrelid = c.oid
43 | JOIN pg_class t ON i.indrelid = t.oid
44 | JOIN pg_namespace n ON c.relnamespace = n.oid
45 | LEFT JOIN pg_class tst ON t.reltoastrelid = tst.oid
46 | LEFT JOIN pg_stat_all_indexes tstind ON tst.oid = tstind.relid;
47 | ```
--------------------------------------------------------------------------------
/docs/events/LOGICALLAUNCHERMAIN.html:
--------------------------------------------------------------------------------
1 |
LogicalLauncherMain
2 | This wait event corresponds to a situation when the Logical Replication Launcher process is waiting in its main sleep loop for something to happen
3 | Logical Replication Launcher is a background process that is responsible for launching and managing logical replication workers in PostgreSQL.
4 | It periodically wakes up to check for new replication tasks and starts the necessary worker processes to handle them.
5 | When the Logical Replication Launcher is in its main sleep loop, it is essentially idle, waiting for a signal or event that indicates it needs to take action, such as starting a new logical replication worker.
6 |
7 |
How it works
8 |
9 |
The launcher periodically wakes up to see if any new subscriptions have been created or if any existing ones need a worker process (e.g., if an "apply" worker crashed)
10 |
If there are no new tasks, it goes back to sleep, waiting for the next check interval and showing LogicalLauncherMain which is normal and expected behavior for the Logical Replication Launcher process
11 |
When a new task is detected, the launcher requests the postmaster to start a new background worker process
12 |
13 |
When to be concerned
14 |
15 |
High percentages of time spent in LogicalLauncherMain are generally not a concern, as this is expected behavior for the Logical Replication Launcher process
16 |
However, if you notice that logical replication workers are not being started when expected, it may be worth investigating further to ensure that the launcher is functioning correctly
17 | Make sure that max_worker_processes is configured to allow for the necessary background workers to be started
18 |
19 |
20 |
Tuning considerations
21 | max_worker_processes parameter can be adjusted to ensure that there are enough resources available for logical replication workers and other background processes.
22 | Logical Replication Configuration Parameters
--------------------------------------------------------------------------------
/docs/params/default_toast_compression.md:
--------------------------------------------------------------------------------
1 | # default_toast_compression
2 | PostgreSQL allows users to select the compression algorithm used for TOAST compression from PostgreSQL version 14 onwards.
3 | PostgreSQL historically used the built-in algorithm `pglz` as default. However algorithms like `lz4` showed significant performance gains [1].
4 | PostgreSQL allow users to select the algorithm at a column basis; for example
5 | ```sql
6 | CREATE TABLE tbl (id int,
7 | col1 text COMPRESSION pglz,
8 | col2 text COMPRESSION lz4,
9 | col3 text);
10 | ```
11 | `lz4` is highly recommended for json datatypes
12 | ### Requirement:
13 | In order to avail `lz4` as the compression algorithm, The PostgreSQL should be built with the configuration option `--with-lz4`. You may confirm the configuration options used for building
14 | ```
15 | pg_config | grep -i 'with-lz4'
16 | ```
17 |
18 | ## How to check the current toasting algorithm
19 | Per-tuple,per-column toasting compression can be checked using `pg_column_compression()`.
20 | For example:
21 | ```
22 | select id,pg_column_compression(col3) FROM tbl ;
23 | ```
24 |
25 | ## How to change the toast compression
26 | 1. The compression method used for existing tuples won't chnage. Only newly inserted tuples will have the new compression method.
27 | 2. `VACUUM FULL` command or `pg_repack` WILL NOT change the compression algorithm. They cannot be used to alter the TOAST compression algorithm.
28 | 3. CREATE TABLE tab AS SELECT ... (CTAS) WILL NOT change the compression algorithm
29 | 4. INSERT INTO tab AS SELECT also WILL NOT change the compression algorithm
30 | 5. Logical dump (`pg_dump`) and `pg_restore` can be used for changing the toast compression
31 | 6. Existing column values of tuples can be changed if there is an operation which requires detoasting the column
32 | ```
33 | update tbl1 SET col3=col3||'' WHERE pg_column_compression(col3) != 'lz4';
34 | # or
35 | update tbl SET col3=trim(col3) WHERE pg_column_compression(col3) != 'lz4';
36 | # or for json
37 | update jsondat set dat = dat || '{}' where pg_column_compression(dat) != 'lz4';
38 | ```
39 |
40 |
41 | ## References
42 | 1. https://www.postgresql.fastware.com/blog/what-is-the-new-lz4-toast-compression-in-postgresql-14
43 | 2. https://stackoverflow.com/questions/71086258/query-on-json-jsonb-column-super-slow-can-i-use-an-index
--------------------------------------------------------------------------------
/docs/tablespace.md:
--------------------------------------------------------------------------------
1 | # Tablespaces
2 | In PostgreSQL, each tablespace is a storage/mount point location.
3 |
4 | Historically, Tablespaces were the only option for spreading the I/O load to multiple disk systems, which was the major use of tablespaces.
5 | However, Advancements in LVM have made it less useful these days. LVMs are capable of striping data across different disk systems, which can give the total I/O bandwidth of all the storages put together.
6 |
7 | ## Checking the tablespaces
8 | ### From pg_gather data
9 | ```
10 | select * from pg_get_tablespace ;
11 | ```
12 |
13 | ## Directly from the database
14 | ```
15 | SELECT spcname AS "Name",
16 | pg_catalog.pg_get_userbyid(spcowner) AS "Owner",
17 | pg_catalog.pg_tablespace_location(oid) AS "Location"
18 | FROM pg_catalog.pg_tablespace
19 | ORDER BY 1;
20 | ```
21 |
22 | ## Disadvantages of Tablespaces.
23 | 1. DBA will have higher responsibility for monitoring and managing each tablespace and space availability.
24 | Segregation of storage into multiple mount points can lead to management and monitoring complexities.
25 | Capacity planning needs to be done for each location.
26 | 2. PostgreSQL need to manage more metadata and dependent metadata in the primary data directory
27 | 3. Unavailability of single tablespace can affect the availabltiy of the entire cluster. We might be introducing more failure points by increasing the number of tablespaces
28 | 4. Standby cluster also need to have similar tablespaces and file locations.
29 | 5. Backup and recovery become more complex operations.In the event of a disaster, getting a replacement machine with a similar structure might be more involved.
30 |
31 | ## Uses of Tablespaces
32 | Even though there is many disadvantages and maintenance overheads for using tablespaces, They can be useful for some of the senarios
33 | 1. Isolation of I/O load
34 | There could be cases where we may want to avoid I/O load on specific tables not affecting the I/O operation on other tables.
35 | 2. Separate tablespace for temp
36 | PostgreSQL allows the `temp_tablespaces` to use a different tablespace which is pointing to different mount point
37 | 3. Storage with different I/O characteristics
38 | For example, we might want to move old table partitions to cheap, slow storage for archival purposes. If the number of queries hitting those old partitions is very rare, that could be a saving.
39 |
--------------------------------------------------------------------------------
/docs/events/TUPLE.html:
--------------------------------------------------------------------------------
1 |
Lock:tuple
2 | The tuple wait event is a specific type of lock contention that occurs at the row level.
3 | The tuple wait event occurs when a backend process is waiting to acquire a lock on a specific tuple (a physical row version).
4 | when a transaction wants to update or delete a row, it must first lock that row. If another transaction already holds a lock on that row,
5 | the second transaction enters a "waiting" state. If the contention is specifically for the right to access the row structure itself or to wait for a prior locker to finish, it is categorized as a Lock: tuple event.
6 |
7 |
8 |
Understanding both tuple & transactionid wait events
9 | transactionid: You are waiting for another transaction to COMMIT or ROLLBACK so you can see if the row is actually available.
10 | tuple: You are waiting in a "queue" to acquire the lock on the row itself. This usually happens when three or more transactions are trying to modify the same row simultaneously.
11 |
12 | When multiple sessions target the same row, the sequence usually looks like this:
13 |
14 |
Transaction A updates a row and holds the lock.
15 |
Transaction B tries to update the same row. It sees Transaction A is busy and starts waiting (this often shows as a transactionid wait).
16 |
Transaction C tries to update the same row. Because there is already a queue forming, Transaction C (and any subsequent transactions) will wait on the tuple event.
17 |
18 | Essentially, tuple is the "waiting room" for row-level locks when there is high concurrency on a single record.
19 |
20 |
21 |
Common Causes of Lock: tuple Wait Events
22 |
23 |
High Concurrency on Specific Rows: When multiple transactions attempt to modify the same row simultaneously, it leads to contention.
24 |
Long-Running Transactions: Transactions that hold locks for extended periods can cause other transactions to wait.
25 |
Inefficient Application Logic: Poorly designed application logic that frequently updates the same rows can increase contention.
26 |
Massive batch updates:If a large batch job updates thousands of rows in a single transaction without committing, any other process trying to touch those same rows will be queued.
--------------------------------------------------------------------------------
/docs/pkuk.md:
--------------------------------------------------------------------------------
1 | # Primary Key and Unique Keys
2 |
3 | **Primary Key (PK)** defines how to uniquely identify a record in a table. If a record cannot be idenfied uniquely, then there is no meaning in storing it the table.
4 | So conceptually Primary Key is mandatory for any table, even if database systems won't enforce it.
5 | **Unique Keys (UK)** are conceptually refered as "Candiate Keys" - Candidates for using as them as Primary Key
6 | PostgreSQL maintains B-Tree index for each of them.
7 |
8 | ## Use of Keys
9 | Following are some of the benefits
10 | 1. Ensuring the integrity of data.
11 | 2. Improve the query performance, because keys are often used for joins and lookups.
12 | 3. In Logical replications as an identitty column
13 | 4. Tools like `pg_repack` uses them for functionality
14 |
15 | # Tables without PK and UKs
16 | ## From pg_gather data.
17 | ```
18 | WITH idx AS (SELECT indrelid, string_agg(ci.relname,',') FILTER (WHERE indisprimary) primarykey,
19 | string_agg(ci.relname,chr(10)) FILTER (WHERE indisunique AND NOT indisprimary) uniquekey
20 | , string_agg(ci.relname,chr(10)) FILTER (WHERE NOT indisunique AND NOT indisprimary) index
21 | FROM pg_get_index i join pg_get_class ci ON i.indexrelid = ci.reloid
22 | GROUP BY indrelid)
23 | -- SELECT the required fields.
24 | SELECT c.relname "table", primarykey, uniquekey, index
25 | FROM pg_get_class c LEFT JOIN idx ON c.reloid = idx.indrelid WHERE c.relkind IN ('r')
26 | -- Filter to see the tables without primary key or unique key.
27 | AND primarykey IS NULL AND uniquekey IS NULL;
28 | ```
29 | ## Directly from database
30 | ```
31 | WITH idx AS (SELECT indrelid, string_agg(ci.relname,',') FILTER (WHERE indisprimary) primarykey,
32 | string_agg(ci.relname,chr(10)) FILTER (WHERE indisunique AND NOT indisprimary) uniquekey
33 | , string_agg(ci.relname,chr(10)) FILTER (WHERE NOT indisunique AND NOT indisprimary) index
34 | FROM pg_index i join pg_class ci ON i.indexrelid = ci.oid
35 | GROUP BY indrelid)
36 | -- SELECT the required fields.
37 | SELECT c.relname "table", primarykey, uniquekey, index
38 | FROM pg_class c JOIN pg_namespace n ON n.oid = c.relnamespace AND nspname NOT IN ('pg_catalog', 'information_schema')
39 | LEFT JOIN idx ON c.oid = idx.indrelid WHERE c.relkind IN ('r') and c.relname NOT LIKE 'pg_toast%'
40 | -- Filter to see the tables without primary key or unique key.
41 | AND primarykey IS NULL AND uniquekey IS NULL;
42 | ```
43 |
--------------------------------------------------------------------------------
/docs/params/autovacuum.md:
--------------------------------------------------------------------------------
1 | # autovacuum
2 | Autovacuum is essential for any healthy PostgreSQL Instance. Please don't disable it unless there are unavoidable reasons for doing so.
3 | Moreover, disabling the autovacuum needs to be done only temporarily when it is essential.
4 |
5 | ## Why autovacuum is essential
6 | 1. Clean up dead tuples to create space for new tuples.
7 | If the cleanup of dead tuples is not happening continuously, new tuples will have to allocate more blocks. This is generally called Bloating. Table bloats result in Index bloat also. This could result in unexpected plan changes and degradation of SQL performance.
8 | 2. Freeze operation
9 | Freezing of sufficiently old tuples is important for perventing the system running into wraparound conditons. Frozen tuples are important for the SQL performance because it is visible for all SQLs. no need to do any further checks.
10 | 3. Helps to avoid aggressive vacuums
11 | Unless the Freeze operation is done in time and the age reaches `autovacuum_freeze_max_age`, Aggressive mode vacuums might start in the system, which could potentially block other concurrent sessions and generally cause a much higher load on the system.
12 | 4. Index maintenance.
13 | Autovacuum is responsible for Pending List Maintenance of GIN indexes. Autovacuum triggers the periodic merging of this pending list into the main index structure, which is controlled by the `gin_pending_list_limit` configuration.
14 | Moreover, autovacuum reduces the chance of index bloat for other types of indexes.
15 | 5. Updating Statistics
16 | Autovacuum is reponsible for keeping the Table and index statistics up-to-date. These statistics are used by the query planner, which helps the optimizer make better decisions about query execution plans
17 | 6. Updating the Visibility Map
18 | autovacuum maintains the visibility map, which tracks which blocks contain only tuples visible to all transactions. This intern helps future vacuum operations and speeds up by identifying blocks which don't have to be scanned. This visibility map information is very important for index-only scans, which improve the SQL performance.
19 |
20 | ## Summary
21 | Autovacuum is an essential background worker which does many housekeeping jobs. Without which many troubles are expected down the line. Avoid disabling it.
22 | Additional supplementary vacuum jobs that run on off-peak times are also recommended. This could help reduce autovacuum activities at peak times.
--------------------------------------------------------------------------------
/imphistory_parallel.sh:
--------------------------------------------------------------------------------
1 | #!/bin/bash
2 | # Bulk Import to history schema from continuous data gathering output files
3 | # This is a new version of imphistory.sh to support parallel execution (Beta - 15-Jan-22)
4 | # USAGE : imphistory_parallel.sh out*.gz
5 |
6 | #Deside on the number of parallelism you need
7 | PARALLEL=4
8 |
9 | process_gather(){
10 | ##Data collection timestamp. This info can be inserted for collect_ts of each line
11 | coll_ts=`zcat $1 | head -n 15 | sed -n '/COPY pg_gather/ {n; s/\([0-9-]*\s[0-9:\.+-]*\).*/\1/; p}'`
12 | printf "\nImporting %s \n" "$coll_ts"
13 | #In a real customer enviorment testing, an additional column appeared for pg_pid_wait like : ?column?|8459 ClientRead
14 | #This don't have a good explanation yet and treated as unknown bug.
15 | #Added 2 lines to mitigate this problem: /^[[:space:]]*$/d and s/^\?column?|\(.*\)/\1/
16 | #TODO : Observe over a period of time and remove those 2 lines if possible.
17 | #TODO : copy pg_get_slots and pg_get_ns lines for sed from "imphistory.sh"
18 | zcat $1 | sed -n '
19 | /^COPY/, /^\\\./ {
20 | s/COPY pg_get_activity (/COPY pg_get_activity (collect_ts,/
21 | s/COPY pg_pid_wait (/COPY pg_pid_wait (collect_ts,/
22 | s/COPY pg_get_db (/COPY pg_get_db (collect_ts,/
23 | s/COPY pg_replication_stat(/COPY pg_replication_stat (collect_ts,/
24 | s/COPY pg_get_slots(/COPY pg_get_slots(collect_ts,/
25 | /^COPY pg_srvr/, /^\\\./d #Delete any full gather information
26 | /^COPY pg_get_roles/, /^\\\./d # -do-
27 | /^COPY pg_get_confs/, /^\\\./d # -do-
28 | /^COPY pg_get_file_confs/, /^\\\./d #-do-
29 | /^COPY pg_get_class/, /^\\\./d #-do-
30 | /^COPY pg_get_index/, /^\\\./d #-do-
31 | /^COPY pg_get_rel/, /^\\\./d #-do-
32 | /^COPY pg_tab_bloat/, /^\\\./d #-do-
33 | /^COPY pg_get_toast/, /^\\\./d #-do-
34 | /^COPY pg_get_extension/, /^\\\./d #-do-
35 | /^COPY pg_get_ns/, /^\\\./d #-do-
36 | /^[[:space:]]*$/d
37 | s/^\?column?|\(.*\)/\1/
38 | /^\(COPY\|\\\.\)/! s/^/'"$coll_ts"\\t'/ # All lines other than those starting with COPY or \. should have coll_ts inserted
39 | p
40 | }' | psql "options='-c search_path=history -c synchronous_commit=off'" -f -
41 | }
42 |
43 | #Make the process_gather() function available for all the shells
44 | export -f process_gather
45 |
46 | #Run the files in parallel using multiple shells
47 | echo "$@" | sed -e 's/ /\n/g' | xargs -I{} -P $PARALLEL bash -c process_gather\ \{\}
48 |
49 |
--------------------------------------------------------------------------------
/docs/mxid.md:
--------------------------------------------------------------------------------
1 | # Multi Transaction ID
2 |
3 | PostgreSQL uses Multi Transaction ID when multiple sessions want to keep a lock on the same row (shared lock).
4 | High use of Multi Transaction IDs are indications of contention and lenghty transactions which are problematic for concurrency.
5 | The Multi Transaction ids are stored seperately on the disk. This could result in additional I/O
6 | Multiple sessions aquiring lock on the same row need to be reduced as much as possible for better performance and stabilty.
7 |
8 | ## Investigating further
9 |
10 | ### pg_gather
11 |
12 | Watch out for `MultiXact`* wait events in the pg_gather data. if they appear whe have a problem to address.
13 |
14 | pg_gather collects only DB level multi transaction id ages, This can be checked like
15 | ```
16 | SELECT datname, mxidage FROM pg_get_db;
17 | ```
18 |
19 | ### From DB catalog
20 | More object level investigation is possible using the catalog information
21 | ```
22 | SELECT datname,mxid_age(datminmxid) FROM pg_database;
23 | ```
24 | Individual table level mxid age can be checked from `pg_class`
25 | ```
26 | SELECT relname,mxid_age(relminmxid) FROM pg_class WHERE relkind = 'r';
27 | ```
28 |
29 | # What causes
30 | ## Foreign Key checks to Parent table
31 | When data is inserted into child table, The tansaction that is doing the `INSERT` will take a `FOR KEY SHARE` lock on the parent record. So if there are lot of INSERT satements refering to the same parent record, PostgreSQL don't have much option than using Multi-TransactionID
32 | ## Lengthy transactions.
33 | Transactions which are taking time could result in Multi-Transaction IDs and conflict with other sessions.
34 |
35 | # Suggessions
36 | 1. Use Foreign Key checks only when database side data integrity checks are absolute necessary. Those checks can become costly.
37 | 2. Batch the transactions instead of individual small transactions in parallel. On transaction requires only one transaction id, irrespective of the size of the transaction.
38 | 3. Commit transactions as quick as possible. Watch out for `ClientRead` wait events
39 | 4. Use modern SQL features like WITH clause , MERGE statements to replace many of the complex programm code.
40 | 5. Use `COPY` command instead of `INSERT` statements when large number of records are to be inserted.
41 |
42 | ## Additional References
43 | [Avoid Postgres performance cliffs with MultiXact IDs and foreign keys](https://pganalyze.com/blog/5mins-postgres-multiXact-ids-foreign-keys-performance)
44 | [Notes on some PostgreSQL implementation details](https://buttondown.com/nelhage/archive/notes-on-some-postgresql-implementation-details/)
--------------------------------------------------------------------------------
/imphistory.sh:
--------------------------------------------------------------------------------
1 | #!/bin/bash
2 | # Import Partial, continuous data gathering output files to history schema.
3 | if [ $# -eq 0 ]
4 | then
5 | echo "Please specify the log files as parameter. Wildcards accepted"
6 | fi
7 | for f in "$@"
8 | do
9 | ##Data collection timestamp. This info can be inserted for collect_ts of each line
10 | coll_ts=`zcat $f | head -n 20 | sed -n '/COPY pg_gather/ {n; s/\([0-9-]*\s[0-9:\.+-]*\).*/\1/; p}'`
11 | printf "\nImporting %s from %s\n" "$coll_ts" "$f"
12 | #In some customer cases, additional column appeared for pg_pid_wait like : ?column?|8459 ClientRead
13 | #Suspectedly because customer passing -x instead of -X, Not yet confirmed with confidence. So treated as unknown bug
14 | #Added 2 lines to mitigate this problem: /^[[:space:]]*$/d and s/^\?column?|\(.*\)/\1/
15 | #TODO : Observe over a period of time and remove those 2 lines if possible.
16 | zcat $f | sed -n '
17 | /^COPY/, /^\\\./ {
18 | s/COPY pg_gather (/COPY pg_gather (imp_ts,/
19 | s/COPY pg_get_activity (/COPY pg_get_activity (collect_ts,/
20 | s/COPY pg_pid_wait (/COPY pg_pid_wait (collect_ts,/
21 | s/COPY pg_get_db (/COPY pg_get_db (collect_ts,/
22 | s/COPY pg_replication_stat(/COPY pg_replication_stat (collect_ts,/
23 | s/COPY pg_get_slots(/COPY pg_get_slots(collect_ts,/
24 | s/COPY pg_get_pidblock(/COPY pg_get_pidblock(collect_ts,/
25 | s/COPY pg_get_wal(/COPY pg_get_wal(collect_ts,/
26 | s/COPY pg_get_io(/COPY pg_get_io(collect_ts,/
27 | s/COPY pg_gather_end(/COPY pg_gather_end(collect_ts,/
28 | /^COPY pg_srvr/, /^\\\./d #Delete any full gather information
29 | /^COPY pg_get_roles/, /^\\\./d # -do-
30 | /^COPY pg_get_db_role_confs/, /^\\\./d # -do-
31 | /^COPY pg_get_confs/, /^\\\./d # -do-
32 | /^COPY pg_get_file_confs/, /^\\\./d #-do-
33 | /^COPY pg_get_class/, /^\\\./d #-do-
34 | /^COPY pg_get_index/, /^\\\./d #-do-
35 | /^COPY pg_get_rel/, /^\\\./d #-do-
36 | /^COPY pg_tab_bloat/, /^\\\./d #-do-
37 | /^COPY pg_get_toast/, /^\\\./d #-do-
38 | /^COPY pg_get_inherits/, /^\\\./d #-do-
39 | /^COPY pg_get_tablespace/, /^\\\./d #-do-
40 | /^COPY pg_get_extension/, /^\\\./d #-do-
41 | /^COPY pg_get_hba_rules/, /^\\\./d #-do-
42 | /^COPY pg_get_prep_xacts/, /^\\\./d #-do-
43 | /^COPY pg_get_statements/, /^\\\./d #-do-
44 | /^COPY pg_get_ns/, /^\\\./d #-do-
45 | /^[[:space:]]*$/d
46 | s/^\?column?|\(.*\)/\1/
47 | /^\(COPY\|\\\.\)/! s/^/'"$coll_ts"\\t'/ # All lines other than those starting with COPY or \. should have coll_ts inserted
48 | p
49 | }' | psql "options='-c search_path=history -c synchronous_commit=off'" -f -
50 | done
51 |
--------------------------------------------------------------------------------
/docs/catalogbloat.md:
--------------------------------------------------------------------------------
1 | # Catalog bloat
2 | PostgreSQL metadata catalogs are where all database objects and their attributes are stored, such as tables, columns, indexes, and view definitions. The metadata includes permissions and statistics about each object, which are used for checking permissions, parsing SQL statements, and preparing the execution plan. It is important to keep the metadata size small for fast database response. Bloating can negatively affect the overall system performance.
3 |
4 | ## Causes
5 | Bloating in PostgreSQL metadata catalogs can occur due to various reasons. Some of the common reasons are:
6 |
7 | 1. **Frequent DDLs:** This generally affects systems where DDL is issued from the application side. For example, OLAP systems creating staging tables and creating indexes after the data load. This bloat comes out of fragmentation.
8 |
9 | 2. **Heavy catalog created by multi-tenancy:** Multi-tenancy can cause several thousands of database objects, sometimes even hundreds of thousands. Multi-tenancy using a single catalog is not a great idea.
10 |
11 | 3. **Use of temporary tables:** Temporary tables in PostgreSQL work like regular tables in terms of metadata. Metadata about temporary tables will be added to the catalog and later removed when the usage of the temporary table is finished. This addition and removal leads to a lot of fragmentation. Extensive use of temporary tables is the most common reason for heavily bloated catalog tables.
12 |
13 | ## Detection.
14 | In a healthy database, The total catalog size should be around 15 - 20 MB, Any size bigger than that can cause performance degradation. One might experinece poor responce from quries. `pg_gather` report can estimate the catalog size
15 |
16 | Additionally You may use the bloat estimation SQL statement : https://github.com/jobinau/pgsql-bloat-estimation/blob/master/table/table_bloat.sql
17 | But remember to replace the line
18 | ```
19 | AND ns.nspname NOT IN ('pg_catalog', 'information_schema')
20 | ```
21 | with
22 | ```
23 | AND ns.nspname IN ('pg_catalog')
24 | ```
25 |
26 | ## Fixing the Bloat.
27 | Performing a VACUUM FULL on the catalog tables is the remedy if the bloat is due to fragmentation. Generally there won't be any continuous DMLs on catalog tables. But better to performt he VACCUM FULL during a low activity window:
28 | Connect to the right database using `psql` and run the following SQL to get the VACUUM FULL statements for each tables. You may add additional filters based on the bloat estimation as mentioned above.
29 | ```
30 | SET statement_timeout='5s';
31 | SELECT 'VACUUM FULL pg_catalog.'|| tablename || ';' FROM pg_tables WHERE schemaname = 'pg_catalog';
32 | ```
33 | Then we should be able to run all the statments using `\gexec`
34 |
35 | But if the bloat is due to very high number of database objects, there is no easy remedy than removing the unwated objects and avoiding multi-tenancy using single database.
36 |
--------------------------------------------------------------------------------
/docs/params/autovacuum_max_workers.md:
--------------------------------------------------------------------------------
1 | # autovacuum_max_workers
2 | This parameter rarely requires a value bigger than 3 (the default).
3 | As the number of autovacuum workers increases, each worker will get a smaller share of `autovacuum_vacuum_cost_limit`. Effectively, the autovacuum workers will start running slower.
4 | Please consider changing this parameter setting only with an expert's analysis.
5 | Consider a bigger value for `autovacuum_max_workers` in those cases where the schema is extremely big OR There are too many active databases in the instance, where we might see autovacuum workers continuously running back to back on different tables, even after all the autovacuum tuning efforts.
6 |
7 | ## Other negative effect of bigger value of autovacuum_max_workers
8 | 1. As the number of workers increases, each worker runs slower and takes more time to complete. This situation leads to autovacuum workers referring to old snapshots (old Xmin reference). Autovacuum workers are like regular PostgreSQL sessions, which are constraint by the visibility rules as per the MVCC.
9 | Effectively, a long-running autovacuum worker has the same effect as any long-running session. It can cause bloat.
10 | Autovacuum workers themself causing bloat would be an anti-pattern but frequently reported case.
11 | 2. Each autovacuum worker uses a snapshot (xmin reference) to work on tables. So autovacuum woker has visiblity only to those records which are existing as when the autovacuum worker started. The Autovauum worker cann't see the dead tuples created later. This means an autovacuum worker becomes ineffective in cleaning up dead tuples if it takes longer duration.
12 | 3. Each autovacuum woker can allocate `maintenance_work_mem` amount of memory. This can result in high memory presure on the server and cause poor performance or even outage.
13 |
14 | ## Supplimentory vacuum jobs
15 | Scheduling supplementary autovacuum jobs is highly recommended on highly active database systems due to many of the disadvantages and limitations of built-in autovacuum algorithms. The built-in Autovacuum considers the Dead tuples (Number and Ratio) as the basis of scheduling the autovacuum workers on a table. Other criteria, like the table's age, are ignored by the autovacuum. Another major disadvantage of autovacuum is the high chance of autovacuum workers starting during peak times because of the DDL changes. All these limitations can be addressed using a scheduled vacuum job running in the off-peak hours. As an added benefit, It reduces the chance that the same table becomes candidate for autovacuum again during peak hours. Sample SQL script is available here: https://github.com/jobinau/pgscripts/blob/main/vacuumjob.sql . This script is widely used in many environments and found to address the problems discussed above. For example, This script can be scheduled as follows:
16 | ```
17 | 20 11 * * * /full/path/to/psql -X -f /path/to/vacuumjob.sql > /tmp/vacuumjob.out 2>&1
18 | ```
19 |
20 |
21 |
--------------------------------------------------------------------------------
/docs/max_connections.md:
--------------------------------------------------------------------------------
1 | # max_connection settings
2 | Avoid exceeding `max_connections` exceeding **10x** of the CPU count
3 |
4 |
5 | ## Problems of high number of connections
6 | * Possibility of overloading and server become unresponsive / hang
7 | * DoS attacks : System becomes easy target
8 | * Lock Management overhead increases
9 | * Memory utilization (Practically 10-50MB usage per connection is common)
10 | * Snapshot overhead increases
11 | Overall poor performance, responsiveness and stability issuse are often reported with databases with high `max_connection` values
12 |
13 | ## Best case benchmark result
14 | Even on a best case senario created using micro-benchmark, we could observe that the thoughput flattens as connections approches 10x of the CPU count
15 | 
16 |
17 |
18 | ## Key concepts to remember
19 | * Each client connection is one process in the database server
20 | * When client connection becomes active (some query to process) the corresponding process becomes runnable at the OS
21 | * One CPU core can handle only 1 runable process at a time.
22 | * That means, if there are N CPU cores, There will be only N running processes.
23 | * When Runable processes reaches the 5x-10x of the CPU count, Overall CPU utilization hits 100% .
24 | * There is no benefit of pushing for more concurency if the CPU utilization is hits its maximum.
25 | * Multi-tasking / Context switches by OS gives the preception of multiple processes running by preempting the process frequently
26 | * More runnable processes beyond the CPU counts results in processes waiting in scheduler queue for longer duration, which effectively results in poor performance.
27 | * Increases the processes more just increases the contention in the system.
28 | * PostgreSQL's supervisor process (so called postmaster) need to keep tab on each process it forked.
29 | * As the process count increases, The work of postmaster become inreases to get snapshot of what’s visible/invisible, committed/uncommitted (aka, Transaction Isolation)
30 | * It takes longer time to get `GetSnapshotData()` as the work increases. This results in slow responce.
31 | * PostgreSQL processs caches the metadata accessed leading to incrased memory utilization over a time
32 | * Extension libraries will be loaded to the processes, which increases the memory footprint.
33 |
34 | ## Important Articles/References to Read
35 | 1. [Why a high `max_connections` setting can be detrimental to performance](https://richyen.com/postgres/2021/09/03/less-is-more-max-connections.html)
36 | 2. [Analyzing the Limits of Connection Scalability in Postgres](https://www.citusdata.com/blog/2020/10/08/analyzing-connection-scalability/) -- Memory and Poor snapshot scalability
37 | 3. [Measuring the Memory Overhead of a Postgres Connection](https://blog.anarazel.de/2020/10/07/measuring-the-memory-overhead-of-a-postgres-connection/)
38 | 4. [Manage Connections Efficiently in Postgres](https://brandur.org/postgres-connections)
39 |
40 |
41 |
42 |
43 |
44 |
--------------------------------------------------------------------------------
/docs/events/LOCKMANAGER.html:
--------------------------------------------------------------------------------
1 |
LWLock:LockManager
2 | This event occurs when a process is waiting to access the internal shared memory structure that tracks locks on tables and indexes
3 | It is not waiting for a row lock (like a standard blocking update); it is waiting for the right to read/write the list of who holds what locks.
4 | This is effectively a CPU scaling bottleneck. It happens when many processes are trying to acquire or release locks at the exact same microsecond,
5 | causing a traffic jam at the "Lock Manager's Front Desk."
6 | This is an area where PostgreSQL 18 has made significant improvements.
7 |
8 |
Why it is happening (Root Causes)
9 |
10 |
The "Fast-Path" Limit (The Core Issue):
11 | PostgreSQL tries to avoid touching the main shared memory lock table because it's slow/contested.
12 | Instead, it tries to record locks in a small, private "Fast-Path" array associated with the backend process.
13 | This array was hardcoded to hold only 16 locks in old verions, where the OIDs of the tables and indexes are "remembered"
14 | If a query touched 17+ tables/indexes (or partitions), it "spilled over" into the main shared lock manager, forcing it to take the LockManager LWLock.
15 |
16 |
17 | The Partition Trap:If you query a partitioned table with 100 partitions and don't prune effectively, you instantly grab 100 locks,
18 | overflow the Fast-Path, and hammer the LockManager
19 |
20 |
21 | The Connection Storms:
22 | if hundreds of connections suddenly try to query data, even if they don't touch the same rows, they all need to register their presence in the Lock Manager.
23 | This creates contention on the memory buckets (Lock Manager partitions).
24 |
25 |
26 | Lock Holders:
27 | Many sessions (especially "idle in transaction") holding locks for long periods.
28 |
29 |
Complex Queries and Table Partitions:
30 | Queries that involve multiple partitions or indexes can acquire many locks.
31 |
32 |
Further Diagnosis
33 |
Use SELECT * FROM pg_locks to check the lock status
34 |
35 |
Resolution
36 |
37 |
Identify and terminate or commit long-running idle in transaction sessions. Configure idle_in_transaction_session_timeout
The WALWrite event occurs when a backend process is waiting for the PostgreSQL WAL buffers to be written out to the operating system's write cache.
3 |
The Difference Between WALWrite and WALSync
4 | WALWrite: Waiting for the data to be moved from PostgreSQL's internal buffers to the OS kernel buffer.
5 | WALSync: Waiting for the OS to move the data to be from the OS kernel buffer to the physical disk.
6 |
Common Causes of High WALWrite Wait Times
7 | When WALWrite becomes a bottleneck, it is usually due to one of the following factors:
8 |
9 |
High WAL generation rate: If the system is generating WAL data faster than it can be written to the OS buffer, it can lead to increased WALWrite wait times.
10 | If your application is performing a massive number transactions, the system must constantly move data to the OS, leading to contention.
11 |
12 |
Disk I/O bottlenecks: Slow disk performance can cause delays in writing WAL data to the OS buffer.
13 | While WALWrite specifically measures the handoff to the OS, a saturated disk subsystem can cause a "backpressure" effect.
14 | If the disk cannot keep up with WALSync operations, the OS buffers stay full, and subsequent WALWrite requests are delayed.
15 |
16 |
Insufficient WAL buffer size: If the WAL buffer is too small, it can lead to frequent flushes and increased wait times.
17 |
18 |
Additional troubleshooting
19 |
You should also check your system-level I/O metrics (using tools like iostat or iotop) to see if the disk write latency is spiking.
20 |
Strategies for Optimization
21 |
22 |
Tune wal_buffers:
23 | This determines how much WAL data can be stored in memory before being written to disk. Increasing this (up to 16MB or 32MB) can reduce the frequency of writes for high-concurrency workloads.
24 | Please refer to the parameter tuning section for reccommendations on setting wal_buffers.
25 |
26 |
27 | Tune checkpoint, using parameters like checkpoint_timeout, max_wal_size, and checkpoint_completion_target to control the frequency and duration of checkpoints.
28 | This is to prevent checkpoint related spikes in WAL generation and I/O that can overwhelm the WAL writing process.
29 |
30 | Use Faster Storage:
31 | Since WAL is written sequentially, disk latency is the primary hardware bottleneck. Moving the WAL directory (pg_wal) to a dedicated, high-speed NVMe drive or a RAID 10 array can significantly decrease WALWrite wait times.
32 |
33 |
Use group commits:
34 | PostgreSQL can group multiple transactions' WAL writes into a single write operation. This reduces the number of write operations and can improve throughput.
35 | This can be achived using parameters like commit_delay and commit_siblings.
36 |
37 |
Consider asynchronous commits wherever possible:
38 | This reduces the number of WAL writes that need to be confirmed before a transaction is considered committed.
39 |
40 |
41 |
--------------------------------------------------------------------------------
/docs/dygraphs/dygraph.css:
--------------------------------------------------------------------------------
1 | /**
2 | * Default styles for the dygraphs charting library.
3 | */
4 |
5 | .dygraph-legend {
6 | position: absolute;
7 | font-size: 14px;
8 | z-index: 10;
9 | width: 250px; /* labelsDivWidth */
10 | /*
11 | dygraphs determines these based on the presence of chart labels.
12 | It might make more sense to create a wrapper div around the chart proper.
13 | top: 0px;
14 | right: 2px;
15 | */
16 | background: white;
17 | line-height: normal;
18 | text-align: left;
19 | overflow: hidden;
20 | }
21 |
22 | .dygraph-legend[dir="rtl"] {
23 | text-align: right;
24 | }
25 |
26 | /* styles for a solid line in the legend */
27 | .dygraph-legend-line {
28 | display: inline-block;
29 | position: relative;
30 | bottom: .5ex;
31 | padding-left: 1em;
32 | height: 1px;
33 | border-bottom-width: 2px;
34 | border-bottom-style: solid;
35 | /* border-bottom-color is set based on the series color */
36 | }
37 |
38 | /* styles for a dashed line in the legend, e.g. when strokePattern is set */
39 | .dygraph-legend-dash {
40 | display: inline-block;
41 | position: relative;
42 | bottom: .5ex;
43 | height: 1px;
44 | border-bottom-width: 2px;
45 | border-bottom-style: solid;
46 | /* border-bottom-color is set based on the series color */
47 | /* margin-right is set based on the stroke pattern */
48 | /* padding-left is set based on the stroke pattern */
49 | }
50 |
51 | .dygraph-roller {
52 | position: absolute;
53 | z-index: 10;
54 | }
55 |
56 | /* This class is shared by all annotations, including those with icons */
57 | .dygraph-annotation {
58 | position: absolute;
59 | z-index: 10;
60 | overflow: hidden;
61 | }
62 |
63 | /* This class only applies to annotations without icons */
64 | /* Old class name: .dygraphDefaultAnnotation */
65 | .dygraph-default-annotation {
66 | border: 1px solid black;
67 | background-color: white;
68 | text-align: center;
69 | }
70 |
71 | .dygraph-axis-label {
72 | /* position: absolute; */
73 | /* font-size: 14px; */
74 | z-index: 10;
75 | line-height: normal;
76 | overflow: hidden;
77 | color: black; /* replaces old axisLabelColor option */
78 | }
79 |
80 | .dygraph-axis-label-x {
81 | }
82 |
83 | .dygraph-axis-label-y {
84 | }
85 |
86 | .dygraph-axis-label-y2 {
87 | }
88 |
89 | .dygraph-title {
90 | font-weight: bold;
91 | z-index: 10;
92 | text-align: center;
93 | /* font-size: based on titleHeight option */
94 | }
95 |
96 | .dygraph-xlabel {
97 | text-align: center;
98 | /* font-size: based on xLabelHeight option */
99 | }
100 |
101 | /* For y-axis label */
102 | .dygraph-label-rotate-left {
103 | text-align: center;
104 | /* See http://caniuse.com/#feat=transforms2d */
105 | transform: rotate(90deg);
106 | -webkit-transform: rotate(90deg);
107 | -moz-transform: rotate(90deg);
108 | -o-transform: rotate(90deg);
109 | -ms-transform: rotate(90deg);
110 | }
111 |
112 | /* For y2-axis label */
113 | .dygraph-label-rotate-right {
114 | text-align: center;
115 | /* See http://caniuse.com/#feat=transforms2d */
116 | transform: rotate(-90deg);
117 | -webkit-transform: rotate(-90deg);
118 | -moz-transform: rotate(-90deg);
119 | -o-transform: rotate(-90deg);
120 | -ms-transform: rotate(-90deg);
121 | }
122 |
--------------------------------------------------------------------------------
/docs/ha.md:
--------------------------------------------------------------------------------
1 | # High Availability in PostgreSQL
2 | High Availability of PostgreSQL is generally implemented as an external framework.
3 | [Patroni](https://github.com/patroni/patroni), [RepMgr](https://github.com/EnterpriseDB/repmgr) , [Stolon](https://github.com/sorintlab/stolon) and [pg_auto_failover](https://github.com/hapostgres/pg_auto_failover) are some of the commonly considered OpenSource HA Frameworks.
4 |
5 | Unfortunately, the feedback from the production use of some of the frameworks is not great. Some frameworks are reported to cause more problems and reliability issues, resulting in more outages and unavailability.
6 | Some of the frameworks cause more split-brain incidents, which is considered as one of the most dangerous thing that can happen to a database system.
7 |
8 | Please consider the following important criteria while evaluating and selecting HA frameworks.
9 |
10 | 1. Protection from Network Partitioning
11 | The network is one of the most unreliable parts of a cluster. There sould be good algorithms like [`Raft`](https://en.wikipedia.org/wiki/Raft_(algorithm)) or [`Paxos`](https://en.wikipedia.org/wiki/Paxos_(computer_science)) to handle such events.
12 | 2. Protection from Split-brain.
13 | As mentioned above, a reliable algorithm will provide the first line of protection. However, in case of network isolation, where there is no way to know the truth, the framework should take the PostgreSQL instance to read-only mode to protect against Split Brain. This acts as the second line of protection.
14 | 3. Maintain the topology integrity
15 | The HA framework should make sure that there is only one leader at a time at any cost and reconfigure the topology to maintain this integrity
16 | 4. STONITH / fencing.
17 | In extreme cases of node hangs, the framework should be capable of STONITH/fencing. Integration with Linux Watchdog is highly recommended. This is the last and highest level of protection.
18 | 5. Central management of configuration.
19 | HA is all about avoiding single point of failures. So Idealy, there shouldn't be any special nodes in a cluster. The HA Framework should ensure that all necessary parameters are same accross all the nodes, so that there won't be a surprise after a switchover or failover.
20 | 6. Ability to manage cluster without any extension.
21 | Avoid extensions as much as possible. Especially those that store data in local nodes.
22 | 7. Something which passed the test of time.
23 | HA frameworks are something which needs to be proven its credibility over time. Getting a wider community feedback is highly suggestable. Reliability / trustability is something to be proven over a period of time. Avoid taking risks.
24 | 8. Auto detection of failures and actions.
25 | Not just node failure, but topology failure also need to be detected and necessary action should be performed including rewind or reinit.
26 | 9. Simple and reliable interface for DBAs
27 | HA framework should provide a simple experience to perform manual switchovers and reinitialize and rejoin a lost node
28 |
29 | ## Recommendation
30 | Currently, [Patroni](https://github.com/patroni/patroni) is considered the best HA Project, meeting the majority of the requirements of a HA solution
31 | (Hint: Please consider the Github star ratings and Number of commits to understand the popularity and rate of development)
32 |
33 |
34 |
35 |
36 |
--------------------------------------------------------------------------------
/docs/barman.md:
--------------------------------------------------------------------------------
1 | # Barman / rsync
2 | Barman is a Python wrapper script on the top of [rsync](https://en.wikipedia.org/wiki/Rsync) and [pg_basebackup](https://www.postgresql.org/docs/current/app-pgbasebackup.html).
3 | The acutal backup is perfomed by either of the underlying tools. So all limitations of underlying tools will be applicable for Barman.
4 |
5 | # Known Limitations of rsync
6 | 1. **CRITICAL : Unreliable Static File List**
7 | `rsync` builds a list of files at the beginning of the synchronisation process, and this list is not updated during the run. If new files are added to the source after the file list is created, these new files will not be copied. Similarly, if files are deleted after the list is created, `rsync` will warn that it could not copy those files. In a live database, files are added and removed at any time. So, there is a risk that the database backup taken using rsync will not be restorable.
8 | Incremental backups have a higher risk.
9 |
10 | 2. **CRITICAL : Inconsistancies and File corruption risk**
11 | `rsync` is not designed for a filesystem which is undergoing changes. It does not create a snapshot of the filesystem either. it is difficult to determine the exact point in time when the data was copied. This can lead to inconsistencies if files are modified during the synchronisation process. It is risky to use on a filesystem which is undergoing changes. Corruptions are reported.
12 | 3. **No Differential Backups**
13 | No differential backups possible.
14 | 4. **No Delta restore**
15 | restore only files that are different than in backups based on checksums, which can improve restore speed by a lot, the bigger db, the better result
16 | 5. **No Encryption of backup repository**
17 | This could be a serious limitation affecting the "Data-At-Rest" encryption compliance requirements.
18 | 6. **No TLS Protocols**
19 | There is no support for Secure TLS Protocol, Certificate authentication for the file transfer.
20 | 7. **No Async/Parallel WAL Archiving**
21 | WAL archiving happens in a single treaded/single process. Asynchronous and parallel archiving is not possible. A system which generates high volume of WAL files can cause serious lag in WAL archiving without Parallel/Async backup.
22 | 8. **No Native Cloud bucket support**
23 | The cloud bucket support is also a wrapper.
24 | 9. **No Incremental Backups possible to Cloud Buckets**
25 | Due to above mentioned archtiectural limiation, Incremental backups to cloud buckets are also not possible.
26 | 10. **No auto detection of switchover/failover**
27 | If there is fail-over or swtich-over to standby in a PostgreSQL cluster, Barman don't have an automatic mechanism to change the backup configuration.
28 | 11. **No single database restore**
29 | There is no option to restore a single database of a PostgreSQL cluster. The entire data directory need to be restored with all the database.
30 | 12. No parallelism for Barman-Cloud backup
31 |
32 | ## Limitations of pg_basebackup
33 | 12. **No Incremental backup***
34 | No incremental backup is possible until PostgreSQL 17
35 | 13. **No Parallelism**
36 | No Parallelism possible.This could be a serious limiation for big databases
37 | 14. **No compression over network**
38 | Backup is copied over network in uncompressed format leading to heavy utilization of network bandwidth.
39 |
--------------------------------------------------------------------------------
/docs/cp.md:
--------------------------------------------------------------------------------
1 | # cp / rsync as archive_command
2 | WAL archiving is an essential part of Backups to facilitate point-in-time recovery (PITR), so its reliability is crucial.
3 | Unfortunately, the PostgreSQL documentation provides a command line which includes `cp` as follows.
4 | ```
5 | archive_command = 'test ! -f /mnt/server/archivedir/%f && cp %p /mnt/server/archivedir/%f'
6 | ```
7 | The official documentation states, "This is an example, not a recommendation, and might not work on all platforms." However, that is not enough to warn against the use of `cp`. Many users tend to use this in critical environments.
8 | As Tom Lane comments : *"It's not really intended to be production-grade, and I think the docs say so (perhaps not emphatically enough)"*
9 | `cp` or `rsync` are not designed to meet the high-reliability requirements of a database workload. But they are more tuned for the speed. Using them as WAL archiving could jeopardise the reliability of WALs archived.
10 | The PostgreSQL documentation still contains such samples to explain the concept of WAL archiving.
11 |
12 |
13 | ## Known Problems
14 | 1. Partially written WAL files:
15 | if the file copy is interrupted due to some reason. The archive destination can have partially written WAL files
16 | 2. `cp` is not atomic
17 | The file can be read before the contents are materialised, causing an early end to recovery.
18 | 3. Accidental overwriting of files.
19 | if the backup location is mounted on multiple hosts, a plain `cp` could overwrite files
20 | 4. WAL Archive failures.
21 | Inorder to protect from accidental overwriting of files `test ! -f` check is used in the example. But that often results in archive failures and WAL directory fill ups.
22 | 5. Risk of losing archived WAL file
23 | many `cp` implementations won't flush. So, there exists a narrow gap where a file can be lost from the archive destination if the OS kernel is not flushing it before a power failure.
24 | 6. Missing WAL
25 | some of the `cp` implementations (GNU cp) return a value of 0 even if a copy is not successful. This can lead to the removal of the WAL file without any archive.
26 |
27 |
28 | ## Some of the relevant PostgreSQL community discussions
29 | Following discussions could reveal the expert's view on the subject
30 | 1. [https://www.postgresql.org/message-id/flat/E1QXiEl-00068A-1S%40gemulon.postgresql.org](https://www.postgresql.org/message-id/flat/E1QXiEl-00068A-1S%40gemulon.postgresql.org)
31 | 2. [https://www.postgresql.org/message-id/flat/53E5603B.5040102%40agliodbs.com](https://www.postgresql.org/message-id/flat/53E5603B.5040102%40agliodbs.com)
32 |
33 | ## Recommendations
34 | 1. PostgreSQL supports `archive_library` from PostgreSQL 15 onwards and a simple sample library: `basic_archive` is provided as part of contrib modules Please refer : [https://www.postgresql.org/docs/current/basic-archive.html](https://www.postgresql.org/docs/current/basic-archive.html) . So the regular cp / rsync commands are no longer needed.
35 | 2. An advanced backup tool is recommended which can safely execute WAL archiving; for example, pgBackRest can do WAL archiving in Asynchronous and Parallel mode. Please refer: [https://www.percona.com/blog/how-pgbackrest-is-addressing-slow-postgresql-wal-archiving-using-asynchronous-feature/](https://www.percona.com/blog/how-pgbackrest-is-addressing-slow-postgresql-wal-archiving-using-asynchronous-feature/)
36 |
--------------------------------------------------------------------------------
/docs/pgbinary.md:
--------------------------------------------------------------------------------
1 | # PostgreSQL Binaries
2 | The integrity of PostgreSQL binaries (executables and libraries) is fundamental to the security and stability of your database system. Compromised or improperly managed binaries can expose your system to significant risks, ranging from unpredictable crashes to critical data breaches.
3 |
4 | ## Potential Risks and Vulnerabilities 🛡️
5 | #### **1. Malicious Tampering**
6 | A malicious actor could create and distribute tampered PostgreSQL binary packages. Installing such a package could install backdoors, granting them unauthorized access to your system and critical data.
7 | #### **2. Compromised Dependencies**
8 | PostgreSQL depends on numerous external libraries for its functionality (e.g., OpenSSL, Readline, zlib). Vulnerabilities or incompatibilities within these dependent libraries can directly compromise PostgreSQL's security and stability.
9 | ```
10 | $ pg_config --libs
11 | -lpgcommon -lpgport -lselinux -lzstd -llz4 -lxslt -lxml2 -lpam -lssl -lcrypto -lgssapi_krb5 -lz -lreadline -lm -lnuma
12 | ```
13 | #### **3. Unintended Library Loading**
14 | The system might accidentally link to or load libraries from unintended locations (for instance, due to an incorrectly configured LD_LIBRARY_PATH). This can jeopardize system security by loading insecure or incompatible code, leading to unpredictable behavior.
15 |
16 | #### **4. Dangers of Manual Installation**
17 | Manual installations (e.g., compiling from source) without a package manager (like rpm or deb) lack a robust mechanism to verify binary integrity and manage dependencies. This can lead to several severe problems:
18 |
19 | **Library Mismatches:** System libraries might be updated to versions that are incompatible with your specific PostgreSQL build, causing issues like assertion failures or segmentation faults (crashes).
20 |
21 | **Orphaned Dependencies:** A system's package manager, unaware of a manually installed PostgreSQL instance, may identify critical libraries as "unused" and remove them during a system cleanup or OS update. This commonly results in PostgreSQL failing to start or operate correctly after system maintenance.
22 |
23 | ## Best Practices and Preventive Measures 🔒
24 | #### **1. Use Official Package Managers**
25 | Always install PostgreSQL using your operating system's native package manager (e.g., `yum`, `dnf`, `apt`). This is the most reliable method for ensuring that all necessary dependencies are correctly installed, version-locked, and managed automatically.
26 |
27 | #### **2. Use Trusted and Verified Repositories**
28 | Only download packages from the official PostgreSQL repositories or your trusted OS vendor. Crucially, ensure your package manager is configured to validate package signatures using GPG keys. This cryptographically verifies that the packages you are installing are authentic and have not been modified.
29 |
30 | #### **3. Enforce a "No Manual Installation" Policy**
31 | On production systems, avoid compiling from source or installing from unofficial archives unless there is a compelling and documented reason. Any manual installation attempt should be treated as a notable event that requires explicit approval and review.
32 |
33 | #### **4. Maintain Local Mirrors for Air-Gapped Systems**
34 | For systems without internet access, create and maintain a local, trusted mirror of the official PostgreSQL repositories. This allows you to manage installations and updates securely and consistently in an isolated environment.
35 |
--------------------------------------------------------------------------------
/docs/params/max_connections.md:
--------------------------------------------------------------------------------
1 | # max_connection settings
2 | Avoid exceeding `max_connections` exceeding **10x** of the CPU count.
3 |
4 |
5 | ## Problems with the high number of connections
6 |
7 | * Possibility of overloading and server becoming unresponsive / hang
8 | * DoS attacks: System becomes an easy target
9 | * Lock Management overhead increases.
10 | * Memory utilization (Practically 10-50MB usage per connection is common)
11 | * Snapshot overhead increases.
12 |
13 | Overall poor performance, responsiveness and stability issues are often reported with databases with high `max_connection` values.
14 |
15 | ## Best case benchmark result
16 | Even in a best-case scenario created using a micro-benchmark, we can observe that the throughput flattens as connections approach 10x the CPU count.
17 | 
18 | But at the same time, the latency - the measure of responsiveness goes terrible.
19 | 
20 | As the latency increases, individual SQL statements take longer to complete, often resulting in poor performance complaints. If the latency increases significantly, some systems may fail due to timeouts.
21 |
22 | ## Key concepts to remember
23 | * Each client connection is one process in the database server.
24 | * When the client connection becomes active (some query to process), corresponding process becomes runnable at the OS
25 | * One CPU core can handle only one runable process at a time.
26 | * That means that if there are N CPU cores, there will only be N running processes.
27 | * When runable processes reach 5x-10x of the CPU count, overall CPU utilization can hit 100%.
28 | * There is no benefit of pushing for more concurrency if the CPU utilization hits its maximum.
29 | * Multi-tasking / Context switches by OS gives the preception of multiple processes running by preempting the process frequently. But context switches comes with big cost
30 | * More runnable processes beyond the CPU counts results in processes waiting in scheduler queue for longer duration, which effectively results in poor performance.
31 | * Increase in number of processes more than what the system could hanlde, just increases the contention in the system.
32 | * PostgreSQL's supervisor process (so-called postmaster) needs to keep a tab on each process it forked. As the process count increases, The work of postmaster become inreases.
33 | * As the number of sessions increases its become more complex to get snapshot of what’s visible/invisible, committed/uncommitted (aka, Transaction Isolation)
34 | * It takes a longer time to getGetSnapshotData() as the work increases. This results in slow response.
35 | * PostgreSQL processs caches the metadata accessed leading to incrased memory utilization over a time
36 | * Extension libraries will be loaded to the processes, which increases the memory footprint.
37 |
38 | ## Important Articles/References to Read
39 | 1. [Why a high `max_connections` setting can be detrimental to performance](https://richyen.com/postgres/2021/09/03/less-is-more-max-connections.html)
40 | 2. [Analyzing the Limits of Connection Scalability in Postgres](https://www.citusdata.com/blog/2020/10/08/analyzing-connection-scalability/) -- Memory and Poor snapshot scalability
41 | 3. [Measuring the Memory Overhead of a Postgres Connection](https://blog.anarazel.de/2020/10/07/measuring-the-memory-overhead-of-a-postgres-connection/)
42 | 4. [Manage Connections Efficiently in Postgres](https://brandur.org/postgres-connections)
43 |
44 |
45 |
46 |
47 |
48 |
--------------------------------------------------------------------------------
/docs/bloat.md:
--------------------------------------------------------------------------------
1 | # Bloated Tables
2 | Table bloat can affect the performance of individual SQL statements as well as the entire database. This is because PostgreSQL needs to scan and fetch more pages to process an SQL statement.
3 | A bloat beyond 20% need to be considered serious.
4 |
5 | # How do I get the List
6 | Bloated tables and their bloat percentage is listed in pg_gather report under tables section. Just sort by "Bloat%' column to get the list of tables in the order.
7 |
8 | ## From pg_gather backend
9 | following SQL might help
10 | ```
11 | SELECT c.relname || CASE WHEN inh.inhrelid IS NOT NULL THEN ' (part)'
12 | WHEN c.relkind != 'r' THEN ' ('||c.relkind||')'
13 | ELSE '' END "Name",
14 | n.nsname "Schema",
15 | CASE WHEN r.blks > 999 AND r.blks > tb.est_pages THEN (r.blks-tb.est_pages)*100/r.blks
16 | ELSE NULL END "Bloat%",
17 | r.n_live_tup "Live", r.n_dead_tup "Dead",
18 | CASE WHEN r.n_live_tup <> 0 THEN ROUND((r.n_dead_tup::real/r.n_live_tup::real)::numeric,1) END "D/L",
19 | r.rel_size "Rel size", r.tot_tab_size "Tot.Tab size", r.tab_ind_size "Tab+Ind size"
20 | FROM pg_get_rel r
21 | JOIN pg_get_class c ON r.relid = c.reloid AND c.relkind NOT IN ('t', 'p')
22 | JOIN pg_get_ns n ON r.relnamespace = n.nsoid
23 | LEFT JOIN pg_tab_bloat tb ON r.relid = tb.table_oid
24 | LEFT JOIN pg_get_inherits inh ON r.relid = inh.inhrelid
25 | WHERE r.blks > 999 AND r.blks > tb.est_pages AND (r.blks-tb.est_pages)*100/nullif(r.blks,0) > 20;
26 | ```
27 |
28 | ## Directly from the database.
29 | Getting information directly from the database is more reliable, and more investigation is possible.
30 | Please consider using the SQL script :
31 | https://github.com/jobinau/pgsql-bloat-estimation/blob/master/table/table_bloat.sql
32 |
33 | # How to Fix
34 | If the table is already bloated, recovering and releasing the space back to storage is highly recommended.
35 | There are generally two options for that.
36 | ### Using VACUUM FULL
37 | This is a built-in feature of PostgreSQL that rebuilds the entire table and its indexes. During this operation, the table will be locked exclusively. So avoid doing this without a proper maintenance window.
38 | Proper `statement_timeout` settings should allow us to do this for small tables (a few MBs). For example:
39 | ```
40 | SET statement_timeout = '10s';
41 | VACUUM FULL pg_get_class;
42 | ```
43 | ### Using pg_repack
44 | If the table is big and getting a maintenance window is not allowed, Or if the application cannot afford to have an exclusive lock on the table which remains until the completion of maintenance. Then consider using the pg_repack extension.
45 | Refer: https://reorg.github.io/pg_repack/
46 |
47 | # How to Avoid
48 | Table bloat can be avoided to certain extent with the following
49 | 1. **Adjust the FILLFACTOR at the table level**
50 | Please refer to the details at table level in the pg_gather report. Sufficient free space per page helps on HOT (Heap Only Tuple) update
51 | 2. **Adjust the vacuum settings per table**
52 | Please refer to the details at table level in the pg_gather report
53 | 3. **Reduce the number of indexes on the table**
54 | Reduce the number of indexes, especially getrid of unused and rarely used indexes. Indexes can prevent HOT updates. Please avoid indexing the column which is frequently updated.
55 | 4. **Have supplementary vacuum job scheduled on off-peak times**
56 | This ensures that the vacuum workers are free enough during the peak time to take care of the autovacuum of tables, which requires attention.
57 | Refer : https://github.com/jobinau/pgscripts/blob/main/vacuumjob.sql
58 |
59 |
60 |
--------------------------------------------------------------------------------
/generate_report.sh:
--------------------------------------------------------------------------------
1 | #!/bin/bash
2 | set -eo pipefail
3 |
4 | DOCKER_IMAGE=postgres:17 #Take one of the commonly used PG version above 16
5 |
6 | if [ -z "${1}" ]; then
7 | echo "USEAGE : generate_report.sh path/to/output.tsv [/path/to/report.html] [leave the docker container running? (y/n)]"
8 | echo "Example : generate_report.sh out.tsv report.html y"
9 | echo "(Output html file name and flag are optional)"
10 | exit 1
11 | fi
12 |
13 | GATHER_OUT="${1}" #First arg, the input file to be imported. (The "out.tsv" file)
14 | REPORT_OUT="${2:-${GATHER_OUT%.*}}" #Second arg (Optional) : if not specified, use the name from the input file (basename "$filename" | cut -d. -f1)
15 | [[ ! $REPORT_OUT == *.html ]] && REPORT_OUT="${REPORT_OUT}.html" #Append file extension ".html" if not specified already.
16 | KEEP_DOCKER="${3:-n}" #Third arg (Optional): Whether the container to be preserved after report generation (y/n)
17 | GATHERDIR="$(dirname "$(realpath "$0")")"
18 |
19 | if [ ! -f $GATHERDIR/gather_schema.sql ] || [ ! -f $GATHERDIR/gather_report.sql ]; then
20 | echo "gather_schema.sql and gather_report.sql weren't found; are you running from a cloned repo?"
21 | exit 1
22 | fi
23 |
24 | #--------------- Make sure that a PG container "pg_gather" is running. if required, create one------------------------
25 | if [ "$(docker ps -a -q -f name=pg_gather)" ]; then #Check wether a docker container "pg_gather" already exists
26 | if [ "$(docker ps -aq -f status=exited -f name=pg_gather)" ]; then #Container exists, But it is stopped/exited
27 | echo "Starting pg_gather container"
28 | CONTAINER_ID=$(docker start pg_gather) #Startup the container and get its container id
29 | sleep 3;
30 | else
31 | CONTAINER_ID=$(docker ps -aq -f status=running -f name=pg_gather) #If container is already running, just get the container id
32 | fi
33 | fi
34 |
35 | if [ -z "${CONTAINER_ID}" ]; then #If no relevant "pg_gather" container exists
36 | docker pull "${DOCKER_IMAGE}"
37 | CONTAINER_ID=$(docker run --name pg_gather -d -e POSTGRES_HOST_AUTH_METHOD=trust ${DOCKER_IMAGE}) #Create a container
38 | echo "Docker container is ${CONTAINER_ID}; will wait 3 seconds before proceeding"
39 | sleep 3;
40 | else
41 | echo "pg_gather container ${CONTAINER_ID} aleady running. Reusing it" #if container is already existing, just reuse that.
42 | fi
43 | #---------------------Container "pg_gather" is running by this time------------------------------------------
44 |
45 | #---------------------Import file to PostgreSQL and generate report------------------------------------------
46 | { cat $GATHERDIR/gather_schema.sql; cat ${GATHER_OUT}; } | docker exec -i --user postgres "${CONTAINER_ID}" psql -f - -c "ANALYZE"
47 | cat $GATHERDIR/gather_report.sql | docker exec -i --user postgres "${CONTAINER_ID}" sh -c "psql -X -f -" > "${REPORT_OUT}"
48 | #------------------------------------------------------------------------------------------------------------
49 |
50 | #----------------------Decide whether to keep the container or not-------------------------------------------
51 | if [ "n" = "${KEEP_DOCKER}" ]; then
52 | docker stop "${CONTAINER_ID}"
53 | docker rm "${CONTAINER_ID}"
54 | echo "Container ${CONTAINER_ID} deleted"
55 | else
56 | echo "Leaving the PG container : ${CONTAINER_ID} / \"pg_gather\" in running state"
57 | echo "You may connect the PG container: docker exec -it --user postgres pg_gather bash"
58 | fi
59 | #------------------------------------------------------------------------------------------------------------
60 |
61 | echo "Finished generating report in ${REPORT_OUT}"
62 |
--------------------------------------------------------------------------------
/docs/params/wal_compression.md:
--------------------------------------------------------------------------------
1 | # wal_compression
2 | Better WAL compression algorithms like `lz4` and `zstd` are supported by PostgreSQL 15 and above.
3 | Generally, Modern machines are not limited by CPU capacity when running the PostgreSQL database. Using the additional CPU capacity on the machine for better compression could be valuable
4 |
5 | ### Important points to remember :
6 | 1. There is **no absolute winner or looser in compression** alogirthms. Different algorithms would be suitable for different use cases, workloads and performance characterstics of machine hardware.
7 | 2. WAL Compression comes with a **cost of more CPU utilization**. It may be preferable to avoid WAL compression completely on systems which are highly CPU constrained, else it will have adverse effect.
8 | 3. WAL Compression is **selectable by each user session**. This give the flexibilty of changing the algorithm based on the workloads.
9 | For example, one might prefer high compression when doing a bulk dataloading, while an OLTP application connection might perfer to avoid any compresssion to improve the responsiveness.
10 | 4. Compression algorithms like lz4 removes the freespace within the page to give better compression. So the compression **depends on the FILLFACTOR**.
11 |
12 |
13 | ## How to test
14 | You may want to check how compression performance on a specific system
15 | ### Using pg_stat_wal
16 | ```
17 | --Prepare a table
18 | CREATE TABLE t AS SELECT generate_series(1,999999)a; VACUUM t;
19 |
20 | --Test the WAL compression one by one
21 | SET wal_compression= off;
22 | \set QUIET \\ \timing on \\ SET max_parallel_maintenance_workers=0; SELECT pg_stat_reset_shared('wal'); begin; CREATE INDEX ON t(a); rollback; SELECT * FROM pg_stat_wal;
23 |
24 | SET wal_compression=lz4;
25 | \set QUIET \\ \timing on \\ SET max_parallel_maintenance_workers=0; SELECT pg_stat_reset_shared('wal'); begin; CREATE INDEX ON t(a); rollback; SELECT * FROM pg_stat_wal;
26 |
27 | SET wal_compression=pglz;
28 | \set QUIET \\ \timing on \\ SET max_parallel_maintenance_workers=0; SELECT pg_stat_reset_shared('wal'); begin; CREATE INDEX ON t(a); rollback; SELECT * FROM pg_stat_wal;
29 | ```
30 | ** Perform the tests when there is sufficient load on the system to arraive at meaningful conclusions because it is CPU vs I/O choice
31 | ** Compare the `wal_bytes` numbers and Time from above tests.
32 | ### Using pg_waldump
33 | ```
34 | --Prepare a table
35 | CREATE TABLE t AS SELECT generate_series(1,999999)a; VACUUM t;
36 |
37 | SET wal_compression= off;
38 | \set QUIET \\ \timing on \\ select pg_switch_wal(); select pg_sleep(2); SET max_parallel_maintenance_workers=0; SELECT pg_stat_reset_shared('wal'); begin; CREATE INDEX ON t(a); rollback; SELECT pg_walfile_name(pg_current_wal_lsn()); SELECT * FROM pg_stat_wal
39 | ;select pg_sleep(2); SELECT pg_walfile_name(pg_current_wal_lsn());
40 |
41 | --Note down the walsegements generated (there could be multiple)
42 | --Check the FPIs in in each segments and add them
43 | pg_waldump 000000010000001800000061 -w -z
44 |
45 | --Repeat it for the compression alorithm
46 | SET wal_compression=lz4;
47 | \set QUIET \\ \timing on \\ select pg_switch_wal(); select pg_sleep(2); SET max_parallel_maintenance_workers=0; SELECT pg_stat_reset_shared('wal'); begin; CREATE INDEX ON t(a); rollback; SELECT pg_walfile_name(pg_current_wal_lsn()); SELECT * FROM pg_stat_wal
48 | ;select pg_sleep(2); SELECT pg_walfile_name(pg_current_wal_lsn());
49 |
50 | ```
51 |
52 | ## Additional References
53 | 1. [WAL Compression in PostgreSQL and Improvements in Version 15](https://www.percona.com/blog/wal-compression-in-postgresql-and-recent-improvements-in-version-15/)
54 | 2. [PostgreSQL Community Discussions](https://www.postgresql.org/message-id/flat/3037310D-ECB7-4BF1-AF20-01C10BB33A33%40yandex-team.ru)
55 | 3. [Code Commit](https://git.postgresql.org/gitweb/?p=postgresql.git;h=4035cd5d4)
56 |
57 |
58 |
--------------------------------------------------------------------------------
/docs/events/SUBTRANSSLRU.html:
--------------------------------------------------------------------------------
1 |
Lwlock:SubtransSLRU
2 | A process is waiting to access the Subtransaction Status Log (pg_subtrans). This corresponds to Control Lock (or mapping lock) of the pg_subtrans system - sub-transaction SLRU cache
3 | This structure tracks the parent-child relationship of subtransactions (created via SAVEPOINT or PL/pgSQL EXCEPTION blocks).
4 | This is almost always a sign of "Subtransaction Cache Overflow."
5 | It means active transactions have created so many subtransactions that PostgreSQL can no longer track them in fast,local memory and is forced to constantly read/write to this shared SLRU structure, creating a massive bottleneck.
6 | Subtransaction metadata, including parent transaction IDs and status, is stored in the pg_subtrans SLRU.
7 | It a disk-based structure that tracks subtransaction relationships.
8 | The SLRU (Simple Least Recently Used) is a caching mechanism in PostgreSQL for managing certain control data structures
9 | (like pg_subtrans, pg_clog, or pg_multixact). The SubtransSLRU specifically refers to the buffer used for subtransaction data.
10 |
11 |
Why it is happening (Root Causes to reach "Overflow" Cliff)
12 | The "Fast" Path (Normal): Each connection (backend) has a small private cache in memory (part of the PGPROC structure)
13 | that can hold up to 64 open subtransactions. When checking if a row is visible, PostgreSQL checks this local cache. It is near-instant.
14 | The "Slow" Path (Overflow):
15 | If a transaction opens the 65th subtransaction (via SAVEPOINT), it "overflows."
16 | PostgreSQL stops using the fast local cache and marks the transaction as "overflowed."
17 | When the Slow Path (Overflow) is triggered, Following things happens
18 | every other connection in the database that needs to check if your transaction is still running must go to the pg_subtrans SLRU (shared memory) to look it up.
19 | If you have high concurrency, thousands of queries suddenly start fighting for locks on these few SLRU pages (LWLock:SubtransSLRU), bringing the database to a crawl.
20 |
21 |
Common Problems
22 |
23 |
ORMs (Django/Hibernate): Some ORMs wrap every single row insertion in a SAVEPOINT to handle errors gracefully. If you bulk insert 1,000 rows this way, you trigger the overflow.
24 |
PL/pgSQL Exception Blocks: Using EXCEPTION blocks in PL/pgSQL functions creates subtransactions.
25 | If a function processes many rows and has an EXCEPTION block, it can easily overflow.
26 |
27 | FOR x IN 1..1000 LOOP
28 |   BEGIN
29 |     INSERT INTO ...;
30 |   EXCEPTION WHEN OTHERS THEN ... -- Implicit SAVEPOINT!
31 |   END;
32 | END LOOP;
33 |
34 |
35 |
36 |
37 |
38 |
Analysis
39 | From PostgreSQL 16 onwards we can findout the PID of the session causing the subtransaction and overflow using a query as follows:
40 |
41 | SELECT
42 |     pg_stat_get_backend_pid(bid) AS pid,
43 |     s.subxact_count,
44 |     s.subxact_overflowed,
45 |     pg_stat_get_backend_activity(bid) AS query
46 | FROM
47 |     pg_stat_get_backend_idset() AS bid
48 | JOIN LATERAL pg_stat_get_backend_subxact(bid) AS s ON TRUE
49 | WHERE s.subxact_count > 0 OR s.subxact_overflowed;
50 |
51 | SubtransSLRU may appear along with SubtransBuffer wait event.`SubtransBuffer` wait event, refers to waiting for in-memory subtransaction buffer in shared memory.
52 | Which means waiting for I/O
53 |
54 |
Fixes
55 |
56 |
Avoid ORMs that create excessive SAVEPOINTs. Use bulk operations without many SAVEPOINTs. Do not use SAVEPOINT (or atomic() in Python) inside a loop. Move the transaction block outside the loop.
57 |
Avoid PL/pgSQL EXCEPTION blocks inside loops that process many rows.
--------------------------------------------------------------------------------
/docs/oldversions.md:
--------------------------------------------------------------------------------
1 | # pg_gather (pgGather) support for old PostgreSQL versions.
2 | pg_gather mainly targets the use for PostgreSQL versions 10 onwards.
3 | But still it is possible to collect and analyze data from older versions. This page covers the special attentions required if PostgreSQL version is older than 10
4 |
5 | ## Challenge
6 | The amount of information available from views like `pg_stat_activity` is significantly changed over versions. Ensuring backward compatibility with PostgreSQL version 9.6 and older, without sacrificing features is a tough task. Another challenge is that `psql` utility of older versions don't have sufficient feautre for data collection without causing any additional overhead and complexity.
7 |
8 | However, The project is striving hard to ensure the minimum support for older versions.
9 |
10 | ## Errors while collecting data
11 | Please expect error messages while collecting the data. This is because old versions don't have many features, performance views, columns etc which the script is looking for. However, `pg_gather` is envisioned to handle failure scenarios, collect the possible data, and perform analysis on what is available.
12 | So you may just ignore the error messages and proceed.
13 |
14 |
15 | ## How to handle Errors while importing data.
16 | Due to missing features in old `psql` versions, there could be multiple lines as follows in the output file (The out.txt where the data is collected)
17 | ```
18 | COPY pg_get_activity (datid, pid ,usesysid ,application_name ,state ,query ,wait_event_type ,wait_event ,xact_start ,query_start ,backend_start ,state_change ,client_addr, client_hostname, client_port, backend_xid ,backend_xmin, backend_type,ssl ,sslversion ,sslcipher ,sslbits ,ssl_client_dn ,ssl_client_serial,ssl_issuer_dn ,gss_auth ,gss_princ ,gss_enc,leader_pid,query_id) FROM stdin;
19 | COPY pg_get_activity (datid, pid ,usesysid ,application_name ,state ,query ,wait_event_type ,wait_event ,xact_start ,query_start ,backend_start ,state_change ,client_addr, client_hostname, client_port, backend_xid ,backend_xmin, backend_type,ssl ,sslversion ,sslcipher ,sslbits ,sslcompression ,ssl_client_dn ,ssl_client_serial,ssl_issuer_dn ,gss_auth ,gss_princ ,gss_enc,leader_pid) FROM stdin;
20 | COPY pg_get_activity (datid, pid ,usesysid ,application_name ,state ,query ,wait_event_type ,wait_event ,xact_start ,query_start ,backend_start ,state_change ,client_addr, client_hostname, client_port, backend_xid ,backend_xmin, backend_type,ssl ,sslversion ,sslcipher ,sslbits ,sslcompression ,ssl_client_dn ,ssl_client_serial,ssl_issuer_dn ,gss_auth ,gss_princ ,gss_enc) FROM stdin;
21 | COPY pg_get_activity (datid, pid ,usesysid ,application_name ,state ,query ,wait_event_type ,wait_event ,xact_start ,query_start ,backend_start ,state_change ,client_addr, client_hostname, client_port, backend_xid ,backend_xmin, backend_type,ssl ,sslversion ,sslcipher ,sslbits ,sslcompression ,ssl_client_dn ) FROM stdin;
22 | ```
23 | These duplicate lines, which are not relevant for the old versions, can cause errors while importing the data.
24 | All these duplicate lines (multiple lines) need to be replaced with a single line according to the data available for the particular PG version. Following are the samples for few PG versions
25 | #### PostgreSQL 9.6
26 | ```
27 | COPY pg_get_activity (datid,pid,usesysid,application_name,state,query,wait_event_type,wait_event,xact_start,query_start,backend_start,state_change,client_addr,client_hostname,client_port,backend_xid,backend_xmin,ssl,sslversion,sslcipher,sslbits,sslcompression,ssl_client_dn ) FROM stdin;
28 | ```
29 | #### PostgreSQL 9.5
30 | ```
31 | COPY pg_get_activity (datid,pid,usesysid,application_name,state,query,wait_event_type,xact_start,query_start,backend_start,state_change,client_addr,client_hostname,client_port,backend_xid,backend_xmin,ssl,sslversion,sslcipher,sslbits,sslcompression,ssl_client_dn ) FROM stdin;
32 | ```
33 | #### PostgreSQL 9.2
34 | ```
35 | COPY pg_get_activity (datid,pid,usesysid,application_name,state,query,wait_event_type,xact_start,query_start,backend_start,state_change,client_addr,client_hostname,client_port ) FROM stdin;
36 | ```
37 | ## Additional note
38 | if you are using a specific version of PG, you may please use a query as follows to understand the columns involved
39 | ```
40 | select * from pg_stat_get_activity(NULL) limit 0;
41 | ```
42 | Additional contributions are welcome, and please raise [issue](https://github.com/jobinau/pg_gather/issues) if something is not working.
43 |
--------------------------------------------------------------------------------
/docs/tableinfo.md:
--------------------------------------------------------------------------------
1 | # Table Level Informations as a Single Query
2 |
3 | Extract the table level information displayed in the HTML report using custom queries. Please conside using the following template SQL for it. You may comment out unwanted fields.
4 |
5 | ```sql
6 | SELECT
7 | c.relname "Table", -- Table name
8 | r.relid, -- OID of the table
9 | n.nsname "Schema", -- Namespacename/Schema of the table
10 | CASE WHEN inh.inhrelid IS NOT NULL THEN ' Partition of ' || inhp.relname
11 | WHEN c.relkind != 'r' THEN ' (' ||c.relkind||')'
12 | ELSE 'Table (Regular)'
13 | END "Kind of Relation", -- Type/Kind of relation, other than regular table
14 | r.n_tup_ins, -- Number of inserted tuples from the last stats reset
15 | r.n_tup_upd, -- Number of updated tuples from the last stats reset
16 | r.n_tup_del, -- Number of deleted tuples from the last stats reset
17 | r.n_tup_hot_upd, -- Number of HOT updated tuples from the last stats reset
18 | isum.totind, -- Total number of indexes on the table
19 | isum.ind0scan, -- Number of indexes never scanned since last stats reset
20 | isum.pk, -- Number of primary key indexes on the table
21 | isum.uk, -- Number of unique indexes on the table
22 | inhp.relname AS parent_table, -- Parent table name if partition
23 | inhp.relkind AS parent_kind, -- Parent table kind if partition
24 | c.relfilenode, -- File node number
25 | c.reltablespace, -- Tablespace OID
26 | ts.tsname "Tablespace", -- Tablespace name
27 | c.reloptions, -- Relation level options specified
28 | CASE WHEN r.blks > 999 AND r.blks > tb.est_pages THEN (r.blks-tb.est_pages)*100/r.blks
29 | ELSE NULL
30 | END "Bloat%", --Approximate Bloat on the table
31 | r.n_live_tup "Live", -- Number of live tuples in the table
32 | r.n_dead_tup "Dead", -- Number of dead tuples in the table
33 | CASE WHEN r.n_live_tup <> 0 THEN Round((r.n_dead_tup::real/r.n_live_tup::real)::numeric,1) END "Dead/Live", -- Ratio of dead to live tuples
34 | r.rel_size "Rel size",-- Size of the table (without toast) in bytes
35 | r.tot_tab_size "Tot.Tab size", -- Size of the table (including toast) in bytes
36 | r.tab_ind_size "Tab+Ind size", --Size of the table (including toast and indexes) in bytes
37 | r.rel_age "Rel. Age", -- Age of the table in transaction ids
38 | To_char(r.last_vac,'YYYY-MM-DD HH24:MI:SS') "Last vacuum", -- Last vacuum date
39 | To_char(r.last_anlyze,'YYYY-MM-DD HH24:MI:SS') "Last analyze", -- Last analyze date
40 | r.vac_nos "Vaccs", -- Number of times the table has been vacuumed since last
41 | ct.relname "Toast name", --Name of the TOAST table associated
42 | rt.tab_ind_size "Toast + Ind" , -- Size of the TOAST table (including indexes) in bytes
43 | rt.rel_age "Toast Age", -- Age of the TOAST table in transaction ids
44 | Greatest(r.rel_age,rt.rel_age) "Max age", -- Maximum Age we need to consider of the table with the TOAST table, in transaction ids
45 | c.blocks_fetched "Fetch", -- Number of block fetches from the table, since the last stats reset
46 | c.blocks_hit*100/NULLIF(c.blocks_fetched,0) "C.Hit%", --Cache hit percentage of the table
47 | To_char(r.lastuse,'YYYY-MM-DD HH24:MI:SS') "Last Use" -- When was the table used for the last time
48 | FROM pg_get_rel r
49 | JOIN pg_get_class c ON r.relid = c.reloid AND c.relkind NOT IN ('t','p')
50 | LEFT JOIN pg_get_toast t ON r.relid = t.relid
51 | LEFT JOIN pg_get_class ct ON t.toastid = ct.reloid
52 | LEFT JOIN pg_get_rel rt ON rt.relid = t.toastid
53 | LEFT JOIN pg_tab_bloat tb ON r.relid = tb.table_oid
54 | LEFT JOIN pg_get_inherits inh ON r.relid = inh.inhrelid
55 | LEFT JOIN pg_get_class inhp ON inh.inhparent = inhp.reloid
56 | LEFT JOIN pg_get_ns n ON r.relnamespace = n.nsoid
57 | LEFT JOIN pg_get_tablespace ts ON c.reltablespace = ts.tsoid
58 | LEFT JOIN
59 | ( SELECT Count(indexrelid) totind,
60 | Count(indexrelid)filter( WHERE numscans=0 ) ind0scan,
61 | count(indexrelid) filter (WHERE indisprimary) pk,
62 | count(indexrelid) filter (WHERE indisunique) uk,
63 | indrelid
64 | FROM pg_get_index
65 | GROUP BY indrelid ) AS isum -- Index summary grouped by table
66 | ON isum.indrelid = r.relid
67 | ORDER BY r.tab_ind_size DESC limit 10;
68 | ```
--------------------------------------------------------------------------------
/docs/History_Objectives_FAQ.md:
--------------------------------------------------------------------------------
1 | # pg_gather Project
2 |
3 | # History
4 | In 2019, The author of the project @jobinau, decided to convert all his scripts, which he accumulated over decades working with PostgreSQL into a single script/tool, So that it will be beneficial for every novice users and DBAs of PostgreSQL.
5 | Since it was a personal project, Initial couple of versions were purely private/personal and not available in Github. The work remained private/presonal for 1 more year. Later decided opensource it under PostgreSQL licence. In Jan 19, 2021, The Public Github project was created and code was published : https://github.com/jobinau/pg_gather/commit/1b7ccfc5222601adc2f3d27341db87cb780a4098
6 | Every release there after is public : https://github.com/jobinau/pg_gather/releases
7 |
8 | ## Objective 1. Clarity and auditability on what is collected
9 |
10 | Solution : Data collection need to be performed using simple SQL statements, preferably without any joins. SQL statements with complex joins are avoided wherever possible to improve the readability.
11 | User will be able to execute individual SQL statement and analyze what it collects.
12 |
13 | ## Objective 2. Avoid any observable load on the target database.
14 |
15 | Solution : Complex join / sort operations on the target database during the data collection can cause sudden spikes of load and cause further damange if the data is collected for any performance incident. Avoid it completely.
16 | Collect only the very essential data
17 | Offload the join/sort operation to different system where the data is analyzed.
18 | Thorughly test the load created by data collection before each release,
19 |
20 | ## Objective 3. Simplify data storage and transmission
21 |
22 | Solution : Use TSV as the standard format to store the data collected. This gives excellent compression. Typical data collection can be stored in kilobytes.
23 | A simplified, compressed storage is important for continuous, repeated data collection.
24 | Moreover that makes it easy to transmit over mediums like email attachement easily.
25 | Every on-going development must make sure to collect only the minimum data as possible and store it in most effecient format feasible.
26 |
27 | ## Objective 4. Perform complex data analytics on the data collected.
28 |
29 | Solution : Import the collected into a a dedicated database and perform all complex data analytics. Modern SQL langaguage, Especially with latest reases of PostgreSQL as an analytical tool is very powerful, liverage it for performing data analyitics. As of writing this documentation, SQL features of PostgreSQL 14 or above is required.
30 |
31 | ## Objective 5. Run anywhere, Any OS, Processor Architecture, and use any authentication.
32 |
33 | Solution : Use `psql` - the commandline client of PostgreSQL as the platfrom. It is available in almost all Operating systems, architectures. It also support every possible authentication mechanism wich PostgreSQL support.
34 |
35 | ## Objective 6. Support every PostgreSQL versions which are currently supported
36 | Solution : Version detection is part of the data collection and the script changes the SQL statements according to the PostgreSQL version.
37 |
38 | ## Objective 7. Support Partial data collection
39 | Analytical queries are designed and tested to support collection of partial data. The project accepts that the data collection could be challenging in few enviroments and it may fail due to issues like permission.
40 |
41 | ## Objective 8 : Zero tolerance to bugs
42 |
43 |
44 |
45 | # FAQ
46 |
47 | ## Why to separate the data analytics to a different Instance? why we can't perform on the taget database?
48 | Ans : Complex queries with many Joins and Sort operations causes load on the target database. This is crutial when we are analyzing degraded performance cases. if we can more this analytical part and report generation to a seperate system, we can avoid causing any observable load by data collection.
49 | Another reason is Objective 4. The Modern SQL language, which is used for analytical work will be available only on new versions of PostgreSQL. Seperation of data collection and data analysis makes it possible to collect the data from older versions and perform analysis on a new version of PostgreSQL
50 |
51 | ## Why to store the collected data in TSV format
52 | Ans : TSV is the standard format used in PostgreSQL. The format of `pg_dump` and `COPY` commands are TSV. TSV allows the users to audit the data, If required mask the data using UNIX tools like `sed`. Moreover TSV gies good compression.
53 | The compressed storage is important for continuous data collection and trasmission.
54 | TSV facilitate the data loading to other systems / different database technologies if required.
55 |
56 |
57 |
58 |
--------------------------------------------------------------------------------
/docs/extensions.md:
--------------------------------------------------------------------------------
1 | # Over use of Extensions
2 |
3 | The benefits of extensions are highlighted and discussed more, while all adverse effects are ignored. Most users remain unaware of the cons, limitations, and consequences until they are hurt.
4 | Extensions have implications on performance, administrative/management overhead, the possibility of misconfigurations, and security and availability.
5 |
6 | ## Negative effects often reported:
7 | The following are some commonly reported areas of trouble, which one should be aware of when using too many extensions.
8 |
9 | * **PostgreSQL may fail to start**:
10 | Extensions can cause database unavailability if there are permission problems, corrupt library files, failing dependencies, library path problems, etc.
11 | For example:
12 | ```
13 | FATAL: could not load library "/usr/pgsql-15/lib/pg_xxxxxxx.so": /usr/pgsql-15/lib/pg_xxxxxxx.so: cannot read file data
14 | ```
15 | *An increase in startup time is also reported in some cases.
16 | * **Implications on High Availablity:**
17 | Automatic failover or switchover might be affected if libraries or extensions are missing on the candidate node. The DBA has the increased responsibility of keeping all candidate machines installed and configured with the same extensions and a similar configuration.
18 |
19 | * **Slow connections:**
20 | Forking new backend processes becomes more costly as they inherit the preloaded libraries.
21 |
22 | * **Memory Usage:**
23 | Libraries loaded using `shared_preload_libraries` remain resident in memory for all server processes, increasing the base memory footprint. Affects the instruction cache.
24 | Some extensions allocate memory (in-memory ring buffer) in shared buffers to hold all the data they need.
25 |
26 | * **CPU Usage :**
27 | Additional code to execute causes more CPU usage.
28 | Some extensions even launch additional background processes also.
29 |
30 | * **Conflict between extensions:**
31 | This happens because extensions are developed by isolated groups of people and seldom tested with all other extensions.
32 |
33 | * **Quality:**
34 | Unlike PostgreSQL, Extensions other than contrib modules are developed and maintained by small sets of indviduals, with limited very limited user bases, code auditing and reviews and QA. Obviously they more prone to more bugs.
35 |
36 | * **Stability/Availability:**
37 | Many incidents were reported about Bugs and other run-time problems of extensions, causing database outages (hangs and crashes). If an extension crashes, the session also crashes. PostgreSQL has no option but to restart.
38 |
39 | * **PG Version Upgrade**
40 | Extensions are a frequent cause of trouble during version upgrades. DBA Need to be well aware of the extensions and their implications, much before any attempts for upgrades
41 |
42 | * **Dependancy on other libraries:**
43 | Some of the extensions are developed using third-party libraries which need to be present in the system. Missing libraries and version conflicts are reported.
44 |
45 | * **Security issues:**
46 | Extensions have access to data and can cause vulnerabilities and security issues. Extensions which link to external libraries or use the network are considered more risky.
47 |
48 | * **Tarball installations and immutable images**:
49 | Maintaining extensions on portable binary installations and immutable images are big challange. Because there won't be any help from package managers to ensure the integrity. Frequent problems are reported.
50 |
51 | * **Extension version incompatibility**:
52 | Extensions are versioned separately, differently and released differently than PostgreSQL. It becomes an additional responsibility for DBAs to keep the extensions updated, ensuring compatibility.
53 |
54 | * **Backup & Restore**
55 | Information about Extensions and versions used in each environment needs to be maintained, which is important for restoring the database to a new machine in an emergency. The new machine needs to have compatible binaries/packages of extensions installed.
56 |
57 | ## Sample Benchmarks for performance implications:
58 | Even the widely used extensions like `pg_stat_statements` are reported to cause severe performance degradation on specific workloads. For example:
59 | [How pg_stat_statements Causes High-concurrency Performance Issues](https://www.alibabacloud.com/blog/postgresql-v12-how-pg-stat-statements-causes-high-concurrency-performance-issues_597790)
60 | [pg_stat_statement can cause significant degradation for fast SELECT workload](https://www.linkedin.com/posts/samokhvalov_postgresql-activity-7211431755403210752-bUNx/)
61 | Proper independent benchmarking of extensions are rarely done.
62 |
63 | ## Suggesions/Recomendations.
64 | * Avoid those extensions which are not very widely used, as they may introduce a bigger risk
65 | * Extensions require more knowledge from DBAs. Ensure that experts are available who are knowledgeable about each extension before it is used.
66 | * Be aware of the overhead, stability & availability issues, and security issues the extensions can cause.
67 | * Use extensions wherever and whenever it is unavoidable for business purposes.
68 | * Periodically check the usage of extensions and DROP the extension whenever not in use and add it back when needed.
69 |
70 |
--------------------------------------------------------------------------------
/docs/continuous_collection.md:
--------------------------------------------------------------------------------
1 | # Continuous Data collection
2 |
3 | Continuous data collection can be an excellent solution for some of the use-cases as follows
4 |
5 | 1. Simple Monitoring
6 | Implement simple monitoring when sophisticated, dedicated monitoring tools are not available or not feasible due to various reasons like security policies, resources, etc.
7 | 2. Capturing an event which happens rarely
8 | Continuous capture of wait events can reveal many details about the system. It is a proven technique for capturing rare events.
9 | 3. Load pattern study.
10 |
11 |
12 | When connected to the `template1` database, the `gather.sql` script switches to a lightweight mode and skips the collection of many of the datapoints including object-specific information. It collects only live, dynamic, performance-related information. This is called a **partial** gathering and it can be further compressed with gzip to reduce the size significantly.
13 |
14 | ## Data collection
15 |
16 | ## Using cron job
17 | A job can be scheduled to run `gather.sql` to run every minute against the "template1" database and collect the output files into a directory.
18 | Following is an example for scheduling in Linux/Unix systems using `cron`.
19 | ```
20 | * * * * * psql -U postgres -d template1 -X -f /path/to/gather.sql | gzip > /path/to/out/out-`date +\%a-\%H.\%M`.txt.gz 2>&1
21 | ```
22 |
23 |
24 | ## Using simple shell loop.
25 | if there is any important event which need to be monitored. A simple shell loop should be good enough
26 | ```
27 | for i in {1..10}
28 | do
29 | psql -U postgres -d template1 -X -f ~/pg_gather/gather.sql | gzip > /tmp/out-`date +\%a-\%H.\%M.\%S`.txt.gz 2>&1
30 | done
31 | ```
32 |
33 | # Importing the data of a continuous collection
34 |
35 | A separate schema (`history`) can hold the imported data.
36 | A script file with the name [`history_schema.sql`](../history_schema.sql) is provided for creating this schema and objects.
37 | ```
38 | psql -X -f history_schema.sql
39 | ```
40 | A Bash script [`imphistory.sh`](../imphistory.sh) is provided, which automates importing partial data from multiple files into the tables in `history` schema. This script can be executed from the directory which contains all the output files. Multiiple files and Wild cards are allowed. Here is an example:
41 | ```
42 | $ imphistory.sh out-*.gz > log.txt
43 | ```
44 |
45 | # Analysis
46 |
47 | ## High level summary
48 |
49 | ```
50 | SELECT COALESCE(wait_event,'CPU') "Event", count(*) FROM history.pg_pid_wait
51 | WHERE wait_event IS NULL OR wait_event NOT IN ('ArchiverMain','AutoVacuumMain','BgWriterHibernate','BgWriterMain','CheckpointerMain','LogicalApplyMain','LogicalLauncherMain','RecoveryWalStream','SysLoggerMain','WalReceiverMain','WalSenderMain','WalWriterMain','CheckpointWriteDelay','PgSleep','VacuumDelay')
52 | GROUP BY 1 ORDER BY count(*) DESC;
53 | ```
54 |
55 | ## Wait events in the order of time
56 |
57 | ```
58 | SELECT collect_ts,COALESCE(wait_event,'CPU') "Event", count(*) FROM history.pg_pid_wait
59 | WHERE wait_event IS NULL OR wait_event NOT IN ('ArchiverMain','AutoVacuumMain','BgWriterHibernate','BgWriterMain','CheckpointerMain','LogicalApplyMain','LogicalLauncherMain','RecoveryWalStream','SysLoggerMain','WalReceiverMain','WalSenderMain','WalWriterMain','CheckpointWriteDelay','PgSleep','VacuumDelay')
60 | GROUP BY 1,2 ORDER BY 1,2 DESC;
61 | ```
62 |
63 | # Crosstab report
64 | Crosstab reports of waitevents over a time can provide more insight into the way waitevents are changing with time.
65 | The crosstab SQL requires the `tablefunc` extension to be created on the database where we are doing the data analysis. This extension (`tablefunc`) is part of PostgreSQL contrib modules.
66 | ```
67 | CREATE EXTENSION IF NOT EXISTS tablefunc;
68 | ```
69 | A sample [crosstab SQL is provided](crosstab.sql) using which a CSV file can be generated like :
70 | ```
71 | psql --csv -f crosstab.sql > crosstab.csv
72 | ```
73 | Dynamic graphs can be prepared out of this CSV data which could provide a high level ivew. A simple, sample graphing page is provided here: https://jobinau.github.io/pg_gather/dygraphs/graph.html
74 |
75 | ## FAQ
76 | ## Will the continuous data collection impact the server performance?
77 | The code for data collection went for multiple rounds of optimization effort over last few years. It is expected to take least server resource.
78 | On test enviroments, Typically 4-5% of single CPU core is observed.
79 | In a multi-core server, this overhead becomes negligable and almost invisible
80 | ```
81 | PID USER PR NI VIRT RES SHR S %CPU %MEM TIME+ COMMAND
82 | 14316 postgres 20 0 225812 29052 24704 S 3.6 0.1 0:00.59 postgres: 14/main: postgres template1 127.0.0.1(39142) EXECUTE
83 | 14313 jobin 20 0 25452 13312 11136 S 1.7 0.0 0:00.24 psql -U postgres -d template1 -X -f /home/jobin/pg_gather/gather.sql
84 | ```
85 | The collection happens over single database connection and it is expected to consume 10MB RAM.
86 | ## Is it possible to generate regular pg_gather report using a snapshot of partial data collection
87 | Yes, One of the main objective of the `pg_gather` projct is the capability to generate reports using available informaiton. Since it is part of the design principle, generating the report usign partial data collection is supported.
88 | If you find any issue, please report it as quick as possible in the [issues page](https://github.com/jobinau/pg_gather/issues)
89 |
--------------------------------------------------------------------------------
/docs/security.md:
--------------------------------------------------------------------------------
1 | # Data Security
2 | Data Security is an area of paramount importance when it comes to information collected for any reason. `pg_gather` is designed to address the security/data safety aspects from day one, and it is one of the project's primary objectives itself. Transparency is ensured for what is collected, transmitted and processed. The data collection script (`gather.sql`) is maintained as SQL only script to enhance the auditing requirements. A basic understanding of SQL is sufficient. No programming knowledge is required for auditing.
3 |
4 | `pg_gather` collects only minimal **system catalog**, **performance**, **current session activity** and **configuration/parameter** information which are essential for analysis. Data stored within the user-defined or application-defined tables or indexes are **Never** accessed or collected. Even from the performance and catalog views, bare minimal information is collected. Please consider the same minimalistic approach are submitting Patches / Pull requests.
5 |
6 | Please refer the "information collected" section of this document for understading th data points
7 |
8 | # Information masking
9 | Even though `pg_gather` collects only very minimal information from **system catalog**, **performance**, **current session activity** and **configuration/parameter**, One might want to mask more details, especially in a highly secured environment. Since the `pg_gather` uses the TSV (Tab Separated Value) format for the collected, any tool or editor with regular expression will be good for data masking/trimming before transmitting the data. Please, see the examples below. Please ensure that the "tab" characters, which are used as the separator, are preserved.
10 |
11 | ## 1. Masking SQL query statements from pg_stat_activity
12 | By default, PostgreSQL removes bind values from query string before it is displayed in views like `pg_stat_activity`. So there is no visibility of data by default. Still, a user may not want to give a complete query string. Following is an example of truncating a query string to 50 characters using the `sed` utility before handing over the output file for analysis.
13 | ```
14 | sed -i '
15 | /^COPY pg_get_activity (/, /^\\\./ {
16 | s/\(^[^\t]*\t[^\t]*\t[^\t]*\t[^\t]*\t[^\t]*\t[^\t]\{50\}\)[^\t]*\([\t.]*\)/\1\2/g
17 | }' out.txt
18 |
19 | ## OR using Extended regular expression (-r)
20 |
21 | sed -i -r '
22 | /^COPY pg_get_activity/, /^\\\./ {
23 | s/(([^\t]*\t){5}[^\t]{10})[^\t]*([\t.]*)/\1\2/
24 | }' out.txt
25 |
26 | ```
27 | ** Please remember that masking or trimming the query/statement will prevent us from understanding problematic queries and statements.
28 | You may refer to the following video explantion on how this works.
29 | https://youtu.be/uFb0_MsCZEc
30 |
31 | [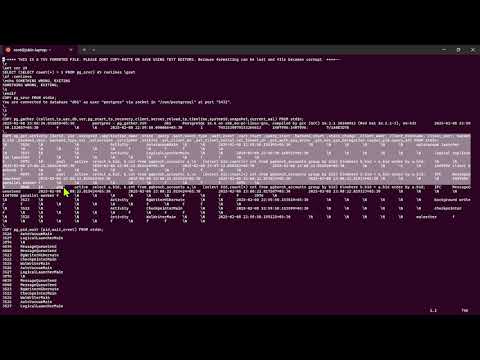](https://youtu.be/uFb0_MsCZEc)
32 |
33 | ## 2. Masking client IP addresses
34 | Any monitoring or analysis tool which accesses the `pg_stat_activity` for understanding the session activities can see the client IP addresses. Following sample `sed` command can be used for masking the part of the IP address, leaving only the last digit of the IPv4
35 | ```
36 | sed -r -i 's/([0-9]{1,3}\.){3}([0-9]{1,3})/0.0.0.\2/g' out.txt
37 | ```
38 | ** IP addresses or the clients connecting to PostgreSQL is essential to understand those clients who are abusive. IP addresses give vital information about application servers which has poor connection pooling. Masking the IP addresses can prevent such analysis.
39 |
40 | ## 3. Masking SQL statements from pg_stat_statements
41 | For removing all characters except first 50 characters, you may use sed expression like
42 | ```
43 | sed -i '
44 | /^COPY pg_get_statements (/, /^\\\./ {
45 | s/\(^[^\t]*\t[^\t]*\t[^\t]\{50\}\)[^\t]*\([\t.]*\)/\1\2/g
46 | }' out.txt
47 | ```
48 |
49 |
50 | ## Information collected (incomplete, work-in-progress)
51 |
52 | 1. The name of the database to which user is connected
53 | uses built-in function of PostgreSQL : `current_database()`
54 | 2. Version of PostgreSQL
55 | uses built-in function PostgreSQL : `version()`
56 | 3. Time of startup of PostgreSQL Instance
57 | uses built-in function PostgreSQL : `pg_postmaster_start_time()`
58 | 4. Check whether PostgreSQL is in recovery mode
59 | uses the built-in function PostgreSQL : `pg_is_in_recovery()`
60 | 5. IP address from the connection came
61 | uses the built-in function PostgreSQL : `inet_client_addr()`
62 | 6. IP address of the Database host
63 | uses the built-in function PostgreSQL : `inet_server_addr()`
64 | 7. Time of last reloading of parameter
65 | uses the built-in function PostgreSQL : `pg_conf_load_time()`
66 | 8. Current LSN Position
67 | uses the built-in function PostgreSQL : `pg_current_wal_lsn()` or `pg_last_wal_receive_lsn()`
68 | 9. Information about the session activity
69 | uses `select * from pg_stat_get_activity(NULL)` which is similar to `pg_stat_activity`
70 | 10. Wait-event sampling
71 | uses information from `pg_stat_activity`
72 | 11. Information from `pg_stat_statements`
73 | 12. Number of transaction commits in each database
74 | uses the built-in function `pg_stat_get_db_xact_commit()`
75 | 13. Number of transaction rollbacks in each database
76 | uses the built-in function `pg_stat_get_db_xact_rollback()`
77 | 14. Number of blocks fetched to memory for each database
78 | uses the built-in function `pg_stat_get_db_blocks_fetched()`
79 | 15. Number of pages in cache which is hit by query execution
80 | uses the built-in function `pg_stat_get_db_blocks_hit()`
81 | 16. Number of tuples/rows returned per database
82 | uses the built-in function `pg_stat_get_db_tuples_returned()`
83 | 17. Number of tuples fetched per database
84 | uses the built-in function `pg_stat_get_db_tuples_fetched()`
85 | 18. Number of tuples inserted per database
86 | `pg_stat_get_db_tuples_inserted()`
87 | 19. Number of tuples updated per database
88 | `pg_stat_get_db_tuples_updated()`
89 | 20. Number of tuples deleted per database
90 | `pg_stat_get_db_tuples_deleted()`
91 |
92 | ## Notes to users:
93 | Appreciate independent audits and feedback. You are welcome to report any concerns that arise out of audits.
94 |
--------------------------------------------------------------------------------
/history_schema.sql:
--------------------------------------------------------------------------------
1 | DROP SCHEMA IF EXISTS history CASCADE;
2 | CREATE SCHEMA IF NOT EXISTS history;
3 |
4 | CREATE UNLOGGED TABLE IF NOT EXISTS history.pg_gather (
5 | imp_ts timestamp with time zone DEFAULT CURRENT_TIMESTAMP,
6 | collect_ts timestamp with time zone,
7 | usr text,
8 | db text,
9 | ver text,
10 | pg_start_ts timestamp with time zone,
11 | recovery bool,
12 | client inet,
13 | server inet,
14 | reload_ts timestamp with time zone,
15 | timeline int,
16 | systemid bigint,
17 | snapshot pg_snapshot,
18 | current_wal pg_lsn
19 | );
20 |
21 |
22 | CREATE UNLOGGED TABLE IF NOT EXISTS history.pg_get_activity (
23 | collect_ts timestamp with time zone,
24 | datid oid,
25 | pid integer,
26 | usesysid oid,
27 | application_name text,
28 | state text,
29 | query text,
30 | wait_event_type text,
31 | wait_event text,
32 | xact_start timestamp with time zone,
33 | query_start timestamp with time zone,
34 | backend_start timestamp with time zone,
35 | state_change timestamp with time zone,
36 | client_addr inet,
37 | client_hostname text,
38 | client_port integer,
39 | backend_xid xid,
40 | backend_xmin xid,
41 | backend_type text,
42 | ssl boolean,
43 | sslversion text,
44 | sslcipher text,
45 | sslbits integer,
46 | sslcompression boolean,
47 | ssl_client_dn text,
48 | ssl_client_serial numeric,
49 | ssl_issuer_dn text,
50 | gss_auth boolean,
51 | gss_princ text,
52 | gss_enc boolean,
53 | gss_delegation boolean,
54 | leader_pid integer,
55 | query_id bigint
56 | );
57 |
58 | CREATE UNLOGGED TABLE history.pg_pid_wait(
59 | collect_ts timestamp with time zone,
60 | itr SERIAL,
61 | pid integer,
62 | wait_event text
63 | );
64 |
65 |
66 | CREATE UNLOGGED TABLE history.pg_get_db (
67 | collect_ts timestamp with time zone,
68 | datid oid,
69 | datname text,
70 | xact_commit bigint,
71 | xact_rollback bigint,
72 | blks_fetch bigint,
73 | blks_hit bigint,
74 | tup_returned bigint,
75 | tup_fetched bigint,
76 | tup_inserted bigint,
77 | tup_updated bigint,
78 | tup_deleted bigint,
79 | temp_files bigint,
80 | temp_bytes bigint,
81 | deadlocks bigint,
82 | blk_read_time double precision,
83 | blk_write_time double precision,
84 | db_size bigint,
85 | age integer,
86 | mxidage integer,
87 | stats_reset timestamp with time zone
88 | );
89 |
90 | CREATE UNLOGGED TABLE history.pg_get_block (
91 | collect_ts timestamp with time zone,
92 | blocked_pid integer,
93 | blocked_user text,
94 | blocked_client_addr text,
95 | blocked_client_hostname text,
96 | blocked_application_name text,
97 | blocked_wait_event_type text,
98 | blocked_wait_event text,
99 | blocked_statement text,
100 | blocked_xact_start timestamp with time zone,
101 | blocking_pid integer,
102 | blocking_user text,
103 | blocking_user_addr text,
104 | blocking_client_hostname text,
105 | blocking_application_name text,
106 | blocking_wait_event_type text,
107 | blocking_wait_event text,
108 | statement_in_blocking_process text,
109 | blocking_xact_start timestamp with time zone
110 | );
111 |
112 |
113 | CREATE UNLOGGED TABLE history.pg_get_pidblock(
114 | collect_ts timestamp with time zone,
115 | victim_pid int,
116 | blocking_pids int[]
117 | );
118 |
119 | CREATE UNLOGGED TABLE history.pg_replication_stat (
120 | collect_ts timestamp with time zone,
121 | usename text,
122 | client_addr text,
123 | client_hostname text,
124 | pid int,
125 | state text,
126 | sent_lsn pg_lsn,
127 | write_lsn pg_lsn,
128 | flush_lsn pg_lsn,
129 | replay_lsn pg_lsn,
130 | sync_state text
131 | );
132 |
133 | CREATE UNLOGGED TABLE history.pg_get_wal(
134 | collect_ts timestamp with time zone,
135 | wal_records bigint,
136 | wal_fpi bigint,
137 | wal_bytes numeric,
138 | wal_buffers_full bigint,
139 | wal_write bigint,
140 | wal_sync bigint,
141 | wal_write_time double precision,
142 | wal_sync_time double precision,
143 | stats_reset timestamp with time zone
144 | );
145 |
146 | CREATE UNLOGGED TABLE history.pg_get_io(
147 | collect_ts timestamp with time zone,
148 | btype char(1), -- 'background writer=G'
149 | obj char(1), -- 'bulkread=R, bulkwrite=W'
150 | context char(1),
151 | reads bigint,
152 | read_time float8,
153 | writes bigint,
154 | write_time float8,
155 | writebacks bigint,
156 | writeback_time float8,
157 | extends bigint,
158 | extend_time float8,
159 | op_bytes bigint,
160 | hits bigint,
161 | evictions bigint,
162 | reuses bigint,
163 | fsyncs bigint,
164 | fsync_time float8,
165 | stats_reset timestamptz
166 | );
167 |
168 | CREATE UNLOGGED TABLE history.pg_archiver_stat(
169 | collect_ts timestamp with time zone,
170 | archived_count bigint,
171 | last_archived_wal text,
172 | last_archived_time timestamp with time zone,
173 | last_failed_wal text,
174 | last_failed_time timestamp with time zone
175 | );
176 |
177 | CREATE UNLOGGED TABLE history.pg_get_bgwriter(
178 | collect_ts timestamp with time zone,
179 | checkpoints_timed bigint,
180 | checkpoints_req bigint,
181 | checkpoint_write_time double precision,
182 | checkpoint_sync_time double precision,
183 | buffers_checkpoint bigint,
184 | buffers_clean bigint,
185 | maxwritten_clean bigint,
186 | buffers_backend bigint,
187 | buffers_backend_fsync bigint,
188 | buffers_alloc bigint,
189 | stats_reset timestamp with time zone
190 | );
191 |
192 |
193 | CREATE UNLOGGED TABLE history.pg_get_slots(
194 | collect_ts timestamp with time zone,
195 | slot_name text,
196 | plugin text,
197 | slot_type text,
198 | datoid oid,
199 | temporary bool,
200 | active bool,
201 | active_pid int,
202 | old_xmin xid,
203 | catalog_xmin xid,
204 | restart_lsn pg_lsn,
205 | confirmed_flush_lsn pg_lsn
206 | );
207 |
208 | CREATE UNLOGGED TABLE history.pg_gather_end (
209 | collect_ts timestamp with time zone,
210 | end_ts timestamp with time zone,
211 | end_lsn pg_lsn,
212 | stmnt char
213 | );
--------------------------------------------------------------------------------
/docs/events/BGWORKERSHUTDOWN.html:
--------------------------------------------------------------------------------
1 |
IPC:BgWorkerShutdown
2 |
3 | This is part of Parallel query execution. There will be a main backend process and few worker processes.
4 | The IPC:BgWorkerShutdown wait event occurs when a main backend process is waiting for a background worker process to cleanly shut down and terminate.
5 |
6 |
Common Problems
7 |
Hanging Sessions
8 | When a main backend process is waiting for a background worker to shut down, it may lead to hanging sessions if the worker does not terminate as expected.
9 | This can occur due to various reasons such as resource contention, deadlocks, or bugs in the worker process.
10 | Sometimes the main backend process may become uninterruptible while waiting for the worker to shut down, making it difficult to terminate the session using pg_terminate_backend().
11 |
12 |
Investigation
13 |
Check whether workers are visible
14 | Mouseover the process id of the main backend process and check whether there are any worker processes associated with it.
15 | If there are no worker processes visibile, There is something wrong with the worker process.
16 |
Use top
17 | capture the top command output by repated execution
18 |
19 | $ sudo top -b -c -n 24 -d 5 > top
20 |
21 | grep the output for the main backend process id and check whether there are any worker processes associated with it.
22 |
52 | if the workers process is visible at OS level, but sleeping (Status 'S') and not consuming any CPU, Then there is something wrong with the worker process.
53 |
Check PostgreSQL logs
54 | Look for errors like "out of memory" "terminating background worker" "parallel worker failed to initialize" "lost connection to parallel worker" and "No space left on device"
55 | Following is an example
56 |
57 | $ grep -E 'ERROR:|FATAL:|PANIC:' postgres.log-20251104.txt | sed -E 's/.*(ERROR:|FATAL:|PANIC:)/\1/' | sort | uniq -c | sort -nr
58 | ---- ouptput truncated ----
59 |  243 ERROR:  out of memory
60 |   38 FATAL:  terminating background worker "parallel worker" due to administrator command
61 |   15 ERROR:  syntax error at or near ")" at character 3322
62 |   15 ERROR:  parallel worker failed to initialize
63 |    4 FATAL:  out of memory
64 |    2 FATAL:  terminating connection due to idle-session timeout
65 |    2 ERROR:  lost connection to parallel worker
66 |    2 ERROR:  could not resize shared memory segment "/PostgreSQL.1098917120" to 4194304 bytes: No space left on device
67 |    1 ERROR:  out of memory at character 25278
68 |
69 |
70 |
General suggessions
71 |
72 |
Essential Tuning
73 | Make sure that the parameters, especially the parallelism related parameters are properly tuned according to your system resources and workload.
74 | Avoid excessive parallelism which can lead to resource contention and instability.
75 |
76 |
Update PostgreSQL
77 | Ensure that you are running the latest stable version of PostgreSQL, as updates often include bug fixes and performance improvements related to parallel query execution.
78 | PostgreSQL minor versions will be updated in every 3 months. It is mandatory to keep your PostgreSQL minor version up to date for every compliance and security reason.
79 |
80 |
Carefull about extensions
81 | Extensions are the most frequent cause of instability in PostgreSQL, especially those that interact with query execution.
82 | Avoid using extensions that are not widely used or not well-maintained or have known issues with parallelism.
83 |
--------------------------------------------------------------------------------
/docs/waitevents.json:
--------------------------------------------------------------------------------
1 | [["ARCHIVERMAIN", "Activity"], ["AUTOVACUUMMAIN", "Activity"], ["BGWRITERHIBERNATE", "Activity"], ["BGWRITERMAIN", "Activity"], ["CHECKPOINTERMAIN", "Activity"], ["CPU", "CPU"], ["LOGICALAPPLYMAIN", "Activity"], ["LOGICALLAUNCHERMAIN", "Activity"], ["LOGICALPARALLELAPPLYMAIN", "Activity"], ["RECOVERYWALSTREAM", "Activity"], ["REPLICATIONSLOTSYNCMAIN", "Activity"], ["REPLICATIONSLOTSYNCSHUTDOWN", "Activity"], ["SYSLOGGERMAIN", "Activity"], ["WALRECEIVERMAIN", "Activity"], ["WALSENDERMAIN", "Activity"], ["WALSUMMARIZERWAL", "Activity"], ["WALWRITERMAIN", "Activity"], ["BUFFERPIN", "BufferPin"], ["CLIENTREAD", "Client"], ["CLIENTWRITE", "Client"], ["GSSOPENSERVER", "Client"], ["LIBPQWALRECEIVERCONNECT", "Client"], ["LIBPQWALRECEIVERRECEIVE", "Client"], ["SSLOPENSERVER", "Client"], ["WAITFORSTANDBYCONFIRMATION", "Client"], ["WALSENDERWAITFORWAL", "Client"], ["WALSENDERWRITEDATA", "Client"], ["EXTENSION", "Extension"], ["BASEBACKUPREAD", "IO"], ["BASEBACKUPSYNC", "IO"], ["BASEBACKUPWRITE", "IO"], ["BUFFILEREAD", "IO"], ["BUFFILETRUNCATE", "IO"], ["BUFFILEWRITE", "IO"], ["CONTROLFILEREAD", "IO"], ["CONTROLFILESYNC", "IO"], ["CONTROLFILESYNCUPDATE", "IO"], ["CONTROLFILEWRITE", "IO"], ["CONTROLFILEWRITEUPDATE", "IO"], ["COPYFILEREAD", "IO"], ["COPYFILEWRITE", "IO"], ["DATAFILEEXTEND", "IO"], ["DATAFILEFLUSH", "IO"], ["DATAFILEIMMEDIATESYNC", "IO"], ["DATAFILEPREFETCH", "IO"], ["DATAFILEREAD", "IO"], ["DATAFILESYNC", "IO"], ["DATAFILETRUNCATE", "IO"], ["DATAFILEWRITE", "IO"], ["DSMALLOCATE", "IO"], ["DSMFILLZEROWRITE", "IO"], ["LOCKFILEADDTODATADIRREAD", "IO"], ["LOCKFILEADDTODATADIRSYNC", "IO"], ["LOCKFILEADDTODATADIRWRITE", "IO"], ["LOCKFILECREATEREAD", "IO"], ["LOCKFILECREATESYNC", "IO"], ["LOCKFILECREATEWRITE", "IO"], ["LOCKFILERECHECKDATADIRREAD", "IO"], ["LOGICALREWRITECHECKPOINTSYNC", "IO"], ["LOGICALREWRITEMAPPINGSYNC", "IO"], ["LOGICALREWRITEMAPPINGWRITE", "IO"], ["LOGICALREWRITESYNC", "IO"], ["LOGICALREWRITETRUNCATE", "IO"], ["LOGICALREWRITEWRITE", "IO"], ["RELATIONMAPREAD", "IO"], ["RELATIONMAPREPLACE", "IO"], ["RELATIONMAPWRITE", "IO"], ["REORDERBUFFERREAD", "IO"], ["REORDERBUFFERWRITE", "IO"], ["REORDERLOGICALMAPPINGREAD", "IO"], ["REPLICATIONSLOTREAD", "IO"], ["REPLICATIONSLOTRESTORESYNC", "IO"], ["REPLICATIONSLOTSYNC", "IO"], ["REPLICATIONSLOTWRITE", "IO"], ["SLRUFLUSHSYNC", "IO"], ["SLRUREAD", "IO"], ["SLRUSYNC", "IO"], ["SLRUWRITE", "IO"], ["SNAPBUILDREAD", "IO"], ["SNAPBUILDSYNC", "IO"], ["SNAPBUILDWRITE", "IO"], ["TIMELINEHISTORYFILESYNC", "IO"], ["TIMELINEHISTORYFILEWRITE", "IO"], ["TIMELINEHISTORYREAD", "IO"], ["TIMELINEHISTORYSYNC", "IO"], ["TIMELINEHISTORYWRITE", "IO"], ["TWOPHASEFILEREAD", "IO"], ["TWOPHASEFILESYNC", "IO"], ["TWOPHASEFILEWRITE", "IO"], ["VERSIONFILESYNC", "IO"], ["VERSIONFILEWRITE", "IO"], ["WALSENDERTIMELINEHISTORYREAD", "IO"], ["WALBOOTSTRAPSYNC", "IO"], ["WALBOOTSTRAPWRITE", "IO"], ["WALCOPYREAD", "IO"], ["WALCOPYSYNC", "IO"], ["WALCOPYWRITE", "IO"], ["WALINITSYNC", "IO"], ["WALINITWRITE", "IO"], ["WALREAD", "IO"], ["WALSUMMARYREAD", "IO"], ["WALSUMMARYWRITE", "IO"], ["WALSYNC", "IO"], ["WALSYNCMETHODASSIGN", "IO"], ["WALWRITE", "IO"], ["APPENDREADY", "IPC"], ["ARCHIVECLEANUPCOMMAND", "IPC"], ["ARCHIVECOMMAND", "IPC"], ["BACKENDTERMINATION", "IPC"], ["BACKUPWAITWALARCHIVE", "IPC"], ["BGWORKERSHUTDOWN", "IPC"], ["BGWORKERSTARTUP", "IPC"], ["BTREEPAGE", "IPC"], ["BUFFERIO", "IPC"], ["CHECKPOINTDELAYCOMPLETE", "IPC"], ["CHECKPOINTDELAYSTART", "IPC"], ["CHECKPOINTDONE", "IPC"], ["CHECKPOINTSTART", "IPC"], ["EXECUTEGATHER", "IPC"], ["HASHBATCHALLOCATE", "IPC"], ["HASHBATCHELECT", "IPC"], ["HASHBATCHLOAD", "IPC"], ["HASHBUILDALLOCATE", "IPC"], ["HASHBUILDELECT", "IPC"], ["HASHBUILDHASHINNER", "IPC"], ["HASHBUILDHASHOUTER", "IPC"], ["HASHGROWBATCHESDECIDE", "IPC"], ["HASHGROWBATCHESELECT", "IPC"], ["HASHGROWBATCHESFINISH", "IPC"], ["HASHGROWBATCHESREALLOCATE", "IPC"], ["HASHGROWBATCHESREPARTITION", "IPC"], ["HASHGROWBUCKETSELECT", "IPC"], ["HASHGROWBUCKETSREALLOCATE", "IPC"], ["HASHGROWBUCKETSREINSERT", "IPC"], ["LOGICALAPPLYSENDDATA", "IPC"], ["LOGICALPARALLELAPPLYSTATECHANGE", "IPC"], ["LOGICALSYNCDATA", "IPC"], ["LOGICALSYNCSTATECHANGE", "IPC"], ["MESSAGEQUEUEINTERNAL", "IPC"], ["MESSAGEQUEUEPUTMESSAGE", "IPC"], ["MESSAGEQUEUERECEIVE", "IPC"], ["MESSAGEQUEUESEND", "IPC"], ["MULTIXACTCREATION", "IPC"], ["PARALLELBITMAPSCAN", "IPC"], ["PARALLELCREATEINDEXSCAN", "IPC"], ["PARALLELFINISH", "IPC"], ["PROCARRAYGROUPUPDATE", "IPC"], ["PROCSIGNALBARRIER", "IPC"], ["PROMOTE", "IPC"], ["RECOVERYCONFLICTSNAPSHOT", "IPC"], ["RECOVERYCONFLICTTABLESPACE", "IPC"], ["RECOVERYENDCOMMAND", "IPC"], ["RECOVERYPAUSE", "IPC"], ["REPLICATIONORIGINDROP", "IPC"], ["REPLICATIONSLOTDROP", "IPC"], ["RESTORECOMMAND", "IPC"], ["SAFESNAPSHOT", "IPC"], ["SYNCREP", "IPC"], ["WALRECEIVEREXIT", "IPC"], ["WALRECEIVERWAITSTART", "IPC"], ["WALSUMMARYREADY", "IPC"], ["XACTGROUPUPDATE", "IPC"], ["ADVISORY", "Lock"], ["APPLYTRANSACTION", "Lock"], ["EXTEND", "Lock"], ["FROZENID", "Lock"], ["OBJECT", "Lock"], ["PAGE", "Lock"], ["RELATION", "Lock"], ["SPECTOKEN", "Lock"], ["TRANSACTIONID", "Lock"], ["TUPLE", "Lock"], ["USERLOCK", "Lock"], ["VIRTUALXID", "Lock"], ["ADDINSHMEMINIT", "LWLock"], ["AUTOFILE", "LWLock"], ["AUTOVACUUM", "LWLock"], ["AUTOVACUUMSCHEDULE", "LWLock"], ["BACKGROUNDWORKER", "LWLock"], ["BTREEVACUUM", "LWLock"], ["BUFFERCONTENT", "LWLock"], ["BUFFERMAPPING", "LWLock"], ["CHECKPOINTERCOMM", "LWLock"], ["COMMITTS", "LWLock"], ["COMMITTSBUFFER", "LWLock"], ["COMMITTSSLRU", "LWLock"], ["CONTROLFILE", "LWLock"], ["DSMREGISTRY", "LWLock"], ["DSMREGISTRYDSA", "LWLock"], ["DSMREGISTRYHASH", "LWLock"], ["DYNAMICSHAREDMEMORYCONTROL", "LWLock"], ["INJECTIONPOINT", "LWLock"], ["LOCKFASTPATH", "LWLock"], ["LOCKMANAGER", "LWLock"], ["LOGICALREPLAUNCHERDSA", "LWLock"], ["LOGICALREPLAUNCHERHASH", "LWLock"], ["LOGICALREPWORKER", "LWLock"], ["MULTIXACTGEN", "LWLock"], ["MULTIXACTMEMBERBUFFER", "LWLock"], ["MULTIXACTMEMBERSLRU", "LWLock"], ["MULTIXACTOFFSETBUFFER", "LWLock"], ["MULTIXACTOFFSETSLRU", "LWLock"], ["MULTIXACTTRUNCATION", "LWLock"], ["NOTIFYBUFFER", "LWLock"], ["NOTIFYQUEUE", "LWLock"], ["NOTIFYQUEUETAIL", "LWLock"], ["NOTIFYSLRU", "LWLock"], ["OIDGEN", "LWLock"], ["PARALLELAPPEND", "LWLock"], ["PARALLELHASHJOIN", "LWLock"], ["PARALLELQUERYDSA", "LWLock"], ["PARALLELVACUUMDSA", "LWLock"], ["PERSESSIONDSA", "LWLock"], ["PERSESSIONRECORDTYPE", "LWLock"], ["PERSESSIONRECORDTYPMOD", "LWLock"], ["PERXACTPREDICATELIST", "LWLock"], ["PGSTATSDATA", "LWLock"], ["PGSTATSDSA", "LWLock"], ["PGSTATSHASH", "LWLock"], ["PREDICATELOCKMANAGER", "LWLock"], ["PROCARRAY", "LWLock"], ["RELATIONMAPPING", "LWLock"], ["RELCACHEINIT", "LWLock"], ["REPLICATIONORIGIN", "LWLock"], ["REPLICATIONORIGINSTATE", "LWLock"], ["REPLICATIONSLOTALLOCATION", "LWLock"], ["REPLICATIONSLOTCONTROL", "LWLock"], ["REPLICATIONSLOTIO", "LWLock"], ["SERIALBUFFER", "LWLock"], ["SERIALCONTROL", "LWLock"], ["SERIALIZABLEFINISHEDLIST", "LWLock"], ["SERIALIZABLEPREDICATELIST", "LWLock"], ["SERIALIZABLEXACTHASH", "LWLock"], ["SERIALSLRU", "LWLock"], ["SHAREDTIDBITMAP", "LWLock"], ["SHAREDTUPLESTORE", "LWLock"], ["SHMEMINDEX", "LWLock"], ["SINVALREAD", "LWLock"], ["SINVALWRITE", "LWLock"], ["SUBTRANSBUFFER", "LWLock"], ["SUBTRANSSLRU", "LWLock"], ["SYNCREP", "LWLock"], ["SYNCSCAN", "LWLock"], ["TABLESPACECREATE", "LWLock"], ["TWOPHASESTATE", "LWLock"], ["WAITEVENTCUSTOM", "LWLock"], ["WALBUFMAPPING", "LWLock"], ["WALINSERT", "LWLock"], ["WALSUMMARIZER", "LWLock"], ["WALWRITE", "LWLock"], ["WRAPLIMITSVACUUM", "LWLock"], ["XACTBUFFER", "LWLock"], ["XACTSLRU", "LWLock"], ["XACTTRUNCATION", "LWLock"], ["XIDGEN", "LWLock"], ["BASEBACKUPTHROTTLE", "Timeout"], ["CHECKPOINTWRITEDELAY", "Timeout"], ["PGSLEEP", "Timeout"], ["RECOVERYAPPLYDELAY", "Timeout"], ["RECOVERYRETRIEVERETRYINTERVAL", "Timeout"], ["REGISTERSYNCREQUEST", "Timeout"], ["SPINDELAY", "Timeout"], ["VACUUMDELAY", "Timeout"], ["VACUUMTRUNCATE", "Timeout"], ["WALSUMMARIZERERROR", "Timeout"]]
--------------------------------------------------------------------------------
/gather_schema.sql:
--------------------------------------------------------------------------------
1 | --Schema for pg_gather
2 | \set QUIET 1
3 | \echo **Dropping pg_gather tables**
4 | set client_min_messages=ERROR;
5 | DROP TABLE IF EXISTS pg_gather, pg_get_activity, pg_get_class, pg_get_confs, pg_get_file_confs, pg_get_db_role_confs, pg_get_db, pg_get_index,pg_get_tablespace,
6 | pg_get_rel, pg_get_inherits, pg_srvr, pg_get_pidblock, pg_pid_wait, pg_replication_stat, pg_get_wal, pg_get_io, pg_archiver_stat, pg_tab_bloat,
7 | pg_get_toast, pg_get_statements, pg_get_bgwriter, pg_get_roles, pg_get_extension, pg_get_slots, pg_get_hba_rules, pg_get_ns, pg_gather_end, pg_get_prep_xacts;
8 |
9 | \echo **Creating pg_gather tables**
10 | CREATE UNLOGGED TABLE pg_srvr (
11 | connstr text
12 | );
13 |
14 | CREATE UNLOGGED TABLE pg_gather (
15 | collect_ts timestamp with time zone,
16 | usr text,
17 | db text,
18 | ver text,
19 | pg_start_ts timestamp with time zone,
20 | recovery bool,
21 | client inet,
22 | server inet,
23 | reload_ts timestamp with time zone,
24 | timeline int,
25 | systemid bigint,
26 | snapshot pg_snapshot,
27 | current_wal pg_lsn,
28 | bindir text
29 | );
30 |
31 | CREATE UNLOGGED TABLE pg_gather_end (
32 | end_ts timestamp with time zone,
33 | end_lsn pg_lsn,
34 | stmnt char
35 | );
36 |
37 | CREATE UNLOGGED TABLE pg_get_activity (
38 | datid oid,
39 | pid integer,
40 | usesysid oid,
41 | application_name text,
42 | state text,
43 | query text,
44 | wait_event_type text,
45 | wait_event text,
46 | xact_start timestamp with time zone,
47 | query_start timestamp with time zone,
48 | backend_start timestamp with time zone,
49 | state_change timestamp with time zone,
50 | client_addr inet,
51 | client_hostname text,
52 | client_port integer,
53 | backend_xid xid,
54 | backend_xmin xid,
55 | backend_type text,
56 | ssl boolean,
57 | sslversion text,
58 | sslcipher text,
59 | sslbits integer,
60 | sslcompression boolean,
61 | ssl_client_dn text,
62 | ssl_client_serial numeric,
63 | ssl_issuer_dn text,
64 | gss_auth boolean,
65 | gss_princ text,
66 | gss_enc boolean,
67 | gss_delegation boolean,
68 | leader_pid integer,
69 | query_id bigint
70 | );
71 |
72 | CREATE UNLOGGED TABLE pg_get_statements(
73 | userid oid,
74 | dbid oid,
75 | query text,
76 | calls bigint,
77 | total_time double precision,
78 | shared_blks_hit bigint,
79 | shared_blks_read bigint,
80 | shared_blks_dirtied bigint,
81 | shared_blks_written bigint,
82 | temp_blks_read bigint,
83 | temp_blks_written bigint
84 | );
85 |
86 |
87 | CREATE UNLOGGED TABLE pg_pid_wait(
88 | itr SERIAL,
89 | pid integer,
90 | wait_event text
91 | );
92 |
93 |
94 | CREATE UNLOGGED TABLE pg_get_db (
95 | datid oid,
96 | datname text,
97 | encod text,
98 | colat text,
99 | xact_commit bigint,
100 | xact_rollback bigint,
101 | blks_fetch bigint,
102 | blks_hit bigint,
103 | tup_returned bigint,
104 | tup_fetched bigint,
105 | tup_inserted bigint,
106 | tup_updated bigint,
107 | tup_deleted bigint,
108 | temp_files bigint,
109 | temp_bytes bigint,
110 | deadlocks bigint,
111 | blk_read_time double precision,
112 | blk_write_time double precision,
113 | db_size bigint,
114 | age integer,
115 | mxidage integer,
116 | stats_reset timestamp with time zone
117 | );
118 |
119 | CREATE UNLOGGED TABLE pg_get_roles (
120 | oid oid,
121 | rolname text,
122 | rolsuper boolean,
123 | rolreplication boolean,
124 | rolconnlimit integer,
125 | rolconfig text[], --remove this column, because we can derive info from pg_get_db_role_confs
126 | enc_method char
127 | );
128 |
129 | CREATE UNLOGGED TABLE pg_get_confs (
130 | name text,
131 | setting text,
132 | unit text,
133 | source text
134 | );
135 |
136 | CREATE UNLOGGED TABLE pg_get_file_confs (
137 | sourcefile text,
138 | name text,
139 | setting text,
140 | applied boolean,
141 | error text
142 | );
143 |
144 | CREATE UNLOGGED TABLE pg_get_db_role_confs( --pg_db_role_setting
145 | db oid,
146 | setrole oid,
147 | config text[]
148 | );
149 |
150 | CREATE UNLOGGED TABLE pg_get_class (
151 | reloid oid,
152 | relname text,
153 | relkind char(1),
154 | relnamespace oid,
155 | relfilenode oid,
156 | reltablespace oid,
157 | relpersistence char,
158 | reloptions text[],
159 | blocks_fetched bigint,
160 | blocks_hit bigint
161 | );
162 |
163 | CREATE UNLOGGED TABLE pg_get_tablespace(
164 | tsoid oid,
165 | tsname text,
166 | location text
167 | );
168 |
169 | CREATE UNLOGGED TABLE pg_get_inherits(
170 | inhrelid oid,
171 | inhparent oid
172 | );
173 |
174 | CREATE UNLOGGED TABLE pg_get_index (
175 | indexrelid oid,
176 | indrelid oid,
177 | indisunique boolean,
178 | indisprimary boolean,
179 | indisvalid boolean,
180 | numscans bigint,
181 | size bigint,
182 | lastuse timestamp with time zone
183 | );
184 | --indexrelid - oid of the index
185 | --indrelid - oid of the corresponding table
186 |
187 | CREATE UNLOGGED TABLE pg_get_rel (
188 | relid oid,
189 | relnamespace oid,
190 | blks bigint,
191 | n_live_tup bigint,
192 | n_dead_tup bigint,
193 | n_tup_ins bigint,
194 | n_tup_upd bigint,
195 | n_tup_del bigint,
196 | n_tup_hot_upd bigint,
197 | rel_size bigint,
198 | tot_tab_size bigint,
199 | tab_ind_size bigint,
200 | rel_age bigint,
201 | last_vac timestamp with time zone,
202 | last_anlyze timestamp with time zone,
203 | vac_nos bigint,
204 | lastuse timestamp with time zone,
205 | dpart char COLLATE "C"
206 | );
207 |
208 |
209 | CREATE UNLOGGED TABLE pg_get_pidblock(
210 | victim_pid int,
211 | blocking_pids int[]
212 | );
213 |
214 | --TODO : Username, client_addr and client_hostname should be removed on the long term
215 | CREATE UNLOGGED TABLE pg_replication_stat (
216 | usename text,
217 | client_addr text,
218 | client_hostname text,
219 | pid int,
220 | state text,
221 | sent_lsn pg_lsn,
222 | write_lsn pg_lsn,
223 | flush_lsn pg_lsn,
224 | replay_lsn pg_lsn,
225 | sync_state text
226 | );
227 |
228 | CREATE UNLOGGED TABLE pg_archiver_stat(
229 | archived_count bigint,
230 | last_archived_wal text,
231 | last_archived_time timestamp with time zone,
232 | last_failed_wal text,
233 | last_failed_time timestamp with time zone
234 | );
235 |
236 |
237 | CREATE UNLOGGED TABLE pg_get_toast(
238 | relid oid,
239 | toastid oid
240 | );
241 |
242 |
243 | CREATE UNLOGGED TABLE pg_tab_bloat (
244 | table_oid oid,
245 | est_pages bigint
246 | );
247 |
248 | CREATE UNLOGGED TABLE pg_get_bgwriter(
249 | checkpoints_timed bigint,
250 | checkpoints_req bigint,
251 | checkpoint_write_time double precision,
252 | checkpoint_sync_time double precision,
253 | buffers_checkpoint bigint,
254 | buffers_clean bigint,
255 | maxwritten_clean bigint,
256 | buffers_backend bigint,
257 | buffers_backend_fsync bigint,
258 | buffers_alloc bigint,
259 | stats_reset timestamp with time zone
260 | );
261 |
262 | CREATE UNLOGGED TABLE pg_get_extension(
263 | oid oid,
264 | extname text,
265 | extowner oid,
266 | extnamespace oid,
267 | extrelocatable boolean,
268 | extversion text
269 | );
270 |
271 | CREATE UNLOGGED TABLE pg_get_wal(
272 | wal_records bigint,
273 | wal_fpi bigint,
274 | wal_bytes numeric,
275 | wal_buffers_full bigint,
276 | wal_write bigint, --Remove this column for PG18+
277 | wal_sync bigint, --Remove this column for PG18+
278 | wal_write_time double precision, --Remove this column for PG18+
279 | wal_sync_time double precision, --Remove this column for PG18+
280 | stats_reset timestamp with time zone
281 | );
282 |
283 | CREATE UNLOGGED TABLE pg_get_io(
284 | btype char(1), -- 'background writer=G'
285 | obj char(1), -- 'bulkread=R, bulkwrite=W'
286 | context char(1),
287 | reads bigint,
288 | read_bytes numeric,
289 | read_time float8,
290 | writes bigint,
291 | write_bytes numeric,
292 | write_time float8,
293 | writebacks bigint,
294 | writeback_time float8,
295 | extends bigint,
296 | extend_bytes numeric,
297 | extend_time float8,
298 | op_bytes bigint, --Remove this column for PG18+
299 | hits bigint,
300 | evictions bigint,
301 | reuses bigint,
302 | fsyncs bigint,
303 | fsync_time float8,
304 | stats_reset timestamptz
305 | );
306 |
307 | CREATE UNLOGGED TABLE pg_get_slots(
308 | slot_name text,
309 | plugin text,
310 | slot_type text,
311 | datoid oid,
312 | temporary bool,
313 | active bool,
314 | active_pid int,
315 | old_xmin xid,
316 | catalog_xmin xid,
317 | restart_lsn pg_lsn,
318 | confirmed_flush_lsn pg_lsn
319 | );
320 |
321 | CREATE UNLOGGED TABLE pg_get_hba_rules(
322 | seq int,
323 | typ text,
324 | db text[],
325 | usr text[],
326 | addr text,
327 | mask text,
328 | method text,
329 | err text
330 | );
331 |
332 | CREATE UNLOGGED TABLE pg_get_ns(
333 | nsoid oid,
334 | nsname text
335 | );
336 |
337 | CREATE UNLOGGED TABLE pg_get_prep_xacts(
338 | txn xid,
339 | gid text,
340 | prepared timestamptz
341 | );
342 |
343 | \set QUIET 0
344 |
--------------------------------------------------------------------------------
/README.md:
--------------------------------------------------------------------------------
1 | # pg_gather aka pgGather
2 | 
3 | Scan and collect the minimal amount of data needed to identify potential problems in your PostgreSQL database, and then generate an analysis report using that data. This project provides two SQL scripts for users:
4 |
5 | * `gather.sql`: Gathers performance and configuration data from PostgreSQL databases.
6 | * `gather_report.sql`: Analyzes the collected data and generates detailed HTML reports.
7 |
8 | Everything is SQL-only, leveraging the built-in features of psql, the command-line utility of PostgreSQL
9 |
10 | **Supported PostgreSQL Versions** : 10, 11, 12, 13, 14, 15, 16 & 17
11 | **Older versions** : For PostgeSQL 9.6 and older, Please refer the [documentation page](docs/oldversions.md)
12 |
13 | # Highlights
14 | 1. **Secure by Open :** Simple, Transperent, Fully auditable code.
15 | To ensure full transparency of what is collected, transmitted, and analyzed, we use an SQL-only data collection script and avoid programs with any control structures, thus improving the readability and auditability of the data collection. This is one reason for separating data collection and analysis.
16 | 2. **No Executables :** No executables need to be deployed on the database host
17 | Using executables in secured environments poses unacceptable risks in many highly secure environments. `pg_gather` requires only the standard PostgreSQL command line utility, `psql`, and no other libraries or executables.
18 | 3. **Authentication agnostic**
19 | Any authentication mechanism supported by PostgreSQL works for data gathering in `pg_gather`, because it uses the standard `psql` command-line utility.
20 | 4. **Any Operating System**
21 | Linux (32/64-bit), Sun Solaris, Apple macOS, and Microsoft Windows: pg_gather works wherever `psql` is available, ensuring maximum portability.
22 | (Windows users, please see the [Notes section](#notes) below)
23 | 5. **Architecture agnostic**
24 | x86-64 bit, ARM, Sparc, Power, and other architectures. It works anywhere `psql` is available.
25 | 6. **Auditable and optionally maskable data** :
26 | `pg_gather` collects data in Tab Separated Values (TSV) format, making it easy to review and audit the information before sharing it for analysis. Additional masking or trimming is also possible with [simple steps](docs/security.md).
27 | 7. **Any cloud/container/k8s** :
28 | Works with AWS RDS, Azure, Google Cloud SQL, on-premises databases, and more.
29 | (Please see Heroku, AWS Aurora, Docker and K8s specific notes in the [Notes section](#notes) below)
30 | 8. **Zero failure design** :
31 | `pg_gather` can generate a report from available information even if data collection is partial or fails due to permission issues, unavailable tables/views, or other reasons.
32 | 9. **Low overhead for data collection** :
33 | By design, data collection is separate from data analysis. This allows the collected data to be analyzed on an independent system, so that analysis queries do not adversely impact critical systems. In most cases, the overhead of data collection is negligible.
34 | 10. **Small, single file data dump** :
35 | To generate the smallest possible file, which can be further compressed by `gzip` for the easy transmission and storage, `pg_gather` avoids redundancy in the collected data as much as possible.
36 |
37 |
38 | # How to Use
39 |
40 | # 1. Data Gathering.
41 | To gather configuration and performance information, run the `gather.sql` script against the database using `psql`:
42 | ```
43 | psql -X -f gather.sql > out.tsv
44 | ```
45 | OR ALTERNATIVELY pipe to a compression utilty to get a compressed output as follows:
46 | ```
47 | psql -X -f gather.sql | gzip > out.tsv.gz
48 | ```
49 | This script may take over 20 seconds to run because it contains sleeps/delays. We recommend running the script as a privileged user (such as `superuser` or `rds_superuser`) or as an account with the `pg_monitor` privilege. The output file contains performance and configuration data for analysis.
50 |
51 | ## Notes:
52 | 1. **Heroku** and similar DaaS hostings impose very high restrictions on collecting performance data. Queries on views like `pg_statistics` may produce errors during data collection, but these errors can be ignored.
53 | 2. **MS Windows** users!,
54 | Client tools like [pgAdmin](https://www.pgadmin.org/) include `psql`, which can be used to run `pg_gather` against local or remote databases.
55 | For example:
56 | ```
57 | "C:\Program Files\pgAdmin 4\v4\runtime\psql.exe" -h pghost -U postgres -f gather.sql > out.tsv
58 | ```
59 | 3. **AWS Aurora** offers a "PostgreSQL-compatible" database. However, it is not a true PostgreSQL database, even though it looks like one. Therefore, you should do the following to the `gather.sql` script to replace any unapplicable lines with "NULL".
60 | ```
61 | sed -i -e 's/^CASE WHEN pg_is_in_recovery().*/NULL/' gather.sql
62 | ```
63 | 4. **Docker** containers of PostgreSQL may not include the `curl` or `wget` utilities necessary to download `gather.sql`. Therefore, it is recommended to pipe the contents of the SQL file to `psql` instead.
64 | ```
65 | cat gather.sql | docker exec -i psql -X -f - > out.tsv
66 | ```
67 | 5. **Kubernetes** environments also have similar restrictions as those mentioned for Docker. Therefore, a similar approach is suggested.
68 | ```
69 | cat gather.sql | kubectl exec -i -- psql -X -f - > out.tsv
70 | ```
71 |
72 | ## Gathering data continuosly
73 | There could be requirements for collecting data continuously and repatedly. `pg_gather` has a special lightweight mode for continuous data gathering, which is automatically enabled when it connects to the "template1" database. Please refer to detailed [documentation specific to continuous and repated data collection](docs/continuous_collection.md)
74 |
75 | # 2. Data Analysis
76 | ## 2.1 Importing collected data
77 | The collected data can be imported to a PostgreSQL Instance. This creates required schema objects in the `public` schema of the database.
78 | **CAUTION :** Avoid importing the data into critical environments/databases. A temporary PostgreSQL instance is preferable.
79 | ```
80 | psql -f gather_schema.sql -f out.tsv
81 | ```
82 | Deprecated usage of `sed` : sed -e '/^Pager/d; /^Tuples/d; /^Output/d; /^SELECT pg_sleep/d; /^PREPARE/d; /^\s*$/d' out.tsv | psql -f gather_schema.sql -
83 | ## 2.2 Generating Report
84 | An analysis report in HTML format can be generated from the imported data as follows.
85 | ```
86 | psql -X -f gather_report.sql > GatherReport.html
87 | ```
88 | You may use your favourite web browser to read the report.
89 |
90 | NOTE: PostgreSQL version 13 or above is required to generate the analysis report.
91 |
92 |
93 |
94 | # ANNEXTURE 1 : Using PostgreSQL container and wrapper script
95 | The steps for data analysis mentioned above seem simple (single command), but they require a PostgreSQL instance to import the data into. An alternative is to use the `generate_report.sh` script, which can spin up a PostgreSQL Docker container and automate the entire process. To use this script, you must place it in a directory containing the `gather_schema.sql` and `gather_report.sql` files.
96 |
97 | The script will spin up a Docker container, import the output of `gather.sql` (out.tsv) and then it generates an HTML report. This script expects at least a single argument: path to the `out.tsv`.
98 |
99 | There are two more additional positional arguments:
100 | * Desired report name with path.
101 | * A flag to specify whether to keep the docker container. This flag allows to usage of the container and data for further analysis.
102 |
103 | Example 1: Import data and generate an HTML file
104 | ```
105 | $ ./generate_report.sh /tmp/out.tsv
106 | ...
107 | Container 61fbc6d15c626b484bdf70352e94bbdb821971de1e00c6de774ca5cd460e8db3 deleted
108 | Finished generating report in /tmp/out.txt.html
109 | ```
110 | Example 2: Import data, keep the container intact and generate the report in the specified location
111 | ```
112 | $ ./generate_report.sh /tmp/out.tsv /tmp/custom-name.html y
113 | ...
114 | Container df7b228a5a6a49586e5424e5fe7a2065d8be78e0ae3aa5cddd8658ee27f4790c left around
115 | Finished generating report in /tmp/custom-name.html
116 | ```
117 | # Advanced configurations
118 | ## Timezone
119 | By default, the `pg_gather` report uses the same timezone of the server from which the data is collected, because it considers the `log_timezone` parameter for generating the report. This default timezone setting helps to compare the PostgreSQL log entries with the `pg_gather` report.
120 | However, this may not be the right timezone for few users, especially when cloud hostings are used. The `pg_gather` allows the user to have a custom timezone by setting the environment variable `PG_GATHER_TIMEZONE` to override the default. For example,
121 | ```
122 | export PG_GATHER_TIMEZONE='UTC'
123 | ```
124 | Please use the timezone name or abbreviation available from `pg_timezone_names`
125 | # Demo
126 | ## Data collection
127 | [](https://youtu.be/4EK7BoV6oOg)
128 | ## Simple Report Generation (1min):
129 | [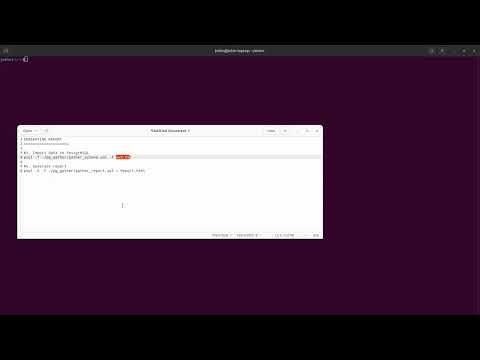](https://youtu.be/Y8gq1dwfzQU)
130 | ## Report generation using postgresql docker container made easy (3min):
131 | [](https://youtu.be/amPQRzz5D8Y)
--------------------------------------------------------------------------------