├── README.md
├── config.py
├── data
├── data_access.py
├── data_prep.py
├── predicted_quality.py
├── product_quality.py
└── sensor_reading.py
├── demo_utils
└── demo_data _init.py
├── docs
├── a_glassware_quality_control.html
├── config.html
├── data
│ ├── data_access.html
│ ├── data_prep.html
│ ├── predicted_quality.html
│ ├── product_quality.html
│ └── sensor_reading.html
├── demo_utils
│ └── demo_data _init.html
├── eda
│ ├── data_profile.html
│ └── model_tryout.html
├── glassware_quality_modeler
│ ├── generate_models.html
│ ├── model_decision_tree.html
│ ├── model_random_forest.html
│ └── model_xgboost.html
├── glassware_quality_scorer
│ └── score_quality.html
├── img
│ ├── drift_detection_kpi.png
│ └── model_drift_architecture.png
├── index.html
├── model_quality
│ └── model_quality_monitor.html
├── requirements.txt.html
└── utils
│ ├── mlflow_utils.html
│ └── viz_utils.html
├── eda
├── data_profile.py
└── model_tryout.py
├── glassware_quality_control.py
├── glassware_quality_modeler
├── generate_models.py
├── model_decision_tree.py
├── model_random_forest.py
└── model_xgboost.py
├── glassware_quality_scorer
└── score_quality.py
├── model_drift_webinar.dbc
├── model_quality
└── model_quality_monitor.py
└── utils
├── mlflow_utils.py
└── viz_utils.py
/README.md:
--------------------------------------------------------------------------------
1 | # Productionizing Machine Learning: From Deployment to Drift Detection
2 |
3 | Here is a prototype on productionizing a ML model pipeline, and monitoring it for drift, for subsequent retraining and deployment.
4 |
5 | This uses glassware manufacturing dataset, which is synthesized to showcase model drift.
6 |
7 | To review the code in notebook format using HTML
8 | https://joelcthomas.github.io/modeldrift
9 |
10 | ## Architecture Overview
11 |
12 | 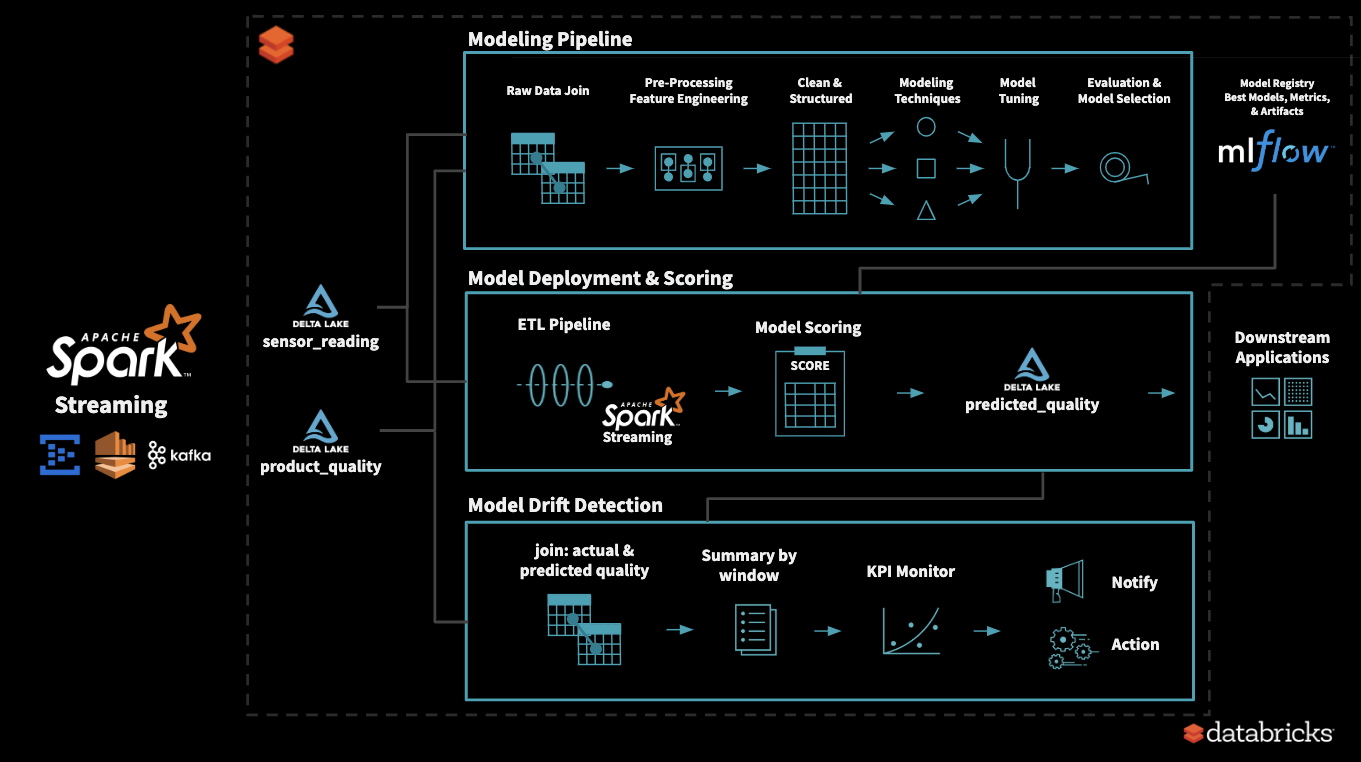 13 |
14 | ## Deployment to Drift Detection - a Typical Workflow
15 | - To understand the data, we start with EDA (Exploratory Data Analysis)
16 | - Using historical data, we explore various modeling methods, tune its hyperparameters, and identify our best model
17 | - All the experiment runs are tracked using MLflow and we tag the best model for production use
18 | - While scoring in a streaming pipeline, production model is accessed from MLflow
19 | - Model is stable for first ‘x’ days
20 | - Model Drift KPIs
21 | - KPIs and its margin depends on the model and business problem
22 | - Sometimes more than 1 KPI maybe needed at times to capture behavior changes
23 | - After ‘y’ days, we see model drift occur, as identified by tracking KPIs
24 | - This triggers re-training process
25 | - Once again, we explore various modeling methods, tune its hyperparameters, and identify our new best model
26 | - The new model is tagged as current production model in MLflow
27 | - We once again observe that KPIs are back within acceptable range
28 | - Over time, based on business demands, it may be needed to update KPIs and its acceptable limits
29 |
30 |
13 |
14 | ## Deployment to Drift Detection - a Typical Workflow
15 | - To understand the data, we start with EDA (Exploratory Data Analysis)
16 | - Using historical data, we explore various modeling methods, tune its hyperparameters, and identify our best model
17 | - All the experiment runs are tracked using MLflow and we tag the best model for production use
18 | - While scoring in a streaming pipeline, production model is accessed from MLflow
19 | - Model is stable for first ‘x’ days
20 | - Model Drift KPIs
21 | - KPIs and its margin depends on the model and business problem
22 | - Sometimes more than 1 KPI maybe needed at times to capture behavior changes
23 | - After ‘y’ days, we see model drift occur, as identified by tracking KPIs
24 | - This triggers re-training process
25 | - Once again, we explore various modeling methods, tune its hyperparameters, and identify our new best model
26 | - The new model is tagged as current production model in MLflow
27 | - We once again observe that KPIs are back within acceptable range
28 | - Over time, based on business demands, it may be needed to update KPIs and its acceptable limits
29 |
30 | 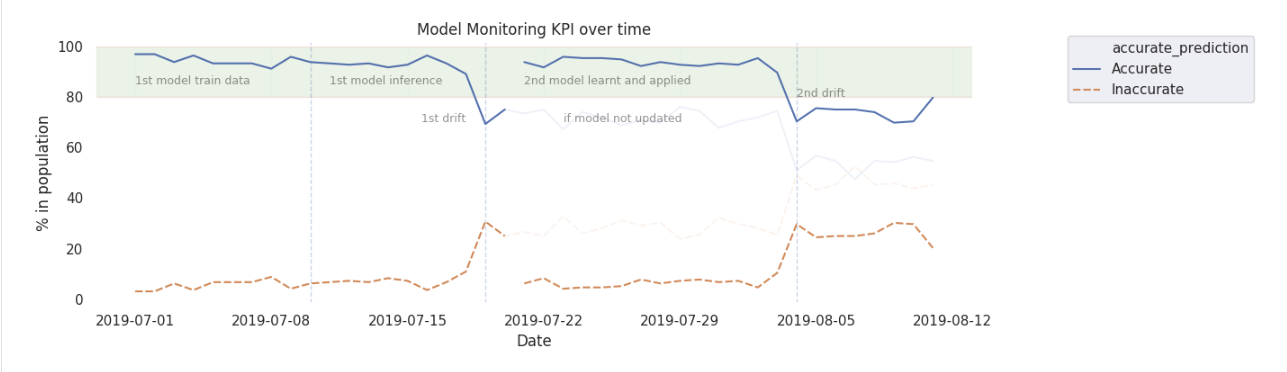 31 |
32 | ## Run
33 | To reproduce this example, please import attached `model_drift_webinar.dbc` file to databricks workspace.
34 |
35 | [Instructions on how to import notebooks in databricks](https://docs.databricks.com/user-guide/notebooks/notebook-manage.html#import-a-notebook)
36 |
37 |
38 | For more information on using databricks
39 | https://docs.databricks.com/
--------------------------------------------------------------------------------
/config.py:
--------------------------------------------------------------------------------
1 | # Databricks notebook source
2 | # Noise for data generator
3 | dg_noise = {"temp_noise": 0.2, "pressure_noise": 0.2, "duration_noise": 0.2}
4 |
5 | userid = 'add_user'
6 |
7 | # Data paths (replace with actual locations. Could be directly to S3, Azure blob/ADLS, or these locations mounted locally)
8 | sensor_reading_blob = "/mnt/tmp/sensor_reading"
9 | product_quality_blob = "/mnt/tmp/product_quality"
10 |
11 | predicted_quality_blob = "/mnt/tmp/predicted_quality"
12 | predicted_quality_cp_blob = "/mnt/tmp/predicted_quality_checkpoint"
13 |
14 | # Modeling & MLflow settings
15 | mlflow_exp_name = "Glassware Quality Predictor"
16 | mlflow_exp_id = "3650654" # Replace with id from your environment
17 |
18 | model_compare_metric = 'accuracy'
19 |
20 | # COMMAND ----------
21 |
22 | # MAGIC %run ./utils/viz_utils
23 |
24 | # COMMAND ----------
25 |
26 | # MAGIC %run ./utils/mlflow_utils
27 |
28 | # COMMAND ----------
29 |
30 | from pyspark.sql import Window
31 | import pyspark.sql.functions as F
32 |
--------------------------------------------------------------------------------
/data/data_access.py:
--------------------------------------------------------------------------------
1 | # Databricks notebook source
2 | ## Example to access Azure blob directly
3 | # storage_account_name = "acctname"
4 | # storage_account_access_key = "addkeyhere=="
5 | # spark.conf.set(
6 | # "fs.azure.account.key."+storage_account_name+".blob.core.windows.net",
7 | # storage_account_access_key)
8 |
9 | # COMMAND ----------
10 |
11 | ## Example mount
12 | # dbutils.fs.mount(
13 | # source = "wasbs://acctname@blobstorename.blob.core.windows.net/",
14 | # mount_point = "/mnt/glassware",
15 | # extra_configs = {"fs.azure.account.key.joelsimpleblobstore.blob.core.windows.net": storage_account_access_key}
16 | # )
17 |
18 | # COMMAND ----------
19 |
20 | # MAGIC %run ./sensor_reading
21 |
22 | # COMMAND ----------
23 |
24 | # MAGIC %run ./product_quality
25 |
26 | # COMMAND ----------
27 |
28 | # MAGIC %run ./predicted_quality
29 |
--------------------------------------------------------------------------------
/data/data_prep.py:
--------------------------------------------------------------------------------
1 | # Databricks notebook source
2 | def model_data(model_data_date):
3 | dates = (model_data_date['start_date'], model_data_date['end_date'])
4 | sensor_reading = get_sensor_reading()
5 | sensor_reading = sensor_reading.filter(sensor_reading.process_time.between(*dates))
6 | product_quality = get_product_quality()
7 | product_quality = product_quality.filter(product_quality.qualitycheck_time.between(*dates))
8 | return sensor_reading.join(product_quality, "pid")
9 |
--------------------------------------------------------------------------------
/data/predicted_quality.py:
--------------------------------------------------------------------------------
1 | # Databricks notebook source
2 | from pyspark.sql.types import *
3 |
4 | # COMMAND ----------
5 |
6 | def get_predicted_quality():
7 | predicted_quality_schema = (StructType([
8 | StructField("pid",LongType(),True),
9 | StructField("process_time",TimestampType(),True),
10 | StructField("predicted_quality",IntegerType(),True)])
11 | )
12 | return spark.read.format("delta").load(predicted_quality_blob)
13 |
14 | # COMMAND ----------
15 |
16 | def stream_predicted_quality():
17 | return spark.readStream.format("delta").load(predicted_quality_blob)
18 |
--------------------------------------------------------------------------------
/data/product_quality.py:
--------------------------------------------------------------------------------
1 | # Databricks notebook source
2 | from pyspark.sql.types import *
3 |
4 | # COMMAND ----------
5 |
6 | def get_product_quality():
7 | product_quality_schema = (StructType([
8 | StructField("pid",LongType(),True),
9 | StructField("qualitycheck_time",TimestampType(),True),
10 | StructField("quality",IntegerType(),True)])
11 | )
12 | return spark.read.format("delta").schema(product_quality_schema).load(product_quality_blob)
13 |
14 | # COMMAND ----------
15 |
16 | def stream_product_quality():
17 | return spark.readStream.format("delta").load(product_quality_blob)
18 |
--------------------------------------------------------------------------------
/data/sensor_reading.py:
--------------------------------------------------------------------------------
1 | # Databricks notebook source
2 | from pyspark.sql.types import *
3 |
4 | # COMMAND ----------
5 |
6 | def get_sensor_reading():
7 | sensor_reading_schema = (StructType([
8 | StructField("pid",LongType(),True),
9 | StructField("process_time",TimestampType(),True),
10 | StructField("temp",DoubleType(),True),
11 | StructField("pressure",DoubleType(),True),
12 | StructField("duration",DoubleType(),True)])
13 | )
14 | return spark.read.format("delta").schema(sensor_reading_schema).load(sensor_reading_blob)
15 |
16 | # COMMAND ----------
17 |
18 | def stream_sensor_reading():
19 | return spark.readStream.format("delta").load(sensor_reading_blob)
20 |
--------------------------------------------------------------------------------
/demo_utils/demo_data _init.py:
--------------------------------------------------------------------------------
1 | # Databricks notebook source
2 | # MAGIC %run ../config
3 |
4 | # COMMAND ----------
5 |
6 | # MAGIC %run ../data/data_access
7 |
8 | # COMMAND ----------
9 |
10 | import pyspark.sql.functions as F
11 |
12 | # COMMAND ----------
13 |
14 | # MAGIC %md
15 | # MAGIC ### Clear pre-data for ru-runs
16 |
17 | # COMMAND ----------
18 |
19 | def clear_for_demo():
20 | dbutils.fs.rm(sensor_reading_blob, True)
21 | dbutils.fs.rm(product_quality_blob, True)
22 | dbutils.fs.rm(predicted_quality_blob, True)
23 | dbutils.fs.rm(predicted_quality_cp_blob, True)
24 | return True
25 |
26 | # COMMAND ----------
27 |
28 | ## Run this to clear predicted quality tables, in case you want to try again
29 | clear_for_demo()
30 |
31 | # COMMAND ----------
32 |
33 | # MAGIC %md
34 | # MAGIC ### Generate data for demo
35 |
36 | # COMMAND ----------
37 |
38 | df = spark.range(1,8000)
39 | # Setup Temperature, Pressure, Duration
40 | df = df.select("id", F.rand(seed=10).alias("temp_raw"), F.randn(seed=27).alias("pressure_raw"), F.rand(seed=45).alias("duration_raw"),
41 | F.randn(seed=54).alias("temp_n"), F.randn(seed=78).alias("pressure_n"), F.randn(seed=96).alias("duration_n"), F.round(F.rand()*7.5*60,0).alias("timestamp_n"))
42 | df = df.withColumn('pid', (100000 + df["id"]))
43 | df = (df.withColumn("temp_raw", (10.0*df["temp_raw"])+350)
44 | .withColumn("pressure_raw", (2.0*df["pressure_raw"])+12)
45 | .withColumn("duration_raw", (4.0*df["duration_raw"])+28.5)
46 | .withColumn("timestamp", ((df["id"]*7.5*60)+1561939200+df["timestamp_n"]).cast('timestamp'))
47 | )
48 | df = df.withColumn("process_time", df["timestamp"])
49 | df = df.withColumn("qualitycheck_time", F.date_trunc("day", F.date_add(df["timestamp"], 2)))
50 |
51 | # Assign good vs bad for quality
52 | df = df.withColumn(
53 | 'quality',
54 | F.when(F.col('id').between(1,3400) & F.col('temp_raw').between(351,359) & F.col('pressure_raw').between(8,15) & F.col('duration_raw').between(28,32), 1)\
55 | .when(F.col('id').between(3401,6500) & F.col('temp_raw').between(354,359) & F.col('pressure_raw').between(8,15) & F.col('duration_raw').between(28,32), 1)\
56 | .when(F.col('id').between(6501,8000) & F.col('temp_raw').between(354,359) & F.col('pressure_raw').between(12,15) & F.col('duration_raw').between(28,32), 1)\
57 | .otherwise(0)
58 | )
59 | # Add some noise
60 | df = (df.withColumn("temp", df["temp_raw"]+(dg_noise["temp_noise"]*df["temp_n"]))
61 | .withColumn("pressure", df["pressure_raw"]+(dg_noise["pressure_noise"]*df["pressure_n"]))
62 | .withColumn("duration", df["duration_raw"]+(dg_noise["duration_noise"]*df["duration_n"]))
63 | )
64 | df = df.select('pid','timestamp', 'process_time', 'qualitycheck_time', 'temp_raw', 'temp', 'pressure_raw', 'pressure', 'duration_raw', 'duration', 'quality')
65 |
66 | # COMMAND ----------
67 |
68 | display(df)
69 |
70 | # COMMAND ----------
71 |
72 | # MAGIC %md
73 | # MAGIC ### Send data for range: 2019-07-01 00:00:00 - 2019-07-16 00:00:00
74 |
75 | # COMMAND ----------
76 |
77 | # First Model generation
78 | df1 = df.filter(df.timestamp<=F.unix_timestamp(F.lit('2019-07-16 00:00:00')).cast('timestamp'))
79 |
80 | # COMMAND ----------
81 |
82 | df1.select('pid', 'process_time', 'temp', 'pressure', 'duration').write.format("delta").mode("overwrite").option("maxRecordsPerFile", 50).save(sensor_reading_blob)
83 | df1.select('pid', 'qualitycheck_time', 'quality').write.format("delta").mode("overwrite").option("maxRecordsPerFile", 50).save(product_quality_blob)
84 |
85 | # COMMAND ----------
86 |
87 | # MAGIC %md
88 | # MAGIC ### Append data for range: 2019-07-16 00:00:00 - 2019-07-21 00:00:00
89 |
90 | # COMMAND ----------
91 |
92 | # Data for drift and 2nd model generation
93 | df2 = df.filter( (df.timestamp>=F.unix_timestamp(F.lit('2019-07-16 00:00:00')).cast('timestamp')) & (df.timestamp<=F.unix_timestamp(F.lit('2019-07-21 00:00:00')).cast('timestamp')))
94 |
95 | # COMMAND ----------
96 |
97 | df2.select('pid', 'process_time', 'temp', 'pressure', 'duration').write.format("delta").mode("append").option("maxRecordsPerFile", 50).save(sensor_reading_blob)
98 | df2.select('pid', 'qualitycheck_time', 'quality').write.format("delta").mode("append").option("maxRecordsPerFile", 50).save(product_quality_blob)
99 |
100 | # COMMAND ----------
101 |
102 | # MAGIC %md
103 | # MAGIC ### Send data for range: 2019-07-21 00:00:00 - 2019-08-01 00:00:00
104 |
105 | # COMMAND ----------
106 |
107 | # Data after 2nd model deployment
108 | df3 = df.filter( (df.timestamp>=F.unix_timestamp(F.lit('2019-07-21 00:00:00')).cast('timestamp')) & (df.timestamp<=F.unix_timestamp(F.lit('2019-08-01 00:00:00')).cast('timestamp')))
109 |
110 | # COMMAND ----------
111 |
112 | df3.select('pid', 'process_time', 'temp', 'pressure', 'duration').write.format("delta").mode("append").option("maxRecordsPerFile", 50).save(sensor_reading_blob)
113 | df3.select('pid', 'qualitycheck_time', 'quality').write.format("delta").mode("append").option("maxRecordsPerFile", 50).save(product_quality_blob)
114 |
115 | # COMMAND ----------
116 |
117 | # MAGIC %md
118 | # MAGIC ### Send data for range: > 2019-08-01 00:00:00
119 |
120 | # COMMAND ----------
121 |
122 | # Data after 2nd model deployment
123 | df4 = df.filter(df.timestamp>F.unix_timestamp(F.lit('2019-08-01 00:00:00')).cast('timestamp'))
124 |
125 | # COMMAND ----------
126 |
127 | df4.select('pid', 'process_time', 'temp', 'pressure', 'duration').write.format("delta").mode("append").option("maxRecordsPerFile", 50).save(sensor_reading_blob)
128 | df4.select('pid', 'qualitycheck_time', 'quality').write.format("delta").mode("append").option("maxRecordsPerFile", 50).save(product_quality_blob)
129 |
130 | # COMMAND ----------
131 |
132 |
133 |
--------------------------------------------------------------------------------
/docs/data/data_prep.html:
--------------------------------------------------------------------------------
1 |
2 |
3 |
4 |
5 | data / data_prep - Databricks
6 |
7 |
8 |
9 |
10 |
11 |
12 |
13 |
14 |
15 |
16 |
17 |
18 |
21 |
24 |
25 |
26 |
27 |
42 |
43 |
--------------------------------------------------------------------------------
/docs/img/drift_detection_kpi.png:
--------------------------------------------------------------------------------
https://raw.githubusercontent.com/joelcthomas/modeldrift/d6706d89772fcb5355b031ab82254792e5f6ac02/docs/img/drift_detection_kpi.png
--------------------------------------------------------------------------------
/docs/img/model_drift_architecture.png:
--------------------------------------------------------------------------------
https://raw.githubusercontent.com/joelcthomas/modeldrift/d6706d89772fcb5355b031ab82254792e5f6ac02/docs/img/model_drift_architecture.png
--------------------------------------------------------------------------------
/eda/data_profile.py:
--------------------------------------------------------------------------------
1 | # Databricks notebook source
2 | # MAGIC %run ../utils/data_generator
3 |
4 | # COMMAND ----------
5 |
6 | # MAGIC %md
7 | # MAGIC
31 |
32 | ## Run
33 | To reproduce this example, please import attached `model_drift_webinar.dbc` file to databricks workspace.
34 |
35 | [Instructions on how to import notebooks in databricks](https://docs.databricks.com/user-guide/notebooks/notebook-manage.html#import-a-notebook)
36 |
37 |
38 | For more information on using databricks
39 | https://docs.databricks.com/
--------------------------------------------------------------------------------
/config.py:
--------------------------------------------------------------------------------
1 | # Databricks notebook source
2 | # Noise for data generator
3 | dg_noise = {"temp_noise": 0.2, "pressure_noise": 0.2, "duration_noise": 0.2}
4 |
5 | userid = 'add_user'
6 |
7 | # Data paths (replace with actual locations. Could be directly to S3, Azure blob/ADLS, or these locations mounted locally)
8 | sensor_reading_blob = "/mnt/tmp/sensor_reading"
9 | product_quality_blob = "/mnt/tmp/product_quality"
10 |
11 | predicted_quality_blob = "/mnt/tmp/predicted_quality"
12 | predicted_quality_cp_blob = "/mnt/tmp/predicted_quality_checkpoint"
13 |
14 | # Modeling & MLflow settings
15 | mlflow_exp_name = "Glassware Quality Predictor"
16 | mlflow_exp_id = "3650654" # Replace with id from your environment
17 |
18 | model_compare_metric = 'accuracy'
19 |
20 | # COMMAND ----------
21 |
22 | # MAGIC %run ./utils/viz_utils
23 |
24 | # COMMAND ----------
25 |
26 | # MAGIC %run ./utils/mlflow_utils
27 |
28 | # COMMAND ----------
29 |
30 | from pyspark.sql import Window
31 | import pyspark.sql.functions as F
32 |
--------------------------------------------------------------------------------
/data/data_access.py:
--------------------------------------------------------------------------------
1 | # Databricks notebook source
2 | ## Example to access Azure blob directly
3 | # storage_account_name = "acctname"
4 | # storage_account_access_key = "addkeyhere=="
5 | # spark.conf.set(
6 | # "fs.azure.account.key."+storage_account_name+".blob.core.windows.net",
7 | # storage_account_access_key)
8 |
9 | # COMMAND ----------
10 |
11 | ## Example mount
12 | # dbutils.fs.mount(
13 | # source = "wasbs://acctname@blobstorename.blob.core.windows.net/",
14 | # mount_point = "/mnt/glassware",
15 | # extra_configs = {"fs.azure.account.key.joelsimpleblobstore.blob.core.windows.net": storage_account_access_key}
16 | # )
17 |
18 | # COMMAND ----------
19 |
20 | # MAGIC %run ./sensor_reading
21 |
22 | # COMMAND ----------
23 |
24 | # MAGIC %run ./product_quality
25 |
26 | # COMMAND ----------
27 |
28 | # MAGIC %run ./predicted_quality
29 |
--------------------------------------------------------------------------------
/data/data_prep.py:
--------------------------------------------------------------------------------
1 | # Databricks notebook source
2 | def model_data(model_data_date):
3 | dates = (model_data_date['start_date'], model_data_date['end_date'])
4 | sensor_reading = get_sensor_reading()
5 | sensor_reading = sensor_reading.filter(sensor_reading.process_time.between(*dates))
6 | product_quality = get_product_quality()
7 | product_quality = product_quality.filter(product_quality.qualitycheck_time.between(*dates))
8 | return sensor_reading.join(product_quality, "pid")
9 |
--------------------------------------------------------------------------------
/data/predicted_quality.py:
--------------------------------------------------------------------------------
1 | # Databricks notebook source
2 | from pyspark.sql.types import *
3 |
4 | # COMMAND ----------
5 |
6 | def get_predicted_quality():
7 | predicted_quality_schema = (StructType([
8 | StructField("pid",LongType(),True),
9 | StructField("process_time",TimestampType(),True),
10 | StructField("predicted_quality",IntegerType(),True)])
11 | )
12 | return spark.read.format("delta").load(predicted_quality_blob)
13 |
14 | # COMMAND ----------
15 |
16 | def stream_predicted_quality():
17 | return spark.readStream.format("delta").load(predicted_quality_blob)
18 |
--------------------------------------------------------------------------------
/data/product_quality.py:
--------------------------------------------------------------------------------
1 | # Databricks notebook source
2 | from pyspark.sql.types import *
3 |
4 | # COMMAND ----------
5 |
6 | def get_product_quality():
7 | product_quality_schema = (StructType([
8 | StructField("pid",LongType(),True),
9 | StructField("qualitycheck_time",TimestampType(),True),
10 | StructField("quality",IntegerType(),True)])
11 | )
12 | return spark.read.format("delta").schema(product_quality_schema).load(product_quality_blob)
13 |
14 | # COMMAND ----------
15 |
16 | def stream_product_quality():
17 | return spark.readStream.format("delta").load(product_quality_blob)
18 |
--------------------------------------------------------------------------------
/data/sensor_reading.py:
--------------------------------------------------------------------------------
1 | # Databricks notebook source
2 | from pyspark.sql.types import *
3 |
4 | # COMMAND ----------
5 |
6 | def get_sensor_reading():
7 | sensor_reading_schema = (StructType([
8 | StructField("pid",LongType(),True),
9 | StructField("process_time",TimestampType(),True),
10 | StructField("temp",DoubleType(),True),
11 | StructField("pressure",DoubleType(),True),
12 | StructField("duration",DoubleType(),True)])
13 | )
14 | return spark.read.format("delta").schema(sensor_reading_schema).load(sensor_reading_blob)
15 |
16 | # COMMAND ----------
17 |
18 | def stream_sensor_reading():
19 | return spark.readStream.format("delta").load(sensor_reading_blob)
20 |
--------------------------------------------------------------------------------
/demo_utils/demo_data _init.py:
--------------------------------------------------------------------------------
1 | # Databricks notebook source
2 | # MAGIC %run ../config
3 |
4 | # COMMAND ----------
5 |
6 | # MAGIC %run ../data/data_access
7 |
8 | # COMMAND ----------
9 |
10 | import pyspark.sql.functions as F
11 |
12 | # COMMAND ----------
13 |
14 | # MAGIC %md
15 | # MAGIC ### Clear pre-data for ru-runs
16 |
17 | # COMMAND ----------
18 |
19 | def clear_for_demo():
20 | dbutils.fs.rm(sensor_reading_blob, True)
21 | dbutils.fs.rm(product_quality_blob, True)
22 | dbutils.fs.rm(predicted_quality_blob, True)
23 | dbutils.fs.rm(predicted_quality_cp_blob, True)
24 | return True
25 |
26 | # COMMAND ----------
27 |
28 | ## Run this to clear predicted quality tables, in case you want to try again
29 | clear_for_demo()
30 |
31 | # COMMAND ----------
32 |
33 | # MAGIC %md
34 | # MAGIC ### Generate data for demo
35 |
36 | # COMMAND ----------
37 |
38 | df = spark.range(1,8000)
39 | # Setup Temperature, Pressure, Duration
40 | df = df.select("id", F.rand(seed=10).alias("temp_raw"), F.randn(seed=27).alias("pressure_raw"), F.rand(seed=45).alias("duration_raw"),
41 | F.randn(seed=54).alias("temp_n"), F.randn(seed=78).alias("pressure_n"), F.randn(seed=96).alias("duration_n"), F.round(F.rand()*7.5*60,0).alias("timestamp_n"))
42 | df = df.withColumn('pid', (100000 + df["id"]))
43 | df = (df.withColumn("temp_raw", (10.0*df["temp_raw"])+350)
44 | .withColumn("pressure_raw", (2.0*df["pressure_raw"])+12)
45 | .withColumn("duration_raw", (4.0*df["duration_raw"])+28.5)
46 | .withColumn("timestamp", ((df["id"]*7.5*60)+1561939200+df["timestamp_n"]).cast('timestamp'))
47 | )
48 | df = df.withColumn("process_time", df["timestamp"])
49 | df = df.withColumn("qualitycheck_time", F.date_trunc("day", F.date_add(df["timestamp"], 2)))
50 |
51 | # Assign good vs bad for quality
52 | df = df.withColumn(
53 | 'quality',
54 | F.when(F.col('id').between(1,3400) & F.col('temp_raw').between(351,359) & F.col('pressure_raw').between(8,15) & F.col('duration_raw').between(28,32), 1)\
55 | .when(F.col('id').between(3401,6500) & F.col('temp_raw').between(354,359) & F.col('pressure_raw').between(8,15) & F.col('duration_raw').between(28,32), 1)\
56 | .when(F.col('id').between(6501,8000) & F.col('temp_raw').between(354,359) & F.col('pressure_raw').between(12,15) & F.col('duration_raw').between(28,32), 1)\
57 | .otherwise(0)
58 | )
59 | # Add some noise
60 | df = (df.withColumn("temp", df["temp_raw"]+(dg_noise["temp_noise"]*df["temp_n"]))
61 | .withColumn("pressure", df["pressure_raw"]+(dg_noise["pressure_noise"]*df["pressure_n"]))
62 | .withColumn("duration", df["duration_raw"]+(dg_noise["duration_noise"]*df["duration_n"]))
63 | )
64 | df = df.select('pid','timestamp', 'process_time', 'qualitycheck_time', 'temp_raw', 'temp', 'pressure_raw', 'pressure', 'duration_raw', 'duration', 'quality')
65 |
66 | # COMMAND ----------
67 |
68 | display(df)
69 |
70 | # COMMAND ----------
71 |
72 | # MAGIC %md
73 | # MAGIC ### Send data for range: 2019-07-01 00:00:00 - 2019-07-16 00:00:00
74 |
75 | # COMMAND ----------
76 |
77 | # First Model generation
78 | df1 = df.filter(df.timestamp<=F.unix_timestamp(F.lit('2019-07-16 00:00:00')).cast('timestamp'))
79 |
80 | # COMMAND ----------
81 |
82 | df1.select('pid', 'process_time', 'temp', 'pressure', 'duration').write.format("delta").mode("overwrite").option("maxRecordsPerFile", 50).save(sensor_reading_blob)
83 | df1.select('pid', 'qualitycheck_time', 'quality').write.format("delta").mode("overwrite").option("maxRecordsPerFile", 50).save(product_quality_blob)
84 |
85 | # COMMAND ----------
86 |
87 | # MAGIC %md
88 | # MAGIC ### Append data for range: 2019-07-16 00:00:00 - 2019-07-21 00:00:00
89 |
90 | # COMMAND ----------
91 |
92 | # Data for drift and 2nd model generation
93 | df2 = df.filter( (df.timestamp>=F.unix_timestamp(F.lit('2019-07-16 00:00:00')).cast('timestamp')) & (df.timestamp<=F.unix_timestamp(F.lit('2019-07-21 00:00:00')).cast('timestamp')))
94 |
95 | # COMMAND ----------
96 |
97 | df2.select('pid', 'process_time', 'temp', 'pressure', 'duration').write.format("delta").mode("append").option("maxRecordsPerFile", 50).save(sensor_reading_blob)
98 | df2.select('pid', 'qualitycheck_time', 'quality').write.format("delta").mode("append").option("maxRecordsPerFile", 50).save(product_quality_blob)
99 |
100 | # COMMAND ----------
101 |
102 | # MAGIC %md
103 | # MAGIC ### Send data for range: 2019-07-21 00:00:00 - 2019-08-01 00:00:00
104 |
105 | # COMMAND ----------
106 |
107 | # Data after 2nd model deployment
108 | df3 = df.filter( (df.timestamp>=F.unix_timestamp(F.lit('2019-07-21 00:00:00')).cast('timestamp')) & (df.timestamp<=F.unix_timestamp(F.lit('2019-08-01 00:00:00')).cast('timestamp')))
109 |
110 | # COMMAND ----------
111 |
112 | df3.select('pid', 'process_time', 'temp', 'pressure', 'duration').write.format("delta").mode("append").option("maxRecordsPerFile", 50).save(sensor_reading_blob)
113 | df3.select('pid', 'qualitycheck_time', 'quality').write.format("delta").mode("append").option("maxRecordsPerFile", 50).save(product_quality_blob)
114 |
115 | # COMMAND ----------
116 |
117 | # MAGIC %md
118 | # MAGIC ### Send data for range: > 2019-08-01 00:00:00
119 |
120 | # COMMAND ----------
121 |
122 | # Data after 2nd model deployment
123 | df4 = df.filter(df.timestamp>F.unix_timestamp(F.lit('2019-08-01 00:00:00')).cast('timestamp'))
124 |
125 | # COMMAND ----------
126 |
127 | df4.select('pid', 'process_time', 'temp', 'pressure', 'duration').write.format("delta").mode("append").option("maxRecordsPerFile", 50).save(sensor_reading_blob)
128 | df4.select('pid', 'qualitycheck_time', 'quality').write.format("delta").mode("append").option("maxRecordsPerFile", 50).save(product_quality_blob)
129 |
130 | # COMMAND ----------
131 |
132 |
133 |
--------------------------------------------------------------------------------
/docs/data/data_prep.html:
--------------------------------------------------------------------------------
1 |
2 |
3 |
4 |
5 | data / data_prep - Databricks
6 |
7 |
8 |
9 |
10 |
11 |
12 |
13 |
14 |
15 |
16 |
17 |
18 |
21 |
24 |
25 |
26 |
27 |
42 |
43 |
--------------------------------------------------------------------------------
/docs/img/drift_detection_kpi.png:
--------------------------------------------------------------------------------
https://raw.githubusercontent.com/joelcthomas/modeldrift/d6706d89772fcb5355b031ab82254792e5f6ac02/docs/img/drift_detection_kpi.png
--------------------------------------------------------------------------------
/docs/img/model_drift_architecture.png:
--------------------------------------------------------------------------------
https://raw.githubusercontent.com/joelcthomas/modeldrift/d6706d89772fcb5355b031ab82254792e5f6ac02/docs/img/model_drift_architecture.png
--------------------------------------------------------------------------------
/eda/data_profile.py:
--------------------------------------------------------------------------------
1 | # Databricks notebook source
2 | # MAGIC %run ../utils/data_generator
3 |
4 | # COMMAND ----------
5 |
6 | # MAGIC %md
7 | # MAGIC Data Sample
8 |
9 | # COMMAND ----------
10 |
11 | display(df)
12 |
13 | # COMMAND ----------
14 |
15 | # MAGIC %md
16 | # MAGIC Data Summary
17 |
18 | # COMMAND ----------
19 |
20 | display(df.describe())
21 |
22 | # COMMAND ----------
23 |
24 | # MAGIC %md
25 | # MAGIC Temperature Over Time
26 |
27 | # COMMAND ----------
28 |
29 | display(df)
30 |
31 | # COMMAND ----------
32 |
33 | # MAGIC %md
34 | # MAGIC Pressure Over Time
35 |
36 | # COMMAND ----------
37 |
38 | display(df)
39 |
40 | # COMMAND ----------
41 |
42 | # MAGIC %md
43 | # MAGIC Duration Over Time
44 |
45 | # COMMAND ----------
46 |
47 | display(df)
48 |
49 | # COMMAND ----------
50 |
51 | # MAGIC %md
52 | # MAGIC Is there an easy explanation between these variables and quality? Are the variables related to each other?
53 |
54 | # COMMAND ----------
55 |
56 | import pandas as pd
57 | import matplotlib
58 | import matplotlib.pyplot as plt
59 |
60 | features = ['temp', 'pressure', 'duration', 'quality']
61 | sampled_data = df.select(features).sample(False, 0.99).toPandas()
62 |
63 | axs = pd.scatter_matrix(sampled_data, alpha=0.2, figsize=(7, 7))
64 | n = len(sampled_data.columns)
65 | for i in range(n):
66 | v = axs[i, 0]
67 | v.yaxis.label.set_rotation(0)
68 | v.yaxis.label.set_ha('right')
69 | v.yaxis.label.set_size(6)
70 | h = axs[n-1, i]
71 | h.xaxis.label.set_rotation(90)
72 | h.xaxis.label.set_size(6)
73 | display(plt.show())
74 |
75 | # COMMAND ----------
76 |
77 |
78 |
--------------------------------------------------------------------------------
/eda/model_tryout.py:
--------------------------------------------------------------------------------
1 | # Databricks notebook source
2 | # DBTITLE 1,Get Data and Config
3 | # MAGIC %run ../utils/data_generator
4 |
5 | # COMMAND ----------
6 |
7 | # MAGIC %md
8 | # MAGIC
9 | # MAGIC Data Modeling
10 |
11 | # COMMAND ----------
12 |
13 | # DBTITLE 1,Required ML Libs
14 | from pyspark.ml import Pipeline
15 | from pyspark.ml.feature import VectorAssembler, StandardScaler, IndexToString, StringIndexer
16 | from pyspark.ml.classification import RandomForestClassifier
17 | from pyspark.ml.evaluation import MulticlassClassificationEvaluator
18 |
19 | # COMMAND ----------
20 |
21 | # DBTITLE 1,Initialize MLflow Settings
22 | import mlflow
23 | import mlflow.mleap
24 | import mlflow.spark
25 | mlflow.set_experiment(mlflow_exp_loc)
26 |
27 | # COMMAND ----------
28 |
29 | # DBTITLE 1,Train & Test Data
30 | (train_data, test_data) = df.randomSplit([0.8, 0.2])
31 |
32 | # COMMAND ----------
33 |
34 | # MAGIC %md
35 | # MAGIC
36 | # MAGIC Model Pipeline
37 | # MAGIC
38 | # MAGIC ### Model -> Tune -> Evaluate -> MLflow
39 |
40 | # COMMAND ----------
41 |
42 | # Identify and index labels that could be fit through classification pipeline
43 | labelIndexer = StringIndexer(inputCol="quality", outputCol="indexedLabel").fit(df)
44 |
45 | # Incorporate all input fields as vector for classificaion pipeline
46 | assembler = VectorAssembler(inputCols=['temp', 'pressure', 'duration'], outputCol="features_assembler").setHandleInvalid("skip")
47 |
48 | # Scale input fields using standard scale
49 | scaler = StandardScaler(inputCol="features_assembler", outputCol="features")
50 |
51 | # Convert/Lookup prediction label index to actual label
52 | labelConverter = IndexToString(inputCol="prediction", outputCol="predicted_quality", labels=labelIndexer.labels)
53 |
54 | # COMMAND ----------
55 |
56 | def classificationModel(stages, params, train, test):
57 | pipeline = Pipeline(stages=stages)
58 |
59 | with mlflow.start_run(run_name=mlflow_exp_name) as ml_run:
60 | for k,v in params.items():
61 | mlflow.log_param(k, v)
62 |
63 | mlflow.set_tag("state", "dev")
64 |
65 | model = pipeline.fit(train)
66 | predictions = model.transform(test)
67 |
68 | evaluator = MulticlassClassificationEvaluator(
69 | labelCol="indexedLabel", predictionCol="prediction", metricName="accuracy")
70 | accuracy = evaluator.evaluate(predictions)
71 | predictions.select("predicted_quality", "quality").groupBy("predicted_quality", "quality").count().toPandas().to_pickle("confusion_matrix.pkl")
72 |
73 | mlflow.log_metric("accuracy", accuracy)
74 | mlflow.log_artifact("confusion_matrix.pkl")
75 | mlflow.spark.log_model(model, "spark-model")
76 |
77 | print("Documented with MLflow Run id %s" % ml_run.info.run_uuid)
78 |
79 | return model, predictions, accuracy, ml_run.info
80 |
81 | # COMMAND ----------
82 |
83 | numTreesList = [10, 25, 50]
84 | maxDepthList = [3, 10, 5]
85 | for numTrees, maxDepth in [(numTrees,maxDepth) for numTrees in numTreesList for maxDepth in maxDepthList]:
86 | params = {"numTrees":numTrees, "maxDepth":maxDepth, "model": "RandomForest"}
87 | params.update(dg_noise)
88 | params.update(model_data_date)
89 | rf = RandomForestClassifier(labelCol="indexedLabel", featuresCol="features", numTrees=numTrees, maxDepth=maxDepth)
90 | model, predictions, accuracy, ml_run_info = classificationModel([labelIndexer, assembler, scaler, rf, labelConverter], params, train_data, test_data)
91 | print("Trees: %s, Depth: %s, Accuracy: %s\n" % (numTrees, maxDepth, accuracy))
92 |
93 | # COMMAND ----------
94 |
95 | # MAGIC %md
96 | # MAGIC ### Get Best Run and Metric from MLflow
97 |
98 | # COMMAND ----------
99 |
100 | mlflow_experiment_id = ml_run_info.experiment_id
101 | mlflowclient = mlflow.tracking.MlflowClient()
102 | best_run = None
103 | mlflow_search_query = "params.model = 'RandomForest' and params.model_data_date = '"+ model_data_date['model_data_date'] +"'"
104 | runs = mlflowclient.search_runs([mlflow_experiment_id],"")
105 | for run in runs:
106 | if best_run is None or run.data.metrics[model_compare_metric] > best_run[1]:
107 | best_run = (run.info.run_uuid,run.data.metrics[model_compare_metric])
108 | best_runid = best_run[0]
109 |
110 | # COMMAND ----------
111 |
112 | mlflowclient.get_run(best_runid).to_dictionary()["data"]["params"]
113 |
114 | # COMMAND ----------
115 |
116 | mlflowclient.get_run(best_runid).to_dictionary()["data"]["metrics"]
117 |
118 | # COMMAND ----------
119 |
120 | # MAGIC %md
121 | # MAGIC ### Confusion Matrix for Best Run
122 |
123 | # COMMAND ----------
124 |
125 | artifact_uri = mlflowclient.get_run(best_runid).to_dictionary()["info"]["artifact_uri"]
126 | confusion_matrix_uri = "/" + artifact_uri.replace(":","") + "/confusion_matrix.pkl"
127 | confusion_matrix_uri
128 |
129 | # COMMAND ----------
130 |
131 | import pandas as pd
132 | import numpy as np
133 | confmat = pd.read_pickle(confusion_matrix_uri)
134 | confmat = pd.pivot_table(confmat, values="count", index=["predicted_quality"], columns=["quality"], aggfunc=np.sum, fill_value=0)
135 |
136 | # COMMAND ----------
137 |
138 | import matplotlib.pyplot as plt
139 | import seaborn as sns
140 |
141 | fig = plt.figure(figsize=(4,4))
142 |
143 | sns.heatmap(confmat, annot=True, fmt="d", square=True, cmap="OrRd")
144 | plt.yticks(rotation=0)
145 | plt.xticks(rotation=90)
146 |
147 | display(fig)
148 |
149 | # COMMAND ----------
150 |
151 | # MAGIC %md
152 | # MAGIC ## Post Model Inference
153 | # MAGIC Simulating based on data - Replace with getting model from MLflow
154 |
155 | # COMMAND ----------
156 |
157 | post_model_predictions = model.transform(df.union(post_df)) # User post_df eventually
158 | # post_model_predictions = model.transform(post_df) # User post_df eventually
159 |
160 | # COMMAND ----------
161 |
162 | post_model_predictions = post_model_predictions.withColumn(
163 | 'accurate_prediction',
164 | F.when((F.col('quality')==F.col('predicted_quality')), 1)\
165 | .otherwise(0)
166 | )
167 |
168 | # COMMAND ----------
169 |
170 | from pyspark.sql import Window
171 |
172 | # COMMAND ----------
173 |
174 | prediction_summary = (post_model_predictions.groupBy(F.window(F.col('timestamp'), '1 day').alias('window'), F.col('predicted_quality'))
175 | .count()
176 | .withColumn('window_day', F.expr('to_date(window.start)'))
177 | .withColumn('total',F.sum(F.col('count')).over(Window.partitionBy('window_day')))
178 | .withColumn('ratio', F.col('count')*100/F.col('total'))
179 | .select('window_day','predicted_quality', 'count', 'total', 'ratio')
180 | .orderBy('window_day')
181 | )
182 | display(prediction_summary)
183 |
184 | # COMMAND ----------
185 |
186 | # MAGIC %md
187 | # MAGIC ### Trend Showing Model Drift
188 |
189 | # COMMAND ----------
190 |
191 | accurate_prediction_summary = (post_model_predictions.groupBy(F.window(F.col('timestamp'), '1 day').alias('window'), F.col('accurate_prediction'))
192 | .count()
193 | .withColumn('window_day', F.expr('to_date(window.start)'))
194 | .withColumn('total',F.sum(F.col('count')).over(Window.partitionBy('window_day')))
195 | .withColumn('ratio', F.col('count')*100/F.col('total'))
196 | .select('window_day','accurate_prediction', 'count', 'total', 'ratio')
197 | .withColumn('accurate_prediction', F.when(F.col('accurate_prediction')==1, 'Accurate').otherwise('Inaccurate'))
198 | .orderBy('window_day')
199 | )
200 |
201 | # COMMAND ----------
202 |
203 | accurate_prediction_summary_2 = (post_model_predictions.groupBy(F.window(F.col('timestamp'), '1 day').alias('window'), F.col('accurate_prediction'))
204 | .count()
205 | .withColumn('window_day', F.expr('to_date(window.start)'))
206 | .withColumn('total',F.sum(F.col('count')).over(Window.partitionBy('window_day')))
207 | .withColumn('ratio', F.col('count')*100/F.col('total'))
208 | .select('window_day','accurate_prediction', 'count', 'total', 'ratio')
209 | .withColumn('accurate_prediction', F.when(F.col('accurate_prediction')==1, 'Accurate').otherwise('Inaccurate'))
210 | .orderBy('window_day')
211 | )
212 |
213 | # COMMAND ----------
214 |
215 | import matplotlib.patches as patches
216 | sns.set(style='dark')
217 | sns.set()
218 | fig, ax = plt.subplots(figsize=(14,4))
219 |
220 | sns.lineplot(x='window_day', y='ratio', hue='accurate_prediction', style='accurate_prediction', data = accurate_prediction_summary.filter(accurate_prediction_summary.window_day < '2019-07-21').toPandas())
221 | sns.lineplot(x='window_day', y='ratio', hue='accurate_prediction', style='accurate_prediction', legend=False, alpha=0.2, data = accurate_prediction_summary.toPandas())
222 | sns.lineplot(x='window_day', y='ratio', hue='accurate_prediction', style='accurate_prediction', legend=False, alpha=1, data = accurate_prediction_summary_2.toPandas())
223 | plt.yticks(rotation=0)
224 | plt.xticks(rotation=0)
225 | plt.ylabel('% in population')
226 | plt.xlabel('Date')
227 |
228 | ax.axvline(x='2019-07-10', linewidth=1, linestyle='--', alpha=0.3)
229 | ax.axvline(x='2019-07-19', linewidth=1, linestyle='--', alpha=0.3)
230 | ax.axvline(x='2019-07-28', linewidth=1, linestyle='--', alpha=0.3)
231 |
232 | ax.legend(bbox_to_anchor=(1.1, 1.05))
233 |
234 | rect = patches.Rectangle(
235 | xy=(ax.get_xlim()[0], 80),
236 | width=ax.get_xlim()[1]-ax.get_xlim()[0],
237 | height=20,
238 | color='green', alpha=0.1, ec='red'
239 | )
240 | ax.add_patch(rect)
241 |
242 | fig.tight_layout()
243 | display(fig)
244 | plt.close(fig)
245 |
246 | # COMMAND ----------
247 |
248 | display(accurate_prediction_summary.filter(accurate_prediction_summary.window_day > '2019-07-20'))
249 |
250 | # COMMAND ----------
251 |
252 |
253 |
--------------------------------------------------------------------------------
/glassware_quality_control.py:
--------------------------------------------------------------------------------
1 | # Databricks notebook source
2 | # MAGIC %md
3 | # MAGIC # Glassware Quality Control
4 |
5 | # COMMAND ----------
6 |
7 | # MAGIC %md
8 | # MAGIC ### Objective:
9 | # MAGIC - To predict and grade the quality of the product as they are made, prior to actual inspection process which are a day or two later.
10 | # MAGIC - This could act as an early indicator of quality for process optimization, and to send lower quality products for additional inspection and categorization.
11 | # MAGIC
12 | # MAGIC ### About Data:
13 | # MAGIC - sensor_reading - Sensor data from manufacturing equipment is streamed through IoT devices. Final aggregated data includes Temperature, and Pressure, along with process duration.
14 | # MAGIC - product_quality - For each product id, actual quality categorization is available
15 |
16 | # COMMAND ----------
17 |
18 | # MAGIC %md
19 | # MAGIC ### Architecture Reference
20 | # MAGIC
21 | # MAGIC
22 | # MAGIC
23 |
24 | # COMMAND ----------
25 |
26 | # MAGIC %md
27 | # MAGIC ### End to End Pipeline
28 | # MAGIC ### Data Access -> Data Prep -> Model Training -> Deployment -> Monitoring -> Action & Feedback Loop
29 |
30 | # COMMAND ----------
31 |
32 | # MAGIC %run ./config
33 |
34 | # COMMAND ----------
35 |
36 | # MAGIC %md ## Data Access & Prep
37 |
38 | # COMMAND ----------
39 |
40 | # MAGIC %md
41 | # MAGIC __Setup access to blob storage, where data is streamed from and to, in delta lake__
42 |
43 | # COMMAND ----------
44 |
45 | # MAGIC %run ./data/data_access
46 |
47 | # COMMAND ----------
48 |
49 | # MAGIC %md
50 | # MAGIC __Read sensor_reading & product_quality, join and prepare the data to be fed for model training__
51 |
52 | # COMMAND ----------
53 |
54 | # MAGIC %run ./data/data_prep
55 |
56 | # COMMAND ----------
57 |
58 | # MAGIC %md
59 | # MAGIC ### Assume today is 2019-07-11
60 | # MAGIC __Using data from (2019-07-01 - 2019-07-10) to generate models, for which sensor_reading and product_quality data are available__
61 | # MAGIC
62 | # MAGIC __To reproduce this demo, generate and push initial set of data using ./demo_utils/demo_data_init __
63 |
64 | # COMMAND ----------
65 |
66 | # MAGIC %md
67 | # MAGIC __Prior to production workflow, typically one could setup a notebook for EDA, get familiar with dataset, and explore modeling methods__
68 | # MAGIC __Check EDA notebook example here, for this project__
69 |
70 | # COMMAND ----------
71 |
72 | today_date = '2019-07-11 18:00'
73 |
74 | # COMMAND ----------
75 |
76 | model_data_date = {'start_date':'2019-07-01 00:00:00', 'end_date':'2019-07-10 23:59:00'}
77 | model_df = model_data(model_data_date)
78 | display(model_df)
79 |
80 | # COMMAND ----------
81 |
82 | # MAGIC %md ## Model Training & Tuning
83 |
84 | # COMMAND ----------
85 |
86 | # MAGIC %md
87 | # MAGIC __Run various models (Random Forest, Decision Tree, XGBoost), each with its own set of hyperparameters, and log all the information to MLflow__
88 |
89 | # COMMAND ----------
90 |
91 | # MAGIC %run ./glassware_quality_modeler/generate_models
92 |
93 | # COMMAND ----------
94 |
95 | # MAGIC %md ## Model Selection & Deployment
96 |
97 | # COMMAND ----------
98 |
99 | # MAGIC %md
100 | # MAGIC __Search MLflow to find the best model from above experiment runs across all model types__
101 |
102 | # COMMAND ----------
103 |
104 | mlflow_search_query = "params.model_data_date = '"+ model_data_date['start_date']+ ' - ' + model_data_date['end_date']+"'"
105 | best_run_details = best_run(mlflow_exp_id, mlflow_search_query)
106 |
107 | print("Best run from all trials:" + best_run_details['runid'])
108 | print("Params:")
109 | print(best_run_details["params"])
110 | print("Metrics:")
111 | print(best_run_details["metrics"])
112 |
113 | # COMMAND ----------
114 |
115 | # MAGIC %md
116 | # MAGIC __Mark the best run as production in MLflow, to be used during scoring__
117 |
118 | # COMMAND ----------
119 |
120 | push_model_production(mlflow_exp_id, best_run_details['runid'], userid, today_date)
121 |
122 | # COMMAND ----------
123 |
124 | # MAGIC %md ## Model Scoring
125 |
126 | # COMMAND ----------
127 |
128 | get_model_production(mlflow_exp_id)
129 |
130 | # COMMAND ----------
131 |
132 | # MAGIC %run ./glassware_quality_scorer/score_quality
133 |
134 | # COMMAND ----------
135 |
136 | # MAGIC %md
137 | # MAGIC __Read the sensor_reading stream, apply model scoring, and write the output stream as 'predicted_quality' delta table__
138 |
139 | # COMMAND ----------
140 |
141 | sensor_reading_stream = stream_sensor_reading()
142 | predict_stream = stream_score_quality(sensor_reading_stream)
143 |
144 | # COMMAND ----------
145 |
146 | # MAGIC %md ## Model Monitoring & Feedback
147 |
148 | # COMMAND ----------
149 |
150 | # MAGIC %run ./model_quality/model_quality_monitor
151 |
152 | # COMMAND ----------
153 |
154 | predicted_quality = get_predicted_quality()
155 | product_quality = get_product_quality()
156 | model_quality_summary = track_model_quality(product_quality, predicted_quality)
157 |
158 | # COMMAND ----------
159 |
160 | display(model_quality_summary)
161 |
162 | # COMMAND ----------
163 |
164 | # MAGIC %md
165 | # MAGIC ### Assume today is 2019-07-16
166 |
167 | # COMMAND ----------
168 |
169 | plot_model_quality(model_quality_summary)
170 |
171 | # COMMAND ----------
172 |
173 | # MAGIC %md
174 | # MAGIC ### Assume today is 2019-07-21
175 | # MAGIC __To reproduce this demo, push data for range 2019-07-16 - 2019-07-21 using ./demo_utils/demo_data_init __
176 |
177 | # COMMAND ----------
178 |
179 | today_date = '2019-07-21 01:00'
180 |
181 | # COMMAND ----------
182 |
183 | model_quality_summary = track_model_quality(get_product_quality(), get_predicted_quality())
184 | plot_model_quality(model_quality_summary)
185 |
186 | # COMMAND ----------
187 |
188 | # MAGIC %md
189 | # MAGIC We see drift occurs on 07/20 (based on process date)
190 |
191 | # COMMAND ----------
192 |
193 | # MAGIC %md ## Retrain After Drift
194 |
195 | # COMMAND ----------
196 |
197 | # MAGIC %md
198 | # MAGIC __Read sensor_reading & product_quality, join and prepare the data to be fed for model training__
199 |
200 | # COMMAND ----------
201 |
202 | model_data_date = {'start_date':'2019-07-19 00:00:00', 'end_date':'2019-07-21 00:00:00'}
203 | model_df = model_data(model_data_date)
204 | display(model_df)
205 |
206 | # COMMAND ----------
207 |
208 | # MAGIC %md
209 | # MAGIC __Run various models (Random Forest, Decision Tree, XGBoost), each with its own set of hyperparameters, and log all the information to MLflow__
210 |
211 | # COMMAND ----------
212 |
213 | # MAGIC %run ./glassware_quality_modeler/generate_models
214 |
215 | # COMMAND ----------
216 |
217 | # MAGIC %md
218 | # MAGIC __Search MLflow to find the best model from above experiment runs across all model types__
219 |
220 | # COMMAND ----------
221 |
222 | mlflow_search_query = "params.model_data_date = '"+ model_data_date['start_date']+ ' - ' + model_data_date['end_date']+"'"
223 | best_run_details = best_run(mlflow_exp_id, mlflow_search_query)
224 |
225 | print("Best run from all trials:" + best_run_details['runid'])
226 | print("Params:")
227 | print(best_run_details["params"])
228 | print("Metrics:")
229 | print(best_run_details["metrics"])
230 |
231 | # COMMAND ----------
232 |
233 | # MAGIC %md
234 | # MAGIC __Mark the best run as production in MLflow, to be used during scoring__
235 |
236 | # COMMAND ----------
237 |
238 | push_model_production(mlflow_exp_id, best_run_details['runid'], userid, today_date)
239 |
240 | # COMMAND ----------
241 |
242 | predict_stream.stop()
243 | predict_stream = stream_score_quality(stream_sensor_reading())
244 |
245 | # COMMAND ----------
246 |
247 | # MAGIC %md
248 | # MAGIC __Summary after retrain__
249 |
250 | # COMMAND ----------
251 |
252 | # MAGIC %md
253 | # MAGIC ### Assume today is 2019-08-01
254 | # MAGIC __To reproduce this demo, push data for range 2019-07-21 - 2019-08-01 using ./demo_utils/demo_data_init __
255 |
256 | # COMMAND ----------
257 |
258 | model_quality_summary = track_model_quality(get_product_quality(), get_predicted_quality())
259 | plot_model_quality(model_quality_summary)
260 |
261 | # COMMAND ----------
262 |
263 | # MAGIC %md
264 | # MAGIC ### Assume today is 2019-08-12
265 | # MAGIC __To reproduce this demo, push data for range > 2019-08-01 using ./demo_utils/demo_data_init __
266 |
267 | # COMMAND ----------
268 |
269 | model_quality_summary = track_model_quality(get_product_quality(), get_predicted_quality())
270 | plot_model_quality(model_quality_summary)
271 |
272 | # COMMAND ----------
273 |
274 | # MAGIC %md
275 | # MAGIC __ Let's see what would have happened if model was not updated?__
276 |
277 | # COMMAND ----------
278 |
279 | predicted_quality = score_quality(get_sensor_reading(), 'd45cd111bc2d49409bb9ccd5df94507d')
280 | model_quality_summary = track_model_quality(get_product_quality(), predicted_quality)
281 | plot_model_quality(model_quality_summary)
282 |
283 | # COMMAND ----------
284 |
285 | # MAGIC %md ## Summary
286 |
287 | # COMMAND ----------
288 |
289 | predicted_quality = score_quality(get_sensor_reading(), 'd45cd111bc2d49409bb9ccd5df94507d')
290 | model_quality_summary_1 = track_model_quality(get_product_quality(), predicted_quality)
291 | predicted_quality = score_quality(get_sensor_reading(), '34c33e631fd441a9be329a600550f4c1')
292 | model_quality_summary_2 = track_model_quality(get_product_quality(), predicted_quality)
293 |
294 | # COMMAND ----------
295 |
296 | plot_summary(model_quality_summary_1, model_quality_summary_2)
297 |
--------------------------------------------------------------------------------
/glassware_quality_modeler/generate_models.py:
--------------------------------------------------------------------------------
1 | # Databricks notebook source
2 | # DBTITLE 1,Run Random Forest
3 | # MAGIC %run ./model_random_forest
4 |
5 | # COMMAND ----------
6 |
7 | print("Modeling using Random Forest:")
8 | best_rf_run = run_randomforest(model_df)
9 |
10 | # COMMAND ----------
11 |
12 | print("Best run within Random Forest trials:" + best_rf_run['runid'])
13 | print("Params:")
14 | print(best_rf_run["params"])
15 | print("Metrics:")
16 | print(best_rf_run["metrics"])
17 |
18 | # COMMAND ----------
19 |
20 | display(plot_confusion_matrix(best_rf_run['confusion_matrix_uri']))
21 |
22 | # COMMAND ----------
23 |
24 | # DBTITLE 1,Run Decision Tree
25 | # MAGIC %run ./model_decision_tree
26 |
27 | # COMMAND ----------
28 |
29 | print("Modeling using Decision Tree:")
30 | best_dt_run = run_decisiontree(model_df)
31 |
32 | # COMMAND ----------
33 |
34 | print("Best run within Random Forest trials:" + best_dt_run['runid'])
35 | print("Params:")
36 | print(best_dt_run["params"])
37 | print("Metrics:")
38 | print(best_dt_run["metrics"])
39 |
40 | # COMMAND ----------
41 |
42 | display(plot_confusion_matrix(best_dt_run['confusion_matrix_uri']))
43 |
44 | # COMMAND ----------
45 |
46 | #%run ./model_xgboost
47 |
--------------------------------------------------------------------------------
/glassware_quality_modeler/model_decision_tree.py:
--------------------------------------------------------------------------------
1 | # Databricks notebook source
2 | # DBTITLE 1,Required ML Libs
3 | from pyspark.ml import Pipeline
4 | from pyspark.ml.feature import VectorAssembler, StandardScaler, IndexToString, StringIndexer
5 | from pyspark.ml.classification import DecisionTreeClassifier
6 | from pyspark.ml.evaluation import MulticlassClassificationEvaluator
7 |
8 | # COMMAND ----------
9 |
10 | def decisiontree_model(stages, params, train, test):
11 | pipeline = Pipeline(stages=stages)
12 |
13 | with mlflow.start_run(experiment_id=mlflow_exp_id) as ml_run:
14 | for k,v in params.items():
15 | mlflow.log_param(k, v)
16 |
17 | mlflow.set_tag("state", "dev")
18 |
19 | model = pipeline.fit(train)
20 | predictions = model.transform(test)
21 |
22 | evaluator = MulticlassClassificationEvaluator(
23 | labelCol="indexedLabel", predictionCol="prediction", metricName="accuracy")
24 | accuracy = evaluator.evaluate(predictions)
25 | predictions.select("predicted_quality", "quality").groupBy("predicted_quality", "quality").count().toPandas().to_pickle("confusion_matrix.pkl")
26 |
27 | mlflow.log_metric("accuracy", accuracy)
28 | mlflow.log_artifact("confusion_matrix.pkl")
29 | mlflow.spark.log_model(model, "spark-model")
30 |
31 | print("Documented with MLflow Run id %s" % ml_run.info.run_uuid)
32 |
33 | return model, predictions, accuracy, ml_run.info
34 |
35 | # COMMAND ----------
36 |
37 | def run_decisiontree(df):
38 |
39 | (train_data, test_data) = df.randomSplit([0.8, 0.2], 1234)
40 |
41 | labelIndexer = StringIndexer(inputCol="quality", outputCol="indexedLabel").fit(df) # Identify and index labels that could be fit through classification pipeline
42 | assembler = VectorAssembler(inputCols=['temp', 'pressure', 'duration'], outputCol="features").setHandleInvalid("skip") # Incorporate all input fields as vector for classificaion pipeline
43 | # scaler = StandardScaler(inputCol="features_assembler", outputCol="features") # Scale input fields using standard scale
44 | labelConverter = IndexToString(inputCol="prediction", outputCol="predicted_quality", labels=labelIndexer.labels) # Convert/Lookup prediction label index to actual label
45 |
46 | maxDepthList = [3, 10, 5]
47 |
48 | for maxDepth in maxDepthList:
49 | params = {"maxDepth":maxDepth, "model": "DecisionTree"}
50 | params.update({"model_data_date":model_data_date['start_date']+ ' - ' + model_data_date['end_date']})
51 | if run_exists(mlflow_exp_id, params):
52 | print("Depth: %s, Run already exists"% (maxDepth))
53 | else:
54 | dt = DecisionTreeClassifier(labelCol="indexedLabel", featuresCol="features", maxDepth=maxDepth, seed=1028)
55 | model, predictions, accuracy, ml_run_info = decisiontree_model([labelIndexer, assembler, dt, labelConverter], params, train_data, test_data)
56 | print("Depth: %s, Accuracy: %s\n" % (maxDepth, accuracy))
57 |
58 | mlflow_search_query = "params.model = 'RandomForest' and params.model_data_date = '"+ model_data_date['start_date']+ ' - ' + model_data_date['end_date']+"'"
59 |
60 | return best_run(mlflow_exp_id, mlflow_search_query)
61 |
62 | # COMMAND ----------
63 |
64 | # display(model.stages[3])
65 |
--------------------------------------------------------------------------------
/glassware_quality_modeler/model_random_forest.py:
--------------------------------------------------------------------------------
1 | # Databricks notebook source
2 | # DBTITLE 1,Required ML Libs
3 | from pyspark.ml import Pipeline
4 | from pyspark.ml.feature import VectorAssembler, StandardScaler, IndexToString, StringIndexer
5 | from pyspark.ml.classification import RandomForestClassifier
6 | from pyspark.ml.evaluation import MulticlassClassificationEvaluator
7 |
8 | # COMMAND ----------
9 |
10 | def randomforest_model(stages, params, train, test):
11 | pipeline = Pipeline(stages=stages)
12 |
13 | with mlflow.start_run(experiment_id=mlflow_exp_id) as ml_run:
14 | for k,v in params.items():
15 | mlflow.log_param(k, v)
16 |
17 | mlflow.set_tag("state", "dev")
18 |
19 | model = pipeline.fit(train)
20 | predictions = model.transform(test)
21 |
22 | evaluator = MulticlassClassificationEvaluator(
23 | labelCol="indexedLabel", predictionCol="prediction", metricName="accuracy")
24 | accuracy = evaluator.evaluate(predictions)
25 | predictions.select("predicted_quality", "quality").groupBy("predicted_quality", "quality").count().toPandas().to_pickle("confusion_matrix.pkl")
26 |
27 | mlflow.log_metric("accuracy", accuracy)
28 | mlflow.log_artifact("confusion_matrix.pkl")
29 | mlflow.spark.log_model(model, "spark-model")
30 |
31 | print("Documented with MLflow Run id %s" % ml_run.info.run_uuid)
32 |
33 | return model, predictions, accuracy, ml_run.info
34 |
35 | # COMMAND ----------
36 |
37 | def run_randomforest(df):
38 |
39 | (train_data, test_data) = df.randomSplit([0.8, 0.2], 1234)
40 |
41 | labelIndexer = StringIndexer(inputCol="quality", outputCol="indexedLabel").fit(df) # Identify and index labels that could be fit through classification pipeline
42 | assembler = VectorAssembler(inputCols=['temp', 'pressure', 'duration'], outputCol="features").setHandleInvalid("skip") # Incorporate all input fields as vector for classificaion pipeline
43 | # scaler = StandardScaler(inputCol="features_assembler", outputCol="features") # Scale input fields using standard scale
44 | labelConverter = IndexToString(inputCol="prediction", outputCol="predicted_quality", labels=labelIndexer.labels) # Convert/Lookup prediction label index to actual label
45 |
46 | numTreesList = [10, 25, 50]
47 | maxDepthList = [3, 10, 5]
48 |
49 | for numTrees, maxDepth in [(numTrees,maxDepth) for numTrees in numTreesList for maxDepth in maxDepthList]:
50 | params = {"numTrees":numTrees, "maxDepth":maxDepth, "model": "RandomForest"}
51 | params.update({"model_data_date":model_data_date['start_date']+ ' - ' + model_data_date['end_date']})
52 | if run_exists(mlflow_exp_id, params):
53 | print("Trees: %s, Depth: %s, Run already exists"% (numTrees, maxDepth))
54 | else:
55 | rf = RandomForestClassifier(labelCol="indexedLabel", featuresCol="features", numTrees=numTrees, maxDepth=maxDepth, seed=512)
56 | model, predictions, accuracy, ml_run_info = randomforest_model([labelIndexer, assembler, rf, labelConverter], params, train_data, test_data)
57 | print("Trees: %s, Depth: %s, Accuracy: %s\n" % (numTrees, maxDepth, accuracy))
58 |
59 | mlflow_search_query = "params.model = 'RandomForest' and params.model_data_date = '"+ model_data_date['start_date']+ ' - ' + model_data_date['end_date']+"'"
60 |
61 | return best_run(mlflow_exp_id, mlflow_search_query)
62 |
--------------------------------------------------------------------------------
/glassware_quality_modeler/model_xgboost.py:
--------------------------------------------------------------------------------
1 | # Databricks notebook source
2 | # MAGIC %sh
3 | # MAGIC sudo apt-get -y install wget
4 | # MAGIC wget -P /tmp https://github.com/dmlc/xgboost/files/2161553/sparkxgb.zip
5 |
6 | # COMMAND ----------
7 |
8 | dbutils.fs.cp("file:/tmp/sparkxgb.zip", "/FileStore/username/sparkxgb.zip")
9 |
10 | # COMMAND ----------
11 |
12 | sc.addPyFile("/dbfs/FileStore/username/sparkxgb.zip")
13 |
14 | # COMMAND ----------
15 |
16 | # DBTITLE 1,Required ML Libs
17 | import os
18 | import pyspark
19 |
20 | from pyspark.sql.types import *
21 | from pyspark.ml.feature import VectorAssembler, StandardScaler, IndexToString, StringIndexer
22 | from pyspark.ml import Pipeline
23 | from pyspark.sql.functions import col
24 | from pyspark.ml.evaluation import MulticlassClassificationEvaluator
25 | from sparkxgb import XGBoostEstimator
26 |
27 | # COMMAND ----------
28 |
29 | def xgboost_model(stages, params, train, test):
30 | pipeline = Pipeline(stages=stages)
31 |
32 | with mlflow.start_run(run_name=mlflow_exp_name) as ml_run:
33 | for k,v in params.items():
34 | mlflow.log_param(k, v)
35 |
36 | mlflow.set_tag("state", "dev")
37 |
38 | model = pipeline.fit(train)
39 | predictions = model.transform(test)
40 |
41 | evaluator = MulticlassClassificationEvaluator(
42 | labelCol="indexedLabel", predictionCol="prediction", metricName="accuracy")
43 | accuracy = evaluator.evaluate(predictions)
44 | predictions.select("predicted_quality", "quality").groupBy("predicted_quality", "quality").count().toPandas().to_pickle("confusion_matrix.pkl")
45 |
46 | mlflow.log_metric("accuracy", accuracy)
47 | mlflow.log_artifact("confusion_matrix.pkl")
48 | mlflow.spark.log_model(model, "spark-model")
49 |
50 | print("Documented with MLflow Run id %s" % ml_run.info.run_uuid)
51 |
52 | return model, predictions, accuracy, ml_run.info
53 |
54 | # COMMAND ----------
55 |
56 | def run_xgboost(df):
57 |
58 | (train_data, test_data) = df.randomSplit([0.8, 0.2])
59 |
60 | labelIndexer = StringIndexer(inputCol="quality", outputCol="indexedLabel").fit(df) # Identify and index labels that could be fit through classification pipeline
61 | assembler = VectorAssembler(inputCols=['temp', 'pressure', 'duration'], outputCol="features_assembler").setHandleInvalid("skip") # Incorporate all input fields as vector for classificaion pipeline
62 | scaler = StandardScaler(inputCol="features_assembler", outputCol="features") # Scale input fields using standard scale
63 | labelConverter = IndexToString(inputCol="prediction", outputCol="predicted_quality", labels=labelIndexer.labels) # Convert/Lookup prediction label index to actual label
64 |
65 | numTreesList = [10, 25, 50]
66 | learningRateList = [.1, .2, .3]
67 |
68 | for numTrees, learningRate in [(numTrees,learningRate) for numTrees in numTreesList for learningRate in learningRateList]:
69 | params = {"numTrees":numTrees, "learningRate":learningRate, "model": "XGBoost"}
70 | params.update(model_data_date)
71 | if run_exists(mlflow_exp_id, params):
72 | print("Trees: %s, learning Rate: %s, Run already exists"% (numTrees, learningRate))
73 | else:
74 | xgboost = XGBoostEstimator(labelCol="indexedLabel", featuresCol="features", eta=learningRate, maxDepth=maxDepth)
75 | model, predictions, accuracy, ml_run_info = xgboost_model([labelIndexer, assembler, scaler, rf, labelConverter], params, train_data, test_data)
76 | print("Trees: %s, learning Rate: %s, Accuracy: %s\n" % (numTrees, learningRate, accuracy))
77 |
78 | mlflow_search_query = "params.model = 'XGBoost' and params.model_data_date = '"+ model_data_date['model_data_date'] +"'"
79 |
80 | return best_run(mlflow_exp_id, mlflow_search_query)
81 |
82 | # COMMAND ----------
83 |
84 |
85 |
--------------------------------------------------------------------------------
/glassware_quality_scorer/score_quality.py:
--------------------------------------------------------------------------------
1 | # Databricks notebook source
2 | def score_quality(df, model_runid):
3 |
4 | run_details = get_run_details(model_runid)
5 | print('Using model version:'+ run_details['runid'])
6 | prod_model = mlflow.spark.load_model(run_details['spark-model'])
7 | predicted_quality = prod_model.transform(df)
8 | predicted_quality = predicted_quality.select('pid', 'process_time', 'predicted_quality')
9 | predicted_quality = predicted_quality.withColumn('model_version', F.lit(run_details['runid']))
10 |
11 | return predicted_quality
12 |
13 | # COMMAND ----------
14 |
15 | def stream_score_quality(df):
16 |
17 | prod_run_details = get_model_production(mlflow_exp_id)
18 | predicted_quality = score_quality(df, prod_run_details['runid'])
19 |
20 | predict_stream = (predicted_quality.writeStream
21 | .format("delta")
22 | .outputMode("append")
23 | .option("checkpointLocation", predicted_quality_cp_blob)
24 | .start(predicted_quality_blob))
25 |
26 | return predict_stream
27 |
--------------------------------------------------------------------------------
/model_drift_webinar.dbc:
--------------------------------------------------------------------------------
https://raw.githubusercontent.com/joelcthomas/modeldrift/d6706d89772fcb5355b031ab82254792e5f6ac02/model_drift_webinar.dbc
--------------------------------------------------------------------------------
/model_quality/model_quality_monitor.py:
--------------------------------------------------------------------------------
1 | # Databricks notebook source
2 | from pyspark.sql import Window
3 | import pyspark.sql.functions as F
4 |
5 | # COMMAND ----------
6 |
7 | def track_model_quality(real, predicted):
8 | quality_compare = predicted.join(real, "pid")
9 | quality_compare = quality_compare.withColumn(
10 | 'accurate_prediction',
11 | F.when((F.col('quality')==F.col('predicted_quality')), 1)\
12 | .otherwise(0)
13 | )
14 |
15 | accurate_prediction_summary = (quality_compare.groupBy(F.window(F.col('process_time'), '1 day').alias('window'), F.col('accurate_prediction'))
16 | .count()
17 | .withColumn('window_day', F.expr('to_date(window.start)'))
18 | .withColumn('total',F.sum(F.col('count')).over(Window.partitionBy('window_day')))
19 | .withColumn('ratio', F.col('count')*100/F.col('total'))
20 | .select('window_day','accurate_prediction', 'count', 'total', 'ratio')
21 | .withColumn('accurate_prediction', F.when(F.col('accurate_prediction')==1, 'Accurate').otherwise('Inaccurate'))
22 | .orderBy('window_day')
23 | )
24 | return accurate_prediction_summary
25 |
--------------------------------------------------------------------------------
/utils/mlflow_utils.py:
--------------------------------------------------------------------------------
1 | # Databricks notebook source
2 | import mlflow
3 | import mlflow.mleap
4 | import mlflow.spark
5 | mlflowclient = mlflow.tracking.MlflowClient()
6 |
7 | # COMMAND ----------
8 |
9 | def best_run(mlflow_experiment_id, mlflow_search_query):
10 | mlflowclient = mlflow.tracking.MlflowClient()
11 | best_run = None
12 | runs = mlflowclient.search_runs([mlflow_experiment_id], mlflow_search_query)
13 | for run in runs:
14 | if best_run is None or run.data.metrics[model_compare_metric] > best_run[1]:
15 | best_run = (run.info.run_uuid,run.data.metrics[model_compare_metric])
16 | best_runid = best_run[0]
17 |
18 | best_run_details = {}
19 | best_run_details['runid'] = best_runid
20 | best_run_details['params'] = mlflowclient.get_run(best_runid).to_dictionary()["data"]["params"]
21 | best_run_details['metrics'] = mlflowclient.get_run(best_runid).to_dictionary()["data"]["metrics"]
22 |
23 | artifact_uri = mlflowclient.get_run(best_runid).to_dictionary()["info"]["artifact_uri"]
24 | best_run_details['confusion_matrix_uri'] = "/" + artifact_uri.replace(":","") + "/confusion_matrix.pkl"
25 | best_run_details['spark-model'] = "/" + artifact_uri.replace(":","") + "/spark-model"
26 |
27 | return best_run_details
28 |
29 | # COMMAND ----------
30 |
31 | def run_exists(mlflow_experiment_id, params):
32 | mlflow_search_query = ' and '.join([f'params.{key} = \'{value}\'' for key, value in params.items()])
33 | runs = mlflowclient.search_runs([mlflow_experiment_id], mlflow_search_query)
34 | if len(runs) > 0: return True
35 | return False
36 |
37 | # COMMAND ----------
38 |
39 | def get_run_details(runid):
40 | run_details = {}
41 | run_details['runid'] = runid
42 | run_details['params'] = mlflowclient.get_run(runid).to_dictionary()["data"]["params"]
43 | run_details['metrics'] = mlflowclient.get_run(runid).to_dictionary()["data"]["metrics"]
44 |
45 | artifact_uri = mlflowclient.get_run(runid).to_dictionary()["info"]["artifact_uri"]
46 | run_details['confusion_matrix_uri'] = "/" + artifact_uri.replace(":","") + "/confusion_matrix.pkl"
47 | run_details['spark-model'] = "/" + artifact_uri.replace(":","") + "/spark-model"
48 |
49 | return run_details
50 |
51 | # COMMAND ----------
52 |
53 | def get_model_production(mlflow_experiment_id):
54 | mlflow_search_query = "tags.state='production'"
55 | run = mlflowclient.search_runs([mlflow_experiment_id], mlflow_search_query)
56 | if run:
57 | runid = run[0].info.run_uuid
58 | return get_run_details(runid)
59 | else:
60 | return 0
61 |
62 | # COMMAND ----------
63 |
64 | def push_model_production(mlflow_experiment_id, runid, userid, start_date):
65 |
66 | if runid!=0:
67 | prod_run_details = get_model_production(mlflow_experiment_id)
68 | if prod_run_details!=0:
69 | terminate_model_production(prod_run_details['runid'], userid, start_date)
70 |
71 | mlflowclient.set_tag(runid, 'state', 'production')
72 | mlflowclient.set_tag(runid, 'production_marked_by', userid)
73 | mlflowclient.set_tag(runid, 'production_start', start_date)
74 | mlflowclient.set_tag(runid, 'production_end', '')
75 | return True
76 | else:
77 | return False
78 |
79 | # COMMAND ----------
80 |
81 | def terminate_model_production(runid, userid, end_date):
82 | if runid!=0:
83 | mlflowclient.set_tag(runid, 'state', 'ex_production')
84 | mlflowclient.set_tag(runid, 'production_marked_by', userid)
85 | mlflowclient.set_tag(runid, 'production_end', end_date)
86 | return True
87 | else:
88 | return False
89 |
--------------------------------------------------------------------------------
/utils/viz_utils.py:
--------------------------------------------------------------------------------
1 | # Databricks notebook source
2 | import pandas as pd
3 | import numpy as np
4 | import matplotlib.pyplot as plt
5 | import matplotlib.patches as patches
6 | import seaborn as sns
7 | import datetime as dt
8 | import matplotlib.dates as mdates
9 |
10 | # COMMAND ----------
11 |
12 | def plot_confusion_matrix(confusion_matrix_uri):
13 | confmat = pd.read_pickle(confusion_matrix_uri)
14 | confmat = pd.pivot_table(confmat, values="count", index=["predicted_quality"], columns=["quality"], aggfunc=np.sum, fill_value=0)
15 |
16 | fig = plt.figure(figsize=(4,4))
17 |
18 | sns.heatmap(confmat, annot=True, fmt="d", square=True, cmap="OrRd")
19 | plt.yticks(rotation=0)
20 | plt.xticks(rotation=90)
21 |
22 | # display(fig)
23 | return fig
24 |
25 | # COMMAND ----------
26 |
27 | def plot_model_quality(df):
28 |
29 | sns.set(style='dark')
30 | sns.set()
31 | fig, ax = plt.subplots(figsize=(14,4))
32 |
33 | hue_order=['Accurate', 'Inaccurate']
34 | sns.lineplot(x='window_day', y='ratio', hue='accurate_prediction', hue_order=hue_order, style='accurate_prediction', style_order=hue_order, alpha=1, data = df.toPandas())
35 | plt.yticks(rotation=0)
36 | plt.xticks(rotation=0)
37 | plt.ylabel('% in population')
38 | plt.xlabel('Date')
39 | plt.title('Model Monitoring KPI over time')
40 |
41 | ax.axvline(x='2019-07-10', linewidth=1, linestyle='--', alpha=0.3)
42 | ax.axvline(x='2019-07-19', linewidth=1, linestyle='--', alpha=0.3)
43 | ax.axvline(x='2019-08-04', linewidth=1, linestyle='--', alpha=0.3)
44 | ax.axvline(x='2019-08-12', linewidth=1, linestyle='--', alpha=0.0)
45 |
46 | ax.legend(bbox_to_anchor=(1.1, 1.05))
47 |
48 | rect = patches.Rectangle(
49 | xy=(ax.get_xlim()[0], 80),
50 | width=ax.get_xlim()[1]-ax.get_xlim()[0],
51 | height=20,
52 | color='green', alpha=0.1, ec='red'
53 | )
54 | ax.add_patch(rect)
55 |
56 | ax.xaxis.set_major_locator(mdates.WeekdayLocator())
57 |
58 | fig.tight_layout()
59 | display(fig)
60 | plt.close(fig)
61 |
62 | return True
63 |
64 | # COMMAND ----------
65 |
66 | def plot_summary(df1, df2):
67 | sns.set(style='dark')
68 | sns.set()
69 | fig, ax = plt.subplots(figsize=(14,4))
70 |
71 | hue_order=['Accurate', 'Inaccurate']
72 | sns.lineplot(x='window_day', y='ratio', hue='accurate_prediction', hue_order=hue_order, style='accurate_prediction', style_order=hue_order, alpha=0.1, data = df1.toPandas())
73 | sns.lineplot(x='window_day', y='ratio', hue='accurate_prediction', hue_order=hue_order, style='accurate_prediction', style_order=hue_order, legend=False, data = df1.filter(df1.window_day < '2019-07-21').toPandas())
74 | sns.lineplot(x='window_day', y='ratio', hue='accurate_prediction', hue_order=hue_order, style='accurate_prediction', style_order=hue_order,legend=False, alpha=1, data = df2.filter(df2.window_day >= '2019-07-21').toPandas())
75 | plt.yticks(rotation=0)
76 | plt.xticks(rotation=0)
77 | plt.ylabel('% in population')
78 | plt.xlabel('Date')
79 | plt.title('Model Monitoring KPI over time')
80 |
81 | ax.axvline(x='2019-07-10', linewidth=1, linestyle='--', alpha=0.3)
82 | ax.axvline(x='2019-07-19', linewidth=1, linestyle='--', alpha=0.3)
83 | ax.axvline(x='2019-08-04', linewidth=1, linestyle='--', alpha=0.3)
84 | ax.axvline(x='2019-08-12', linewidth=1, linestyle='--', alpha=0.0)
85 |
86 | ax.text(mdates.date2num(dt.datetime(2019, 7, 1)), 85, '1st model train data', fontsize=9, alpha=0.5)
87 | ax.text(mdates.date2num(dt.datetime(2019, 7, 11)), 85, '1st model inference', fontsize=9, alpha=0.5)
88 | ax.text(mdates.date2num(dt.datetime(2019, 7, 21)), 85, '2nd model learnt and applied', fontsize=9, alpha=0.5)
89 | ax.text(mdates.date2num(dt.datetime(2019, 7, 23)), 70, 'if model not updated', fontsize=9, alpha=0.5)
90 | ax.text(mdates.date2num(dt.datetime(2019, 7, 18)), 70, '1st drift', fontsize=9, alpha=0.5, ha='right')
91 | ax.text(mdates.date2num(dt.datetime(2019, 8, 4)), 80, '2nd drift', fontsize=9, alpha=0.5, ha='left')
92 |
93 | ax.legend(bbox_to_anchor=(1.1, 1.05))
94 |
95 | rect = patches.Rectangle(
96 | xy=(ax.get_xlim()[0], 80),
97 | width=ax.get_xlim()[1]-ax.get_xlim()[0],
98 | height=20,
99 | color='green', alpha=0.1, ec='red'
100 | )
101 | ax.add_patch(rect)
102 |
103 | ax.xaxis.set_major_locator(mdates.WeekdayLocator())
104 |
105 | fig.tight_layout()
106 | display(fig)
107 | plt.close(fig)
108 |
109 | return True
110 |
--------------------------------------------------------------------------------