 7 |
8 |
9 | ### Why?
10 | Use these charts where the communication goal is to show intent or generality, and not absolute precision. Or just because they're fun and look weird.
11 |
12 |
13 | ### Chart Types
14 |
15 | | Chart Type | API |
16 | | -------------- | ----------------------------------------------------- |
17 | | Bar |
7 |
8 |
9 | ### Why?
10 | Use these charts where the communication goal is to show intent or generality, and not absolute precision. Or just because they're fun and look weird.
11 |
12 |
13 | ### Chart Types
14 |
15 | | Chart Type | API |
16 | | -------------- | ----------------------------------------------------- |
17 | | Bar | 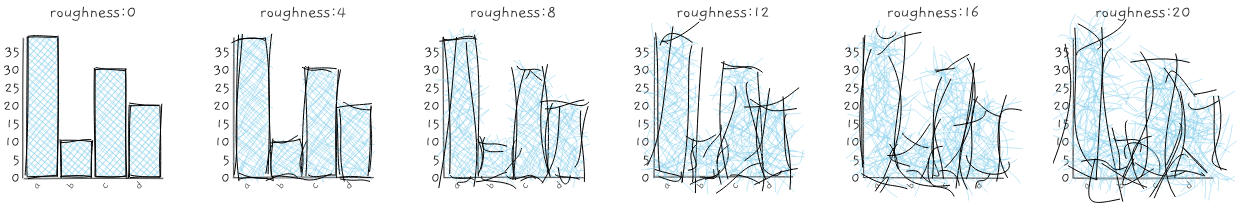 34 |
35 | fillStyle
36 |
34 |
35 | fillStyle
36 | 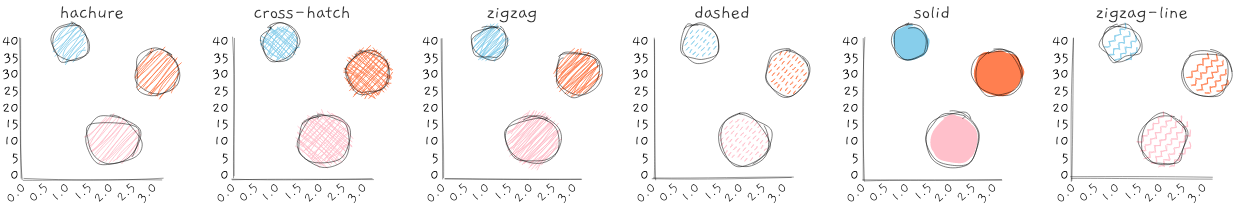 37 |
38 |
39 | **fillWeight**
40 |
37 |
38 |
39 | **fillWeight**
40 | 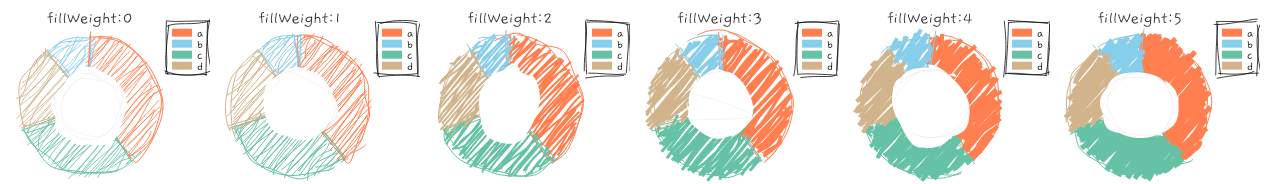 41 |
42 |
43 | As well as additional chart-specific options ([see API below](#API))
44 |
45 |
46 | ### Installation
47 |
48 | Via CDN (expose the `roughViz` global in `html`):
49 |
50 | ```html
51 |
52 | ```
53 |
54 | Via `npm`:
55 |
56 | ```sh
57 | npm install rough-viz
58 | ```
59 | Want to use with `React`? [There's a wrapper!](https://github.com/Chris927/react-roughviz):
60 |
61 | ```sh
62 | npm install react-roughviz
63 | ```
64 |
65 | Want to use with `Vue`? [There's a wrapper!](https://github.com/jolo-dev/vue-roughviz):
66 |
67 | ```sh
68 | npm install vue-roughviz
69 | ```
70 |
71 | Want to use it with `Python`? [Go crazy](https://github.com/charlesdong1991/py-roughviz):
72 |
73 | ```sh
74 | pip install py-roughviz
75 | ```
76 |
77 |
78 | ### How to use
79 |
80 | If you're using ESM, make sure to import the library:
81 |
82 | ```
83 | import roughViz from "rough-viz";
84 | ```
85 |
86 | Create some container elements, one for each chart:
87 |
88 | ```html
89 |
90 |
91 |
92 | ```
93 | In the javascript, just create charts, referencing the desired container:
94 | ```js
95 | // create Bar chart from csv file, using default options
96 | new roughViz.Bar({
97 | element: '#viz0', // container selection
98 | data: 'https://raw.githubusercontent.com/jwilber/random_data/master/flavors.csv',
99 | labels: 'flavor',
100 | values: 'price'
101 | });
102 |
103 | // create Donut chart using defined data & customize plot options
104 | new roughViz.Donut(
105 | {
106 | element: '#viz1',
107 | data: {
108 | labels: ['North', 'South', 'East', 'West'],
109 | values: [10, 5, 8, 3]
110 | },
111 | title: "Regions",
112 | width: window.innerWidth / 4,
113 | roughness: 8,
114 | colors: ['red', 'orange', 'blue', 'skyblue'],
115 | stroke: 'black',
116 | strokeWidth: 3,
117 | fillStyle: 'cross-hatch',
118 | fillWeight: 3.5,
119 | }
120 | );
121 | ```
122 |
123 |
41 |
42 |
43 | As well as additional chart-specific options ([see API below](#API))
44 |
45 |
46 | ### Installation
47 |
48 | Via CDN (expose the `roughViz` global in `html`):
49 |
50 | ```html
51 |
52 | ```
53 |
54 | Via `npm`:
55 |
56 | ```sh
57 | npm install rough-viz
58 | ```
59 | Want to use with `React`? [There's a wrapper!](https://github.com/Chris927/react-roughviz):
60 |
61 | ```sh
62 | npm install react-roughviz
63 | ```
64 |
65 | Want to use with `Vue`? [There's a wrapper!](https://github.com/jolo-dev/vue-roughviz):
66 |
67 | ```sh
68 | npm install vue-roughviz
69 | ```
70 |
71 | Want to use it with `Python`? [Go crazy](https://github.com/charlesdong1991/py-roughviz):
72 |
73 | ```sh
74 | pip install py-roughviz
75 | ```
76 |
77 |
78 | ### How to use
79 |
80 | If you're using ESM, make sure to import the library:
81 |
82 | ```
83 | import roughViz from "rough-viz";
84 | ```
85 |
86 | Create some container elements, one for each chart:
87 |
88 | ```html
89 |
90 |
91 |
92 | ```
93 | In the javascript, just create charts, referencing the desired container:
94 | ```js
95 | // create Bar chart from csv file, using default options
96 | new roughViz.Bar({
97 | element: '#viz0', // container selection
98 | data: 'https://raw.githubusercontent.com/jwilber/random_data/master/flavors.csv',
99 | labels: 'flavor',
100 | values: 'price'
101 | });
102 |
103 | // create Donut chart using defined data & customize plot options
104 | new roughViz.Donut(
105 | {
106 | element: '#viz1',
107 | data: {
108 | labels: ['North', 'South', 'East', 'West'],
109 | values: [10, 5, 8, 3]
110 | },
111 | title: "Regions",
112 | width: window.innerWidth / 4,
113 | roughness: 8,
114 | colors: ['red', 'orange', 'blue', 'skyblue'],
115 | stroke: 'black',
116 | strokeWidth: 3,
117 | fillStyle: 'cross-hatch',
118 | fillWeight: 3.5,
119 | }
120 | );
121 | ```
122 |
123 | 119 |
roughViz.js
122 | 123 | 124 |
127 | Easy, responsive JavaScript library for creating hand-drawn looking
128 | charts in the browser.
129 |
130 |
141 | 157 |
171 | 172 | 175 | 176 | 177 | 178 | 181 | 187 |
188 | 191 |
245 | To see the full list of options for each chart, visit the 246 | GitHub repo. 249 |
250 |256 | Why? roughViz was built to provide an easy way to create 257 | interactive, "sketchy" plots in the browser. Use these charts where 258 | the communication goal is to show intent or generality, and not 259 | absolute precision. Or just because they're fun and look weird! 260 |
261 |
262 | Live, editable examples:
263 | available on observable.
266 | Documentation & API:
267 | available on GitHub.
268 |
Getting Started Is Simple
270 |271 | 1. Import roughViz.js: First, import the library via 272 | a script tag or via npm: 273 |
274 |
275 |
276 |     // Install with cdn:
277 |     <script src="https://unpkg.com/rough-viz@2.0.5"></script>
278 |
279 |     # Install with npm:
280 |     $ npm install rough-viz
281 |
282 | 283 | 2. Create container: Simply create a container div 284 | and assign some dimensions (e.g. width and height). By default, the 285 | roughViz chart will be sized and responsive according to these 286 | dimensions. 287 |
288 |
289 |
290 |    <div id="viz0" style="width: 500px; height: 500px;" ></div>
291 |
292 | 293 | 3. Call chart: Use roughViz to create the desired 294 | chart, and feed in the required arguments. 295 |
296 |
297 |
298 |   // create Donut chart using defined data & customize plot options
299 |   new roughViz.Donut(
300 |     {
301 |       element: '#viz0',
302 |       data: {
303 |         labels: ['North', 'South', 'East', 'West'],
304 |         values: [10, 5, 8, 3]
305 |       },
306 |       title: "Regions",
307 |       roughness: 8,
308 |       colors: ['red', 'orange', 'blue', 'skyblue'],
309 |       stroke: 'black',
310 |       strokeWidth: 3,
311 |       fillStyle: 'cross-hatch',
312 |       fillWeight: 3.5,
313 |     }
314 |   );
315 |
316 | 317 | If you're using npm, simply import the module and use 318 | the roughViz namespace: 319 |
320 |
321 |
322 |       # Install with npm:
323 |       $ npm install rough-viz
324 |
325 |       import { Bar, ... } from 'rough-viz';
326 |
327 | 328 | 329 |
Made by Jared Wilber
330 |331 |