34 |
35 |
36 |
37 |
38 |
39 |
40 |
43 |
44 | {% include meta-footer.html %}
45 |
46 |
47 | {% endif %}
48 |
--------------------------------------------------------------------------------
/_sass/button.scss:
--------------------------------------------------------------------------------
1 | @mixin gradient($from, $to) {
2 | background: -moz-linear-gradient(45deg, $from, $to);
3 | background: -webkit-linear-gradient(45deg, $from, $to);
4 | background: linear-gradient(45deg, $from, $to);
5 | }
6 |
7 | p.btn-stylized {
8 | text-align: center;
9 | }
10 |
11 | .runtime-page {
12 | p.btn-stylized a {
13 | @include gradient(#3EB1F3, #72D9FA);
14 | }
15 | }
16 |
17 | .plus-page {
18 | p.btn-stylized a {
19 | @include gradient(#01CEA2, #61E8CB);
20 | }
21 | }
22 |
23 | .enterprise-page {
24 | p.btn-stylized a {
25 | @include gradient(#7F86F5, #BABEFD);
26 | }
27 | }
28 |
29 | p.btn-stylized a {
30 | display: inline-block;
31 | font-size: 18px;
32 | border-radius: 3px;
33 | color: white !important;
34 | text-decoration: none;
35 | // box-shadow: 0px 2px 10px #999;
36 | box-shadow: 0 5px 20px 0 rgba(0, 0, 0, 0.2);
37 | cursor: pointer;
38 | transition: all 0.3s ease;
39 | margin: 10px;
40 | padding: 10px 20px;
41 | background-size: 250% 100% !important;
42 | background-position: 100% 0% !important;
43 |
44 | &:hover {
45 | background-position: 0% !important;
46 | box-shadow: 0 0 12px #bbb;
47 | transition: all 0.3s ease;
48 | transform: translateY(-1px);
49 | }
50 |
51 | &:active {
52 | transform: translateY(0);
53 | background-position: 50% !important;
54 | }
55 | }
56 |
--------------------------------------------------------------------------------
/_sass/code.scss:
--------------------------------------------------------------------------------
https://raw.githubusercontent.com/keymetrics/doc-pm2/8bf849c8ebf8abeb47c8093beec0299cb9c04d87/_sass/code.scss
--------------------------------------------------------------------------------
/_sass/edit-page.scss:
--------------------------------------------------------------------------------
https://raw.githubusercontent.com/keymetrics/doc-pm2/8bf849c8ebf8abeb47c8093beec0299cb9c04d87/_sass/edit-page.scss
--------------------------------------------------------------------------------
/_sass/faq.scss:
--------------------------------------------------------------------------------
1 | .faq {
2 | h2 {
3 | margin-top: 20px !important;
4 | font-size: 26px !important;
5 | }
6 | details {
7 | margin: 10px 0;
8 | padding: 3px;
9 | border-radius: 4px;
10 | }
11 | summary {
12 | //margin: 10px 0;
13 | &:hover {
14 | cursor:pointer;
15 | opacity: 0.8;
16 | }
17 | }
18 | }
19 |
--------------------------------------------------------------------------------
/_sass/footer.scss:
--------------------------------------------------------------------------------
1 | .footer {
2 | margin-top: 100px;
3 | margin-bottom: 100px;
4 | text-align: center;
5 |
6 | ul {
7 | color: white;
8 | list-style-type: none;
9 | }
10 |
11 | li {
12 | line-height: 30px;
13 | }
14 |
15 | a {
16 | color: white;
17 | text-decoration: none;
18 | }
19 | }
20 |
--------------------------------------------------------------------------------
/_sass/homepage.scss:
--------------------------------------------------------------------------------
1 |
2 | .homepage {
3 | .content-home {
4 | flex: 1;
5 | overflow: auto;
6 | display: flex;
7 | flex-direction: column;
8 | align-items: center;
9 | justify-content: center;
10 | background-image: url($baseurl + "/img/backgrounds/bg-squares.png");
11 | background-position: bottom left;
12 | background-attachment: fixed;
13 | background-color: #131d26;
14 | background-size: cover;
15 |
16 | a {
17 | text-decoration: none;
18 |
19 | :hover {
20 | transition: opacity 0.15s ease-in-out;
21 | opacity: 0.6;
22 | }
23 | }
24 |
25 | .product-line {
26 | text-align: center;
27 | margin-bottom: 50px;
28 | padding: 15px;
29 |
30 | h2 {
31 | margin: 0;
32 | color: white;
33 | margin-top: 15px;
34 | font-size: 24px;
35 | }
36 |
37 | .logo-img {
38 | width: 500px;
39 | display: block;
40 | }
41 | }
42 | }
43 | }
44 |
45 | @media screen and (max-width: $mobile_offset) {
46 | .product-line {
47 | margin-bottom: 30px !important;
48 | }
49 |
50 | h2 {
51 | font-size: 22px !important;
52 | }
53 |
54 | .logo-img {
55 | margin: 0 auto;
56 | width: 250px !important;
57 | }
58 | }
59 |
--------------------------------------------------------------------------------
/_sass/main.scss:
--------------------------------------------------------------------------------
1 | $color_runtime: #3eb1f3;
2 | $color_plus: #01cea2;
3 | $color_enterprise: #7f86f5;
4 | $sidebar-width: 265px;
5 | $header-height: 76px;
6 | $baseurl: "";
7 | $mobile_offset: 768px;
8 |
9 | @import "mobile";
10 | @import "button";
11 | @import "layout";
12 | @import "edit-page";
13 | @import "footer";
14 | @import "header";
15 | @import "markdown";
16 | @import "sidebar";
17 | @import "homepage";
18 | @import "print-layout";
19 | @import "prism";
20 | @import "gitalk";
21 | @import "faq";
22 |
--------------------------------------------------------------------------------
/_sass/mobile.scss:
--------------------------------------------------------------------------------
1 |
2 | @media screen and (max-width:$mobile_offset){
3 | .github-corner,.sidebar,.sidebar-toggle{
4 | position:fixed;
5 | height:200%;
6 | }
7 | .app-nav{
8 | margin-top:16px
9 | }
10 | .app-nav li ul{
11 | top:30px
12 | }
13 | main{
14 | height:auto;
15 | overflow-x:hidden
16 | }
17 | .content{
18 | transition:transform .25s ease
19 | }
20 | .app-nav,.github-corner{
21 | transition:transform .25s ease-out
22 | }
23 | .github-corner:hover .octo-arm{
24 | animation:none
25 | }
26 | .github-corner .octo-arm{
27 | animation:a .56s ease-in-out
28 | }
29 | }
30 |
--------------------------------------------------------------------------------
/_sass/print-layout.scss:
--------------------------------------------------------------------------------
1 | @media print{
2 | body {
3 | overflow: visible !important;
4 | display: block;
5 | font-size: 14px !important;
6 | background-color: white !important;
7 | }
8 | .footer {
9 | display: none;
10 | }
11 | pre, code {
12 | font-size: 13px !important;
13 | }
14 | #gitalk {
15 | display: none;
16 | }
17 | .content-container{
18 | padding: 0px !important;
19 | }
20 | .content {
21 | display: block !important;
22 | .content-main {
23 | max-width: max-content !important;
24 | width: max-content !important;
25 | }
26 | }
27 | .app-nav,.github-corner,.sidebar,.sidebar-toggle, .PM2_search, .header-section{
28 | display:none
29 | }
30 | .markdown-section {
31 | box-shadow: none !important;
32 | }
33 | }
34 |
--------------------------------------------------------------------------------
/_sass/sidebar.scss:
--------------------------------------------------------------------------------
1 |
2 | .sidebar{
3 | transition:transform .25s ease-out;
4 | color: white;
5 | background: #202a37;
6 | border-right:1px solid rgba(0,0,0,.07);
7 | overflow-y:auto;
8 | overflow-x: hidden;
9 | z-index:9;
10 | padding-bottom: 100px;
11 |
12 | .sidebar-nav{
13 | line-height:2em;
14 | padding-bottom:40px
15 | }
16 |
17 | li.collapse .app-sub-sidebar {
18 | display:none
19 | }
20 |
21 | ul {
22 | list-style-type: none;
23 | margin:0;
24 | padding:0
25 | }
26 |
27 | li a {
28 | text-decoration: none;
29 | border-bottom:none;
30 | display:block;
31 | margin: 6px 0 6px 20px;
32 |
33 | &:hover {
34 | opacity: 0.7;
35 | }
36 | }
37 |
38 | ul li ul{
39 | padding-left:20px
40 | }
41 | }
42 |
43 | @media screen and (max-width: $mobile_offset) {
44 | .sidebar {
45 | transform:translateX(-250px)
46 | }
47 | }
48 |
49 | .sidebar.open {
50 | transform:translateX(0px)
51 | }
52 |
53 | .sidebar-nav > ul{
54 | padding: 14px 24px 16px 20px !important
55 | }
56 | .sidebar ul li ul {
57 | padding-left: 12px!important;
58 | }
59 | .sidebar-nav ul li{
60 | margin: 14px 0 0 0;
61 | }
62 | .sidebar-nav > ul > li:first-child {
63 | margin-top: 0px !important;
64 | }
65 |
66 | .sidebar-nav a.active{
67 | color:#3eb1f3!important;
68 | }
69 |
70 | .sidebar ul li a {
71 | color: #fff;
72 | font-weight: 500;
73 | text-align: left;
74 | letter-spacing: 1px;
75 | line-height: 1.6;
76 | font-size: 15px;
77 | }
78 |
79 | .sidebar ul li ul li a {
80 | font-size: 14px;
81 | }
82 |
83 | .runtime-page .sidebar ul li.active>a {
84 | color: $color_runtime;
85 | }
86 |
87 | .plus-page .sidebar ul li.active>a {
88 | color: $color_plus;
89 | }
90 |
91 | .enterprise-page .sidebar ul li.active>a {
92 | color: $color_enterprise;
93 | }
94 |
95 | .sidebar ul li.active>a {
96 | font-weight:600;
97 | border-right:0px;
98 | border-left: 2px solid;
99 | padding-left: 10px;
100 | position: relative;
101 | left: -10px;
102 | }
103 |
--------------------------------------------------------------------------------
/css/main.scss:
--------------------------------------------------------------------------------
1 | ---
2 | ---
3 |
4 | @import "main";
5 |
--------------------------------------------------------------------------------
/css/normalize.css:
--------------------------------------------------------------------------------
1 | /*! normalize.css v7.0.0 | MIT License | github.com/necolas/normalize.css */button,hr,input{overflow:visible}audio,canvas,progress,video{display:inline-block}progress,sub,sup{vertical-align:baseline}[type=checkbox],[type=radio],legend{box-sizing:border-box;padding:0}html{line-height:1.15;-ms-text-size-adjust:100%;-webkit-text-size-adjust:100%}body{margin:0}article,aside,details,figcaption,figure,footer,header,main,menu,nav,section{display:block}h1{font-size:2em;margin:.67em 0}figure{margin:1em 40px}hr{box-sizing:content-box;height:0}code,kbd,pre,samp{font-family:monospace,monospace;font-size:1em}a{background-color:transparent;-webkit-text-decoration-skip:objects}abbr[title]{border-bottom:none;text-decoration:underline;text-decoration:underline dotted}b,strong{font-weight:bolder}dfn{font-style:italic}mark{background-color:#ff0;color:#000}small{font-size:80%}sub,sup{font-size:75%;line-height:0;position:relative}sub{bottom:-.25em}sup{top:-.5em}audio:not([controls]){display:none;height:0}img{border-style:none}svg:not(:root){overflow:hidden}button,input,optgroup,select,textarea{font-family:sans-serif;font-size:100%;line-height:1.15;margin:0}button,select{text-transform:none}[type=reset],[type=submit],button,html [type=button]{-webkit-appearance:button}[type=button]::-moz-focus-inner,[type=reset]::-moz-focus-inner,[type=submit]::-moz-focus-inner,button::-moz-focus-inner{border-style:none;padding:0}[type=button]:-moz-focusring,[type=reset]:-moz-focusring,[type=submit]:-moz-focusring,button:-moz-focusring{outline:ButtonText dotted 1px}fieldset{padding:.35em .75em .625em}legend{color:inherit;display:table;max-width:100%;white-space:normal}textarea{overflow:auto}[type=number]::-webkit-inner-spin-button,[type=number]::-webkit-outer-spin-button{height:auto}[type=search]{-webkit-appearance:textfield;outline-offset:-2px}[type=search]::-webkit-search-cancel-button,[type=search]::-webkit-search-decoration{-webkit-appearance:none}::-webkit-file-upload-button{-webkit-appearance:button;font:inherit}summary{display:list-item}[hidden],template{display:none}
--------------------------------------------------------------------------------
/en/enterprise/collector/overview.md:
--------------------------------------------------------------------------------
1 | ---
2 | layout: page
3 | title: Overview | PM2 Enterprise Documentation
4 | menu: starter
5 | lang: en
6 | section: enterprise
7 | permalink: "/en/enterprise/collector/"
8 | ---
9 |
10 | ## Overview
11 |
12 | When installing PM2 Enterprise, you need to choose how you want to fetch monitoring data. We have multiples way to "collect" the data:
13 |
14 | - PM2 itself embed a agent, which is the default way used by most of our clients: [checkout there]({{ site.baseurl }}{% link en/enterprise/collector/pm2.md %})
15 | - If you want to monitor a Node.js app without PM2 (usually used in containers), you can use our standalone Node.js agent: [checkout there]({{ site.baseurl }}{% link en/enterprise/collector/standalone.md %})
16 | - Use Golang in production? you can use our beta agent: [checkout there]({{ site.baseurl }}{% link en/enterprise/collector/go.md %})
17 | - You already have a Prometheus instance running? You can broadcast metrics from Prometheus to PM2 Enterprise: [checkout there]({{ site.baseurl }}{% link en/enterprise/collector/prometheus.md %})
18 |
--------------------------------------------------------------------------------
/en/enterprise/collector/prometheus.md:
--------------------------------------------------------------------------------
1 | ---
2 | layout: page
3 | title: Prometheus Integration | Guides | PM2 Enterprise Documentation
4 | menu: starter
5 | lang: en
6 | section: enterprise
7 | permalink: "/en/enterprise/collector/prometheus/"
8 | ---
9 |
10 | ## Overview
11 |
12 | When setting up the monitoring for your production environment, you might have already ran a Prometheus server and maybe a graphana dashboard.
13 | Even if it's possible to re-add everything on PM2 Enterprise, it would take a lot of time, that's why we developed a gateway between any prometheus and our backend.
14 |
15 | It allows you to simply drop in your configuration a remote backend, and it will start saving your metrics in PM2 Enterprise.
16 |
17 | Note that currently only the alerting system works with it, you will be able to trigger alert in PM2 Enterprise from the values of your Prometheus metrics. However we plan to support them in the Dashboards in the near future.
18 |
19 | ## Requirements
20 |
21 | The Prometheus team built a feature called `adapter` that lets you push metrics from prometheus thought HTTP. We currently only support the version `0.1.0` of this feature is supported, if you need a specific version, ask to our sales team directly.
22 | We also currently support the `snappy` compression and the `protobuf` serialization, again ask us if you need something special.
23 |
24 | ## Configuration
25 |
26 | If all the versions are good, you simply need to add this snipet to your prometheus configuration:
27 | ```yaml
28 | remote_write:
29 | - url: https://secret_endpoint/receive
30 | basic_auth:
31 | username: publicKey
32 | password: privateKey
33 | ```
34 |
35 | Where both `publicKey` and `privateKey` are the one you can find on the dashboard.
36 | As you can see we didn't yet document the actual endpoint to push data, it's because in a private beta so if you want to try it out, just contact our sales team !
37 |
38 | ## Best practices
39 |
40 | Please check that you are correctly pushing with the `HTTPS` protocol, since by default the adapter push in HTTP with is not secure at all.
41 | A part from that no specific action is required from you to ensure best practices.
42 |
43 | ## Questions / Answers
44 |
45 | * Why do we need to still host a prometheus instance ourselves?
46 |
47 | Because prometheus is what is called `pull based` monitoring, that means it the server that request the metrics to the client. We however are `push based` which means that you receive data from our agents that collect the metrics for us. So basically it's by design really hard to do that in our case (it would be easier if we were `pull based`). Also from a security point, you would need to expose your metrics page to the internet so our servers can reach them which is a nightmare in a security point of view.
48 |
49 | ## Common Issues
50 |
51 | * I doesn't work, i can't see any data on the dashboard !
52 |
53 | Check the prometheus server logs for any errors, check the authentication details. Also please note that our system need few minutes for data to show up in the metrics list when you start pushing a new one.
54 |
--------------------------------------------------------------------------------
/en/enterprise/frontend-monitoring/install.md:
--------------------------------------------------------------------------------
1 | ---
2 | layout: page
3 | title: Installation | Frontend Monitoring | PM2 Enterprise Documentation
4 | menu: starter
5 | lang: en
6 | section: enterprise
7 | permalink: "/en/enterprise/frontend-monitoring/install/"
8 | ---
9 |
10 | # Frontend Monitoring installation
11 |
12 | First, connect to your PM2 Enterprise dashboard. Go to your bucket, and click on **Frontend** at the top of the page.
13 |
14 | 
15 |
16 | Fill in the small form, by giving your application a name (you will be able to create multiple applications within your dashboard), and listing the domains your application will be accessible from. Make sure to put your main domain first. Enable Webchecks if you want deeper metrics gathered from your main domain.
17 |
18 | 
19 |
20 | After submiting the form, the app will generate an HTML snippet. Just copy and paste it in your Website, just before the `` tag.
21 |
22 | 
23 |
24 | That's it! your Website is starting to be monitored by PM2, and you will see data incoming in realtime.
25 |
26 |
--------------------------------------------------------------------------------
/en/enterprise/frontend-monitoring/overview.md:
--------------------------------------------------------------------------------
1 | ---
2 | layout: page
3 | title: Overview | Frontend Monitoring | PM2 Enterprise Documentation
4 | menu: starter
5 | lang: en
6 | section: enterprise
7 | hide_comments: true
8 | permalink: "/en/enterprise/frontend-monitoring/overview/"
9 | ---
10 |
11 | # Frontend Monitoring overview
12 |
13 | Start monitoring your website frontend inside your PM2 dashboard. This will allow collecting and inspecting:
14 |
15 | * uncaught JavaScript exceptions experienced by your users
16 | * users unexpected behaviors (rage clicks, rage reloads...)
17 | * bad user experiences (slow requests...)
18 |
--------------------------------------------------------------------------------
/en/enterprise/guides/dashboard.md:
--------------------------------------------------------------------------------
1 | ---
2 | layout: page
3 | title: Dashboards | Guides | PM2 Enterprise Documentation
4 | menu: starter
5 | lang: en
6 | section: enterprise
7 | hide_comments: true
8 | permalink: "/en/enterprise/guides/dashboard/"
9 | ---
10 |
11 | # Overview
12 |
13 | It's common in the devops culture to have a screen in your office that monitor the state your production apps.
14 | This feature is actually that. It allows you to see what's going on in realtime so you detect faster any wrong behavior of your application.
15 | We've recently added the possibility to add widget with historic data for any metrics.
16 |
17 | ## Use cases
18 |
19 | #### Have an overview of what's happening
20 |
21 | The main use case of this feature is of course to have an overview of all the important metrics of your app in one place, to avoid looking at multiple dashboards to have all the informations.
22 |
23 | #### Detect error quickly
24 |
25 | The dashboards can also help you detect faster issue if you have a screen constantly showing your dashboard, any developer can look at it and might see a wrong behavior at any time, even before the alerts comes if you have configured some.
26 |
27 | ## Requirements
28 |
29 | In the following documention, we assume that you already have connected your application to PM2 Enterprise (either on-premise and cloud).
30 | We also assume that you know how custom metrics works.
31 |
32 | ## Configuration
33 |
34 | Since the feature is really just customization for your needs, there a no specific configuration to have. You need to evaluate what you want to see on your dashboard and configure each compoments to show you what you want.
35 |
36 | ## Common Questions
37 |
38 | * Is there a way to show historic value of a metric?
39 |
40 | Yes, you need to use the "Metric line chart" widget which allows you to specify a timerange. Other widget are only in realtime.
41 |
42 | * I need to show a metric in a specific way (one that isn't covered by one of your component)?
43 |
44 | We are totally open to implement other components, please contact us so we can discuss that !
45 |
46 | ## Common Issues
47 |
48 | * It's slow on my PC
49 |
50 | The realtime dashboard can cost a lot depending on how much process you want to monitor in realtime, we are constantly looking to optimize our frontend, we advise to contact us so we can inspect the problem and find a solution.
51 |
--------------------------------------------------------------------------------
/en/enterprise/on-premise/README.md:
--------------------------------------------------------------------------------
1 | ---
2 | layout: page
3 | title: On-Premise | PM2 Enterprise Documentation
4 | menu: starter
5 | lang: en
6 | section: enterprise
7 | hide_comments: true
8 | permalink: "/en/enterprise/on-premise/"
9 | redirect_to:
10 | - https://www.github.com/keymetrics/on-premise
11 | ---
12 |
--------------------------------------------------------------------------------
/en/enterprise/on-premise/baremetal.md:
--------------------------------------------------------------------------------
1 | ---
2 | layout: page
3 | title: Deployment on Baremetal Servers | On-Premise | PM2 Enterprise Documentation
4 | menu: starter
5 | lang: en
6 | section: enterprise
7 | permalink: "/en/enterprise/on-premise/baremetal/"
8 | ---
9 |
10 | # Deployment on Baremetal Servers
11 |
12 | Note that this tutorial is only made if you decided to deploy PM2 Enterprise On-Premise. If you use the Cloud based one you can just use it straight from https://app.pm2.io
13 |
14 | ## Requirements
15 |
16 | Install Docker & Docker compose (minimum required version is 1.19.0) in your host machine:
17 |
18 | ```bash
19 | $ sudo wget -qO- https://get.docker.com/ | sh
20 | $ sudo curl -L https://github.com/docker/compose/releases/download/1.19.0/docker-compose-`uname -s`-`uname -m` -o /usr/local/bin/docker-compose
21 | $ sudo chmod +x /usr/local/bin/docker-compose
22 | ```
23 |
24 | Then make sure you have logged-in on the hub to be able to pull the private images:
25 |
26 | ```bash
27 | $ docker login
28 | ```
29 |
30 | ## Steps to Install
31 |
32 | 1. Get the docker-compose.yml file corresponding to your version:
33 |
34 | ```bash
35 | $ wget https://raw.githubusercontent.com/keymetrics/on-premise/master/docker/docker-compose.yml
36 | ```
37 |
38 | Once you have configured the `docker-compose.yml` file start it:
39 |
40 | ```bash
41 | $ docker-compose up -d
42 | ```
43 |
44 | Now connect to:
45 |
46 | ```bash
47 | $ google-chrome http://server-ip/wizard
48 | ```
49 |
50 | Set your License Key and configuration and youre done
51 |
52 | ## Update Procedure
53 |
54 | Just run docker-compose up again and it will pull the latest backend image:
55 |
56 | ```bash
57 | $ docker-compose pull km-api km-front
58 | $ docker-compose restart km-api km-front
59 | ```
60 |
61 | A downtime of around 30 seconds maximum will happen.
62 |
63 | ## FAQ
64 |
65 | - *Backend cannot connect to Elasticsearch*: make sure you have a clean docker installation and there are no conflicting networks (docker networks)
66 |
67 | - *Everything is started as expected but I cannot access the interface / I cannot link PM2*: Make sure you have set the right `KM_SITE_URL` because without a proper value PM2 agent will not be able to connect to the Backend
68 |
69 | - *Do I loose the ES/Mongo data on restart?* No, by default, there are local volumes bound to the
70 |
71 | - *I want to use specific version of mongodb/redis/elasticsearch, is this possible?* No, we currently support mongodb up to 3.4, redis 2/3/4 and elasticsearch 5.5.
72 |
--------------------------------------------------------------------------------
/en/enterprise/on-premise/faq.md:
--------------------------------------------------------------------------------
1 | ---
2 | layout: page
3 | title: FAQ | On-Premise | PM2 Enterprise Documentation
4 | menu: starter
5 | lang: en
6 | section: enterprise
7 | permalink: "/en/enterprise/on-premise/faq/"
8 | ---
9 |
10 | # FAQ
11 |
12 | ## The register hang or don't redirect me to the application
13 |
14 | You need to verify that the `KM_SITE_URL` you configured is the endpoint you use to connect to the frontend. If you modify it, you need to delete the mongodb database afterwards because all the endpoints configurations are stored inside it.
15 |
16 | ## What are the services that are used?
17 |
18 | - http API on port 3010 (access the data, configure bucket etc)
19 | - auth service on port 3100 (register/login etc)
20 | - websocket service on port 4010 (so the frontend can receive update in realtime)
21 | - interaction on port 3900 (listen for PM2 data)
22 | - reverse interaction on port 43554 (listen for a specific connection from PM2, used to send command to it like restart etc)
23 |
24 | ## What is exposed by default?
25 |
26 | Depending on how you deployed the keymetrics enterprise product, there are different answers:
27 |
28 | - **Docker**
29 | - nginx is used to load balance depending on the path, to either the frontend or backend services
30 | - km-front expose the frontend on the port 80
31 | - km-api expose all the backend services
32 | - **AWS**
33 | - Everything is running inside the km-core AMI
34 | - **GCP**
35 | - Same as AWS, everything is running inside the km-core API
36 |
37 |
38 | ## I get a error about `Unknown modifier: $pushAll`, what did i miss?
39 |
40 | We only support mongodb up to version 3.4 for now, you need to downgrade.
41 |
42 | ## How do i configure my pm2 to connect to it?
43 |
44 | When you first register, you should have a bucket created automatically, then you will have connection data in the middle in this format:
45 |
46 | ```bash
47 | > KEYMETRICS_NODE= pm2 link
48 | ```
49 |
50 | You have two way to link your pm2:
51 |
52 | - Connect to the instance where pm2 is and run the command.
53 | - If you have container, just add these environements variables:
54 | - `KEYMETRICS_PUBLIC`: replace with `identifier_two>`
55 | - `KEYMETRICS_SECRET`: replace with ``
56 | - `KEYMETRICS_NODE`: replace with ``
57 | - `INSTANCE_NAME`: (optional) replace it if you want your server in keymetrics to have a fixed name
58 |
59 | Then it should all the instances in the keymetrics frontend in realtime.
60 |
61 | ## How should i run pm2 inside my containers to connect to it?
62 |
63 | We advise you to use `pm2-runtime`, it should be a dropin replacement for node inside your images:
64 |
65 | ```docker
66 | FROM node:8-alpine
67 |
68 | RUN npm install -g pm2 2> /dev/null
69 | [ ... ]
70 | CMD [ "pm2-runtime", "app.js" ] # note that you can use an ecosystem here too
71 | ```
72 |
73 | You can find the flags that you can use [here](https://github.com/Unitech/pm2/blob/master/lib/binaries/Runtime4Docker.js#L17)
74 |
--------------------------------------------------------------------------------
/en/enterprise/on-premise/helm.md:
--------------------------------------------------------------------------------
1 | ---
2 | layout: page
3 | title: Deployment on Kubernetes with Helm | On-Premise | PM2 Enterprise Documentation
4 | menu: starter
5 | lang: en
6 | section: enterprise
7 | permalink: "/en/enterprise/helm/"
8 | ---
9 |
10 | ## Deployment on Kubernetes with Helm
11 |
12 | Documentation about how to deploy the keymetrics on-premise version on Kubernetes using Helm
13 |
14 | ### Requirements
15 |
16 | In the following examples, we assume that you already have a fully working Kubernetes cluster with a working installation of Helm.
17 | To install and learn how to use Helm, you can follow the [Helm Quick Start Guide](https://docs.helm.sh/using_helm/#quickstart).
18 |
19 | ### Setup steps
20 |
21 | #### 1. Clone this repository
22 |
23 | The first step is to locally clone this git repository:
24 |
25 | `git clone https://github.com/keymetrics/on-premise.git km-on-premise`
26 |
27 | `cd km-on-premise/helm/`
28 |
29 | #### 2. Add the "incubator" repository needed for ElasticSearch chart
30 |
31 | Because the ElasticSearch chart isn't a stable chart yet, we need to add its repository to the list of allowed ones.
32 |
33 | `helm repo index incubator --url http://storage.googleapis.com/kubernetes-charts-incubator`
34 |
35 | #### 3. Install the chart
36 |
37 | The automatic installation is done using:
38 |
39 | ```
40 | helm install keymetrics-aio --set km_license= \
41 | --set km_public_dns= \
42 | --set km_smtp_host= \
43 | --set km_smtp_user= \
44 | --set km_smtp_pass= \
45 | --set km_smtp_sender=
46 | ```
47 |
48 | This will install PM2 Plus and its requirements:
49 | - [Redis](https://github.com/kubernetes/charts/tree/master/stable/redis
50 | )
51 | - [ElasticSearch](https://github.com/kubernetes/charts/tree/master/incubator/elasticsearch)
52 | - [MongoDB](https://github.com/kubernetes/charts/tree/master/stable/mongodb)
53 |
54 | These settings are required:
55 |
56 | - `km_license`: You PM2 Plus license key.
57 | - `km_public_dns`: The public dns record that will be pointing to your PM2 Plus instance (needed for requirections).
58 | - `km_smtp_host`: SMTP Server address.
59 | - `km_smtp_user`: SMTP Server username.
60 | - `km_smtp_pass`: SMTP Server password.
61 | - `km_smtp_sender`: Emails used in "From" field of emails.
62 |
63 | Once the installation is done, Helm is going to print a summary of the resources that it created. Make sure to follow the `NOTES` in order to set you DNS correctly and the connect to the web interface.
--------------------------------------------------------------------------------
/en/enterprise/overview.md:
--------------------------------------------------------------------------------
1 | ---
2 | layout: page
3 | title: Overview | PM2 Enterprise Documentation
4 | menu: starter
5 | lang: en
6 | section: enterprise
7 | hide_comments: true
8 | permalink: "/en/enterprise/overview//"
9 | ---
10 |
11 |
12 |
13 |
14 |
15 | P(rocess) M(anager) 2
16 | Enterprise
17 |
18 |
19 | **PM2 Enterprise** is an advanced Node.js toolset that is convenient for high scale or critical Node.js services.
20 | It answers to the need of companies willing to bet a lot on Node.js and be confident on their technology switch.
21 |
22 | Here a quick description of each of the Enterprise feature currently available in the PM2 Enterprise product:
23 |
24 | - Dashboards:
25 | If you have a lot of metrics that you want to track, you might have the problem to display a lot of them the way you want. Each dashboard is customizable, each component on it is configurable (apps/servers/metrics etc) and moveable anywhere on the dashboard.
26 |
27 | - Alerting:
28 | This feature is the opposite of the Anomalies, sometimes you want to create manual alert for specific metrics, with this feature you are able to configure the threshold and the actions that result, you can ask to receive an email, a slack message or trigger pm2 action (like a pm2 restart) directly on application. We also added the possibility to trigger directly profiling into the application if you want to collect cpu or memory profiling on your production environment, it will launch and save it for you to inspect it later.
29 |
30 | - Logs:
31 | Currently PM2 Plus only offer the realtime logs where you can only know what's happening in realtime, with Enterprise we also store the logs of the application so you can checkout them later if you want to, no need to ssh into your servers anymore to see the logs.
32 |
33 | - Memory Profiling:
34 | In PM2 Plus you have the CPU profiling which help you know which function is using the most cpu usage, with Enterprise you have the same system but for the memory, you are able to exactly know which function is allocating memory in your application. It can help you pinpoint exactly which function is responsible for memory leak.
35 | Note that the profiling can be launched in production because it's running in parallel of your application, no need to try to reproduce any cpu/memory issue in development anymore, just launch directly the profiling where the issue is happening.
36 |
37 | - Profiling:
38 | In the Enterprise product, we also added the possibility to store all the profiling that you run on your applications so you can compare them, review them and see how a change in your code is impacting the cpu/memory consumption.
39 |
40 | ## On-premise Installation
41 |
42 | We offer different way of delivering PM2 Enterprise via easily installable on-premise system or dedicated/managed instances.
43 |
44 | [Checkout the on-premise documentation](https://github.com/keymetrics/on-premise)
45 | {: .btn-stylized}
46 |
--------------------------------------------------------------------------------
/en/plus/best-practices/README.md:
--------------------------------------------------------------------------------
1 | ---
2 | layout: page
3 | title: Best Practices | PM2 Plus Documentation
4 | menu: starter
5 | lang: en
6 | section: plus
7 | hide_comments: true
8 | permalink: /en/plus/best-practices/
9 | ---
10 |
11 | # Monitoring Best Practices
12 |
13 | This section gathers best practices to make your app scalable from the beginning.
14 |
15 | - [Metrics Glossary]({{ site.baseurl }}{% link en/plus/best-practices/metrics-glossary.md %})
16 | - [CPU Profiling]({{ site.baseurl }}{% link en/plus/best-practices/cpu-profiling.md %})
17 |
--------------------------------------------------------------------------------
/en/plus/best-practices/memory-profiling.md:
--------------------------------------------------------------------------------
1 | ---
2 | layout: page
3 | title: Memory Profiling | Best Practices | PM2 Plus Documentation
4 | menu: starter
5 | lang: en
6 | section: plus
7 | permalink: /en/plus/best-practices/memory-profiling/
8 | ---
9 |
10 | # Memory Profiling
11 |
12 | Article available soon.
13 |
14 |
28 |
--------------------------------------------------------------------------------
/en/plus/best-practices/metrics-glossary.md:
--------------------------------------------------------------------------------
1 | ---
2 | layout: page
3 | title: Metrics Glossary | Best Practices | PM2 Plus Documentation
4 | menu: starter
5 | lang: en
6 | section: plus
7 | permalink: "/en/plus/best-practices/metrics-glossary/"
8 | ---
9 |
10 | # Metrics Glossary
11 |
12 | This glossary is an exhaustive list of all metrics recorded by PM2 Plus. Understand what a metric stands for and how it is computed will avoid you to draw conclusions too quickly.
13 |
14 | Note that each metric always describes the state of a specific application on a specific server. You may find some cross server metrics on the dashboard, to suggest on which application you could use the profiling for example, but in most cases, metrics are application and server specific.
15 |
16 | ## CPU Usage
17 |
18 | The CPU usage is the amount of time the CPU is busy. A CPU only can handle one operation at a time and so is either busy or idle.
19 |
20 | Unit: %
21 | Range of values: 0 - 100
22 |
23 | ## Memory Usage
24 |
25 | The memory usage is the total amount of memory used by the application.
26 |
27 | Unit: Megabytes (MB)
28 | Range of values: 0 - total memory of the server
29 |
30 | ## Issues
31 |
32 | The number of new issues recorded in the app.
33 |
34 | ## Number of restart
35 |
36 | The number of restart of your application since added to the PM2 process list. PM2 automatically restarts your application whenever needed, for example after an uncaught exception has happened.
37 |
38 | ## Number of processes
39 |
40 | The number of cluster on which your app has been spread on the server. Only PM2 clusters appear.
41 |
42 | ## HTTP Requests per Minutes
43 |
44 | Unit: Number of requests / minutes
45 |
46 | ## Loop Delay
47 |
48 | Unit: milliseconds (ms)
49 | Range: 0 - less than 100ms
50 |
51 | The time the Node.js event loop takes to complete a loop.
52 |
53 | ## Active Handles
54 |
55 | Handles represent long-lived objects capable of performing certain operations while active. Some examples:
56 |
57 | - A prepare handle gets its callback called once every loop iteration when active.
58 | - A TCP server handle that gets its connection callback called every time there is a new connection.
59 |
60 | ## Active Requests
61 |
62 | Requests represent short-lived operations. These operations can be performed over a handle: write requests are used to write data on a handle; or standalone: getaddrinfo requests don’t need a handle they run directly on the loop.
63 |
64 | ## Node.js Memory
65 |
66 | ## New space used size
67 |
68 | ## Old space used size
69 |
70 | ## Map space used size
71 |
72 | ## Code space used size
73 |
74 | ## Large object space used suze
75 |
76 | ## Heap size
77 |
78 | ## Heap size executable
79 |
80 | ## Used heap size
81 |
82 | ## Heap size limit
83 |
84 | ## Garbage Collector
85 |
86 | ## GC heap size
87 |
88 | ## GC executable heap size
89 |
90 | ## GC used heap size
91 |
92 | ## GC type
93 |
94 | ## Gc Pause
95 |
--------------------------------------------------------------------------------
/en/plus/best-practices/transaction-tracing.md:
--------------------------------------------------------------------------------
1 | ---
2 | layout: page
3 | title: Transaction Tracing | Best Practices | PM2 Plus Documentation
4 | menu: starter
5 | lang: en
6 | section: plus
7 | permalink: "/en/plus/best-practices/transaction-tracing/"
8 | ---
9 |
10 | # Transaction Tracing
11 |
12 | Article available soon.
13 |
14 |
15 |
16 |
--------------------------------------------------------------------------------
/en/plus/guide/README.md:
--------------------------------------------------------------------------------
1 | ---
2 | layout: page
3 | title: Guide | PM2 Plus Documentation
4 | menu: starter
5 | lang: en
6 | section: plus
7 | hide_comments: true
8 | permalink: "/en/plus/guide/"
9 | ---
10 |
11 | # Guide
12 |
13 | Follow this guide and get your Node.js app monitored by PM2 Plus in minutes!
14 |
15 | ## Terminology
16 |
17 | Let's first explain some terminology we will use across this guide:
18 |
19 | A **bucket** is an entity related to PM2 Plus which is associated to a billing plan. Buckets are generally used to group and monitor multiple servers of a single project.
20 |
21 | A **server** is a container or a machine with a PM2 daemon managing one or more processes.
22 |
23 | A **process** is an entity of the process list (`pm2 ls`). This is one instance of an app which has been started by PM2.
24 |
25 | [Let's start]({{ site.baseurl }}{% link en/plus/guide/installation.md %})
26 | {: .btn-stylized}
27 |
--------------------------------------------------------------------------------
/en/plus/guide/app-dashboard.md:
--------------------------------------------------------------------------------
1 | ---
2 | layout: page
3 | title: App Dashboard | Guide | PM2 Plus Documentation
4 | menu: starter
5 | lang: en
6 | section: plus
7 | permalink: "/en/plus/guide/app-dashboard/"
8 | ---
9 |
10 | # Application Dashboard
11 |
12 | 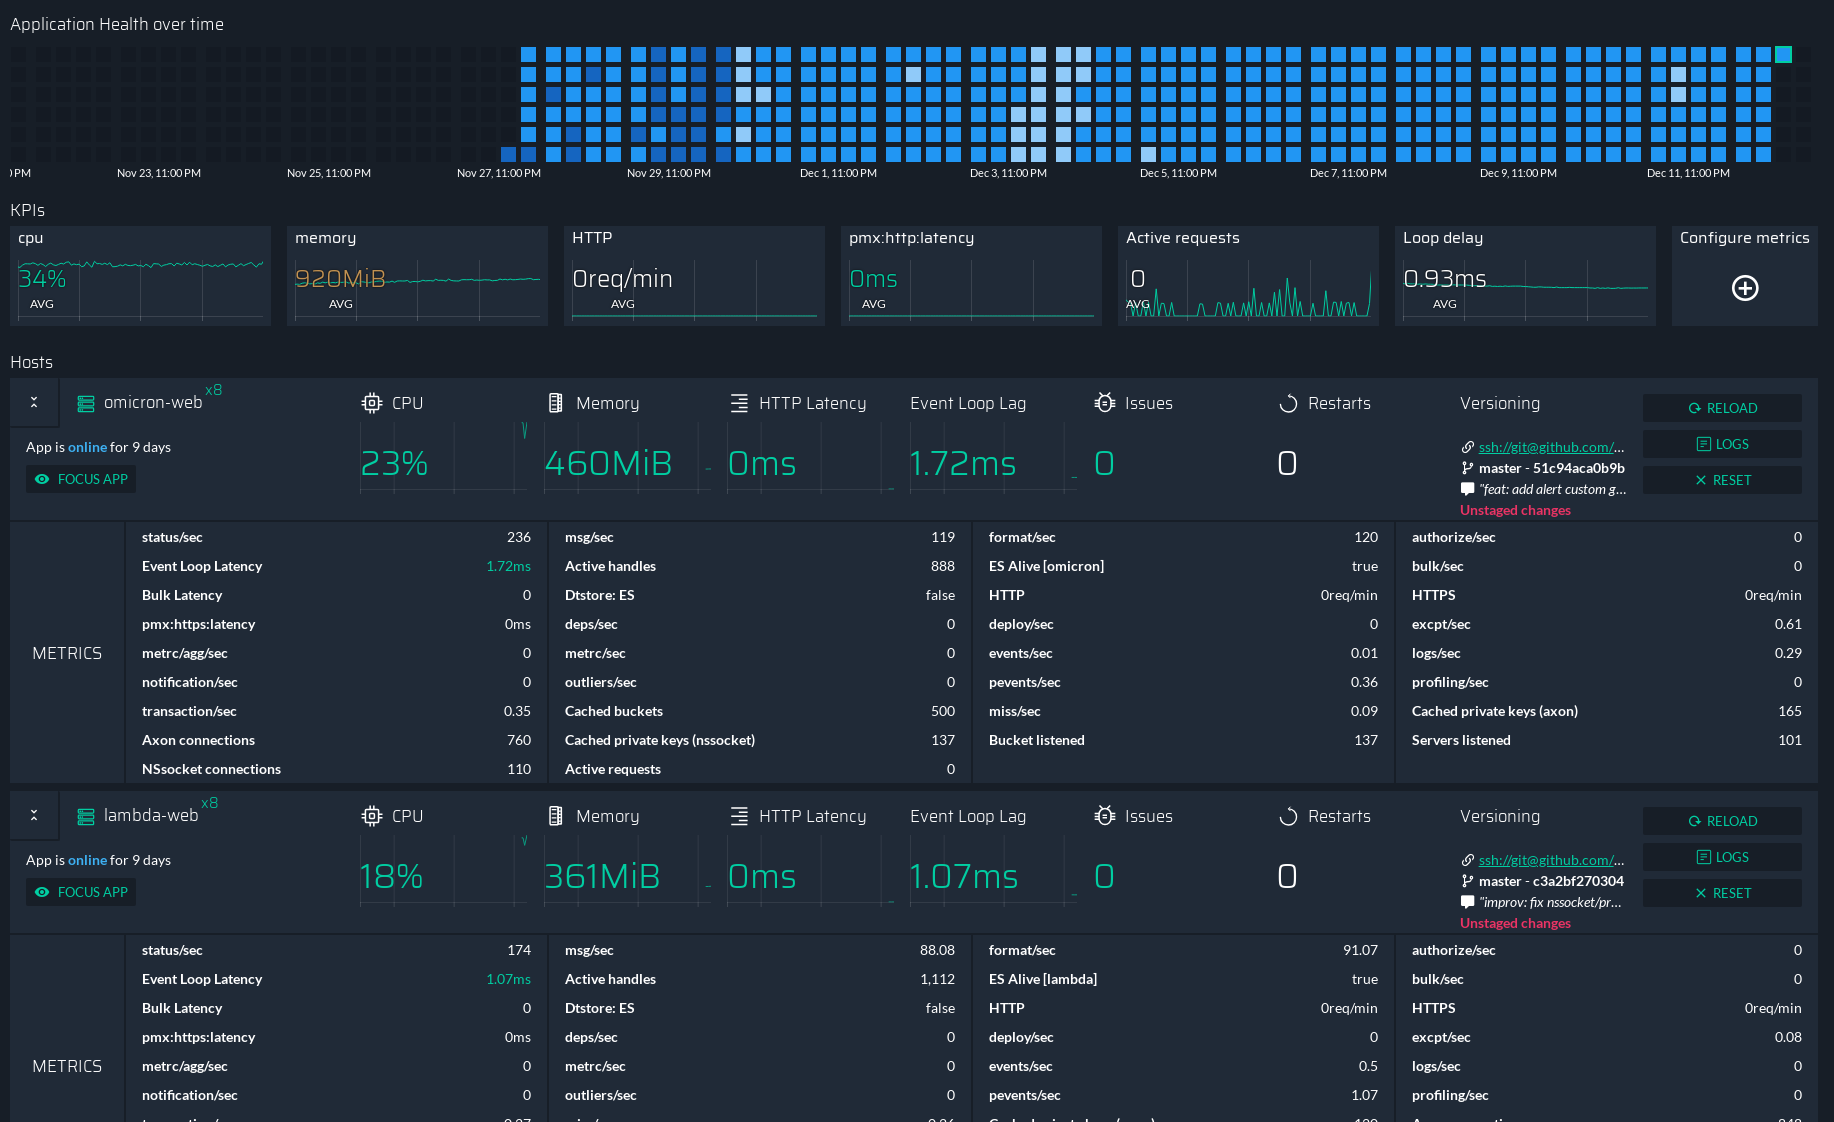
13 |
14 | This dashboard is used to give you insight on a particular application.
15 |
16 | At the top you will see a map again, each of the rectangle represent one hour and its color depend on what was happening during this hour.
17 | Each color have a different meaning:
18 | - Light blue means either a low cpu or memory usage (lower than normal)
19 | - Dark blue means either a high cpu or memory usage (higher than normal)
20 | - Blue means everything is normal
21 | - Red means we received error about the application during this hour.
22 |
23 | Then you have few metrics about this applications, for each metric you will have the historial value in the background and the realtime value in the foreground. You can customize those ones by clicking on `Configure metrics` at the far right of the screen.
24 |
25 | Finally at the bottom, we will list each servers where your application is. And for each server, we will show you the metrics about the application on this specific server.
26 | It's pretty much the same view as the `Servers overview` expect there it's only about one application.
27 |
28 | ## Next Steps
29 |
30 | [Notifications]({{ site.baseurl }}{% link en/plus/guide/notifications.md %})
31 | {: .btn-stylized}
32 |
--------------------------------------------------------------------------------
/en/plus/guide/configuration.md:
--------------------------------------------------------------------------------
1 | ---
2 | layout: page
3 | title: Configuration | Guide | PM2 Plus Documentation
4 | menu: starter
5 | lang: en
6 | section: plus
7 | permalink: "/en/plus/guide/configuration/"
8 | ---
9 |
10 | 
11 |
12 | # Configuration
13 |
14 | Your dashboard already comes with a lot of metrics without any configuration. But don't worry, you also can add predefined set of metrics or - even better - to create custom ones.
15 |
16 | PM2 comes with the [@pm2/io](https://github.com/keymetrics/pm2-io-apm) module, which is a module that gathers the metrics displayed in `pm2 monit` or in the web dashboard. By default, it just wraps your app. If you however want to refine the configuration, add custom metrics or custom actions, you must require it in your code.
17 |
18 | ## Installation
19 |
20 | With npm:
21 |
22 | ```bash
23 | npm install @pm2/io --save
24 | ```
25 |
26 | With yarn:
27 |
28 | ```bash
29 | yarn add @pm2/io
30 | ```
31 |
32 | ## Intialisation
33 |
34 | Load and initialize `@pm2/io` at the top level of your application, before any other `require`.
35 |
36 | ```javascript
37 | const io = require('@pm2/io')
38 |
39 | io.init({
40 | metrics: {
41 | network: {
42 | ports: true
43 | }
44 | }
45 | })
46 | ```
47 |
48 | This first basic initialisation will add to the dashboard the port number your app is listening to.
49 |
50 | See all intialisation options in the [@pm2/io reference]({{ site.baseurl }}{% link en/plus/reference/pm2io.md %}).
51 | {: .tip}
52 |
53 | ## Next Steps
54 |
55 |
56 | [@pm2/io reference]({{ site.baseurl }}{% link en/plus/reference/pm2io.md %})
57 | {: .btn-stylized}
58 |
59 | [Custom Metrics]({{ site.baseurl }}{% link en/plus/guide/custom-metrics.md %})
60 | {: .btn-stylized}
61 |
--------------------------------------------------------------------------------
/en/plus/guide/cpu-profiling.md:
--------------------------------------------------------------------------------
1 | ---
2 | layout: page
3 | title: CPU Profiling | Guide | PM2 Plus Documentation
4 | menu: starter
5 | lang: en
6 | section: plus
7 | permalink: "/en/plus/guide/cpu-profiling/"
8 | ---
9 |
10 | # Overview
11 |
12 | 
13 |
14 | The CPU profiling tool helps you better understand how CPU is used with your application.
15 |
16 | PM2 Plus makes remote CPU profiling of your production servers possible through the interface.
17 |
18 | ## How to use
19 |
20 | In order to use the CPU profiling, you must first [install the profiling tool]({{ site.baseurl }}{% link en/plus/guide/installation.md %}#install-cpumemory-profiling).
21 |
22 | For CPU profiling, you decide how long you want to record.
23 |
24 | It gets you a visualisation of the stack and still offer the ability to download the CPU profiling file.
25 |
26 | ## Next Steps
27 |
28 | [Modules]({{ site.baseurl }}{% link en/plus/guide/modules.md %})
29 | {: .btn-stylized}
30 |
--------------------------------------------------------------------------------
/en/plus/guide/installation.md:
--------------------------------------------------------------------------------
1 | ---
2 | layout: page
3 | title: Installation | Guide | PM2 Plus Documentation
4 | menu: starter
5 | lang: en
6 | section: plus
7 | permalink: "/en/plus/guide/installation/"
8 | ---
9 |
10 | # Installation
11 |
12 | We assume that your app have been started with PM2. If not, follow the [Quick Start]({{ site.baseurl }}{% link en/runtime/quick-start.md %}) tutorial.
13 |
14 | ## Create an account
15 |
16 | You can create a PM2 plus accoutn by registering [here](https://id.keymetrics.io/api/oauth/register) or juste by typing ```pm2 plus``` in your terminal.
17 |
18 | Then just simply follow the in-app tutorial
19 | 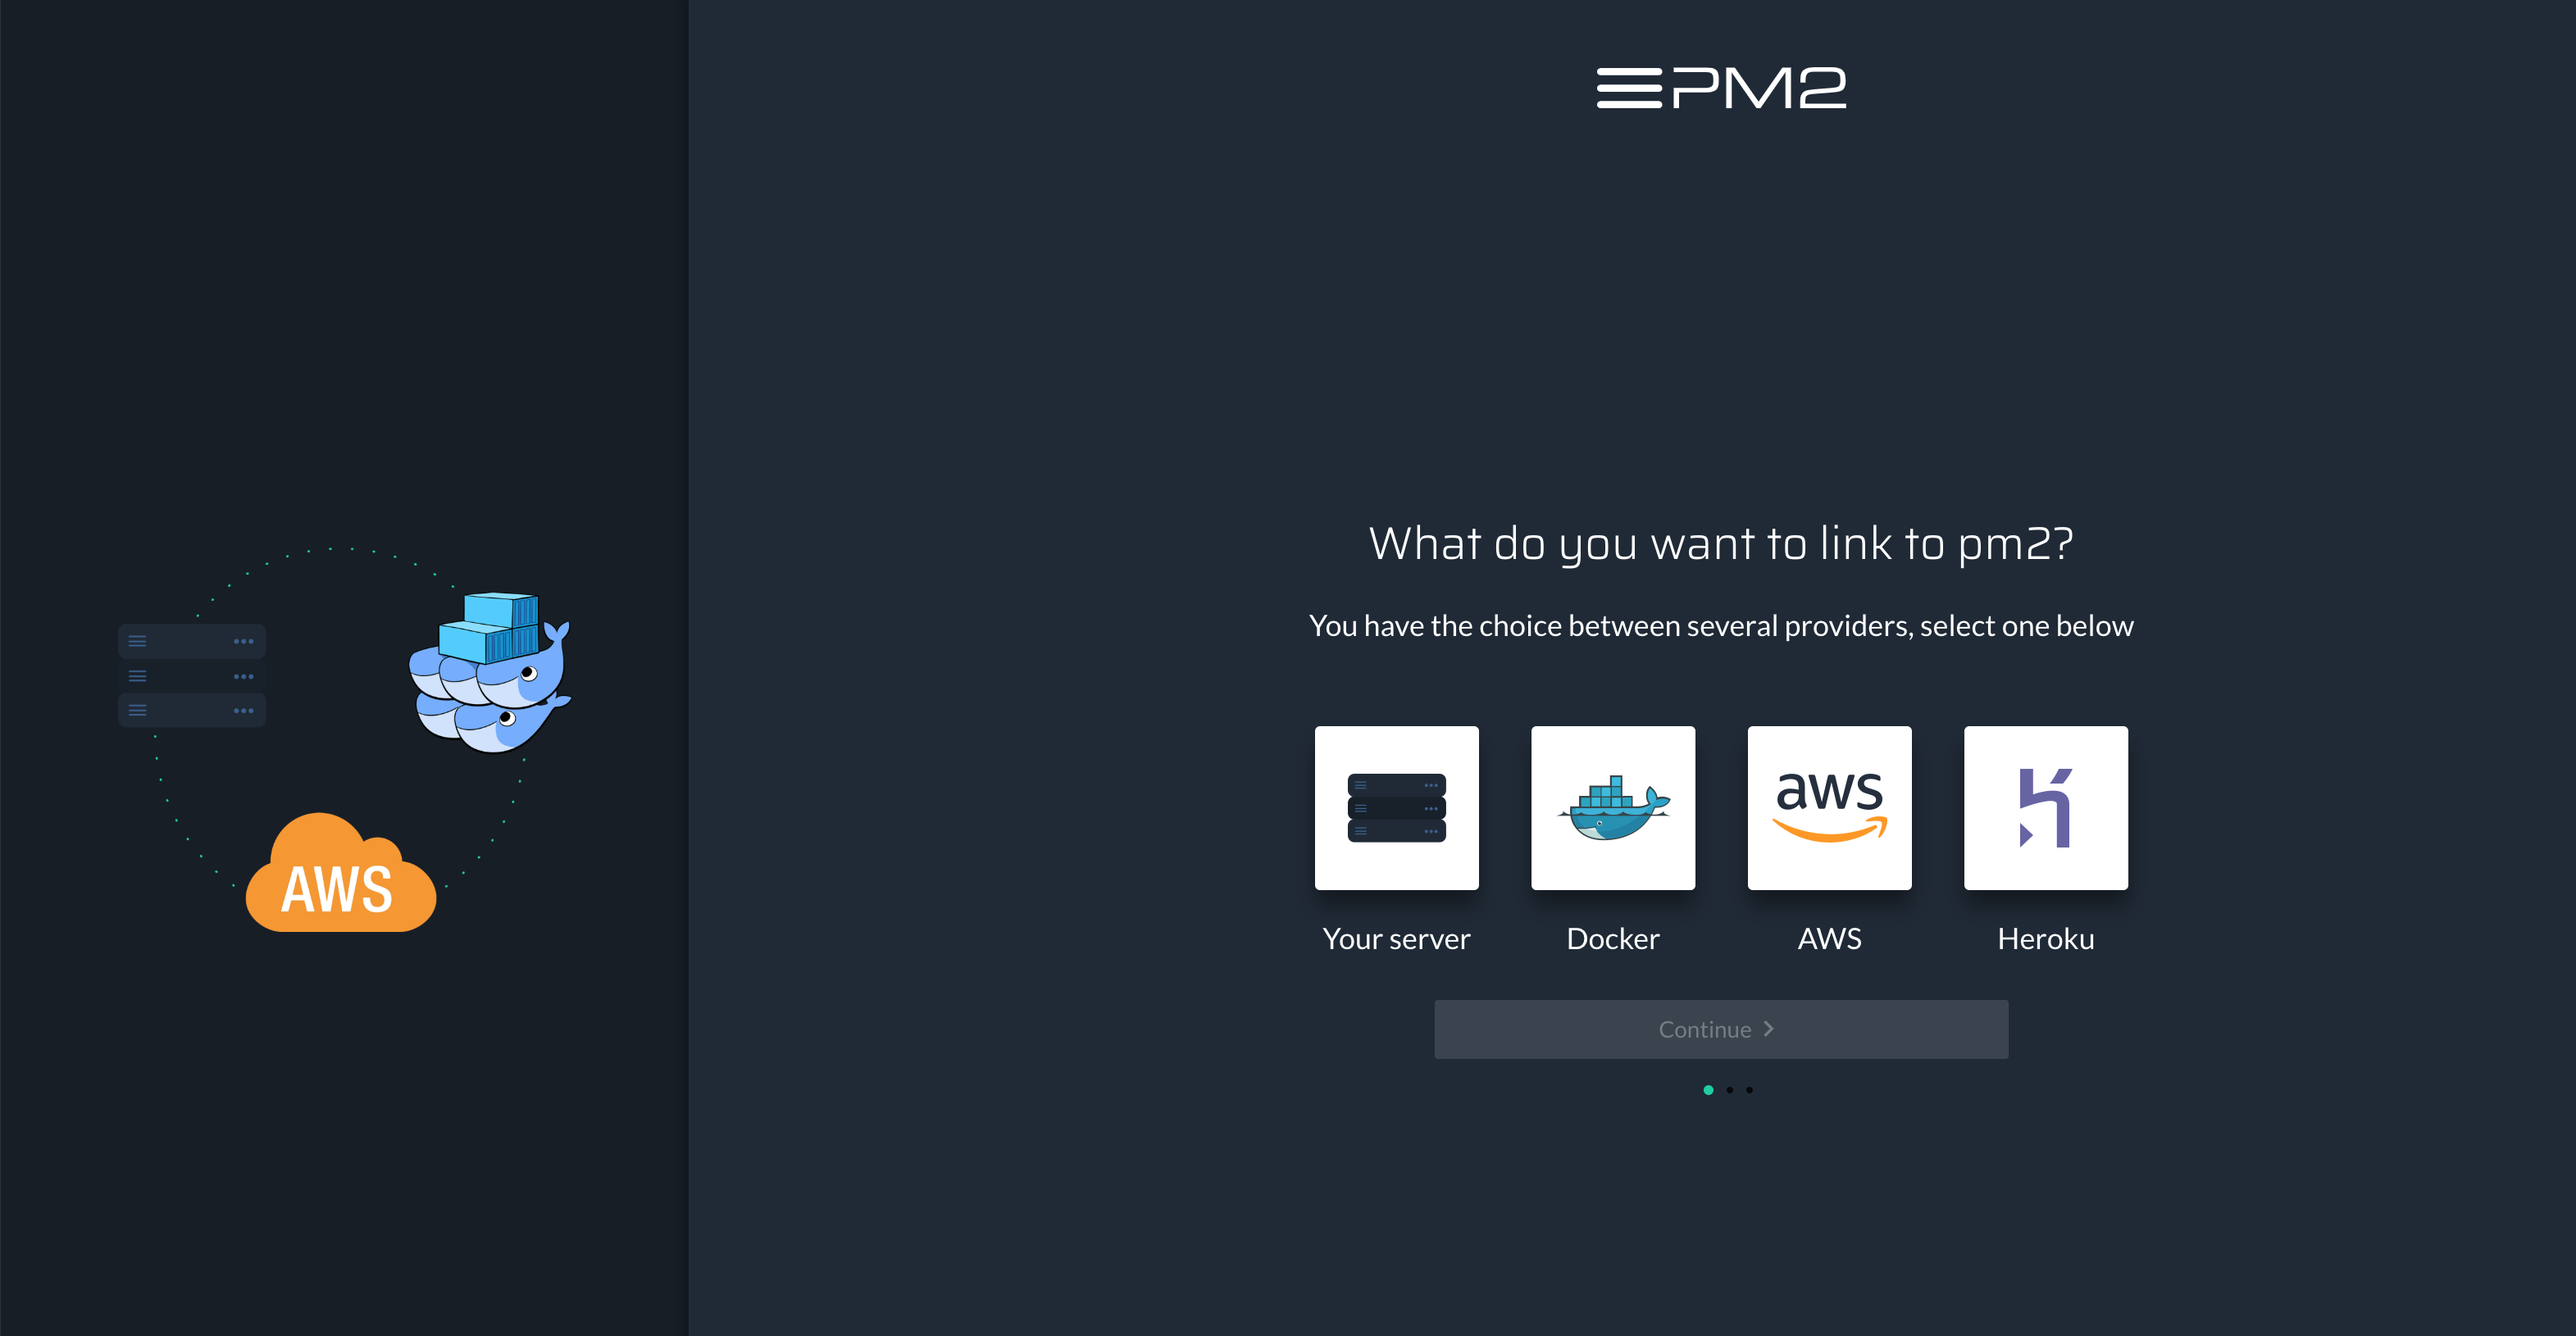
20 |
21 | ## Connect your server to the dashboard
22 |
23 | Connect your server to your dashboard and start collecting metrics with:
24 |
25 | ```bash
26 | pm2 link
27 | ```
28 |
29 | Or, if you don't have access to the CLI, add `PM2_PUBLIC_KEY` and `PM2_SECRET_KEY` environment variables set with your public and private keys.
30 |
31 | Use the `conncet` button on the top right of your dashboard to find your `PM2_PUBLIC_KEY` and `PM2_SECRET_KEY`
32 | {: .tip}
33 |
34 | ### If you are behind a company proxy/firewall
35 |
36 | Starting from PM2 3.2, we changed the networking connection by using a direct Websocket connection to our server on the port 443, so you only need OUTBOUND on port 443 TCP open. If you are using an older version, we of course advise to update but the ports that you need to open are 80 (TCP outbound), 443 (HTTPS outbound) and 43554 (TCP outbound), so verify everything is allowed on your firewall.
37 |
38 | You also may need to whitelist IPs, please allow these ones: 62.210.102.213, 163.172.76.240, 62.4.21.98, 163.172.253.187, 163.172.67.152, 195.154.79.25, 195.154.79.34
39 |
40 | ## Next Steps
41 |
42 | [Server Apps Overview]({{ site.baseurl }}{% link en/plus/guide/server-apps-overview.md %})
43 | {: .btn-stylized}
44 |
--------------------------------------------------------------------------------
/en/plus/guide/issue-dashboard.md:
--------------------------------------------------------------------------------
1 | ---
2 | layout: page
3 | title: Issue Dashboard | Guide | PM2 Plus Documentation
4 | menu: starter
5 | lang: en
6 | section: plus
7 | permalink: "/en/plus/guide/issue-dashboard/"
8 | ---
9 |
10 | # Issue dashboard
11 |
12 | 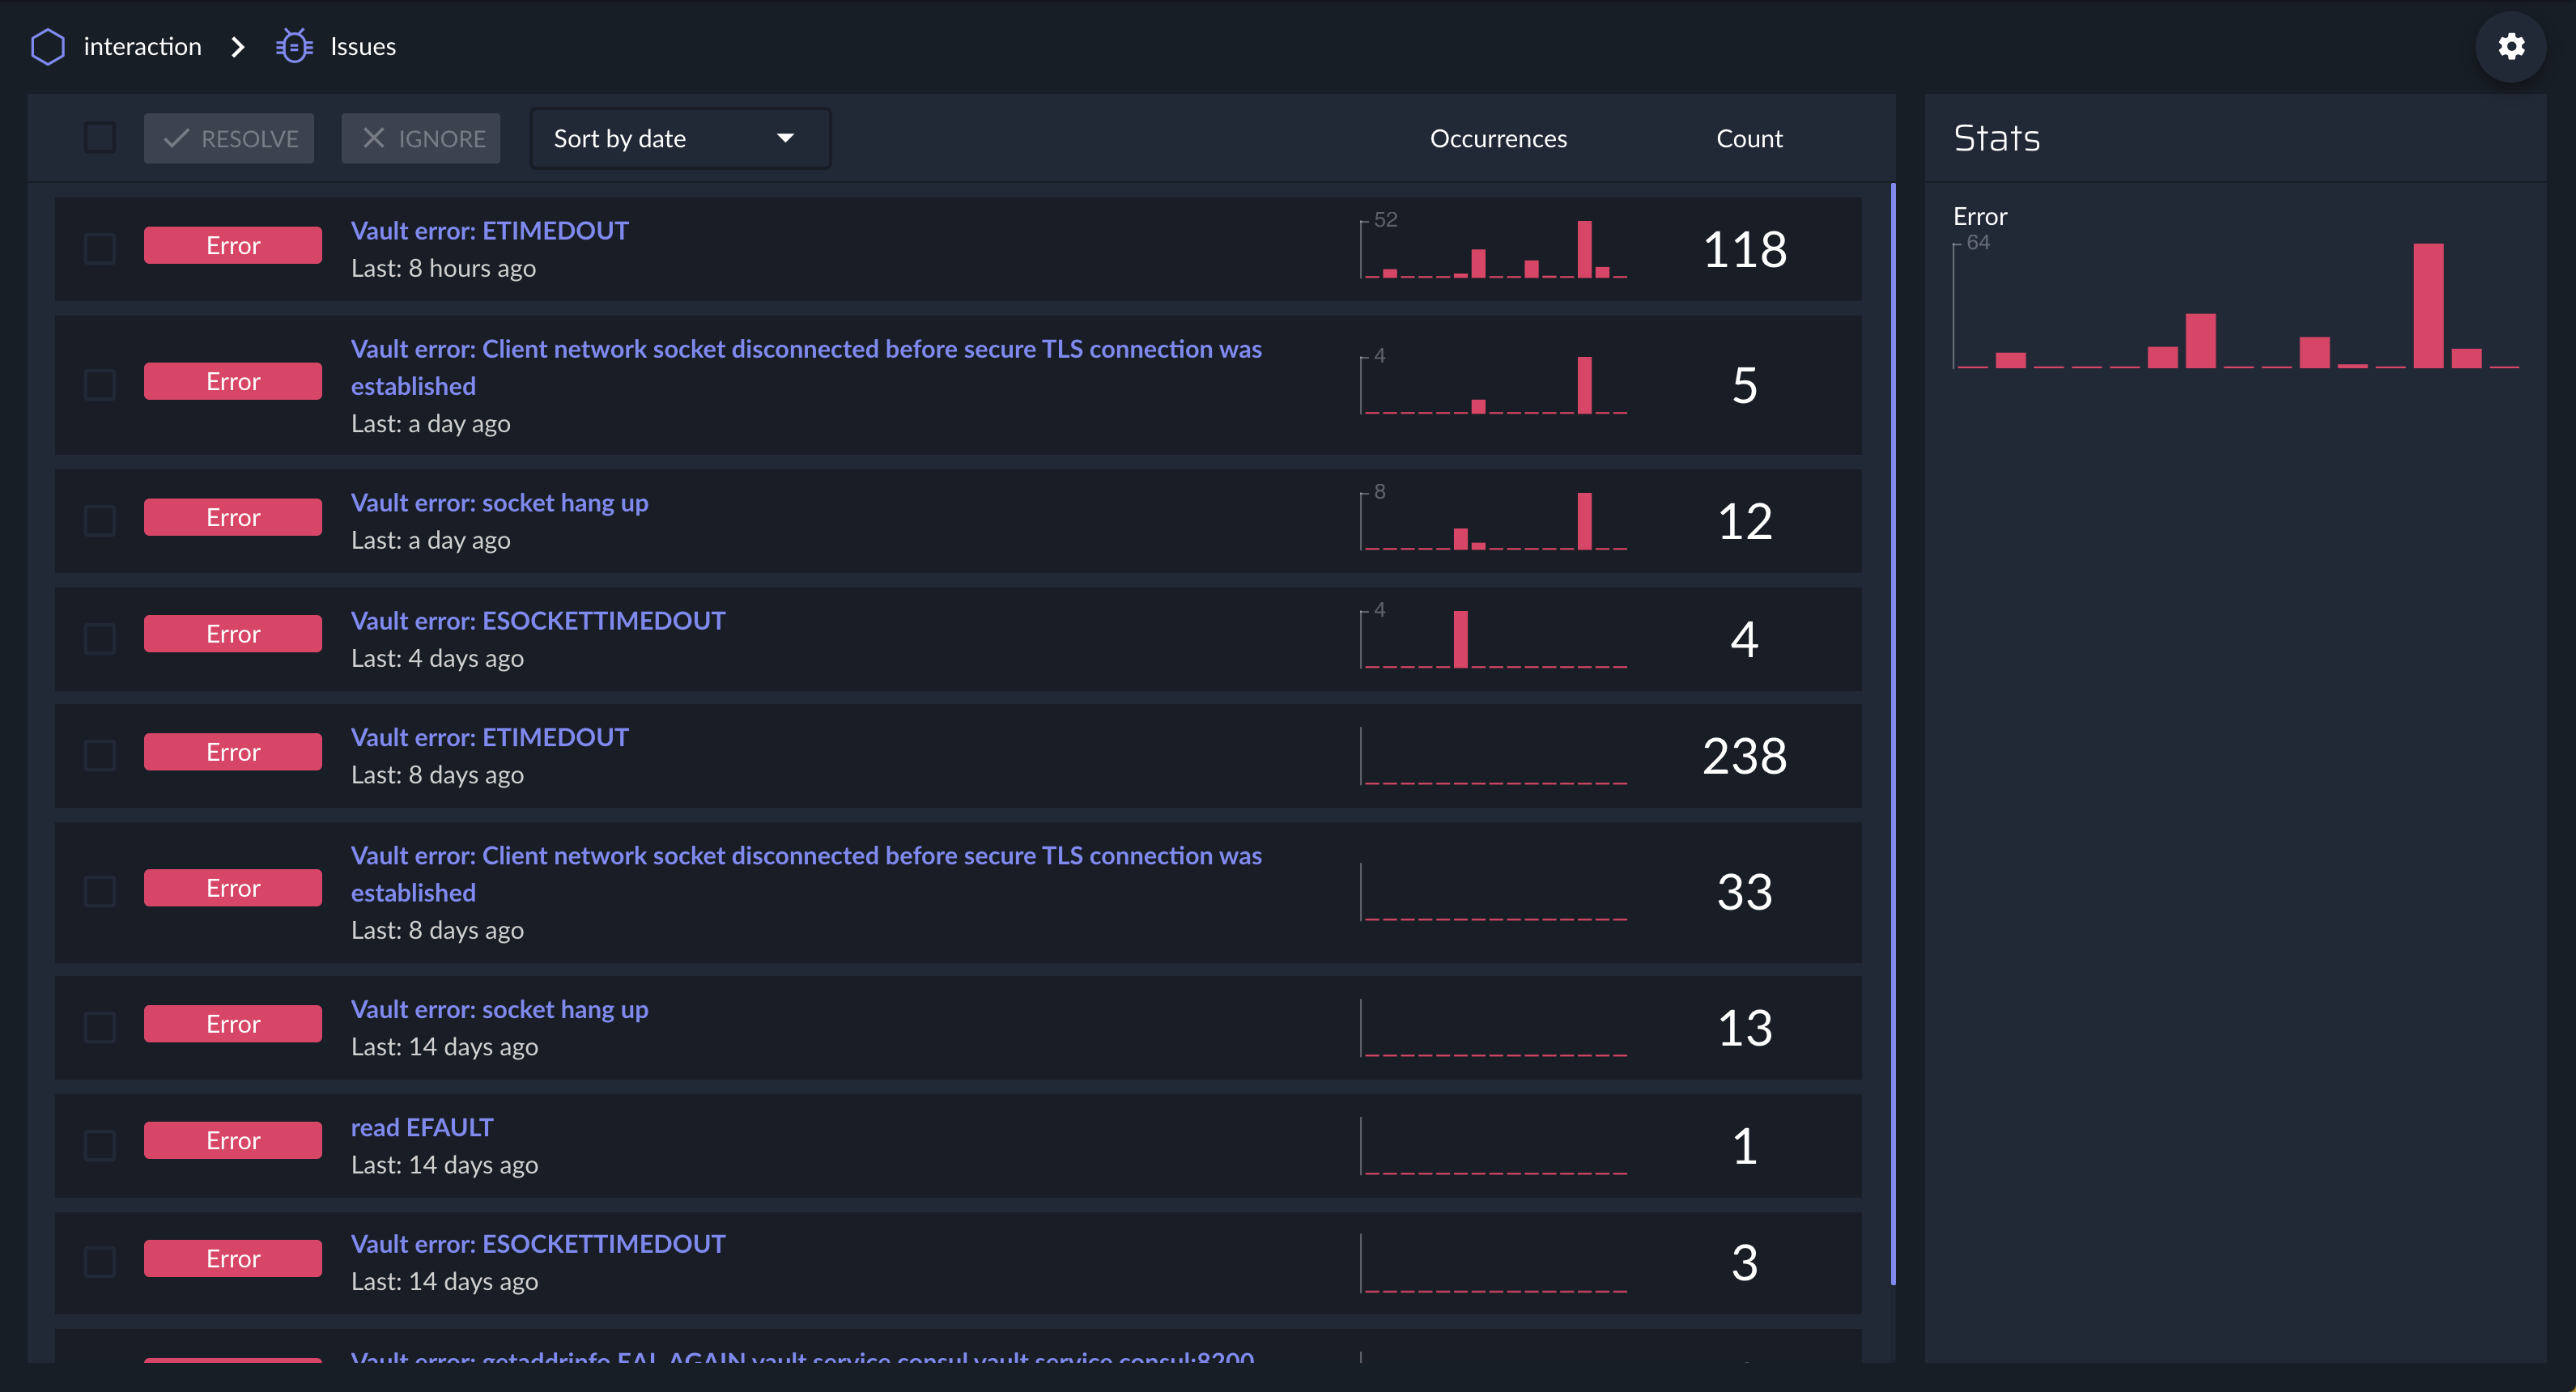
13 |
14 | By default when one of your applications crash, pm2 will of course automatically restart it but it will also send the error to PM2 Plus.
15 | In the issue dashboard, you will be able to see for each error:
16 | - How much time the error happened?
17 | - The servers that were impacted by this errors
18 | - The stack trace
19 | - The exact line of code that thrown the error
20 | - Few applications logs before the error happened
21 |
22 | You can of course delete them if you think they are not relevant by click on `
23 |
24 | ## Manually emit an issue
25 |
26 | It's possible that you need to report an error that isn't crashing your process.
27 | In this case you can use `io.notifyError`:
28 |
29 | ```javascript
30 | const io = require('@pm2/io')
31 |
32 | try {
33 | // Critical action to be tested
34 | user.sendNotifications()
35 | } catch (error) {
36 | io.notifyError(new Error('Notification failed'), {
37 | // or anything that you can like an user id
38 | custom: {
39 | user: user.id
40 | }
41 | })
42 | }
43 | ```
44 |
45 | ## Next Steps
46 |
47 | [Notifications]({{ site.baseurl }}{% link en/plus/guide/custom-metrics.md %})
48 | {: .btn-stylized}
49 |
--------------------------------------------------------------------------------
/en/plus/guide/memory-profiling.md:
--------------------------------------------------------------------------------
1 | ---
2 | layout: page
3 | title: Memory Profiling | Guide | PM2 Plus Documentation
4 | menu: starter
5 | lang: en
6 | section: plus
7 | permalink: "/en/plus/guide/memory-profiling/"
8 | ---
9 |
10 | # Memory profiling
11 |
12 | 
13 |
14 | Profiling tools help you diagnose memory issues in your application.
15 |
16 | PM2 Plus allows you to take remote heap memory snapshots of your production servers and provide you visualization tools.
17 |
18 | ## Memory profiling
19 |
20 | In order to use the memory profiling, you must first [install the profiling tool]({{ site.baseurl }}{% link en/plus/guide/installation.md %}#install-cpumemory-profiling).
21 |
22 | Click to take a heapdump and download the file. It may take some time depending on the weight of the heap file.
23 |
24 | Inspect with the Google Chrome developer tool into the Profiles tab (**Load** button).
25 |
26 | ### Tracking memory leaks
27 |
28 | To track memory leak you will need to compare multiple heapdump files to see which element is increasing over time.
29 |
30 | To know more about memory analysis check the [google tutorial](https://developer.chrome.com/devtools/docs/heap-profiling).
31 |
32 | ## Next Steps
33 |
34 | [CPU Profiling]({{ site.baseurl }}{% link en/plus/guide/cpu-profiling.md %})
35 | {: .btn-stylized}
36 |
--------------------------------------------------------------------------------
/en/plus/guide/memory-snapshot.md:
--------------------------------------------------------------------------------
1 | ---
2 | layout: page
3 | title: Memory Snapshot | Guide | PM2 Plus Documentation
4 | menu: starter
5 | lang: en
6 | section: plus
7 | permalink: "/en/plus/guide/memory-snapshot/"
8 | ---
9 |
10 | # Overview
11 |
12 | 
13 |
14 | This feature help you diagnose memory issues in your application.
15 |
16 | PM2 Plus allows you to take remote heap memory snapshots of your applications and provide you visualization tools.
17 |
18 | **WARNING**: There are few bugs in V8 (the engine that runs the javascript in Node.js) that can impact your applications when you are doing a memory snapshot. Specially if you use it in applications with large memory (>800MB of RAM). You should avoid running it in those cases.
19 |
20 | ## How to use
21 |
22 | In order to use the memory snapshot, you must first [install the snapshot tool]({{ site.baseurl }}{% link en/plus/guide/installation.md %}#install-cpumemory-profiling).
23 |
24 | Click to take a heapdump and download the file. It may take some time depending on the weight of the heap file.
25 |
26 | Inspect with the Google Chrome developer tool into the Profiles tab (**Load** button).
27 |
28 | ### Tracking memory leaks
29 |
30 | To track memory leak you will need to compare multiple heapdump files to see which element is increasing over time.
31 |
32 | To know more about memory analysis check the [chrome devtools tutorial](https://developer.chrome.com/devtools/docs/heap-profiling).
33 |
34 | ## Next Steps
35 |
36 | [CPU Profiling]({{ site.baseurl }}{% link en/plus/guide/cpu-profiling.md %})
37 | {: .btn-stylized}
38 |
--------------------------------------------------------------------------------
/en/plus/guide/realtime-logs.md:
--------------------------------------------------------------------------------
1 | ---
2 | layout: page
3 | title: Realtime logs | Guide | PM2 Plus Documentation
4 | menu: starter
5 | lang: en
6 | section: plus
7 | permalink: "/en/plus/guide/realtime-logs/"
8 | ---
9 |
10 | # Realtime Logs
11 |
12 | 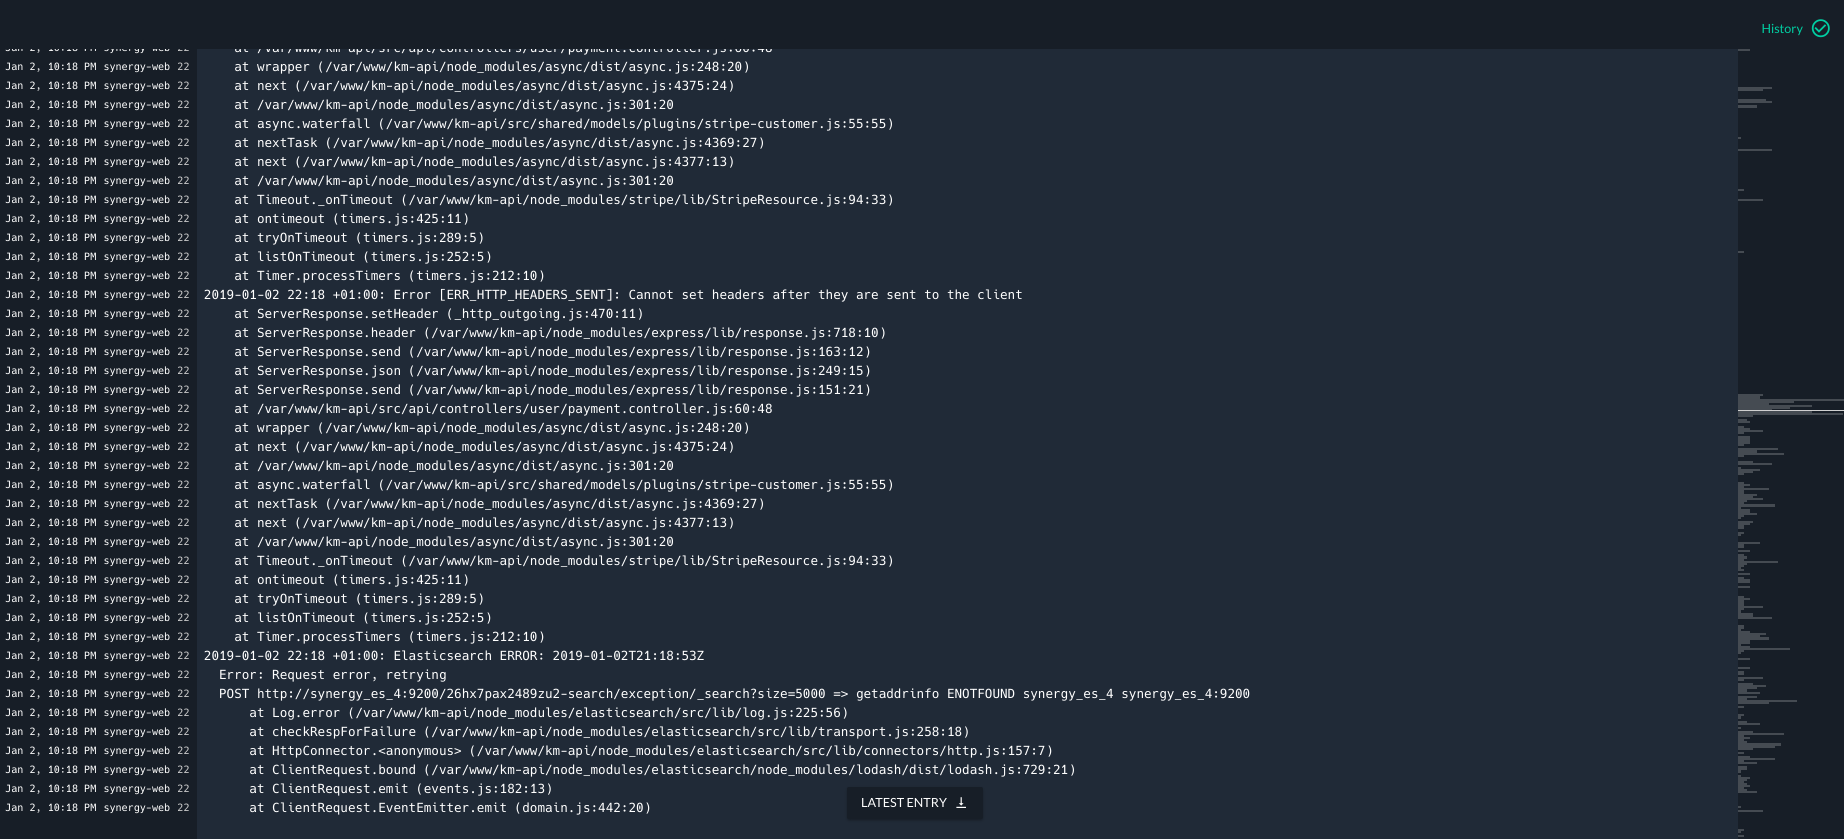
13 |
14 | In PM2 Plus you are able to stream the logs that your application output directly to the dashboard.
15 | It can be really helpful if you don't want to SSH into your servers and use `pm2 logs`
16 |
17 | Note that if you are looking for a log storage solution, you can checkout the PM2 Enterprise product which contains log retention.
18 |
19 |
20 | ## Next Steps
21 |
22 | [Modules]({{ site.baseurl }}{% link en/plus/guide/modules.md %})
23 | {: .btn-stylized}
24 |
--------------------------------------------------------------------------------
/en/plus/guide/server-apps-overview.md:
--------------------------------------------------------------------------------
1 | ---
2 | layout: page
3 | title: Overviews | Guide | PM2 Plus Documentation
4 | menu: starter
5 | lang: en
6 | section: plus
7 | permalink: "/en/plus/guide/server-apps-overview/"
8 | ---
9 |
10 | # Presentation
11 |
12 | There are 2 types of overview in PM2 Plus, the first one is the `Application overview` where you don't see any reference to a server in the overview, this one is mainly useful to containers or environment with a lot of applications.
13 | The other one is the `Server overview` which is the default with PM2 Plus, it's more detailed than the other one and show you every information by physical server.
14 |
15 | ## Server Overview
16 |
17 | 
18 |
19 | This view is breakdown by server, in the following example we have one server with 7 applications:
20 |
21 | 
22 |
23 | In the top bar of this section you will find infos about the actual server
24 | - The Server's Name
25 | - Number of cores and memory
26 | - Versions of Node.js & PM2
27 | - The public and private IP
28 |
29 | You are able to get realtime infos about any application such as
30 | - cpu utilization
31 | - memory comsumption
32 | - HTTP Latency
33 | - Issues
34 | - Event Loop Lag (the amount of time between two run of the event loop, should be less than 10 ms)
35 | - Number of restarts
36 | - Versionning metadata (if your app is in a git repository)
37 |
38 | At the left of each application you can toggle more information for the application, it will show you:
39 | - All the metrics about the applications (both default and custom ones)
40 | - All the custom actions you added, you can trigger them for these buttons too.
41 |
42 | ## Apps Overview
43 |
44 | 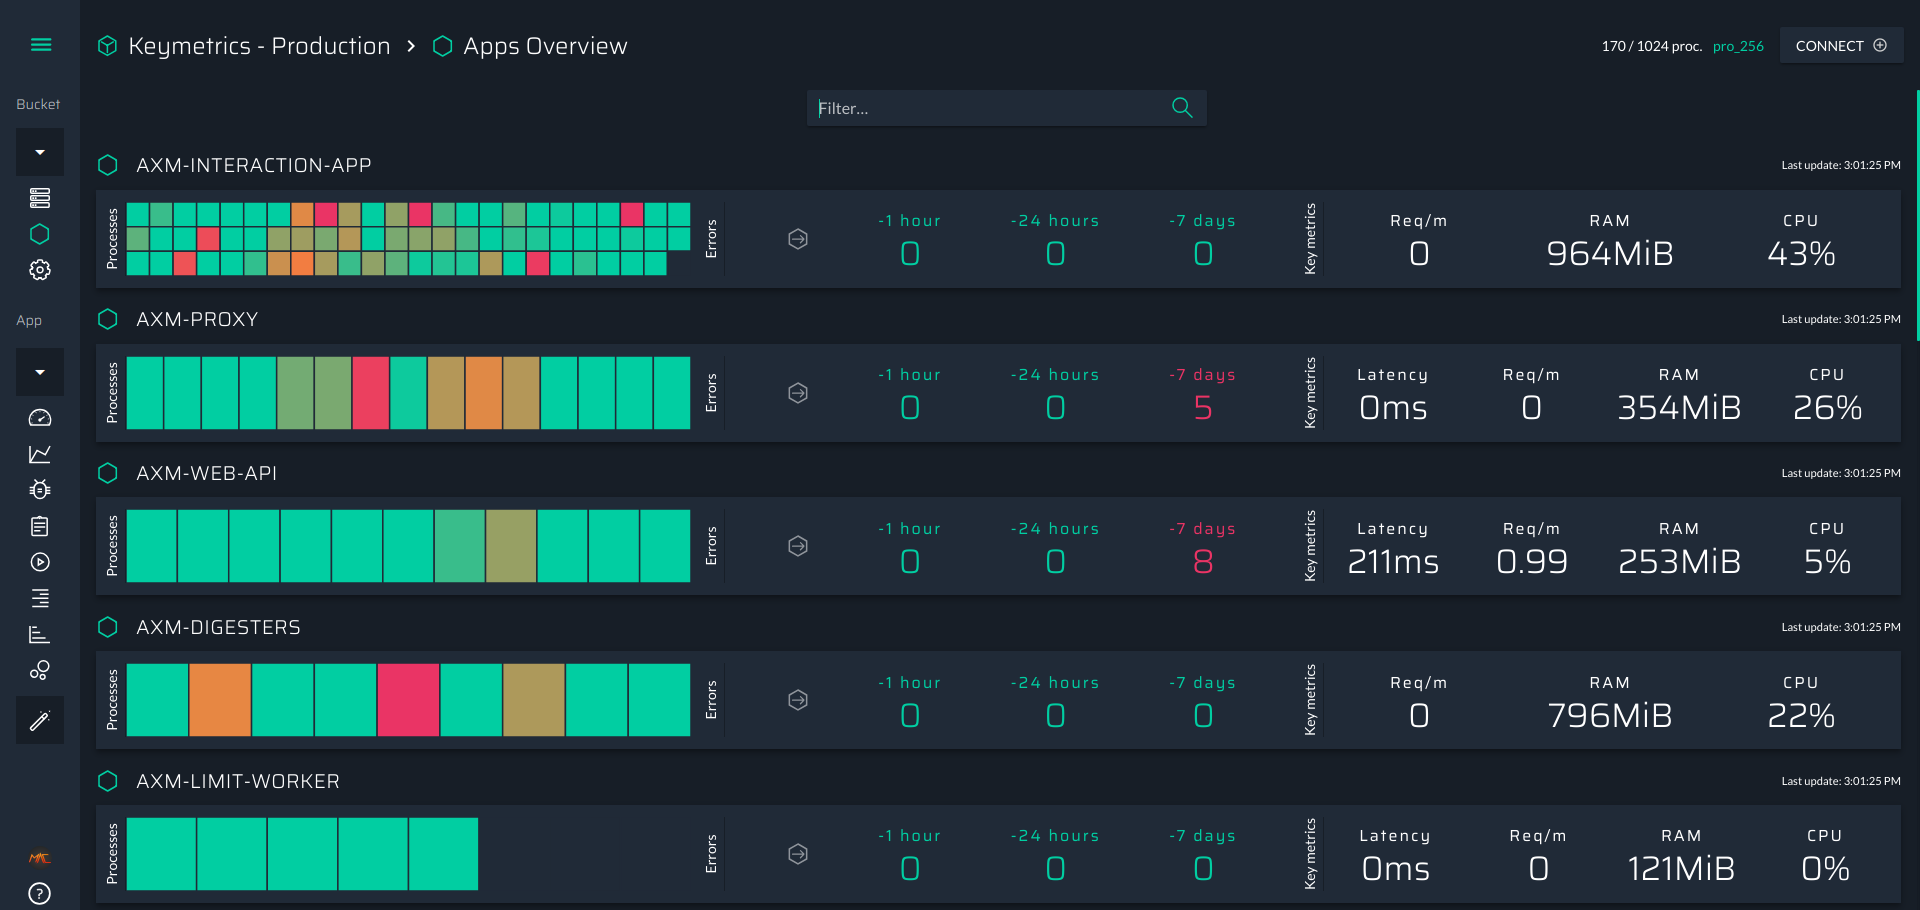
45 |
46 | It contains almost everything you need to see to understand the current health of your applications:
47 |
48 | - CPU Usage Heatmap
49 | - Each cell represent a process in a server
50 | - the color represent the cpu usage (varying from green to red where red is 100% of cpu usage)
51 | - Error history
52 | - Last hour, last day and last week, it give you an idea if the application is instable for a long time or not.
53 | - Important metrics
54 | - average cpu utilization
55 | - average memory consumption
56 | - average latency (only if you are using an http server)
57 | - average Request / minutes (only if you are using an http server)
58 |
59 | If you click on the heatmap, you will directly go on the app dashboad which is discribed in the following dashboard.
60 |
61 | ## Next Steps
62 |
63 | [Application dashboard]({{ site.baseurl }}{% link en/plus/guide/app-dashboard.md %})
64 | {: .btn-stylized}
65 |
--------------------------------------------------------------------------------
/en/plus/integration/README.md:
--------------------------------------------------------------------------------
1 | ---
2 | layout: page
3 | title: Integration | PM2 Plus Documentation
4 | menu: starter
5 | lang: en
6 | section: plus
7 | hide_comments: true
8 | permalink: "/en/plus/integration/"
9 | ---
10 |
11 | # Integration
12 |
13 | This section will help you integrate PM2 Plus.
14 |
15 | Pick the tutorial that best matches your needs:
16 |
17 | - [AWS Elastic Beanstalk]({{ site.baseurl }}{% link en/plus/integration/elastic-beanstalk.md %})
18 | - [Docker]({{ site.baseurl }}{% link en/plus/integration/docker.md %})
19 | - [Heroku]({{ site.baseurl }}{% link en/plus/integration/heroku.md %})
20 | - [With a Cloud Provider]({{ site.baseurl }}{% link en/plus/integration/cloud-providers.md %})
21 |
--------------------------------------------------------------------------------
/en/plus/integration/cloud-providers.md:
--------------------------------------------------------------------------------
1 | ---
2 | layout: page
3 | title: Cloud Providers | Integration | PM2 Plus Documentation
4 | menu: starter
5 | lang: en
6 | section: plus
7 | permalink: "/en/plus/integration/cloud-providers/"
8 | ---
9 |
10 | # Monitor your Node.js app in a cloud provider
11 |
12 | In seconds, this tutorial will show you how to monitor a Node.js application with PM2 Plus in a cloud provider.
13 |
14 | We assume that your app has already been wrapped with PM2. If not, follow the [PM2 Cloud Provider Tutorial]({{ site.baseurl }}{% link en/runtime/integration/cloud-providers.md %}).
15 |
16 | ## Create an account
17 |
18 | Register [here](https://id.keymetrics.io/api/oauth/register).
19 |
20 | ## Link your app with PM2 Plus
21 |
22 | In order to connect PM2 to the dashboard, you need to add your public and private keys in the environment.
23 |
24 | ```bash
25 | export PM2_PUBLIC_KEY="YYYYY"
26 | export PM2_SECRET_KEY="XXXXXXXXX"
27 | pm2 update
28 | ```
29 |
30 | ## Set the server name in PM2 Plus
31 |
32 | Set the `PM2_MACHINE_NAME` environment variable to specify a server name:
33 |
34 | ```bash
35 | export PM2_MACHINE_NAME="my-cloud-provider-server"
36 | ```
37 |
38 | The default server name is the hostname (`HOST` environment variable) with a random string.
39 | {: .tip}
40 |
41 | Be careful, in case of duplicate hostnames the dashboard will receive data from both instances and flicker.
42 | {: .tip}
43 |
44 | ## Next Steps
45 |
46 | Complete your [dashboard configuration]({{ site.baseurl }}{% link en/plus/guide/configuration.md %}).
47 |
48 |
49 |
50 |
--------------------------------------------------------------------------------
/en/plus/integration/docker.md:
--------------------------------------------------------------------------------
1 | ---
2 | layout: page
3 | title: Docker | Integration | PM2 Plus Documentation
4 | menu: starter
5 | lang: en
6 | section: plus
7 | permalink: "/en/plus/integration/docker/"
8 | ---
9 |
10 | # Monitor your Node.js app in a Docker container
11 |
12 | In seconds, this tutorial will show you how to monitor a Node.js application with PM2 Plus inside a container.
13 |
14 | We assume that your app has already been wrapped with PM2. If not, follow the [PM2 Docker Tutorial]({{ site.baseurl }}{% link en/runtime/integration/docker.md %}).
15 |
16 | ## Create an account
17 |
18 | Register [here](https://id.keymetrics.io/api/oauth/register).
19 |
20 | ## Install the profiler
21 |
22 | Add this to your Dockerfile to install the profiler:
23 |
24 | ```Dockerfile
25 | RUN pm2 install profiler
26 | ```
27 |
28 | ## Link your app with PM2 Plus
29 |
30 | In order to connect PM2 to the dashboard, you need to add your public and private keys in the environment.
31 |
32 | Create a .env file with:
33 | ```.env
34 | PM2_SECRET_KEY=XXXXX
35 | PM2_PUBLIC_KEY=YYYYY
36 | ```
37 | and restart your container with `docker run`adding `--env-file .env` to load the environment variables.
38 |
39 | ## Set the server name in PM2 Plus
40 |
41 | Set the `PM2_MACHINE_NAME` environment variable to specify a server nam. Add this to the .env file:
42 |
43 | ```.env
44 | PM2_SECRET_KEY=XXXXX
45 | PM2_PUBLIC_KEY=YYYYY
46 | PM2_MACHINE_NAME=docker-server
47 | ```
48 |
49 | The default server name is the hostname (`HOST` environment variable) with a random string.
50 | {: .tip}
51 |
52 | Be careful, in case of duplicate hostnames the dashboard will receive data from both instances and flicker.
53 | {: .tip}
54 |
55 | ## Next Steps
56 |
57 | Complete your dashboard [configuration]({{ site.baseurl }}{% link en/plus/guide/configuration.md %}).
58 |
59 |
60 |
61 |
--------------------------------------------------------------------------------
/en/plus/integration/elastic-beanstalk.md:
--------------------------------------------------------------------------------
1 | ---
2 | layout: page
3 | title: Elastic Beanstalk | Integration | PM2 Plus Documentation
4 | menu: starter
5 | lang: en
6 | section: plus
7 | permalink: "/en/plus/integration/elastic-beanstalk/"
8 | ---
9 |
10 | # Monitor your Node.js app in AWS Elastic Beanstalk
11 |
12 | In seconds, this tutorial will show you how to monitor a Node.js application with PM2 Plus in AWS Elastic Beanstalk.
13 |
14 | We assume that your app has already been wrapped with PM2. If not, follow our [PM2 AWS Elastic Beanstalk Tutorial]({{ site.baseurl }}{% link en/runtime/integration/elastic-beanstalk.md %}).
15 |
16 | ## Create an account on PM2 Plus
17 |
18 | You can register [here](https://id.keymetrics.io/api/oauth/register).
19 |
20 | ## Link your app with PM2 Plus
21 |
22 | In order to connect PM2 to the dashboard, you need to add your public and private keys in the environment.
23 |
24 | Inject your keys into your eb environment:
25 | ```bash
26 | eb setenv PM2_PUBLIC_KEY=YYYYY PM2_SECRET_KEY=XXXXXXXX
27 | ```
28 |
29 | You can access your keys at the top right of your dashboard
30 | {: .tip}
31 |
32 | We unadvise to use the ecosystem file to set your keys into your environment, doing so your ecosystem file can stay public
33 | {: .warn}
34 |
35 | ## Set the server name in PM2 Plus
36 |
37 | Set the `PM2_MACHINE_NAME` environment variable to specify a server name:
38 |
39 | ```bash
40 | eb setenv PM2_MACHINE_NAME=aws-eb-server
41 | ```
42 |
43 | The default server name is the hostname (`HOST` environment variable) with a random string.
44 | {: .tip}
45 |
46 | Be careful, in case of duplicate hostnames the dashboard will receive data from both instances and flicker.
47 | {: .tip}
48 |
49 | ## Next Steps
50 |
51 | Complete your [dashboard configuration]({{ site.baseurl }}{% link en/plus/guide/configuration.md %}).
52 |
53 |
54 |
55 |
56 |
--------------------------------------------------------------------------------
/en/plus/integration/heroku.md:
--------------------------------------------------------------------------------
1 | ---
2 | layout: page
3 | title: Heroku | Integration | PM2 Plus Documentation
4 | menu: starter
5 | lang: en
6 | section: plus
7 | permalink: "/en/plus/integration/heroku/"
8 | ---
9 |
10 | # Monitor your Node.js app in Heroku
11 |
12 | In seconds, this tutorial will show you how to monitor a Node.js application with PM2 Plus in Heroku.
13 |
14 | We assume that your app has already been wrapped with PM2. If not, follow the [PM2 Heroku Tutorial]({{ site.baseurl }}{% link en/runtime/integration/heroku.md %}).
15 |
16 | ## Create an account
17 |
18 | Register [here](https://id.keymetrics.io/api/oauth/register).
19 |
20 | ## Link with PM2 Plus
21 |
22 | In order to connect PM2 to the dashboard, you need to add your public and private keys in the environment.
23 |
24 | To add your keys, run:
25 |
26 | ```bash
27 | heroku config:set PM2_PUBLIC_KEY=XXXXXXXXXX PM2_SECRET_KEY=YYYYY
28 | ```
29 |
30 | You can access your keys at the top right of your dashboard
31 | {: .tip}
32 |
33 | ## Set the server name in PM2 Plus
34 |
35 | Set the `PM2_MACHINE_NAME` environment variable to specify a server name:
36 |
37 | ```bash
38 | heroku config:set PM2_MACHINE_NAME=heroku-server
39 | ```
40 |
41 | The default server name is the hostname (`HOST` environment variable) with a few random characters.
42 | {: .tip}
43 |
44 | Be careful, in case of duplicate hostnames the dashboard will receive data from both instances and flicker.
45 | {: .tip}
46 |
47 | ## Next Steps
48 |
49 | Complete your [dashboard configuration]({{ site.baseurl }}{% link en/plus/guide/configuration.md %}).
50 |
51 |
52 |
53 |
54 |
--------------------------------------------------------------------------------
/en/plus/integration/now.md:
--------------------------------------------------------------------------------
1 | Now.sh is actually not supported by pm2
2 | {: .warn}
3 |
4 | # Monitor your Node.js app in Now.sh
5 |
6 | In seconds, this tutorial will show you how to monitor a node.js application with PM2 Plus and Now.sh.
7 |
8 | We assume that your app has already been wrapped with pm2. If not, follow the [PM2 Now.sh Tutorial]({{ site.baseurl }}{% link en/runtime/integration/now.md %}).
9 |
10 | ---
11 |
12 | ### Create an account
13 |
14 | Register [here](https://id.keymetrics.io/api/oauth/register).
15 |
16 | ---
17 |
18 | ### Link with pm2 Plus
19 |
20 | You first need to use pm2 to wrap your app inside your Docker container. If not, follow the [now.sh tutorial]({{ site.baseurl }}{% link en/runtime/integration/now.md %}).
21 |
22 | ### Link with pm2 Plus
23 |
24 | In order to connect pm2 to your dashboard, you must add your public and private keys in the environment.
25 |
26 | Add a `KEYMETRICS_PUBLIC` and a `KEYMETRICS_SECRET` environment variables and fill their value with your keys.
27 |
28 | You can access your keys at the top right of your dashboard
29 | {: .tip}
30 |
31 | ### Set the server name in pm2 Plus
32 |
33 | Add a `PM2_MACHINE_NAME` environment variable to the ecosystem file to specify a server name:
34 |
35 | ```javascript
36 | module.exports = {
37 | apps : [{
38 | name: "app",
39 | script: "./app.js",
40 | instances: "max",
41 | env: {
42 | NODE_ENV: "development",
43 | },
44 | env_production: {
45 | NODE_ENV: "production",
46 | PM2_MACHINE_NAME: "now-my-app",
47 | }
48 | }]
49 | }
50 | ```
51 |
52 | The default server name is the hostname (`HOST` variable) with a few random characters.
53 | {: .tip}
54 |
55 | Be careful, in case of duplicate hostnames the dashboard will receive data from both instances and flicker.
56 | {: .tip}
57 |
58 | ### Next Steps
59 |
60 | Complete your [dashboard configuration]({{ site.baseurl }}{% link en/plus/guide/configuration.md %}).
61 |
62 |
63 |
64 |
65 |
--------------------------------------------------------------------------------
/en/plus/quick-start.md:
--------------------------------------------------------------------------------
1 | ---
2 | layout: page
3 | title: Installation | PM2 Plus Documentation
4 | menu: starter
5 | lang: en
6 | section: plus
7 | permalink: "/en/plus/quick-start/"
8 | ---
9 |
10 | # Installation
11 |
12 | In seconds, this Installation tutorial will show you how to start monitoring your Node.js application with PM2 Plus.
13 |
14 | ## Create an account
15 |
16 | You can create a PM2 plus account by registering [here](https://id.keymetrics.io/api/oauth/register) or juste by typing ```pm2 plus``` in your terminal.
17 |
18 | Then just simply follow the in-app tutorial
19 | 
20 |
21 |
22 | ## Connect your server to the dashboard
23 |
24 | Connect your server to your dashboard and start collecting metrics with:
25 |
26 | ```bash
27 | pm2 link
28 | ```
29 |
30 | Or, if you don't have access to the CLI, add `PM2_PUBLIC_KEY` and `PM2_SECRET_KEY` environment variables set with your public and private keys.
31 |
32 | Use the `connect` button on the top right of your dashboard to find your `PM2_PUBLIC_KEY` and `PM2_SECRET_KEY`
33 | {: .tip}
34 |
35 |
36 | ## You are done
37 |
38 | Go back to the dashboard, you will have access to realtime metrics of your app.
39 |
40 | 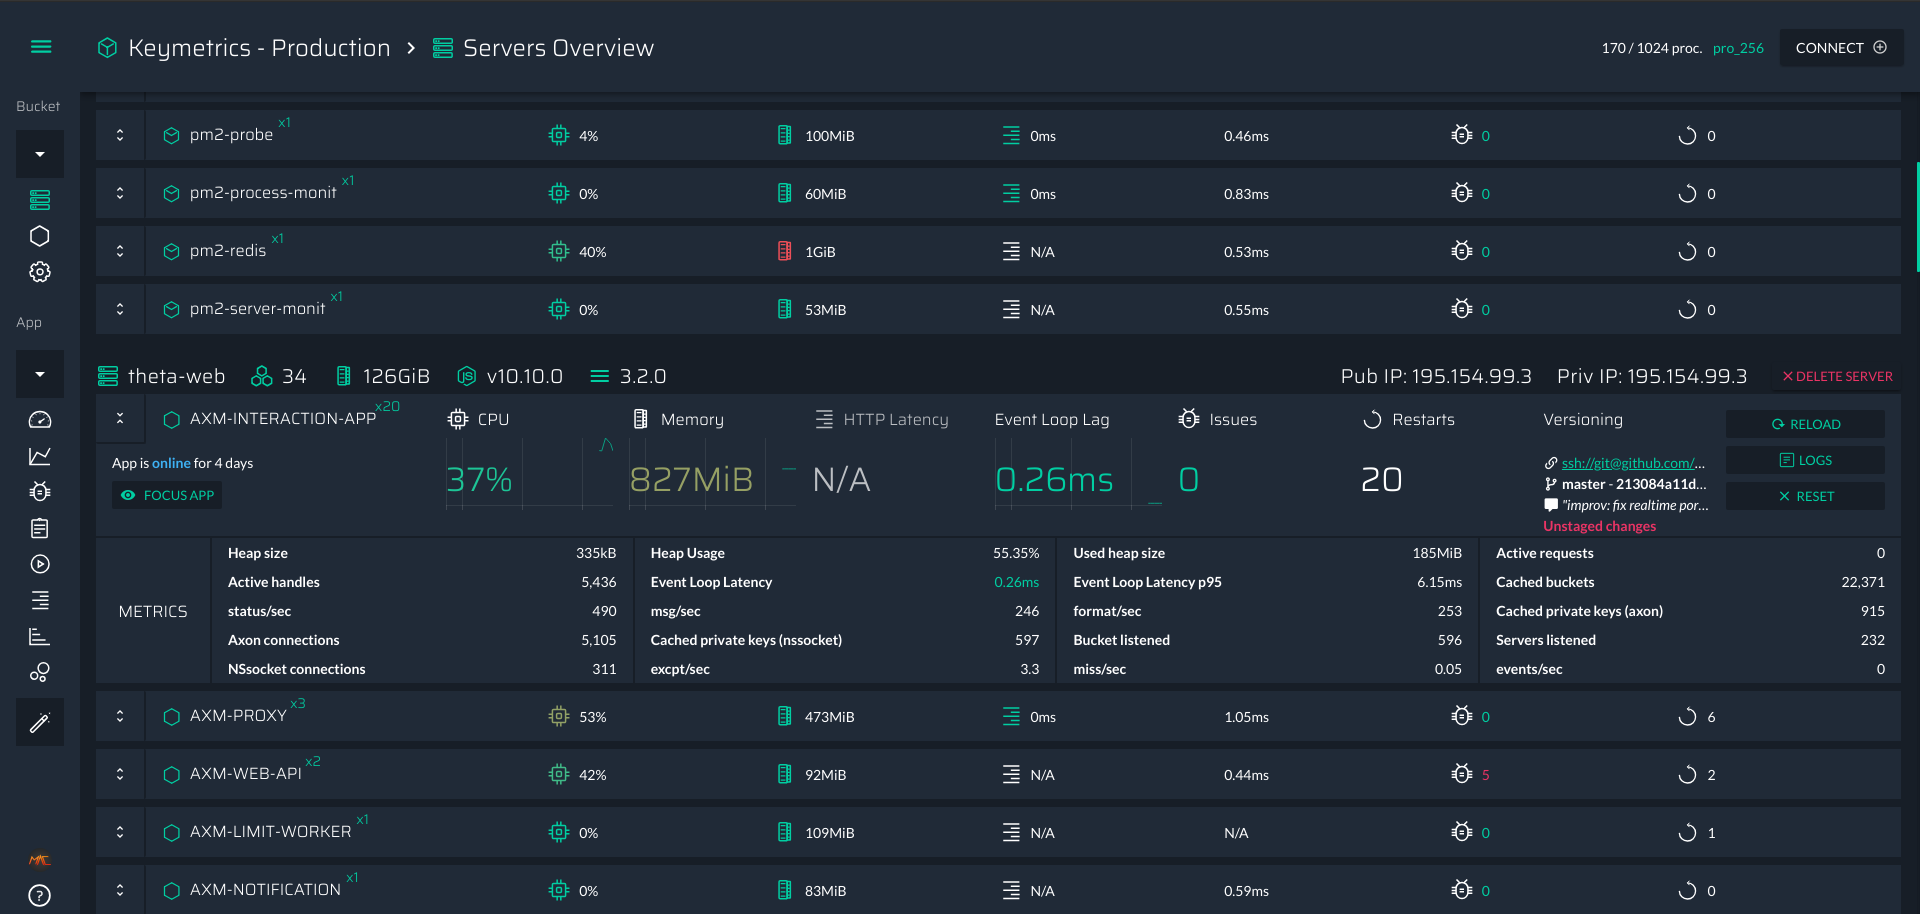
41 |
42 | ## Next Steps
43 |
44 | [Discover the Dashboard]({{ site.baseurl }}{% link en/plus/guide/server-apps-overview.md %})
45 | {: .btn-stylized}
46 |
47 |
48 |
49 |
50 |
51 |
52 |
53 |
--------------------------------------------------------------------------------
/en/runtime/best-practices/README.md:
--------------------------------------------------------------------------------
1 | ---
2 | layout: page
3 | title: Best Practices | PM2 Documentation
4 | menu: starter
5 | lang: en
6 | section: runtime
7 | hide_comments: true
8 | permalink: "/en/runtime/best-practices/"
9 | ---
10 |
11 | # Production Best Practices
12 |
13 | This section gathers production best practices to make your app scalable from the beginning:
14 |
15 | - [Environment Variables in Node.js]({{ site.baseurl }}{% link en/runtime/best-practices/environment-variables.md %})
16 | - [Graceful Shutdown]({{ site.baseurl }}{% link en/runtime/best-practices/graceful-shutdown.md %})
17 | - [Stateless Application]({{ site.baseurl }}{% link en/runtime/best-practices/stateless-application.md %})
18 |
--------------------------------------------------------------------------------
/en/runtime/best-practices/stateless-application.md:
--------------------------------------------------------------------------------
1 | ---
2 | layout: page
3 | title: Stateless Application | Best Practices | PM2 Documentation
4 | menu: starter
5 | lang: en
6 | section: runtime
7 | permalink: "/en/runtime/best-practices/stateless-application/"
8 | ---
9 |
10 | # Stateless Application
11 |
12 | A stateless application has no local data stored in the process. For example, sessions/websocket connections, session-memory and related.
13 |
14 | You must use Redis, Mongo or other databases to share all states between processes.
15 |
16 | A useful resource on how to write efficient, production ready stateless application is The Twelve Factor Application manifesto:
17 |
18 |
19 |
20 |
21 |
--------------------------------------------------------------------------------
/en/runtime/features/#memory-limit.md#:
--------------------------------------------------------------------------------
1 | ---
2 | layout: page
3 | title: Memory Threshold Auto Reload | Features | PM2 Documentation
4 | description: Fast way to temporarily fix memory leaks
5 | lang: en
6 | section: runtime
7 | permalink: /en/runtime/features/memory-limit
8 | ---
9 |
10 | ## Max Memory Threshold Auto Reload
11 |
12 | PM2 allows to reload (auto fallback to restart if not in cluster) an application based on a memory limit/ Please note that the PM2 internal worker (which checks memory), starts every 30 seconds, so you may have to wait a bit before your process gets restarted automatically after reaching the memory threshold.
13 |
14 | CLI:
15 |
16 | ```bash
17 | pm2 start api.js --max-memory-restart 300M
18 | ```
19 |
20 | Config file (ecosystem.config.js):
21 |
22 | ```javascript
23 | module.exports = {
24 | apps: [{
25 | name: 'api',
26 | script: 'api.js',
27 | max_memory_restart: '300M'
28 | }]
29 | }
30 | ```
31 |
32 | *Note:* Units can be K(ilobyte), M(egabyte), G(igabyte).
33 |
--------------------------------------------------------------------------------
/en/runtime/features/commands-cheatsheet.md:
--------------------------------------------------------------------------------
1 | ---
2 | layout: page
3 | title: Commands Cheatsheet | PM2 Documentation
4 | description: PM2 Inception
5 | lang: en
6 | section: runtime
7 | permalink: "/en/runtime/features/commands-cheatsheet/"
8 | ---
9 |
10 | ## CheatSheet
11 |
12 | Here is a quick, pragmatic overview of a range of PM2 commands:
13 |
14 | ### Install
15 |
16 | ```bash
17 | $ npm install pm2 -g
18 | ```
19 |
20 | ### Start an app
21 |
22 | ```bash
23 | $ pm2 start app.js
24 | ```
25 |
26 | ### Start and auto-restart on file change
27 |
28 | ```bash
29 | $ pm2 start app.js --watch [--ignore-watch /*/]
30 | ```
31 |
32 | ### List apps
33 |
34 | ```bash
35 | pm2 list
36 | ```
37 |
38 | ### Show extended infos
39 |
40 | ```bash
41 | $ pm2 show
42 | ```
43 |
44 | ### Restart
45 |
46 | ```bash
47 | $ pm2 restart app
48 | ```
49 |
50 | ### Restart and update env
51 |
52 | ```bash
53 | $ NODE_ENV=production pm2 restart app --update-env
54 | ```
55 |
56 | ### Stop
57 |
58 | ```bash
59 | $ pm2 stop app
60 | ```
61 |
62 | ### Delete
63 |
64 | ```bash
65 | $ pm2 delete app
66 | ```
67 |
68 | ### Show logs
69 |
70 | ```bash
71 | $ pm2 logs
72 | ```
73 |
74 | ### Show env
75 |
76 | ```bash
77 | $ pm2 env
78 | ```
79 |
80 | ### Start PM2 at boot
81 |
82 | ```bash
83 | $ pm2 startup
84 | ```
85 |
86 | ### Set a name
87 |
88 | ```bash
89 | $ pm2 start app.js --name="name"
90 | # or update name
91 | $ pm2 restart app --name="new-name"
92 | ```
93 |
94 | ### Reset Restart Counters
95 |
96 | ```bash
97 | $ pm2 reset all
98 | ```
99 |
100 | ### Monitoring
101 |
102 | ```bash
103 | $ pm2 monitor
104 | ```
105 |
106 | ### Dump all process data
107 |
108 | ```bash
109 | $ pm2 prettylist
110 | # or
111 | $ pm2 show
112 | ```
113 |
--------------------------------------------------------------------------------
/en/runtime/features/memory-limit.md:
--------------------------------------------------------------------------------
1 | ---
2 | layout: page
3 | title: Memory Threshold Auto Reload | Features | PM2 Documentation
4 | description: Fast way to temporarily fix memory leaks
5 | lang: en
6 | section: runtime
7 | permalink: "/en/runtime/features/memory-limit/"
8 | ---
9 |
10 | ## Max Memory Threshold Auto Reload
11 |
12 | PM2 allows to reload (auto fallback to restart if not in cluster) an application based on a memory limit/ Please note that the PM2 internal worker (which checks memory), starts every 30 seconds, so you may have to wait a bit before your process gets restarted automatically after reaching the memory threshold.
13 |
14 | CLI:
15 |
16 | ```bash
17 | pm2 start api.js --max-memory-restart 300M
18 | ```
19 |
20 | Config file (ecosystem.config.js):
21 |
22 | ```bash
23 | module.exports = {
24 | apps: [{
25 | name: 'api',
26 | script: 'api.js',
27 | max_memory_restart: '300M'
28 | }]
29 | }
30 | ```
31 |
32 | *Note:* Units can be K(ilobyte), M(egabyte), G(igabyte).
33 |
--------------------------------------------------------------------------------
/en/runtime/features/multiple-pm2.md:
--------------------------------------------------------------------------------
1 | ---
2 | layout: page
3 | title: Multiple PM2 Runtime | Features | PM2 Documentation
4 | description: PM2 Inception
5 | lang: en
6 | section: runtime
7 | permalink: "/en/runtime/features/multiple-pm2/"
8 | ---
9 |
10 | ## Running Multiple PM2
11 |
12 | If you want to run multiple PM2 under the same user, you can override the variable `PM2_HOME`. Setting the PM2_HOME will change the PM2 configuration folder, like communication sockets (`$HOME/.pm2/pub.sock` and `$HOME/.pm2/rpc.sock`), default logs location path, pids and so on.
13 |
14 | ```javascript
15 | PM2_HOME=/tmp/.pm2 pm2 start echo.js
16 | PM2_HOME=/tmp/.pm3 pm2 start echo.js
17 | ```
18 |
--------------------------------------------------------------------------------
/en/runtime/features/restart-strategies.md:
--------------------------------------------------------------------------------
1 | ---
2 | layout: page
3 | title: Restart Strategies | Features | PM2 Documentation
4 | description: Different Restart Strategies in case of crash
5 | lang: en
6 | section: runtime
7 | permalink: "/en/runtime/features/restart-strategies/"
8 | ---
9 |
10 | ## Exponential Backoff Restart Delay
11 |
12 | *Available in PM2 >= 3.2*
13 |
14 | A new restart mode has been implemented on PM2 Runtime, making your application restarts in a smarter way. Instead of restarting your application like crazy when exceptions happens (e.g. database is down), the *exponential backoff restart* will increase incrementaly the time between restarts, reducing the pressure on your DB or your external provider... Pretty easy to use:
15 |
16 | CLI:
17 | ```bash
18 | $ pm2 start app.js --exp-backoff-restart-delay=100
19 | ```
20 |
21 | Or via ecosystem.config.js file:
22 | ```javascript
23 | module.exports = [{
24 | script: 'app.js',
25 | exp_backoff_restart_delay: 100
26 | }]
27 | ```
28 |
29 | When an application crash unexpectedly and the option `--exp-backoff-restart-delay` is activated, you will be able to see a new application status **waiting restart**.
30 |
31 | By running `pm2 logs` you will also see the restart delay being incremented:
32 | ```
33 | PM2 | App [throw:0] will restart in 100ms
34 | PM2 | App [throw:0] exited with code [1] via signal [SIGINT]
35 | PM2 | App [throw:0] will restart in 150ms
36 | PM2 | App [throw:0] exited with code [1] via signal [SIGINT]
37 | PM2 | App [throw:0] will restart in 225ms
38 | ```
39 |
40 | As you can see the restart delay between restarts will increase in an exponential moving average, till reaching the maximum of 15000ms between restarts.
41 |
42 | When the application will then get back to a stable mode (uptime without restarts of more than 30 seconds), the restart delay will automatically reset to 0ms.
43 |
44 | ## Fixed Restart Delay
45 |
46 | *Available in PM2 >= 0.9*
47 |
48 | You can also use the `restart_delay` to set a fixed timing between restarts:
49 |
50 | CLI:
51 | ```bash
52 | $ pm2 start app.js --restart-delay=3000
53 | ```
54 |
55 | Or via ecosystem.config.js file:
56 | ```javascript
57 | module.exports = [{
58 | script: 'app.js',
59 | restart_delay: 3000
60 | }]
61 | ```
62 |
63 | ## Memory based reload strategy
64 |
65 | Checkout [https://pm2.io/doc/en/runtime/features/memory-limit/](https://pm2.io/doc/en/runtime/features/memory-limit/)
66 |
67 | ## 0second Downtime Reload
68 |
69 | Checkout the cluster mode to get [this behavior](/doc/en/runtime/guide/load-balancing/#0-seconds-downtime-reload)
70 |
71 | ## No Auto Restart
72 |
73 | This is useful in case we wish to run 1-time scripts and don't want the process manager to restart our script in case it's completed running.
74 |
75 | Simply running these scripts from bash would terminate the script in case the ssh-session is terminated and the script should not get restarted when it completes execution.
76 |
77 | PM2 is perfect for such cases, providing robust monitoring and logging
78 |
79 | CLI:
80 | ```bash
81 | $ pm2 start app.js --no-autorestart
82 | ```
83 |
--------------------------------------------------------------------------------
/en/runtime/features/source-maps.md:
--------------------------------------------------------------------------------
1 | ---
2 | layout: page
3 | title: Memory Threshold Auto Reload | Features | PM2 Documentation
4 | description: Set a memory limit and allow soft reloads without downtime
5 | lang: en
6 | section: runtime
7 | permalink: "/en/runtime/features/javascript-source-maps/"
8 | ---
9 |
10 | ## Source Map
11 |
12 | If you use [BabelJS](https://babeljs.io/), [Typescript](http://www.typescriptlang.org/) or any other Javascript superset you may have noticed that when an exception occurs, the stacktrace is not meaningful at all. To get interesting informations you need to generate [source map files](http://www.html5rocks.com/en/tutorials/developertools/sourcemaps/).
13 |
14 | Once these source map files are generated, PM2 will automatically detects them and will help you inspect errors.
15 |
16 | **PM2 automatically detects javascript source map files** if the file you start (let's say app.js) has his map equivalence (e.g app.js.map).
17 |
18 | ### Inspect exceptions
19 |
20 | Exceptions are logged into your application error log file.
21 |
22 | To check your logs to detect exceptions, you simply have to type:
23 |
24 | ```bash
25 | pm2 logs main
26 | ```
27 |
28 | Or use PM2+ to get emailed and get exceptions analysis when it happens
29 |
30 | ### Disable source map support
31 |
32 | If you do not want PM2 to automatically support javascript source map you can use the option `--disable-source-map-support`.
33 |
34 | It can be done both via CLI and via JSON file.
35 |
--------------------------------------------------------------------------------
/en/runtime/features/updating-pm2.md:
--------------------------------------------------------------------------------
1 | ---
2 | layout: page
3 | title: Updating PM2 | Features | PM2 Documentation
4 | description: Updating is a matter of 3 commands
5 | lang: en
6 | section: runtime
7 | permalink: "/en/runtime/features/updating-pm2/"
8 | ---
9 |
10 | ## Updating PM2
11 |
12 | Updating PM2 is straightforward. Upgrading between minor and patch versions will **never** break anything on your environment
13 |
14 | You will have to first run the installation command:
15 |
16 | ```bash
17 | $ npm install pm2@latest -g
18 | ```
19 |
20 | Then to save your current process list, kill the previous PM2 daemon and restore process list with the new PM2 version is as easy as doing:
21 |
22 | ```bash
23 | $ pm2 update
24 | ```
25 |
--------------------------------------------------------------------------------
/en/runtime/features/watch-restart.md:
--------------------------------------------------------------------------------
1 | ---
2 | layout: page
3 | title: Watch & Restart | Features | PM2 Documentation
4 | description: Watch & Restart application on file change
5 | lang: en
6 | section: runtime
7 | permalink: "/en/runtime/features/watch-restart/"
8 | ---
9 |
10 | ## Auto restart apps on file change
11 |
12 | PM2 can automatically restart your application when a file is modified in the current directory or its subdirectories:
13 |
14 | ```bash
15 | pm2 start app.js --watch
16 | ```
17 |
18 | If `--watch` is enabled, stopping it won't stop watching:
19 |
20 | - `pm2 stop 0` will not stop watching
21 | - `pm2 stop 0 --watch` will stop watching
22 |
23 | Restart with `--watch` will toggle the `watch` parameter.
24 |
25 | To watch specific paths, please use a [Ecosystem File](/doc/en/runtime/guide/ecosystem-file/), `watch` can take a string or an array of paths. Default is `true`:
26 |
27 | ```javascript
28 | module.exports = {
29 | apps: [{
30 | script: "app.js",
31 | watch: ["server", "client"],
32 | // Delay between restart
33 | watch_delay: 1000,
34 | ignore_watch : ["node_modules", "client/img"],
35 | watch_options: {
36 | "followSymlinks": false
37 | }
38 | }]
39 | }
40 | ```
41 |
42 | Notes:
43 |
44 | `watch_options` is an object that will replace options given to chokidar. Please refer to [chokidar documentation](https://github.com/paulmillr/chokidar#api) for the definition.
45 |
46 | PM2 is giving chokidar these Default options:
47 |
48 | ```
49 | var watch_options = {
50 | persistent : true,
51 | ignoreInitial : true
52 | }
53 | ```
54 |
--------------------------------------------------------------------------------
/en/runtime/guide/development-tools.md:
--------------------------------------------------------------------------------
1 | ---
2 | layout: page
3 | title: Development Tools | Guide | PM2 Documentation
4 | menu: starter
5 | lang: en
6 | section: runtime
7 | permalink: "/en/runtime/guide/development-tools/"
8 | ---
9 |
10 | # Development Tools
11 |
12 | PM2 comes with two development tools that will help you on the development stage: a watch and restart mode and a server for static files.
13 |
14 | ## Watch and Restart
15 |
16 | The watch and restart mode watches the current directory to detect file changes and auto-start.
17 |
18 | This mode can be enable in your ecosystem.config.js:
19 |
20 | ```javascript
21 | module.exports = {
22 | apps : [{
23 | name: "app",
24 | script: "./app.js",
25 | watch: true,
26 | }]
27 | }
28 | ```
29 |
30 | Beware that the watch and restart mode makes hard restart, without sending SIGINT.
31 | {: .tip}
32 |
33 | ### Watch options
34 |
35 | You can use advanced options to specify path to watch or path to ignore.
36 |
37 | ```javascript
38 | module.exports = {
39 | apps : [{
40 | name: "app",
41 | script: "./app.js",
42 | watch: ".",
43 | }]
44 | }
45 | ```
46 |
47 | - `watch` can also be a string or an array of paths to watch. Current directory is watched when set to `true`.
48 | - `ignore_watch` can be an array of paths or a string. It is used by the [chokidar](https://github.com/paulmillr/chokidar#path-filtering) dependency as a glob or a regular expression.
49 | - `watch_options` is an object that is given as options to [chokidar](https://github.com/paulmillr/chokidar#api) dependency (default options used by pm2 are persistent and ignoreInitial set to true)
50 |
51 | When working with NFS devices you'll need to set `usePolling: true` as stated in [this chokidar issue](https://github.com/paulmillr/chokidar/issues/242).
52 |
53 | ### With CLI
54 |
55 | Watch mode can also be enabled via CLI with
56 |
57 | ```bash
58 | pm2 start app.js --watch
59 | ```
60 |
61 | However, please note that when `--watch` is enabled, you must use `pm2 stop --watch ` to stop the process, as simple stop won't stop the watching.
62 |
63 | ## Serve static file over HTTP
64 |
65 | pm2 can serve static files (like a frontend app) over HTTP with:
66 |
67 | ```bash
68 | pm2 serve
69 | ```
70 |
71 | As default values are `current folder` and `8080`, you can then just use:
72 |
73 | ```bash
74 | pm2 serve
75 | ```
76 |
77 | In the ecosystem file:
78 |
79 | ```javascript
80 | module.exports = {
81 | apps: [{
82 | name: "static-file",
83 | script: "serve",
84 | env: {
85 | PM2_SERVE_PATH: ".",
86 | PM2_SERVE_PORT: 8080,
87 | },
88 | }]
89 | }
90 | ```
91 |
92 | and start with:
93 |
94 | ```bash
95 | pm2 start ecosystem.config.js
96 | ```
97 |
98 | All other pm2 options are still available.
99 | {: .tip}
100 |
101 | ## Next Steps
102 |
103 | [Easy Deploy with SSH]({{ site.baseurl }}{% link en/runtime/guide/easy-deploy-with-ssh.md %})
104 | {: .btn-stylized}
105 |
--------------------------------------------------------------------------------
/en/runtime/guide/ecosystem-file.md:
--------------------------------------------------------------------------------
1 | ---
2 | layout: page
3 | title: Ecosystem File | Guide | PM2 Documentation
4 | menu: starter
5 | lang: en
6 | section: runtime
7 | permalink: "/en/runtime/guide/ecosystem-file/"
8 | ---
9 |
10 | # Ecosystem File
11 |
12 | When deploying on multiple servers or when using multiple CLI arguments, an alternative to the command line becomes more convenient for starting your apps.
13 |
14 | The purpose of the ecosystem file is to gather all options and environment variables for all your applications.
15 |
16 | ## Generate a template
17 |
18 | Generate an `ecosystem.config.js` template with:
19 |
20 | ```bash
21 | pm2 ecosystem
22 | ```
23 |
24 | This will generate:
25 |
26 | ```javascript
27 | module.exports = {
28 | apps : [{
29 | name: "app",
30 | script: "./app.js",
31 | env: {
32 | NODE_ENV: "development",
33 | },
34 | env_production: {
35 | NODE_ENV: "production",
36 | }
37 | }]
38 | }
39 | ```
40 |
41 | For more information about available properties, check the [ecosystem file reference]({{ site.baseurl }}{% link en/runtime/reference/ecosystem-file.md %}).
42 |
43 | ## Use your ecosystem file
44 |
45 | ### Routine
46 |
47 | Inside your source code working directory, you can add all of the applications to your process list with:
48 |
49 | ```bash
50 | pm2 start
51 | ```
52 |
53 | This will run all of the `apps` defined within the `ecosystem.config.js` generated with `pm2 init`.
54 |
55 | You can also load an ecosystem from an other folder with:
56 |
57 | ```bash
58 | pm2 start /path/to/ecosystem.config.js
59 | ```
60 |
61 | ### Only use a specific app
62 |
63 | Use your ecosystem file only on a specific application with the option `--only `:
64 |
65 | ```bash
66 | pm2 start --only app
67 | ```
68 |
69 | ## Environment variables
70 |
71 | You can declare variables for multiple environments. Each enviroment key must have this format: `env_`.
72 |
73 | For example, the following `app` process can be started in two environments: `development` and `production`.
74 |
75 | ```javascript
76 | module.exports = {
77 | apps : [{
78 | name: "app",
79 | script: "./app.js",
80 | env: {
81 | NODE_ENV: "development",
82 | },
83 | env_production: {
84 | NODE_ENV: "production",
85 | }
86 | }]
87 | }
88 | ```
89 |
90 | To start this `app` in a particular environment, use the `--env` flag:
91 |
92 | ```bash
93 | pm2 start ecosystem.config.js # uses variables from `env`
94 | pm2 start ecosystem.config.js --env production # uses variables from `env_production`
95 | ```
96 |
97 | ### Options Reference
98 |
99 | To know more about all the options available checkout [the complete option reference](https://pm2.io/doc/en/runtime/reference/ecosystem-file/)
100 |
101 | ## Next Steps
102 |
103 | [Process Management]({{ site.baseurl }}{% link en/runtime/guide/process-management.md %})
104 | {: .btn-stylized}
105 |
--------------------------------------------------------------------------------
/en/runtime/guide/entrypoint.md:
--------------------------------------------------------------------------------
1 | ---
2 | layout: page
3 | title: Entrypoint | Guide | PM2 Documentation
4 | menu: starter
5 | lang: en
6 | section: runtime
7 | permalink: "/en/runtime/guide/entrypoint/"
8 | ---
9 |
10 | # Entrypoint
11 |
12 | The **entrypoint.js** lets you precisely contol your application flow and organize the link between the Node.js runtime and PM2.
13 |
14 | ## Entrypoint base class
15 |
16 | The entrypoint has 4 methods; onStart, onStop, sensors and actuators. Here is an example of this class:
17 |
18 | ```javascript
19 | const Entrypoint = require('@pm2/io').Entrypoint
20 |
21 | new class App extends Entrypoint {
22 | // This is the very first method called on startup
23 | onStart (cb) {
24 |
25 | // Returning the callback will tell PM2 that the app is ready to process queries
26 | return cb()
27 | }
28 |
29 | // This is the very last method called on exit || uncaught exception
30 | onStop(err, cb, code, signal) {
31 | }
32 |
33 | // Here we declare some process metrics
34 | sensors () {
35 | }
36 |
37 | // Here are some actions to interact with the app in live
38 | actuators () {
39 | }
40 | }
41 | ```
42 |
43 | ## Example
44 |
45 | Here is a concrete example for a simple Hello world http api:
46 |
47 | ```javascript
48 | const io = require('@pm2/io')
49 | const app = require('express')()
50 |
51 | new class MyApp extends io.Entrypoint {
52 | // This is the very first method called on startup
53 | onStart (cb) {
54 | const http = require('http').Server(app)
55 |
56 | app.get('/', (req, res) => {
57 | this.reqMeter.mark()
58 | res.send('Hello From Entrypoint.js')
59 | });
60 |
61 | this.server = app.listen(cb)
62 | }
63 |
64 | // This is the very last method called on exit || uncaught exception
65 | onStop (err, cb, code, signal) {
66 | console.log(`App has exited with code ${code}`)
67 | }
68 |
69 | // Here we declare some process metrics
70 | sensors () {
71 | this.reqMeter = this.io.meter('req/min')
72 | }
73 |
74 | // Here are some actions to interact with the app in live
75 | actuators () {
76 | this.io.action('getEnv', (reply) => {
77 | reply({ server: this.server })
78 | })
79 | }
80 | }
81 | ```
82 |
83 | Then to start it just run:
84 |
85 | ```
86 | pm2 start entrypoint.js
87 | ```
88 |
89 | ## Roadmap
90 |
91 | We plan to implement ecosystem file configuration straight into this entrypoint.js file, if you have any remarks, ideas or feedback feel free to [post an issue](https://github.com/Unitech/pm2)
92 |
--------------------------------------------------------------------------------
/en/runtime/guide/installation.md:
--------------------------------------------------------------------------------
1 | ---
2 | layout: page
3 | title: Installation | Guide | PM2 Documentation
4 | menu: starter
5 | lang: en
6 | section: runtime
7 | permalink: "/en/runtime/guide/installation/"
8 | ---
9 |
10 | # Installation
11 |
12 | ## Install pm2
13 |
14 | With yarn:
15 | ```bash
16 | yarn global add pm2
17 | ```
18 |
19 | With npm:
20 | ```bash
21 | npm install pm2 -g
22 | ```
23 |
24 | With debian, use the install script:
25 | ```bash
26 | apt update && apt install sudo curl && curl -sL https://raw.githubusercontent.com/Unitech/pm2/master/packager/setup.deb.sh | sudo -E bash -
27 | ```
28 |
29 | With docker, follow this [tutorial]({{ site.baseurl }}{% link en/runtime/integration/docker.md %}).
30 |
31 | ### CLI autocompletion
32 |
33 | By default, CLI autocompletion is not installed with PM2, we recommend it:
34 |
35 | ```bash
36 | pm2 completion install
37 | ```
38 |
39 | ### Source map support
40 |
41 | Source map files are autodetected by default if they are present (`app.js.map` for `app.js`).
42 |
43 | What are source map files? If using Babel, Typescript or any other Javascript superset, you may have noticed that stacktraces are not meaningful, errors not pointing to the right line. Source map files can be used to solve this problem.
44 | {: .tip}
45 |
46 | ## Update
47 |
48 | Keep your pm2 up to date with:
49 |
50 | ```bash
51 | npm install pm2 -g && pm2 update
52 | ```
53 |
54 | `pm2 update` is necessary in order to refresh the PM2 daemon.
55 | {: .tip}
56 |
57 | ## Next Steps
58 |
59 | [Ecosystem File]({{ site.baseurl }}{% link en/runtime/guide/ecosystem-file.md %})
60 | {: .btn-stylized}
61 |
--------------------------------------------------------------------------------
/en/runtime/integration/cloud-providers.md:
--------------------------------------------------------------------------------
1 | ---
2 | layout: page
3 | title: Cloud Providers | Integration | PM2 Documentation
4 | menu: starter
5 | lang: en
6 | section: runtime
7 | permalink: "/en/runtime/integration/cloud-providers/"
8 | ---
9 |
10 | # Using PM2 in a Cloud Provider
11 |
12 | You might find yourself in a situation in which you do not have access to the CLI to start your Node.js applications.
13 |
14 | In such a situation, pm2 must be added as a dependency and must be called with the start script.
15 |
16 | ## Prepare your app
17 |
18 | ### Set your ecosystem file
19 |
20 | Generate an `ecosystem.config.js` template with:
21 |
22 | ```bash
23 | pm2 init
24 | ```
25 |
26 | Modify the ecosystem file to match your needs:
27 |
28 | ```javascript
29 | module.exports = {
30 | apps : [{
31 | name: "app",
32 | script: "./app.js",
33 | env: {
34 | NODE_ENV: "development",
35 | },
36 | env_production: {
37 | NODE_ENV: "production",
38 | }
39 | }]
40 | }
41 | ```
42 |
43 | Learn more about ecosystem file [here]({{ site.baseurl }}{% link en/runtime/guide/ecosystem-file.md %}).
44 | {: .tip}
45 |
46 | ### Add PM2 as a module
47 |
48 | Add pm2 as a dependency to your projet.
49 |
50 | With npm:
51 |
52 | ```bash
53 | npm install pm2
54 | ```
55 |
56 | With yarn:
57 |
58 | ```bash
59 | yarn add pm2
60 | ```
61 |
62 | ### Start script in package.json
63 |
64 | In your `package.json`, modify your `start` script like the following:
65 |
66 | ```json
67 | {
68 | "scripts": {
69 | "start": "pm2-runtime start ecosystem.config.js --env production"
70 | }
71 | }
72 | ```
73 |
74 | ## Deploy your app
75 |
76 | You can now deploy your application in your cloud providers like you would have done for a regular node.js app.
77 |
78 | ## Next Steps
79 |
80 | Complete your configuration with the [Ecosystem File]({{ site.baseurl }}{% link en/runtime/guide/ecosystem-file.md %}).
81 |
82 | Monitor your app on a web dashboard, with [PM2 Plus]({{ site.baseurl }}{% link en/plus/integration/cloud-providers.md %}).
83 |
--------------------------------------------------------------------------------
/en/runtime/integration/now.md:
--------------------------------------------------------------------------------
1 | Now.sh is actually not supported
2 | {: .warn}
3 |
4 | # Using PM2 with Now.sh
5 |
6 | This page will guide you step by step through the PM2 integration with Now.sh.
7 |
8 | ## Prepare your app
9 |
10 | ### Set your ecosystem file
11 |
12 | Generate an `ecosystem.config.js` template with:
13 |
14 | ```bash
15 | pm2 init
16 | ```
17 |
18 | Modify the ecosystem file to match your needs:
19 |
20 | ```javascript
21 | module.exports = {
22 | apps : [{
23 | name: "app",
24 | script: "./app.js",
25 | env: {
26 | NODE_ENV: "development",
27 | },
28 | env_production: {
29 | NODE_ENV: "production",
30 | }
31 | }]
32 | }
33 | ```
34 |
35 | Learn more about ecosystem file [here]({{ site.baseurl }}{% link en/runtime/guide/ecosystem-file.md %}).
36 | {: .tip}
37 |
38 | ### Add PM2 as a module
39 |
40 | Add pm2 as a dependency to your projet.
41 |
42 | With npm:
43 |
44 | ```bash
45 | npm install --save pm2
46 | ```
47 |
48 | With yarn:
49 |
50 | ```bash
51 | yarn add pm2
52 | ```
53 |
54 | ### Set your package.json
55 |
56 | In your `package.json`, modify your `start` script like the following:
57 |
58 | ```json
59 | {
60 | "scripts": {
61 | "start": "node ./node_modules/.bin/pm2-runtime start ecosystem.config.js --env production" }
62 | ```
63 |
64 | ## Deploy with Now.sh
65 |
66 | ### You are ready
67 |
68 | You can now deploy your application on Now.sh like you would have done for a regular node.js app.
69 |
70 | ## Next Steps
71 |
72 | Complete your configuration with the [Ecosystem File]({{ site.baseurl }}{% link en/runtime/guide/ecosystem-file.md %}).
73 |
74 | Monitor your app on a dashboard, with [PM2 Plus]({{ site.baseurl }}{% link en/plus/integration/now.md %}).
--------------------------------------------------------------------------------
/en/runtime/integration/transpilers.md:
--------------------------------------------------------------------------------
1 | ---
2 | layout: page
3 | title: Transpilers | Integration | PM2 Documentation
4 | menu: starter
5 | lang: en
6 | section: runtime
7 | permalink: "/en/runtime/integration/transpilers/"
8 | ---
9 |
10 | # Using PM2 with transpilers
11 |
12 | This tutorial will show you how to use pm2 with transpilers.
13 |
14 | We highly don't recommend to use this in **production** as it slows down your app. In that case, your app must be bundled i.e. transpiled from the source to get a pre-processed version of your app.
15 | {: .warn}
16 |
17 | ## Typescript
18 |
19 | ```bash
20 | ## Add the new typescript dependency in PM2:
21 | pm2 install typescript
22 |
23 | ## Start app.ts in watch & restart:
24 | pm2 start app.ts --watch
25 | ```
26 |
27 | ## Babel
28 |
29 | ```bash
30 | ## Install the Babel CLI globally:
31 | npm install -g babel-cli
32 |
33 | ## Start pm2 with the Babel CLI binary in watch mode:
34 | pm2 start --watch --interpreter babel-cli app.js
35 | ```
36 |
37 | Or, you can create an other file, which requires the transpiler and your app:
38 | ```javascript
39 | // index.js
40 | require('babel-register');
41 | require('./app.js');
42 | ```
43 | Then, run:
44 | ```bash
45 | pm2 start --watch index.js
46 | ```
47 |
48 | The cluster mode is only available with the second option.
49 | {: .tip}
50 |
51 | ## Coffee-script
52 |
53 | ```bash
54 | ## Install Coffee Script at PM2 level:
55 | pm2 install coffeescript
56 |
57 | ## Start pm2 with coffee binary in watch mode:
58 | pm2 start app.coffee
59 | ```
60 |
61 | Or, you can install the coffeescript dependency via `npm install coffeescript` and require it in your code:
62 |
63 | ```javascript
64 | // index.js
65 | require('coffee/register');
66 | require('./app.coffee');
67 | ```
68 |
69 | Then, run:
70 | ```bash
71 | pm2 start index.js
72 | ```
73 |
74 | The cluster mode is only available with the second option.
75 | {: .tip}
76 |
--------------------------------------------------------------------------------
/gulpfile.js:
--------------------------------------------------------------------------------
1 | const gulp = require('gulp');
2 | const sass = require('gulp-sass');
3 | const gutil = require('gulp-util');
4 | const child = require('child_process');
5 | const browserSync = require('browser-sync').create();
6 | const prefix = require('gulp-autoprefixer');
7 |
8 | const siteRoot = 'docs/';
9 |
10 | // Serve static files and auto reload on CSS change
11 | gulp.task('serve', () => {
12 | browserSync.init({
13 | files: [siteRoot + '/**'],
14 | port: 4010,
15 | proxy: 'localhost:4000'
16 | });
17 |
18 | gulp.watch('./_sass/**.scss', ['sass']);
19 | });
20 |
21 | // Start Jekyll
22 | gulp.task('jekyll', () => {
23 | const jekyll = child.spawn('jekyll', [
24 | 'serve',
25 | '--watch',
26 | '--host=0.0.0.0',
27 | '--incremental',
28 | '--drafts'
29 | ]);
30 |
31 | const jekyllLogger = (buffer) => {
32 | buffer.toString()
33 | .split(/\n/)
34 | .forEach((message) => gutil.log('Jekyll: ' + message));
35 | };
36 |
37 | jekyll.stdout.on('data', jekyllLogger);
38 | jekyll.stderr.on('data', jekyllLogger);
39 | });
40 |
41 | // Transpile scss
42 | gulp.task('sass', function () {
43 | return gulp.src('./_sass/main.scss')
44 | .pipe(prefix())
45 | .pipe(sass().on('error', sass.logError))
46 | .pipe(gulp.dest('./docs/css'));
47 | });
48 |
49 | gulp.task('jekyll-build', (cb) => {
50 | const jekyll = child.spawn('jekyll', [
51 | 'build'
52 | ]);
53 |
54 | const jekyllLogger = (buffer) => {
55 | buffer.toString()
56 | .split(/\n/)
57 | .forEach((message) => gutil.log('Jekyll: ' + message));
58 | };
59 |
60 | jekyll.on('exit', cb)
61 | jekyll.stdout.on('data', jekyllLogger);
62 | jekyll.stderr.on('data', jekyllLogger);
63 | });
64 |
65 | gulp.task('dist', ['jekyll-build'], function () {
66 | return gulp.src('./_sass/main.scss')
67 | .pipe(prefix())
68 | .pipe(sass().on('error', sass.logError))
69 | .pipe(gulp.dest('./docs/css'));
70 | });
71 |
72 | gulp.task('default', ['sass', 'jekyll', 'serve']);
73 |
--------------------------------------------------------------------------------
/img/backgrounds/bg-doc_enterprise.png:
--------------------------------------------------------------------------------
https://raw.githubusercontent.com/keymetrics/doc-pm2/8bf849c8ebf8abeb47c8093beec0299cb9c04d87/img/backgrounds/bg-doc_enterprise.png
--------------------------------------------------------------------------------
/img/backgrounds/bg-doc_plus.png:
--------------------------------------------------------------------------------
https://raw.githubusercontent.com/keymetrics/doc-pm2/8bf849c8ebf8abeb47c8093beec0299cb9c04d87/img/backgrounds/bg-doc_plus.png
--------------------------------------------------------------------------------
/img/backgrounds/bg-doc_runtime.png:
--------------------------------------------------------------------------------
https://raw.githubusercontent.com/keymetrics/doc-pm2/8bf849c8ebf8abeb47c8093beec0299cb9c04d87/img/backgrounds/bg-doc_runtime.png
--------------------------------------------------------------------------------
/img/backgrounds/bg-squares.png:
--------------------------------------------------------------------------------
https://raw.githubusercontent.com/keymetrics/doc-pm2/8bf849c8ebf8abeb47c8093beec0299cb9c04d87/img/backgrounds/bg-squares.png
--------------------------------------------------------------------------------
/img/enterprise/alert_global.png:
--------------------------------------------------------------------------------
https://raw.githubusercontent.com/keymetrics/doc-pm2/8bf849c8ebf8abeb47c8093beec0299cb9c04d87/img/enterprise/alert_global.png
--------------------------------------------------------------------------------
/img/enterprise/enterprise-black.png:
--------------------------------------------------------------------------------
https://raw.githubusercontent.com/keymetrics/doc-pm2/8bf849c8ebf8abeb47c8093beec0299cb9c04d87/img/enterprise/enterprise-black.png
--------------------------------------------------------------------------------
/img/enterprise/frontend-1.png:
--------------------------------------------------------------------------------
https://raw.githubusercontent.com/keymetrics/doc-pm2/8bf849c8ebf8abeb47c8093beec0299cb9c04d87/img/enterprise/frontend-1.png
--------------------------------------------------------------------------------
/img/enterprise/frontend-2.png:
--------------------------------------------------------------------------------
https://raw.githubusercontent.com/keymetrics/doc-pm2/8bf849c8ebf8abeb47c8093beec0299cb9c04d87/img/enterprise/frontend-2.png
--------------------------------------------------------------------------------
/img/enterprise/frontend-3.png:
--------------------------------------------------------------------------------
https://raw.githubusercontent.com/keymetrics/doc-pm2/8bf849c8ebf8abeb47c8093beec0299cb9c04d87/img/enterprise/frontend-3.png
--------------------------------------------------------------------------------
/img/enterprise/logs.png:
--------------------------------------------------------------------------------
https://raw.githubusercontent.com/keymetrics/doc-pm2/8bf849c8ebf8abeb47c8093beec0299cb9c04d87/img/enterprise/logs.png
--------------------------------------------------------------------------------
/img/enterprise/rect-e.png:
--------------------------------------------------------------------------------
https://raw.githubusercontent.com/keymetrics/doc-pm2/8bf849c8ebf8abeb47c8093beec0299cb9c04d87/img/enterprise/rect-e.png
--------------------------------------------------------------------------------
/img/logos-pm2/pm2-enterprise_white.png:
--------------------------------------------------------------------------------
https://raw.githubusercontent.com/keymetrics/doc-pm2/8bf849c8ebf8abeb47c8093beec0299cb9c04d87/img/logos-pm2/pm2-enterprise_white.png
--------------------------------------------------------------------------------
/img/logos-pm2/pm2-plus_white.png:
--------------------------------------------------------------------------------
https://raw.githubusercontent.com/keymetrics/doc-pm2/8bf849c8ebf8abeb47c8093beec0299cb9c04d87/img/logos-pm2/pm2-plus_white.png
--------------------------------------------------------------------------------
/img/logos-pm2/pm2-runtime_white.png:
--------------------------------------------------------------------------------
https://raw.githubusercontent.com/keymetrics/doc-pm2/8bf849c8ebf8abeb47c8093beec0299cb9c04d87/img/logos-pm2/pm2-runtime_white.png
--------------------------------------------------------------------------------
/img/logos-pm2/pm2_enterprise.svg:
--------------------------------------------------------------------------------
1 |
--------------------------------------------------------------------------------
/img/logos-pm2/pm2_monitoring.svg:
--------------------------------------------------------------------------------
1 |
--------------------------------------------------------------------------------
/img/logos-pm2/pm2_runtime.svg:
--------------------------------------------------------------------------------
1 |
--------------------------------------------------------------------------------
/img/logos-pm2/pm2_white.svg:
--------------------------------------------------------------------------------
1 |
--------------------------------------------------------------------------------
/img/plus/2views.png:
--------------------------------------------------------------------------------
https://raw.githubusercontent.com/keymetrics/doc-pm2/8bf849c8ebf8abeb47c8093beec0299cb9c04d87/img/plus/2views.png
--------------------------------------------------------------------------------
/img/plus/apps.png:
--------------------------------------------------------------------------------
https://raw.githubusercontent.com/keymetrics/doc-pm2/8bf849c8ebf8abeb47c8093beec0299cb9c04d87/img/plus/apps.png
--------------------------------------------------------------------------------
/img/plus/cpu-profiling.png:
--------------------------------------------------------------------------------
https://raw.githubusercontent.com/keymetrics/doc-pm2/8bf849c8ebf8abeb47c8093beec0299cb9c04d87/img/plus/cpu-profiling.png
--------------------------------------------------------------------------------
/img/plus/flame-graph.png:
--------------------------------------------------------------------------------
https://raw.githubusercontent.com/keymetrics/doc-pm2/8bf849c8ebf8abeb47c8093beec0299cb9c04d87/img/plus/flame-graph.png
--------------------------------------------------------------------------------
/img/plus/issue.old.png:
--------------------------------------------------------------------------------
https://raw.githubusercontent.com/keymetrics/doc-pm2/8bf849c8ebf8abeb47c8093beec0299cb9c04d87/img/plus/issue.old.png
--------------------------------------------------------------------------------
/img/plus/issue.png:
--------------------------------------------------------------------------------
https://raw.githubusercontent.com/keymetrics/doc-pm2/8bf849c8ebf8abeb47c8093beec0299cb9c04d87/img/plus/issue.png
--------------------------------------------------------------------------------
/img/plus/memory-profiling.png:
--------------------------------------------------------------------------------
https://raw.githubusercontent.com/keymetrics/doc-pm2/8bf849c8ebf8abeb47c8093beec0299cb9c04d87/img/plus/memory-profiling.png
--------------------------------------------------------------------------------
/img/plus/modules.png:
--------------------------------------------------------------------------------
https://raw.githubusercontent.com/keymetrics/doc-pm2/8bf849c8ebf8abeb47c8093beec0299cb9c04d87/img/plus/modules.png
--------------------------------------------------------------------------------
/img/plus/notifications.png:
--------------------------------------------------------------------------------
https://raw.githubusercontent.com/keymetrics/doc-pm2/8bf849c8ebf8abeb47c8093beec0299cb9c04d87/img/plus/notifications.png
--------------------------------------------------------------------------------
/img/plus/personalized.old.png:
--------------------------------------------------------------------------------
https://raw.githubusercontent.com/keymetrics/doc-pm2/8bf849c8ebf8abeb47c8093beec0299cb9c04d87/img/plus/personalized.old.png
--------------------------------------------------------------------------------
/img/plus/personalized.png:
--------------------------------------------------------------------------------
https://raw.githubusercontent.com/keymetrics/doc-pm2/8bf849c8ebf8abeb47c8093beec0299cb9c04d87/img/plus/personalized.png
--------------------------------------------------------------------------------
/img/plus/plus-black.png:
--------------------------------------------------------------------------------
https://raw.githubusercontent.com/keymetrics/doc-pm2/8bf849c8ebf8abeb47c8093beec0299cb9c04d87/img/plus/plus-black.png
--------------------------------------------------------------------------------
/img/plus/profiling.old.png:
--------------------------------------------------------------------------------
https://raw.githubusercontent.com/keymetrics/doc-pm2/8bf849c8ebf8abeb47c8093beec0299cb9c04d87/img/plus/profiling.old.png
--------------------------------------------------------------------------------
/img/plus/remote.old.png:
--------------------------------------------------------------------------------
https://raw.githubusercontent.com/keymetrics/doc-pm2/8bf849c8ebf8abeb47c8093beec0299cb9c04d87/img/plus/remote.old.png
--------------------------------------------------------------------------------
/img/plus/remote.png:
--------------------------------------------------------------------------------
https://raw.githubusercontent.com/keymetrics/doc-pm2/8bf849c8ebf8abeb47c8093beec0299cb9c04d87/img/plus/remote.png
--------------------------------------------------------------------------------
/img/plus/server.png:
--------------------------------------------------------------------------------
https://raw.githubusercontent.com/keymetrics/doc-pm2/8bf849c8ebf8abeb47c8093beec0299cb9c04d87/img/plus/server.png
--------------------------------------------------------------------------------
/img/plus/tracing.old.png:
--------------------------------------------------------------------------------
https://raw.githubusercontent.com/keymetrics/doc-pm2/8bf849c8ebf8abeb47c8093beec0299cb9c04d87/img/plus/tracing.old.png
--------------------------------------------------------------------------------
/img/plus/tracing.png:
--------------------------------------------------------------------------------
https://raw.githubusercontent.com/keymetrics/doc-pm2/8bf849c8ebf8abeb47c8093beec0299cb9c04d87/img/plus/tracing.png
--------------------------------------------------------------------------------
/img/plus/unified.old.png:
--------------------------------------------------------------------------------
https://raw.githubusercontent.com/keymetrics/doc-pm2/8bf849c8ebf8abeb47c8093beec0299cb9c04d87/img/plus/unified.old.png
--------------------------------------------------------------------------------
/img/plus/unified.png:
--------------------------------------------------------------------------------
https://raw.githubusercontent.com/keymetrics/doc-pm2/8bf849c8ebf8abeb47c8093beec0299cb9c04d87/img/plus/unified.png
--------------------------------------------------------------------------------
/img/pm2-white.svg:
--------------------------------------------------------------------------------
1 |
--------------------------------------------------------------------------------
/img/pm2_docs_og.png:
--------------------------------------------------------------------------------
https://raw.githubusercontent.com/keymetrics/doc-pm2/8bf849c8ebf8abeb47c8093beec0299cb9c04d87/img/pm2_docs_og.png
--------------------------------------------------------------------------------
/img/runtime/IAM-add.png:
--------------------------------------------------------------------------------
https://raw.githubusercontent.com/keymetrics/doc-pm2/8bf849c8ebf8abeb47c8093beec0299cb9c04d87/img/runtime/IAM-add.png
--------------------------------------------------------------------------------
/img/runtime/IAM-creds.png:
--------------------------------------------------------------------------------
https://raw.githubusercontent.com/keymetrics/doc-pm2/8bf849c8ebf8abeb47c8093beec0299cb9c04d87/img/runtime/IAM-creds.png
--------------------------------------------------------------------------------
/img/runtime/IAM-prog.png:
--------------------------------------------------------------------------------
https://raw.githubusercontent.com/keymetrics/doc-pm2/8bf849c8ebf8abeb47c8093beec0299cb9c04d87/img/runtime/IAM-prog.png
--------------------------------------------------------------------------------
/img/runtime/IAM-strat.png:
--------------------------------------------------------------------------------
https://raw.githubusercontent.com/keymetrics/doc-pm2/8bf849c8ebf8abeb47c8093beec0299cb9c04d87/img/runtime/IAM-strat.png
--------------------------------------------------------------------------------
/img/runtime/autocomplete.png:
--------------------------------------------------------------------------------
https://raw.githubusercontent.com/keymetrics/doc-pm2/8bf849c8ebf8abeb47c8093beec0299cb9c04d87/img/runtime/autocomplete.png
--------------------------------------------------------------------------------
/img/runtime/cluster-mode.png:
--------------------------------------------------------------------------------
https://raw.githubusercontent.com/keymetrics/doc-pm2/8bf849c8ebf8abeb47c8093beec0299cb9c04d87/img/runtime/cluster-mode.png
--------------------------------------------------------------------------------
/img/runtime/help.png:
--------------------------------------------------------------------------------
https://raw.githubusercontent.com/keymetrics/doc-pm2/8bf849c8ebf8abeb47c8093beec0299cb9c04d87/img/runtime/help.png
--------------------------------------------------------------------------------
/img/runtime/monit.png:
--------------------------------------------------------------------------------
https://raw.githubusercontent.com/keymetrics/doc-pm2/8bf849c8ebf8abeb47c8093beec0299cb9c04d87/img/runtime/monit.png
--------------------------------------------------------------------------------
/img/runtime/pm2ls.png:
--------------------------------------------------------------------------------
https://raw.githubusercontent.com/keymetrics/doc-pm2/8bf849c8ebf8abeb47c8093beec0299cb9c04d87/img/runtime/pm2ls.png
--------------------------------------------------------------------------------
/img/runtime/rect-r.png:
--------------------------------------------------------------------------------
https://raw.githubusercontent.com/keymetrics/doc-pm2/8bf849c8ebf8abeb47c8093beec0299cb9c04d87/img/runtime/rect-r.png
--------------------------------------------------------------------------------
/img/runtime/runtime-black.png:
--------------------------------------------------------------------------------
https://raw.githubusercontent.com/keymetrics/doc-pm2/8bf849c8ebf8abeb47c8093beec0299cb9c04d87/img/runtime/runtime-black.png
--------------------------------------------------------------------------------
/img/sidebar2/pm2_enterprise.svg:
--------------------------------------------------------------------------------
1 |
--------------------------------------------------------------------------------
/img/sidebar2/pm2_monitoring.svg:
--------------------------------------------------------------------------------
1 |
--------------------------------------------------------------------------------
/img/sidebar2/pm2_runtime.svg:
--------------------------------------------------------------------------------
1 |
--------------------------------------------------------------------------------
/img/sidebar2/pm2_white.svg:
--------------------------------------------------------------------------------
1 |
--------------------------------------------------------------------------------
/index.md:
--------------------------------------------------------------------------------
1 | ---
2 | layout: home
3 | title: PM2 Documentation
4 | menu: starter
5 | lang: en
6 | section:
7 | ---
8 |
--------------------------------------------------------------------------------
/js/main.js:
--------------------------------------------------------------------------------
1 | (function() {
2 |
3 | $(document).ready(function(event) {
4 | setAnchors();
5 | setGitalk();
6 | logoTogglesSidebarOnMobile();
7 | });
8 |
9 | function setAnchors() {
10 | var anchorForId = function (id) {
11 | var anchor = document.createElement("a");
12 | anchor.className = "header-link";
13 | anchor.href = "#" + id;
14 | anchor.innerHTML = "link";
15 | return anchor;
16 | };
17 |
18 | var linkifyAnchors = function (level, containingElement) {
19 | var headers = containingElement.getElementsByTagName("h" + level);
20 | for (var h = 0; h < headers.length; h++) {
21 | var header = headers[h];
22 |
23 | $(header).attr('onClick','location.hash="' + header.id + '"');
24 | if (typeof header.id !== "undefined" && header.id !== "") {
25 | header.appendChild(anchorForId(header.id));
26 | }
27 | }
28 | };
29 |
30 | document.onreadystatechange = function () {
31 | if (this.readyState === "complete") {
32 | var contentBlock = document.getElementsByClassName("content")[0];
33 | if (!contentBlock) {
34 | return;
35 | }
36 | for (var level = 2; level <= 6; level++) {
37 | linkifyAnchors(level, contentBlock);
38 | }
39 | }
40 | };
41 | }
42 |
43 | function setGitalk() {
44 | var gitalk = new Gitalk({
45 | clientID: '918c405abac62eacf227',
46 | clientSecret: '7c102fd9965dbe94ce2fb6006ccadcac8f2b9d44',
47 | repo: 'doc-pm2',
48 | owner: 'keymetrics',
49 | admin: ['robin-monnier', 'vmarchaud', 'Unitech'],
50 | language: document.documentElement.lang === 'zh' ? 'zh-CN' : 'en',
51 | id: md5(window.location.pathname),
52 | // facebook-like distraction free mode
53 | distractionFreeMode: false
54 | })
55 |
56 | $(document).ready(function() {
57 | if (document.querySelector('#gitalk')) {
58 | gitalk.render('gitalk');
59 | }
60 | });
61 | }
62 |
63 | function logoTogglesSidebarOnMobile() {
64 | $('.burger-header').click(function() {
65 | $('.sidebar').toggleClass('open')
66 | })
67 | }
68 | })();
69 |
--------------------------------------------------------------------------------
/js/prism-clipboard.js:
--------------------------------------------------------------------------------
1 | // Mostly taken from : https://webdesign.tutsplus.com/tutorials/copy-to-clipboard-made-easy-with-clipboardjs--cms-25086
2 | document.addEventListener('DOMContentLoaded', function() {
3 |
4 | // Get the elements.
5 | // - the 'pre' element.
6 | // - the 'div' with the 'paste-content' id.
7 |
8 | var pre = document.getElementsByTagName('pre');
9 | var pasteContent = document.getElementById('paste-content');
10 |
11 | // Add a copy button in the 'pre' element.
12 | // which only has the className of 'language-'.
13 |
14 |
15 | for (var i = 2; i < pre.length; i++) { // var i = 1, because the first pre element were not code snippet
16 | var isLanguage = pre[i].children[0].className.indexOf('language-');
17 |
18 | if ( isLanguage === 1 ) {
19 | var button = document.createElement('button');
20 | button.className = 'docsify-copy-code-button';
21 | button.textContent = 'Copy';
22 |
23 | pre[i].appendChild(button);
24 |
25 | var codeLang = pre[i].className.match(/[^-]+$/)[0]; //find class in pre element
26 | pre[i].setAttribute("data-lang", codeLang);
27 |
28 | }
29 | };
30 |
31 | // Run Clipboard
32 |
33 | var copyCode = new ClipboardJS('.docsify-copy-code-button', {
34 | target: function(trigger) {
35 | return trigger.previousElementSibling;
36 | }
37 | });
38 |
39 | // On success:
40 | // - Change the "Copy" text to "Copied".
41 | // - Swap it to "Copy" in 2s.
42 |
43 | copyCode.on('success', function(event) {
44 | event.clearSelection();
45 | event.trigger.textContent = 'Copied';
46 | window.setTimeout(function() {
47 | event.trigger.textContent = 'Copy';
48 | }, 2000);
49 | });
50 |
51 | // On error (Safari):
52 | // - Change the "Press Ctrl+C to copy"
53 | // - Swap it to "Copy" in 2s.
54 |
55 | copyCode.on('error', function(event) {
56 | event.trigger.textContent = 'Press "Ctrl + C" to copy';
57 | window.setTimeout(function() {
58 | event.trigger.textContent = 'Copy';
59 | }, 5000);
60 | });
61 |
62 |
63 | });
64 |
--------------------------------------------------------------------------------
/misc/cli-parser.js:
--------------------------------------------------------------------------------
1 | const fs = require('fs')
2 |
3 | // const { exec } = require('child_process')
4 | // const pm2Help = exec('pm2', ['-h'])
5 |
6 | // let stream = fs.createWriteStream('./pm2Help')
7 |
8 | // pm2Help.stdout.on('data', (data) => {
9 | // stream.write(data)
10 | // console.log(data)
11 | // })
12 |
13 | // pm2Help.stderr.on('data', (data) => {
14 | // console.log(`stderr: ${data}`)
15 | // })
16 |
17 | // pm2Help.on('close', (code) => {
18 | // console.log(`child process exited with code ${code}`)
19 | // stream.end()
20 | // })
21 |
22 | const escapeSpecialChar = (str) => {
23 | if (typeof str !== typeof '') { return str }
24 | return str.replace(/\|/g, '|')
25 | .replace(/\/g, '>')
27 | }
28 |
29 | const schema = fs.readFileSync('./pm2Help').toString()
30 | // console.log(schema)
31 | const tab = schema.split('\n')
32 | stream = fs.createWriteStream('./cli.md')
33 |
34 | stream.write('# CLI reference')
35 | stream.write('\n\n### pm2 Flags\n\n')
36 | stream.write('Flag name|Description\n')
37 | stream.write('---|---\n')
38 |
39 | let i = 0;
40 | while (!tab[i].match(/Options/)) {
41 | i++
42 | }
43 | i = i + 2
44 | while (tab[i].length) {
45 | const flag = tab[i].split(/ {2,}/).filter((entry) => { return entry.trim() != '' })
46 | const flagName = escapeSpecialChar(flag[0])
47 | const flagDescription = escapeSpecialChar(flag[1])
48 | stream.write(`${flagName}|${flagDescription}\n`)
49 | i++
50 | }
51 | while (!tab[i].match(/Commands/)) {
52 | i++
53 | }
54 | i = i + 2
55 |
56 | stream.write('\n\n### pm2 Commands\n\n')
57 | stream.write('Command name|Description\n')
58 | stream.write('---|---\n')
59 | while (i < tab.length) {
60 | // console.log(tab[i])
61 | const flag = tab[i].split(/ {2,}/).filter((entry) => { return entry.trim() != '' })
62 | const flagName = escapeSpecialChar(flag[0])
63 | const flagDescription = escapeSpecialChar(flag[1])
64 | stream.write(`${flagName}|${flagDescription}\n`)
65 | i++
66 | }
67 |
68 | stream.end()
--------------------------------------------------------------------------------
/misc/ecosystem-parser.js:
--------------------------------------------------------------------------------
1 | const axios = require('axios')
2 | const fs = require('fs')
3 |
4 | // const schema = axios.get('https://raw.githubusercontent.com/Unitech/pm2/master/lib/API/schema.json')
5 | // .then(res => { return res.data })
6 | const schema = JSON.parse(fs.readFileSync('./schema.json'))
7 |
8 | const escapeVerticalBar = (str) => {
9 | if (typeof str !== typeof '') { return str }
10 | return str.replace(/\|/g, '|')
11 | }
12 |
13 | const stream = fs.createWriteStream('./ecosystem.md')
14 |
15 | stream.write('# Ecosystem file reference\n\n')
16 | stream.write('Entry name|Description|Type|Default\n')
17 | stream.write('---|---|---|---\n')
18 |
19 | for (let key of Object.keys(schema)) {
20 | const description = escapeVerticalBar(schema[key].description)
21 | const type = escapeVerticalBar(schema[key].type)
22 | const defaultValue = escapeVerticalBar(schema[key].default)
23 |
24 | stream.write(`${key}|${description || ''}|${type || ''}|${defaultValue || ''}\n`)
25 | }
26 | stream.end()
27 |
--------------------------------------------------------------------------------
/misc/metrics.js:
--------------------------------------------------------------------------------
1 | const metrics = {
2 | {
3 | id: 1,
4 | displayName: "CPU Usage",
5 | unit: "%",
6 | range: "0 - 100"
7 | shortDesc: "The CPU usage is the amount of time the CPU is busy. A CPU only can handle one operation at a time and so is either busy or idle.",
8 | longDesc: "",
9 | externalDoc: ""
10 | },
11 | {
12 | id: 2,
13 | displayName: "Memory Usage",
14 | unit: "Megabytes (MB)",
15 | range: "0 - total memory of the server",
16 | shortDesc: "The memory usage is the total amount of memory used by the application.",
17 | longDesc: "",
18 | externalDoc: ""
19 | },
20 | {
21 | id: 3,
22 | displayName: "Issues",
23 | shortDesc: "The number of new issues recorded in the app.",
24 | longDesc: "",
25 | externalDoc: ""
26 | },
27 | {
28 | id: 4,
29 | displayName: "Number of restart",
30 | shortDesc: "The number of restart of your application since added to the PM2 process list.",
31 | longDesc: "The number of restart of your application since added to the PM2 process list. PM2 automatically restarts your application whenever needed, for example after an uncaught exception has happened.",
32 | externalDoc: ""
33 | },
34 | {
35 | id: 5,
36 | displayName: "Number of processes",
37 | shortDesc: "The number of cluster on which your app has been spread on the server.",
38 | longDesc: "The number of cluster on which your app has been spread on the server. Only PM2 clusters appear.",
39 | externalDoc: ""
40 | },
41 | {
42 | id: 6,
43 | displayName: "HTTP requests per minute",
44 | unit: "Requests / minute (rpm)",
45 | shortDesc: "The number of requests the app is receiving per minute.",
46 | longDesc: "",
47 | externalDoc: ""
48 | },
49 | {
50 | id: 7,
51 | displayName: "Loop delay",
52 | unit: "Milliseconds (ms)",
53 | shortDesc: "How long it takes for Node.js to complete a full event loop.",
54 | longDesc: "",
55 | externalDoc: ""
56 | },
57 | {
58 | id: 8,
59 | displayName: "Active handles",
60 | shortDesc: "Handles represent long-lived objects capable of performing certain operations while active (a listening server for example).",
61 | longDesc: "Handles represent long-lived objects capable of performing certain operations while active. Some examples: - A prepare handle gets its callback called once every loop iteration when active. - A TCP server handle that gets its connection callback called every time there is a new connection.",
62 | externalDoc: ""
63 | },
64 | {
65 | id: 9,
66 | displayName: "Active requests",
67 | shortDesc: "Requests represent short-lived operations (write requests used to write data on a handle for example).",
68 | longDesc: "Requests represent short-lived operations. These operations can be performed over a handle: write requests are used to write data on a handle; or standalone: getaddrinfo requests don’t need a handle they run directly on the loop.",
69 | externalDoc: ""
70 | },
71 | }
--------------------------------------------------------------------------------
/package.json:
--------------------------------------------------------------------------------
1 | {
2 | "name": "doc-pm2",
3 | "version": "1.0.0",
4 | "description": "1. sudo apt install clang make ruby-dev libffi-dev\r 2. `bundle install`\r 3. `bundle exec jekyll serve`",
5 | "main": "mapping-plus.js",
6 | "directories": {
7 | "doc": "docs"
8 | },
9 | "scripts": {
10 | "test": "echo \"Error: no test specified\" && exit 1",
11 | "dev": "docker run -p 80:4000 -v $(pwd):/site bretfisher/jekyll-serve"
12 | },
13 | "repository": {
14 | "type": "git",
15 | "url": "git+https://github.com/keymetrics/doc-pm2.git"
16 | },
17 | "author": "",
18 | "license": "ISC",
19 | "bugs": {
20 | "url": "https://github.com/keymetrics/doc-pm2/issues"
21 | },
22 | "homepage": "https://github.com/keymetrics/doc-pm2#readme",
23 | "dependencies": {
24 | "gulp-autoprefixer": "^5.0.0",
25 | "gulp-sass": "^4.0.1",
26 | "ins": "0.0.0"
27 | },
28 | "devDependencies": {
29 | "browser-sync": "^2.24.4",
30 | "gulp": "^3.9.1",
31 | "gulp-util": "^3.0.8",
32 | "stylelint-config-standard": "^18.2.0"
33 | }
34 | }
35 |
--------------------------------------------------------------------------------
/static/hamburger-enterprise.png:
--------------------------------------------------------------------------------
https://raw.githubusercontent.com/keymetrics/doc-pm2/8bf849c8ebf8abeb47c8093beec0299cb9c04d87/static/hamburger-enterprise.png
--------------------------------------------------------------------------------
/static/hamburger-monitoring.png:
--------------------------------------------------------------------------------
https://raw.githubusercontent.com/keymetrics/doc-pm2/8bf849c8ebf8abeb47c8093beec0299cb9c04d87/static/hamburger-monitoring.png
--------------------------------------------------------------------------------
/static/hamburger-runtime.png:
--------------------------------------------------------------------------------
https://raw.githubusercontent.com/keymetrics/doc-pm2/8bf849c8ebf8abeb47c8093beec0299cb9c04d87/static/hamburger-runtime.png
--------------------------------------------------------------------------------
/static/pm-2.png:
--------------------------------------------------------------------------------
https://raw.githubusercontent.com/keymetrics/doc-pm2/8bf849c8ebf8abeb47c8093beec0299cb9c04d87/static/pm-2.png
--------------------------------------------------------------------------------
/static/pm-2@2x.png:
--------------------------------------------------------------------------------
https://raw.githubusercontent.com/keymetrics/doc-pm2/8bf849c8ebf8abeb47c8093beec0299cb9c04d87/static/pm-2@2x.png
--------------------------------------------------------------------------------
/static/pm-2@3x.png:
--------------------------------------------------------------------------------
https://raw.githubusercontent.com/keymetrics/doc-pm2/8bf849c8ebf8abeb47c8093beec0299cb9c04d87/static/pm-2@3x.png
--------------------------------------------------------------------------------
/static/pm2-logo-e.png:
--------------------------------------------------------------------------------
https://raw.githubusercontent.com/keymetrics/doc-pm2/8bf849c8ebf8abeb47c8093beec0299cb9c04d87/static/pm2-logo-e.png
--------------------------------------------------------------------------------
/static/pm2-logo-m.png:
--------------------------------------------------------------------------------
https://raw.githubusercontent.com/keymetrics/doc-pm2/8bf849c8ebf8abeb47c8093beec0299cb9c04d87/static/pm2-logo-m.png
--------------------------------------------------------------------------------
/static/pm2-logo-r.png:
--------------------------------------------------------------------------------
https://raw.githubusercontent.com/keymetrics/doc-pm2/8bf849c8ebf8abeb47c8093beec0299cb9c04d87/static/pm2-logo-r.png
--------------------------------------------------------------------------------
/zh/enterprise/overview.md:
--------------------------------------------------------------------------------
1 | ---
2 | layout: page
3 | title: Quick Start with PM2
4 | menu: starter
5 | lang: zh
6 | section: enterprise
7 | ---
8 |
9 |
 18 |
18 |  25 |
25 |  32 |
32 |  13 |
13 |