├── README.md
└── triangle_stacks.html
/README.md:
--------------------------------------------------------------------------------
1 | # Visualizing Sport Results with D3.js
2 |
3 | [](#)
4 |
5 |
6 | This "Stacked Triangle" data visualization gives a recap of a match and shows the order in which teams scored. This works for several sport disciplines when teams or individuals win by scoring goals or points.
7 |
8 | [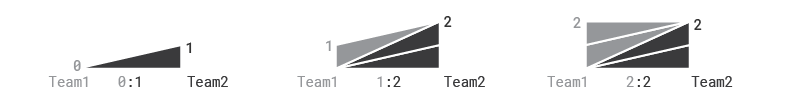](#)
9 |
10 |
11 | ## Getting Started
12 |
13 | To use this visualization, simply open the `triangle_stacks.html` file in a web browser. No web server is required.
14 | The visualization is using [D3.js](https://github.com/d3/d3).
15 |
16 | The `data` array contains the progress of the match in terms of goals scored. You can edit the 3-letter country codes to show different teams.
17 |
18 | ```javascript
19 | const TEAM1 = "BRA";
20 | const TEAM2 = "CRO";
21 |
22 | const data = [
23 | [0,1],
24 | [0,2],
25 | [1,2],
26 | [2,2],
27 | [2,3],
28 | [3,3],
29 | [3,4],
30 | [3,5],
31 | [4,5],
32 | [5,5],
33 | [6,5],
34 | ]
35 |
36 | const colorSet = {
37 | "bg": "#f2eee3",
38 | "team1": "#eb7150",
39 | "team2": "#222"
40 | }
41 | ```
42 |
43 | ## How the Animation Works
44 |
45 | [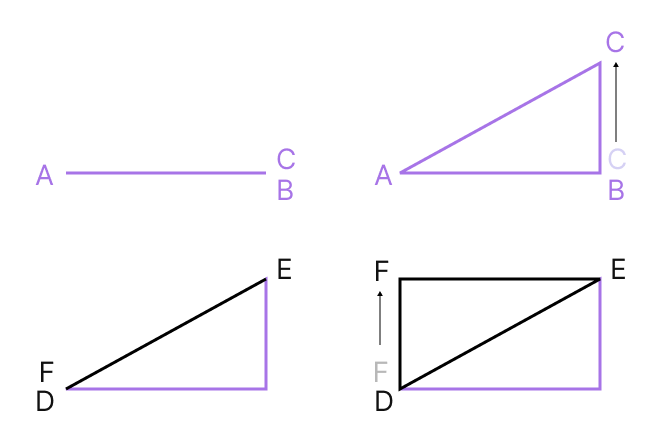](#)
46 |
47 | The animation is built by adding simple triangles on top of one another. The starting shape appears as a simple line, but it is actually a polygon with three points, where point B and C are in the exact same position. With a transition, we move point C upwards to make the triangle appear. When the other team scores a goal, we add a new line created by three points on the edge of the previous triangle, covering the line between points A and C. Then, we move point F up in the same way as we did with point C.
48 |
49 | ```javascript
50 | const triangles = {
51 | team1: {
52 | startPoly: [C1X, c1y, C2X, c2y, C1X, c1y],
53 | finalPoly: [C1X, c1y, C2X, c2y, C1X, COLUMNH - scaleY(d[0])],
54 | score: d[0],
55 | },
56 | team2: {
57 | startPoly: [C1X, c1y, C2X, c2y, C2X, c2y],
58 | finalPoly: [C1X, c1y, C2X, c2y, C2X, COLUMNH - scaleY(d[1])],
59 | score: d[1],
60 | }
61 | };
62 |
63 | changePolygon = function (whichTeamScored) {
64 | vizGroup.append("polygon")
65 | .attr("points", triangles[whichTeamScored].startPoly.join(","))
66 | .transition()
67 | .duration(TRIANIMDURATION)
68 | .attr("points", triangles[whichTeamScored].finalPoly.join(","))
69 | }
70 | ```
71 |
72 | ## Read more about this type of visualization and see examples of it in use
73 |
74 | - An editable variation with gif export is available at [PlotParade](https://plotparade.com/44_giftriangle/)
75 | - [Animated Sport Results](https://krisztinaszucs.com/blog/20220829_gif/)
76 | - [FIFA World Cup 2022](https://krisztinaszucs.com/my-product/FIFA/)
77 |
78 |
79 | ## What's Not Included
80 |
81 | Please note that the following features are not included in this code:
82 |
83 | - GIF Export
84 | - Penalty score visualization
85 | - Gaps for halves, periods, quarters, overtime, etc.
86 | - Visualizing points when two opponents score a point simultaneously (e.g., fencing).
87 |
--------------------------------------------------------------------------------
/triangle_stacks.html:
--------------------------------------------------------------------------------
1 |
2 |
3 |
4 |
5 | Triangles viz
6 |
7 |
8 |
9 |
10 |
11 |
18 |
19 |
20 |
21 |
22 |
23 |
24 |
193 |
194 |