├── 1-Foundations: Data, Data, Everywhere
├── Certificate.md
├── Week1-Introducing Data Analytics.md
├── Week2-All about analytical thinking.md
├── Week3-The wonderful world of data.md
├── Week4-Set up your toolbox.md
└── Week5-Endless career possibilities.md
├── 2-Ask Questions to Make Data-Driven Decisions
├── Certificate.md
├── Week1-Effective questions.md
├── Week2-Data-driven decisions.md
├── Week3-More spreadsheet basics.md
└── Week4-Always remember the stakeholder.md
├── 3-Prepare Data for Exploration
├── Certificate.md
├── Week1-Data types and structures.md
├── Week2-Bias, credibility, privacy, ethics, and access.md
├── Week3-Databases: Where data lives.md
├── Week4-Organizing and protecting your data.md
└── Week5-Optional: Engaging in the data community.md
├── 4-Process Data from Dirty to Clean
├── Certificate.md
├── Week1-The importance of integrity.md
├── Week2-Sparkling-clean data.md
├── Week3-Cleaning data with SQL.md
├── Week4-Verify and report on your cleaning results.md
└── Week5-Optional: Adding data to your resume.md
├── 5-Analyze Data to Answer Questions
└── Week1-Organizing data to begin analysis.md
└── README.md
/1-Foundations: Data, Data, Everywhere/Certificate.md:
--------------------------------------------------------------------------------
1 | 
2 |
3 | ---
4 |
5 | [Verify](https://coursera.org/verify/AZYUG5K9T9QV)
6 |
7 | ---
8 |
--------------------------------------------------------------------------------
/1-Foundations: Data, Data, Everywhere/Week1-Introducing Data Analytics.md:
--------------------------------------------------------------------------------
1 | ### Data
2 | Data is a collection of facts that can be used to draw conclusions, make predictions, and assist in decision-making.
3 |
4 | ### Data Analysis
5 | Data analysis is the collection, transformation, and organization of data in order to draw conclusions, make predictions, and drive informed decision-making.
6 |
7 | The six steps of the data analysis process are([data analysis life cycle](https://github.com/ksgr5566/Google-Data-Analytics/blob/main/1-Foundations:%20Data%2C%20Data%2C%20Everywhere/Week1-Introducing%20Data%20Analytics.md#data-analysis-life-cycle)):
8 | - **Ask** questions and define the problem.
9 | - **Prepare** data by collecting and storing the information.
10 | - **Process** data by cleaning and checking the information. Data cleaning is the process of fixing or removing incorrect, corrupted, incorrectly formatted, duplicate, or incomplete data within a dataset.
11 | - **Analyze** data to find patterns, relationships, and trends.
12 | - **Share** data with your audience.
13 | - **Act** on the data and use the analysis results.
14 |
15 |
16 |
17 | ##### People Analytics
18 | Human resources analytics/Workforce analytics. It is the practice of collecting and analyzing data on the people who make up a company’s workforce in order to gain insights to improve how the company operates.
19 |
20 |
21 |
22 | ---
23 |
24 | Data science, the discipline of making data useful, is an umbrella term that encompasses three disciplines: ***machine learning, statistics, and analytics***.
25 | These are separated by how many decisions you know you want to make before you begin with them.
26 |
27 | If you want to make a few important decisions under uncertainty, that is statistics.
28 | The excellence of statistics is rigor. They are very, very careful about protecting decision-makers from coming to the wrong conclusion.
29 |
30 | If you want to automate, in other words, make many, many, many decisions under uncertainty, that is machine learning and AI.
31 | Performance is the excellence of the machine learning and AI engineer.
32 |
33 | But what if you don't know how many decisions you want to make before you begin? What if what you're looking for is inspiration? You want to encounter your unknown unknowns. You want to understand your world. That is analytics.
34 | The excellence of an analyst is speed. How quickly can you surf through vast amounts of data to explore it and discover the gems, the beautiful potential insights that are worth knowing about and bringing to your decision-makers
35 |
36 | ---
37 |
38 |
39 |
40 | ### Data Ecosystem
41 | An ecosystem is a group of elements that interact with one another.
42 |
43 | Data ecosystems are made up of various elements that interact with one another in order to produce, manage, store, organize, analyze, and share data. These elements include hardware and software tools, and the people who use them.
44 |
45 | For example, you could tap into your retail store's database, which is an ecosystem filled with customer names, addresses, previous purchases, and customer reviews.
46 |
47 |
48 |
49 | ### Data Science
50 | Data science is defined as creating new ways of modeling and understanding the unknown by using raw data.
51 |
52 | Data **scientists** create new questions using data, while **analysts** find answers to existing questions by creating insights from data sources.
53 |
54 |
55 |
56 | ### Data Analytics
57 | Data analytics in the simplest terms is the science of data.
58 |
59 | It's a very broad concept that encompasses everything from the job of managing and using data to the tools and methods that data workers use each and every day.
60 |
61 | Data, data analysis and the data ecosystem, all fit under the data analytics umbrella.
62 |
63 |
64 |
65 | ### Data-driven Decision-making
66 | Using facts to guide business strategy.
67 |
68 | The first step in data-driven decision-making is figuring out the business need.
69 |
70 | Data alone will never be as powerful as data combined with human experience, observation, and sometimes even intuition. To get the most out of data-driven decision-making, it's important to include insights from people who are familiar with the business problem. These people are called **subject matter experts**, and they have the ability to look at the results of data analysis and identify any inconsistencies, make sense of gray areas, and eventually validate choices being made.
71 |
72 |
73 |
74 |
75 | ### Gut Instinct
76 | Gut instinct is an intuitive understanding of something with little or no explanation. This isn’t always something conscious; we often pick up on signals without even realizing. You just have a “feeling” it’s right.
77 |
78 | Blending data with business knowledge, plus maybe a touch of gut instinct, will be a common part of your process as a junior data analyst. The key is figuring out the exact mix for each particular project. A lot of times, it will depend on the goals of your analysis.
79 |
80 | At the heart of data-driven decision-making is data, so analysts are most effective when they ensure that facts are driving strategy.
81 |
82 |
83 |
84 | ### Data Analysis Life Cycle
85 | The process of going from data to decision.
86 |
87 | Data goes through several phases as it gets created, consumed, tested, processed, and reused. With a life cycle model, all key team members can drive success by planning work both up front and at the end of the data analysis process. While the data analysis life cycle is well known among experts, there isn't a single defined structure of those phases. There might not be one single architecture that’s uniformly followed by every data analysis expert, but there are some shared fundamentals in every data analysis process.
88 |
89 |
90 |
91 | ---
92 |
93 | [Glossary](https://docs.google.com/document/d/1yd3IZr2VupqaTPyjrlauxDLj4MsDHl9r9J3wmNf11mE/template/preview)
94 |
95 | ---
96 |
--------------------------------------------------------------------------------
/1-Foundations: Data, Data, Everywhere/Week2-All about analytical thinking.md:
--------------------------------------------------------------------------------
1 | ### Analytical Skills
2 | Analytical skills are qualities and characteristics associated with solving problems using facts.
3 |
4 | Five essential aspects to analytical skills:
5 | 1. Curiosity
6 | - It is all about wanting to learn something.
7 | 2. Understanding context
8 | - Context is the condition in which something exists or happens. This can be a structure or an environment.
9 | - Grouping things into categories.
10 | - Understanding where information fits into the “big picture”.
11 | 3. Having technical mindset
12 | - The ability to break things down into smaller steps or pieces and work with them in an orderly and logical way.
13 | 4. Data design
14 | - Data design is how you organize information.
15 | 5. Data strategy
16 | - Data strategy is the management of the people, processes, and tools used in data analysis.
17 |
18 | Data-driven decision-making involves curiosity, understanding context, having a technical mindset, data design, and data strategy.
19 |
20 |
21 |
22 | ### Analytical Thinking
23 | Analytical thinking involves identifying and defining a problem and then solving it by using data in an organized, step-by-step manner.
24 |
25 | Five key aspects to analytical thinking:
26 | 1. Visualization
27 | - The graphical representation of information.
28 | - To understand and explain information more effectively.
29 | 2. Strategy
30 | - Strategizing helps data analysts see what they want to achieve with the data and how they can get there. Strategy also helps improve the quality and usefulness of the data we collect. By strategizing, we know all our data is valuable and can help us accomplish our goals.
31 | 3. Problem-orientation
32 | - Data analysts use a problem- oriented approach in order to identify, describe, and solve problems. It's all about keeping the problem top of mind throughout the entire project.
33 | 4. Correlation
34 | - Being able to identify a relationship between two or more pieces of data.
35 | - Correlation does not equal causation. In other words, just because two pieces of data are both trending in the same direction, that doesn't necessarily mean they are all related.
36 | 5. Big-picture and detail-oriented thinking.
37 | - Being able to see the big picture as well as the details.
38 | - Detail-oriented thinking is all about figuring out all of the aspects that will help you execute a plan.
39 |
40 |
41 |
42 | ---
43 |
44 | The more ways you can think, the easier it is to think outside the box and come up with fresh ideas.
45 |
46 | You need to think **critically** to find out the right questions to ask.
47 |
48 | You also need to think **creatively** to get new and unexpected answers.
49 |
50 | ---
51 |
52 |
53 |
54 | ### Root cause (What is the root cause of a problem?)
55 | A root cause is the reason why a problem occurs.
56 | If we can identify and get rid of a root cause, we can prevent that problem from happening again.
57 |
58 | #### 5 whys
59 | In the Five Whys you ask "why" five times to reveal the root cause. The fifth and final answer should give you some useful and sometimes surprising insights.
60 |
61 | The Five Whys process is used to reveal a root cause of a problem through the answer to the fifth question.
62 |
63 |
64 |
65 | ### Gap analysis (Where are the gaps in our process?)
66 | Gap analysis is a method for examining and evaluating how a process works currently in order to get where you want to be in the future. Improving accessibility, increasing efficiency, and reducing carbon emissions are examples of improvements that gap analysis can help accomplish.
67 |
68 | The general approach to gap analysis is understanding where you are now compared to where you want to be. Then you can identify the gaps that exist between the current and future state and determine how to bridge them.
69 |
70 |
71 |
72 | ### (What did we not consider before?)
73 | This is a great way to think about what information or procedure might be missing from a process, so you can identify ways to make better decisions and strategies moving forward.
74 |
75 |
76 |
77 | #### Quartile
78 | A quartile divides data points into four equal parts or quarters.
79 |
80 |
81 |
82 | ---
83 |
84 | [Glossary](https://docs.google.com/document/d/1NPfVEPe0X2l3d2v-XIaevT0I5OU5J4EYMGeetijKhAM/template/preview?resourcekey=0-bLCbJQfNZJ70tiFfxT2VXg)
85 |
86 | ---
87 |
--------------------------------------------------------------------------------
/1-Foundations: Data, Data, Everywhere/Week3-The wonderful world of data.md:
--------------------------------------------------------------------------------
1 | ### Data life cycle
2 | The entire period of time that data exists in the system.
3 |
4 | Six stages of data life cycle:
5 | 1. **Plan**: During planning, a business decides what kind of data it needs, how it will be managed throughout its life cycle, who will be responsible for it, and the optimal outcomes.
6 | 2. **Capture**: This is where data is collected from a variety of different sources and brought into the organization.
7 | 3. **Manage**: How we care for our data, how and where it's stored, the tools used to keep it safe and secure, and the actions taken to make sure that it's maintained properly.
8 | 4. **Analyze**: In this phase, the data is used to solve problems, make great decisions, and support business goals. A data analyst might use formulas to perform calculations, create a report from the data, or use spreadsheets to aggregate data.
9 | 5. **Archive**: Keep relevant data stored for long-term and future reference.
10 | 6. **Destroy**: Remove data from storage and delete any shared copies of the data. This is important for protecting a company's private information, as well as private data about its customers.
11 |
12 |
13 | Individual stages in the data life cycle will vary from company to company or by industry or sector. Although data life cycles vary, one data management principle is universal. Govern how data is handled so that it is accurate, secure, and available to meet your organization's needs.
14 |
15 | ---
16 |
17 | #### Stakeholders
18 | They are people who have invested time and resources into a project and are interested in the outcome.
19 |
20 | ---
21 |
22 | 
23 |
24 | ---
25 |
26 | ### Data analyst tools
27 |
28 | #### Spreadsheet
29 | A spreadsheet is a digital worksheet. It stores, organizes, and sorts data. This is important because the usefulness of your data depends on how well it's structured. When you put your data into a spreadsheet, you can see patterns, group information and easily find the information you need. Some popular spreadsheets are ***Microsoft Excel*** and ***Google Sheets***. Spreadsheets also have some really useful features called **formulas** and **functions**.
30 | - A **formula** is a set of instructions that performs a specific calculation using the data in a spreadsheet.
31 | - A **function** is a preset command that automatically performs a specific process or task using the data in a spreadsheet.
32 |
33 | Spreadsheets structure data in a meaningful way by letting you:
34 | - Collect, store, organize, and sort information
35 | - Identify patterns and piece the data together in a way that works for each specific data project
36 | - Create excellent data visualizations, like graphs and charts.
37 |
38 |
39 | #### Query language
40 | A query language is a computer programming language that allows you to retrieve and manipulate data from a database.
41 |
42 | SQL is a language that lets data analysts communicate with a database. A **database** is a collection of data stored in a computer system. With SQL, data analysts can access the data they need by making a query. Some popular Structured Query Language (SQL) programs include ***MySQL***, ***Microsoft SQL Server***, and ***BigQuery***.
43 |
44 | Query languages:
45 | - Allow analysts to isolate specific information from a database(s)
46 | - Make it easier for you to learn and understand the requests made to databases
47 | - Allow analysts to select, create, add, or download data from a database for analysis
48 |
49 |
50 | #### Data visualization
51 | Data visualization is the graphical representation of information. Some examples include graphs, maps, and tables. They help data analysts communicate their insights to others, in an effective and compelling way. Some popular visualization tools are ***Tableau*** and ***Looker***.
52 |
53 | These tools:
54 | - Turn complex numbers into a story that people can understand
55 | - Help stakeholders come up with conclusions that lead to informed decisions and effective business strategies
56 | - Have multiple features:
57 | - Tableau's simple drag-and-drop feature lets users create interactive graphs in dashboards and worksheets.
58 | - Looker communicates directly with a database, allowing you to connect your data right to the visual tool you choose.
59 |
60 |
61 |
62 | A career as a data analyst also involves using programming languages, like R and Python, which are used a lot for statistical analysis, visualization, and other data analysis.
63 |
64 | ---
65 |
66 | 
67 |
68 | ---
69 |
70 | [Glossary](https://docs.google.com/document/d/1HlHJkeCHI2_-dXYhZxacyFpsmFGt49HehhYaZgx-05M/template/preview?resourcekey=0-CX2FbmmO0dgLoD3O0kp1Tw)
71 |
72 | ---
73 |
74 |
75 |
76 | - What is the relationship between the data life cycle and the data analysis process? How are the two processes similar? How are they different?
77 | - The data life cycle involves stages for identifying needs and managing data. Data analysis involves process steps to make meaning from data.
78 | - While the data analysis process will drive your projects and help you reach your business goals, you must understand the life cycle of your data in order to use that process. To analyze your data well, you need to have a thorough understanding of it. Similarly, you can collect all the data you want, but the data is only useful to you if you have a plan for analyzing it.
79 |
80 | - What is the relationship between the Ask phase of the data analysis process and the Plan phase of the data life cycle? How are they similar? How are they different?
81 | - The Plan and Ask phases both involve planning and asking questions, but they tackle different subjects. The Ask phase in the data analysis process focuses on big-picture strategic thinking about business goals. However, the Plan phase focuses on the fundamentals of the project, such as what data you have access to, what data you need, and where you’re going to get it.
82 |
83 |
84 |
--------------------------------------------------------------------------------
/1-Foundations: Data, Data, Everywhere/Week4-Set up your toolbox.md:
--------------------------------------------------------------------------------
1 | ### Spreadsheet basics
2 |
3 | - Each rectangular block is a cell.
4 | - Each cell is meant for one data point.
5 | - Cells are organized by columns and rows.
6 | - Each column has a distinct letter, and each row has a distinct number.
7 | - Each cell has a unique identifier composed of the column letter and row number. This identifier is like the cell’s address.
8 |
9 |
10 |
11 | - Adding labels to the top of the columns will make it easier to reference and find data later on when you're doing analysis. These column labels are usually called attributes. An **attribute** is a characteristic or quality of data used to label a column in a table. More commonly, attributes are referred to as column names, column labels, headers, or the header row.
12 | - In a dataset, a row is also called an observation. An **observation** includes all of the attributes for what is contained in a row of a data table.
13 |
14 |
15 |
16 | A spreadsheet helps you structure data in rows and columns, prepare data for analysis, and create custom data visualizations. The chart editor enables data analysts to choose the type of chart you're making and customize its appearance. To better analyze your data, clean up your chart to make it more visually appealing and to clarify what data means by making your chart more descriptive. To do that, it’s important to add chart titles and axis titles.
17 |
18 |
19 |
20 | [Google Sheets Training and Help](https://support.google.com/a/users/answer/9282959?visit_id=637361702049227170-1815413770&rd=1)
21 |
22 | [Google Sheets Cheat Sheet](https://support.google.com/a/users/answer/9300022)
23 |
24 | [Microsoft Excel for Windows Training](https://support.microsoft.com/en-us/office/excel-video-training-9bc05390-e94c-46af-a5b3-d7c22f6990bb)
25 |
26 | ---
27 |
28 | ### Structured Query Language (SQL)
29 |
30 | Structured Query Language (or SQL, often pronounced “sequel”) enables data analysts to talk to their databases. SQL is one of the most useful data analyst tools, especially when working with large datasets in tables. It can help you investigate huge databases, track down text (referred to as strings) and numbers, and filter for the exact kind of data you need—much faster than a spreadsheet can.
31 |
32 | - A **query** is a request for data or information from a database.
33 | - SQL follows a unique set of guidelines known as syntax. **Syntax** is the predetermined structure of a language that includes all required words, symbols, and punctuation, as well as their proper placement.
34 | - The syntax of every SQL query is the same:
35 | - Use `SELECT` to choose the columns you want to return. A comma to separate fields/variables/parameters.
36 | - Use `FROM` to choose the tables where the columns you want are located. The dataset name is always followed by a dot, and then the table name.
37 | - Use `WHERE` to filter for certain information. WHERE command uses the connectors/operators, such as OR and NOT statements, to connect conditions.
38 | - Example:
39 |
40 | 
41 |
42 |
43 |
44 | - The semicolon is a statement terminator, not all SQL databases have adopted or enforce the semicolon, so it’s possible you may come across some SQL statements that aren’t terminated with a semicolon. If a statement works without a semicolon, it’s fine.
45 | - The WHERE clause narrows your query so that the database returns only the data with an exact value match or the data that matches a certain condition that you want to satisfy. The `LIKE` clause is very powerful because it allows you to tell the database to look for a certain pattern. The percent sign `%` is used as a wildcard to match one or more characters. Note that in some databases an asterisk `*` is used as the wildcard instead of a percent sign `%`.
46 | - If you replace `SELECT field1` with `SELECT *` , you would be selecting all of the columns in the table instead of the field1 column only.
47 | - Comments are text placed between certain characters, `/*` and `*/`, or after two dashes `--`.
48 | - You can also make it easier on yourself by assigning a new name or alias to the column or table names to make them easier to work with. This is done with a SQL `AS` clause.
49 | - `<>` means "does not equal" in SQL.
50 |
51 |
52 |
53 | [W3Schools SQL Tutorial](https://www.w3schools.com/sql/default.asp)
54 |
55 | [SQL Cheat Sheet](https://towardsdatascience.com/sql-cheat-sheet-776f8e3189fa)
56 |
57 | ---
58 |
59 | ### Data Visualization
60 |
61 | Data analysts use data visualizations to explain complex data quickly, reinforce data analysis, and create interesting graphs and charts. Data visualizations can clearly demonstrate patterns and trends, help stakeholders understand complex data more quickly, and illustrate relationships between data points.
62 |
63 | Misc: A line chart is effective for tracking trends over time. A pie chart shows how a whole is broken down into parts.
64 |
65 | Steps to plan a data visualization:
66 | 1. **Explore the data for patterns**
67 | 2. **Plan your visuals**: Refine the data and present the results of your analysis. You will want to create a data visualization that explains your findings quickly and effectively to your target audience.
68 | 3. **Create your visuals**: Now that you have decided what kind of information and insights you want to display, it is time to start creating the actual visualizations. Keep in mind that creating the right visualization for a presentation or to share with stakeholders is a process. It involves trying different visualization formats and making adjustments until you get what you are looking for. In this case, a mix of different visuals will best communicate your findings and turn your analysis into the most compelling story for stakeholders.
69 |
70 | #### Data visualization toolkit
71 | - **Spreadsheets**: Spreadsheets are great for creating simple visualizations like bar graphs and pie charts, and even provide some advanced visualizations like maps, and waterfall and funnel diagrams.
72 | - **Visualization software (Tableau)**: Tableau is a popular data visualization tool that lets you pull data from nearly any system and turn it into compelling visuals or actionable insights. The platform offers built-in visual best practices, which makes analyzing and sharing data fast, easy, and (most importantly) useful. Tableau works well with a wide variety of data and includes an interactive dashboard that lets you and your stakeholders click to explore the data interactively. Start exploring Tableau from the [How-to Video](https://public.tableau.com/en-us/s/resources) resources.
73 | - **Programming language (R with RStudio)**: As with Tableau, you can create dashboard-style data visualizations using RStudio.
74 | Resources: [RStudio](https://www.rstudio.com/), [RStudio Cheatsheets](https://www.rstudio.com/resources/cheatsheets/), [RStudio Visualize Data Primer](https://rstudio.cloud/learn/primers/3).
75 |
76 | ---
77 |
78 | [Glossary](https://docs.google.com/document/d/1EBGVEVKBWj_uuUZaZ1IYaDfyQWeZXzOcwhWLG5A8mqc/template/preview?resourcekey=0-uEYx121Up84n0Abpn1uQnQ)
79 |
80 | ---
81 |
--------------------------------------------------------------------------------
/1-Foundations: Data, Data, Everywhere/Week5-Endless career possibilities.md:
--------------------------------------------------------------------------------
1 | Data analytics helps businesses make better decisions, but getting there is a process. It begins with analyzing a business problem, identifying data about that problem, and then using data analysis to arrive at an answer. Sometimes you get an answer that solves your business problem, but it’s often just as likely that you discover other questions to investigate further.
2 |
3 | Businesses using data analytics have a common theme. They all have issues to explore, questions to answer, or problems to solve.
4 | - An **issue** is a topic or subject to investigate.
5 | - A **question** is designed to discover information.
6 | - A **problem** is an obstacle or complication that needs to be worked out.
7 |
8 | These questions and problems become the foundation for all kinds of business tasks, that you'll help solve as a data analyst. A **business task** is the question or problem data analysis answers for a business. Data analytics helps businesses make better decisions. It all starts with a business task and the question it's trying to answer.
9 |
10 | ---
11 |
12 | Data analysts have an important responsibility: making sure that their analyses are fair (ensuring that analysis does not create or reinforce bias requires using processes and systems that are fair and inclusive to everyone). **Fairness** means ensuring that your analysis doesn't create or reinforce bias. It's important to think about fairness from the moment you start collecting data for a business task to the time you present your conclusions to your stakeholders. Considering inclusive sample populations, social context, and self-reported data enable fairness in data collection.
13 |
14 | #### A case study:
15 | 1. To improve the effectiveness of its teaching staff, the administration of a high school offered the opportunity for all teachers to participate in a workshop. They were not required to attend; instead, the administration encouraged teachers to sign up. Of the 43 teachers on staff, 19 chose to take the workshop.
16 | At the end of the academic year, the administration collected data on teacher performance for all teachers on staff. The data was collected via student survey. In the survey, students were asked to rank each teacher's effectiveness on a scale of 1 (very poor) to 6 (very good).
17 | The administration compared data on teachers who attended the workshop to data on teachers who did not. The comparison revealed that teachers who attended the workshop had an average score of 4.95, while teachers who did not attend had an average score of 4.22. The administration concluded that the workshop was a success.
18 | - This is an example of unfair practice. It is tempting to conclude—as the administration did—that the workshop was a success. However, since the workshop was voluntary and not random, it is not appropriate to infer a causal relationship between attending the workshop and the higher rating.
19 | The workshop might have been effective, but other explanations for the differences in the ratings cannot be ruled out. For example, another explanation could be that the staff volunteering for the workshop were the better, more motivated teachers. This group of teachers would be rated higher whether or not the workshop was effective.
20 | It’s also notable that there is no direct connection between student survey responses and workshop attendance. The data analyst could correct this by asking for the teachers to be selected randomly to participate in the workshop. They could also collect data that measures something more directly related to workshop attendance, such as the success of a technique the teachers learned in that workshop.
21 |
22 | ---
23 |
24 | ### Data analyst roles
25 |
26 | The data analyst role is one of many job titles that contain the word “analyst.”
27 |
28 | To name a few others that sound similar but may not be the same role:
29 | - Business analyst — analyzes data to help businesses improve processes, products, or services
30 | - Data analytics consultant — analyzes the systems and models for using data
31 | - Data engineer — prepares and integrates data from different sources for analytical use
32 | - Data scientist — uses expert skills in technology and social science to find trends through data analysis
33 | - Data specialist — organizes or converts data for use in databases or software systems
34 | - Operations analyst — analyzes data to assess the performance of business operations and workflows
35 |
36 | Data analysts, data scientists, and data specialists sound very similar but focus on different tasks.
37 |
38 | 
39 |
40 | #### Job Specializations
41 |
42 | The role of data specialist(concentrates on in-depth knowledge of databases) is one of many specializations within data analytics. Other specialist roles for data analysts can focus on in-depth knowledge of specific industries.
43 |
44 | Other industry-specific specialist positions that you might come across in your data analyst job search include:
45 | - Marketing analyst — analyzes market conditions to assess the potential sales of products and services
46 | - HR/payroll analyst — analyzes payroll data for inefficiencies and errors
47 | - Financial analyst — analyzes financial status by collecting, monitoring, and reviewing data
48 | - Risk analyst — analyzes financial documents, economic conditions, and client data to help companies determine the level of risk involved in making a particular business decision
49 | - Healthcare analyst — analyzes medical data to improve the business aspect of hospitals and medical facilities
50 |
51 | ---
52 |
53 | [Glossary](https://docs.google.com/document/d/1kpvyM205cp_PmLz0tFOqusO9_wxGL_E0tDQNWwWhons/template/preview)
54 |
55 | ---
56 |
57 |
58 |
--------------------------------------------------------------------------------
/2-Ask Questions to Make Data-Driven Decisions/Certificate.md:
--------------------------------------------------------------------------------
1 | 
2 |
3 | ---
4 |
5 | [Verify](https://coursera.org/verify/X8TKRN6TDAM4)
6 |
7 | ---
8 |
--------------------------------------------------------------------------------
/2-Ask Questions to Make Data-Driven Decisions/Week1-Effective questions.md:
--------------------------------------------------------------------------------
1 |
2 | The six data analysis phases
3 |
4 |
5 | Step1: Ask
6 |
7 |
8 | It’s impossible to solve a problem if you don’t know what it is. These are some things to consider:
9 | - Define the problem you’re trying to solve
10 | - Make sure you fully understand the stakeholder’s expectations
11 | - Focus on the actual problem and avoid any distractions
12 | - Collaborate with stakeholders and keep an open line of communication
13 | - Take a step back and see the whole situation in context
14 |
15 | Questions to ask yourself in this step:
16 | - What are my stakeholders saying their problems are?
17 | - Now that I’ve identified the issues, how can I help the stakeholders resolve their questions?
18 |
19 |
20 |
21 | Step 2: Prepare
22 |
23 |
24 | You will decide what data you need to collect in order to answer your questions and how to organize it so that it is useful.
25 | You might use your business task to decide:
26 | - What metrics to measure
27 | - Locate data in your database
28 | - Create security measures to protect that data
29 |
30 | Questions to ask yourself in this step:
31 | - What do I need to figure out how to solve this problem?
32 | - What research do I need to do?
33 |
34 |
35 |
36 | Step 3: Process
37 |
38 |
39 | Clean data is the best data and you will need to clean up your data to get rid of any possible errors, inaccuracies, or
40 | inconsistencies. This might mean:
41 | - Using spreadsheet functions to find incorrectly entered data
42 | - Using SQL functions to check for extra spaces
43 | - Removing repeated entries
44 | - Checking as much as possible for bias in the data
45 |
46 | Questions to ask yourself in this step:
47 | - What data errors or inaccuracies might get in my way of getting the best possible answer to the problem I am trying to solve?
48 | - How can I clean my data so the information I have is more consistent?
49 |
50 |
51 |
52 | Step 4: Analyze
53 |
54 |
55 | You will want to think analytically about your data. At this stage, you might sort and format your data to make it easier to:
56 | - Perform calculations
57 | - Combine data from multiple sources
58 | - Create tables with your results
59 |
60 | Questions to ask yourself in this step:
61 | - What story is my data telling me?
62 | - How will my data help me solve this problem?
63 | - Who needs my company’s product or service? What type of person is most likely to use it?
64 |
65 |
66 |
67 | Step 5: Share
68 |
69 |
70 | Everyone shares their results differently so be sure to summarize your results with clear and
71 | enticing visuals of your analysis using data viz tools like graphs or dashboards.
72 | This is your chance to show the stakeholders you have solved their problem and how you got there.
73 | Sharing will certainly help your team:
74 | - Make better decisions
75 | - Make more informed decisions
76 | - Lead to stronger outcomes
77 | - Successfully communicate your findings
78 |
79 | Questions to ask yourself in this step:
80 | - How can I make what I present to the stakeholders engaging and easy to understand?
81 | - What would help me understand this if I were the listener?
82 |
83 |
84 |
85 | Step 6: Act
86 |
87 |
88 | Now it’s time to act on your data. You will take everything you have learned from your data analysis and put it to use.
89 | This could mean providing your stakeholders with recommendations based on your findings so they can make
90 | data-driven decisions.
91 |
92 | Questions to ask yourself in this step:
93 | - How can I use the feedback I received during the share phase (step 5) to actually
94 | meet the stakeholder’s needs and expectations?
95 |
96 |
97 |
98 | These six steps can help you to break the data analysis process into smaller, manageable parts, which is called structured thinking . This process involves four basic activities:
99 | - Recognizing the current problem or situation
100 | - Organizing available information
101 | - Revealing gaps and opportunities
102 | - Identifying your options
103 |
104 |
105 |
106 | ---
107 |
108 | Six common types of problems that data analysts work with:
109 | - **Making predictions**: Using data to make an informed decision about how things may be in the future.
110 | - **Categorizing things**: Assigning information to different groups or clusters based on common features.
111 | - **Spotting something unusual**: Identifying data that is different from the norm.
112 | - **Identifying themes**: It takes categorization as a step further by grouping information into broader concepts.
113 | - **Discovering connections**: Finding similar challenges faced by different entities, and then combining data and insights to address them.
114 | - **Finding patterns**: Using historical data to understand what happened in the past and is therefore likely to happen again.
115 |
116 | Note: Categorizing things involves assigning items to categories; identifying themes takes those categories a step further by grouping them into broader themes.
117 |
118 | ---
119 |
120 | Avoid asking:
121 |
122 | - **Leading questions**: questions that only have a particular response. Leading questions direct the respondent to a particular answer, often because they suggest the answer within the question. Example: "These are the best sandwiches ever, aren't they?" This question doesn't really give you the opportunity to share your own opinion, especially if you happen to disagree and didn't enjoy the sandwich very much. This is called a leading question because it's leading you to answer in a certain way.
123 | - **Closed-ended questions**: questions that ask for a one-word or brief response only. Example: "Were you satisfied with the customer trial?" This question is closed-ended. That means it can be answered with a yes or no.
124 | - **Vague questions**: questions that aren’t specific or don’t provide context. Example: "Does the tool work for you?" This question is too vague because there is no context.
125 |
126 |
127 |
128 | The more questions you ask, the more you learn about your data, and the more powerful your insights will be. Asking thorough and specific questions means clarifying details until you get to concrete requirements. With clear requirements and goals, it’s much easier to plan and execute a successful data analysis project and avoid time-consuming problems down the road. Effective questions follow the SMART methodology:
129 |
130 | 
131 |
132 | - **Specific**: Specific questions are simple, significant and focused on a single topic or a few closely related ideas. This helps us collect information that's relevant to what we're investigating. If a question is too general, try to narrow it down by focusing on just one element.
133 | - **Measurable**: Measurable questions can be quantified and assessed.
134 | - **Action-oriented**: Action-oriented questions encourage change. For example, rather than asking, "how can we get customers to recycle our product packaging?" You could ask, "what design features will make our packaging easier to recycle?" This brings you answers you can act on. The questions that are action-oriented are more likely to result in specific answers that can be acted on to lead to change.
135 | - **Relevant**: Relevant questions matter, are important and have significance to the problem you're trying to solve.
136 | - **Time-bound**: Time-bound questions specify the time to be studied. This limits the range of possibilities and enables the data analyst to focus on relevant data.
137 |
138 | There's something else that's very important to keep in mind when crafting questions, fairness. Fairness means ensuring that your questions don't create or reinforce bias. Fairness also means crafting questions that make sense to everyone. It's important for questions to be clear and have a straightforward wording that anyone can easily understand. Unfair questions also can make your job as a data analyst more difficult. They lead to unreliable feedback and missed opportunities to gain some truly valuable insights. A common example of an unfair question is one that makes assumptions. These are questions that assume the answer to the question being asked.
139 |
140 | Questions should be open-ended. This is the best way to get responses that will help you accurately qualify or disqualify potential solutions to your specific problem.
141 |
142 | ---
143 |
144 | [Glossary](https://docs.google.com/document/d/1QX_1-xlHe4Vd2Ods-a2p21XeY5ODBo2KP-L_eOlI-A4/template/preview?resourcekey=0-dSnwNjRO8Ycn5OHib4C3Dw)
145 |
146 | ---
147 |
148 |
149 |
150 |
151 |
152 |
--------------------------------------------------------------------------------
/2-Ask Questions to Make Data-Driven Decisions/Week2-Data-driven decisions.md:
--------------------------------------------------------------------------------
1 | ### Data-inspired decision making
2 | Explores different data sources to find out what they have in common.
3 |
4 | #### Algorithm
5 | An algorithm is a process or set of rules to be followed for a specific task.
6 |
7 | ---
8 |
9 | The goal of all data analysts is to use data to draw accurate conclusions and make good recommendations. That all starts with having complete, correct, and relevant data. It is possible to have solid data and still make the wrong choices. It is up to data analysts to interpret the data accurately. When data is interpreted incorrectly, it can lead to huge losses. When data is used strategically, businesses can transform and grow their revenue. There is a difference between making a decision with incomplete data and making a decision with a small amount of data. Making a decision with incomplete data is dangerous. But sometimes accurate data from a small test can help you make a good decision.
10 |
11 | ---
12 |
13 | There are a lot of different kinds of questions that data might help us answer, and these different questions make different kinds of data.
14 |
15 | ### Quantitative data
16 | Quantitative data is all about the specific and objective measures of numerical facts. This can often be the *what*, *how many*, and *how often* about a problem. In other words, things you can measure, such as a number, quantity or range.
17 |
18 | ### Qualitative data
19 | Qualitative data is a subjective and explanatory measure of a quality or characteristic. Basically, the things that can't be measured with numerical data, like your hair color. Qualitative data is great for helping us answer *why* questions.
20 |
21 | With quantitative data, we can see numbers visualized as charts or graphs. Qualitative data can then give us a more high-level understanding of why the numbers are the way they are. It helps us add context to a problem.
22 |
23 | 
24 |
25 | Data analysts will generally use both types of data in their work. Usually, qualitative data can help analysts better understand their quantitative data by providing a reason or more thorough explanation. In other words, quantitative data generally gives you the what, and qualitative data generally gives you the why.
26 |
27 | ---
28 |
29 | Two data presentation tools:
30 |
31 | ### Reports
32 | A report is a static collection of data given to stakeholders periodically.
33 | Pros:
34 | - Reports are great for giving snapshots of **high level historical data** for an organization.
35 | - They can be designed and sent out periodically, often on a weekly or monthly basis, as organized and easy to reference information. They're **quick to design and easy to use** as long as you continually maintain them.
36 | - Since reports use static data or data that doesn't change once it's been recorded, they reflect data that's already been **cleaned and sorted**.
37 |
38 | Cons:
39 | - Reports need **regular maintenance**.
40 | - They are **less visually appealing**.
41 | - Because they aren't automatic or dynamic (**static**), reports don't show live, evolving data.
42 |
43 | One way spreadsheet data could be visualized in a report:
44 | #### Pivot Table
45 | A data summarization tool that is used in data processing. Pivot tables are used to summarize, sort, re-organize, group, count, total, or average data stored in a database. It allows its users to transform columns into rows and rows into columns.
46 |
47 | ### Dashboard
48 | Monitors live, incoming data. A dashboard is a single point of access for managing a business's information. It allows analysts to pull key information from data in a quick review by visualizing the data in a way that makes findings easy to understand.
49 | Pros:
50 | - **Dynamic, automatic and interactive**: They give your team more access to information being recorded, you can interact through data by playing with filters, and because they're dynamic, they have long-term value.
51 | - **More stakeholder access** and **Low maintenance**: If stakeholders need to continually access information, a dashboard can be more efficient than having to pull reports over and over.
52 |
53 | Cons:
54 | - **Labor-intensive design**: They take a lot of time to design and can actually be less efficient than reports, if they're not used very often.
55 | - **Can be confusing**: If the base table breaks at any point, they need a lot of maintenance to get back up and running again.
56 | - **Potentially uncleaned data**: Dashboards can sometimes overwhelm people with information too. If you aren't used to looking through data on a dashboard, you might get lost in it.
57 |
58 | A dashboard would be useful for monitoring data as it becomes available. You might create a Tableau dashboard with interactive graphs that showcase multiple views of the data.
59 |
60 | 3 most common types of dashboards:
61 | - **Strategic**: focuses on long term goals and strategies at the highest level of metrics
62 | - **Operational**: short-term performance tracking and intermediate goals
63 | - **Analytical**: consists of the datasets and the mathematics used in these sets. hese dashboards contain the details involved in the usage, analysis, and predictions made by data scientists.
64 |
65 | Dashboards identify metrics: Relevant metrics may help analysts assess company performance.
66 |
67 | Dashboards can help companies perform many helpful tasks, such as:
68 | - Track historical and current performance.
69 | - Establish both long-term and/or short-term goals.
70 | - Define key performance indicators or metrics.
71 | - Identify potential issues or points of inefficiency.
72 |
73 | [Designing compelling dashboards](https://d3c33hcgiwev3.cloudfront.net/IfnpXnRlRhi56V50ZVYYow_3a87f3d18e444bdda63014571e0d9ef1_DAC2-Designing-compelling-dashboards.pdf?Expires=1639872000&Signature=jkZQrBDKFAQKg9Cl~uonJ3YgiJYh8QG-y7xKsMSMkaOd-AumFhG~X~PdpihInp-O6Irvn2Q1QtcUQCjTAfCuwOE9tJuhirAroRh3UuWAqliZh7rJgylneeVj1kMvFohDUHLVIxMIeqpH2Jd4sLcvKRxIsIhoZwZYrQScTKBrPLc_&Key-Pair-Id=APKAJLTNE6QMUY6HBC5A)
74 |
75 | ---
76 |
77 | ### Metric
78 | A metric is a single, quantifiable type of data that can be used for measurement. Data starts as a collection of raw facts, until we organize them into individual metrics that represent a single type of data. Metrics can also be combined into formulas that you can plug your numerical data into. Data contains a lot of raw details about the problem we're exploring. But we need the right metrics to get the answers we're looking for.
79 |
80 | Different industries use all kinds of different metrics. But there's one thing they all have in common: they're all trying to meet a specific goal by measuring data.
81 |
82 | Using key performance indicators to measure revenue and using annual profit targets to set and evaluate goals are examples of using metrics.
83 |
84 | ### Metric Goal
85 | A measurable goal set by a company and evaluated using metrics.
86 |
87 | ---
88 |
89 | **Mathematical thinking**: It means looking at a problem and logically breaking it down step-by-step, so you can see the relationship of patterns in your data, and use that to analyze your problem. This kind of thinking can also help you figure out the best tools for analysis because it lets us see the different aspects of a problem and choose the best logical approach.
90 |
91 | ### Small data
92 | These kinds of data tend to be made up of datasets concerned with *specific metrics over a short, well defined period of time*. Small data can be useful for making day-to-day decisions, like deciding to drink more water. But it doesn't have a huge impact on bigger frameworks like business operations.
93 |
94 | Example: The amount of exercise time it takes for a single person to burn a minimum of 400 calories is a problem that requires small data. It contains a specific metric (400 calories) and a short, defined period of time (amount of exercise time).
95 |
96 | ### Big data
97 | Big data has *larger, less specific datasets covering a longer period of time*. They usually have to be broken down to be analyzed. Big data is useful for looking at large- scale questions and problems, and they help companies make *big decisions*.
98 |
99 | 
100 |
101 | Some challenges you might face when working with big data:
102 | - A lot of organizations deal with data overload and way too much unimportant or irrelevant information.
103 | - Important data can be hidden deep down with all of the non-important data, which makes it harder to find and use. This can lead to slower and more inefficient decision-making time frames.
104 | - The data you need isn’t always easily accessible.
105 | - Current technology tools and solutions still struggle to provide measurable and reportable data. This can lead to unfair algorithmic bias.
106 | - There are gaps in many big data business solutions.
107 |
108 | Some benefits that come with big data:
109 | - When large amounts of data can be stored and analyzed, it can help companies identify more efficient ways of doing business and save a lot of time and money.
110 | - Big data helps organizations spot the trends of customer buying patterns and satisfaction levels, which can help them create new products and solutions that will make customers happy.
111 | - By analyzing big data, businesses get a much better understanding of current market conditions, which can help them stay ahead of the competition.
112 | - Big data helps companies keep track of their online presence—especially feedback, both good and bad, from customers. This gives them the information they need to improve and protect their brand.
113 |
114 | #### V words for big data
115 | - **Volume** describes the amount of data.
116 | - **Variety** describes the different kinds of data.
117 | - **Velocity** describes how fast the data can be processed.
118 | - **Veracity** refers to the quality and reliability of the data.
119 |
120 | These are all important considerations related to processing huge, complex data sets.
121 |
122 | ---
123 |
124 | [Glossary](https://docs.google.com/document/d/1jjYX7LtWJxWC9qbI9pKHpoVqqlD0YuILDpyYENwYGvI/template/preview)
125 |
126 | ---
127 |
128 |
129 |
130 |
--------------------------------------------------------------------------------
/2-Ask Questions to Make Data-Driven Decisions/Week3-More spreadsheet basics.md:
--------------------------------------------------------------------------------
1 | ### Spreadsheet tasks
2 | - Organize your data
3 | - Pivot tables
4 | - Sort and filter
5 | - Calculate your data
6 | - Formulas
7 | - Functions
8 |
9 |
10 | Spreadsheets and the data life cycle
11 |
12 | - Plan for the users who will work within a spreadsheet by developing organizational standards. This can mean formatting your cells, the headings you choose to highlight, the color scheme, and the way you order your data points. When you take the time to set these standards, you will improve communication, ensure consistency, and help people be more efficient with their time.
13 | - Capture data by the source by connecting spreadsheets to other data sources, such as an online survey application or a database. This data will automatically be updated in the spreadsheet. That way, the information is always as current and accurate as possible.
14 | - Manage different kinds of data with a spreadsheet. This can involve storing, organizing, filtering, and updating information. Spreadsheets also let you decide who can access the data, how the information is shared, and how to keep your data safe and secure.
15 | - Analyze data in a spreadsheet to help make better decisions. Some of the most common spreadsheet analysis tools include formulas to aggregate data or create reports, and pivot tables for clear, easy-to-understand visuals.
16 | - Archive any spreadsheet that you don’t use often, but might need to reference later with built-in tools. This is especially useful if you want to store historical data before it gets updated.
17 | - Destroy your spreadsheet when you are certain that you will never need it again, if you have better backup copies, or for legal or security reasons. Keep in mind, lots of businesses are required to follow certain rules or have measures in place to make sure data is destroyed properly.
18 |
19 |
20 |
21 | [Google Sheets shortcuts](https://support.google.com/docs/answer/181110), [Microsoft Excel shortcuts](https://support.microsoft.com/en-us/office/keyboard-shortcuts-in-excel-1798d9d5-842a-42b8-9c99-9b7213f0040f)
22 |
23 |
24 | Useful links
25 |
30 |
31 |
32 | ---
33 |
34 | ### Formulas
35 | A formula is a set of instructions that perform a specific calculation. Formulas are built on operators which are symbols that name that type of operation or calculation to be performed.
36 |
37 | #### Cell reference
38 | A cell reference is a single cell or range of cells in a worksheet that can be used in a formula. Cell references contain the letter of the column and the number of the row where the data is. A range of cells is a collection of two or more cells. A range can include cells from the same row or column, or from different columns and rows collected together. The great thing about using cell references is that they also automatically update when a formula is copied to a new cell.
39 |
40 |
41 | Auto-filling
42 | The lower-right corner of each cell has a fill handle. It is a small green square in Microsoft Excel and a small blue square in Google Sheets.
43 |
44 | - Click the fill handle for a cell and drag it down a column to auto-fill other cells in the column with the same value or formula in that cell.
45 | - Click the fill handle for a cell and drag it across a row to auto-fill other cells in the row with the same value or formula in that cell.
46 | - If you want to create a numbered sequence in a column or row, do the following: 1) Fill in the first two numbers of the sequence in two adjacent cells, 2) Select to highlight the cells, and 3) Drag the fill handle to the last cell to complete the sequence of numbers. For example, to insert 1 through 100 in each row of column A, enter 1 in cell A1 and 2 in cell A2. Then, select to highlight both cells, click the fill handle in cell A2, and drag it down to cell A100. This auto-fills the numbers sequentially so you don't have to type them in each cell.
47 |
48 |
49 |
50 |
51 | Absolute referencing
52 |
53 | - Absolute referencing is marked by a dollar sign ($). For example, =$A$10 has absolute referencing for both the column and the row value
54 | - Relative references (which is what you normally do e.g. “=A10”) will change anytime the formula is copied and pasted. They are in relation to where the referenced cell is located. For example if you copied “=A10” to the cell to the right it would become “=B10”. With absolute referencing “=$A$10” copied to the cell to the right would remain “=$A$10”. But if you copied $A10 to the cell below, it would change to $A11 because the row value isn't an absolute reference.
55 | - Absolute references will not change when you copy and paste the formula in a different cell. The cell being referenced is always the same.
56 | - To easily switch between absolute and relative referencing in the formula bar, highlight the reference you want to change and press the F4 key; for example, if you want to change the absolute reference, $A$10, in your formula to a relative reference, A10, highlight $A$10 in the formula bar and then press the F4 key to make the change.
57 |
58 |
59 |
60 |
61 | Data range
62 | The set of cells a data analyst selects to include in a formula is called the data range.
63 |
64 | - When you click into your formula, the colored ranges let you see which cells are being used in your spreadsheet. There are different colors for each unique range in your formula.
65 | - In a lot of spreadsheet applications, you can press the F2 (or Enter) key to highlight the range of data in the spreadsheet that is referenced in a formula. Click the cell with the formula, and then press the F2 (or Enter) key to highlight the data in your spreadsheet.
66 |
67 |
68 |
69 |
70 | Combining with functions
71 | - COUNTIF() is a formula and a function. This means the function runs based on criteria set by the formula. In this case, COUNT is the formula; it will be executed IF the conditions you create are true. For example, you could use =COUNTIF(A1:A16, “7”) to count only the cells that contained the number 7. Combining formulas and functions allows you to do more work with a single command.
72 |
73 |
74 | [**Spreadsheet errors and fixes**](https://d3c33hcgiwev3.cloudfront.net/fDHAQD8OQX6xwEA_DsF-tw_299c2bf89be04d0bae30bf763b606af1_DAC2-Spreadsheet-Errors-and-Fixes.pdf?Expires=1639958400&Signature=khlJhAOS7CarbwgvV-AGUp5XyXkMXYy5ssfw0te3fL7kR68rBLSv-1bafnENkYmL8F2cBpwz6fvGTkfifiI8pkkxlyi58m8PLWZXLpkAYP8zmwUbajS4LWLSJ-1wIzrRIGm6rGsKeBKDGN~QiZeuei2UlXpTt4~A5viTEuJIMzM_&Key-Pair-Id=APKAJLTNE6QMUY6HBC5A)
75 |
76 | ---
77 |
78 | ### Functions
79 | A function is a preset command that automatically performs a specific process or task using the data.
80 |
81 | **Difference between formulas and functions**
82 | - A formula is a set of instructions used to perform a calculation using the data in a spreadsheet.
83 | - A function is a preset command that automatically performs a specific process or task using the data in a spreadsheet.
84 |
85 |
86 | Relative, absolute, and mixed references
87 |
88 | - Relative references (cells referenced without a dollar sign, like A2) will change when you copy and paste the function into a different cell. With relative references, the location of the cell that contains the function determines the cells used by the function.
89 | - Absolute references (cells fully referenced with a dollar sign, like $A$2) will not change when you copy and paste the function into a different cell. With absolute references, the cells referenced always remain the same.
90 | - Mixed references (cells partially referenced with a dollar sign, like $A2 or A$2) will change when you copy and paste the function into a different cell. With mixed references, the location of the cell that contains the function determines the cells used by the function, but only the row or column is relative (not both).
91 | - In spreadsheets, you can press the F4 key to toggle between relative, absolute, and mixed references in a function. Click the cell containing the function, highlight the referenced cells in the formula bar, and then press F4 to toggle between and select relative, absolute, or mixed referencing.
92 |
93 |
94 |
95 | [DAC2 Keyboard functions 1](https://d3c33hcgiwev3.cloudfront.net/UbHnj9LnRlGx54_S5yZRJA_64a50a70b938476c852b172e826e9af1_DAC2-Keyboard-functions-1.pdf?Expires=1639958400&Signature=A2lNbKBH4jhT7PyaLm5SiV73QbYwRaY0s3e7EqwSRSE8hdxQAJKOdLY9zed3f2JMtAExTbPZtaPt2i8xRAqbDakzYJ6OwMp4sfsgE8tcThQ~M84UL~EZd8rqrtoVp1GQXfc66n5Pqo1gY9KPGv0WpX030AEHZHyyCDtBtst-bhE_&Key-Pair-Id=APKAJLTNE6QMUY6HBC5A), [DAC2 Keyboard functions 2](https://d3c33hcgiwev3.cloudfront.net/9gsOZ_tGTtOLDmf7Rh7T1Q_8a825edae2a94e5e81d880681270acf1_DAC2-Keyboard-functions-2.pdf?Expires=1639958400&Signature=VJUZw6DnuoBIGeqdafuH1OtvsD~g99yDHMWTHDl-rR2PWf9W14kcH9VJ1ktkfeVGkiSFX8TIfWCGHTCyDPtFPXOodtRrATIwzU1~FWunUxkKHZVXwmWdYHDYbNuED10hOXtBSVKAQoYISmWoyZHbM5Jlb0qUnGgHBH7VxUV8mw8_&Key-Pair-Id=APKAJLTNE6QMUY6HBC5A).
96 |
97 | ---
98 |
99 | ### Problem domain
100 | The specific area of analysis that encompasses every activity affecting or affected by the problem.
101 |
102 | Carefully defining a business problem can ultimately save time, money, and resources. All of this is achieved through structured thinking.
103 |
104 | ### Structured thinking
105 | The process of recognizing the current problem or situation, organizing available information, revealing gaps and opportunities, and identifying the options.
106 |
107 | The starting place for structured thinking is the problem domain. Once you know the specific area of analysis, you can set your base and lay out all your requirements and hypotheses before you start investigating.
108 |
109 | You can practice structured thinking and avoid mistakes is by using a scope of work.
110 |
111 | ### Scope of work (SOW)
112 | An agreed- upon outline of the work you're going to perform on a project. A scope of work is project-based and sets the expectations and boundaries of a project. A scope of work keeps everyone on the same page. Using structured thinking, you can define what is being delivered, when, and how you will measure success along the way.
113 |
114 | There’s no standard format for an SOW. They may differ significantly from one organization to another, or from project to project. However, they all have a few foundational pieces of content in common:
115 | - **Deliverables** are items or tasks you will complete before you can finish the project.
What work is being done, and what things are being created as a result of this project? When the project is complete, what are you expected to deliver to the stakeholders? Be specific here. Will you collect data for this project? How much, or for how long?
116 | - **Timelines** include due dates for when deliverables, milestones, and/or reports are due.
The timeline is a way of mapping expectations for how long each step of the process should take. The timeline should be specific enough to help all involved decide if a project is on schedule. When will the deliverables be completed? How long do you expect the project will take to complete? If all goes as planned, how long do you expect each component of the project will take? When can we expect to reach each milestone?
117 | - **Milestones** are significant tasks you will confirm along your timeline to help everyone know the project is on track.
This is closely related to your timeline. What are the major milestones for progress in your project? How do you know when a given part of the project is considered complete?
118 | - **Reports** notify everyone as you finalize deliverables and meet milestones.
Good SOWs also set boundaries for how and when you’ll give status updates to stakeholders. How will you communicate progress with stakeholders and sponsors, and how often? Will progress be reported weekly? Monthly? When milestones are completed? What information will status reports contain?
119 |
120 | 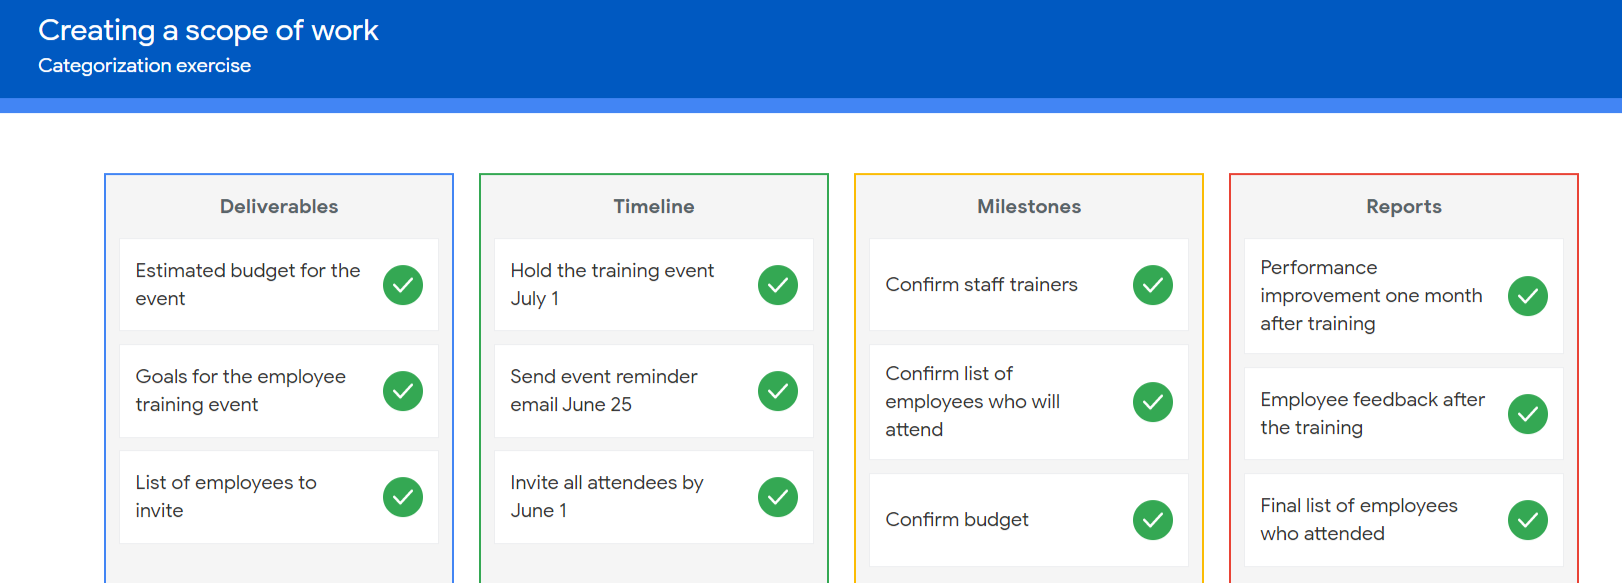
121 |
122 | [Data Analysis Project Scope-of-Work (SOW) Strong Example](https://docs.google.com/document/d/16x-E04Nr48Ww1Nlxwa0PNOXyaytKbVCxrF5yRJy6Y70/template/preview?resourcekey=0-X1a531fuUVbtlNKdIA11dQ)
123 |
124 |
125 |
126 | Usually, projects don’t start until an SOW is approved with its key pieces of content: the deliverables, milestones, timeline, and reports. To collect and synthesize this information, analysts identify and formalize quantifiable project requirements. They use structured thinking to ask clarifying questions, define what to accomplish, and specify project boundaries.
127 |
128 | ### Context
129 | The condition in which something exists or happens. To avoid bias when collecting data, a data analyst should keep context in mind. Context can turn raw data into meaningful information. It is very important for data analysts to contextualize their data. This means giving the data perspective by defining it. To do this, you need to identify:
130 | - **Who**: The person or organization that created, collected, and/or funded the data collection
131 | - **What**: The things in the world that data could have an impact on
132 | - **Where**: The origin of the data
133 | - **When**: The time when the data was created or collected
134 | - **Why**: The motivation behind the creation or collection
135 | - **How**: The method used to create or collect it
136 |
137 | To ensure your data is accurate and fair, make sure you start with an accurate representation of the population in the sample; collect the data in an objective way; and ask questions about the data.
138 |
139 | ---
140 |
141 | [Glossary](https://docs.google.com/document/d/1v1_vAc7R81IK2JL4QTIbkUdHVYXnIvithZ_gC_k--jw/template/preview)
142 |
143 | ---
144 |
--------------------------------------------------------------------------------
/2-Ask Questions to Make Data-Driven Decisions/Week4-Always remember the stakeholder.md:
--------------------------------------------------------------------------------
1 | Focusing on stakeholder expectations will help you understand the goal of a project, communicate more effectively across your team, and build trust in your work.
2 |
3 | [Working with stakeholders](https://drive.google.com/file/d/1NcYRIaCtWyOMnUYFTV1-TVxemxL_rHJg/view?usp=sharing)
4 |
5 | By asking yourself a few simple questions at the beginning of each task, you can ensure that you're able to stay focused on your objective while still balancing stakeholder needs.
6 | You could be working on multiple projects with lots of different people but no matter what project you're working on, there are three things you can focus on that will help you stay on task.
7 | 1. Who are the primary and secondary stakeholders?
8 | 2. Who is managing the data?
9 | 3. Where can you go for help?
10 |
11 | ---
12 |
13 | - There are four key questions data analysts ask themselves to communicate clearly with stakeholders and team members
14 | 1. Who your audience is
15 | 2. What they already know
16 | 3. What they need to know
17 | 4. How you can communicate that effectively to them
18 |
19 | You'll want your emails to be just as professional as your in-person communications.
20 |
21 | - It's important to set realistic expectations at every stage of the project. Setting expectations for a realistic timeline might involve sharing a high-level schedule with stakeholders, creating a schedule, and communicating clearly with team members.
22 |
23 | - In the data world, speed can sometimes be the enemy of accuracy, especially when collaboration is required.
24 |
25 | - A data analyst reframes a question. Then, they outline the problem, challenges, potential solutions, and timeframe in order to put data into context, balance speed with accuracy, and keep stakeholders informed. (To ensure their work answers the right questions and delivers useful results, the data analyst should set clear expectations, outline the problem, and reframe the question)
26 |
27 | - Focusing on stakeholder expectations enables data analysts to understand project goals, improve communication, and build trust.
28 |
29 | - Asking questions including, “Does my analysis answer the original question?” and “Are there other angles I haven’t considered?” enable data analysts to consider the best ways to share data with others, help their team make informed decisions, and use data to get to a solid conclusion.
30 |
31 | - Data analysts pay attention to sample size in order to represent a diverse set of perspectives and avoid skewed results or inaccurate judgements.
32 |
33 | ---
34 |
35 | - When leading a meeting, testing out technology, taking notes and preparing supporting materials will help you ensure all participants have a positive experience.
36 |
37 | **Before the meeting**
38 | - If you are organizing the meeting, you will probably talk about the data. Before the meeting:
39 | - Identify your objective. Establish the purpose, goals, and desired outcomes of the meeting, including any questions or requests that need to be addressed.
40 | - Acknowledge participants and keep them involved with different points of view and experiences with the data, the project, or the business.
41 | - Organize the data to be presented. You might need to turn raw data into accessible formats or create data visualizations.
42 | - Prepare and distribute an agenda. We will go over this next.
43 |
44 | **Crafting a compelling agenda**
45 |
46 | A solid meeting agenda sets your meeting up for success. Here are the basic parts your agenda should include:
47 | - Meeting start and end time
48 | - Meeting location (including information to participate remotely, if that option is available)
49 | - Objectives
50 | - Background material or data the participants should review beforehand
51 |
52 | Sharing your agenda ahead of time
53 |
54 | **During the meeting**
55 |
56 | As the leader of the meeting, it's your job to guide the data discussion. With everyone well informed of the meeting plan and goals, you can follow these steps to avoid any distractions:
57 | - Make introductions (if necessary) and review key messages
58 | - Present the data
59 | - Discuss observations, interpretations, and implications of the data
60 | - Take notes during the meeting
61 | - Determine and summarize next steps for the group
62 |
63 | **After the meeting**
64 | - Distribute any notes or data
65 | - Confirm next steps and timeline for additional actions
66 | - Ask for feedback (this is an effective way to figure out if you missed anything in your recap)
67 |
68 |
69 |
70 | To shift a situation from problematic to productive, data analysts can reframe a problem and start a constructive conversation. This will give everyone the chance to share their viewpoints in a productive manner which leads to a more successful project.
71 |
72 | ---
73 |
74 | [Glossary](https://docs.google.com/document/d/1oZFmNXd3aXtTrfKULLEtCaRKlKEAMscFfqU2syf1bsw/template/preview)
75 |
76 | ---
77 |
--------------------------------------------------------------------------------
/3-Prepare Data for Exploration/Certificate.md:
--------------------------------------------------------------------------------
1 | 
2 |
3 | ---
4 |
5 | [Verify](http://coursera.org/verify/GMDUXF5KKMH3)
6 |
7 | ---
8 |
--------------------------------------------------------------------------------
/3-Prepare Data for Exploration/Week1-Data types and structures.md:
--------------------------------------------------------------------------------
1 | ### How data is collected
2 | - Interviews, Observations(most often used by scientists), Forms, Questionnaires, Surveys, Cookies.
3 |
4 | ### Data collection considerations
5 | - How the data will be collected
6 | - Decide if you will collect the data using your own resources or receive (and possibly purchase it) from another party.
7 | - Choose the data sources
8 | - **First-party data**: Data collected by an individual or group using their own resources. Collecting first-party data is typically the preferred method because you know exactly where it came from.
9 | - **Second-party data**: Data collected by a group directly from its audience and then sold.
10 | - **Third-party data**: Data collected from outside sources who did not collect it directly. This data might have come from a number of different sources before you investigated it. It might not be as reliable, but that doesn't mean it can't be useful.
11 |
12 | No matter what kind of data you use, it needs to be inspected for accuracy, bias, and credibility.
13 | - Decide what data to use
14 | - Choosing the data that can help you find answers and solve problems and not getting distracted by other data.
15 | - How much data to collect
16 | - A **population** refers to all possible data values in a certain data set.
17 | - In instances when collecting data from an entire population is challenging, data analysts may choose to use a sample. A **sample** is a part of a population that is representative of that population.
18 | - Select the right data type
19 | - Determine the time frame
20 | - If you are collecting your own data, decide how long you will need to collect it, especially if you are tracking trends over a long period of time. If you need an immediate answer, you might not have time to collect new data. In this case, you would need to use historical data that already exists.
21 |
22 | ---
23 |
24 |
25 | Data formats
26 |
27 | Primary | Secondary
28 | ------- | ---------
29 | Collected by a researcher from first-hand sources | Gathered by other people or from other research
30 | Examples: - Data from an interview you conducted
- Data from a survey returned from 20 participants
- Data from questionnaires you got back from a group of workers
| Examples: - Data you bought from a local data analytics firm’s customer profiles
- Demographic data collected by a university
- Census data gathered by the federal government
31 |
32 | Internal | External
33 | -------- | --------
34 | Data that lives inside a company’s own systems. Internal data is usually more reliable and easier to collect | Data that lives outside of a company or organization. It is structured.
35 | Examples: - Wages of employees across different business units tracked by HR
- Sales data by store location
- Product inventory levels across distribution centers
| Examples: - National average wages for the various positions throughout your organization
- Credit reports for customers of an auto dealership
36 |
37 | Continuous | Discrete
38 | ---------- | --------
39 | Data that is measured and can have almost any numeric value | Data that is counted and has a limited number of values
40 | Examples: - Height of kids in third grade classes (52.5 inches, 65.7 inches)
- Runtime markers in a video
- Temperature
| Examples: - Number of people who visit a hospital on a daily basis (10, 20, 200)
- Room’s maximum capacity allowed
- Tickets sold in the current month
41 |
42 | Qualitative | Quantitative
43 | ----------- | ------------
44 | Subjective and explanatory measures of qualities and characteristics | Specific and objective measures of numerical facts
45 | Examples: - Exercise activity most enjoyed
- Favorite brands of most loyal customers
- Fashion preferences of young adults
| Examples: - Percentage of board certified doctors who are women
- Population of elephants in Africa
- Distance from Earth to Mars
46 |
47 | Nominal | Ordinal
48 | ------- | -------
49 | A type of qualitative data that isn’t categorized with a set order | A type of qualitative data with a set order or scale
50 | Examples: - First time customer, returning customer, regular customer
- New job applicant, existing applicant, internal applicant
- New listing, reduced price listing, foreclosure
| Examples: - Movie ratings (number of stars: 1 star, 2 stars, 3 stars)
- Ranked-choice voting selections (1st, 2nd, 3rd)
- Income level (low income, middle income, high income)
51 |
52 | Structured | Unstructured
53 | ---------- | ------------
54 | Data organized in a certain format, like rows and columns | Data that isn’t organized in any easily identifiable manner
55 | Examples: - Expense reports
- Tax returns
- Store inventory
| Examples: - Social media posts
- Emails
- Videos
56 |
57 | 
58 |
59 |
60 |
61 | ### Data modeling
62 |
63 | Data modeling is the process of creating diagrams that visually represent how data is organized and structured. These visual representations are called data models. You can think of data modeling as a blueprint of a house. At any point, there might be electricians, carpenters, and plumbers using that blueprint. Each one of these builders has a different relationship to the blueprint, but they all need it to understand the overall structure of the house. Data models are similar; different users might have different data needs, but the data model gives them an understanding of the structure as a whole.
64 |
65 | Data model is a model that is used for organizing data elements and how they relate to one another. **Data elements** are pieces of information, such as people's names, account numbers, and addresses. Data models help to keep data consistent and provide a map of how data is organized. This makes it easier for analysts and other stakeholders to make sense of their data and use it for business purposes.
66 |
67 |
68 | Each level of data modeling has a different level of detail.
69 | - Conceptual data modeling gives a high-level view of the data structure, such as how data interacts across an organization. For example, a conceptual data model may be used to define the business requirements for a new database. A conceptual data model doesn't contain technical details.
70 |
71 | - Logical data modeling focuses on the technical details of a database such as relationships, attributes, and entities. For example, a logical data model defines how individual records are uniquely identified in a database. But it doesn't spell out actual names of database tables. That's the job of a physical data model.
72 |
73 | - Physical data modeling depicts how a database operates. A physical data model defines all entities and attributes used; for example, it includes table names, column names, and data types for the database.
74 |
75 |
76 | Data-modeling techniques
There are a lot of approaches when it comes to developing data models, but two common methods are the Entity Relationship Diagram (ERD) and the Unified Modeling Language (UML) diagram. ERDs are a visual way to understand the relationship between entities in the data model. UML diagrams are very detailed diagrams that describe the structure of a system by showing the system's entities, attributes, operations, and their relationships. As a junior data analyst, you will need to understand that there are different data modeling techniques, but in practice, you will probably be using your organization’s existing technique.
77 |
78 | Data modeling can help you explore the high-level details of your data and how it is related across the organization’s information systems. Data modeling sometimes requires data analysis to understand how the data is put together; that way, you know how to map the data. And finally, data models make it easier for everyone in your organization to understand and collaborate with you on your data.
79 |
80 | Data modeling keeps data consistent, provides a map of how data is organized, and makes data easier to understand. Data modeling is the process of creating a model that is used for organizing data elements and how they relate to one another.
81 |
82 | ---
83 |
84 | ### Data type
85 | A specific kind of data attribute that tells what kind of value the data is.
Data types can be different depending on the query language you're using. For example, SQL allows for different data types depending on which database you're using.
86 |
87 | Data types in spreadsheets: Number, Text or String, and Boolean.
88 |
89 |
90 |
91 | A data table, or tabular data, has a very simple structure. It's arranged in rows and columns. You can call the rows **records** and the columns **fields**. They basically mean the same thing, but records and fields can be used for any kind of data table, while rows and columns are usually reserved for spreadsheets. Sometimes a **field** can also refer to a single piece of data, like the value in a cell.
92 |
93 | ### Wide data
94 | Data in which every data subject has a single row with multiple columns to hold the values of various attributes of the subject. Wide data lets you easily identify and quickly compare different columns. Wide data is preferred when:
95 | - Creating tables and charts with a few variables about each subject.
96 | - Comparing straightforward line graphs.
97 |
98 | ### Long data
99 | Data in which each row is one time point per subject, so each subject will have data in multiple rows. Long data is a great format for storing and organizing data when there's multiple variables for each subject at each time point that we want to observe. Long data is preferred when:
100 | - Storing a lot of variables about each subject. For example, 60 years worth of interest rates for each bank.
101 | - Performing advanced statistical analysis or graphing.
102 |
103 | ### Data transformation
104 | Data transformation is the process of changing the data’s format, structure, or values.
105 | Data transformation usually involves:
106 | - Adding, copying, or replicating data
107 | - Deleting fields or records
108 | - Standardizing the names of variables
109 | - Renaming, moving, or combining columns in a database
110 | - Joining one set of data with another
111 | - Saving a file in a different format. For example, saving a spreadsheet as a comma separated values (CSV) file
112 | Some aspects of data ethics
23 | - Ownership: Individuals who own the raw data they provide, and they have primary control over its usage, how it's processed and how it's shared.
24 | - Transaction transaparency: All data processing activities and algorithms should be completely explainable and understood by the individual who provides their data.
25 | - Consent: An individual's right to know explicit details about how and why their data will be used before agreeing to provide it.
26 | - Currency: Individuals should be aware of financial transactions resulting from the use of their personal data and the scale of these transactions.
27 | - Privacy: Preserving a data subject's information and activity any time a data transaction occurs. This is sometimes called information privacy or data protection.
- Protection from unauthorized access to our private data
28 | - Freedom from inappropriate use of our data
29 | - The right to inspect, update, or correct our data
30 | - Ability to give consent to use our data
31 | - Legal right to access our data
32 | - Openness: Free access, usage, and sharing of data.
33 |
**De-identification** is a process used to wipe data clean of all personally identifying information.
37 |
38 | ---
39 |
40 | For data to be considered open, it has to meet all three of these standards:
41 | - Availability and access: Open data must be available as a whole, preferably by downloading over the Internet in a convenient and modifiable form.
42 | - Reuse and redistribution: Open data must be provided under terms that allow reuse and redistribution including the ability to use it with other datasets.
43 | - Universal participation: Everyone must be able to use, reuse, and redistribute the data. There shouldn't be any discrimination against fields, persons, or groups.
44 |
45 | #### Data interoperability
46 | Interoperability is key to open data's success. It is the ability of data systems and services to openly connect and share data. Different databases using common formats and terminology is an example of interoperability.
47 |
48 | One of the biggest benefits of open data is that credible databases can be used more widely. Basically, this means that all of that good data can be leveraged, shared, and combined with other data. But it is important to think about the individuals being represented by the public, open data, too.
49 |
50 | Sites and resources for open data
51 | - U.S. government data site: Data.gov is one of the most comprehensive data sources in the US. This resource gives users the data and tools that they need to do research, and even helps them develop web and mobile applications and design data visualizations.
52 | - U.S. Census Bureau: This open data source offers demographic information from federal, state, and local governments, and commercial entities in the U.S. too.
53 | - Open Data Network: This data source has a really powerful search engine and advanced filters. Here, you can find data on topics like finance, public safety, infrastructure, and housing and development.
54 | - Google Cloud Public Datasets: There are a selection of public datasets available through the Google Cloud Public Dataset Program that you can find already loaded into BigQuery.
55 | - Dataset Search: The Dataset Search is a search engine designed specifically for data sets; you can use this to search for specific data sets.
56 |
11 | Alignment to business objective + newly discovered variables + constraints = accurate conclusions
12 |
13 | Maintaining data integrity helps ensure a close alignment of data and business objectives because the data is likely to be accurate, complete, consistent, and trustworthy.
14 |
15 | ---
16 |
17 | Types of insufficient data:
18 | - Data from only one source
19 | - Data that keeps updating
20 | - Outdated data
21 | - Geographically-limited data
22 |
23 | Ways to address insufficient data:
24 | - Identify trends with the available data
25 | - Wait for more data if time allows
26 | - Talk with stakeholders and adjust your objective
27 | - Look for a new dataset
28 |
29 | Consider the following data issues and suggestions on how to work around them.
30 | Data issue 1: no data
- Gather the data on a small scale to perform a preliminary analysis and then request additional time to complete the analysis after you have collected more data.
- If there isn’t time to collect data, perform the analysis using proxy data from other datasets. This is the most common workaround.
31 |
32 | Data issue 2: too little data
- Do the analysis using proxy data along with actual data.
- Adjust your analysis to align with the data you already have.
33 |
34 | Data issue 3: wrong data, including data with errors
- If you have the wrong data because requirements were misunderstood, communicate the requirements again.
- Identify errors in the data and, if possible, correct them at the source by looking for a pattern in the errors.
- If you can’t correct data errors yourself, you can ignore the wrong data and go ahead with the analysis if your sample size is still large enough and ignoring the data won’t cause systematic bias.
35 |
36 | 
37 |
38 |
If you know that your data is accurate, consistent, and complete, you can be confident that your results will be valid. Stakeholders will be pleased if you connect the data to business objectives. And, knowing when to stop collecting data will allow you to finish your tasks in a timely manner without sacrificing data integrity. Data analysts perform pre-cleaning activities to complete these steps.
46 |
47 | ---
48 |
49 | #### Statistical power
50 | The probability of getting meaningful results from a test. Statistical power can be calculated and reported for a completed experiment to comment on the confidence one might have in the conclusions drawn from the results of the study. It can also be used as a tool to estimate the number of observations or sample size required in order to detect an effect in an experiment.
51 |
52 | #### Hypothesis testing
53 | A way to see if a survey or experiment has meaningful results.
54 |
55 | Statistical power is usually shown as a value out of one. If a test is statistically significant, it means the results of the test are real and not an error caused by random chance. Usually, you need a statistical power of at least 0.8 or 80% to consider your results statistically significant.
56 |
57 | #### Confidence level
58 | The probability that your sample accurately reflects the greater population. Having a 99 percent confidence level is ideal but most industries hope for at least a 90 or 95 percent confidence level.
59 |
60 | **Estimated response rate**: If you are running a survey of individuals, this is the percentage of people you expect will complete your survey out of those who received the survey.
61 |
62 | A sample size calculator tells you how many people you need to interview (or things you need to test) to get results that represent the target population. To calculate sample size using an online calculator, it’s necessary to input the confidence level, margin of error, and population size. [Calculator](https://docs.google.com/spreadsheets/d/1kBTvnpH2qOLJx4XWjUG1v-GF4LPmOhequy_9VRyslJ8/template/preview). The calculated sample size is the minimum number to achieve what you input for confidence level and margin of error. If you are working with a survey, you will also need to think about the estimated response rate to figure out how many surveys you will need to send out.
63 |
64 | ---
65 |
66 | #### Margin of error
67 | The maximum amount that the sample results are expected to differ from those of the actual population. The closer to zero the margin of error, the closer your results from your sample would match results from the overall population. The more people you include in your survey, the more likely your sample is representative of the entire population. Decreasing the confidence level would also have the same effect, but that would also make it less likely that your survey is accurate. To calculate margin of error, you need three things: population size, sample size, and confidence level. [Calculator](https://docs.google.com/spreadsheets/d/1gdhfyA3_vMnQ1cDaGSCshXd5ezLtVPfLhxc9STGq6B8/template/preview).
68 |
69 | ---
70 |
71 | [Glossary](https://docs.google.com/document/d/1Ij-diqvlxXx7_GEA1pCovuars8d67iOWSFccrp3Vgv4/template/preview?resourcekey=0-ckHhfy9jV7IWpzJ7k5h20A)
72 |
73 | ---
74 |
--------------------------------------------------------------------------------
/4-Process Data from Dirty to Clean/Week2-Sparkling-clean data.md:
--------------------------------------------------------------------------------
1 | #### Dirty data and Clean data
2 | Dirty data is data that is incomplete, incorrect, or irrelevant to the problem you're trying to solve. Clean data is data that is complete, correct, and relevant to the problem you're trying to solve.
3 |
4 | **Data engineers** transform data into a useful format for analysis and give it a reliable infrastructure. This means they develop, maintain, and test databases, data processors and related systems.
**Data warehousing specialists** develop processes and procedures to effectively store and organize data. They make sure that data is available, secure, and backed up to prevent loss.
5 |
6 | A **null** is an indication that a value does not exist in a data set.
7 |
8 |
9 | Types of dirty data
10 |
11 | Description | Possible Causes | Potential harm to businesses
12 | ----------- | --------------- | ----------------------------
13 | Duplicate data: Any data record that shows up more than once | Manual data entry, batch data imports, or data migration | Skewed metrics or analyses, inflated or inaccurate counts or predictions, or confusion during data retrieval
14 | Outdated data: Any data that is old which should be replaced with newer and more accurate information | People changing roles or companies, or software and systems becoming obsolete | Inaccurate insights, decision-making, and analytics
15 | Incomplete data: Any data that is missing important fields | Improper data collection or incorrect data entry | Decreased productivity, inaccurate insights, or inability to complete essential services
16 | Incorrect/inaccurate data: Any data that is complete but inaccurate | Human error inserted during data input, fake information, or mock data | Inaccurate insights or decision-making based on bad information resulting in revenue loss
17 | Inconsistent data: Any data that uses different formats to represent the same thing | Data stored incorrectly or errors inserted during data transfer | Contradictory data points leading to confusion or inability to classify or segment customers
18 |
19 |
20 |
21 | A **field** is a single piece of information from a row or column of a spreadsheet. **Field length** is a tool for determining how many characters can be keyed into a field. Using the field length tool to specify the number of characters in each cell in the column could be part of data validation.
22 |
23 | **Data validation** is a tool for checking the accuracy and quality of data before adding or importing it.
24 |
25 | ---
26 |
27 | #### Data merging
28 | The process of combining two or more datasets into a single dataset. This presents a unique challenge because when two totally different datasets are combined, the information is almost guaranteed to be inconsistent and misaligned. In data analytics, **compatibility** describes how well two or more datasets are able to work together.
29 |
30 | Key questions to think about to avoid redundancy and to confirm that the datasets are compatible:
31 | - Do I have all the data I need?
32 | - Does the data I need exist within these datasets?
33 | - Do the datasets need to be cleaned, or are they ready for me to use?
34 | - Are the datasets cleaned to the same standard?
35 |
36 | Common data-cleaning pitfalls
37 | - Not checking for spelling errors: Misspellings can be as simple as typing or input errors. Most of the time the wrong spelling or common grammatical errors can be detected, but it gets harder with things like names or addresses. For example, if you are working with a spreadsheet table of customer data, you might come across a customer named “John” whose name has been input incorrectly as “Jon” in some places. The spreadsheet’s spellcheck probably won’t flag this, so if you don’t double-check for spelling errors and catch this, your analysis will have mistakes in it.
38 | - Forgetting to document errors: Documenting your errors can be a big time saver, as it helps you avoid those errors in the future by showing you how you resolved them. For example, you might find an error in a formula in your spreadsheet. You discover that some of the dates in one of your columns haven’t been formatted correctly. If you make a note of this fix, you can reference it the next time your formula is broken, and get a head start on troubleshooting. Documenting your errors also helps you keep track of changes in your work, so that you can backtrack if a fix didn’t work.
39 | - Not checking for misfielded values: A misfielded value happens when the values are entered into the wrong field. These values might still be formatted correctly, which makes them harder to catch if you aren’t careful. For example, you might have a dataset with columns for cities and countries. These are the same type of data, so they are easy to mix up. But if you were trying to find all of the instances of Spain in the country column, and Spain had mistakenly been entered into the city column, you would miss key data points. Making sure your data has been entered correctly is key to accurate, complete analysis.
40 | - Overlooking missing values: Missing values in your dataset can create errors and give you inaccurate conclusions. For example, if you were trying to get the total number of sales from the last three months, but a week of transactions were missing, your calculations would be inaccurate. As a best practice, try to keep your data as clean as possible by maintaining completeness and consistency.
41 | - Only looking at a subset of the data: It is important to think about all of the relevant data when you are cleaning. This helps make sure you understand the whole story the data is telling, and that you are paying attention to all possible errors. For example, if you are working with data about bird migration patterns from different sources, but you only clean one source, you might not realize that some of the data is being repeated. This will cause problems in your analysis later on. If you want to avoid common errors like duplicates, each field of your data requires equal attention.
42 | - Losing track of business objectives: When you are cleaning data, you might make new and interesting discoveries about your dataset-- but you don’t want those discoveries to distract you from the task at hand. For example, if you were working with weather data to find the average number of rainy days in your city, you might notice some interesting patterns about snowfall, too. That is really interesting, but it isn’t related to the question you are trying to answer right now. Being curious is great! But try not to let it distract you from the task at hand.
43 | - Not fixing the source of the error: Fixing the error itself is important. But if that error is actually part of a bigger problem, you need to find the source of the issue. Otherwise, you will have to keep fixing that same error over and over again. For example, imagine you have a team spreadsheet that tracks everyone’s progress. The table keeps breaking because different people are entering different values. You can keep fixing all of these problems one by one, or you can set up your table to streamline data entry so everyone is on the same page. Addressing the source of the errors in your data will save you a lot of time in the long run.
44 | - Not analyzing the system prior to data cleaning: If we want to clean our data and avoid future errors, we need to understand the root cause of your dirty data. Imagine you are an auto mechanic. You would find the cause of the problem before you started fixing the car, right? The same goes for data. First, you figure out where the errors come from. Maybe it is from a data entry error, not setting up a spell check, lack of formats, or from duplicates. Then, once you understand where bad data comes from, you can control it and keep your data clean.
45 | - Not backing up your data prior to data cleaning: It is always good to be proactive and create your data backup before you start your data clean-up. If your program crashes, or if your changes cause a problem in your dataset, you can always go back to the saved version and restore it. The simple procedure of backing up your data can save you hours of work-- and most importantly, a headache.
46 | - Not accounting for data cleaning in your deadlines/process: All good things take time, and that includes data cleaning. It is important to keep that in mind when going through your process and looking at your deadlines. When you set aside time for data cleaning, it helps you get a more accurate estimate for ETAs for stakeholders, and can help you know when to request an adjusted ETA.
47 |
63 |
64 | - **COUNTIF** is a function that returns the number of cells that match a specified value. `=COUNTIF(range, "value")`
65 | - **LEN** is a function that tells you the length of the text string by counting the number of characters it contains. `=LEN(range)`
66 | - **LEFT** is a function that gives you a set number of characters from the left side of a text string. `=LEFT(range, number of characters)`
67 | - **RIGHT** is a function that gives you a set number of characters from the right side of a text string. `=RIGHT(range, number of characters)`
68 | - **MID** is a function that gives you a segment from the middle of a text string. `=MID(range, reference starting point, number of middle characters)`
69 | - **CONCATENATE** is a function that joins multiple text strings into a single string. `=CONCATENATE(item 1, item 2)`
70 | - **TRIM** is a function that removes leading, trailing, and repeated spaces in data. `=TRIM(range)`
71 |
72 |
73 |
74 | Different methods that data analysts use to look at data differently and how that leads to more efficient and effective data cleaning: Some of these methods include sorting and filtering, pivot tables, a function called VLOOKUP, and plotting to find outliers.
75 |
76 | - For data cleaning, you can use sorting to put things in alphabetical or numerical order, so you can easily find a piece of data. Sorting can also bring duplicate entries closer together for faster identification. Filters, on the other hand, are very useful in data cleaning when you want to find a particular piece of information.
77 | - **Pivot tables** sort, reorganize, group, count, total or average data stored in the database. In data cleaning, pivot tables are used to give you a quick, clutter- free view of your data. You can choose to look at the specific parts of the data set that you need to get a visual in the form of a pivot table.
78 | - **VLOOKUP** stands for vertical lookup. It's a function that searches for a certain value in a column to return a corresponding piece of information. `=VLOOKUP(data to look up, 'where to look up' !Range, column, false)`
79 | - When you plot data, you put it in a graph chart, table, or other visual to help you quickly find what it looks like. Plotting is very useful when trying to identify any skewed data or outliers.
80 |
81 |
82 |
83 | #### Data mapping
84 | Data mapping is the process of matching fields from one data source to another. Different systems store data in different ways. Data mapping helps us note these kinds of differences so we know when data is moved and combined it will be compatible.
85 |
86 | 1. The first step to data mapping is identifying what data needs to be moved. This includes the tables and the fields within them. We also need to define the desired format for the data once it reaches its destination.
87 | 2. Next comes mapping the data. Depending on the schema and number of primary and foreign keys in a data source, data mapping can be simple or very complex. A **schema** is a way of describing how something is organized. For more challenging projects there's all kinds of data mapping software programs you can use. These data mapping tools will analyze field by field how to move data from one place to another then they automatically clean, match, inspect, and validate the data. They also create consistent naming conventions, ensuring compatibility when the data is transferred from one source to another. When selecting a software program to map your data, you want to be sure that it supports the file types you're working with, such as Excel, SQL, Tableau, and others.
88 | 3. The next step is to transform the data into a consistent format.
89 | 4. Now that everything's compatible, it's time to transfer the data to it's destination. There's a lot of different ways to move data from one place to another, including querying, import wizards, and even simple drag and drop.
90 | 5. We would still want to make sure everything was transferred properly. We'll go into the testing phase of data mapping. For this, you inspect a sample piece of data to confirm that it's clean and properly formatted. It's also a smart practice to do spot checks on things such as the number of nulls. For the test, you can use a lot of the data cleaning tools such as data validation, conditional formatting, COUNTIF, sorting, and filtering.
91 | 6. Once you've determined that the data is clean and compatible, you can start using it for analysis.
92 |
93 | ---
94 |
95 | [Glossary](https://docs.google.com/document/d/1JC24x3TypcFdueCPEd5UAnKIzL9sM8UpOKaMHdibiq4/template/preview)
96 |
97 | ---
98 |
99 |
100 |
--------------------------------------------------------------------------------
/4-Process Data from Dirty to Clean/Week3-Cleaning data with SQL.md:
--------------------------------------------------------------------------------
1 | SQL can process large amounts of data much more quickly than spreadsheets.
2 |
3 | Where the data lives will decide which tool you use. If you are working with data that is already in a spreadsheet, that is most likely where you will perform your analysis. And if you are working with data stored in a database, SQL will be the best tool for you to use for your analysis. SQL can handle huge amounts of data, can be adapted and used with multiple database programs, and offers powerful tools for cleaning data. SQL is also a well-known standard in the professional community.
4 |
5 | Data stored in a SQL database is useful to a project with multiple team members because they can access the data at the same time, use SQL to interact with the database program, and track changes to SQL queries across the team.
6 |
7 | Structured Query Language, or SQL, is a language used to talk to databases. Learning SQL can be a lot like learning a new language — including the fact that languages usually have different dialects within them. Some database products have their own variant of SQL, and these different varieties of SQL dialects are what help you communicate with each database product. These dialects will be different from company to company and might change over time if the company moves to another database system. So, a lot of analysts start with Standard SQL and then adjust the dialect they use based on what database they are working with. Standard SQL works with a majority of databases and requires a small number of syntax changes to adapt to other dialects.
8 |
9 | ---
10 |
11 | - We can use `SELECT` to specify exactly what data we want to interact with in a table. If we combine `SELECT` with `FROM`, we can pull data from any table in this database as long as they know what the columns and rows are named.
12 | - We can also insert new data into a database or update existing data. We can use the `INSERT INTO` query to put that information in. We also want to specify which columns we're adding this data to by typing their names in the parentheses.
13 | - If we want to create a new table for an updated database, we can use the `CREATE TABLE IF NOT EXISTS` statement. Just running a SQL query doesn't actually create a table for the data we extract. It just stores it in our local memory.
14 | - If you're creating lots of tables within a database, you'll want to use the `DROP TABLE IF EXISTS` statement to clean up.
15 | - `DELETE` removes data from a database.
16 | - `UPDATE` changes existing data in a database.
17 |
18 |
19 | - Including `DISTINCT` in your `SELECT` statement removes duplicates.
20 | - In a query, if you use the `LENGTH()`, `SUBSTR()`, or `TRIM()` function in a WHERE clause, you can select data based on a string condition. `SUBSTR()` and `TRIM()` functions can be used to clean string variables. `LENGTH()` can be used in the general cleaning process to check if the data is as expected, but it does not actually clean strings.
21 | - If we already know the length our string variables are supposed to be, we can use `LENGTH(column)` to double-check that our string variables are consistent. For some databases, this query is written as `LEN(column)`, but it does the same thing.
22 | - `SUBSTR(column, starting position, number of letters including starting position)` is the substring function.
23 | - `TRIM(column)` function is really useful if you find entries with extra spaces and need to eliminate those extra spaces for consistency.
24 |
25 |
26 |
27 | - `MIN(column)` and `MAX(column)` returns the minimum and maximum numerical values respectively in the specified column.
28 | - `COUNT(*)` returns the number of rows.
29 |
30 | ---
31 |
32 | - `CAST(column AS data_type)` can be used to convert anything from one data type to another.
33 | - `ORDER BY` statement allows us to order rows in the specified column in descending or ascending order as specified in the statement.
34 | - `CONCAT(column1, column2)` lets you add strings together to create new text strings that can be used as unique keys.
35 | - `COALESCE(column to check first, column to check second if the first column is null)` can be used to return non-null values in a list. Null values are missing values.
36 |
37 | ---
38 |
39 | [Glossary](https://docs.google.com/document/d/11qyveOPiz27RWNKfQa2xrJ2QwCHwNMHN_Z8_sBr0GNk/template/preview)
40 |
41 | ---
42 |
--------------------------------------------------------------------------------
/4-Process Data from Dirty to Clean/Week4-Verify and report on your cleaning results.md:
--------------------------------------------------------------------------------
1 | ### Verification
2 | Verification is a process to confirm that a data cleaning effort was well- executed and the resulting data is accurate and reliable. It involves rechecking your clean dataset, doing some manual clean ups if needed, and taking a moment to sit back and really think about the original purpose of the project. That way, you can be confident that the data you collected is credible and appropriate for your purposes.
3 |
4 | Reporting is a great opportunity to show stakeholders that you're accountable, build trust with your team, and make sure you're all on the same page of important project details. Different strategies for reporting include creating **data- cleaning reports**, **documenting your cleaning process**, and using **changelog**.
5 |
6 | #### Changelog
7 | A changelog is a file containing a chronologically ordered list of modifications made to a project. It's usually organized by version and includes the date followed by a list of added, improved, and removed features. Changelogs are very useful for keeping track of how a dataset evolved over the course of a project. They're also another great way to communicate and report on data to others. They can be referred to during the verification period if there are errors or questions.
8 |
9 |
10 |
11 | - The first step in the verification process is going back to your original unclean data set and comparing it to what you have now, review the dirty data and try to identify any common problems.
12 | - Another key part of verification involves taking a big-picture view of your project. This is an opportunity to confirm you're actually focusing on the business problem, that you need to solve, and the overall project goals; and to make sure that your data is actually capable of solving that problem and achieving those goals. Taking a big picture view of your project involves doing three things:
13 | 1. Consider the business problem you're trying to solve with the data. Taking a problem-first approach to analytics is essential at all stages of any project.
14 | 2. Consider the goal of the project. On top of that, you also need to know whether the data you've collected and cleaned will actually help your company achieve that goal.
15 | 3. Consider whether your data is capable of solving the problem and meeting the project objectives.
16 |
17 |
18 |
19 | - **COUNTA** counts the total number of values within a specified range. Note that there's also function called **COUNT**, which only counts the numerical values within a specified range.
20 | - If you're working in SQL, you can address misspellings using a `CASE` statement. The `CASE` statement goes through one or more conditions and returns a value as soon as a condition is met. You should add a CASE statement as a `SELECT` clause. The typo would be a condition and the correction would be the returned value for the condition.
21 |
22 | ---
23 |
24 | #### Documentation
25 | The process of tracking changes, additions, deletions and errors involved in your data cleaning effort. Changelogs are good example of this, since it's staged chronologically, it provides a real-time account of every modification. Documenting data-cleaning makes it possible to be transparent about your process, keep team members on the same page, and demonstrate to project stakeholders that you are accountable.
26 |
27 | Having a record of how a data set evolved does three very important things:
28 | - Lets us recover data-cleaning errors (recalling the errors that were cleaned).
29 | - Documentation gives you a way to inform other users of changes you've made.
30 | - Documentation helps you to determine the quality of the data to be used in analysis.
31 |
32 | Most software applications have a kind of history tracking built in. You can use and view a changelog in spreadsheets and SQL to achieve similar results.
33 | - In the spreadsheet, we can use *Sheets Version History*, which provides a real-time tracker of all the changes and who made them from individual cells to the entire worksheet. If you want to check out changes in a specific cell, we can right-click and select *Show Edit History*.
34 | - The way you create and view a changelog with SQL depends on the software program you're using.
35 | - In BigQuery, *Query History* tracks all the queries you've run. You can click on any of them to revert back to a previous version of your query or to bring up an older version to find what you've changed.
36 |
37 | While your team can view changelogs directly, stakeholders can't and have to rely on your report to know what you did. There're plenty of ways we could go about documenting what we did, one common way is to just create a doc listing out the steps we took and the impact they had. If we were working with SQL, we could include a comment in the statement describing the reason for a change without affecting the execution of the statement.
38 |
39 | Clean data is important to the task at hand. But the data-cleaning process itself can reveal insights that are helpful to a business. The feedback we get when we report on our cleaning can transform data collection processes, and ultimately business development. With consistent documentation and reporting, we can uncover error patterns in data collection and entry procedures and use the feedback we get to make sure common errors aren't repeated. Maybe we need to reprogram the way the data is collected or change specific questions on the survey form. In more extreme cases, the feedback we get can even send us back to the drawing board to rethink expectations and possibly update quality control procedures. For example, sometimes it's useful to schedule a meeting with a data engineer or data owner to make sure the data is brought in properly and doesn't require constant cleaning.
40 |
41 | Some advanced functions that can help you speed up the data cleaning process in spreadsheets. Below is a table summarizing three functions and what they do:
42 |
43 | 
44 |
45 | ---
46 |
47 | [Glossary](https://docs.google.com/document/d/1rYNIY-fDkA2lLCwrBrvhzNV5BzzHpjTcsiWwXou0bj4/template/preview)
48 |
49 | ---
50 |
--------------------------------------------------------------------------------
/4-Process Data from Dirty to Clean/Week5-Optional: Adding data to your resume.md:
--------------------------------------------------------------------------------
1 | Nothing specific. Enroll in, or Preview the course and visit [here](https://www.coursera.org/learn/process-data/home/week/5) for tips to build an effective resume for a data analyst position.
2 |
3 | ---
4 |
5 | [Glossary](https://docs.google.com/document/d/1M5ECYjyOHafeVj-ryAE2rDXA8iYPSlxCyvPHPIlGdqk/template/preview)
6 |
7 | ---
8 |
--------------------------------------------------------------------------------
/5-Analyze Data to Answer Questions/Week1-Organizing data to begin analysis.md:
--------------------------------------------------------------------------------
1 |
2 |
--------------------------------------------------------------------------------
/README.md:
--------------------------------------------------------------------------------
1 | # Google-Data-Analytics Certification
2 |
3 | Notes for the course on Data Analytics by Google in Coursera. Course [link](https://www.coursera.org/professional-certificates/google-data-analytics?utm_source=google&utm_medium=institutions&utm_campaign=gwgsite-paid-essence-in-dr-q42021-sem-bkws-exa-txt-course-1-analytics-certificate-data_analytics).
4 |
--------------------------------------------------------------------------------