├── .babelrc
├── .eslintrc.js
├── .gitignore
├── .npmignore
├── LICENSE
├── README.md
├── index.js
├── package-lock.json
├── package.json
├── rollup.config.js
├── src
├── addCover.js
├── convertUnitRadius.js
├── getBoundaryPoints.js
├── getCover.js
├── getEdgeCenters.js
├── getEdgeTools.js
├── getImageCenters.js
├── getImageData.js
├── getPolygonPoints.js
├── hexgrid.js
├── prepUserData.js
├── rollupDensity.js
├── rollupPoints.js
├── setHexGenerator.js
└── utils.js
└── test
├── data
├── lux_adm0.json
├── lux_cities.csv
└── lux_cities.json
└── hexgrid.test.js
/.babelrc:
--------------------------------------------------------------------------------
1 | {
2 | "presets": [
3 | [
4 | "@babel/env",
5 | {
6 | "modules": false
7 | }
8 | ]
9 | ],
10 | "plugins": ["@babel/transform-runtime"]
11 | }
12 |
--------------------------------------------------------------------------------
/.eslintrc.js:
--------------------------------------------------------------------------------
1 | module.exports = {
2 | "extends": [
3 | "airbnb-base",
4 | "prettier"
5 | ],
6 | "rules": {
7 | "func-names": "off",
8 | "no-return-assign": "off",
9 | "no-plusplus": "off",
10 | "no-continue": "off",
11 | "arrow-body-style": "off"
12 | },
13 | "env": {
14 | "browser": true
15 | }
16 |
17 | };
--------------------------------------------------------------------------------
/.gitignore:
--------------------------------------------------------------------------------
1 | .DS_Store
2 | dist/
3 | npm-debug.log
4 | node_modules
5 | *.txt
6 | *.tgz
7 | package/
--------------------------------------------------------------------------------
/.npmignore:
--------------------------------------------------------------------------------
1 | dist/*.zip
2 | test/
3 | .babelrc
4 | .eslintrc.js
5 | rollup.config.js
--------------------------------------------------------------------------------
/LICENSE:
--------------------------------------------------------------------------------
1 | Copyright 2018, Lars Verspohl
2 | All rights reserved.
3 |
4 | Redistribution and use in source and binary forms, with or without modification,
5 | are permitted provided that the following conditions are met:
6 |
7 | * Redistributions of source code must retain the above copyright notice, this
8 | list of conditions and the following disclaimer.
9 |
10 | * Redistributions in binary form must reproduce the above copyright notice,
11 | this list of conditions and the following disclaimer in the documentation
12 | and/or other materials provided with the distribution.
13 |
14 | * Neither the name of the author nor the names of contributors may be used to
15 | endorse or promote products derived from this software without specific prior
16 | written permission.
17 |
18 | THIS SOFTWARE IS PROVIDED BY THE COPYRIGHT HOLDERS AND CONTRIBUTORS "AS IS" AND
19 | ANY EXPRESS OR IMPLIED WARRANTIES, INCLUDING, BUT NOT LIMITED TO, THE IMPLIED
20 | WARRANTIES OF MERCHANTABILITY AND FITNESS FOR A PARTICULAR PURPOSE ARE
21 | DISCLAIMED. IN NO EVENT SHALL THE COPYRIGHT OWNER OR CONTRIBUTORS BE LIABLE FOR
22 | ANY DIRECT, INDIRECT, INCIDENTAL, SPECIAL, EXEMPLARY, OR CONSEQUENTIAL DAMAGES
23 | (INCLUDING, BUT NOT LIMITED TO, PROCUREMENT OF SUBSTITUTE GOODS OR SERVICES;
24 | LOSS OF USE, DATA, OR PROFITS; OR BUSINESS INTERRUPTION) HOWEVER CAUSED AND ON
25 | ANY THEORY OF LIABILITY, WHETHER IN CONTRACT, STRICT LIABILITY, OR TORT
26 | (INCLUDING NEGLIGENCE OR OTHERWISE) ARISING IN ANY WAY OUT OF THE USE OF THIS
27 | SOFTWARE, EVEN IF ADVISED OF THE POSSIBILITY OF SUCH DAMAGE.
28 |
--------------------------------------------------------------------------------
/README.md:
--------------------------------------------------------------------------------
1 | # d3-hexgrid
2 |
3 | A wrapper of [_d3-hexbin_](https://github.com/d3/d3-hexbin), _**d3-hexgrid**_ does three things:
4 |
5 | 1. It allows you to [regularly tessellate](https://www.mathsisfun.com/geometry/tessellation.html) polygons with hexagons. _**d3-hexbin**_ produces hexagons where there is data. _**d3-hexgrid**_ produces hexagons where there is a base geography you define.
6 |
7 | 2. Hexagons at the edge of your geography are often truncated by the geography's border. _d3.hexgrid_ calculates the inside-area or _cover_ of these edge hexagons allowing you to encode edge data based on the correct point density. [See below for more](#cover-correction).
8 |
9 | 3. Lastly, _d3.hexgrid_ provides an extended layout generator for your point location data to simplify the visual encoding of your data. The layout rolls up the number of point locations per hexagon, adds cover and point density and provides point count and point density extents for colour scale domains. [See below for more](#breaking-the-example-down).
10 |
11 | Please [see this notebook](https://beta.observablehq.com/@larsvers/hexgrid-maps-with-d3-hexgrid) for a description of the algorithm.
12 |
13 | Go straight to the [API reference](#api-reference).
14 |
15 | ## Install
16 |
17 | ```
18 | npm install d3-hexgrid
19 | ```
20 |
21 | You can also download the build files [from here](https://github.com/larsvers/d3-hexgrid/releases).
22 |
23 | Or you can use [unpkg](https://unpkg.com/) to script-link to _d3-hexgrid_:
24 |
25 | ```
26 |
27 | ```
28 |
29 | ## Examples
30 |
31 | #### Militarised interstate disputes in Europe 1816-2001
32 |
33 | 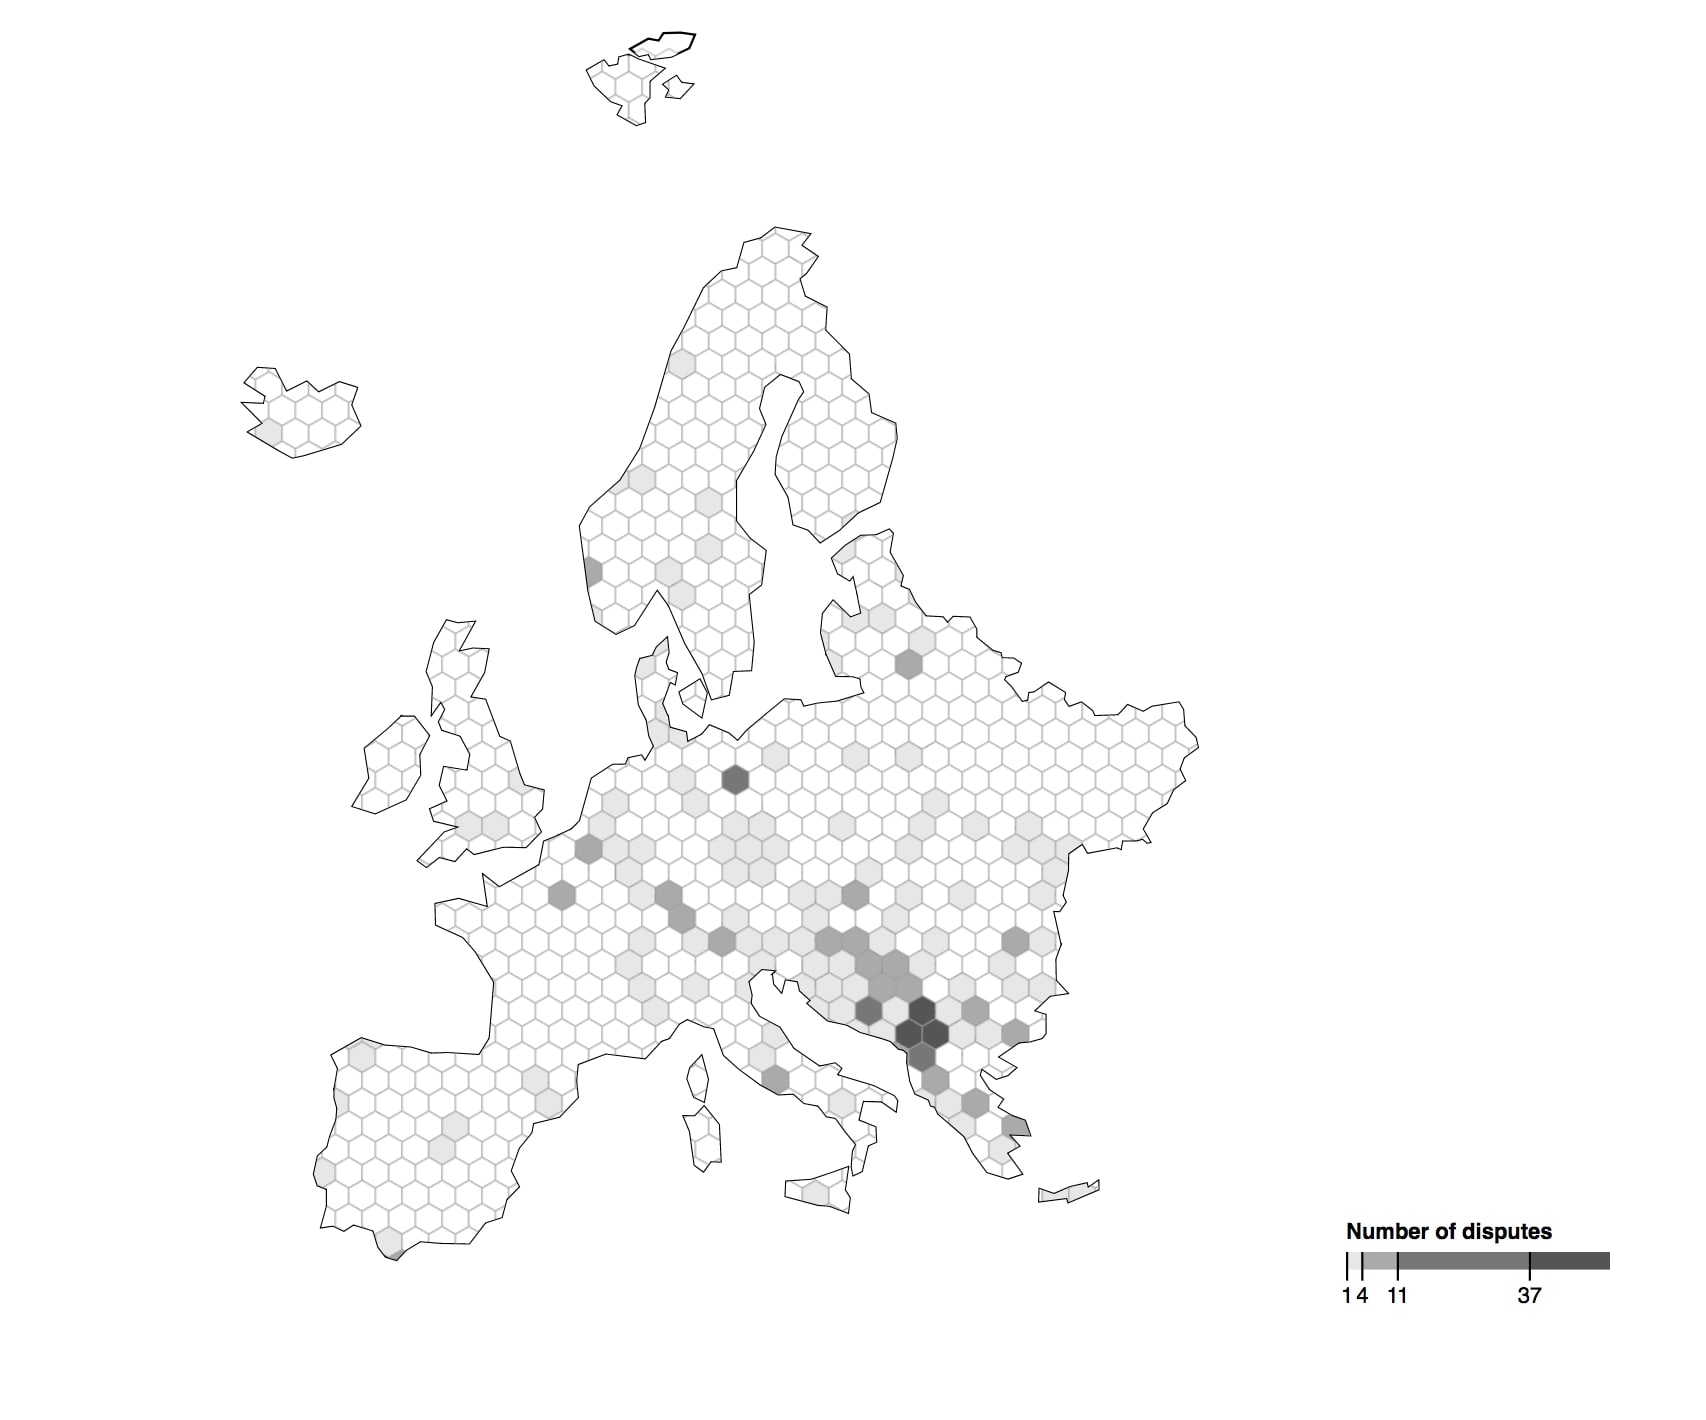
34 |
35 | Data source: [Midloc via data.world](https://data.world/cow/militarized-dispute-locations/). Additional clip-path applied. • [code](https://bl.ocks.org/larsvers/049c8f382ea07d48ca0a395e661d0fa4)
36 |
37 | #### Cities across the world
38 |
39 | 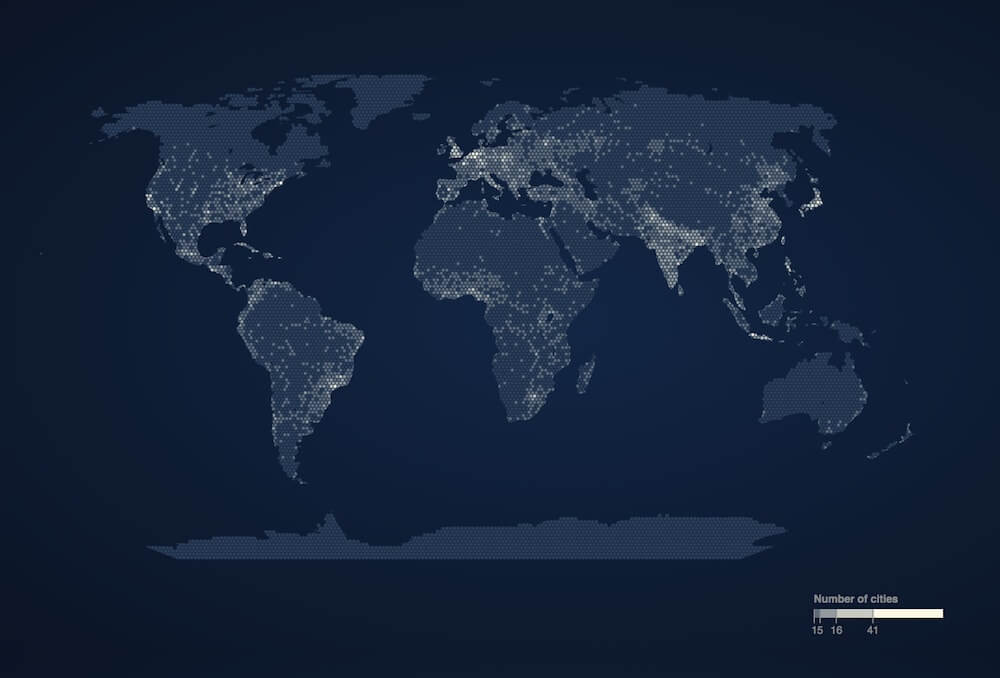
40 |
41 | Data source: [maxmind](https://www.maxmind.com/en/free-world-cities-database). Not equal area projected. • [code](https://bl.ocks.org/larsvers/da5b2b77c8626be757076807409b87d3)
42 |
43 | #### Farmers Markets in the US
44 |
45 | 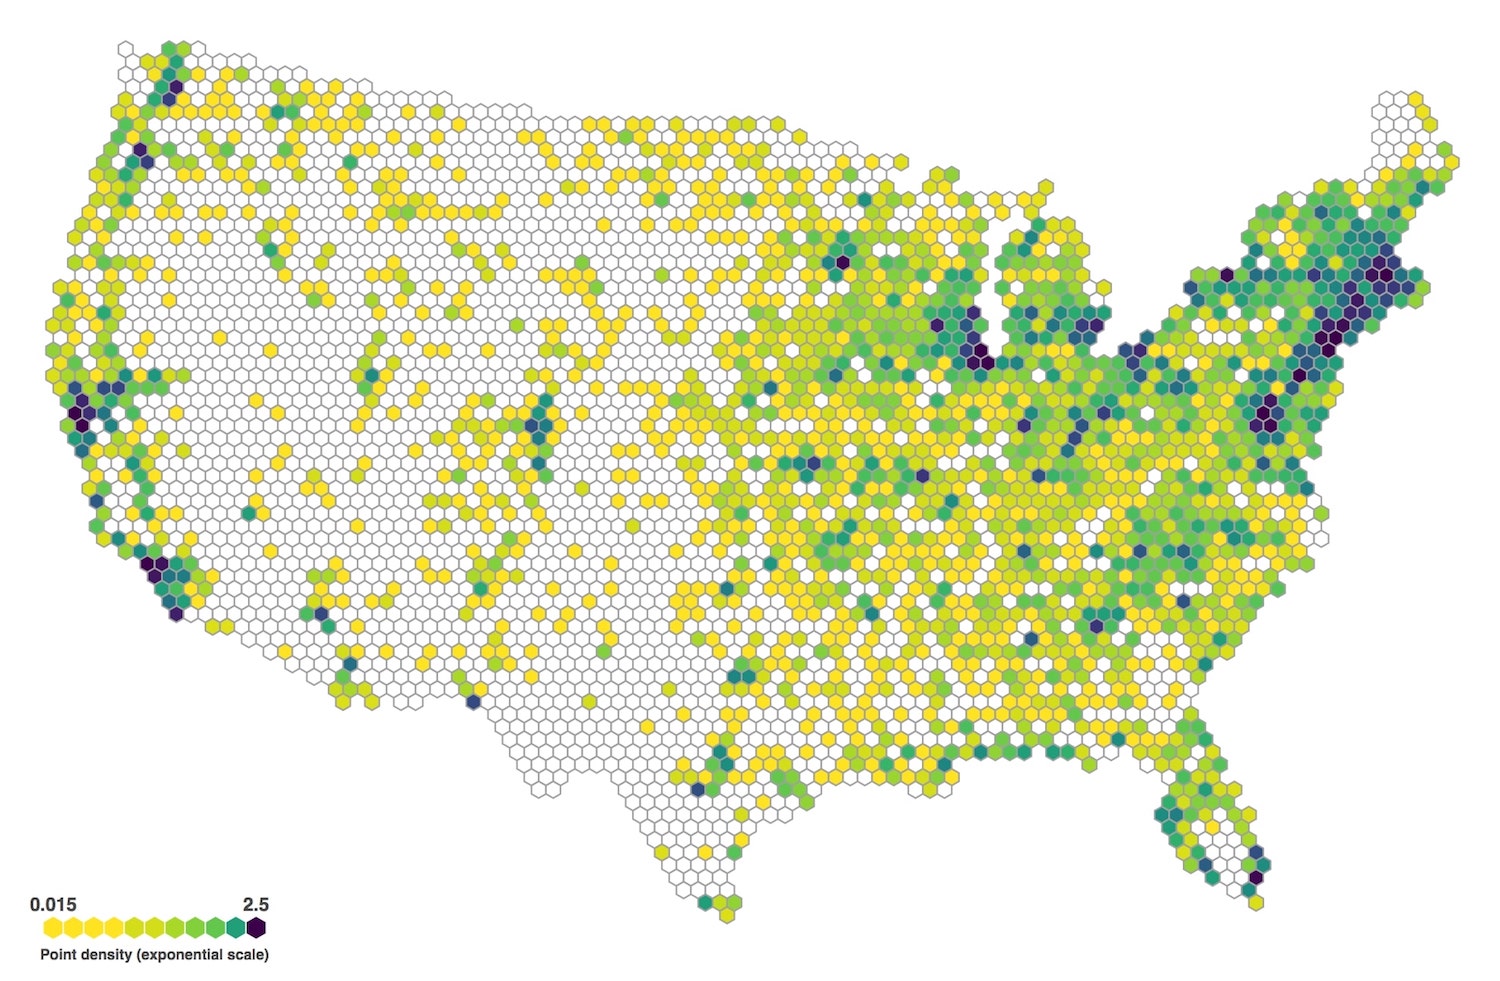
46 |
47 | Data source: [USDA](https://www.ams.usda.gov/local-food-directories/farmersmarkets) • [code](https://bl.ocks.org/larsvers/7f856d848e1f5c007553a9cea8a73538)
48 |
49 | #### Post boxes in the UK
50 |
51 | 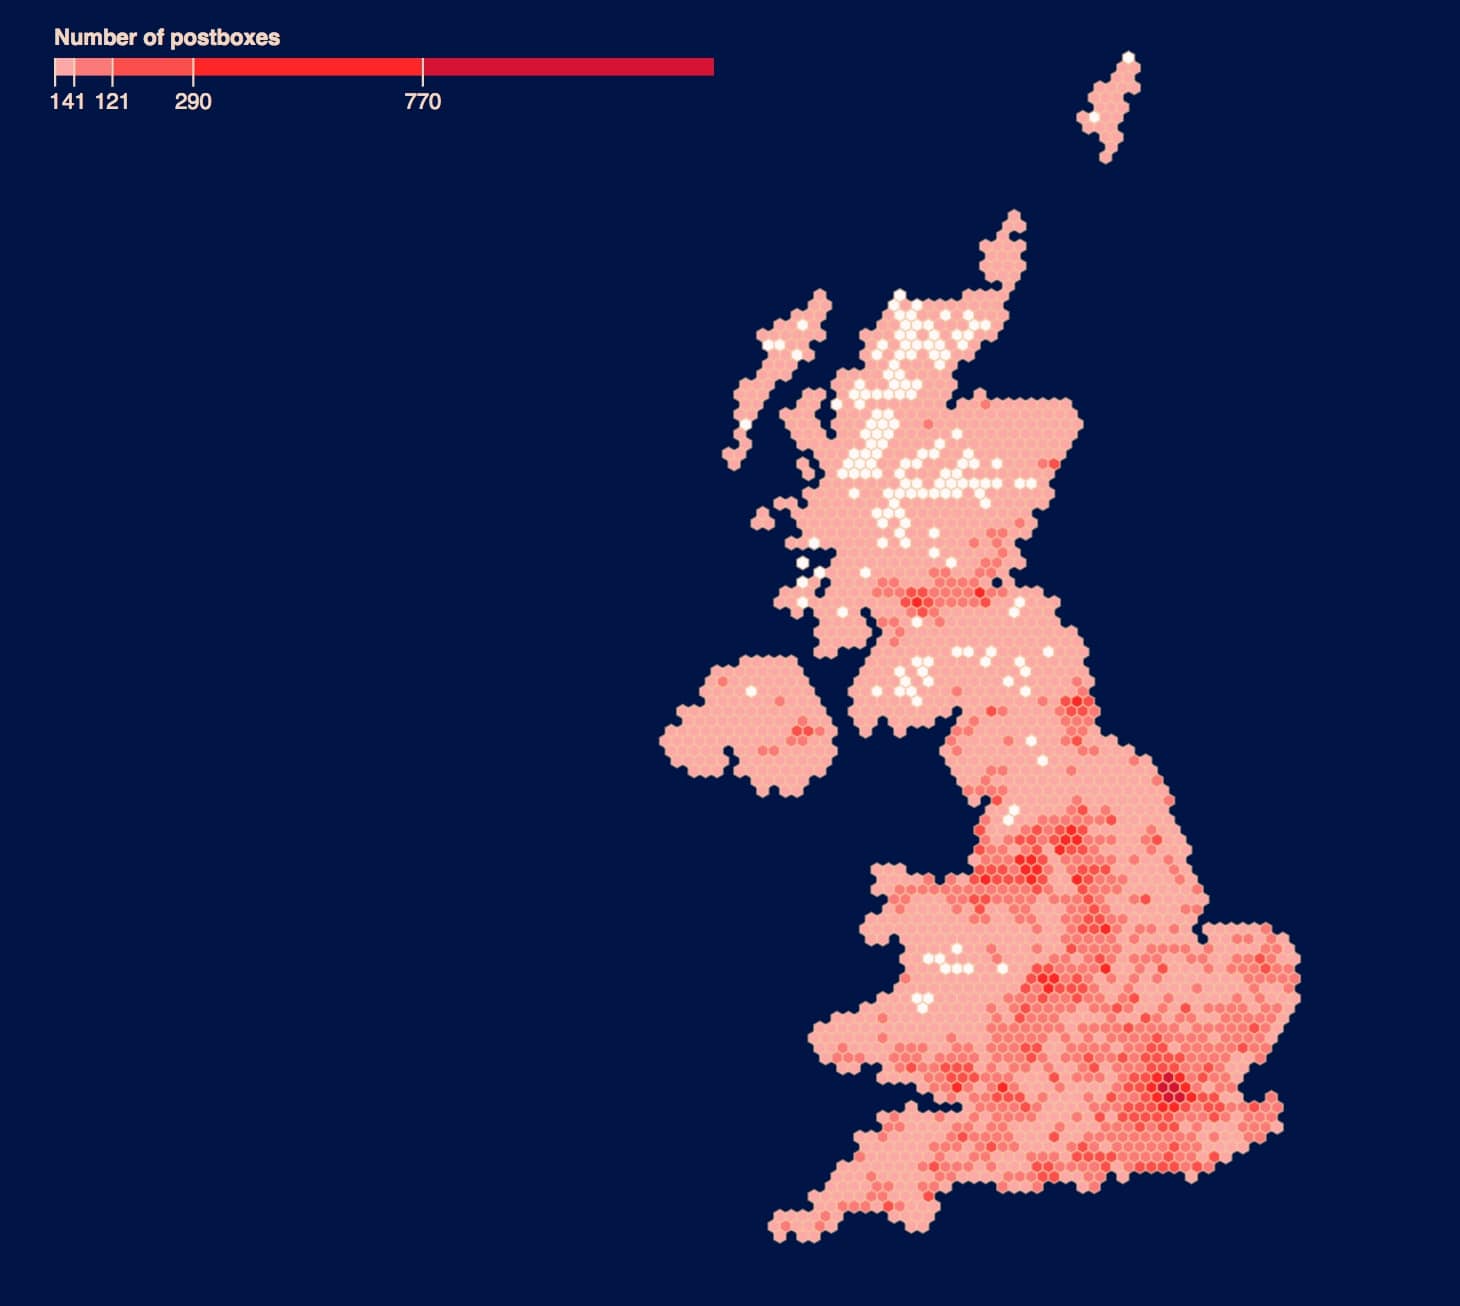
52 |
53 | Data source: [dracos.co.uk](http://dracos.co.uk/) from [here](http://dracos.co.uk/made/locating-postboxes) via [Free GIS Data](https://freegisdata.rtwilson.com/) • [code](https://bl.ocks.org/larsvers/a05405dd9476e5842a1dbbc93b3d1cf7)
54 |
55 | ### Edge Cover
56 |
57 | The tessellation aspect might become clear in these examples. The edge cover calculation might not. In short, _d3.hexgrid_ identifies all **edge hexagons** that partly lie beyond the borders of the geography, or more general: the base image presented. In a next step it calculates the edge hexagon's **cover**: the area the edge hexagon lies within the bounds of the base image in percent. Lastly, the **point density** will be calculated by:
58 |
59 | _Point density = Points in hexagon / Hexagon area in px2 × Cover_
60 |
61 | A comparison:
62 |
63 | 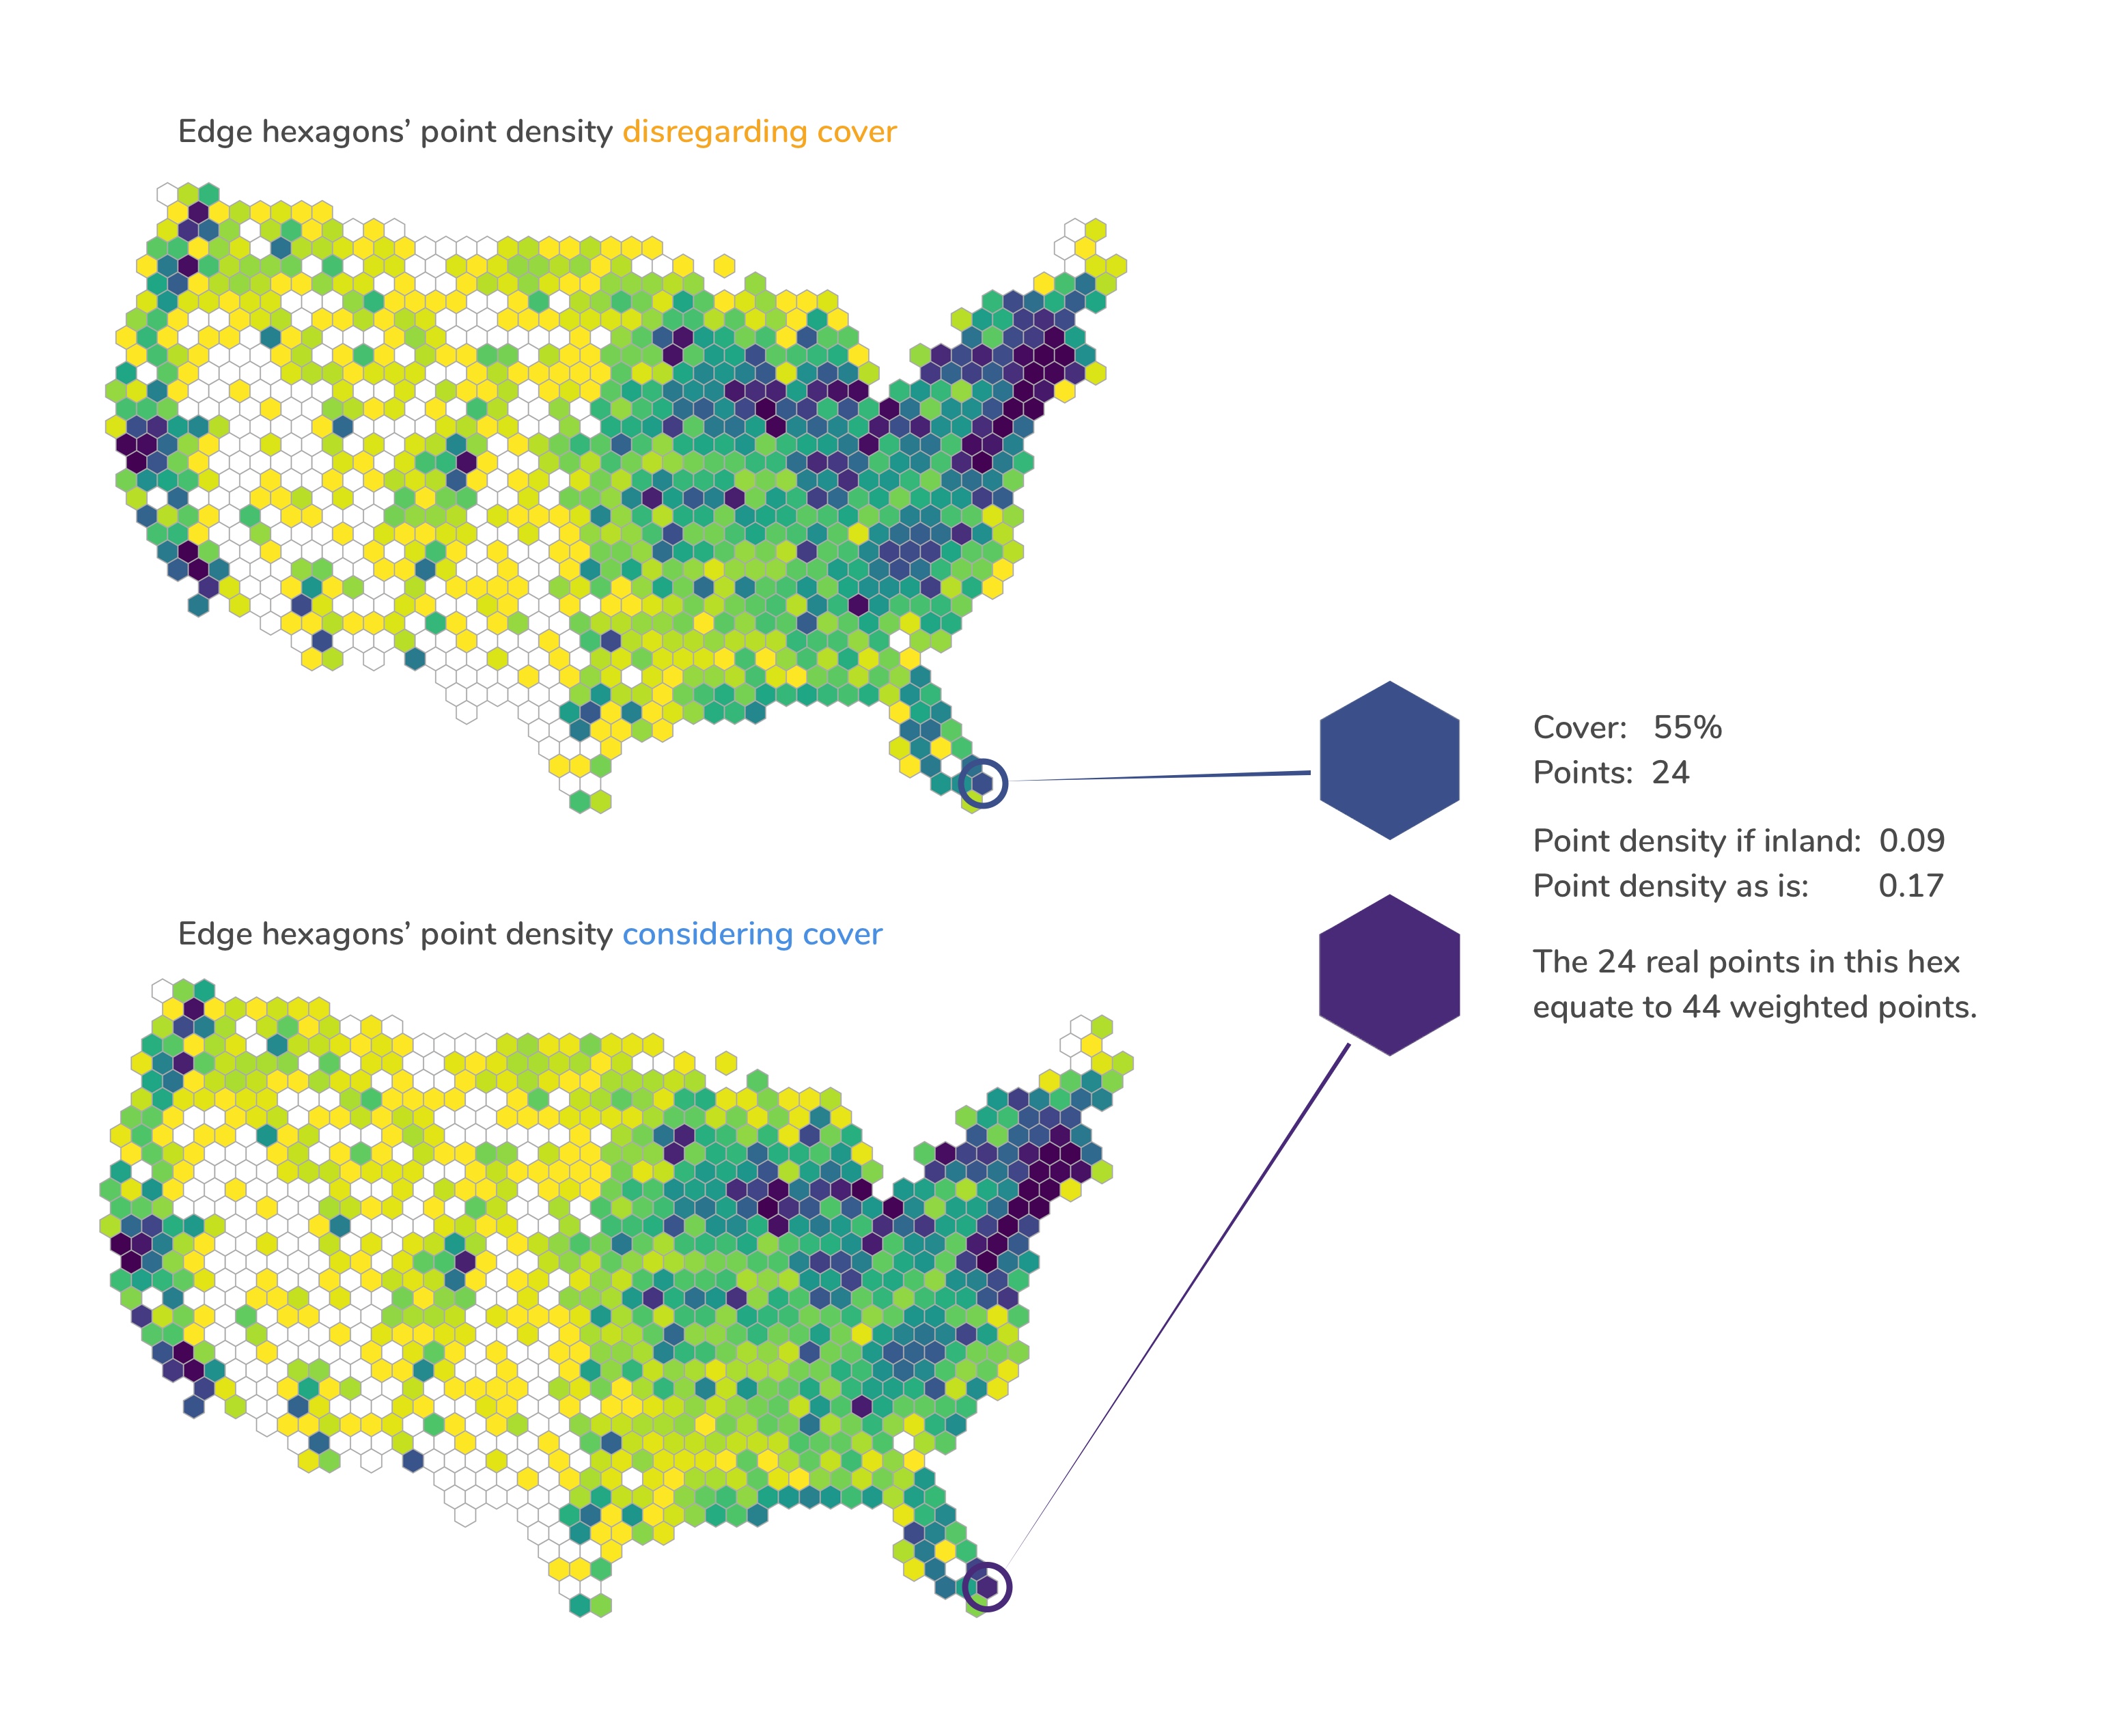
64 |
65 | Both maps encode the number of Farmer's Markets per hexagon. Yellow represents a low, purple a high number. The edge hexagons of the upper map are not cover corrected, the edge hexagons of the lower map are.
66 |
67 | The edge hexagon at the south-eastern tip of Florida we're comparing has a cover of 55%, meaning 55% of the hexagon's area is inland, 45% is in the Atlantic. There are a total of 22 Farmer's Markets in this hexagon. Not cover corrected, the hexagon would have a point density of 0.09 and would be filled in a dark blue with the colour scale of choice. When cover corrected, its real point density increases to 0.17 and it is coloured in a dark purple—indicating higher point density as it should.
68 |
69 | Differences might be subtle but noticeable.
70 |
71 | Please see the d3-hexgrid's notebook [section on edge cover](https://beta.observablehq.com/@larsvers/hexgrid-maps-with-d3-hexgrid#coverChapter) for a detailed description of the cover calculation.
72 |
73 | ## Example usage
74 |
75 | A lean example usage of _d3-hexgrid_.
76 |
77 | ```
78 | // Container.
79 | const svg = d3.select('body')
80 | .append('svg')
81 | .attr(width, 'width')
82 | .attr('height, 'height');
83 |
84 | // Projection and path.
85 | const projection = d3.geoAlbers().fitSize([width, height], geo);
86 | const geoPath = d3.geoPath().projection(projection);
87 |
88 | // Produce and configure the hexgrid instance.
89 | const hexgrid = d3.hexgrid()
90 | .extent([width, height])
91 | .geography(geo)
92 | .projection(projection)
93 | .pathGenerator(geoPath);
94 |
95 | // Get the hexbin generator and the layout.
96 | const hex = hexgrid(myPointLocationData);
97 |
98 | // Create a colour scale.
99 | const colourScale = d3.scaleSequential(d3.interpolateViridis)
100 | .domain([...hex.grid.maxPoints].reverse());
101 |
102 | // Draw the hexes.
103 | svg.append('g')
104 | .selectAll('.hex')
105 | .data(hex.grid.layout)
106 | .enter()
107 | .append('path')
108 | .attr('class', 'hex')
109 | .attr('d', hex.hexagon())
110 | .attr('transform', d => `translate(${d.x}, ${d.y})`)
111 | .style('fill', d => !d.datapoints ? '#fff' : colourScale(d.datapoints));
112 | ```
113 |
114 | ### Breaking the example down:
115 |
116 | First, we create an `SVG` element. Let's assume our geography represents mainland US and comes in as a geoJSON called `geo`. We use an Albers projection to fit our SVG and finally get the appropriate path generator.
117 |
118 | ```
119 | const svg = d3.select('body')
120 | .append('svg')
121 | .attr(width, 'width')
122 | .attr('height, 'height');
123 |
124 | const projection = d3.geoAlbers().fitSize([width, height], geo);
125 | const geoPath = d3.geoPath().projection(projection);
126 | ```
127 |
128 | Next, we use `d3.hexgrid()` to produce a _hexgrid_ instance we creatively call `hexgrid`. We immediately configure it by passing in the extent, the GeoJSON, the projection and the path-generator.
129 |
130 | ```
131 | const hexgrid = d3.hexgrid()
132 | .extent([width, height])
133 | .geography(geo)
134 | .projection(projection)
135 | .pathGenerator(geoPath);
136 | ```
137 |
138 | Now we can call our _hexgrid_ instance passing in the data.
139 |
140 | ```
141 | const hex = hexgrid(myPointLocationData);
142 | ```
143 |
144 | This will return a hexbin generator as [`d3.hexbin()`](https://github.com/d3/d3-hexbin) does, augmented with an additional object called `grid`, which exposes the following properties:
145 |
146 | 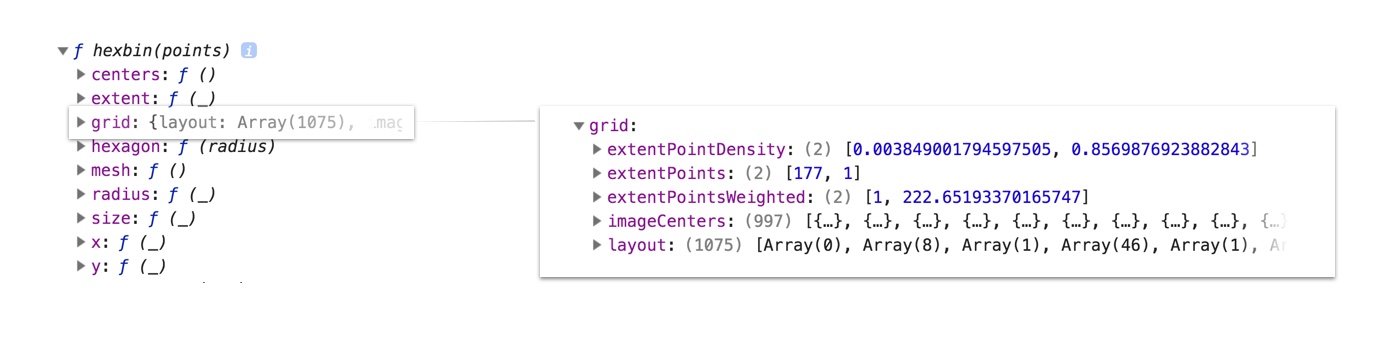
147 |
148 | - `imageCenters` is an array of objects exposing at least the _x_, _y_ hexagon centre coordinates of the hexgrid in screen space.
149 |
150 | - `layout` is an array of arrays, each sub-array representing a hexagon in the grid. Each sub-array holds all point locations per hexagon in an object exposing at least _x_ and _y_ pixel coordinates as well as aggregate values. Here's an example hexagon layout sub-array with three point locations (or _datapoints_):
151 |
152 | 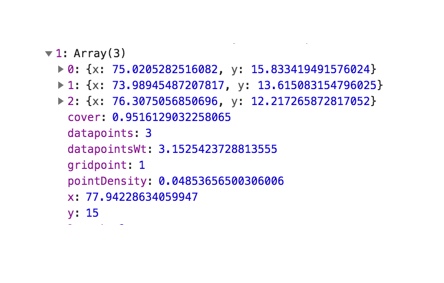
153 |
154 | The aggregate values per hexagon are:
155 |
156 | - `cover` is the percentage of this hexagon's area within the geography expressed as a number between 0 and 1.
157 | - `datapoints` is the number of points binned in the hexagon.
158 | - `datapointsWt` is the number of points weighted by the inverse cover.
159 | - `pointDensity` is the hexagon's point density.
160 | - `gridpoint` marks the hexagon as part of the initial hexgrid. This allows you to identify hexagons added by the data. Imprecise latitude and longitude data values can lead to the generation of hexagons just outside the hexgrid. _d3.hexgrid_ will still capture and produce them. But you can spot and treat them by filtering for `gridpoint === 0`.
161 | - `x` and `y` are the hexagon centre positions in pixel coordinates.
162 |
163 | - `extentPoints` is the extent of point location counts over all hexagons in the form _[min number of points, max number of points]_.
164 | - `extentPointsWeighted` is the extent of point location counts weighted by their cover over all hexagons in the form _[min number of weighted points, max number of weighted points]_.
165 | - `extentPointDensity` is the extent of cover adjusted point density over all hexagons in the form _[min point density, max point density]_.
166 |
167 | These extents can be used to set a colour scale domain when encoding number of points or point density.
168 |
169 | Working with points, for example, we might want to create the following colour scale:
170 |
171 | ```
172 | const colourScale = d3.scaleSequential(d3.interpolateViridis)
173 | .domain([...hex.grid.maxPoints].reverse());
174 | ```
175 |
176 | Here, we decide to encode the number of points per hexagon as colours along the spectrum of the [Viridis colour map](https://github.com/d3/d3-scale-chromatic#interpolateViridis) and create an appropriate colour scale. We reverse the extent (without modifying the original array) as we want to map the maximum value to the darkest colour, which the Viridis colour space starts with.
177 |
178 | Finally, we build the visual:
179 |
180 | ```
181 | svg.append('g')
182 | .selectAll('.hex')
183 | .data(hex.grid.layout)
184 | .enter()
185 | .append('path')
186 | .attr('class', 'hex')
187 | .attr('d', hexgrid.hexagon())
188 | .attr('transform', d => `translate(${d.x}, ${d.y})`)
189 | .style('fill', d => !d.datapoints ? '#fff' : colourScale(d.datapoints));
190 | ```
191 |
192 | We use the `hex.grid.layout` to produce as many path's as there are hexagons—as we would with `d3.hexbin()`—now, however, making sure we have as many hexagons to cover our entire GeoJSON polygon. We draw each hexagon with with `hexgrid.hexagon()` and `translate` them into place. Lastly, we give our empty hexagons (`!d.datapoints`) a white fill and colour encode all other hexagons depending on their number of `datapoints`.
193 |
194 | ## API Reference
195 |
196 | # d3.hexgrid()
197 |
198 | Constructs a hexgrid generator called _hexgrid_ in the following. To be configured before calling it with the data you plan to visualise.
199 |
200 | # _hexgrid_(_data_[, _names_])
201 |
202 | Generates a hexbin generator augmented with a `grid` property, exposing the hexagon layout data as well as extents for point and point density measures. [See above for the `grid` object's properties](#grid-object). Optionally _names_ can be an array of strings, listing properties you would like to pass through from your original data to the grid layout.
203 |
204 | Assuming you want to visualise restaurants on a map and have a restaurant dataset containing the variables `website` and `opening_times` you can say:
205 |
206 | ```
207 | hexgrid(restaurantData, ['website', 'opening_times'])
208 | ```
209 |
210 | As a result, objects in the _hexgrid_.grid.layout array will contain the two variables in addition to the default _x_ and _y_ coordinates:
211 |
212 | 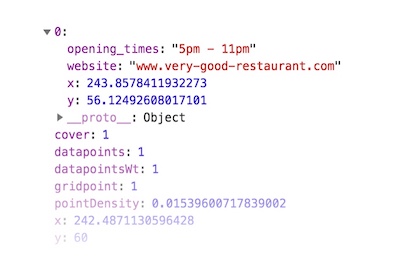
213 |
214 | # _hexgrid._extent([_extent_])
215 |
216 | _Required_. Sets the extent of the hexbin generator produced internally. _extent_ can come as either a 2D array specifying top left start and bottom right end point [[x₀, y₀], [x₁, y₁]]. Alternatively _extent_ can be specified as an array of just width and height [x₁, y₁] with the top-left corner assumed to be [0, 0]. The following two statements are equivalent:
217 |
218 | ```
219 | hexgrid.extent([[0, 0], [width, height]]);
220 | hexgrid.extent([width, height]);
221 | ```
222 |
223 | # _hexgrid._geography([_object_])
224 |
225 | _Required_. _object_ represents the base polygon for the hexgrid in GeoJSON format. If you were to project a hexgrid onto Bhutan, _object_ would be a GeoJSON object of Bhutan.
226 |
227 | # _hexgrid._projection([_projection_])
228 |
229 | _Required_. _projection_ is the projection function for the previously defined [_geography_](#hex-geography) commonly specified within the bounds of [_extent_](#hex-extent). See [here](https://github.com/d3/d3-geo) or [here](https://github.com/d3/d3-geo-projection) for a large pond of projection functions.
230 |
231 | # _hexgrid._pathGenerator([_path_])
232 |
233 | _Required_. _path_ is the path generator to produce the drawing instructions of the previously defined [_geography_](#hex-geography) based on the also previously defined [_projection_](#hex-projection).
234 |
235 | # _hexgrid._hexRadius([_radius_[, _unit_]])
236 |
237 | _Optional_. The desired hexagon radius in pixel. Defaults to 4. _unit_ can optionally be specified if the radius should be expressed not in pixel but in either _"miles"_ or _"kilometres"_. The following is valid configuration:
238 |
239 | ```js
240 | .hexRadius(50, 'm') // or 'miles'
241 | .hexRadius(50, 'km') // or 'kilometres' or 'kilometers'
242 | ```
243 |
244 | The conversion is based on a [`geoCircle`](https://github.com/d3/d3-geo#geoCircle) projected in the center of the drawing area. As such the conversion can only be a proxy, however, a good one if an equal area projection is used to minimise area distortions across the geography.
245 |
246 | # _hexgrid._edgePrecision([_precision_])
247 |
248 | _Optional_. The edge precision sets the size of the internally produced canvas to identify which area of the edge hexagon is covered by the [_geography_](#hex-geography). The higher the precision, the better the pixel detection at the hexagon edges. Values can be larger than 1 for small visuals. Values smaller than 0.3 will be coerced to 0.3. The default value of 1 will be fine for most purposes.
249 |
250 | # _hexgrid._gridExtend([_extension_])
251 |
252 | _Optional_. _gridExtend_ controls the size of the base geography. _gridExtend_ allows you to "inflate" your hexgrid and can be used to draw more hexagons around the edges that otherwise would not be drawn.
253 |
254 | 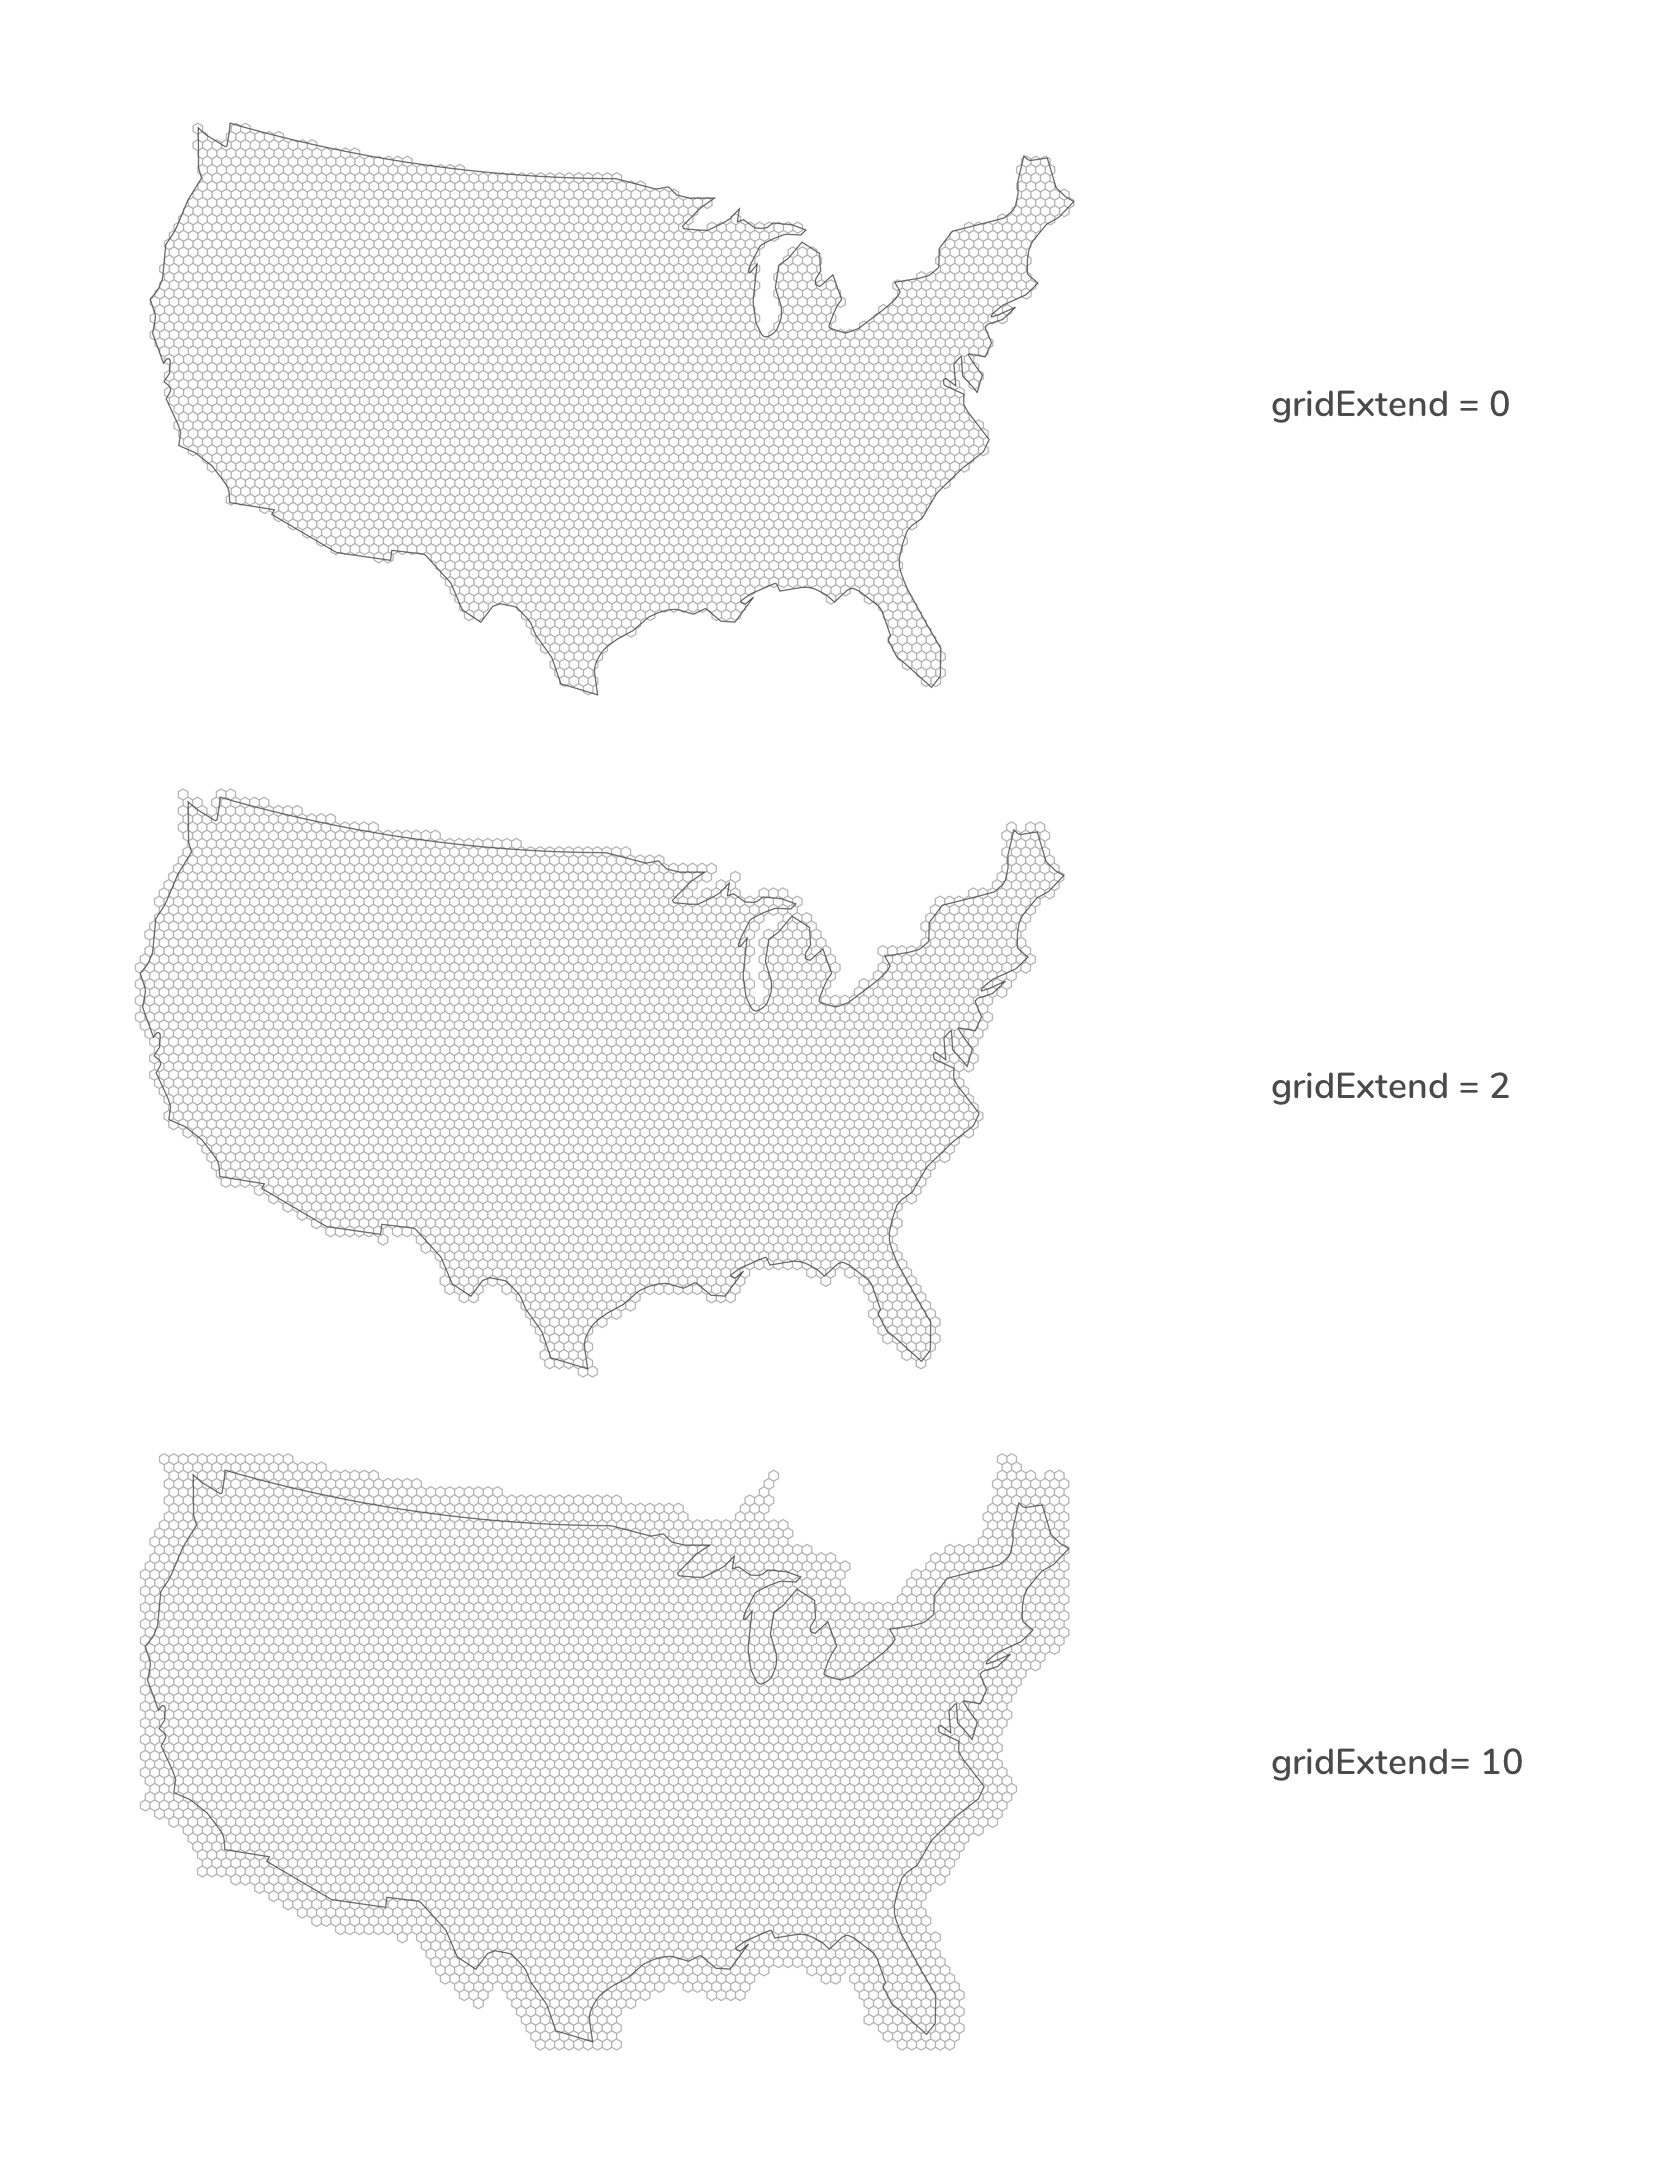
255 |
256 | _gridExtend_ is measured in units of _hexRadius_. For example, a _gridExtend_ value of 2 would extend the grid by _2 × hexRadius_ pixel.
257 |
258 | # _hexgrid._geoKeys([_keys_])
259 |
260 | _Optional_. _d3.hexgrid_ will try to guess the key names for longitude and latitude variables in your data. The following case-insensitive key names will be sniffed out:
261 |
262 | - _longitude_, _long_, _lon_, _lng_, _lambda_ as well as
263 | - _latitude_, _lat_ and _phi_.
264 |
265 | If you choose other names like for example _upDown_ and _leftRight_, you
266 | have to specify them as hexgrid.geokeys(['upDown', 'leftRight']) with the first element representing longitude and the second latitude.
267 |
268 | Don't call your geo keys `x` or `y` or otherwise include `x` and/or `y` keys in your passed in user variables as they are reserved keys for the pixel coordinates of the layout.
269 |
270 | ### Helper functions
271 |
272 | The following functions can be helpful to filter out point location data that lie beyond the base geography.
273 |
274 | # d3.geoPolygon([_geo_, _projection_])
275 |
276 | Transforms a GeoJSON geography into a Polygon or MultiPolygon. _geo_ is a GeoJSON of the base geography. _projection_ is the applied projection function.
277 |
278 | # d3.polygonPoints([_data_, _polygon_])
279 |
280 | _data_ is an array of point location objects with _x_ and _y_ properties in screen space. _polygon_ is a Polygon or MultiPolygon as produced by [`d3.geoPolygon()`](#d3-geoPolygon). Returns a new array of point location objects exclusively within the bounds of the specified _polygon_.
281 |
282 | If you had a point location dataset of all post boxes in the world, but you only want to visualise UK post boxes you can use these helper functions to produce a dataset with only UK post boxes like so:
283 |
284 | ```
285 | const polygonUk = d3.geoPolygon(ukGeo, projectionUk);
286 | const postboxesUk = d3.polygonPoints(postboxesWorld, polygonUk);
287 | ```
288 |
289 | If you plan to use the d3-hexgrid produced extents in a color scale, it is suggested to focus your dataset on your base geography. If produced with data beyond your base geography, the extents might not be meaningful.
290 |
291 | ## General notes on hexagonal binning
292 |
293 | Hexagons are often ideal for binning point location data as they are the shape closest to circles that can be regularly tessellated. As a result, point distributions binned by a hexagon are [relatively spike-less](https://beta.observablehq.com/@larsvers/making-a-tesselated-hexbin-map) and [neighbouring hexagons are equidistant](https://uber.github.io/h3/#/documentation/overview/use-cases).
294 |
295 | While being the right choice in many cases, two notes should be considered when using hexagonal binning—or any point location binning for that matter:
296 |
297 | #### Use equal area projections for the base geography.
298 |
299 | The world is [something like a sphere](https://en.wikipedia.org/wiki/Spheroid) and there are numerous ways to project a sphere onto a 2D plane. The projection used has an important effect on the analysis. Any tessellation normalises space to equally sized units—hexagons in this case—which invites the reader to assume that each unit covers the same area. However, some projections, like the ubiquitous Mercator projection, will distort area increasingly towards the poles:
300 |
301 | 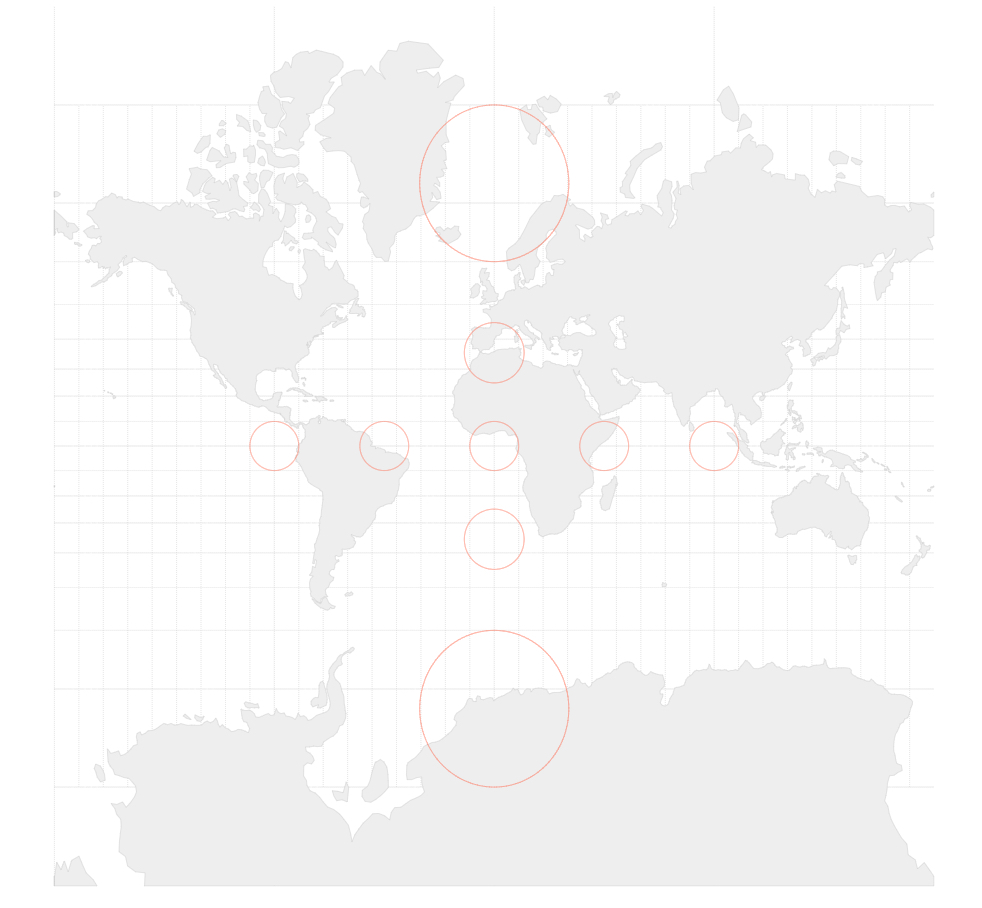
302 |
303 | Source: [D3 in depth](http://d3indepth.com/geographic/) by [Peter Cook](http://animateddata.co.uk/)
304 |
305 | All red circles on above map are of the same area. As a result, tessellating a Mercator world map with hexagons will produce many more hexagons per square mile in Norway compared to Brazil, for example.
306 |
307 | [Equal area projections](https://github.com/d3/d3-geo-projection#geoConicEqualArea) will help to avoid this problem to a large extent.
308 |
309 | #### Consciously choose the hexagon radius size.
310 |
311 | Location binning is susceptible to the [Modifiable Areal Unit Problem](https://blog.cartographica.com/blog/2011/5/19/the-modifiable-areal-unit-problem-in-gis.html). The MAUP—or more specifically the _zonal_ MAUP—states that a change in size of the analysis units can lead to different results. In other words, changing the hexagons’ size can produce significantly different patterns—although the views across different sizes share the same data. Awareness is the only corrective to the MAUP. As such, it is recommended to test a few unit sizes before consciously settling for one, stating the reasons why and/or allowing the readers to see or chose different hexagon sizes.
312 |
313 | ## Thanks!
314 |
315 | A big thanks to [Philippe Rivière](https://illisible.net/philippe-riviere) for bringing the grid layout algorithm on track and sparking the idea for the edge cover calculation. This plug-in would look different and be significantly less performant without his elegant ideas.
316 |
317 | For a deeper dive read [Amit Patel](http://www-cs-students.stanford.edu/~amitp/)'s (aka [reblobgames](https://www.redblobgames.com/)) seminal [hexagon tutorial](http://www.redblobgames.com/grids/hexagons/). The best to find out there. Also see the great things Uber's been doing with [H3](https://uber.github.io/h3/#/), which in many ways goes far beyond this plugin.
318 |
--------------------------------------------------------------------------------
/index.js:
--------------------------------------------------------------------------------
1 | export { default as hexgrid } from "./src/hexgrid";
2 | export { default as geoPolygon } from "./src/getBoundaryPoints";
3 | export { default as polygonPoints } from "./src/getPolygonPoints";
--------------------------------------------------------------------------------
/package.json:
--------------------------------------------------------------------------------
1 | {
2 | "name": "d3-hexgrid",
3 | "version": "0.3.1",
4 | "description": "Regular hexagon tessellation with edge cover detection.",
5 | "keywords": [
6 | "d3",
7 | "d3-module",
8 | "d3-hexgrid"
9 | ],
10 | "homepage": "https://github.com/larsvers/d3-hexgrid",
11 | "author": {
12 | "name": "Lars Verspohl",
13 | "url": "https://www.datamake.io"
14 | },
15 | "license": "BSD-3-Clause",
16 | "main": "dist/d3-hexgrid.js",
17 | "module": "index",
18 | "jsnext:main": "index",
19 | "unpkg": "dist/d3-hexgrid.min.js",
20 | "browserslist": "> 0.25%, not dead",
21 | "repository": {
22 | "type": "git",
23 | "url": "https://github.com/larsvers/d3-hexgrid.git"
24 | },
25 | "scripts": {
26 | "lint": "eslint src/",
27 | "build": "rm -rf dist && mkdir dist && rollup --config rollup.config.js",
28 | "watch": "rollup --config rollup.config.js --watch",
29 | "pretest": "npm run build",
30 | "test": "tape 'test/**/*.test.js' | tap-spec",
31 | "test:simple": "tape 'test/**/*.test.js'",
32 | "prepare": "npm run test && uglifyjs dist/d3-hexgrid.js -c -m -o dist/d3-hexgrid.min.js",
33 | "postpublish": "zip -j dist/d3-hexgrid.zip -- LICENSE README.md dist/d3-hexgrid.js dist/d3-hexgrid.min.js"
34 | },
35 | "devDependencies": {
36 | "@babel/core": "^7.9.6",
37 | "@babel/plugin-transform-runtime": "^7.9.6",
38 | "@babel/preset-env": "^7.9.6",
39 | "@rollup/plugin-babel": "^5.0.0",
40 | "@rollup/plugin-commonjs": "^11.1.0",
41 | "@rollup/plugin-node-resolve": "^7.1.3",
42 | "canvas": "^2.6.1",
43 | "eslint": "^8.33.0",
44 | "eslint-config-airbnb": "^17.0.0",
45 | "eslint-config-airbnb-base": "^13.0.0",
46 | "eslint-config-prettier": "^2.9.0",
47 | "eslint-plugin-import": "^2.13.0",
48 | "eslint-plugin-jsx-a11y": "^6.1.1",
49 | "eslint-plugin-react": "^7.10.0",
50 | "jsdom": "^16.2.2",
51 | "rollup": "^2.8",
52 | "rollup-plugin-license": "^2.0.0",
53 | "tap-spec": "^5.0.0",
54 | "tape": "^4.9",
55 | "topojson": "^3.0",
56 | "uglify-js": "^3.4"
57 | },
58 | "dependencies": {
59 | "@babel/runtime": "^7.9.6",
60 | "d3-array": "^1.2",
61 | "d3-geo": "^1.10",
62 | "d3-hexbin": "^0.2",
63 | "d3-polygon": "^1.0"
64 | }
65 | }
66 |
--------------------------------------------------------------------------------
/rollup.config.js:
--------------------------------------------------------------------------------
1 | import babel from '@rollup/plugin-babel';
2 | import resolve from '@rollup/plugin-node-resolve';
3 | import commonjs from '@rollup/plugin-commonjs';
4 | import license from 'rollup-plugin-license';
5 |
6 | const globals = {
7 | 'd3-array': 'd3',
8 | 'd3-geo': 'd3',
9 | 'd3-hexbin': 'd3',
10 | 'd3-polygon': 'd3'
11 | }
12 |
13 | export default {
14 | external: ['@babel/runtime'],
15 | input: 'index.js',
16 | output: {
17 | file: 'dist/d3-hexgrid.js',
18 | format: 'umd',
19 | name: 'd3',
20 | globals: globals,
21 | },
22 | plugins: [
23 | resolve(),
24 | commonjs(),
25 | babel({
26 | exclude: 'node_modules/**',
27 | babelHelpers: 'runtime'
28 | }),
29 | license({
30 | banner: {
31 | content: `d3-hexgrid plugin v<%= pkg.version %>. <%= pkg.repository.url %>.`,
32 | commentStyle: 'ignored',
33 | },
34 | }),
35 | ]
36 | };
--------------------------------------------------------------------------------
/src/addCover.js:
--------------------------------------------------------------------------------
1 | /**
2 | * Adds the updated cover value to each center datum.
3 | * @param {Array} centers All center objects including the edge centers.
4 | * @param {Array} edges Only the edge center objects.
5 | * @return {Array} The updated center objects.
6 | */
7 | export default function(centers, edges) {
8 | const centersUpdated = centers.slice(0);
9 |
10 | for (let i = 0; i < edges.length; i++) {
11 | const edge = edges[i];
12 | // Assuming the centers array id's are
13 | // consistent with the edge id's.
14 | centersUpdated[edge.id].cover = edge.cover;
15 | }
16 |
17 | return centersUpdated;
18 | }
19 |
--------------------------------------------------------------------------------
/src/convertUnitRadius.js:
--------------------------------------------------------------------------------
1 | import { geoCircle } from 'd3-geo';
2 | import { getPixelRadius } from './utils';
3 |
4 | /**
5 | * Sniffs the unit and converts to either "m" or "km".
6 | * @param {string} unit The user given unit.
7 | * @return {string} The clean unit string.
8 | */
9 | function getUnitString(unit) {
10 | let unitLower = unit.toLowerCase();
11 |
12 | if (unitLower === 'm' || unitLower === 'km') {
13 | return unitLower;
14 | }
15 | if (
16 | unitLower === 'kilometres' ||
17 | unitLower === 'kilometre' ||
18 | unitLower === 'kilometers' ||
19 | unitLower === 'kilometer'
20 | ) {
21 | unitLower = 'km';
22 | } else if (unitLower === 'miles' || unitLower === 'mile') {
23 | unitLower = 'm';
24 | } else {
25 | throw new Error(
26 | 'Please provide the unit identifier as either "km" for kilometres or "m" for miles'
27 | );
28 | }
29 |
30 | return unitLower;
31 | }
32 |
33 | /**
34 | *
35 | * @param {number} radiusDistance The user given distance in either miles or km.
36 | * @param {string} distanceUnit The user chosen distance unit (miles or km).
37 | * @param {function} projection The D3 projection function.
38 | * @param {Array} center The center coordinates of the drawing area.
39 | * @return {Object} The geo circle, the radius in degrees and in pixel.
40 | */
41 | export default function(radiusDistance, distanceUnit, projection, center) {
42 | // Get radius in degrees
43 | const unit = getUnitString(distanceUnit);
44 | const RADIUS_EARTH = unit === 'm' ? 3959 : 6371;
45 | const radiusRadians = radiusDistance / RADIUS_EARTH;
46 | const radiusDegrees = radiusRadians * (180 / Math.PI);
47 |
48 | // Get geo circle data.
49 | const circlePolygon = geoCircle()
50 | .radius(radiusDegrees)
51 | .center(projection.invert(center));
52 |
53 | // Get radius in pixel.
54 | const radiusPixel = getPixelRadius(circlePolygon(), projection);
55 |
56 | return { circlePolygon, radiusDegrees, radiusPixel };
57 | }
58 |
--------------------------------------------------------------------------------
/src/getBoundaryPoints.js:
--------------------------------------------------------------------------------
1 | /**
2 | * Produce an array or arrays with all polygonal boundary points.
3 | * @param {Object} geo The GeoJSON FeatureCollection.
4 | * @param {function} projection The D3 projection function.
5 | * @return {Array} Array of arrays holding the boundary points
6 | * for each area.
7 | */
8 | export default function(geo, projection) {
9 | let boundaryPoints = [];
10 | let collection;
11 |
12 | // 1) Try for geometry type and get their contents.
13 |
14 | try {
15 | if (geo.type === 'FeatureCollection') {
16 | collection = geo.features;
17 | } else if (geo.type === 'GeometryCollection') {
18 | collection = geo.geometries;
19 | } else {
20 | throw new Error(
21 | 'Geometry type not supported. Please feed me a "FeatureCollection" or a "GeometryCollection".'
22 | );
23 | }
24 | } catch (err) {
25 | throw new Error(err);
26 | }
27 |
28 | // 2) Retrieve the boundary points.
29 |
30 | for (let i = 0; i < collection.length; i++) {
31 | // Crack open the geometry to get the coordinate holder object.
32 | const geom =
33 | geo.type === 'FeatureCollection'
34 | ? geo.features[i].geometry
35 | : geo.geometries[i];
36 |
37 | // Different ways to access coordinates in a FeatureCollection:
38 |
39 | // Polygons: coordinates[Array[coordinates]]
40 | if (geom && geom.type === 'Polygon') {
41 | // Correcting for longitudes +180°.
42 | const polygon = geom.coordinates[0].map(coord =>
43 | projection(coord[0] > 180 ? [180, coord[1]] : coord)
44 | );
45 | boundaryPoints.push(polygon);
46 |
47 | // MultiPolygons: coordinates[Polygons[Array[[coordinates]]]]
48 | } else if (geom && geom.type === 'MultiPolygon') {
49 | // Correcting for longitudes +180°.
50 | const polygons = geom.coordinates.map(multi =>
51 | multi[0].map(coord =>
52 | projection(coord[0] > 180 ? [180, coord[1]] : coord)
53 | )
54 | );
55 | boundaryPoints = boundaryPoints.concat(polygons);
56 | } else {
57 | continue;
58 | }
59 | }
60 |
61 | return boundaryPoints;
62 | }
63 |
--------------------------------------------------------------------------------
/src/getCover.js:
--------------------------------------------------------------------------------
1 | // Debug
2 | // import { pointyHexCorner, hexDraw } from './utils';
3 |
4 | /**
5 | * Calculates the cover for a single hexagon by
6 | * overlaying the map at the given position.
7 | * @param {Object} edge The datum representing the edge center.
8 | * @param {Object} tools The image and drawing tools
9 | * to create the overlap image.
10 | * @param {number} precision The scaling factor for the image
11 | * at the given hex radius.
12 | * @param {number} r The hex radius. Required only for debugging.
13 | * @return {Object} The cover updated egde center datum.
14 | */
15 | export default function(edge, tools, precision, r) {
16 | const { canvasHex, canvasImage, contextMix } = tools;
17 | const w = canvasHex.width;
18 | const h = canvasHex.height;
19 |
20 | // // Debug ↓ --------------------------------------------------------------
21 |
22 | // // const r = 7;
23 | // const hexCorners = Array(7);
24 | // for (let i = 0; i < 7; i++) {
25 | // const corner = pointyHexCorner({ x: 0, y: 0 }, r * precision, i);
26 | // hexCorners[i] = corner;
27 | // }
28 |
29 | // const contextImage = canvasImage.getContext('2d');
30 |
31 | // // Centers.
32 | // contextImage.beginPath();
33 | // contextImage.arc(edge.x, edge.y, 2, 0, 2*Math.PI)
34 | // contextImage.fillStyle = '#000'
35 | // contextImage.fill();
36 |
37 | // // Hexagons
38 | // hexDraw(contextImage, hexCorners, 'red', 'fill')
39 |
40 | // // Debug ↑ --------------------------------------------------------------
41 |
42 | // 1) Concoct the specific edge hexagon image and get the pixel data.
43 |
44 | // Draw hex image.
45 | contextMix.drawImage(canvasHex, 0, 0);
46 |
47 | // Set the composite type in preperation for the image overlap.
48 | contextMix.globalCompositeOperation = 'source-atop';
49 |
50 | // Draw Map at correct position.
51 | contextMix.drawImage(
52 | canvasImage,
53 | -edge.x * precision + w / 2,
54 | -edge.y * precision + h / 2
55 | );
56 |
57 | // Get the image data.
58 | const imageData = contextMix.getImageData(0, 0, w, h).data;
59 |
60 | // // Clear the canvas and reset the composite type in preperation
61 | // // for the next overlap (http://bit.do/ekDx4).
62 | // contextMix.clearRect(0,0,w,h);
63 | // contextMix.globalCompositeOperation = 'source-over';
64 |
65 | // 2) Calculate the image cover per edge hexagon.
66 |
67 | // Init area count variables.
68 | let hexArea = 0;
69 | let imgArea = 0;
70 |
71 | // Find filled pixel with some alpha (>=100)
72 | // and identify image part.
73 | for (let pixelIndex = 3; pixelIndex < imageData.length; pixelIndex += 4) {
74 | const alpha = imageData[pixelIndex];
75 | if (alpha < 100) {
76 | continue;
77 | } else {
78 | const red = imageData[pixelIndex - 3];
79 | const blue = imageData[pixelIndex - 1];
80 | red > blue ? hexArea++ : imgArea++;
81 | }
82 | }
83 |
84 | // Calculate cover and add to edge hexagon.
85 | const imgRatio = imgArea / (hexArea + imgArea);
86 | const updatedEdge = Object.assign({}, edge);
87 | updatedEdge.cover = imgRatio;
88 |
89 | // Clear the canvas and reset the composite type in preperation
90 | // for the next overlap (http://bit.do/ekDx4).
91 | contextMix.clearRect(0, 0, w, h);
92 | contextMix.globalCompositeOperation = 'source-over';
93 |
94 | return updatedEdge;
95 | }
96 |
--------------------------------------------------------------------------------
/src/getEdgeCenters.js:
--------------------------------------------------------------------------------
1 | /**
2 | * Checks for each center if it covers a pixel in the image.
3 | * @param {Array} centers Hexagon centers covering the
4 | * breadth of the drawing canvas.
5 | * @param {Uint8ClampedArray} image Pixels indicating fill.
6 | * @param {Array} size Width and height of drawing canvas.
7 | * @param {number} precision Hidden canvas ratio of the
8 | * drawing canvas.
9 | * @return {Array} Hexagon centers covering the
10 | * displayed object only.
11 | */
12 | // export default function(centers, image, size, precision) {
13 | export default function(centers, image, size) {
14 | const w = size[0];
15 |
16 | return centers.filter(el => image[Math.floor(el.x) + w * Math.floor(el.y)]);
17 | }
18 |
--------------------------------------------------------------------------------
/src/getEdgeTools.js:
--------------------------------------------------------------------------------
1 | import { pointyHexCorner, hexDraw } from './utils';
2 |
3 | /**
4 | * Produe the canvas image of a specifically sized and scaled hexagon,
5 | * the canvas image of the desired base image as well as a context
6 | * to concoct the overlap image.
7 | * @param {number} precision Scale for single hexagon-map image.
8 | * @param {Array} size Width and height of base element.
9 | * @param {function} pathGen D3 path generator function.
10 | * @param {Object} geo GeoJSON representing the object to tesselate.
11 | * @param {number} r Hexagon radius.
12 | * @param {number} band Extension of image (factor of r).
13 | * @return {Object} The hex & geo image plus the context to use.
14 | */
15 | export default function(precision, size, pathGen, geo, r, band) {
16 | // 1) Draw a hex with the correct radius at 0, 0.
17 |
18 | // Set up canvas and context.
19 | const w = Math.sqrt(3) * r * precision;
20 | const h = r * 2 * precision;
21 | const canvasHex = document.createElement('canvas');
22 | // const canvasHex = d3.select('body').append('canvas').node()
23 | canvasHex.width = w;
24 | canvasHex.height = h;
25 | const contextHex = canvasHex.getContext('2d');
26 |
27 | // Get the hexagon's corner points.
28 | const hexCorners = Array(7);
29 | for (let i = 0; i < 7; i++) {
30 | const corner = pointyHexCorner({ x: 0, y: 0 }, r * precision, i);
31 | hexCorners[i] = corner;
32 | }
33 |
34 | // Draw the hexagon.
35 | contextHex.translate(w / 2, h / 2);
36 | hexDraw(contextHex, hexCorners, 'red', 'fill');
37 |
38 | // 2) Draw the image.
39 |
40 | // Set up the image canvas and context.
41 | const [width, height] = size;
42 | const canvasImage = document.createElement('canvas');
43 | // const canvasImage = d3.select('body').append('canvas').node();
44 | canvasImage.width = width * precision;
45 | canvasImage.height = height * precision;
46 | const contextImage = canvasImage.getContext('2d');
47 |
48 | // Set the context for the path generator for use with Canvas.
49 | pathGen.context(contextImage);
50 |
51 | // Draw the image.
52 | const gridExtentStroke = band * r;
53 |
54 | contextImage.scale(precision, precision);
55 | contextImage.beginPath();
56 | pathGen(geo);
57 | contextImage.lineWidth = gridExtentStroke;
58 | contextImage.fillStyle = 'blue';
59 | contextImage.strokeStyle = 'blue';
60 | contextImage.stroke();
61 | contextImage.fill();
62 |
63 | // Reset the pathGenerators context.
64 | pathGen.context(null);
65 |
66 | // 3) Create context to combine images;
67 |
68 | const canvasMix = document.createElement('canvas');
69 | // const canvasMix = d3.select('body').append('canvas').node()
70 | canvasMix.width = w;
71 | canvasMix.height = h;
72 | const contextMix = canvasMix.getContext('2d');
73 |
74 | return { canvasHex, canvasImage, contextMix };
75 | }
76 |
--------------------------------------------------------------------------------
/src/getImageCenters.js:
--------------------------------------------------------------------------------
1 | /**
2 | * Checks for each center if it covers a pixel in the image.
3 | * Checks only for centers that are within the bounds of width and height.
4 | * Note, this can be optimised (for loop instead of filter all).
5 | * @param {Array} centers Hexagon centers covering the
6 | * extent of the drawing canvas.
7 | * @param {Uint8ClampedArray} image Pixel alpha values indicating fill.
8 | * @param {Array} size Width and height of drawing canvas.
9 | * @param {number} precision Hidden canvas ratio of the
10 | * drawing canvas.
11 | * @return {Array} Hexagon centers covering
12 | * the displayed object.
13 | */
14 | // export default function(centers, image, size, precision) {
15 | export default function(centers, image, size) {
16 | const [w, h] = size;
17 |
18 | return centers
19 | .filter(center => {
20 | return (
21 | // Guarantee centers to be within bounds.
22 | center[0] >= 0 &&
23 | center[0] <= w &&
24 | center[1] >= 0 &&
25 | center[1] <= h &&
26 | image[Math.floor(center[0]) + Math.floor(center[1]) * Math.floor(w)]
27 | );
28 | })
29 | .map((center, i) => {
30 | return { id: i, x: center[0], y: center[1], gridpoint: 1, cover: 1 };
31 | });
32 | }
33 |
--------------------------------------------------------------------------------
/src/getImageData.js:
--------------------------------------------------------------------------------
1 | /**
2 | * Checks which pixel of the image are filled
3 | * returning pixel positions to draw hexes on.
4 | * @param {Array} size Width and height of base element.
5 | * @param {function} pathGen D3 path generator function.
6 | * @param {Object} geo GeoJSON representing the object to tesselate.
7 | * @param {number} r Hexagon radius.
8 | * @param {string} action Drawing action `fill` or `stroke`.
9 | * @param {number} band Extension of image (factor of r).
10 | * @return {Uint8ClampedArray} Array of A values (from RGBA) per pixel.
11 | */
12 | // export default function(size, precision, pathGen, geo, r, action, band) {
13 | export default function(size, pathGen, geo, r, action, band) {
14 | const gridExtentStroke = band * r;
15 | const edgeBand = gridExtentStroke + 2 * r;
16 |
17 | // For debugging; append the canvas to the body and just draw on it.
18 | const canvas = document.createElement('canvas');
19 | // const canvas = d3.select('body').append('canvas').node();
20 | [canvas.width, canvas.height] = size;
21 |
22 | const context = canvas.getContext('2d');
23 |
24 | const canvasPath = pathGen.context(context);
25 |
26 | // Draw.
27 | context.beginPath();
28 | canvasPath(geo);
29 | if (action === 'fill') {
30 | // debugger
31 | if (band) {
32 | context.lineWidth = gridExtentStroke;
33 | context.stroke();
34 | }
35 | context.fill();
36 | } else if (action === 'stroke') {
37 | context.lineWidth = edgeBand;
38 | context.stroke();
39 | }
40 |
41 | // Remove side effect of setting the path's context.
42 | pathGen.context(null);
43 |
44 | // Get the pixel rgba data but only keep the 4th value (alpha).
45 | const imgData = context.getImageData(0, 0, size[0], size[1]).data;
46 | return imgData.filter((d, i) => i % 4 === 3);
47 | }
48 |
--------------------------------------------------------------------------------
/src/getPolygonPoints.js:
--------------------------------------------------------------------------------
1 | import { polygonContains } from 'd3-polygon';
2 |
3 | /**
4 | * Produce an array or arrays with all points within a polygonial area/feature.
5 | * @param {Array} gridPoints All grid points.
6 | * @param {Array} boundaryPoints Array of arrays, one for each area,
7 | * holding the area's boundary points.
8 | * @return {Array} Array of grid points within each area.
9 | * Sorted ascendingly by x and y.
10 | */
11 | export default function(gridPoints, boundaryPoints) {
12 | return boundaryPoints
13 | .reduce((result, boundary) => {
14 | const areaPoints = gridPoints.filter(point =>
15 | polygonContains(boundary, [point.x, point.y])
16 | );
17 |
18 | return result.concat(areaPoints);
19 | }, [])
20 | .sort((a, b) => a.x - b.x || a.y - b.y);
21 | }
22 |
--------------------------------------------------------------------------------
/src/hexgrid.js:
--------------------------------------------------------------------------------
1 | import { expandExtent, convertToMin } from './utils';
2 |
3 | import convertUnitRadius from './convertUnitRadius';
4 |
5 | import setHexGenerator from './setHexGenerator';
6 | import getImageData from './getImageData';
7 | import getImageCenters from './getImageCenters';
8 |
9 | import getEdgeCenters from './getEdgeCenters';
10 | import getEdgeTools from './getEdgeTools';
11 | import getCover from './getCover';
12 | import addCover from './addCover';
13 |
14 | import prepUserData from './prepUserData';
15 | import rollupPoints from './rollupPoints';
16 | import rollupDensity from './rollupDensity';
17 |
18 | /**
19 | * Main hexgrid component.
20 | */
21 | export default function() {
22 | // Init exposed.
23 | let extent;
24 | let geography;
25 | let projection;
26 | let pathGenerator;
27 | let hexRadius = 4;
28 | let hexRadiusUnit = null;
29 | let hexRadiusInUnits = null;
30 | let edgePrecision = 1;
31 | let gridExtend = 0;
32 | let geoKeys;
33 |
34 | /**
35 | * hexgrid function producing the layout.
36 | * @param {Array} userData Datapoints to visualise.
37 | * One datum represents one location.
38 | * @param {Array} userVariables Optional array of object keys to be
39 | * included in the final layout hex data.
40 | * @return {function/Object} Augmented hexbin generator.
41 | */
42 | const hexgrid = function(userData, userVariables) {
43 | // Convert to pixel radius if provided in units.
44 | if (hexRadiusInUnits) {
45 | const conversion = convertUnitRadius(
46 | hexRadiusInUnits,
47 | hexRadiusUnit,
48 | projection,
49 | extent[1].map(d => d / 2)
50 | );
51 | hexRadius = conversion.radiusPixel;
52 | }
53 |
54 | // Set hex radius to nearest full- or half-pixel.
55 | hexRadius = Math.round(hexRadius * 2) / 2;
56 |
57 | // Identify hexagons to draw.
58 | const hexbin = setHexGenerator(extent, hexRadius);
59 |
60 | const size = hexbin.size();
61 |
62 | const centers = hexbin.centers();
63 |
64 | const imageData = getImageData(
65 | size,
66 | pathGenerator,
67 | geography,
68 | hexRadius,
69 | 'fill',
70 | gridExtend
71 | );
72 |
73 | let imageCenters = getImageCenters(centers, imageData, size);
74 |
75 | // Identify edge hexagons and calculate image overlap ratio.
76 | const imageDataEdges = getImageData(
77 | size,
78 | pathGenerator,
79 | geography,
80 | hexRadius,
81 | 'stroke',
82 | gridExtend
83 | );
84 |
85 | const imageEdges = getEdgeCenters(imageCenters, imageDataEdges, size);
86 |
87 | const edgeTools = getEdgeTools(
88 | edgePrecision,
89 | size,
90 | pathGenerator,
91 | geography,
92 | hexRadius,
93 | gridExtend
94 | );
95 |
96 | const imageEdgesCover = imageEdges.map(d =>
97 | getCover(d, edgeTools, edgePrecision, hexRadius)
98 | );
99 |
100 | imageCenters = addCover(imageCenters, imageEdgesCover);
101 |
102 | // Prepare user data to augment layout.
103 | const userDataPrepped = prepUserData(
104 | userData,
105 | projection,
106 | geoKeys,
107 | userVariables
108 | );
109 |
110 | const mergedData = imageCenters.concat(userDataPrepped);
111 |
112 | const hexPoints = hexbin(mergedData);
113 |
114 | let hexData = rollupPoints(hexPoints);
115 |
116 | hexData = rollupDensity(hexData, hexRadius);
117 |
118 | // Augment hexbin generator.
119 | hexbin.grid = {};
120 | hexbin.grid.layout = hexData.layout;
121 | hexbin.grid.imageCenters = imageCenters;
122 | hexbin.grid.extentPoints = hexData.extentPoints;
123 | hexbin.grid.extentPointsWeighted = hexData.extentPointsWeighted;
124 | hexbin.grid.extentPointDensity = hexData.extentPointDensity;
125 |
126 | return hexbin;
127 | };
128 |
129 | // Exposed.
130 | hexgrid.extent = function(_) {
131 | return arguments.length ? ((extent = expandExtent(_)), hexgrid) : extent;
132 | };
133 |
134 | hexgrid.geography = function(_) {
135 | return arguments.length ? ((geography = _), hexgrid) : geography;
136 | };
137 |
138 | hexgrid.projection = function(_) {
139 | return arguments.length ? ((projection = _), hexgrid) : projection;
140 | };
141 |
142 | hexgrid.pathGenerator = function(_) {
143 | return arguments.length ? ((pathGenerator = _), hexgrid) : pathGenerator;
144 | };
145 |
146 | hexgrid.hexRadius = function(...args) {
147 | if (!args.length) {
148 | return hexRadiusUnit
149 | ? { radius: hexRadius, unit: hexRadiusUnit }
150 | : hexRadius;
151 | }
152 | if (args.length === 1) {
153 | return (hexRadius = args[0]), hexgrid;
154 | }
155 | if (args.length === 2) {
156 | [hexRadiusInUnits, hexRadiusUnit] = args;
157 | return hexgrid;
158 | }
159 |
160 | throw new Error(
161 | 'Please pass a numeric radius and optionally a string distance unit ("miles" or "kilometres") to `.hexradius()`'
162 | );
163 | };
164 |
165 | hexgrid.edgePrecision = function(_) {
166 | return arguments.length
167 | ? ((edgePrecision = convertToMin(_, 'Edge precision', 0.3)), hexgrid)
168 | : edgePrecision;
169 | };
170 |
171 | hexgrid.gridExtend = function(_) {
172 | return arguments.length
173 | ? ((gridExtend = convertToMin(_, 'Edge band', 0)), hexgrid)
174 | : gridExtend;
175 | };
176 |
177 | hexgrid.geoKeys = function(_) {
178 | return arguments.length ? ((geoKeys = _), hexgrid) : geoKeys;
179 | };
180 |
181 | return hexgrid;
182 | }
183 |
--------------------------------------------------------------------------------
/src/prepUserData.js:
--------------------------------------------------------------------------------
1 | /**
2 | * Defines the data's latitude and longitude keys.
3 | * @param {Array} lonLat User defined array of geo keys.
4 | * @param {Array} data User defined data.
5 | * @return {Array} Array of geo keys.
6 | */
7 | function checkGeoKeyNames(lonLat, data) {
8 | if (lonLat && lonLat.length === 2) return lonLat;
9 |
10 | const lonKey = Object.keys(data[0]).filter(key => {
11 | const low = key.toLowerCase();
12 | return (
13 | low === 'longitude' ||
14 | low === 'lon' ||
15 | low === 'lng' ||
16 | low === 'long' ||
17 | low === 'lambda'
18 | );
19 | });
20 |
21 | const latKey = Object.keys(data[0]).filter(key => {
22 | const low = key.toLowerCase();
23 | return low === 'latitude' || low === 'lat' || low === 'phi';
24 | });
25 |
26 | return [lonKey[0], latKey[0]];
27 | }
28 |
29 | /**
30 | * Process the user data to be structured for further use.
31 | * @param {Array} data Array of user data objects.
32 | * @param {function} projection Geo projection.
33 | * @param {Array} variables Optional. Array of variables the user
34 | * would like to add to the layout.
35 | * @return {Array} Array of user's data points.
36 | */
37 | export default function(data, projection, lonLat, variables) {
38 | // Return an empty array if the user hasn't passed down data.
39 | if (!data.length) return [];
40 |
41 | const geoKeys = checkGeoKeyNames(lonLat, data);
42 |
43 | return data.map(el => {
44 | const coords = projection([+el[geoKeys[0]], +el[geoKeys[1]]]);
45 |
46 | const obj = {};
47 | [obj.x, obj.y] = coords;
48 |
49 | if (variables && variables.length) {
50 | variables.forEach(varName => {
51 | obj[varName] = el[varName];
52 | });
53 | }
54 |
55 | return obj;
56 | });
57 | }
58 |
--------------------------------------------------------------------------------
/src/rollupDensity.js:
--------------------------------------------------------------------------------
1 | import { quantile } from 'd3-array';
2 |
3 | /**
4 | * Calculates the cover weighted measures. Also assigns a
5 | * minimum cover proxy to each layout point without a cover.
6 | * Requried as some user data points can lie just outside the image.
7 | * @param {Array} points Layout objects.
8 | * @param {number} r The hexagon's radius.
9 | * @return {Array} Cover augmented layout objects.
10 | */
11 | export default function(points, r) {
12 | // Establish a minimum cover proxy: get a sorted array of cover values
13 | // for the quantile function. Only consider edges with cover < 1.
14 | const ascendingCover = points
15 | .filter(p => p.cover > 0 && p.cover < 1)
16 | .map(d => d.cover)
17 | .sort((a, b) => a - b);
18 | // Get the 10th percentile as the proxy.
19 | const quartileCover = quantile(ascendingCover, 0.1);
20 |
21 | // Get the hexagon's area in square pixel.
22 | const hexArea = (3 / 2) * Math.sqrt(3) * (r ** 2);
23 |
24 | // Initialise extents.
25 | let maxPoints = 0;
26 | let maxPointsWt = 0;
27 | let maxDensity = 0;
28 |
29 | // Initialise the min values with the largest possible min value.
30 | let minPoints = points.length;
31 | let minPointsWt = points.length;
32 | let minDensity = points.length / hexArea;
33 |
34 | for (let i = 0; i < points.length; i++) {
35 | const point = points[i];
36 |
37 | // All layout points w/o cover will get assigned the cover proxy.
38 | // Note, only non-gridpoont datapoints will have no cover.
39 | if (!point.cover) {
40 | point.cover = quartileCover;
41 | }
42 |
43 | // Calculate the cover weighted measures.
44 | point.datapointsWt = point.datapoints * (1 / point.cover);
45 | point.pointDensity = point.datapoints / (hexArea * point.cover);
46 |
47 | // Update extents.
48 | maxPoints = Math.max(maxPoints, point.datapoints);
49 | maxPointsWt = Math.max(maxPointsWt, point.datapointsWt);
50 | maxDensity = Math.max(maxDensity, point.pointDensity);
51 |
52 | if (point.datapoints > 0) {
53 | minPoints = Math.min(minPoints, point.datapoints);
54 | minPointsWt = Math.min(minPointsWt, point.datapointsWt);
55 | }
56 | if (point.pointDensity > 0) {
57 | minDensity = Math.min(minDensity, point.pointDensity);
58 | }
59 | }
60 |
61 | const extentPoints = [minPoints, maxPoints];
62 | const extentPointsWeighted = [minPointsWt, maxPointsWt];
63 | const extentPointDensity = [minDensity, maxDensity];
64 |
65 | return {
66 | layout: points,
67 | extentPoints,
68 | extentPointsWeighted,
69 | extentPointDensity
70 | };
71 | }
72 |
--------------------------------------------------------------------------------
/src/rollupPoints.js:
--------------------------------------------------------------------------------
1 | /* eslint-disable no-param-reassign */
2 |
3 | /**
4 | * Bring each hexpoint into shape, by rolling up number of datapoints
5 | * per hexagon, add cover and setting apart original centers from
6 | * centers added by user-data.
7 | * @param {Array} hexPoints Array of arrays of grid and
8 | * datapoints per hexagon.
9 | * @return {Array} Array of arrays of datapoints
10 | * per hexagon plus additional props.
11 | */
12 | export default function(hexPoints) {
13 | for (let i = 0; i < hexPoints.length; i++) {
14 | // Cache current element and prep cover variable.
15 | const hexPoint = hexPoints[i];
16 | let cover;
17 | let gridpoint;
18 |
19 | // Remove grid points and cache cover.
20 | for (let j = 0; j < hexPoint.length; j++) {
21 | if (hexPoint[j].gridpoint === 1) {
22 | cover = hexPoint[j].cover;
23 | gridpoint = 1;
24 | hexPoint.splice(j, 1);
25 | }
26 | }
27 |
28 | // Augment with new properties.
29 | hexPoints[i].datapoints = hexPoints[i].length;
30 | hexPoints[i].cover = cover;
31 | hexPoints[i].gridpoint = gridpoint || 0;
32 | }
33 |
34 | return hexPoints;
35 | }
36 |
--------------------------------------------------------------------------------
/src/setHexGenerator.js:
--------------------------------------------------------------------------------
1 | import { hexbin } from 'd3-hexbin';
2 |
3 | /**
4 | * Configure the hexbin generator.
5 | * @param {Array} extent Drawing area extent.
6 | * @param {number} radius The desired hex radius.
7 | * @return {function} Hexbin generator function.
8 | */
9 | export default function(extent, radius) {
10 | // Set the hexbin generator. Note, x and y will
11 | // be set later when prepping the user data.
12 | // Also round radius to the nearest 0.5 step.
13 | return hexbin()
14 | .extent(extent)
15 | .radius(radius)
16 | .x(d => d.x)
17 | .y(d => d.y);
18 | }
19 |
--------------------------------------------------------------------------------
/src/utils.js:
--------------------------------------------------------------------------------
1 | /* eslint-disable no-param-reassign */
2 |
3 | import { extent } from 'd3-array';
4 |
5 | /**
6 | * Checks and if required converts the 1D extent to a 2D extent.
7 | * @param {Array} userExtent Either the full 2D extent or just width and height.
8 | * @return The full 2D extent.
9 | */
10 | export function expandExtent(userExtent) {
11 | const nestedArrayLength = Array.from(
12 | new Set(userExtent.map(e => e.length))
13 | )[0];
14 | let extentLong = Array(2);
15 |
16 | if (nestedArrayLength === 2) {
17 | extentLong = userExtent;
18 | } else if (nestedArrayLength === undefined) {
19 | extentLong = [[0, 0], userExtent];
20 | } else {
21 | throw new Error(
22 | "Check 'extent' is in the anticipated form [[x0,y0],[x1,y1]] or [x1,y1]"
23 | );
24 | }
25 |
26 | return extentLong;
27 | }
28 |
29 | /**
30 | * Checks and sets given value to greater than 0.
31 | * @param {number} v Value.
32 | * @param {string} name Value name.
33 | * @return {number} Value.
34 | */
35 | export function convertToMin(v, name, min) {
36 | if (v >= min) {
37 | return v;
38 | }
39 | // eslint-disable-next-line no-console
40 | console.warn(`${name} should be ${min} or greater. Coerced to ${min}.`);
41 | return min;
42 | }
43 |
44 | /**
45 | * Produce corner points for a pointy hexagon.
46 | * @param {Object} center Hexagon center position.
47 | * @param {number} r Radius of hexagon.
48 | * @param {number} i Index of point to calculate.
49 | * @return {Object} Hexagon corner position.
50 | */
51 | export function pointyHexCorner(center, r, i) {
52 | const point = {};
53 | const angleDegree = 60 * i - 30;
54 | const angleRadian = (Math.PI / 180) * angleDegree;
55 | point.x = center.x + r * Math.cos(angleRadian);
56 | point.y = center.y + r * Math.sin(angleRadian);
57 | return point;
58 | }
59 |
60 | /**
61 | * Draw a hexagon.
62 | * @param {Object} context The canvas context.
63 | * @param {Object} corners Hexagon corner positions.
64 | * @param {String} action 'fill' or 'stroke'.
65 | * @param {String} colour Colour.
66 | * @return {[type]} undefined
67 | */
68 | export function hexDraw(context, corners, colour, action = 'fill') {
69 | context.beginPath();
70 | corners.forEach(d => {
71 | d === 0 ? context.moveTo(d.x, d.y) : context.lineTo(d.x, d.y);
72 | });
73 | context.closePath();
74 | if (action === 'fill') {
75 | context.fillStyle = colour;
76 | context.fill();
77 | } else if (action === 'stroke') {
78 | context.strokeStyle = colour;
79 | context.stroke();
80 | } else {
81 | throw new Error("hexDraw action needs to be either 'fill' or 'stroke'");
82 | }
83 | }
84 |
85 | /**
86 | * Calculates the circle radius in pixel, given a circle polygon.
87 | * @param {Object} geoCirclePolygon The circle polygon.
88 | * @param {function} projection The D3 projection function.
89 | * @return {number} The radius in pixel.
90 | */
91 | export function getPixelRadius(geoCirclePolygon, projection) {
92 | // Get radius in pixel.
93 | const circleDataGeo = geoCirclePolygon.coordinates[0];
94 | const circleDataY = circleDataGeo.map(d => projection(d)[1]);
95 | const circleDiameter = extent(circleDataY);
96 | const radiusPixel = (circleDiameter[1] - circleDiameter[0]) / 2;
97 |
98 | return radiusPixel;
99 | }
100 |
--------------------------------------------------------------------------------
/test/data/lux_adm0.json:
--------------------------------------------------------------------------------
1 | {"type":"FeatureCollection", "features": [
2 | {"type":"Feature","geometry":{"type":"Polygon","coordinates":[[[6.026518821716252,50.17766952514654],[6.236907005310002,49.892372131347656],[6.507969856262264,49.80574035644531],[6.3662891387938885,49.46838760375988],[5.864011764526367,49.50125122070324],[5.746118068695068,49.838768005371094],[6.026518821716252,50.17766952514654]]]},"properties":{"ID_0":131,"ISO":"LUX","NAME_0":"Luxembourg"}}
3 | ]}
--------------------------------------------------------------------------------
/test/data/lux_cities.csv:
--------------------------------------------------------------------------------
1 | Name,Area,Population,lat,lng
2 | Vianden,10,1918,49.927605,6.154527
3 | Differdange,22,24805,49.52273,5.88896
4 | Dudelange,21,20003,49.478462,6.085879
5 | Luxembourg City,51,115227,49.611621,6.131935
6 | Diekirch,12,6896,49.867178,6.159563
7 | Echternach,20,5249,49.811413,6.417564
8 | Esch-sur-Alzette,14,33939,49.500881,5.986093
9 | Ettelbruck,15,8544,49.847802,6.098523
10 | Grevenmacher,16,4794,49.680841,6.440759
11 | Remich,5,3482,49.545017,6.367422
12 | Rumelange,7,5422,49.459942,6.031811
13 | Wiltz,19,6522,49.96622,5.932431
--------------------------------------------------------------------------------
/test/data/lux_cities.json:
--------------------------------------------------------------------------------
1 | [
2 | {"Name":"Vianden","Area":10,"Population":1918,"lat":49.927605,"lng":6.154527},
3 | {"Name":"Differdange","Area":22,"Population":24805,"lat":49.52273,"lng":5.88896},
4 | {"Name":"Dudelange","Area":21,"Population":20003,"lat":49.478462,"lng":6.085879},
5 | {"Name":"Luxembourg City","Area":51,"Population":115227,"lat":49.611621,"lng":6.131935},
6 | {"Name":"Diekirch","Area":12,"Population":6896,"lat":49.867178,"lng":6.159563},
7 | {"Name":"Echternach","Area":20,"Population":5249,"lat":49.811413,"lng":6.417564},
8 | {"Name":"Esch-sur-Alzette","Area":14,"Population":33939,"lat":49.500881,"lng":5.986093},
9 | {"Name":"Ettelbruck","Area":15,"Population":8544,"lat":49.847802,"lng":6.098523},
10 | {"Name":"Grevenmacher","Area":16,"Population":4794,"lat":49.680841,"lng":6.440759},
11 | {"Name":"Remich","Area":5,"Population":3482,"lat":49.545017,"lng":6.367422},
12 | {"Name":"Rumelange","Area":7,"Population":5422,"lat":49.459942,"lng":6.031811},
13 | {"Name":"Wiltz","Area":19,"Population":6522,"lat":49.96622,"lng":5.932431}
14 | ]
--------------------------------------------------------------------------------
/test/hexgrid.test.js:
--------------------------------------------------------------------------------
1 | // Libraries.
2 | const tape = require('tape'),
3 | d3Geo = require('d3-geo'),
4 | JSDOM = require('jsdom').JSDOM,
5 | hexgrid = require('../').hexgrid;
6 |
7 | // Data.
8 | const luxGeo = require('./data/lux_adm0.json'),
9 | luxCities = require('./data/lux_cities.json');
10 |
11 | // Helper functions.
12 |
13 | /**
14 | * Check if all object properties are congruent.
15 | * @param {Array} keyList Array of properties for each object.
16 | * @return {boolean} true for congruent properties • false for deviance.
17 | */
18 | function getKeyEquality(keyList) {
19 | const keyEquality = [];
20 | for (let i = 0; i < keyList.length; i++) {
21 | if (i == 0) continue;
22 | var equality = keyList[i - 1].join() === keyList[i].join();
23 | keyEquality.push(equality);
24 | }
25 | return Array.from(new Set(keyEquality))[0];
26 | }
27 |
28 | /**
29 | * Get unique object properties across array.
30 | * @param {Array} keys Array of objects with keys to test.
31 | * @return {Array} Array of unique keys.
32 | */
33 | function getUniqueKeys(layout) {
34 | const allKeys = layout.reduce((res, el) => {
35 | return res.concat(Object.keys(el));
36 | }, []);
37 |
38 | return Array.from(new Set(allKeys));
39 | }
40 |
41 | // Fake dom for canvas methods using `document`.
42 | const dom = new JSDOM('fake dom');
43 | global.document = dom.window.document;
44 |
45 | // Set up the hexgrid
46 | const w = 100,
47 | h = 100,
48 | geo = luxGeo;
49 |
50 | const projection = d3Geo.geoMercator().fitSize([w, h], luxGeo);
51 | const geoPath = d3Geo.geoPath().projection(projection);
52 |
53 | const t = hexgrid()
54 | .extent([w, h])
55 | .geography(geo)
56 | .projection(projection)
57 | .pathGenerator(geoPath)
58 | .hexRadius(4);
59 |
60 | const hex = t([]);
61 | const hexData = t(luxCities);
62 | const hexDataWithKeys = t(luxCities, ['Name', 'Population']);
63 |
64 | tape('The hexgrid function returns an object', test => {
65 | let actual, expected;
66 |
67 | (actual = hex.grid.constructor.name), (expected = 'Object');
68 | test.equal(actual, expected, 'called "grid".');
69 |
70 | (actual = hex.grid.layout.constructor.name), (expected = 'Array');
71 | test.equal(
72 | actual,
73 | expected,
74 | 'with a property called "layout" of type "Array".'
75 | );
76 |
77 | (actual = hex.grid.imageCenters.constructor.name), (expected = 'Array');
78 | test.equal(
79 | actual,
80 | expected,
81 | 'with a property called "imageCenters" of type "Array".'
82 | );
83 |
84 | (actual = hex.grid.extentPoints.constructor.name), (expected = 'Array');
85 | test.equal(
86 | actual,
87 | expected,
88 | 'with a property called "extentPoints" of type "Array".'
89 | );
90 |
91 | (actual = hex.grid.extentPointsWeighted.constructor.name),
92 | (expected = 'Array');
93 | test.equal(
94 | actual,
95 | expected,
96 | 'with a property called "extentPointsWeighted" of type "Array".'
97 | );
98 |
99 | (actual = hex.grid.extentPointDensity.constructor.name), (expected = 'Array');
100 | test.equal(
101 | actual,
102 | expected,
103 | 'with a property called "extentPointDensity" of type "Array".'
104 | );
105 |
106 | test.end();
107 | });
108 |
109 | tape("The hexgrid's layout array holds objects", test => {
110 | let actual, expected;
111 |
112 | // Check all objects share the same keys.
113 | const layout = hex.grid.layout;
114 | const keyArray = layout.map(d => Object.keys(d));
115 |
116 | actual = getKeyEquality(keyArray);
117 | expected = true;
118 | test.equal(actual, expected, 'with the same properties.');
119 |
120 | // Check unique key names.
121 | const uniqueKeys = getUniqueKeys(layout);
122 |
123 | actual = uniqueKeys.length;
124 | expected = 7;
125 | test.equal(
126 | actual,
127 | expected,
128 | 'with seven keys if no user data is passed through.'
129 | );
130 |
131 | expected = true;
132 | actual = uniqueKeys.includes('x');
133 | test.equal(actual, expected, 'with an "x" property.');
134 | actual = uniqueKeys.includes('y');
135 | test.equal(actual, expected, 'with a "y" property.');
136 | actual = uniqueKeys.includes('cover');
137 | test.equal(actual, expected, 'with a "cover" property.');
138 | actual = uniqueKeys.includes('gridpoint');
139 | test.equal(actual, expected, 'with a "gridpoint" property.');
140 | actual = uniqueKeys.includes('datapoints');
141 | test.equal(actual, expected, 'with a "datapoints" property.');
142 | actual = uniqueKeys.includes('datapointsWt');
143 | test.equal(actual, expected, 'with a "datapointsWt" property.');
144 | actual = uniqueKeys.includes('pointDensity');
145 | test.equal(actual, expected, 'with a "pointDensity" property.');
146 |
147 | test.end();
148 | });
149 |
150 | tape('The hexgrid function run with a geography returns an object', test => {
151 | let actual, expected;
152 |
153 | actual = hex.grid.layout.length > 90;
154 | expected = true;
155 | test.equal(
156 | actual,
157 | expected,
158 | 'with a "layout" array of length greater than the expected number.'
159 | );
160 |
161 | actual = hex.grid.imageCenters.length > 90;
162 | expected = true;
163 | test.equal(
164 | actual,
165 | expected,
166 | 'with an "imageCenters" array of length greater than the expected number.'
167 | );
168 |
169 | test.end();
170 | });
171 |
172 | tape(
173 | 'The hexgrid function run with a geography and user data returns an object',
174 | test => {
175 | let actual, expected;
176 |
177 | actual = hexData.grid.extentPoints[0];
178 | expected = 1;
179 | test.equal(
180 | actual,
181 | expected,
182 | 'with the expected minimum of datapoints per hexagon.'
183 | );
184 |
185 | actual = hexData.grid.extentPoints[1];
186 | expected = 1;
187 | test.equal(
188 | actual,
189 | expected,
190 | 'with the expected maximum of datapoints per hexagon.'
191 | );
192 |
193 | // Check length of hexagons with datapoints.
194 | const layout = hexData.grid.layout;
195 | const points = layout.filter(d => d.datapoints).map(d => d.length > 0);
196 | let length = Array.from(new Set(points))[0];
197 |
198 | actual = length;
199 | expected = true;
200 | test.equal(
201 | actual,
202 | expected,
203 | 'with a "layout" property holding hexagons with a length greater than 0 if they contain datapoints.'
204 | );
205 |
206 | // Check lengthh of hexagons without datapoints.
207 | const noPoints = layout.filter(d => !d.datapoints).map(d => d.length > 0);
208 | length = Array.from(new Set(noPoints))[0];
209 |
210 | actual = length;
211 | expected = false;
212 | test.equal(
213 | actual,
214 | expected,
215 | 'with a "layout" property holding hexagons with a length of 0 if they do not contain datapoints.'
216 | );
217 |
218 | // Check cover of external hexagons.
219 | const edges = layout
220 | .filter(d => d.cover < 1 && d.datapoints)
221 | .map(d => d.datapointsWt > d.datapoints);
222 |
223 | actual = Array.from(new Set(edges))[0];
224 | expected = true;
225 | test.equal(
226 | actual,
227 | expected,
228 | 'with a "layout" property holding edge hexagons with up-weighted datapoints.'
229 | );
230 |
231 | // Check cover of internal hexagons.
232 | const internal = layout
233 | .filter(d => d.cover === 1 && d.datapoints)
234 | .map(d => d.datapointsWt === 1);
235 |
236 | actual = Array.from(new Set(edges))[0];
237 | expected = true;
238 | test.equal(
239 | actual,
240 | expected,
241 | 'with a "layout" property holding internal hexagons with no up-weighted datapoints.'
242 | );
243 |
244 | test.end();
245 | }
246 | );
247 |
248 | tape(
249 | 'Given a geography, user data and user variables, only the layout objects WITH datapoints',
250 | test => {
251 | let actual, expected;
252 |
253 | // Check user variables have been passed through.
254 | const filter = hexDataWithKeys.grid.layout.filter(d => d.datapoints);
255 | const keyArray = filter.map(d => Object.keys(d));
256 |
257 | actual = getKeyEquality(keyArray);
258 | expected = true;
259 | test.equal(actual, expected, 'share the same properties.');
260 |
261 | // Check unique key names.
262 | const uniqueKeys = getUniqueKeys(filter);
263 |
264 | actual = uniqueKeys.length;
265 | expected = 8;
266 | test.equal(
267 | actual,
268 | expected,
269 | 'have eight keys (all keys + Array index 0) if the maximum number of datapoints per hex is 1.'
270 | );
271 |
272 | // Check equality of key names.
273 | const datapointKeyArray = filter.map(d => Object.keys(d[0]));
274 |
275 | actual = getKeyEquality(datapointKeyArray);
276 | expected = true;
277 | test.equal(
278 | actual,
279 | expected,
280 | 'hold datapoint objects with the same properties.'
281 | );
282 |
283 | // Check unique key names.
284 | const datapoints = filter.map(d => d[0]);
285 | const datapointsUniqueKeys = getUniqueKeys(datapoints);
286 |
287 | actual = datapointsUniqueKeys.length;
288 | expected = 4;
289 | test.equal(
290 | actual,
291 | expected,
292 | 'hold datapoint objects with the expected number of properties.'
293 | );
294 |
295 | expected = true;
296 | actual = datapointsUniqueKeys.includes('x');
297 | test.equal(
298 | actual,
299 | expected,
300 | 'hold datapoint objects with an "x" property.'
301 | );
302 | actual = datapointsUniqueKeys.includes('y');
303 | test.equal(actual, expected, 'hold datapoint objects with a "y" property.');
304 | actual =
305 | datapointsUniqueKeys.includes('Name') &&
306 | datapointsUniqueKeys.includes('Population');
307 | test.equal(
308 | actual,
309 | expected,
310 | 'hold datapoint objects with the passed in user variables.'
311 | );
312 |
313 | test.end();
314 | }
315 | );
316 |
317 | const tM = hexgrid()
318 | .extent([w, h])
319 | .geography(geo)
320 | .projection(projection)
321 | .pathGenerator(geoPath)
322 | .hexRadius(50, 'm');
323 |
324 | const tKm = hexgrid()
325 | .extent([w, h])
326 | .geography(geo)
327 | .projection(projection)
328 | .pathGenerator(geoPath)
329 | .hexRadius(50, 'km');
330 |
331 | const radiusM = tM([]).radius();
332 | const radiusKm = tKm([]).radius();
333 |
334 | tape('Given a user defined distance unit', test => {
335 | let actual, expected;
336 |
337 | // const radiusM = hexUnitM.radius();
338 | // const radiusKm = hexUnitKm.radius();
339 |
340 | actual = typeof radiusM;
341 | expected = 'number';
342 |
343 | test.equal(actual, expected, 'the converted radius should be a number.');
344 |
345 | actual = radiusM;
346 | expected = 102;
347 |
348 | test.equal(
349 | actual,
350 | expected,
351 | 'the converted radius should be the expected number.'
352 | );
353 |
354 | actual = radiusM > radiusKm;
355 | expected = true;
356 |
357 | test.equal(
358 | actual,
359 | expected,
360 | 'the converted miles radius should be larger than the converted km radius.'
361 | );
362 |
363 | test.end();
364 |
365 | });
366 |
--------------------------------------------------------------------------------