├── CNAME
├── favicon.ico
├── articles.md
├── .gitignore
├── favicon-16x16.png
├── favicon-32x32.png
├── wtrace-icon.png
├── mstile-150x150.png
├── apple-touch-icon.png
├── android-chrome-192x192.png
├── android-chrome-512x512.png
├── assets
├── img
│ ├── background.jpg
│ ├── procmon-filters.png
│ ├── gflags-loader-snaps.png
│ ├── withdll-sltest-sylogd.png
│ ├── perfview-snapshots-diff.png
│ ├── cpu-usage-precise-diagram.jpg
│ └── ui-delay-with-cpu-precise.png
├── main.scss
└── other
│ ├── windbg-install.ps1.txt
│ └── WTComTrace.wprp
├── browserconfig.xml
├── site.webmanifest
├── 404.html
├── _layouts
├── posts.html
└── home.html
├── _includes
├── footer.html
└── head.html
├── index.md
├── _config.yml
├── about.md
├── README.md
├── Gemfile
├── tools.md
├── guides.md
├── safari-pinned-tab.svg
├── guides
├── using-withdll-and-detours-to-trace-winapi.md
├── configuring-windows-for-effective-troubleshooting.md
├── diagnosing-native-windows-apps.md
├── windows-performance-counters.md
├── network-tracing-tools.md
├── com-troubleshooting.md
├── etw.md
└── diagnosing-dotnet-apps.md
├── Gemfile.lock
└── LICENSE
/CNAME:
--------------------------------------------------------------------------------
1 | wtrace.net
--------------------------------------------------------------------------------
/favicon.ico:
--------------------------------------------------------------------------------
https://raw.githubusercontent.com/lowleveldesign/debug-recipes/HEAD/favicon.ico
--------------------------------------------------------------------------------
/articles.md:
--------------------------------------------------------------------------------
1 | ---
2 | layout: page
3 | title: Articles
4 | redirect_to: /guides
5 | ---
6 |
--------------------------------------------------------------------------------
/.gitignore:
--------------------------------------------------------------------------------
1 | _site
2 | .sass-cache
3 | .jekyll-cache
4 | .jekyll-metadata
5 | vendor
6 | draft_*
7 |
--------------------------------------------------------------------------------
/favicon-16x16.png:
--------------------------------------------------------------------------------
https://raw.githubusercontent.com/lowleveldesign/debug-recipes/HEAD/favicon-16x16.png
--------------------------------------------------------------------------------
/favicon-32x32.png:
--------------------------------------------------------------------------------
https://raw.githubusercontent.com/lowleveldesign/debug-recipes/HEAD/favicon-32x32.png
--------------------------------------------------------------------------------
/wtrace-icon.png:
--------------------------------------------------------------------------------
https://raw.githubusercontent.com/lowleveldesign/debug-recipes/HEAD/wtrace-icon.png
--------------------------------------------------------------------------------
/mstile-150x150.png:
--------------------------------------------------------------------------------
https://raw.githubusercontent.com/lowleveldesign/debug-recipes/HEAD/mstile-150x150.png
--------------------------------------------------------------------------------
/apple-touch-icon.png:
--------------------------------------------------------------------------------
https://raw.githubusercontent.com/lowleveldesign/debug-recipes/HEAD/apple-touch-icon.png
--------------------------------------------------------------------------------
/android-chrome-192x192.png:
--------------------------------------------------------------------------------
https://raw.githubusercontent.com/lowleveldesign/debug-recipes/HEAD/android-chrome-192x192.png
--------------------------------------------------------------------------------
/android-chrome-512x512.png:
--------------------------------------------------------------------------------
https://raw.githubusercontent.com/lowleveldesign/debug-recipes/HEAD/android-chrome-512x512.png
--------------------------------------------------------------------------------
/assets/img/background.jpg:
--------------------------------------------------------------------------------
https://raw.githubusercontent.com/lowleveldesign/debug-recipes/HEAD/assets/img/background.jpg
--------------------------------------------------------------------------------
/assets/img/procmon-filters.png:
--------------------------------------------------------------------------------
https://raw.githubusercontent.com/lowleveldesign/debug-recipes/HEAD/assets/img/procmon-filters.png
--------------------------------------------------------------------------------
/assets/img/gflags-loader-snaps.png:
--------------------------------------------------------------------------------
https://raw.githubusercontent.com/lowleveldesign/debug-recipes/HEAD/assets/img/gflags-loader-snaps.png
--------------------------------------------------------------------------------
/assets/img/withdll-sltest-sylogd.png:
--------------------------------------------------------------------------------
https://raw.githubusercontent.com/lowleveldesign/debug-recipes/HEAD/assets/img/withdll-sltest-sylogd.png
--------------------------------------------------------------------------------
/assets/img/perfview-snapshots-diff.png:
--------------------------------------------------------------------------------
https://raw.githubusercontent.com/lowleveldesign/debug-recipes/HEAD/assets/img/perfview-snapshots-diff.png
--------------------------------------------------------------------------------
/assets/img/cpu-usage-precise-diagram.jpg:
--------------------------------------------------------------------------------
https://raw.githubusercontent.com/lowleveldesign/debug-recipes/HEAD/assets/img/cpu-usage-precise-diagram.jpg
--------------------------------------------------------------------------------
/assets/img/ui-delay-with-cpu-precise.png:
--------------------------------------------------------------------------------
https://raw.githubusercontent.com/lowleveldesign/debug-recipes/HEAD/assets/img/ui-delay-with-cpu-precise.png
--------------------------------------------------------------------------------
/browserconfig.xml:
--------------------------------------------------------------------------------
1 |
2 |
3 |
4 |
5 |
6 | #da532c
7 |
8 |
9 |
10 |
--------------------------------------------------------------------------------
/site.webmanifest:
--------------------------------------------------------------------------------
1 | {
2 | "name": "",
3 | "short_name": "",
4 | "icons": [
5 | {
6 | "src": "/android-chrome-192x192.png",
7 | "sizes": "192x192",
8 | "type": "image/png"
9 | },
10 | {
11 | "src": "/android-chrome-512x512.png",
12 | "sizes": "512x512",
13 | "type": "image/png"
14 | }
15 | ],
16 | "theme_color": "#ffffff",
17 | "background_color": "#ffffff",
18 | "display": "standalone"
19 | }
20 |
--------------------------------------------------------------------------------
/404.html:
--------------------------------------------------------------------------------
1 | ---
2 | permalink: /404.html
3 | layout: default
4 | ---
5 |
6 |
19 |
20 |
21 |
404
22 |
23 |
Page not found :(
24 |
The requested page could not be found.
25 |
6 | {%- if page.title -%}
7 |
{{ page.title }}
8 | {%- endif -%}
9 |
10 | {%- if site.posts.size > 0 -%}
11 |
12 | {%- for post in site.posts -%}
13 | -
14 | {%- assign date_format = site.minima.date_format | default: "%b %-d, %Y" -%}
15 | {{ post.date | date: date_format }}
16 |
21 | {{ post.excerpt }}
22 |
23 | {%- endfor -%}
24 |
25 | {%- endif -%}
26 |
27 |
13 | {%- if page.title -%}
14 |
15 |
16 |
{{ page.title }}
17 | {% if page.description %}
18 |
{{ page.description }}
19 | {% endif %}
20 |
21 |
22 | {%- endif -%}
23 |
24 |
25 |
26 | {{ content }}
27 |
28 |
29 |
30 |
11 | Credits: this site uses modified icons from the feather set.
12 |
13 |
14 |
15 | 
The published guides are licensed under a Creative Commons Attribution 4.0 International License.
16 |
--------------------------------------------------------------------------------
/README.md:
--------------------------------------------------------------------------------
1 |
2 | Debug Recipes
3 | =============
4 |
5 | It is a repository of my field notes collected while debugging various .NET application problems on Windows (mainly) and Linux. They do not contain much theory but rather describe tools and scripts with some usage examples.
6 |
7 | :floppy_disk: Old and no longer updated recipes are in the [archived branch](https://github.com/lowleveldesign/debug-recipes/tree/archive).
8 |
9 | The recipes are available in the guides folder and at **[wtrace.net](https://wtrace.net/guides)** (probably the best way to view them).
10 |
11 | ## Troubleshooting guides
12 |
13 | - [Diagnosing .NET applications](guides/diagnosing-dotnet-apps.md)
14 | - [Diagnosing native Windows applications](guides/diagnosing-native-windows-apps.md)
15 | - [COM troubleshooting](guides/com-troubleshooting)
16 |
17 | ## Tools usage guides
18 |
19 | - [WinDbg usage guide](guides/windbg.md)
20 | - [Event Tracing for Windows (ETW)](guides/etw.md)
21 | - [Using withdll and detours to trace Win API calls](guides/using-withdll-and-detours-to-trace-winapi.md)
22 | - [Windows Performance Counters](guides/windows-performance-counters.md)
23 | - [Network tracing tools](guides/network-tracing-tools.md)
24 |
--------------------------------------------------------------------------------
/Gemfile:
--------------------------------------------------------------------------------
1 | source "https://rubygems.org"
2 | # Hello! This is where you manage which Jekyll version is used to run.
3 | # When you want to use a different version, change it below, save the
4 | # file and run `bundle install`. Run Jekyll with `bundle exec`, like so:
5 | #
6 | # bundle exec jekyll serve
7 | #
8 | # This will help ensure the proper Jekyll version is running.
9 | # Happy Jekylling!
10 | # gem "jekyll", "~> 4.2.0"
11 | # This is the default theme for new Jekyll sites. You may change this to anything you like.
12 | gem "minima", "~> 2.5"
13 | # gem "jekyll-theme-cayman", "~> 0.2.0"
14 | # If you want to use GitHub Pages, remove the "gem "jekyll"" above and
15 | # uncomment the line below. To upgrade, run `bundle update github-pages`.
16 | gem "github-pages", group: :jekyll_plugins
17 | # If you have any plugins, put them here!
18 | group :jekyll_plugins do
19 | gem "jekyll-feed", "~> 0.12"
20 | end
21 |
22 | # Windows and JRuby does not include zoneinfo files, so bundle the tzinfo-data gem
23 | # and associated library.
24 | platforms :mingw, :x64_mingw, :mswin, :jruby do
25 | gem "tzinfo", "~> 1.2"
26 | gem "tzinfo-data"
27 | end
28 |
29 | # Performance-booster for watching directories on Windows
30 | gem "wdm", "~> 0.1.1", :platforms => [:mingw, :x64_mingw, :mswin]
31 |
32 | gem "webrick", "~> 1.7"
33 |
34 | gem "json", "~> 2.7"
35 |
--------------------------------------------------------------------------------
/tools.md:
--------------------------------------------------------------------------------
1 | ---
2 | layout: page
3 | title: Tools
4 | ---
5 |
6 | ### :feet: Tracing tools
7 |
8 | #### [wtrace](https://github.com/lowleveldesign/wtrace)
9 |
10 | A command-line tool for live recording ETW trace events on Windows systems. Wtrace collects, among others, File I/O and Registry operations, TPC/IP connections, and RPC calls. Its purpose is to give you some insights into what is happening in the system.
11 |
12 | #### [dotnet-wtrace](http://github.com/lowleveldesign/dotnet-wtrace)
13 |
14 | A cross-platform command-line tool for live recording .NET trace events. Dotnet-wtrace collects, among others, GC, network, ASP.NET Core, and exception events.
15 |
16 | #### [withdll](https://github.com/lowleveldesign/withdll)
17 |
18 | A small tool which can inject DLLs into already running and newly started processes. The injected DLL may, for example, trace or patch functions in the remote process.
19 |
20 | ### :beetle: Debugging tools
21 |
22 | #### [lldext](https://github.com/lowleveldesign/lldext) (a WinDbg extension)
23 |
24 | The repository contains the source code of a native lldext extension and my various scripts enhancing debugging with WinDbg.
25 |
26 | #### [comon](https://github.com/lowleveldesign/comon) (a WinDbg extension)
27 |
28 | A WinDbg extension showing traces of COM class creations and interface querying. You may use it to investigate various COM issues and better understand application logic.
29 |
--------------------------------------------------------------------------------
/guides.md:
--------------------------------------------------------------------------------
1 | ---
2 | layout: page
3 | title: Guides
4 | ---
5 |
6 | Please first check the [Windows degugging configuration guide](configuring-windows-for-effective-troubleshooting) as it presents fundamental settings and tools for effective problems troubleshooting on Windows.
7 |
8 | ### :triangular_ruler: Troubleshooting scenarios
9 |
10 | #### [Diagnosing .NET applications](diagnosing-dotnet-apps)
11 |
12 | This guide describes ways of troubleshooting various problems in .NET applications, such as high CPU usage, memory leaks, network issues, etc.
13 |
14 | #### [Diagnosing native Windows applications](diagnosing-native-windows-apps)
15 |
16 | This guide describes ways of troubleshooting various problems in native applications on Windows, such as high CPU usage, hangs, abnormal terminations, etc.
17 |
18 | #### [COM troubleshooting](com-troubleshooting)
19 |
20 | A guide presenting troubleshooting techniques and tools (including the [comon extension](https://github.com/lowleveldesign/comon)) useful for debugging COM objects.
21 |
22 | ### :wrench: Tools usage
23 |
24 | #### [WinDbg usage guide](windbg)
25 |
26 | My field notes describing usage of WinDbg and WinDbgX (new WinDbg).
27 |
28 | #### [Event Tracing for Windows (ETW)](etw)
29 |
30 | This guide describes how to collect and analyze ETW traces.
31 |
32 | #### [Using withdll and detours to trace Win API calls](using-withdll-and-detours-to-trace-winapi)
33 |
34 | This guide describes how to use [withdll](https://github.com/lowleveldesign/withdll) and [Detours](https://github.com/microsoft/Detours) samples to collect traces of Win API calls.
35 |
36 | #### [Windows Performance Counters](windows-performance-counters)
37 |
38 | The guide presents how to query Windows Performance Counters and analyze the collected data.
39 |
40 | #### [Network tracing tools](network-tracing-tools)
41 |
42 | This guide lists various network tools you may use to diagnose connectivity problems and collect network traces on Windows and Linux.
43 |
--------------------------------------------------------------------------------
/assets/main.scss:
--------------------------------------------------------------------------------
1 | ---
2 | # Only the main Sass file needs front matter (the dashes are enough)
3 | ---
4 |
5 | $brand-color: #CA4E07;
6 | $credits-color: #707070;
7 |
8 | @import "minima";
9 |
10 | body {
11 | background-color: #f6f6ef;
12 | }
13 |
14 | pre, code {
15 | background: transparent;
16 | }
17 |
18 | .highlighter-rouge .highlight {
19 | background: #f9f9f9;
20 | }
21 |
22 | .highlight .c {
23 | color: #6c6c62;
24 | }
25 |
26 | .post-title {
27 | @include relative-font-size(2.2);
28 | letter-spacing: -1px;
29 | line-height: 1;
30 |
31 | @include media-query($on-laptop) {
32 | @include relative-font-size(2.0);
33 | }
34 | }
35 |
36 | .post-content {
37 | table {
38 | table-layout: fixed;
39 | }
40 |
41 | table th {
42 | text-align: center;
43 | }
44 |
45 | table td {
46 | vertical-align: top;
47 | }
48 |
49 | h2, h3 {
50 | margin: 15px 0 15px 0;
51 | }
52 | }
53 |
54 | .site-title {
55 | @include relative-font-size(1.4);
56 | font-weight: 700;
57 | line-height: $base-line-height * $base-font-size * 2.25;
58 | letter-spacing: -1px;
59 | margin-bottom: 0;
60 | float: left;
61 | text-transform: uppercase;
62 |
63 | &, &:visited {
64 | color: $brand-color;
65 | }
66 | }
67 |
68 | .site-nav {
69 | .page-link {
70 | text-transform: uppercase;
71 | font-weight: 600;
72 | }
73 | }
74 |
75 | .feature-image {
76 | background-color: black;
77 | background-repeat: no-repeat;
78 | margin-bottom: 10px;
79 | padding-top: 50px;
80 | height: 300px;
81 |
82 | .wrapper {
83 | color: #ffffff;
84 |
85 | h1 {
86 | font-size: 4rem;
87 | font-weight: 900;
88 | margin-bottom: 0px
89 | }
90 |
91 | p {
92 | font-size: 1.2rem;
93 | }
94 | }
95 | }
96 |
97 | p.credits {
98 | color: $credits-color;
99 | padding-top: 10px;
100 | margin-top: 10px;
101 | }
102 |
--------------------------------------------------------------------------------
/assets/other/windbg-install.ps1.txt:
--------------------------------------------------------------------------------
1 | # script created by @Izybkr (https://github.com/microsoftfeedback/WinDbg-Feedback/issues/19#issuecomment-1513926394) with my minor updates to make it work with latest WinDbg releases):
2 |
3 | param(
4 | $OutDir = ".",
5 | [ValidateSet("x64", "x86", "arm64")]
6 | $Arch = "x64"
7 | )
8 |
9 | if (!(Test-Path $OutDir)) {
10 | $null = mkdir $OutDir
11 | }
12 |
13 | $ErrorActionPreference = "Stop"
14 |
15 | if ($PSVersionTable.PSVersion.Major -le 5) {
16 | [Net.ServicePointManager]::SecurityProtocol = [Net.SecurityProtocolType]::Tls12
17 |
18 | # This is a workaround to get better performance on older versions of PowerShell
19 | $ProgressPreference = 'SilentlyContinue'
20 | }
21 |
22 | # Download the appinstaller to find the current uri for the msixbundle
23 | Invoke-WebRequest https://aka.ms/windbg/download -OutFile $OutDir\windbg.appinstaller
24 |
25 | # Download the msixbundle
26 | $msixBundleUri = ([xml](Get-Content $OutDir\windbg.appinstaller)).AppInstaller.MainBundle.Uri
27 |
28 | # Download the msixbundle (but name as zip for older versions of Expand-Archive
29 | Invoke-WebRequest $msixBundleUri -OutFile $OutDir\windbg.zip
30 |
31 | # Extract the 3 msix files (plus other files)
32 | Expand-Archive -DestinationPath $OutDir\UnzippedBundle $OutDir\windbg.zip
33 |
34 | # Expand the build you want - also renaming the msix to zip for Windows PowerShell
35 | $fileName = switch ($Arch) {
36 | "x64" { "windbg_win-x64" }
37 | "x86" { "windbg_win-x86" }
38 | "arm64" { "windbg_win-arm64" }
39 | }
40 |
41 | # Rename msix (for older versions of Expand-Archive) and extract the debugger
42 | Rename-Item "$OutDir\UnzippedBundle\$fileName.msix" "$fileName.zip"
43 | Expand-Archive -DestinationPath "$OutDir\windbg" "$OutDir\UnzippedBundle\$fileName.zip"
44 |
45 | Remove-Item -Recurse -Force "$OutDir\UnzippedBundle"
46 | Remove-Item -Force "$OutDir\windbg.appinstaller"
47 | Remove-Item -Force "$OutDir\windbg.zip"
48 |
49 | # Now you can run:
50 | & $OutDir\windbg\DbgX.Shell.exe
51 |
--------------------------------------------------------------------------------
/safari-pinned-tab.svg:
--------------------------------------------------------------------------------
1 |
2 |
4 |
47 |
--------------------------------------------------------------------------------
/guides/using-withdll-and-detours-to-trace-winapi.md:
--------------------------------------------------------------------------------
1 | ---
2 | layout: page
3 | title: Using withdll and detours to trace Win API calls
4 | date: 2023-11-25 08:00:00 +0200
5 | ---
6 |
7 | **Table of contents:**
8 |
9 |
10 |
11 | - [Introducing withdll](#introducing-withdll)
12 | - [Detours syelog library and log collector \(syelogd.exe\)](#detours-syelog-library-and-log-collector-syelogdexe)
13 | - [Detours sample libraries that log Win API functions calls](#detours-sample-libraries-that-log-win-api-functions-calls)
14 | - [Injecting libraries with withdll](#injecting-libraries-with-withdll)
15 |
16 |
17 |
18 | ## Introducing withdll
19 |
20 | The [Detours](https://github.com/microsoft/Detours) repository contains many interesting samples, some of which could be particularly useful in software troubleshooting. Inspired by one of those samples, named withdll, I created my clone of it in C# with some additional features. In this guide, I will present to you how you may use withdll with Detours samples to collect traces of Win API calls.
21 |
22 | ## Detours syelog library and log collector (syelogd.exe)
23 |
24 | Detours developers implemented a logging library, syelog, based on Windows named pipes. As you may see in the sltest example, it is straightforward to use. We may receive the logged messages with the syelogd application (also a Detours sample). Here is the result of running sltest and syelogd in separate console windows:
25 |
26 | 
27 |
28 | Each syelog message has a timestamp, process ID, facility number, severity code, and the textual message. Syelogd prints them in separate columns in the output. The timestamp could be either absolute (as in the example output) or relative to the last received message if you use the /d option. Having covered the receiver, let us focus on the senders.
29 |
30 | ## Detours sample libraries that log Win API functions calls
31 |
32 | The Detours repository contains a few syelog-based tracers. The most thorough tracer is [**traceapi**](https://github.com/microsoft/Detours/tree/main/samples/traceapi). It hooks [a vast number of Win32 API functions](https://github.com/microsoft/Detours/blob/main/samples/traceapi/_win32.cpp). More tailored loggers include:
33 |
34 | - [**tracemem**](https://github.com/microsoft/Detours/tree/main/samples/tracemem) to trace heap allocations
35 | - [**tracereg**](https://github.com/microsoft/Detours/tree/main/samples/tracereg) to trace registry operations
36 | - [**tracetcp**](https://github.com/microsoft/Detours/tree/main/samples/tracetcp) to trace TCP connections
37 | - [**tracessl**](https://github.com/microsoft/Detours/tree/main/samples/tracessl) to trace plain text messages sent over TLS (it hooks EncryptMessage and DecryptMessage functions)
38 |
39 | And, if we are not satisfied with the examples provided, it is quite easy to create a custom tracer (you may start by adding new hooks to, for example, trcmem.cpp).
40 |
41 | The last step to start collecting Win API traces is to put the tracing libraries into the memory of the process that we want to analyze. And that is the place where withdll comes to the rescue.
42 |
43 | ## Injecting libraries with withdll
44 |
45 | The detours repository already contains a withdll sample that wraps the DetoursCreateProcessWithDlls function and allows you to start a new process with given DLLs injected. Unfortunately, it does not allow injecting DLLs into a running process. I decided to implement this feature in my version of withdll, and, to make it a bit more interesting, I reimplemented it in C#. Thanks to the excellent [win32metadata](https://github.com/microsoft/win32metadata) and [cswin32](https://github.com/microsoft/cswin32) projects, I could [easily generate C# bindings for structures and functions defined in the detours’ header](https://lowleveldesign.wordpress.com/2023/11/23/generating-c-bindings-for-native-windows-libraries/). You may download the compiled executable from the [release page](https://github.com/lowleveldesign/withdll/releases). I also added the detours sample tracers and syelogd.exe, so you may quickly run the first tracing session 😊.
46 |
47 | Withdll is a 64-bit application (compiled with NativeAOT and statically linked with the detours library) but supports both 32-bit and 64-bit targets. An example command line to inject a DLL into a running process with PID 1234 may look as follows:
48 |
49 | ```
50 | withdll.exe -d trcapi32.dll 1234
51 | ```
52 |
53 | And to start, for example, winver.exe with injected traceapi libraries, you may run:
54 |
55 | ```
56 | withdll.exe -d trcapi64.dll C:\Windows\System32\winver.exe
57 | withdll.exe -d trcapi32.dll C:\Windows\SysWow64\winver.exe
58 | ```
59 |
60 | Please note that you may inject multiple DLLs at once. If you compile a library for 32-bit and 64-bit architectures, add a “bitness suffix” to its base name, and withdll will replace the suffix if the target process is 32-bit. For example, if we have trcapi32.dll and trcapi64.dll in the same folder and we run `withdll.exe -d trcapi64.dll C:\Windows\SysWow64\winver.exe`, winver.exe instance will have trcapi32.dll in its loaded module list.
61 |
62 | Finally, if you would like to **always inject a DLL into a given application**, you may use the Image File Execution Option registry key. However, to profit from this key, withdll must play the role of a debugger when launching the application. Therefore, when defining a Debugger value key, add an additional `--debug` switch to the withdll command, for example:
63 |
64 | ```
65 | Windows Registry Editor Version 5.00
66 |
67 | [HKEY_LOCAL_MACHINE\SOFTWARE\Microsoft\Windows NT\CurrentVersion\Image File Execution Options\winver.exe]
68 | "Debugger"="c:\\tools\\withdll.exe --debug -d c:\\tools\\trcapi64.dll"
69 | ```
70 |
71 | I also recorded a short video presenting the usage of withdll with the traceapi sample library:
72 |
73 | [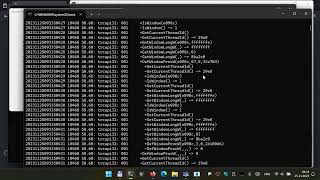](https://www.youtube.com/watch?v=q_iBojsF1sA)
74 |
--------------------------------------------------------------------------------
/assets/other/WTComTrace.wprp:
--------------------------------------------------------------------------------
1 |
2 |
3 |
4 |
5 |
6 |
7 |
8 |
9 |
10 |
11 |
12 |
13 |
14 |
15 |
16 |
17 |
18 |
19 |
20 |
21 |
22 |
23 |
24 |
25 |
26 |
27 |
28 |
29 |
30 |
31 |
32 |
33 |
34 |
35 |
36 |
37 |
38 |
39 |
40 |
41 |
42 |
43 |
44 |
45 |
46 |
47 |
48 |
49 |
50 |
51 |
52 |
53 |
54 |
55 |
56 |
57 |
58 |
59 |
60 |
61 |
62 |
63 |
64 |
65 |
66 |
67 |
68 |
69 |
70 |
71 |
72 |
73 |
74 |
75 |
76 |
77 |
78 |
79 |
80 |
81 |
82 |
83 |
84 |
85 |
86 |
87 |
88 |
89 |
90 |
91 |
92 |
93 |
94 |
95 |
--------------------------------------------------------------------------------
/guides/configuring-windows-for-effective-troubleshooting.md:
--------------------------------------------------------------------------------
1 | ---
2 | layout: page
3 | title: Configuring Windows for effective troubleshooting
4 | date: 2023-10-11 08:00:00 +0200
5 | ---
6 |
7 | **Table of contents:**
8 |
9 |
10 |
11 | - [Configuring debug symbols](#configuring-debug-symbols)
12 | - [Replacing Task Manager with System Informer](#replacing-task-manager-with-system-informer)
13 | - [Installing and configuring Sysinternals Suite](#installing-and-configuring-sysinternals-suite)
14 | - [Configuring post-mortem debugging](#configuring-post-mortem-debugging)
15 |
16 |
17 |
18 | ## Configuring debug symbols
19 |
20 | Staring at raw hex numbers is not very helpful for troubleshooting. Therefore, it's essential to take the time to properly configure debug symbols on our system. One effective method is to set the **\_NT\_SYMBOL\_PATH** environment variable. Most troubleshooting tools read its value and utilize the specified symbol stores. I usually configure it to point only to the official Microsoft symbol server, resulting in the following value for the \_NT\_SYMBOL\_PATH variable on my system: `SRV*C:\symbols\dbg*https://msdl.microsoft.com/download/symbols`. Here, `C:\symbols` serves as a cache folder for storing downloaded symbols. I also use `C:\symbols\dbg` if I need to index PDB files for my applications. For further information about the \_NT\_SYMBOL\_PATH variable, refer to [the official documentation](https://learn.microsoft.com/en-us/windows-hardware/drivers/debugger/symbol-path).
21 |
22 | The symbol path variable is one essential component required for successful symbol resolution. Another critical aspect is the version of **dbghelp.dll** that can work with symbol servers. Unfortunately, the version preinstalled with Windows lacks this feature. To overcome this issue, you can install the **Debugging Tools for Windows** from the [Windows SDK](https://developer.microsoft.com/en-us/windows/downloads/windows-sdk/). Make sure to install both the x86 and x64 versions to enable debugging of both 32- and 64-bit applications. Once installed, certain tools (e.g., Symbol Informer) will automatically select the appropriate dbghelp.dll version, while others will require some configuration, as we'll explore in later sections.
23 |
24 | ## Replacing Task Manager with System Informer
25 |
26 | My long time favorite tool to observe system and processes running on it, is [System Informer](https://www.systeminformer.com/), formerly known as Process Hacker. It has so many great features that deserves a guide on its own. The process tree, which shows the process creation and termination events, is much more readable than the flat process list in Task Manager or Resource Monitor. Moreover, System Informer lets you manage services and drivers, and view live network connections. Therefore, I highly recommend to open the Options dialog and replace Task Manager with it. System Informer does not have an option to set the dbghelp.dll path in its settings, but it will detect it if you have Debugging Tools for Windows installed. So please install them to have Windows stacks correctly resolved.
27 |
28 | If you have reasons not to use System Informer, you can try [Process Explorer](https://learn.microsoft.com/en-us/sysinternals/downloads/process-explorer). It does not have as many functionalities as System Informer, but it is still a powerful system monitor.
29 |
30 | ## Installing and configuring Sysinternals Suite
31 |
32 | [Sysinternals tools](https://learn.microsoft.com/en-us/sysinternals/) help me diagnose and fix various issues on Windows systems. Most often I use [Process Monitor](https://learn.microsoft.com/en-us/sysinternals/downloads/procmon) to capture and analyze system events, and sometimes that's the only tool I need to solve the problem! Other Sysinternals tools that I frequently use are [DebugView](https://learn.microsoft.com/en-us/sysinternals/downloads/debugview), [ProcDump](https://learn.microsoft.com/en-us/sysinternals/downloads/procdump), and [LiveKd](https://learn.microsoft.com/en-us/sysinternals/downloads/livekd). You can get the entire suite or individual tools from the [SysInternals website](https://learn.microsoft.com/en-us/sysinternals/downloads/) or from [live.sysinternals.com](https://live.sysinternals.com). However, these methods require manual updates when new versions are available. A more convenient way to keep the tools up to date is to install them from [Microsoft Store](https://www.microsoft.com/store/apps/9p7knl5rwt25).
33 |
34 | To get the most out of Process Monitor and Process Explorer, you need to set up symbol resolution correctly. The default settings do not use the Microsoft symbol store, so you need to adjust them in the options or import the registry keys shown below (after installing Debugging Tools for Windows):
35 |
36 | ```
37 | [HKEY_CURRENT_USER\Software\Sysinternals\Process Explorer]
38 | "DbgHelpPath"="C:\\Program Files (x86)\\Windows Kits\\10\\Debuggers\\x64\\dbghelp.dll"
39 | "SymbolPath"="SRV*C:\\symbols\\dbg*http://msdl.microsoft.com/download/symbols"
40 |
41 | [HKEY_CURRENT_USER\Software\Sysinternals\Process Monitor]
42 | "DbgHelpPath"="C:\\Program Files (x86)\\Windows Kits\\10\\Debuggers\\x64\\dbghelp.dll"
43 | "SymbolPath"="SRV*C:\\symbols\\dbg*http://msdl.microsoft.com/download/symbols"
44 | ```
45 |
46 | ## Configuring post-mortem debugging
47 |
48 | We all experience application failures from time to time. When it happens, Windows collectes some data about a crash and saves it to the event log. It usually lacks details required to fully understand the root cause of an issue. Fortunately, we have options to replace this scarse report with, for example, a memory dump. One way to accomplish that is by configuring **Windows Error Reporting** . The commands below will enable minidump collection to a C:\Dumps folder on a process failure:
49 |
50 | ```shell
51 | reg.exe add "HKLM\Software\Microsoft\Windows\Windows Error Reporting\LocalDumps" /v DumpType /t REG_DWORD /d 1 /f
52 | reg.exe add "HKLM\Software\Microsoft\Windows\Windows Error Reporting\LocalDumps" /v DumpFolder /t REG_EXPAND_SZ /d C:\dumps /f
53 | ```
54 |
55 | The available settings are listed and explained in the [WER documentation](https://learn.microsoft.com/en-us/windows/win32/wer/collecting-user-mode-dumps). Note, that by creating a subkey with an application name (for example, `HKEY_LOCAL_MACHINE\SOFTWARE\Microsoft\Windows\Windows Error Reporting\LocalDumps\test.exe`), you may customize WER settings per individual applications.
56 |
57 | [ProcDump](https://learn.microsoft.com/en-us/sysinternals/downloads/procdump) is an alternative to WER. You could install it as an [automatic debugger](https://learn.microsoft.com/en-us/windows/win32/debug/configuring-automatic-debugging), which Windows will run whenever a critical error occurs in an application. Example install command (-u to uninstall):
58 |
59 | ```shell
60 | procdump -i C:\Dumps
61 | ```
62 |
63 | These dumps can take up a lot of disk space over time, so you should either delete the old files periodically, or set up a task scheduler job that does it for you.
64 |
--------------------------------------------------------------------------------
/Gemfile.lock:
--------------------------------------------------------------------------------
1 | GEM
2 | remote: https://rubygems.org/
3 | specs:
4 | activesupport (8.0.2)
5 | base64
6 | benchmark (>= 0.3)
7 | bigdecimal
8 | concurrent-ruby (~> 1.0, >= 1.3.1)
9 | connection_pool (>= 2.2.5)
10 | drb
11 | i18n (>= 1.6, < 2)
12 | logger (>= 1.4.2)
13 | minitest (>= 5.1)
14 | securerandom (>= 0.3)
15 | tzinfo (~> 2.0, >= 2.0.5)
16 | uri (>= 0.13.1)
17 | addressable (2.8.7)
18 | public_suffix (>= 2.0.2, < 7.0)
19 | base64 (0.2.0)
20 | benchmark (0.4.1)
21 | bigdecimal (3.2.2)
22 | coffee-script (2.4.1)
23 | coffee-script-source
24 | execjs
25 | coffee-script-source (1.12.2)
26 | colorator (1.1.0)
27 | commonmarker (0.23.11)
28 | concurrent-ruby (1.3.5)
29 | connection_pool (2.5.3)
30 | csv (3.3.5)
31 | dnsruby (1.72.4)
32 | base64 (~> 0.2.0)
33 | logger (~> 1.6.5)
34 | simpleidn (~> 0.2.1)
35 | drb (2.2.3)
36 | em-websocket (0.5.3)
37 | eventmachine (>= 0.12.9)
38 | http_parser.rb (~> 0)
39 | ethon (0.16.0)
40 | ffi (>= 1.15.0)
41 | eventmachine (1.2.7)
42 | execjs (2.10.0)
43 | faraday (2.13.4)
44 | faraday-net_http (>= 2.0, < 3.5)
45 | json
46 | logger
47 | faraday-net_http (3.4.1)
48 | net-http (>= 0.5.0)
49 | ffi (1.17.2-x86_64-linux-gnu)
50 | forwardable-extended (2.6.0)
51 | gemoji (4.1.0)
52 | github-pages (232)
53 | github-pages-health-check (= 1.18.2)
54 | jekyll (= 3.10.0)
55 | jekyll-avatar (= 0.8.0)
56 | jekyll-coffeescript (= 1.2.2)
57 | jekyll-commonmark-ghpages (= 0.5.1)
58 | jekyll-default-layout (= 0.1.5)
59 | jekyll-feed (= 0.17.0)
60 | jekyll-gist (= 1.5.0)
61 | jekyll-github-metadata (= 2.16.1)
62 | jekyll-include-cache (= 0.2.1)
63 | jekyll-mentions (= 1.6.0)
64 | jekyll-optional-front-matter (= 0.3.2)
65 | jekyll-paginate (= 1.1.0)
66 | jekyll-readme-index (= 0.3.0)
67 | jekyll-redirect-from (= 0.16.0)
68 | jekyll-relative-links (= 0.6.1)
69 | jekyll-remote-theme (= 0.4.3)
70 | jekyll-sass-converter (= 1.5.2)
71 | jekyll-seo-tag (= 2.8.0)
72 | jekyll-sitemap (= 1.4.0)
73 | jekyll-swiss (= 1.0.0)
74 | jekyll-theme-architect (= 0.2.0)
75 | jekyll-theme-cayman (= 0.2.0)
76 | jekyll-theme-dinky (= 0.2.0)
77 | jekyll-theme-hacker (= 0.2.0)
78 | jekyll-theme-leap-day (= 0.2.0)
79 | jekyll-theme-merlot (= 0.2.0)
80 | jekyll-theme-midnight (= 0.2.0)
81 | jekyll-theme-minimal (= 0.2.0)
82 | jekyll-theme-modernist (= 0.2.0)
83 | jekyll-theme-primer (= 0.6.0)
84 | jekyll-theme-slate (= 0.2.0)
85 | jekyll-theme-tactile (= 0.2.0)
86 | jekyll-theme-time-machine (= 0.2.0)
87 | jekyll-titles-from-headings (= 0.5.3)
88 | jemoji (= 0.13.0)
89 | kramdown (= 2.4.0)
90 | kramdown-parser-gfm (= 1.1.0)
91 | liquid (= 4.0.4)
92 | mercenary (~> 0.3)
93 | minima (= 2.5.1)
94 | nokogiri (>= 1.16.2, < 2.0)
95 | rouge (= 3.30.0)
96 | terminal-table (~> 1.4)
97 | webrick (~> 1.8)
98 | github-pages-health-check (1.18.2)
99 | addressable (~> 2.3)
100 | dnsruby (~> 1.60)
101 | octokit (>= 4, < 8)
102 | public_suffix (>= 3.0, < 6.0)
103 | typhoeus (~> 1.3)
104 | html-pipeline (2.14.3)
105 | activesupport (>= 2)
106 | nokogiri (>= 1.4)
107 | http_parser.rb (0.8.0)
108 | i18n (1.14.7)
109 | concurrent-ruby (~> 1.0)
110 | jekyll (3.10.0)
111 | addressable (~> 2.4)
112 | colorator (~> 1.0)
113 | csv (~> 3.0)
114 | em-websocket (~> 0.5)
115 | i18n (>= 0.7, < 2)
116 | jekyll-sass-converter (~> 1.0)
117 | jekyll-watch (~> 2.0)
118 | kramdown (>= 1.17, < 3)
119 | liquid (~> 4.0)
120 | mercenary (~> 0.3.3)
121 | pathutil (~> 0.9)
122 | rouge (>= 1.7, < 4)
123 | safe_yaml (~> 1.0)
124 | webrick (>= 1.0)
125 | jekyll-avatar (0.8.0)
126 | jekyll (>= 3.0, < 5.0)
127 | jekyll-coffeescript (1.2.2)
128 | coffee-script (~> 2.2)
129 | coffee-script-source (~> 1.12)
130 | jekyll-commonmark (1.4.0)
131 | commonmarker (~> 0.22)
132 | jekyll-commonmark-ghpages (0.5.1)
133 | commonmarker (>= 0.23.7, < 1.1.0)
134 | jekyll (>= 3.9, < 4.0)
135 | jekyll-commonmark (~> 1.4.0)
136 | rouge (>= 2.0, < 5.0)
137 | jekyll-default-layout (0.1.5)
138 | jekyll (>= 3.0, < 5.0)
139 | jekyll-feed (0.17.0)
140 | jekyll (>= 3.7, < 5.0)
141 | jekyll-gist (1.5.0)
142 | octokit (~> 4.2)
143 | jekyll-github-metadata (2.16.1)
144 | jekyll (>= 3.4, < 5.0)
145 | octokit (>= 4, < 7, != 4.4.0)
146 | jekyll-include-cache (0.2.1)
147 | jekyll (>= 3.7, < 5.0)
148 | jekyll-mentions (1.6.0)
149 | html-pipeline (~> 2.3)
150 | jekyll (>= 3.7, < 5.0)
151 | jekyll-optional-front-matter (0.3.2)
152 | jekyll (>= 3.0, < 5.0)
153 | jekyll-paginate (1.1.0)
154 | jekyll-readme-index (0.3.0)
155 | jekyll (>= 3.0, < 5.0)
156 | jekyll-redirect-from (0.16.0)
157 | jekyll (>= 3.3, < 5.0)
158 | jekyll-relative-links (0.6.1)
159 | jekyll (>= 3.3, < 5.0)
160 | jekyll-remote-theme (0.4.3)
161 | addressable (~> 2.0)
162 | jekyll (>= 3.5, < 5.0)
163 | jekyll-sass-converter (>= 1.0, <= 3.0.0, != 2.0.0)
164 | rubyzip (>= 1.3.0, < 3.0)
165 | jekyll-sass-converter (1.5.2)
166 | sass (~> 3.4)
167 | jekyll-seo-tag (2.8.0)
168 | jekyll (>= 3.8, < 5.0)
169 | jekyll-sitemap (1.4.0)
170 | jekyll (>= 3.7, < 5.0)
171 | jekyll-swiss (1.0.0)
172 | jekyll-theme-architect (0.2.0)
173 | jekyll (> 3.5, < 5.0)
174 | jekyll-seo-tag (~> 2.0)
175 | jekyll-theme-cayman (0.2.0)
176 | jekyll (> 3.5, < 5.0)
177 | jekyll-seo-tag (~> 2.0)
178 | jekyll-theme-dinky (0.2.0)
179 | jekyll (> 3.5, < 5.0)
180 | jekyll-seo-tag (~> 2.0)
181 | jekyll-theme-hacker (0.2.0)
182 | jekyll (> 3.5, < 5.0)
183 | jekyll-seo-tag (~> 2.0)
184 | jekyll-theme-leap-day (0.2.0)
185 | jekyll (> 3.5, < 5.0)
186 | jekyll-seo-tag (~> 2.0)
187 | jekyll-theme-merlot (0.2.0)
188 | jekyll (> 3.5, < 5.0)
189 | jekyll-seo-tag (~> 2.0)
190 | jekyll-theme-midnight (0.2.0)
191 | jekyll (> 3.5, < 5.0)
192 | jekyll-seo-tag (~> 2.0)
193 | jekyll-theme-minimal (0.2.0)
194 | jekyll (> 3.5, < 5.0)
195 | jekyll-seo-tag (~> 2.0)
196 | jekyll-theme-modernist (0.2.0)
197 | jekyll (> 3.5, < 5.0)
198 | jekyll-seo-tag (~> 2.0)
199 | jekyll-theme-primer (0.6.0)
200 | jekyll (> 3.5, < 5.0)
201 | jekyll-github-metadata (~> 2.9)
202 | jekyll-seo-tag (~> 2.0)
203 | jekyll-theme-slate (0.2.0)
204 | jekyll (> 3.5, < 5.0)
205 | jekyll-seo-tag (~> 2.0)
206 | jekyll-theme-tactile (0.2.0)
207 | jekyll (> 3.5, < 5.0)
208 | jekyll-seo-tag (~> 2.0)
209 | jekyll-theme-time-machine (0.2.0)
210 | jekyll (> 3.5, < 5.0)
211 | jekyll-seo-tag (~> 2.0)
212 | jekyll-titles-from-headings (0.5.3)
213 | jekyll (>= 3.3, < 5.0)
214 | jekyll-watch (2.2.1)
215 | listen (~> 3.0)
216 | jemoji (0.13.0)
217 | gemoji (>= 3, < 5)
218 | html-pipeline (~> 2.2)
219 | jekyll (>= 3.0, < 5.0)
220 | json (2.13.2)
221 | kramdown (2.4.0)
222 | rexml
223 | kramdown-parser-gfm (1.1.0)
224 | kramdown (~> 2.0)
225 | liquid (4.0.4)
226 | listen (3.9.0)
227 | rb-fsevent (~> 0.10, >= 0.10.3)
228 | rb-inotify (~> 0.9, >= 0.9.10)
229 | logger (1.6.6)
230 | mercenary (0.3.6)
231 | minima (2.5.1)
232 | jekyll (>= 3.5, < 5.0)
233 | jekyll-feed (~> 0.9)
234 | jekyll-seo-tag (~> 2.1)
235 | minitest (5.25.5)
236 | net-http (0.6.0)
237 | uri
238 | nokogiri (1.18.9-x86_64-linux-gnu)
239 | racc (~> 1.4)
240 | octokit (4.25.1)
241 | faraday (>= 1, < 3)
242 | sawyer (~> 0.9)
243 | pathutil (0.16.2)
244 | forwardable-extended (~> 2.6)
245 | public_suffix (5.1.1)
246 | racc (1.8.1)
247 | rb-fsevent (0.11.2)
248 | rb-inotify (0.11.1)
249 | ffi (~> 1.0)
250 | rexml (3.4.1)
251 | rouge (3.30.0)
252 | rubyzip (2.4.1)
253 | safe_yaml (1.0.5)
254 | sass (3.7.4)
255 | sass-listen (~> 4.0.0)
256 | sass-listen (4.0.0)
257 | rb-fsevent (~> 0.9, >= 0.9.4)
258 | rb-inotify (~> 0.9, >= 0.9.7)
259 | sawyer (0.9.2)
260 | addressable (>= 2.3.5)
261 | faraday (>= 0.17.3, < 3)
262 | securerandom (0.4.1)
263 | simpleidn (0.2.3)
264 | terminal-table (1.8.0)
265 | unicode-display_width (~> 1.1, >= 1.1.1)
266 | typhoeus (1.4.1)
267 | ethon (>= 0.9.0)
268 | tzinfo (2.0.6)
269 | concurrent-ruby (~> 1.0)
270 | unicode-display_width (1.8.0)
271 | uri (1.0.3)
272 | webrick (1.9.1)
273 |
274 | PLATFORMS
275 | x86_64-linux
276 |
277 | DEPENDENCIES
278 | github-pages
279 | jekyll-feed (~> 0.12)
280 | json (~> 2.7)
281 | minima (~> 2.5)
282 | tzinfo (~> 1.2)
283 | tzinfo-data
284 | wdm (~> 0.1.1)
285 | webrick (~> 1.7)
286 |
287 | BUNDLED WITH
288 | 2.5.22
289 |
--------------------------------------------------------------------------------
/guides/diagnosing-native-windows-apps.md:
--------------------------------------------------------------------------------
1 | ---
2 | layout: page
3 | title: Diagnosing native Windows applications
4 | date: 2025-05-25 08:00:00 +0200
5 | ---
6 |
7 | {% raw %}
8 |
9 | **Table of contents:**
10 |
11 |
12 |
13 | - [Debugging process execution](#debugging-process-execution)
14 | - [Collecting memory dumps on errors](#collecting-memory-dumps-on-errors)
15 | - [Using procdump](#using-procdump)
16 | - [Using Windows Error Reporting \(WER\)](#using-windows-error-reporting-wer)
17 | - [Automatic dump collection using AeDebug registry key](#automatic-dump-collection-using-aedebug-registry-key)
18 | - [Diagnosing waits or high CPU usage](#diagnosing-waits-or-high-cpu-usage)
19 | - [Collecting ETW trace](#collecting-etw-trace)
20 | - [Anaysing the collected traces](#anaysing-the-collected-traces)
21 | - [Diagnosing issues with DLL loading](#diagnosing-issues-with-dll-loading)
22 |
23 |
24 |
25 | Debugging process execution
26 | ---------------------------
27 |
28 | Please check [the WinDbg guide](/guides/windbg) where I describe various troubleshooting commands in WinDbg, along with Time Travel Debugging.
29 |
30 | Collecting memory dumps on errors
31 | ---------------------------------
32 |
33 | ### Using procdump
34 |
35 | My preferred tool to collect memory dumps is **[procdump](https://learn.microsoft.com/en-us/sysinternals/downloads/procdump)**.
36 |
37 | It is often a good way to start diagnosing errors by observing 1st chance exceptions occurring in a process. At this point we don't want to collect any dumps, only logs. We may achieve this by specyfing a non-existing exception name in the filter command, for example:
38 |
39 | ```
40 | C:\Utils> procdump -e 1 -f "DoesNotExist" 8012
41 | ...
42 |
43 | CLR Version: v4.0.30319
44 |
45 | [09:03:27] Exception: E0434F4D.System.NullReferenceException ("Object reference not set to an instance of an object.")
46 | [09:03:28] Exception: E0434F4D.System.NullReferenceException ("Object reference not set to an instance of an object.")
47 | ```
48 |
49 | We may also observe the logs in procmon. In order to see the procdump log events in **procmon** remember to add procdump.exe and procdump64.exe to the accepted process names in procmon filters.
50 |
51 | To create a full memory dump when `NullReferenceException` occurs use the following command:
52 |
53 | ```
54 | procdump -ma -e 1 -f "E0434F4D.System.NullReferenceException" 8012
55 | ```
56 |
57 | From some time procdump uses a managed debugger engine when attaching to .NET Framework processes. This is great because we can filter exceptions based on their managed names. Unfortunately, that works only for 1st chance exceptions (at least for .NET 4.0). 2nd chance exceptions are raised out of the .NET Framework and must be handled by a native debugger. Starting from .NET 4.0 it is no longer possible to attach both managed and native engine to the same process. Thus, if we want to make a dump on the 2nd chance exception for a .NET application, we need to use the **-g** option in order to force procdump to use the native engine.
58 |
59 | ### Using Windows Error Reporting (WER)
60 |
61 | By default WER takes dump only when necessary, but this behavior can be configured and we can force WER to always create a dump by modifying `HKLM\Software\Microsoft\Windows\Windows Error Reporting\ForceQueue=1` or (`HKEY_CURRENT_USER\Software\Microsoft\Windows\Windows Error Reporting\ForceQueue=1`). The reports are usually saved at `%LocalAppData%\Microsoft\Windows\WER`, in two directories: `ReportArchive`, when a server is available or `ReportQueue`, when the server is unavailable. If you want to keep the data locally, just set the server to a non-existing machine (for example, `HKEY_LOCAL_MACHINE\SOFTWARE\Microsoft\Windows\Windows Error Reporting\CorporateWERServer=NonExistingServer`). For **system processes** you need to look at `C:\ProgramData\Microsoft\Windows\WER`. In Windows 2003 Server R2 Error Reporting stores errors in the signed-in user's directory (for example, `C:\Documents and Settings\me\Local Settings\Application Data\PCHealth\ErrorRep`).
62 |
63 | Starting with Windows Server 2008 and Windows Vista with Service Pack 1 (SP1), Windows Error Reporting can be configured to [collect full memory dumps on application crash](https://learn.microsoft.com/en-us/windows/win32/wer/collecting-user-mode-dumps). The registry key enabling this behavior is `HKEY_LOCAL_MACHINE\Software\Microsoft\Windows\Windows Error Reporting\LocalDumps`. An example configuration for saving full-memory dumps to the %SYSTEMDRIVE%\dumps folder when the test.exe application fails looks as follows:
64 |
65 | ```
66 | Windows Registry Editor Version 5.00
67 |
68 | [HKEY_LOCAL_MACHINE\SOFTWARE\Microsoft\Windows\Windows Error Reporting\LocalDumps]
69 |
70 | [HKEY_LOCAL_MACHINE\SOFTWARE\Microsoft\Windows\Windows Error Reporting\LocalDumps\test.exe]
71 | "DumpFolder"=hex(2):25,00,53,00,59,00,53,00,54,00,45,00,4d,00,44,00,52,00,49,\
72 | 00,56,00,45,00,25,00,5c,00,64,00,75,00,6d,00,70,00,73,00,00,00
73 | "DumpType"=dword:00000002
74 | ```
75 |
76 | With the help of [the WER API](https://learn.microsoft.com/en-us/windows/win32/wer/wer-reference), you may also force WER reports in your custom application.
77 |
78 | To **completely disable WER**, create a DWORD Value under the `HKEY_LOCAL_MACHINE\SOFTWARE\Microsoft\Windows\Windows Error Reporting` key, named `Disabled` and set its value to `1`. For 32-bit apps use the `HKEY_LOCAL_MACHINE\SOFTWARE\Wow6432Node\Microsoft\Windows\Windows Error Reporting` key.
79 |
80 | ### Automatic dump collection using AeDebug registry key
81 |
82 | There is a special [AeDebug](https://learn.microsoft.com/en-us/windows/win32/debug/configuring-automatic-debugging) key in the registry defining what should happen when an unhandled exception occurs in an application. You may find it under the `HKEY_LOCAL_MACHINE\SOFTWARE\Microsoft\Windows NT\CurrentVersion` key (or `HKEY_LOCAL_MACHINE\SOFTWARE\WOW6432Node\Microsoft\Windows NT\CurrentVersion` for 32-bit apps). Its important value keys include:
83 |
84 | - `Debugger` : REG_SZ - application which will be called to handle the problematic process (example value: `procdump.exe -accepteula -j "c:\dumps" %ld %ld %p`), the first %ld parameter is replaced with the process ID and the second with the event handle
85 | - `Auto` : REG_SZ - defines if the debugger runs automatically, without prompting the user (example value: 1)
86 | - `UserDebuggerHotKey` : REG_DWORD - not sure, but it looks it enables the Debug button on the exception handling message box (example value: 1)
87 |
88 | To set **WinDbg** as your default AeDebug debugger, run `windbg -I`. After running this command, WinDbg will launch on application crashes. You may also automate WinDbg to create a memory dump and then allow process to terminate, for example: `windbg -c ".dump /ma /u c:\dumps\crash.dmp; qd" -p %ld -e %ld -g`.
89 |
90 | My favourite tool to use as the automatic debugger is **procdump**. The command line to install it is `procdump -mp -i c:\dumps`, where c:\dumps is the folder where I would like to store the dumps of crashing apps.
91 |
92 | Diagnosing waits or high CPU usage
93 | ----------------------------------
94 |
95 | There are two ways of tracing CPU time. We could either use CPU sampling or Thread Time profiling. CPU sampling is about collecting samples in intervals: each CPU sample contains an instruction pointer to the currently executing code. Thus, this technique is excellent when diagnosing high CPU usage of an application. It won't work for analyzing waits in the applications. For such scenarios, we should rely on Thread Time profiling. It uses the system scheduler/dispatcher events to get detailed information about application CPU time. When combined with CPU sampling, it is the best non-invasive profiling solution.
96 |
97 | ### Collecting ETW trace
98 |
99 | We may use **PerfView** or **wpr.exe** to collect CPU samples and Thread Time events.
100 |
101 | When collecting CPU samples, PerfView relies on Profile events coming from the Kernel ETW provider which has very low impact on the system overall performance. An example command to start the CPU sampling:
102 |
103 | ```shell
104 | perfview collect -NoGui -KernelEvents:Profile,ImageLoad,Process,Thread -ClrEvents:JITSymbols cpu-collect.etl
105 | ```
106 |
107 | Alternatively, you may use the Collect dialog. Make sure the Cpu Samples checkbox is selected.
108 |
109 | To collect Thread Time events, you may use the following command:
110 |
111 | ```shell
112 | perfview collect -NoGui -ThreadTime thread-time-collect.etl
113 | ```
114 |
115 | The Collect dialog has also the Thread Time checkbox.
116 |
117 | ### Anaysing the collected traces
118 |
119 | For analyzing **CPU Samples**, use the **CPU Stacks** view. Always check the number of samples if it corresponds to the tracing time (CPU sampling works when we have enough events). If necessary, zoom into the interesting period using a histogram (select the time and press Alt + R). Checking the **By Name** tab could be enough to find the method responsible for the high CPU Usage (look at the inclusive time and make sure you use correct grouping patterns).
120 |
121 | When analyzing waits in an application, we should use the **Thread Time Stacks** views. The default one, **with StartStop activities**, tries to group the tasks under activities and helps diagnose application activities, such as HTTP requests or database queries. Remember that the exclusive time in the activities view is a sum of all the child tasks. The thread under the activity is the thread on which the task started, not necessarily the one on which it continued. The **with ReadyThread** view can help when we are looking for thread interactions. For example, we want to find the thread that released a lock on which a given thread was waiting. The **Thread Time Stacks** view (with no grouping) is the best one to visualize the application's sequence of actions. Expanding thread nodes in the CallTree could take lots of time, so make sure you use other events (for example, from the Events view) to set the time ranges. As usual, check the grouping patterns.
122 |
123 | Diagnosing issues with DLL loading
124 | ----------------------------------
125 |
126 | An invaluable source of information when dealing with DLL loading issues are Windows Loader snaps. Those are detailed logs of the steps that Windows Loader takes to resolve the application library dependencies. They are one of the available Global Flags that we can set for an executable, so we may use the **gflags.exe** tool to enable them.
127 |
128 | 
129 |
130 | Alternatively, you may modify the process IFEO registry key, for example:
131 |
132 | ```
133 | Windows Registry Editor Version 5.00
134 |
135 | [HKEY_LOCAL_MACHINE\SOFTWARE\Microsoft\Windows NT\CurrentVersion\Image File Execution Options\winver.exe]
136 | "GlobalFlag"=dword:000000002
137 | ```
138 |
139 | Once enabled, you need to start the failing application under a debugger and the Loader logs should appear in the debug output.
140 |
141 | Alternatively, you may collect a procmon or ETW trace and search for any failure in the file events.
142 |
143 | {% endraw %}
144 |
--------------------------------------------------------------------------------
/guides/windows-performance-counters.md:
--------------------------------------------------------------------------------
1 | ---
2 | layout: page
3 | title: Windows Performance Counters
4 | date: 2024-01-01 08:00:00 +0200
5 | redirect_from:
6 | - /guides/using-perfomance-counters/
7 | ---
8 |
9 | {% raw %}
10 |
11 | **Table of contents:**
12 |
13 |
14 |
15 | - [General information](#general-information)
16 | - [Listing Performance Counters installed in the system](#listing-performance-counters-installed-in-the-system)
17 | - [Collecting performance data](#collecting-performance-data)
18 | - [Examining the collected performance data](#examining-the-collected-performance-data)
19 | - [Using system tools](#using-system-tools)
20 | - [Using Log Parser](#using-log-parser)
21 | - [Save performance data in SQL Server](#save-performance-data-in-sql-server)
22 | - [Fix problems with Performance Counters](#fix-problems-with-performance-counters)
23 | - [Corrupted counters](#corrupted-counters)
24 |
25 |
26 |
27 | ## General information
28 |
29 | The Performance Counter selection uses following syntax: `\\Computer\PerfObject(ParentInstance/ObjectInstance#InstanceIndex)\Counter`.
30 |
31 | In order to match the process instance index with a PID you may use a special counter `\Process(*)\ID Process`. Similar counter (`\.NET CLR Memory(*)\Process ID`) exists for .NET Framework apps. If we want to track performance data for a particular process, we should start with collecting data from those two counters, for example:
32 |
33 | ```shell
34 | typeperf -c "\Process(*)\ID Process" -si 1 -sc 1 -f CSV -o pids.txt
35 | typeperf -c "\.NET CLR Memory(*)\Process ID" -si 1 -sc 1 -f CSV -o clr-pids.txt
36 | ```
37 |
38 | An application that supports Performance Counters must have a **Performance** key under the **HKLM\SYSTEM\CurrentControlSet\Services\appname** key. The following example shows the values that you must include for this key.
39 |
40 | HKEY_LOCAL_MACHINE
41 | \SYSTEM
42 | \CurrentControlSet
43 | \Services
44 | \application-name
45 | \Linkage
46 | Export = a REG_MULTI_SZ value that will be passed to the `OpenPerformanceData` function
47 | \Performance
48 | Library = Name of your performance DLL
49 | Open = Name of your Open function in your DLL
50 | Collect = Name of your Collect function in your DLL
51 | Close = Name of your Close function in your DLL
52 | Open Timeout = Timeout when waiting for the `OpenPerformanceData` to finish
53 | Collect Timeout = Timeout when waiting for the `CollectPerformanceData` to finish
54 | Disable Performance Counters = A value added by system if something is wrong with the library
55 |
56 | The Performance Counter names and descriptions are stored under the **HKLM\SOFTWARE\Microsoft\Windows NT\CurrentVersion\Perflib** key in the registry.
57 |
58 | HKEY_LOCAL_MACHINE
59 | \SOFTWARE
60 | \Microsoft
61 | \Windows NT
62 | \CurrentVersion
63 | \Perflib
64 | Last Counter = highest counter index
65 | Last Help = highest help index
66 | \009
67 | Counters = 2 System 4 Memory...
68 | Help = 3 The System Object Type...
69 | \supported language, other than English
70 | Counters = ...
71 | Help = ...
72 |
73 | ## Listing Performance Counters installed in the system
74 |
75 | To list the available Performance Counters we may use the **Get-Counter** cmdlet in **PowerShell** or the **typeperf** command.
76 |
77 | For example, below, we look for Performance Counters in the `processor` set:
78 |
79 | ```
80 | PS> Get-Counter -listset processor
81 |
82 | CounterSetName : Processor
83 | MachineName : .
84 | CounterSetType : MultiInstance
85 | Description : The Processor performance object consists of counters that measure aspects of processor activity.
86 | The processor is the part of the computer that performs arithmetic and logical computations, initi
87 | ates operations on peripherals, and runs the threads of processes. A computer can have multiple p
88 | rocessors. The processor object represents each processor as an instance of the object.
89 | Paths : {\Processor(*)\% Processor Time, \Processor(*)\% User Time, \Processor(*)\% Privileged Time, \Proc
90 | essor(*)\Interrupts/sec...}
91 | PathsWithInstances : {\Processor(0)\% Processor Time, \Processor(1)\% Processor Time, \Processor(_Total)\% Processor Ti
92 | me, \Processor(0)\% User Time...}
93 | Counter : {\Processor(*)\% Processor Time, \Processor(*)\% User Time, \Processor(*)\% Privileged Time, \Proc
94 | essor(*)\Interrupts/sec...}
95 | ```
96 |
97 | The Get-Counter cmdlet accepts also **wildcards** and is case insensitive so to list Performance Counter sets which starts with `.net` you may issue command: `Get-Counter -listset .net*`.
98 |
99 | To find all Performance Counters for the `.NET CLR Memory` object using **typeperf**, we could run:
100 |
101 | ```
102 | > typeperf -q ".NET CLR Memory"
103 | \.NET CLR Memory(*)\# Gen 0 Collections
104 | \.NET CLR Memory(*)\# Gen 1 Collections
105 | ...
106 | ```
107 |
108 | If we also want to include instance information:
109 |
110 | ```
111 | > typeperf -qx ".NET CLR Memory"
112 | \.NET CLR Memory(_Global_)\# Gen 0 Collections
113 | \.NET CLR Memory(powershell)\# Gen 0 Collections
114 | \.NET CLR Memory(powershell#1)\# Gen 0 Collections
115 | \.NET CLR Memory(_Global_)\# Gen 1 Collections
116 | \.NET CLR Memory(powershell)\# Gen 1 Collections
117 | ...
118 | ```
119 |
120 | Finally, the **lodctr** extracts Performance Counters information from the registry:
121 |
122 | ```
123 | > lodctr /q:".NET CLR Data"
124 | Performance Counter ID Queries [PERFLIB]:
125 | Base Index: 0x00000737 (1847)
126 | Last Counter Text ID: 0x0000435A (17242)
127 | Last Help Text ID: 0x0000435B (17243)
128 |
129 | [.NET CLR Data] Performance Counters (Enabled)
130 | DLL Name: netfxperf.dll
131 | Open Procedure: OpenPerformanceData
132 | Collect Procedure: CollectPerformanceData
133 | Close Procedure: ClosePerformanceData
134 | First Counter ID: 0x000013A4 (5028)
135 | Last Counter ID: 0x000013B0 (5040)
136 | First Help ID: 0x000013A5 (5029)
137 | Last Help ID: 0x000013B1 (5041)
138 | ```
139 |
140 | ## Collecting performance data
141 |
142 | We could use the same tools we used for querying also to collect Performance Counters data. In **PowerShell**, to collect 50 samples (with 1s interval) from all the process counters and save them to a binary file we could run the following set of commands:
143 |
144 | ```shell
145 | (Cet-Counter -listset process).Paths > counters.txt
146 | Get-Counter (gc .\counters.txt) -sampleinterval 1 -maxsamples 20 | Export-Counter testdata.blg -FileFormat BLG -Force
147 | ```
148 |
149 | Another example shows how to collect samples with interval 2s until ctrl-c is pressed:
150 |
151 | ```shell
152 | Get-Counter (gc .\counters.txt) -sampleinterval 2 -continuous /
153 | ```
154 |
155 | We may achieve the same results with **typeperf**, for example:
156 |
157 | ```shell
158 | typeperf -cf .\counters.txt -si 1 -o testdata.blg -f BIN -sc 20
159 | typeperf -cf .\counters.txt -si 1
160 | ```
161 |
162 | Of course, with both PowerShell or typeperf, we may also retrieve only one counter data:
163 |
164 | ```shell
165 | typeperf -c "\process(*)\% Processor Time" -si 1 -sc 20 -o testdata.blg -f BIN
166 | ```
167 |
168 | Finally, we have a gui tool, **perfmon** that allows us to pick the interesting counters and present their values in a graph. We may also trigger a scheduled task when a specific counter threshold is met. You just need to manually create a **User-Created Data Collector** of type **Performance Counter Alert**. You will then be able select which counter values are interesting for you.
169 |
170 | ## Examining the collected performance data
171 |
172 | ### Using system tools
173 |
174 | If we saved the counters data to a binary file, we can open it with **perfmon**:
175 |
176 | ```shell
177 | perfmon /sys /open "c:\temp\testdata.blg"
178 | ```
179 |
180 | *REMARK: Remember to specify full path to the binary file.*
181 |
182 | A command line tool to query the collected performance data is **relog**. For example, to list the Performance Counters available in the input file, run the following command:
183 |
184 | ```shell
185 | relog -q testdata.blg
186 | ```
187 |
188 | In PowerShell, the **Import-Counter** cmdlet reads performance data generated by any Performance Counter tool and converts it to the performance data objects (the same as generated by the **Get-Counter** command).
189 |
190 | Collect Performance Counter binary data and convert it using the **Import-Counter** cmdlet:
191 |
192 | ```shell
193 | typeperf -cf .\counters.txt -si 1 -o testdata.blg -f BIN -sc 20
194 | Import-Counter .\testdata.blg
195 | ```
196 |
197 | The Import-Counter cmdlet may show statistics for the performance data file, for example:
198 |
199 | ```
200 | PS C:\temp> Import-Counter .\testdata.blg -summary
201 |
202 | OldestRecord NewestRecord SampleCount
203 | ------------ ------------ -----------
204 | 2012-03-31 15:54:27 2012-03-31 15:54:46 20
205 | ```
206 |
207 | ### Using Log Parser
208 |
209 | **[Log Parser Studio](https://techcommunity.microsoft.com/t5/exchange-team-blog/introducing-log-parser-studio/ba-p/601131)** and the command line **[logparser](https://www.microsoft.com/en-in/download/details.aspx?id=24659)** tool (and library) are great data analysing tools and we may use them to query Performance Counters data as well. They do not understand the BLG format so before we can look into the data we need to convert the BLG file to CSV format (additional filtering is possible):
210 |
211 | ```shell
212 | relog -f CSV testdata.blg -o testdata.csv
213 | ```
214 |
215 | And we are ready to use logparser to parse the data, for example:
216 |
217 | ```shell
218 | logparser "select * from testdata.csv" -o:DATAGRID
219 |
220 | logparser "select top 2 [Event Name], Type, [User Data] into c:\temp\test.csv from dumpfile.csv"
221 | ```
222 |
223 | To draw a chart presenting the Performance Counters data use the following syntax:
224 |
225 | ```shell
226 | logparser "select [time], [\\pecet\process(system)\% user time],[\\pecet\process(_total)\% user time] into test.gif from testdata.csv" -o:CHART
227 |
228 | logparser "select to_timestamp(time, 'MM/dd/yyyy HH:mm:ss.ll'), [\\pecet\process(system)\% user time],[\\pecet\process(_total)\% user time] into test.gif from testdata.csv" -o:CHART
229 | ```
230 |
231 | ### Save performance data in SQL Server
232 |
233 | To save Performance Counters data in SQL Server, you need to create a new Data Source (ODBC) using the SQL Server driver (SQLSRV32.dll). Then run the relog tool, for example:
234 |
235 | ```
236 | > relog -f SQL -o SQL:Test!fd .\memperfdata-blog.csv
237 |
238 | Input
239 | ----------------
240 | File(s):
241 | .\memperfdata-blog.csv (CSV)
242 |
243 | Begin: 2012-4-17 6:44:15
244 | End: 2012-4-17 6:44:25
245 | Samples: 10
246 |
247 | 100.00%
248 |
249 | Output
250 | ----------------
251 | File: SQL:Test!fd
252 |
253 | Begin: 2012-4-17 6:44:15
254 | End: 2012-4-17 6:44:25
255 | Samples: 4
256 |
257 | The command completed successfully.
258 | ```
259 |
260 | More information:
261 |
262 | - Relog Syntax Examples (for SQL Server)
263 |
264 | - SQL Log File Schema
265 |
266 |
267 | ## Fix problems with Performance Counters
268 |
269 | ### Corrupted counters
270 |
271 | Performance Counters sometimes might become corrupted - in such a case try to locate last Performance Counter data backup in C:\Windows\System32 folder. It should have a name similar to **PerfStringBackup.ini**. Before making any changes make backup of your current perf counters:
272 |
273 | ```
274 | lodctr /S:PerfStringBackup_broken.ini
275 | ```
276 |
277 | and then restore the counters:
278 |
279 | ```
280 | lodctr /R:PerfStringBackup.ini
281 | ```
282 |
283 | {% endraw %}
284 |
--------------------------------------------------------------------------------
/guides/network-tracing-tools.md:
--------------------------------------------------------------------------------
1 | ---
2 | layout: page
3 | title: Network tracing tools
4 | date: 2024-01-01 08:00:00 +0200
5 | redirect_from:
6 | - /guides/using-network-tracing-tools/
7 | ---
8 |
9 |
10 |
11 | - [Testing connectivity](#testing-connectivity)
12 | - [Collecting network traces](#collecting-network-traces)
13 | - [pktmon \(Windows\)](#pktmon-windows)
14 | - [netsh \(Windows\)](#netsh-windows)
15 | - [tcpdump \(Linux\)](#tcpdump-linux)
16 | - [Measuring network latency](#measuring-network-latency)
17 | - [Measuring network bandwidth](#measuring-network-bandwidth)
18 | - [Logging HTTP\(S\) requests in a proxy](#logging-https-requests-in-a-proxy)
19 |
20 |
21 |
22 | ## Testing connectivity
23 |
24 | It is a common mistake to rely on ping when testing TCP connections. Ping uses a different protocol (ICMP) and although it is a fine tool to check if there is connectivity between two hosts (assuming ICMP traffic is not blocked), it will not tell us anything about opened TCP ports.
25 |
26 | On **Linux**, to check if there is anything listening on a TCP port 80 on a remote host, you may use **netcat**:
27 |
28 | ```shell
29 | nc -vnz 192.168.0.20 80
30 | ```
31 |
32 | On **Windows**, we may use the `Test-NetConnection` (`tnc`) cmdlet, for example:
33 |
34 | ```sh
35 | tnc example.com -Port 443
36 |
37 | # ComputerName : example.com
38 | # RemoteAddress : 23.215.0.138
39 | # RemotePort : 443
40 | # InterfaceAlias : Ethernet
41 | # SourceAddress : 192.168.88.164
42 | # TcpTestSucceeded : True
43 | ```
44 |
45 | PsPing (a part of the [Sysinternals toolkit](https://technet.microsoft.com/en-us/sysinternals)) also has few interesting options when it comes to diagnosing network connectivity issues. The simplest usage is just a replacement for a ping.exe tool (performs ICMP ping):
46 |
47 | ```shell
48 | psping www.google.com
49 | ```
50 |
51 | By adding a port number at the end of the host we will test a TCP handshake (or discover a closed port on the remote host):
52 |
53 | ```shell
54 | psping www.google.com:80
55 | ```
56 |
57 | To test UDP add **-u** option on the command line.
58 |
59 | ## Collecting network traces
60 |
61 | Probably the best tool to analyze network traffic is **[Wireshark](https://www.wireshark.org/)**. Of course, Wireshark may also collect network traffic. However, as it's a GUI application, you may have problems running it on servers. On Windows, Wireshark requires an npcap driver which might also generate problems. Therefore, a better choice might be to use command line tools that I discuss later in this ection.
62 |
63 | Another problem in network traces is that they lack the ID of the process owning the network connection. We might get this information with the help of other tracing tools. For example, in [this blog post](https://lowleveldesign.org/2018/05/11/correlate-pids-with-network-packets-in-wireshark/), I present how to use Process Monitor logs for this purpose.
64 |
65 | ### pktmon (Windows)
66 |
67 | Switching to the command line tools, starting with **Window 10 (Server 2019)**, we have a new network tracing tool in our arsenal: **pktmon**. It groups packets per components in the network stack, which is especially helpful when monitoring virtualized applications. Here are some usage examples:
68 |
69 | ```shell
70 | # List active components in the network stack
71 | pktmon component list
72 |
73 | # Create a filter for TCP traffic for the 172.29.235.111 IP and the 8080 port
74 | pktmon filter add -t tcp -i 172.29.235.111 -p 8080
75 |
76 | # Show the configured filters
77 | pktmon filter list
78 |
79 | # Start the capturing session (-c) for all the components (--comp)
80 | pktmon start -c --comp all && timeout -1 && pktmon stop
81 |
82 | # Start the capture session (-c) for all NICs only (--comp), logging the entire
83 | # packets (--pkt-size 0), overwriting the older packets when the output file
84 | # reaches 512MB (-m circular -s 512)
85 | pktmon start -c --comp nics --pkt-size 0 -m circular -s 512 -f c:\network-trace.etl && timeout -1 && pktmon stop
86 | ```
87 |
88 | We may later convert the etl file to open it in Wireshark:
89 |
90 | ```shell
91 | pktmon etl2pcap C:\network-trace.etl --out C:\network-trace.pcap
92 | ```
93 |
94 | If the pcap file contains duplicate network packets, it is probably because same packets were logged by different network components. We can use the `--comp` parameter also in the `etl2pcap` subcommand to filter the packets, for example:
95 |
96 | ```shell
97 | pktmon etl2pcap C:\network-trace.etl --out C:\network-trace.pcap --comp 12
98 | ```
99 |
100 | If you don't know the component number, you may use the `etl2txt` subcommand to list events in text format with their component IDs, and then pick the right component.
101 |
102 | ### netsh (Windows)
103 |
104 | Netsh is another tool we could use for this purpose on Windows (even on **older Windows versions**). The **netsh trace {start\|stop}** command will create an ETW-based network trace, allowing us to choose from a variety of diagnostics scenarios:
105 |
106 | ```
107 | > netsh trace show scenarios
108 |
109 | Available scenarios (18):
110 | -------------------------------------------------------------------
111 | AddressAcquisition : Troubleshoot address acquisition-related issues
112 | DirectAccess : Troubleshoot DirectAccess related issues
113 | FileSharing : Troubleshoot common file and printer sharing problems
114 | InternetClient : Diagnose web connectivity issues
115 | InternetServer : Set of HTTP service counters
116 | L2SEC : Troubleshoot layer 2 authentication related issues
117 | LAN : Troubleshoot wired LAN related issues
118 | Layer2 : Troubleshoot layer 2 connectivity related issues
119 | MBN : Troubleshoot mobile broadband related issues
120 | NDIS : Troubleshoot network adapter related issues
121 | NetConnection : Troubleshoot issues with network connections
122 | P2P-Grouping : Troubleshoot Peer-to-Peer Grouping related issues
123 | P2P-PNRP : Troubleshoot Peer Name Resolution Protocol (PNRP) related issues
124 | RemoteAssistance : Troubleshoot Windows Remote Assistance related issues
125 | Virtualization : Troubleshoot network connectivity issues in virtualization environment
126 | WCN : Troubleshoot Windows Connect Now related issues
127 | WFP-IPsec : Troubleshoot Windows Filtering Platform and IPsec related issues
128 | WLAN : Troubleshoot wireless LAN related issues
129 | ```
130 |
131 | *NOTE: For DHCP traces you may check netsh dhcpclient trace ... commands. Also LAN and WLAN modes have some tracing capabilities which you may enable with a command netsh (w)lan set tracing mode=yes and stop with a command netsh (w)lan set tracing mode=no*
132 |
133 | To know exactly which providers are enabled in each scenario use **netsh trace show scenario {scenarioname}**. After choosing the right scenario for your diagnosing case start the trace, for example:
134 |
135 | ```shell
136 | netsh trace start scenario=InternetClient capture=yes && timeout -1 && netsh trace stop
137 | ```
138 |
139 | A new .etl file should be created in the output directory (as well as a .cab file with some interesting system logs). If you only need a trace file, you may add **report=no tracefile=d:\temp\net.etl** paramters. Some ETW providers do not generate information about the processes related to the specific events (for instance WFP provider) - keep this in mind when choosing your own set.
140 |
141 | Many interesting capture filters are available, you may use **netsh trace show CaptureFilterHelp** to list them. Most interesting include CaptureInterface, Protocol, Ethernet, IPv4, and IPv6 options set, for example:
142 |
143 | ```shell
144 | netsh trace start scenario=InternetClient capture=yes CaptureInterface="Local Area Connection 2" Protocol=TCP Ethernet.Type=IPv4 IPv4.Address=157.59.136.1 maxSize=250 fileMode=circular overwrite=yes traceFile=c:\temp\nettrace.etl
145 | ```
146 |
147 | We can **convert the generated .etl file to .pcapng** with the [etl2pcapng](https://github.com/microsoft/etl2pcapng) tool, and open them in Wireshark.
148 |
149 | ### tcpdump (Linux)
150 |
151 | Most commonly used tool to collect network traces on Linux is **tcpdump**. The BPF language is quite complex and allows various filtering options. A great explanation of its syntax can be found [here](http://www.biot.com/capstats/bpf.html). Below, you may find example session configurations.
152 |
153 | ```shell
154 | # View traffic only between two hosts:
155 | tcpdump host 192.168.0.1 && host 192.168.0.2
156 |
157 | # View traffic in a particular network:
158 | tcpdump net 192.168.0.1/24
159 |
160 | # Dump traffic to a file and rotate it every 1KB:
161 | tcpdump -C 1024 -w test.pcap
162 | ```
163 |
164 | ## Measuring network latency
165 |
166 | On **Windows**, we may use **psping**. We need to run it in a server mode on the connection target (-f for creating a temporary exception in the Windows Firewall, -s to enable server listening mode):
167 |
168 | ```shell
169 | psping -f -s 192.168.1.3:4000
170 | ```
171 |
172 | Then start the client and perform the test:
173 |
174 | ```shell
175 | psping -l 16k -n 100 192.168.1.3:4000
176 | ```
177 |
178 | ## Measuring network bandwidth
179 |
180 | **iperf** is a tool that can measure bandwidth on Windows and Linux. We need to start the iperf server (-s) (the -e option is to enable enhanced output and -l sets the TCP read buffer size):
181 |
182 | ```shell
183 | iperf -s -l 128k -p 8080 -e
184 | ```
185 |
186 | Then, for an example test, we may run the client for 30s (-t) using two parallel threads (-P) and showing interval summaries every 2s (-i):
187 |
188 | ```shell
189 | iperf -c 172.30.102.167 -p 8080 -l 128k -P 2 -i 2 -t 30
190 | ```
191 |
192 | On **Windows**, we may alternatively use **psping**. Again, we need to run it in a server mode on the connection target (-f for creating a temporary exception in the Windows Firewall, -s to enable server listening mode):
193 |
194 | ```shell
195 | psping -f -s 192.168.1.3:4000
196 | ```
197 |
198 | Then start the client and perform the test:
199 |
200 | ```shell
201 | psping -b -l 16k -n 100 192.168.1.3:4000
202 | ```
203 |
204 | ## Logging HTTP(S) requests in a proxy
205 |
206 | If you are on Windows, use the system settings to change the system proxy. On Linux, set the **HTTP_PROXY** and **HTTPS_PROXY** variables, for example:
207 |
208 | ```bash
209 | export HTTP_PROXY="http://localhost:8080"
210 | export HTTPS_PROXY="http://localhost:8080"
211 | ```
212 |
213 | When you make a request in code you should remember to configure its proxy according to the system settings, for exampe in C#:
214 |
215 | ```csharp
216 | var request = WebRequest.Create(url);
217 | request.Proxy = WebRequest.GetSystemWebProxy();
218 | request.Method = "POST";
219 | request.ContentType = "application/json; charset=utf-8";
220 | ...
221 | ```
222 |
223 | or in the configuration file:
224 |
225 | ```xml
226 |
227 |
228 |
229 |
230 |
231 | ```
232 |
233 | Then run [Fiddler](http://www.telerik.com/fiddler) (or [Burp Suite](https://portswigger.net/burp/) or any other proxy) and requests data should appear in the sessions window. Unfortunately, this approach won't work for requests to applications served on the local server. A workaround is to use one of the Fiddler's localhost alternatives in the url: `ipv4.fiddler`, `ipv6.fiddler` or `localhost.fiddler` (more [here](http://docs.telerik.com/fiddler/Configure-Fiddler/Tasks/MonitorLocalTraffic)).
234 |
235 | **NOTE for WCF clients**: WCF has its own proxy settings, to use the default proxy add an `useDefaultWebProxy=true` attribute to your binding.
236 |
237 | If you want to trace HTTPS traffic you probably also need to **install the Root CA** of your proxy. On Windows, install the certificate to the Third-Party Root Certification Authorities. On Ubuntu Linux, run the following commands:
238 |
239 | ```bash
240 | sudo mkdir /usr/share/ca-certificates/extra
241 | sudo cp mitmproxy.crt /usr/share/ca-certificates/extra/mitmproxy.crt
242 | sudo dpkg-reconfigure ca-certificates
243 | ```
244 |
245 | *NOTE for Python*: if there is Python code that you need to trace, use `export REQUESTS_CA_BUNDLE=/etc/ssl/certs/ca-certificates.crt` to force Python to validate TLS certs with your system cert store.
246 |
247 | If you would like to apply custom modifications to the proxied requests, you should consider implementing your own network proxy. I present several C# examples of such proxies in [a blog post](https://lowleveldesign.wordpress.com/2020/02/03/writing-network-proxies-for-development-purposes-in-c/) on my blog.
248 |
--------------------------------------------------------------------------------
/LICENSE:
--------------------------------------------------------------------------------
1 | Attribution 4.0 International
2 |
3 | =======================================================================
4 |
5 | Creative Commons Corporation ("Creative Commons") is not a law firm and
6 | does not provide legal services or legal advice. Distribution of
7 | Creative Commons public licenses does not create a lawyer-client or
8 | other relationship. Creative Commons makes its licenses and related
9 | information available on an "as-is" basis. Creative Commons gives no
10 | warranties regarding its licenses, any material licensed under their
11 | terms and conditions, or any related information. Creative Commons
12 | disclaims all liability for damages resulting from their use to the
13 | fullest extent possible.
14 |
15 | Using Creative Commons Public Licenses
16 |
17 | Creative Commons public licenses provide a standard set of terms and
18 | conditions that creators and other rights holders may use to share
19 | original works of authorship and other material subject to copyright
20 | and certain other rights specified in the public license below. The
21 | following considerations are for informational purposes only, are not
22 | exhaustive, and do not form part of our licenses.
23 |
24 | Considerations for licensors: Our public licenses are
25 | intended for use by those authorized to give the public
26 | permission to use material in ways otherwise restricted by
27 | copyright and certain other rights. Our licenses are
28 | irrevocable. Licensors should read and understand the terms
29 | and conditions of the license they choose before applying it.
30 | Licensors should also secure all rights necessary before
31 | applying our licenses so that the public can reuse the
32 | material as expected. Licensors should clearly mark any
33 | material not subject to the license. This includes other CC-
34 | licensed material, or material used under an exception or
35 | limitation to copyright. More considerations for licensors:
36 | wiki.creativecommons.org/Considerations_for_licensors
37 |
38 | Considerations for the public: By using one of our public
39 | licenses, a licensor grants the public permission to use the
40 | licensed material under specified terms and conditions. If
41 | the licensor's permission is not necessary for any reason--for
42 | example, because of any applicable exception or limitation to
43 | copyright--then that use is not regulated by the license. Our
44 | licenses grant only permissions under copyright and certain
45 | other rights that a licensor has authority to grant. Use of
46 | the licensed material may still be restricted for other
47 | reasons, including because others have copyright or other
48 | rights in the material. A licensor may make special requests,
49 | such as asking that all changes be marked or described.
50 | Although not required by our licenses, you are encouraged to
51 | respect those requests where reasonable. More considerations
52 | for the public:
53 | wiki.creativecommons.org/Considerations_for_licensees
54 |
55 | =======================================================================
56 |
57 | Creative Commons Attribution 4.0 International Public License
58 |
59 | By exercising the Licensed Rights (defined below), You accept and agree
60 | to be bound by the terms and conditions of this Creative Commons
61 | Attribution 4.0 International Public License ("Public License"). To the
62 | extent this Public License may be interpreted as a contract, You are
63 | granted the Licensed Rights in consideration of Your acceptance of
64 | these terms and conditions, and the Licensor grants You such rights in
65 | consideration of benefits the Licensor receives from making the
66 | Licensed Material available under these terms and conditions.
67 |
68 |
69 | Section 1 -- Definitions.
70 |
71 | a. Adapted Material means material subject to Copyright and Similar
72 | Rights that is derived from or based upon the Licensed Material
73 | and in which the Licensed Material is translated, altered,
74 | arranged, transformed, or otherwise modified in a manner requiring
75 | permission under the Copyright and Similar Rights held by the
76 | Licensor. For purposes of this Public License, where the Licensed
77 | Material is a musical work, performance, or sound recording,
78 | Adapted Material is always produced where the Licensed Material is
79 | synched in timed relation with a moving image.
80 |
81 | b. Adapter's License means the license You apply to Your Copyright
82 | and Similar Rights in Your contributions to Adapted Material in
83 | accordance with the terms and conditions of this Public License.
84 |
85 | c. Copyright and Similar Rights means copyright and/or similar rights
86 | closely related to copyright including, without limitation,
87 | performance, broadcast, sound recording, and Sui Generis Database
88 | Rights, without regard to how the rights are labeled or
89 | categorized. For purposes of this Public License, the rights
90 | specified in Section 2(b)(1)-(2) are not Copyright and Similar
91 | Rights.
92 |
93 | d. Effective Technological Measures means those measures that, in the
94 | absence of proper authority, may not be circumvented under laws
95 | fulfilling obligations under Article 11 of the WIPO Copyright
96 | Treaty adopted on December 20, 1996, and/or similar international
97 | agreements.
98 |
99 | e. Exceptions and Limitations means fair use, fair dealing, and/or
100 | any other exception or limitation to Copyright and Similar Rights
101 | that applies to Your use of the Licensed Material.
102 |
103 | f. Licensed Material means the artistic or literary work, database,
104 | or other material to which the Licensor applied this Public
105 | License.
106 |
107 | g. Licensed Rights means the rights granted to You subject to the
108 | terms and conditions of this Public License, which are limited to
109 | all Copyright and Similar Rights that apply to Your use of the
110 | Licensed Material and that the Licensor has authority to license.
111 |
112 | h. Licensor means the individual(s) or entity(ies) granting rights
113 | under this Public License.
114 |
115 | i. Share means to provide material to the public by any means or
116 | process that requires permission under the Licensed Rights, such
117 | as reproduction, public display, public performance, distribution,
118 | dissemination, communication, or importation, and to make material
119 | available to the public including in ways that members of the
120 | public may access the material from a place and at a time
121 | individually chosen by them.
122 |
123 | j. Sui Generis Database Rights means rights other than copyright
124 | resulting from Directive 96/9/EC of the European Parliament and of
125 | the Council of 11 March 1996 on the legal protection of databases,
126 | as amended and/or succeeded, as well as other essentially
127 | equivalent rights anywhere in the world.
128 |
129 | k. You means the individual or entity exercising the Licensed Rights
130 | under this Public License. Your has a corresponding meaning.
131 |
132 |
133 | Section 2 -- Scope.
134 |
135 | a. License grant.
136 |
137 | 1. Subject to the terms and conditions of this Public License,
138 | the Licensor hereby grants You a worldwide, royalty-free,
139 | non-sublicensable, non-exclusive, irrevocable license to
140 | exercise the Licensed Rights in the Licensed Material to:
141 |
142 | a. reproduce and Share the Licensed Material, in whole or
143 | in part; and
144 |
145 | b. produce, reproduce, and Share Adapted Material.
146 |
147 | 2. Exceptions and Limitations. For the avoidance of doubt, where
148 | Exceptions and Limitations apply to Your use, this Public
149 | License does not apply, and You do not need to comply with
150 | its terms and conditions.
151 |
152 | 3. Term. The term of this Public License is specified in Section
153 | 6(a).
154 |
155 | 4. Media and formats; technical modifications allowed. The
156 | Licensor authorizes You to exercise the Licensed Rights in
157 | all media and formats whether now known or hereafter created,
158 | and to make technical modifications necessary to do so. The
159 | Licensor waives and/or agrees not to assert any right or
160 | authority to forbid You from making technical modifications
161 | necessary to exercise the Licensed Rights, including
162 | technical modifications necessary to circumvent Effective
163 | Technological Measures. For purposes of this Public License,
164 | simply making modifications authorized by this Section 2(a)
165 | (4) never produces Adapted Material.
166 |
167 | 5. Downstream recipients.
168 |
169 | a. Offer from the Licensor -- Licensed Material. Every
170 | recipient of the Licensed Material automatically
171 | receives an offer from the Licensor to exercise the
172 | Licensed Rights under the terms and conditions of this
173 | Public License.
174 |
175 | b. No downstream restrictions. You may not offer or impose
176 | any additional or different terms or conditions on, or
177 | apply any Effective Technological Measures to, the
178 | Licensed Material if doing so restricts exercise of the
179 | Licensed Rights by any recipient of the Licensed
180 | Material.
181 |
182 | 6. No endorsement. Nothing in this Public License constitutes or
183 | may be construed as permission to assert or imply that You
184 | are, or that Your use of the Licensed Material is, connected
185 | with, or sponsored, endorsed, or granted official status by,
186 | the Licensor or others designated to receive attribution as
187 | provided in Section 3(a)(1)(A)(i).
188 |
189 | b. Other rights.
190 |
191 | 1. Moral rights, such as the right of integrity, are not
192 | licensed under this Public License, nor are publicity,
193 | privacy, and/or other similar personality rights; however, to
194 | the extent possible, the Licensor waives and/or agrees not to
195 | assert any such rights held by the Licensor to the limited
196 | extent necessary to allow You to exercise the Licensed
197 | Rights, but not otherwise.
198 |
199 | 2. Patent and trademark rights are not licensed under this
200 | Public License.
201 |
202 | 3. To the extent possible, the Licensor waives any right to
203 | collect royalties from You for the exercise of the Licensed
204 | Rights, whether directly or through a collecting society
205 | under any voluntary or waivable statutory or compulsory
206 | licensing scheme. In all other cases the Licensor expressly
207 | reserves any right to collect such royalties.
208 |
209 |
210 | Section 3 -- License Conditions.
211 |
212 | Your exercise of the Licensed Rights is expressly made subject to the
213 | following conditions.
214 |
215 | a. Attribution.
216 |
217 | 1. If You Share the Licensed Material (including in modified
218 | form), You must:
219 |
220 | a. retain the following if it is supplied by the Licensor
221 | with the Licensed Material:
222 |
223 | i. identification of the creator(s) of the Licensed
224 | Material and any others designated to receive
225 | attribution, in any reasonable manner requested by
226 | the Licensor (including by pseudonym if
227 | designated);
228 |
229 | ii. a copyright notice;
230 |
231 | iii. a notice that refers to this Public License;
232 |
233 | iv. a notice that refers to the disclaimer of
234 | warranties;
235 |
236 | v. a URI or hyperlink to the Licensed Material to the
237 | extent reasonably practicable;
238 |
239 | b. indicate if You modified the Licensed Material and
240 | retain an indication of any previous modifications; and
241 |
242 | c. indicate the Licensed Material is licensed under this
243 | Public License, and include the text of, or the URI or
244 | hyperlink to, this Public License.
245 |
246 | 2. You may satisfy the conditions in Section 3(a)(1) in any
247 | reasonable manner based on the medium, means, and context in
248 | which You Share the Licensed Material. For example, it may be
249 | reasonable to satisfy the conditions by providing a URI or
250 | hyperlink to a resource that includes the required
251 | information.
252 |
253 | 3. If requested by the Licensor, You must remove any of the
254 | information required by Section 3(a)(1)(A) to the extent
255 | reasonably practicable.
256 |
257 | 4. If You Share Adapted Material You produce, the Adapter's
258 | License You apply must not prevent recipients of the Adapted
259 | Material from complying with this Public License.
260 |
261 |
262 | Section 4 -- Sui Generis Database Rights.
263 |
264 | Where the Licensed Rights include Sui Generis Database Rights that
265 | apply to Your use of the Licensed Material:
266 |
267 | a. for the avoidance of doubt, Section 2(a)(1) grants You the right
268 | to extract, reuse, reproduce, and Share all or a substantial
269 | portion of the contents of the database;
270 |
271 | b. if You include all or a substantial portion of the database
272 | contents in a database in which You have Sui Generis Database
273 | Rights, then the database in which You have Sui Generis Database
274 | Rights (but not its individual contents) is Adapted Material; and
275 |
276 | c. You must comply with the conditions in Section 3(a) if You Share
277 | all or a substantial portion of the contents of the database.
278 |
279 | For the avoidance of doubt, this Section 4 supplements and does not
280 | replace Your obligations under this Public License where the Licensed
281 | Rights include other Copyright and Similar Rights.
282 |
283 |
284 | Section 5 -- Disclaimer of Warranties and Limitation of Liability.
285 |
286 | a. UNLESS OTHERWISE SEPARATELY UNDERTAKEN BY THE LICENSOR, TO THE
287 | EXTENT POSSIBLE, THE LICENSOR OFFERS THE LICENSED MATERIAL AS-IS
288 | AND AS-AVAILABLE, AND MAKES NO REPRESENTATIONS OR WARRANTIES OF
289 | ANY KIND CONCERNING THE LICENSED MATERIAL, WHETHER EXPRESS,
290 | IMPLIED, STATUTORY, OR OTHER. THIS INCLUDES, WITHOUT LIMITATION,
291 | WARRANTIES OF TITLE, MERCHANTABILITY, FITNESS FOR A PARTICULAR
292 | PURPOSE, NON-INFRINGEMENT, ABSENCE OF LATENT OR OTHER DEFECTS,
293 | ACCURACY, OR THE PRESENCE OR ABSENCE OF ERRORS, WHETHER OR NOT
294 | KNOWN OR DISCOVERABLE. WHERE DISCLAIMERS OF WARRANTIES ARE NOT
295 | ALLOWED IN FULL OR IN PART, THIS DISCLAIMER MAY NOT APPLY TO YOU.
296 |
297 | b. TO THE EXTENT POSSIBLE, IN NO EVENT WILL THE LICENSOR BE LIABLE
298 | TO YOU ON ANY LEGAL THEORY (INCLUDING, WITHOUT LIMITATION,
299 | NEGLIGENCE) OR OTHERWISE FOR ANY DIRECT, SPECIAL, INDIRECT,
300 | INCIDENTAL, CONSEQUENTIAL, PUNITIVE, EXEMPLARY, OR OTHER LOSSES,
301 | COSTS, EXPENSES, OR DAMAGES ARISING OUT OF THIS PUBLIC LICENSE OR
302 | USE OF THE LICENSED MATERIAL, EVEN IF THE LICENSOR HAS BEEN
303 | ADVISED OF THE POSSIBILITY OF SUCH LOSSES, COSTS, EXPENSES, OR
304 | DAMAGES. WHERE A LIMITATION OF LIABILITY IS NOT ALLOWED IN FULL OR
305 | IN PART, THIS LIMITATION MAY NOT APPLY TO YOU.
306 |
307 | c. The disclaimer of warranties and limitation of liability provided
308 | above shall be interpreted in a manner that, to the extent
309 | possible, most closely approximates an absolute disclaimer and
310 | waiver of all liability.
311 |
312 |
313 | Section 6 -- Term and Termination.
314 |
315 | a. This Public License applies for the term of the Copyright and
316 | Similar Rights licensed here. However, if You fail to comply with
317 | this Public License, then Your rights under this Public License
318 | terminate automatically.
319 |
320 | b. Where Your right to use the Licensed Material has terminated under
321 | Section 6(a), it reinstates:
322 |
323 | 1. automatically as of the date the violation is cured, provided
324 | it is cured within 30 days of Your discovery of the
325 | violation; or
326 |
327 | 2. upon express reinstatement by the Licensor.
328 |
329 | For the avoidance of doubt, this Section 6(b) does not affect any
330 | right the Licensor may have to seek remedies for Your violations
331 | of this Public License.
332 |
333 | c. For the avoidance of doubt, the Licensor may also offer the
334 | Licensed Material under separate terms or conditions or stop
335 | distributing the Licensed Material at any time; however, doing so
336 | will not terminate this Public License.
337 |
338 | d. Sections 1, 5, 6, 7, and 8 survive termination of this Public
339 | License.
340 |
341 |
342 | Section 7 -- Other Terms and Conditions.
343 |
344 | a. The Licensor shall not be bound by any additional or different
345 | terms or conditions communicated by You unless expressly agreed.
346 |
347 | b. Any arrangements, understandings, or agreements regarding the
348 | Licensed Material not stated herein are separate from and
349 | independent of the terms and conditions of this Public License.
350 |
351 |
352 | Section 8 -- Interpretation.
353 |
354 | a. For the avoidance of doubt, this Public License does not, and
355 | shall not be interpreted to, reduce, limit, restrict, or impose
356 | conditions on any use of the Licensed Material that could lawfully
357 | be made without permission under this Public License.
358 |
359 | b. To the extent possible, if any provision of this Public License is
360 | deemed unenforceable, it shall be automatically reformed to the
361 | minimum extent necessary to make it enforceable. If the provision
362 | cannot be reformed, it shall be severed from this Public License
363 | without affecting the enforceability of the remaining terms and
364 | conditions.
365 |
366 | c. No term or condition of this Public License will be waived and no
367 | failure to comply consented to unless expressly agreed to by the
368 | Licensor.
369 |
370 | d. Nothing in this Public License constitutes or may be interpreted
371 | as a limitation upon, or waiver of, any privileges and immunities
372 | that apply to the Licensor or You, including from the legal
373 | processes of any jurisdiction or authority.
374 |
375 |
376 | =======================================================================
377 |
378 | Creative Commons is not a party to its public
379 | licenses. Notwithstanding, Creative Commons may elect to apply one of
380 | its public licenses to material it publishes and in those instances
381 | will be considered the “Licensor.” The text of the Creative Commons
382 | public licenses is dedicated to the public domain under the CC0 Public
383 | Domain Dedication. Except for the limited purpose of indicating that
384 | material is shared under a Creative Commons public license or as
385 | otherwise permitted by the Creative Commons policies published at
386 | creativecommons.org/policies, Creative Commons does not authorize the
387 | use of the trademark "Creative Commons" or any other trademark or logo
388 | of Creative Commons without its prior written consent including,
389 | without limitation, in connection with any unauthorized modifications
390 | to any of its public licenses or any other arrangements,
391 | understandings, or agreements concerning use of licensed material. For
392 | the avoidance of doubt, this paragraph does not form part of the
393 | public licenses.
394 |
395 | Creative Commons may be contacted at creativecommons.org.
396 |
397 |
--------------------------------------------------------------------------------
/guides/com-troubleshooting.md:
--------------------------------------------------------------------------------
1 | ---
2 | layout: page
3 | title: COM troubleshooting
4 | date: 2023-04-07 08:00:00 +0200
5 | redirect_from:
6 | - /articles/com-troubleshooting/
7 | - /articles/com-troubleshooting
8 | ---
9 |
10 | {% raw %}
11 |
12 | **Table of contents:**
13 |
14 |
15 |
16 | - [Quick introduction to COM](#quick-introduction-to-com)
17 | - [COM metadata](#com-metadata)
18 | - [Troubleshooting COM in WinDbg](#troubleshooting-com-in-windbg)
19 | - [Monitoring COM objects in a process](#monitoring-com-objects-in-a-process)
20 | - [Tracing COM methods](#tracing-com-methods)
21 | - [Stopping the COM monitor](#stopping-the-com-monitor)
22 | - [Observing COM interactions outside WinDbg](#observing-com-interactions-outside-windbg)
23 | - [Windows Performance Recorder \(wpr.exe\)](#windows-performance-recorder-wprexe)
24 | - [Process Monitor](#process-monitor)
25 | - [wtrace](#wtrace)
26 | - [Troubleshooting .NET COM interop](#troubleshooting-net-com-interop)
27 | - [Links](#links)
28 |
29 |
30 |
31 | Quick introduction to COM
32 | -------------------------
33 |
34 | In COM, everything is about interfaces. In old times, when various compiler vendors were fighting over whose "standard" was better, the only reliable way to call C++ class methods contained in third-party libraries was to use virtual tables. As its name suggests virtual table is a table, to be precise, a table of addresses (pointers). The "virtual" adjective relates to the fact that our table's addresses point to virtual methods. If you're familiar with object programming (you plan to debug COM, so you should!), you probably thought of inheritance and abstract classes. And that's correct! The abstract class is how we implement interfaces in C++ (to be more precise [an abstract class with pure virtual methods](https://en.cppreference.com/w/cpp/language/abstract_class)). Now, COM is all about passing pointers to those various virtual tables which happen to have GUID identifiers. The most important interface (parent of all interfaces) is `IUnknown`. Every COM interface must inherit from this interface. Why? For two reasons: to manage the object lifetime and to access all the other interfaces that our object may implement (or, in other words, to find all virtual tables our object is aware of). As this interface is so important, let's have a quick look at its definition:
35 |
36 | ```cpp
37 | struct __declspec(uuid("00000000-0000-0000-C000-000000000046"))) IUnknown
38 | {
39 | public:
40 | virtual HRESULT STDMETHODCALLTYPE QueryInterface(REFIID riid, void **ppvObject) = 0;
41 | virtual ULONG STDMETHODCALLTYPE AddRef( void) = 0;
42 | virtual ULONG STDMETHODCALLTYPE Release( void) = 0;
43 | };
44 | ```
45 |
46 | Guess which methods are responsible for lifetime management and which are for interface querying. OK, so we know the declaration, but to debug COM, we need to understand how COM objects are laid out in the memory. Let's have a look at a sample Probe class (the snippet comes from [my Protoss COM example repository](https://github.com/lowleveldesign/protoss-com-example)):
47 |
48 | ```cpp
49 | struct __declspec(uuid("59644217-3e52-4202-ba49-f473590cc61a")) IGameObject : public IUnknown
50 | {
51 | public:
52 | virtual HRESULT STDMETHODCALLTYPE get_Name(BSTR* name) = 0;
53 | virtual HRESULT STDMETHODCALLTYPE get_Minerals(LONG* minerals) = 0;
54 | virtual HRESULT STDMETHODCALLTYPE get_BuildTime(LONG* buildtime) = 0;
55 | };
56 |
57 | struct __declspec(uuid("246A22D5-CF02-44B2-BF09-AAB95A34E0CF")) IProbe : public IUnknown
58 | {
59 | public:
60 | virtual HRESULT STDMETHODCALLTYPE ConstructBuilding(BSTR building_name, IUnknown * *ppUnk) = 0;
61 | };
62 |
63 | class __declspec(uuid("EFF8970E-C50F-45E0-9284-291CE5A6F771")) Probe final : public IProbe, public IGameObject
64 | {
65 | ULONG ref_count;
66 | /* ... implementation .... */
67 | }
68 | ```
69 |
70 | If we instantiate (more on that later) the Probe class, its layout in the memory will look as follows:
71 |
72 | ```
73 | 0:000> dps 0xfb2f58 L4
74 | 00fb2f58 72367744 protoss!Probe::`vftable'
75 | 00fb2f5c 7236775c protoss!Probe::`vftable'
76 | 00fb2f60 00000001
77 | 00fb2f64 fdfdfdfd
78 |
79 | 0:000> dps 72367744 L4 * IProbe interface
80 | 72367744 72341bb3 protoss!ILT+2990(?QueryInterfaceProbeUAGJABU_GUIDPAPAXZ)
81 | 72367748 72341ba9 protoss!ILT+2980(?AddRefProbeUAGKXZ)
82 | 7236774c 723411ae protoss!ILT+425(?ReleaseProbeUAGKXZ)
83 | 72367750 723414d3 protoss!ILT+1230(?ConstructBuildingProbeUAGJPA_WPAPAUIUnknownZ)
84 |
85 | 0:000> dps 7236775c L6 * IGameUnit interface
86 | 7236775c 72341e3d protoss!ILT+3640(?QueryInterfaceProbeW3AGJABU_GUIDPAPAXZ)
87 | 72367760 723416fe protoss!ILT+1785(?AddRefProbeW3AGKXZ)
88 | 72367764 72341096 protoss!ILT+145(?ReleaseProbeW3AGKXZ)
89 | 72367768 723415f0 protoss!ILT+1515(?get_NameProbeUAGJPAPA_WZ)
90 | 7236776c 723419d8 protoss!ILT+2515(?get_MineralsProbeUAGJPAJZ)
91 | 72367770 72341e1a protoss!ILT+3605(?get_BuildTimeProbeUAGJPAJZ)
92 | ```
93 |
94 | Notice the pointers at the beginning of the object memory. As you can see in the snippet, those pointers reference arrays of function pointers or, as you remember, virtual tables. Each virtual table represents a COM interface, like `IProbe` or `IGameObject` in our case.
95 |
96 | Let's now briefly discuss the creation of COM objects. We usually start by calling one of the well-known Co-functions to create a COM object. Often, it's either `CoCreateInstance` or `CoGetClassObject`. Those functions perform actions defined in the COM registration (either in a manifest file or in the registry). In the most common (and most straightforward scenario), they load a dll and run the exported `DllGetClassObject` function:
97 |
98 | ```cpp
99 | HRESULT DllGetClassObject([in] REFCLSID rclsid, [in] REFIID riid, [out] LPVOID *ppv);
100 | ```
101 |
102 | On a successful return, the `*ppv` value should point to an address of the virtual table representing a COM interface with the IID equal to `riid`. And this address will be a part of memory belonging to a COM object of the type identified by the `rclsid`.
103 |
104 | People often say that COM is complicated. As you just saw, COM fundamentals are clear and straightforward. However, its various implementations might cause a headache. For example, there are myriads of methods in OLE and ActiveX interfaces created to make it possible to drag/drop things between windows, use the clipboard, or embed one control in another. Remember, though, that all those crazy interfaces still need to implement `IUnknown`. And that's the advantage we can take as troubleshooters. It's easy to track new instance creations, interface queries, and interface method calls (often even with their names). That may give us enough insights to debug a problem successfully.
105 |
106 | ### COM metadata
107 |
108 | COM metadata, saved in type libraries, provides definitions of COM classes and COM interfaces. Thanks to it, we can decode method names and their argument values without debugging symbols. The tool we usually use to view the type libraries installed in the system is [OleView](https://learn.microsoft.com/en-us/windows/win32/com/ole-com-object-viewer), part of the Windows SDK. OleView has some open-source alternatives, such as [.NET OLE/COM viewer](https://github.com/tyranid/oleviewdotnet) or [OleWoo](https://github.com/leibnitz27/olewoo). [Comon](https://github.com/lowleveldesign/comon) also provides the **!cometa** command, which allows you to use COM metadata without leaving WinDbg. Before the debugging session, it is worth taking a moment to build the cometa database with the **!cometa index** command. The database resides in a temporary folder. It's an SQLite database, so you may copy it between machines. Other comon commands will use the cometa database to resolve class and interface IDs to meaningful names.
109 |
110 | You may also do some basic queries against the database with the **!cometa showc** and **!cometa showi** commands, for example:
111 |
112 | ```
113 | 0:000> !cometa showi {59644217-3E52-4202-BA49-F473590CC61A}
114 | Found: {59644217-3E52-4202-BA49-F473590CC61A} (IGameObject)
115 |
116 | Methods:
117 | - [0] HRESULT QueryInterface(void* this, GUID* riid, void** ppvObject)
118 | - [1] ULONG AddRef(void* this)
119 | - [2] ULONG Release(void* this)
120 | - [3] HRESULT get_Name(void* this, BSTR* Name)
121 | - [4] HRESULT get_Minerals(void* this, long* Minerals)
122 | - [5] HRESULT get_BuildTime(void* this, long* BuildTime)
123 |
124 | Registered VTables for IID:
125 | - Module: protoss, CLSID: {EFF8970E-C50F-45E0-9284-291CE5A6F771} (Probe), VTable offset: 0x3775c
126 | - Module: protoss, CLSID: {F5353C58-CFD9-4204-8D92-D274C7578B53} (Nexus), VTable offset: 0x37710
127 | ```
128 |
129 | Troubleshooting COM in WinDbg
130 | -----------------------------
131 |
132 | ### Monitoring COM objects in a process
133 |
134 | There are various ways in which COM objects can be created. When a given function creates a COM object, you will see a `void **` as one of its arguments. After a successful call, this pointer will point to a new COM object. Let's check how we can trace such a creation. We will use breakpoints to monitor calls to the `CoCreateInstance(REFCLSID rclsid, LPUNKNOWN pUnkOuter, DWORD dwClsContext, REFIID riid, LPVOID *ppv)` function. We are interested in the class (`rclsid`) and interface (`riid`) values, and the address of the created COM object (`*ppv`). When debugging a 64-bit process, our breakpoint command might look as follows:
135 |
136 | ```
137 | bp combase!CoCreateInstance ".echo ==== combase!CoCreateInstance ====; dps @rsp L8; dx *(combase!GUID*)@rcx; dx *(combase!GUID*)@r9; .printf /D \"==> obj addr: %p\", poi(@rsp+28);.echo; bp /1 @$ra; g"
138 | ```
139 |
140 | The `bp /1 @$ra` part creates a one-time breakpoint at a function return address. This second breakpoint will stop the process execution and allow us to examine the results of the function call. At this time, the `rax` register will show the return code (should be `0` for a successful call), and the created COM object (and also the interface virtual) will be at the previously printed object address. For the sake of completeness, let me show you the 32-bit version of this breakpoint:
141 |
142 | ```
143 | bp combase!CoCreateInstance ".echo ==== combase!CoCreateInstance ====; dps @esp L8; dx **(combase!GUID **)(@esp + 4); dx **(combase!GUID **)(@esp + 0x10); .printf /D \"==> obj addr: %p\", poi(@esp+14);.echo; bp /1 @$ra; g"
144 | ```
145 |
146 | Creating such breakpoints for various COM functions might be a mundane task, especially when we consider that our only point in doing so is to save the addresses of the virtual tables. **Fortunately, [comon](https://github.com/lowleveldesign/comon) might be of help here**. In-process COM creation usually ends in a call to the `DllGetClassObject` function exported by the DLL implementing a given COM object. After **attaching to a process** (**!comon attach**), comon creates breakpoints on all such functions and checks the results of their executions. It also breaks when a process calls `CoRegisterClassObject`, a function called by out-of-process COM servers to register the COM objects they host.
147 |
148 | After you attach comon to a debugged process, you should see various log messages showing COM object creations, for example:
149 |
150 | ```
151 | 0:000> !comon attach
152 | COM monitor enabled for the current process.
153 | 0:000> g
154 | ...
155 | [comon] 0:000 [protoss!DllGetClassObject] CLSID: {EFF8970E-C50F-45E0-9284-291CE5A6F771} (Protoss Probe), IID: {00000001-0000-0000-C000-000000000046} (IClassFactory) -> SUCCESS (0x0)
156 | [comon] 0:000 [IClassFactory::CreateInstance] CLSID: {EFF8970E-C50F-45E0-9284-291CE5A6F771} (Protoss Probe), IID: {246A22D5-CF02-44B2-BF09-AAB95A34E0CF} (IProbe) -> SUCCESS (0x0)
157 | [comon] 0:000 [IUnknown::QueryInterface] CLSID: {EFF8970E-C50F-45E0-9284-291CE5A6F771} (Protoss Probe), IID: {59644217-3E52-4202-BA49-F473590CC61A} (IGameObject) -> SUCCESS (0x0)
158 | [comon] 0:000 [protoss!DllGetClassObject] CLSID: {F5353C58-CFD9-4204-8D92-D274C7578B53} (Protoss Nexus), IID: {00000001-0000-0000-C000-000000000046} (IClassFactory) -> SUCCESS (0x0)
159 | [comon] 0:000 [IClassFactory::CreateInstance] CLSID: {F5353C58-CFD9-4204-8D92-D274C7578B53} (Protoss Nexus), IID: {C5F45CBC-4439-418C-A9F9-05AC67525E43} (INexus) -> SUCCESS (0x0)
160 | [comon] 0:000 [IUnknown::QueryInterface] CLSID: {F5353C58-CFD9-4204-8D92-D274C7578B53} (Protoss Nexus), IID: {59644217-3E52-4202-BA49-F473590CC61A} (IGameObject) -> SUCCESS (0x0)
161 | ...
162 | ```
163 |
164 | The `QueryInterface` calls will show up only for the first time; it won't be reported if we have the virtual table for a given interface already registered in the cometa database. To check the COM objects registered in a given session, run the **!comon status** command, for example:
165 |
166 | ```
167 | 0:000> !comon status
168 | COM monitor is RUNNING
169 |
170 | COM types recorded for the current process:
171 |
172 | CLSID: {F5353C58-CFD9-4204-8D92-D274C7578B53} (Nexus)
173 | IID: {C5F45CBC-4439-418C-A9F9-05AC67525E43} (INexus), address: 0x723676f8
174 | IID: {00000001-0000-0000-C000-000000000046} (N/A), address: 0x7236694c
175 | IID: {59644217-3E52-4202-BA49-F473590CC61A} (IGameObject), address: 0x72367710
176 |
177 | CLSID: {EFF8970E-C50F-45E0-9284-291CE5A6F771} (Probe)
178 | IID: {00000001-0000-0000-C000-000000000046} (N/A), address: 0x72366968
179 | IID: {59644217-3E52-4202-BA49-F473590CC61A} (IGameObject), address: 0x7236775c
180 | IID: {246A22D5-CF02-44B2-BF09-AAB95A34E0CF} (IProbe), address: 0x72367744
181 | ```
182 |
183 | The `cometa` queries show now also return information about the registered virtual tables:
184 |
185 | ```
186 | 0:000> !cometa showc {F5353C58-CFD9-4204-8D92-D274C7578B53}
187 | Found: {F5353C58-CFD9-4204-8D92-D274C7578B53} (Nexus)
188 |
189 | Registered VTables for CLSID:
190 | - module: protoss, IID: {00000001-0000-0000-C000-000000000046} (N/A), VTable offset: 0x3694c
191 | - module: protoss, IID: {59644217-3E52-4202-BA49-F473590CC61A} (IGameObject), VTable offset: 0x37710
192 | - module: protoss, IID: {C5F45CBC-4439-418C-A9F9-05AC67525E43} (INexus), VTable offset: 0x376f8
193 | ```
194 |
195 | ### Tracing COM methods
196 |
197 | When we know the interface virtual table address, nothing can stop us from creating breakpoints on interface methods :) I will first show you how to do that manually and later present how [comon](https://github.com/lowleveldesign/comon) may help.
198 |
199 | The first step is to find the offset of our method in the interface definition. Let's stick to the Protoss COM example and let's create a breakpoint on the `get_Minerals` method/property from the `IGameObject` interface:
200 |
201 | ```
202 | 0:000> !cometa showi {59644217-3E52-4202-BA49-F473590CC61A}
203 | Found: {59644217-3E52-4202-BA49-F473590CC61A} (IGameObject)
204 |
205 | Methods:
206 | - [0] HRESULT QueryInterface(void* this, GUID* riid, void** ppvObject)
207 | - [1] ULONG AddRef(void* this)
208 | - [2] ULONG Release(void* this)
209 | - [3] HRESULT get_Name(void* this, BSTR* Name)
210 | - [4] HRESULT get_Minerals(void* this, long* Minerals)
211 | - [5] HRESULT get_BuildTime(void* this, long* BuildTime)
212 |
213 | Registered VTables for IID:
214 | - Module: protoss, CLSID: {EFF8970E-C50F-45E0-9284-291CE5A6F771} (Probe), VTable offset: 0x3775c
215 | - Module: protoss, CLSID: {F5353C58-CFD9-4204-8D92-D274C7578B53} (Nexus), VTable offset: 0x37710
216 | ```
217 |
218 | We can see that its ordinal number is four, and two virtual tables are registered for our interface (two classes implementing it). Let's focus on the `Probe` class. To set a breakpoint method, we can use the `bp` command:
219 |
220 | ```
221 | bp poi(protoss + 0x3775c + 4 * $ptrsize)
222 | ```
223 |
224 | Similarly, if we would like to set breakpoints on all the `IGameObject` methods, we might use a loop:
225 |
226 | ```
227 | .for (r $t0 = 0; @$t0 < 6; r $t0 = @$t0 + 1) { bp poi(protoss + 0x3775c + @$t0 * @$ptrsize) }
228 | ```
229 |
230 | Instead of setting breakpoints manually, you may use the **!cobp** command from the comon extension. It also creates a breakpoint (you will see it if you run the bl command), but on hit, comon will decode the method parameters (for the supported types). It will also automatically create a one-time breakpoint on the method return address, displaying the return code and method out parameter values. The optional parameter lets you decide if you'd like to stop when cobreakpoint is hit. An example output might look as follows:
231 |
232 | ```
233 | 0:000> !cobp --always {EFF8970E-C50F-45E0-9284-291CE5A6F771} {59644217-3E52-4202-BA49-F473590CC61A} get_Name
234 | [comon] Breakpoint 18 (address 0x723415f0) created / updated
235 | 0:000> g
236 | [comon breakpoint] IGameObject::get_Name (iid: {59644217-3E52-4202-BA49-F473590CC61A}, clsid: {EFF8970E-C50F-45E0-9284-291CE5A6F771})
237 |
238 | Parameters:
239 | - this: 0xfb2f5c (void*)
240 | - Name: 0x81fc1c (BSTR*) [out]
241 |
242 | 0:000> dps 0081fc1c L1
243 | 0081fc1c 00000000
244 | 0:000> g
245 | [comon breakpoint] IGameObject::get_Name (iid: {59644217-3E52-4202-BA49-F473590CC61A}, clsid: {EFF8970E-C50F-45E0-9284-291CE5A6F771}) return
246 | Result: 0x0 (HRESULT)
247 |
248 | Out parameters:
249 | - Name: 0x81fc1c (BSTR*)
250 |
251 | 0:000> du 00f9c6ac
252 | 00f9c6ac "Probe"
253 | ```
254 |
255 | If comon can't decode a given parameter, you may use the **dx** command with combase.dll symbols (one of the rare Microsoft DLLs that comes with private symbols), for example: `dx -r2 (combase!DISPPARAMS *)(*(void **)(@esp+0x18))` or `dx -r1 ((combase!tagVARIANT[3])0x31ec1f0)`.
256 |
257 | ### Stopping the COM monitor
258 |
259 | Run the **!comon detach** command to stop the COM monitor. This command will remove all the comon breakpoints and debugging session data, but you can still examine COM metadata with the cometa command.
260 |
261 | Observing COM interactions outside WinDbg
262 | -----------------------------------------
263 |
264 | Sometimes we only need basic information about COM interactions, such as which objects are used and how they are launched. While WinDbg can be overkill for such scenarios, there are several simpler tools we can use to collect this additional information.
265 |
266 | ### Windows Performance Recorder (wpr.exe)
267 |
268 | Let's begin with wpr.exe, a powerful tool that's likely already installed on your system. WPR requires profile files to configure tracing sessions. For basic COM event collection, you can use [the ComTrace.wprp profile](https://raw.githubusercontent.com/microsoft/winget-cli/refs/heads/master/tools/COMTrace/ComTrace.wprp) from [the winget-cli repository](https://github.com/microsoft/winget-cli). I've also created an enhanced profile, adding providers found in the [TSS scripts](https://learn.microsoft.com/en-us/troubleshoot/windows-client/windows-tss/introduction-to-troubleshootingscript-toolset-tss), which you can download **[here](/assets/other/WTComTrace.wprp)**. You can use those profiles either solely or in combination with other profiles, as shown in the examples below.
269 |
270 | ```shell
271 | # Collect only COM events
272 | wpr.exe -start .\WTComTrace.wprp -filemode
273 | # Run COM apps ...
274 | # Stop the trace when done
275 | wpr -stop C:\temp\comtrace.etl
276 |
277 | # Collect COM events with CPU sampling
278 | wpr.exe -start CPU -start .\WTComTrace.wprp -filemode
279 | # Run COM apps ...
280 | # Stop the trace when done
281 | wpr -stop C:\temp\comtrace.etl
282 | ```
283 |
284 | Some providers are the [legacy WPP providers](https://learn.microsoft.com/en-us/windows-hardware/drivers/devtest/wpp-software-tracing), which require TMF files to read the collected events. Fortunately, the PDB file for compbase.dll contains the required TMF data and we can decode those events. To view the collected data, open the ETL file in **[Windows Performance Analyzer (WPA)](https://learn.microsoft.com/en-us/windows-hardware/test/wpt/windows-performance-analyzer)**. Remember to load symbols first (check [the Windows configuration guide](guides/configuring-windows-for-effective-troubleshooting/#configuring-debug-symbols) how to configure symbols globally in the system), then navigate to the **Generic Events** category and open the **WPP Trace** view.
285 |
286 | ### Process Monitor
287 |
288 | In **[Process Monitor](https://learn.microsoft.com/en-us/sysinternals/downloads/procmon)**, we can include Registry and Process events and events where Path contains `\CLSID\` or `\AppID` strings or ends with `.dll`, as in the image below:
289 |
290 | 
291 |
292 | The collected events should tell us which COM objects the application initiated and in which way. For example, if procmon shows a DLL path read from the `InprocServer32` and then we see this dll loaded, we may assume that the application created a given COM object (the event call stack may be an additional proof). If the COM server runs in a standalone process or a remote machine, other keys will be queried. We may then check the Process Tree or Network events for more details. [COM registry keys official documentation](https://learn.microsoft.com/en-us/windows/win32/com/com-registry-keys) is thorough, so please consult it to learn more.
293 |
294 | ### wtrace
295 |
296 | In **[wtrace](https://github.com/lowleveldesign/wtrace)**, we need to pick the proper handlers and define filters. An example command line might look as follows:
297 |
298 | ```shell
299 | wtrace --handlers registry,process,rpc -f 'path ~ \CLSID\' -f 'path ~ \AppID\' -f 'path ~ rpc' -f 'pname = ProtossComClient'
300 | ```
301 |
302 | As you can see, wtrace may additionally show information about RPC (Remote Procedure Call) events.
303 |
304 | Troubleshooting .NET COM interop
305 | --------------------------------
306 |
307 | A native COM object must be wrapped into a Runtime Callable Wrapper (RCW) to be accessible to managed code. RCW binds a managed object (for example, `System.__Com`) and a native COM class instance. COM Callable Wrappers (CCW) work in the opposite direction - thanks to them, we may expose .NET objects to the COM world. Interestingly, the object interop usage is saved in the object's SyncBlock. Therefore, it should not come as a surprise that the **!syncblk** command from [the SOS extension](https://learn.microsoft.com/en-us/dotnet/core/diagnostics/sos-debugging-extension) presents information about RCWs and CCWs:
308 |
309 | ```
310 | 0:011> !syncblk
311 | Index SyncBlock MonitorHeld Recursion Owning Thread Info SyncBlock Owner
312 | -----------------------------
313 | Total 5
314 | CCW 1
315 | RCW 0
316 | ComClassFactory 0
317 | Free 3
318 | ```
319 |
320 | When we add the **-all** parameter, **!syncblk** will list information about the created SyncBlocks with their corresponding objects, for example:
321 |
322 | ```
323 | 0:007> !syncblk -all
324 | Index SyncBlock MonitorHeld Recursion Owning Thread Info SyncBlock Owner
325 | 1 07FF8F54 0 0 00000000 none 030deb48 System.__ComObject
326 | 2 07FF8F20 0 0 00000000 none 030deb3c EventTesting
327 | 3 00000000 0 0 00000000 none 0 Free
328 | 4 00000000 0 0 00000000 none 0 Free
329 | 5 00000000 0 0 00000000 none 0 Free
330 | -----------------------------
331 | Total 5
332 | CCW 1
333 | RCW 0
334 | ComClassFactory 0
335 | Free 3
336 | ```
337 |
338 | Now, we can dump information about managed objects using the **!dumpobj** command, for example:
339 |
340 | ```
341 | 0:006> !dumpobj 030deb3c
342 | Name: EventTesting
343 | MethodTable: 08301668
344 | EEClass: 082f7110
345 | CCW: 0833ffe0
346 | Tracked Type: false
347 | Size: 12(0xc) bytes
348 | File: c:\repos\testing-com-events\bin\NETServer.dll
349 | Fields:
350 | MT Field Offset Type VT Attr Value Name
351 | 0830db50 4000003 4 ...ng+OnEventHandler 0 instance 00000000 onEvent```
352 | ```
353 |
354 | The good news is that the **!dumpobj** command also checks if a given object has a SyncBlock assigned and dumps information from it. In this case, it's the address of CCW. We may get more details about it by using the **!dumpccw** command:
355 |
356 | ```
357 | 0:011> !dumpccw 08060000
358 | Managed object: 02e6cf88
359 | Outer IUnknown: 00000000
360 | Ref count: 0
361 | Flags:
362 | RefCounted Handle: 00D714F8 (WEAK)
363 | COM interface pointers:
364 | IP MT Type
365 | 08060010 080315b0 Server.Contract.IEventTesting
366 | ```
367 |
368 | Notice here that there is only one interface implemented by the managed object and the CCW is no longer in use by the native code (Ref count equals 0). Below is an example of a CCW representing a Windows Forms ActiveX control which is still alive and implements more interfaces:
369 |
370 | ```
371 | 0:014> !dumpccw 0a23fde0
372 | Managed object: 04ee6984
373 | Outer IUnknown: 00000000
374 | Ref count: 7
375 | Flags:
376 | RefCounted Handle: 04C716D8 (STRONG)
377 | COM interface pointers:
378 | IP MT Type
379 | 0A23FDF8 09fbbb04 Interop+Ole32+IOleControl
380 | 0A23FDC8 09fbbc4c Interop+Ole32+IOleObject
381 | 0A23FDCC 09fbbd34 Interop+Ole32+IOleInPlaceObject
382 | 0A23FDD0 09fbbde4 Interop+Ole32+IOleInPlaceActiveObject
383 | 0A23FDA8 09fbbfa0 Interop+Ole32+IViewObject2
384 | 0A23FDB0 09fbc09c Interop+Ole32+IPersistStreamInit
385 | 0A23FD4C 09f6485c BullsEyeControlLib.IBullsEye
386 | ```
387 |
388 | If you would like to dump information about all objects associated with SyncBlocks, you may use the following WinDbg script:
389 |
390 | ```
391 | .foreach /pS 7 /ps 7 (addr { !syncblk -all }) { !do addr }
392 | ```
393 |
394 | And to extract only the RCW or CCW addresses, we could use the **!grep** command from the [awesome Andrew Richard's PDE extension](https://onedrive.live.com/?authkey=%21AJeSzeiu8SQ7T4w&id=DAE128BD454CF957%217152&cid=DAE128BD454CF957):
395 |
396 | ```
397 | 0:014> .load PDE.dll
398 | 0:014> !grep RCW: .foreach /pS 7 /ps 7 (addr { !syncblk -all }) { !do addr }
399 | RCW: 08086d30
400 | 0:014> !grep CCW: .foreach /pS 7 /ps 7 (addr { !syncblk -all }) { !do addr }
401 | CCW: 08060000
402 | ```
403 |
404 | To keep COM objects alive in the managed memory, .NET Runtime creates handles for them. Those are either strong or ref-counted handles and we may list them with the **!gchandles** command, for example:
405 |
406 | ```
407 | 0:011> !gchandles -type refcounted
408 | Handle Type Object Size Data Type
409 | 00D714F8 RefCounted 02e6cf88 12 0 EventTesting
410 |
411 | Statistics:
412 | MT Count TotalSize Class Name
413 | 08031668 1 12 EventTesting
414 | Total 1 objects
415 |
416 | 0:014> !gchandles -type strong
417 | Handle Type Object Size Data Type
418 | 04C711B4 Strong 030deb48 12 System.__ComObject
419 | ...
420 |
421 | Statistics:
422 | MT Count TotalSize Class Name
423 | 04ebbf00 1 12 System.__ComObject
424 | ...
425 | Total 19 objects
426 | ```
427 |
428 | Of course, in those lists we will find the objects we already saw in the **!syncblk** output, so it's just another way to find them. It may be useful when tracking, for example, GC leaks.
429 |
430 | Finally, to find who is keeping our managed object alive, we could use the **!gcroot** command. And it's quite easy to find the GC roots for a particular type with the following script:
431 |
432 | ```
433 | .foreach (addr { !DumpHeap -short -type System.__ComObject }) { !gcroot addr }
434 | ```
435 |
436 | Links
437 | -----
438 |
439 | - ["Essential COM"](https://archive.org/details/essentialcom00boxd) by Don Box
440 | - ["Inside OLE"](https://github.com/kraigb/InsideOLE) by Kraig Brockschmidt (Kraig published the whole book with source code on GitHub!)
441 | - ["Inside COM+ Base Services"](https://thrysoee.dk/InsideCOM+/) by Guy Eddon and Henry Eddon
442 | - ["COM and .NET interoperability"](https://link.springer.com/book/10.1007/978-1-4302-0824-2) and [source code](https://github.com/Apress/com-.net-interoperability) by Andrew Troelsen
443 | - [".NET and COM: The Complete Interoperability Guide"](https://books.google.pl/books/about/NET_and_COM.html?id=x2OIPSyFLBcC) by Adam Nathan
444 | - [COM+ revisited](https://lowleveldesign.wordpress.com/2022/01/17/com-revisited/) by me :)
445 | - [Calling Local Windows RPC Servers from .NET](https://googleprojectzero.blogspot.com/2019/12/calling-local-windows-rpc-servers-from.html) by James Forshaw
446 |
447 | {% endraw %}
--------------------------------------------------------------------------------
/guides/etw.md:
--------------------------------------------------------------------------------
1 | ---
2 | layout: page
3 | title: Event Tracing for Windows (ETW)
4 | date: 2025-10-02 08:00:00 +0200
5 | redirect_from:
6 | - /guides/using-etw/
7 | ---
8 |
9 | {% raw %}
10 |
11 | **Table of contents:**
12 |
13 |
14 |
15 | - [General information](#general-information)
16 | - [Tools](#tools)
17 | - [Windows Performance Recorder \(WPR\)](#windows-performance-recorder-wpr)
18 | - [Profiles](#profiles)
19 | - [Starting and stopping the trace](#starting-and-stopping-the-trace)
20 | - [Issues](#issues)
21 | - [Windows Performance Analyzer \(WPA\)](#windows-performance-analyzer-wpa)
22 | - [Installation](#installation)
23 | - [Tips on analyzing events](#tips-on-analyzing-events)
24 | - [Perfview](#perfview)
25 | - [Installation](#installation_1)
26 | - [Tips on recording events](#tips-on-recording-events)
27 | - [Tips on analyzing events](#tips-on-analyzing-events_1)
28 | - [Live view of events](#live-view-of-events)
29 | - [Issues](#issues_1)
30 | - [logman](#logman)
31 | - [Querying providers installed in the system](#querying-providers-installed-in-the-system)
32 | - [Starting and stopping the trace](#starting-and-stopping-the-trace_1)
33 | - [wevtutil](#wevtutil)
34 | - [tracerpt](#tracerpt)
35 | - [xperf](#xperf)
36 | - [TSS \(TroubleShootingScript toolset\)](#tss-troubleshootingscript-toolset)
37 | - [MSO scripts \(PowerShell\)](#mso-scripts-powershell)
38 | - [Event types](#event-types)
39 | - [Autologger events](#autologger-events)
40 | - [System boot events](#system-boot-events)
41 | - [File events](#file-events)
42 | - [Registry events](#registry-events)
43 | - [WPP events](#wpp-events)
44 | - [Libraries](#libraries)
45 | - [ETW tools and libs \(including EtwEnumerator\)](#etw-tools-and-libs-including-etwenumerator)
46 | - [TraceProcessing](#traceprocessing)
47 | - [WPRContol](#wprcontol)
48 | - [TraceEvent](#traceevent)
49 | - [KrabsETW](#krabsetw)
50 | - [Performance Logs and Alerts \(PLA\)](#performance-logs-and-alerts-pla)
51 | - [System API](#system-api)
52 |
53 |
54 |
55 | General information
56 | -------------------
57 |
58 | When loading **symbols**, the ETW tools and libraries use the **\_NT\_SYMBOLS\_PATH** environment variable to download (and cache) the PDB files and **\_NT\_SYMCACHE\_PATH** to store their preprocessed (cached) versions. An example machine configuration might look as follows:
59 |
60 | ```shell
61 | setx /M _NT_SYMBOL_PATH "SRV*C:\symbols\dbg*https://msdl.microsoft.com/download/symbols"
62 | setx /M _NT_SYMCACHE_PATH "C:\symcache"
63 | ```
64 |
65 | On Windows 7 64-bit, to improve stack walking, disable paging of the drivers and kernel-mode system code:
66 |
67 | ```sh
68 | reg add "HKLM\System\CurrentControlSet\Control\Session Manager\Memory Management" -v DisablePagingExecutive -d 0x1 -t REG\_DWORD -f
69 | # or
70 | wpr -disablepagingexecutive`
71 | ```
72 |
73 | For **manifest-based providers** set `MatchAnyKeywords` to `0x00` to receive all events. Otherwise you need to create a bitmask which will be or-ed with event keywords. Additionally when `MatchAllKeywords` is set, its value is used for events that passed the `MatchAnyKeywords` test and providers additional and filtering.
74 |
75 | For **classic providers** set `MatchAnyKeywords` to `0xFFFFFFFF` to receive all events.
76 |
77 | Up to 8 sessions may collect manifest-based provider events, but only 1 session may be created for a classic provider (when a new session is created the provider switches to the session).
78 |
79 | When creating a session we may also specify the minimal severity level for collected events, where `1` is the critical level and `5` the verbose level (all events are logged).
80 |
81 | Tools
82 | -----
83 |
84 | ### Windows Performance Recorder (WPR)
85 |
86 | #### Profiles
87 |
88 | As its name suggests, WPR is a tool that records ETW traces and is available on all modern Windowses. It is straightforward to use and provides a big number of **ready-to-use tracing profiles**. We can list them with the `-profiles` command and show any profile details with the `profiledetails` command, for example:
89 |
90 | ```shell
91 | # list available profiles with their short description
92 | wpr -profiles
93 |
94 | # ...
95 | # GeneralProfile First level triage
96 | # CPU CPU usage
97 | # DiskIO Disk I/O activity
98 | # FileIO File I/O activity
99 | # ...
100 |
101 | # show profile details
102 | wpr -profiledetails CPU
103 |
104 | # ...
105 | # Profile : CPU.Verbose.Memory
106 | #
107 | # Collector Name : WPR_initiated_WprApp_WPR System Collector
108 | # Buffer Size (KB) : 1024
109 | # Number of Buffers : 3258
110 | # Providers
111 | # System Keywords
112 | # CpuConfig
113 | # CSwitch
114 | # ...
115 | # SampledProfile
116 | # ThreadPriority
117 | # System Stacks
118 | # CSwitch
119 | # ReadyThread
120 | # SampledProfile
121 | #
122 | # Collector Name : WPR_initiated_WprApp_WPR Event Collector
123 | # Buffer Size (KB) : 1024
124 | # Number of Buffers : 20
125 | # Providers
126 | # b7a19fcd-15ba-41ba-a3d7-dc352d5f79ba: : 0xff
127 | # e7ef96be-969f-414f-97d7-3ddb7b558ccc: 0x2000: 0xff
128 | # Microsoft-JScript: 0x1: 0xff
129 | # Microsoft-Windows-BrokerInfrastructure: 0x1: 0xff
130 | # Microsoft-Windows-DotNETRuntime: 0x20098: 0x05
131 | # ...
132 | # Microsoft-Windows-Win32k: 0x80000: 0xff
133 | ```
134 |
135 | Profiles often come in two versions: verbose and light, and we decide which one to use by appending "Verbose" or "Light" to the main profile name (if we do not specify the version, WPR defaults to "Verbose"), for example:
136 |
137 | ```sh
138 | wpr -profiledetails CPU.Light
139 | ```
140 |
141 | The trace could be memory- or file- based, with memory-based being the default. We can switch to the file-based profile by using the `-filemode` option. If we can find a profile for our tracing scenario, we may build a custom one (WPR profile schema is documented [here](https://learn.microsoft.com/en-us/windows-hardware/test/wpt/recording-profile-xml-reference)). It is often easier to base it one of the existing profiles, which we may extract with the `-exportprofile` command, for example:
142 |
143 | ```sh
144 | # export the memory-based CPU.Light profilek
145 | wpr -exportprofile CPU.Light C:\temp\CPU.light.wprp
146 | # export the file-based CPU.Light profilek
147 | wpr -exportprofile CPU.Light C:\temp\CPU.light.wprp -filemode
148 | ```
149 |
150 | Interestingly, in the XML file, profile names include also the tracing mode, so the memory-based profile will have name `CPU.Light.Memory`, as you can see in the example below:
151 |
152 | ```xml
153 |
154 |
155 |
156 |
157 |
158 |
159 |
160 |
161 | ```
162 |
163 | An exteremly important parameter of the collector configuration are buffers. If we look into the exported profiles, we will find that the number of buffers differs depending on the mode which we use for tracing. Memory-based profiles will use a much higher number of buffers, for example:
164 |
165 | ```xml
166 |
167 |
168 |
169 |
170 |
171 |
172 |
173 |
174 |
175 |
176 |
177 | ```
178 |
179 | The number of buffers depends also on the amount of memory on the host. Because `BufferSize` specifies memory size in KB, the above space is quite large (1GB). In memory mode, we operate on circular in-memory buffers - the system adds new buffers when the previous buffers fill up. When it reaches the maximum, it begins to overwrite events in the oldest buffers. For a file-based traces, the number of buffers is much smaller, as we only need to ensure that we are not dropping events because the disk cannot keep up with the write operations.
180 |
181 | Apart from keywords and levels, we may **[filter the trace and stack events](https://devblogs.microsoft.com/performance-diagnostics/filtering-events-using-wpr/)** by the event IDs (`EventFilters`, `StackFilters`). Filtering by process name is also possible, however, in my tests I found that the `ProcessExeFilter` works only for processes already running when we start the trace:
182 |
183 | ```xml
184 |
185 |
186 |
187 |
188 |
189 |
190 |
191 |
192 |
193 |
194 |
195 |
196 |
197 |
198 | ```
199 |
200 | Working with WPR profiles is described in details in a great series of posts on [Microsoft's Performance and Diagnostics blog](https://devblogs.microsoft.com/performance-diagnostics/) and I highly recommend reading them:
201 |
202 | - [WPR Start and Stop Commands](https://devblogs.microsoft.com/performance-diagnostics/wpr-start-and-stop-commands/)
203 | - [Authoring custom profiles – Part 1](https://devblogs.microsoft.com/performance-diagnostics/authoring-custom-profiles-part-1/)
204 | - [Authoring Custom Profiles – Part 2](https://devblogs.microsoft.com/performance-diagnostics/authoring-custom-profiles-part-2/)
205 | - [Authoring Custom Profiles – Part 3](https://devblogs.microsoft.com/performance-diagnostics/authoring-custom-profile-part3/)
206 |
207 | #### Starting and stopping the trace
208 |
209 | After picking a profile or profiles that we want to use, we can **start a tracing session** with the `-start` command. Some examples:
210 |
211 | ```sh
212 | # starts verbose CPU profile
213 | wpr -start CPU.verbose
214 | # same as above
215 | wpr -start CPU
216 |
217 | # starts light CPU profile
218 | wpr -start CPU.light
219 |
220 | # multiple profiles start
221 | wpr -start CPU -start VirtualAllocation -start Network
222 |
223 | # starts a custom WPRTest.Verbose profile defined in the C:\temp\CustomProfile.wprp file
224 | wpr -start "C:\temp\CustomProfile.wprp!WPRTest" -filemode
225 | # starts a custom WPRTest.Light profile defined in the C:\temp\CustomProfile.wprp file
226 | wpr -start "C:\temp\CustomProfile.wprp!WPRTest.Light"
227 | ```
228 |
229 | There could be only one WPR trace running in the system and we can check its status using the `-status` command:
230 |
231 | ```sh
232 | wpr -status
233 |
234 | # Microsoft Windows Performance Recorder Version 10.0.26100 (CoreSystem)
235 | # Copyright (c) 2024 Microsoft Corporation. All rights reserved.
236 | #
237 | # WPR recording is in progress...
238 | #
239 | # Time since start : 00:00:01
240 | # Dropped event : 0
241 | # Logging mode : File
242 | ```
243 |
244 | To **terminate the trace** we may use either the `-stop` or the `-cancel` command:
245 |
246 | ```shell
247 | # stopping the trace and saving it to a file with an optional description
248 | wpr -stop "C:\temp\testapp-fail.etl" "Abnormal termination of testapp.exe"
249 | # cancelling the trace (no trace files will be created)
250 | wpr -cancel
251 | ```
252 |
253 | #### Issues
254 |
255 | ##### Error 0x80010106 (RPC_E_CHANGED_MODE)
256 |
257 | If it happens when you run the `-stop` command, use wpr.exe from Windows SDK, build 1950 or later.
258 |
259 | ##### Error 0xc5580612
260 |
261 | If you are using `ProcessExeFilter` in your profile, this error may indicate that a process with a given name is not running when the trace starts (it is thrown by `WindowsPerformanceRecorderControl!WindowsPerformanceRecorder::CControlManager::VerifyAllProvidersEnabled`):
262 |
263 | ```
264 | An Event session cannot be started without any providers.
265 |
266 | Profile Id: Wtrace.Verbose.File
267 |
268 | Error code: 0xc5580612
269 |
270 | An Event session cannot be started without any providers.
271 | ```
272 |
273 | ### Windows Performance Analyzer (WPA)
274 |
275 | #### Installation
276 |
277 | **Windows Performance Analyzer (wpa.exe)**, may be installed from [Microsoft Store](https://apps.microsoft.com/store/detail/windows-performance-analyzer-preview/9N58QRW40DFW?hl=en-sh&gl=sh) (recommended) or as part of the **Windows Performance Toolkit**, included in the [Windows SDK](https://developer.microsoft.com/en-us/windows/downloads/windows-sdk/).
278 |
279 | #### Tips on analyzing events
280 |
281 | In **CPU Wait analysis**, each row marks a moment, when a thread received CPU time ([MS docs](https://learn.microsoft.com/en-us/windows-hardware/test/wpt/cpu-analysis#cpu-usage-precise-graph)) after, for example, waiting on an event object. The `Readying Thread` is the thread that woke up the `New Thread`. And the `Old Thread` is the thread which gave place on a CPU to the `New Thread`. The diagram below from Microsoft documentation nicely explain those terms:
282 |
283 | 
284 |
285 | Here is an example view of my test GUI app when I call the `Sleep` function after pressing a button:
286 |
287 | 
288 |
289 | As you can see, the `Wait` column shows the time spent on waiting, while the UI view shows the time when the application was unresponsive.
290 |
291 | WPA allows us to **group the call stacks** by tags. The default stacktag list can be found in the `c:\Program Files (x86)\Windows Kits\10\Windows Performance Toolkit\Catalog\default.stacktags` file.
292 |
293 | We may also **extend WPA with our own plugins**. The [SDK repository](https://github.com/microsoft/microsoft-performance-toolkit-sdk/) contains sample extensions. [Wpa.Demystifier](https://github.com/Zhentar/Wpa.Demystifier/tree/master) is another interesting extension to check.
294 |
295 | ### Perfview
296 |
297 | #### Installation
298 |
299 | Could be downloaded from [its release page](https://github.com/microsoft/perfview/releases) or installed with winget:
300 |
301 | ```sh
302 | winget install --id Microsoft.PerfView
303 | ```
304 |
305 | #### Tips on recording events
306 |
307 | Most often you will use the Collect dialog, but it is also possible to use PerfView from a command line. An example command collecting traces into a 500MB file (in circular mode) may look as follows:
308 |
309 | ```sh
310 | perfview -AcceptEULA -ThreadTime -CircularMB:500 -Circular:1 -LogFile:perf.output -Merge:TRUE -Zip:TRUE -noView collect
311 | ```
312 |
313 | A new console window will open with the following text:
314 |
315 | ```
316 | Pre V4.0 .NET Rundown enabled, Type 'D' to disable and speed up .NET Rundown.
317 | Do NOT close this console window. It will leave collection on!
318 | Type S to stop collection, 'A' will abort. (Also consider /MaxCollectSec:N)
319 |
320 | Type 'S' when you are done with tracing and wait (DO NOT CLOSE THE WINDOW) till you see `Press enter to close window`. Then copy the files: PerfViewData.etl.zip and perf.output to the machine when you will perform analysis.
321 | ```
322 |
323 | If you are also interested in the network traces append the `-NetMonCapture` option. This will generate an additional PerfViewData_netmon.cab file.
324 |
325 | If we use the EventSource provider and want to collect the call stacks along with the events, we need to append `@StacksEnabled=true` to the provider name, for example: `*EFTrace:@StacksEnabled=true`.
326 |
327 | #### Tips on analyzing events
328 |
329 | Select a **time range** and press `Alt+R` to set it for the grid. We may also copy a range, paste it in the Start box and then press Enter to apply it (PerfView should fill the End box).
330 |
331 | The table below contains grouping patterns I use for various analysis targets
332 |
333 | Name | Pattern
334 | -------- | --------
335 | Just my code with folded threads | `[My app + folded threads] \Temporary ASP.NET Files\->;!dynamicClass.S->;!=>OTHER;Thread->AllThreads` |
336 | Just my code with folded threads (ASP.NET view) | `[My app + folded threads and ASP.NET requests] Thread -> AllThreads;Request ID * URL: {*}-> URL $1;\Temporary ASP.NET Files\->;!dynamicClass.S->;!=>OTHER`
337 | Just my code with folded threads (Server requests view) | `[My app + folded threads and requests] Thread -> AllThreads;ASP.NET Request: * URL: {*}-> URL $1;\Temporary ASP.NET Files\->;!dynamicClass.S->;!=>OTHER`
338 | Group requests | `^Request ID->ALL Requests`
339 | Group requests by URL | `Request ID * URL:{*}->$1`
340 | Group async calls (by Christophe Nasarre) | `{%}!{%}+<>c__DisplayClass*+<<{%}>b__*>d.MoveNext()->($1) $2 async $3`
341 |
342 | When exporting to **Excel**, the data coming from PerfView often does not have valid formatting and contains some strange characters at the beginning or at the end, for example:
343 |
344 | ```
345 | 0000 A0 A0 32 32 34 224
346 | ```
347 |
348 | We may clean up those values by using the **SUBSTITUTE** function, for example:
349 |
350 | ```
351 | =SUBSTITUTE(A1,LEFT(A1,1),"")
352 | =SUBSTITUTE(A1,RIGHT(A1,1),"")
353 | ```
354 |
355 | And later do the usual Copy, Paste as Values operation. Alternatively, we may copy the values column by column. In that case, PerfView won't insert those special characters.
356 |
357 | If we want to open a trace created by PerfView in **WPA**, we need to first convert it, for example:
358 |
359 | ```sh
360 | perfview /wpr unzip test.etl.zip
361 | # The above command should create two files (.etl and .etl.ngenpdb)
362 | # and we can open wpa
363 | wpa test.etl
364 | ```
365 |
366 | #### Live view of events
367 |
368 | The `Listen` user command enables a live view dump of events in the PerfView log:
369 |
370 | ```sh
371 | PerfView.exe UserCommand Listen Microsoft-JScript:0x7:Verbose
372 |
373 | # inspired by Konrad Kokosa's tweet
374 | PerfView.exe UserCommand Listen Microsoft-Windows-DotNETRuntime:0x1:Verbose:@EventIDsToEnable="1 2"
375 | ```
376 |
377 | #### Issues
378 |
379 | ##### Error 0x800700B7 (ERROR_ALREADY_EXISTS)
380 |
381 | ```
382 | [Kernel Log: C:\tools\PerfViewData.kernel.etl]
383 | Kernel keywords enabled: Default
384 | Aborting tracing for sessions 'NT Kernel Logger' and 'PerfViewSession'.
385 | Insuring .NET Allocation profiler not installed.
386 | Completed: Collecting data C:\tools\PerfViewData.etl (Elapsed Time: 0,858 sec)
387 | Exception Occured: System.Runtime.InteropServices.COMException (0x800700B7): Cannot create a file when that file already exists. (Exception from HRESULT: 0x800700B7)
388 | at System.Runtime.InteropServices.Marshal.ThrowExceptionForHRInternal(Int32 errorCode, IntPtr errorInfo)
389 | at Microsoft.Diagnostics.Tracing.Session.TraceEventSession.EnableKernelProvider(Keywords flags, Keywords stackCapture)
390 | at PerfView.CommandProcessor.Start(CommandLineArgs parsedArgs)
391 | at PerfView.CommandProcessor.Collect(CommandLineArgs parsedArgs)
392 | at PerfView.MainWindow.c__DisplayClass9.b__7()
393 | at PerfView.StatusBar.c__DisplayClass8.b__6(Object param0)
394 | An exceptional condition occurred, see log for details.
395 | ```
396 |
397 | If you receive such error, make sure that no kernel log is running with `perfview listsessions` and eventually kill it with `perfview abort`.
398 |
399 | ### logman
400 |
401 | Nowadays, logman will not be our first choice tool to collect ETW trace, but the best thing about it is that it is a built-in tool and has been available in Windows for many years already, so might be the only option if you need to work on a legacy Windows system.
402 |
403 | #### Querying providers installed in the system
404 |
405 | Logman is great for querying ETW providers installed in the system or activated in a given process:
406 |
407 | ```sh
408 | # list all providers in the system
409 | logman query providers
410 |
411 | # show details about the ".NET Common Language Runtime" provider
412 | logman query providers ".NET Common Language Runtime"
413 |
414 | # list providers active in a process with ID 808
415 | logman query providers -pid 808
416 | ```
417 |
418 | #### Starting and stopping the trace
419 |
420 | The following commands start and stop a tracing session that is using one provider:
421 |
422 | ```sh
423 | logman start mysession -p {9744AD71-6D44-4462-8694-46BD49FC7C0C} -o "c:\temp\test.etl" -ets & timeout -1 & logman stop mysession -ets
424 | ```
425 |
426 | For the provider options you may additionally specify the keywords (flags) and levels that will be logged: `-p provider [flags [level]]`
427 |
428 | You may also use a file with a list of providers:
429 |
430 | ```sh
431 | logman start mysession -pf providers.guids -o c:\temp\test.etl -ets & timeout -1 & logman stop mysession -ets
432 | ```
433 |
434 | And the `providers.guids` file content is built of lines following the format: `{guid} [flags] [level] [provider name]` (flags, level, and provider name are optional), for example:
435 |
436 | ```
437 | {AFF081FE-0247-4275-9C4E-021F3DC1DA35} 0xf 5 ASP.NET Events
438 | {3A2A4E84-4C21-4981-AE10-3FDA0D9B0F83} 0x1ffe 5 IIS: WWW Server
439 | ```
440 |
441 | If you want to record events from the **kernel provider** you need to name the session: `NT Kernel Logger`, for example:
442 |
443 | ```sh
444 | logman start "NT Kernel Logger" -p "Windows Kernel Trace" "(process,thread,file,fileio,net)" -o c:\kernel.etl -ets & timeout -1 & logman stop "NT Kernel Logger" -ets
445 | ```
446 |
447 | To see the available kernel provider keywords, run:
448 |
449 | ```sh
450 | logman query providers "Windows Kernel Trace"
451 |
452 | # Provider GUID
453 | # -------------------------------------------------------------------------------
454 | # Windows Kernel Trace {9E814AAD-3204-11D2-9A82-006008A86939}
455 | #
456 | # Value Keyword Description
457 | # -------------------------------------------------------------------------------
458 | # 0x0000000000000001 process Process creations/deletions
459 | # 0x0000000000000002 thread Thread creations/deletions
460 | # ...
461 | ```
462 |
463 | Additionally, we may change the way how events are saved to the file using the `-mode` parameter. For example, to use a circular file with maximum size of 200MB, we can run the following command:
464 |
465 | ```sh
466 | logman start "NT Kernel Logger" -p "Windows Kernel Trace" "(process,thread,img)" -o C:\ntlm-kernel.etl -mode circular -max 200 -ets
467 | ```
468 |
469 | ### wevtutil
470 |
471 | Wevtutil is a built-in tool that allows us to manage **manifest-based providers (publishers)** installed in our system. Example usages:
472 |
473 | ```sh
474 | # list all installed publishers
475 | wevtutil ep
476 | # find MSMQ publishers
477 | wevtutil ep | findstr /i msmq
478 |
479 | # extract details about a Microsoft-Windows-MSMQ publisher
480 | wevtutil gp Microsoft-Windows-MSMQ /ge /gm /f:xml
481 | ```
482 |
483 | ### tracerpt
484 |
485 | Tracerpt is another built-in tool. It may collect ETW traces, but I usually use it only to convert etl files from binary to text format. Example commands:
486 |
487 | ```sh
488 | # convert etl file to evtx
489 | tracerpt -of EVTX test.etl -o test.evtx -summary test-summary.xml
490 |
491 | # dump events to an XML file
492 | tracerpt test.etl -o test.xml -summary test-summary.xml
493 |
494 | # dump events to a HTML file
495 | tracerpt.exe '.\NT Kernel Logger.etl' -o -report -f html
496 | ```
497 |
498 | ### xperf
499 |
500 | For a long time xperf was the best tool to collect ETW traces, providing ways to configure many aspects of the tracing sessions. It is now considered legacy (with [wpr](#windows-performance-recorder-wpr) being its replacement), but many people still find its command line syntax eaier to use than WPR profiles. Here are some usage examples:
501 |
502 | ```sh
503 | # list available Kernel Flags
504 | xperf -providers KF
505 | # PROC_THREAD : Process and Thread create/delete
506 | # LOADER : Kernel and user mode Image Load/Unload events
507 | # PROFILE : CPU Sample profile
508 | # CSWITCH : Context Switch
509 | # ...
510 |
511 | # list available Kernel Groups
512 | xperf -providers KG
513 | # Base : PROC_THREAD+LOADER+DISK_IO+HARD_FAULTS+PROFILE+MEMINFO+MEMINFO_WS
514 | # Diag : PROC_THREAD+LOADER+DISK_IO+HARD_FAULTS+DPC+INTERRUPT+CSWITCH+PERF_COUNTER+COMPACT_CSWITCH
515 | # DiagEasy : PROC_THREAD+LOADER+DISK_IO+HARD_FAULTS+DPC+INTERRUPT+CSWITCH+PERF_COUNTER
516 | # ...
517 |
518 | # list installed providers
519 | xperf -providers I
520 | # 0063715b-eeda-4007-9429-ad526f62696e : Microsoft-Windows-Services
521 | # 0075e1ab-e1d1-5d1f-35f5-da36fb4f41b1 : Microsoft-Windows-Network-ExecutionContext
522 | # 00b7e1df-b469-4c69-9c41-53a6576e3dad : Microsoft-Windows-Security-IdentityStore
523 | # 01090065-b467-4503-9b28-533766761087 : Microsoft-Windows-ParentalControls
524 | # ...
525 |
526 | # start the kernel trace, enabling flags defined in the DiagEasy group
527 | xperf -on DiagEasy
528 | # stop the kernel trace
529 | xperf -stop -d "c:\temp\DiagEasy.etl"
530 |
531 | # start the kernel with some additional settings and wait for the user to stop it
532 | xperf -on Latency -stackwalk Profile -buffersize 2048 -MaxFile 1024 -FileMode Circular && timeout -1 && xperf stop -d "C:\highCPUUsage.etl"
533 |
534 | # in user-mode tracing you may still use kernel flags and groups but for each user-trace provider
535 | # you need to add some additional parameters: -on (GUID|KnownProviderName)[:Flags[:Level[:0xnnnnnnnn|'stack|[,]sid|[,]tsid']]]
536 | xperf -start ClrRundownSession -on ClrAll:0x118:5+a669021c-c450-4609-a035-5af59af4df18:0x118:5 -f clr_DCend.etl -buffersize 128 -minbuffers 256 -maxbuffers 512
537 | timeout /t 15
538 | xperf -stop ClrSession ClrRundownSession -stop -d cpu_clr.etl
539 |
540 | # dump collected events to a text file
541 | xperf -i test.etl -o test.csv
542 | ```
543 |
544 | Chad Schultz published [many xperf scripts](https://github.com/itoleck/WindowsPerformance/tree/main/ETW/Tools/WPT/Xperf/CaptureScripts) in the [WindowsPerformance repository](https://github.com/itoleck/WindowsPerformance), so check them out if you are interested in using xperf.
545 |
546 | ### TSS (TroubleShootingScript toolset)
547 |
548 | TSS contains tons of various scripts and ETW is only a part of it. TSS official documentation is [here](https://learn.microsoft.com/en-us/troubleshoot/windows-client/windows-tss/introduction-to-troubleshootingscript-toolset-tss) and we can download the package from .
549 |
550 | Here is an example PowerShell script to install and run the main script:
551 |
552 | ```shell
553 | powershell.exe -NoProfile -ExecutionPolicy RemoteSigned -Command "Invoke-WebRequest -Uri https://aka.ms/getTSS -OutFile $env:TEMP\TSS.zip; Unblock-File $env:TEMP\TSS.zip; Expand-Archive -Force -LiteralPath $env:TEMP\TSS.zip -DestinationPath C:\TSS; Remove-Item $env:TEMP\TSS.zip; C:\TSS\TSS.ps1 -ListSupportedTrace"
554 | ```
555 |
556 | TSS defined many **troubleshooting scenarios** with precompiled parameters:
557 |
558 | ```shell
559 | C:\tSS\TSS.ps1 -ListSupportedScenarioTrace
560 | # ...
561 | # NET_General - collects CommonTask NET, NetshScenario InternetClient_dbg, Procmon, PSR, Video, SDP NET, xray, CollectComponentLog
562 | # ...
563 | ```
564 |
565 | where:
566 |
567 | - `CommonTask` are commands run before and after the scenario (only `NET` in this case)
568 | - `NetshScenario` is the selected netsh scenario (`InternetClient_dbg`)
569 | - `Procmon` will start procmon
570 | - `PSR` will run step recorder
571 | - `Video` will record a video of what the user is doing
572 | - `SDP` (Support Diagnostic Package) and `NET` enable `General`, `SMB`, and `NET` counters
573 | - `xray` runs xray scripts to discover existing problems
574 | - `CollectComponentLog` collects logs of commands run in a given scenario
575 |
576 | To start a scenario, we run:
577 |
578 | ```shell
579 | C:\TSS\TSS.ps1 -Scenario NET_General
580 | ```
581 |
582 | We may also manually "compose" the TSS command. A nice GUI tool for this purpose is `.\TSSGUI.ps1` (start it from the TSS folder). We may also list available TSS features:
583 |
584 | ```shell
585 | C:\TSS\TSS.ps1 -ListSupportedCommands
586 | C:\TSS\TSS.ps1 -ListSupportedControls
587 | C:\TSS\TSS.ps1 -ListSupportedDiag
588 | C:\TSS\TSS.ps1 -ListSupportedLog
589 | C:\TSS\TSS.ps1 -ListSupportedNetshScenario
590 | C:\TSS\TSS.ps1 -ListSupportedNoOptions
591 | C:\TSS\TSS.ps1 -ListSupportedPerfCounters
592 | C:\TSS\TSS.ps1 -ListSupportedScenarioTrace
593 | C:\TSS\TSS.ps1 -ListSupportedSDP
594 | C:\TSS\TSS.ps1 -ListSupportedSetOptions
595 | C:\TSS\TSS.ps1 -ListSupportedTrace
596 | C:\TSS\TSS.ps1 -ListSupportedWPRScenario
597 | C:\TSS\TSS.ps1 -ListSupportedXperfProfile
598 | ```
599 |
600 | Example commands to check which ETW providers the `NET_COM` component is using:
601 |
602 | ```shell
603 | .\TSS.ps1 -ListSupportedTrace | select-string "_COM"
604 | # [Component] -NET_COM COM/DCOM/WinRT/PRC component tracing. -EnableCOMDebug will enable further debug logging
605 | # [Component] -UEX_COM COM/DCOM/WinRT/PRC component ETW tracing. -EnableCOMDebug will enable further debug logging
606 | # Usage:
607 | # .\TSS.ps1 - -
608 | # Example: .\TSS.ps1 -UEX_FSLogix -UEX_Logon
609 |
610 | .\TSS -ListETWProviders NeT_COM
611 |
612 | # List of 20 Provider GUIDs (Flags/Level) for ComponentName: NET_COM
613 | # ==========================================================
614 | # {9474a749-a98d-4f52-9f45-5b20247e4f01}
615 | # {bda92ae8-9f11-4d49-ba1d-a4c2abca692e}
616 | # ...
617 | ```
618 |
619 | The TSS commands create raports in the `C:\MS_DATA` folder.
620 |
621 | To collect the trace in the background we may use the `-StartNoWait` option and `-Stop` to stop the trace.
622 |
623 | If we add the `-StartAutoLogger` option, our trace will start when the system boots. We stop by calling `TSS.ps1 -Stop`, as usual.
624 |
625 | Example commands:
626 |
627 | ```shell
628 | # starting WPR using TSS
629 | C:\TSS\TSS.ps1 -WPR CPU -WPROptions "-start Dotnet -start DesktopComposition"
630 |
631 | # Starting time travel debugging session using TSS
632 | # 1234 is the process PID (we may use process name as well, for example winver.exe)
633 | C:\TSS\TSS.ps1 -AcceptEula -TTD 1234
634 | ```
635 |
636 | ### MSO scripts (PowerShell)
637 |
638 | [MSO-Scripts repository](https://github.com/microsoft/MSO-Scripts) hosts many interesting PowerShell scripts for working with ETW traces.
639 |
640 | Event types
641 | -----------
642 |
643 | ### Autologger events
644 |
645 | Autologger ETW session collects events appearing after the system start. It can be enabled with wpr:
646 |
647 | ```sh
648 | wpr -boottrace -addboot FileIO
649 | ```
650 |
651 | Additional information:
652 |
653 | - [Autologger session](https://learn.microsoft.com/en-us/windows/win32/etw/configuring-and-starting-an-autologger-session)
654 | - [Autologger with WPR](https://devblogs.microsoft.com/performance-diagnostics/setting-up-an-autologger-with-wpr/)
655 |
656 | ### System boot events
657 |
658 | To collect general profile traces use:
659 |
660 | ```sh
661 | wpr -start generalprofile -onoffscenario boot -numiterations 1
662 | ```
663 |
664 | ### File events
665 |
666 | Described in [a post on my blog](https://lowleveldesign.org/2020/08/15/fixing-empty-paths-in-fileio-events-etw/).
667 |
668 | ### Registry events
669 |
670 | Described in [a post on my blog](https://lowleveldesign.org/2020/08/20/monitoring-registry-activity-with-etw/).
671 |
672 | ### WPP events
673 |
674 | WPP events are legacy events, for which we need TMF files to decode their payload. TMF may be available as standalone files or they might be embedded into PDB files. For the latter case, we may extract them using **tracepdb.exe**, for example:
675 |
676 | ```sh
677 | tracepdb.exe -f .\combase.pdb -p .\tmfs
678 | ```
679 |
680 | TMF data is stored as a binary block in the PDB file:
681 |
682 | ```
683 | 0D9:46A0 BA 00 19 10 20 52 0A 00 01 00 06 00 54 4D 46 3A º... R......TMF:
684 | 0D9:46B0 00 64 61 66 38 39 65 63 31 2D 64 66 66 32 2D 33 .daf89ec1-dff2-3
685 | 0D9:46C0 30 35 35 2D 36 30 61 62 2D 36 33 64 34 63 31 31 055-60ab-63d4c11
686 | 0D9:46D0 62 33 64 39 63 20 4F 4C 45 43 4F 4D 20 2F 2F 20 b3d9c OLECOM //
687 | 0D9:46E0 53 52 43 3D 63 6F 6D 74 72 61 63 65 77 6F 72 6B SRC=comtracework
688 | 0D9:46F0 65 72 2E 63 78 78 20 4D 4A 3D 20 4D 4E 3D 00 23 er.cxx MJ= MN=.#
689 | 0D9:4700 74 79 70 65 76 20 63 6F 6D 74 72 61 63 65 77 6F typev comtracewo
690 | 0D9:4710 72 6B 65 72 5F 63 78 78 31 38 36 20 31 31 20 22 rker_cxx186 11 "
691 | 0D9:4720 25 30 25 31 30 21 73 21 22 20 2F 2F 20 20 20 4C %0%10!s!" // L
692 | 0D9:4730 45 56 45 4C 3D 57 41 52 4E 49 4E 47 00 7B 00 6D EVEL=WARNING.{.m
693 | 0D9:4740 65 73 73 61 67 65 2C 20 49 74 65 6D 57 53 74 72 essage, ItemWStr
694 | 0D9:4750 69 6E 67 20 2D 2D 20 31 30 00 7D 00 BA 00 19 10 ing -- 10.}.º...
695 | ```
696 |
697 | The GUID at the beginning of the block defines the provider ID and may appear multiple times in the PDB file. Tracepdb uses this ID as the name of the generated TMF file. When decoding WPP events, if we do not configure the `TDH_CONTEXT_WPP_TMFSEARCHPATH`, Tdh functions will look for TMF files in the path specified in the [TRACE_FORMAT_SEARCH_PATH environment variable](https://learn.microsoft.com/en-us/windows/win32/api/tdh/ne-tdh-tdh_context_type). **WPA** has a special view for WPP events and can load the TMF manifests from symbol files, so **remember to first load the symbols**.
698 |
699 | Libraries
700 | ---------
701 |
702 | This section lists some of the ETW libraries I used with my notes about them. It is not meant to be a comprehensive documentation of those libraries, but rather a list of tips and tricks.
703 |
704 | ### ETW tools and libs (including EtwEnumerator)
705 |
706 | [Source code](https://github.com/microsoft/ETW)
707 |
708 | This C++ library contains code to parse ETW events. The sample EtwEnumerator CLI tool formats events from a binary etl file to their text representation.
709 |
710 | To build the library run:
711 |
712 | ```shell
713 | cd EtwEnumerator
714 | cmake -B bin .
715 | cmake --build bin
716 | ```
717 |
718 | The `EtwEnumerator` instance stores information about the currently analyzed event in an efficient way, caching metadata for future processing of similar events. Please check the [README](https://github.com/microsoft/ETW/tree/main/EtwEnumerator). Below is an example C# code that formats event to a JSON string in the [ETW callback function](https://learn.microsoft.com/en-us/windows/win32/api/evntrace/nc-evntrace-pevent_record_callback):
719 |
720 | ```cs
721 | EtwStringViewZ etwString;
722 | fixed (char* formatPtr = "[%9]%8.%3::%4 [%1]")
723 | {
724 | if (!ee->FormatCurrentEvent((ushort*)formatPtr, EtwJsonSuffixFlags.EtwJsonSuffixFlags_Default, &etwString))
725 | {
726 | Trace.WriteLine("ERROR");
727 | return;
728 | }
729 | }
730 |
731 | var s = new string((char*)etwString.Data, 0, (int)etwString.DataLength);
732 | writer.TryWrite(new MessageEvent(s));
733 | ```
734 |
735 | ### TraceProcessing
736 |
737 | [Documentation](https://learn.microsoft.com/en-us/windows/apps/trace-processing/) | [Code samples](https://github.com/microsoft/eventtracing-processing-samples)
738 |
739 | TraceProcessing library **categorized the events and splits them between Trace Processor**. Before processing the trace, we mark Trace Processors that we want to active, and we may query the events they processed after the analysis finishes, for example:
740 |
741 | ```cs
742 | using var trace = TraceProcessor.Create(traceFilePath);
743 |
744 | var pendingProcesses = trace.UseProcesses();
745 | var pendingFileIO = trace.UseFileIOData();
746 |
747 | trace.Process();
748 |
749 | var filecopyProcess = pendingProcesses.Result.Processes.Where(p => p.ImageName == "filecopy.exe").First();
750 |
751 | var fev = pendingFileIO.Result.CreateFileObjectActivity.First(f => f.IssuingProcess.Id == filecopyProcess.Id
752 | && f.FileName == "sampling-2-1.etl");
753 |
754 | Console.WriteLine($"Create file event: {fev.Path} ({fev.FileObject})");
755 |
756 | ```
757 |
758 | The above code uses the buffered mode of opening a trace file, in which all processed events land in memory (we may notice that the application memory consumption will be really high for bigger traces). Therefore, for bigger traces we may also use [the streaming mode](https://learn.microsoft.com/en-us/windows/apps/trace-processing/streaming), but not all event types support it. An example session using streaming mode might be coded as follows:
759 |
760 | ```cs
761 | using var trace = TraceProcessor.Create(traceFilePath);
762 | var pendingProcesses = trace.UseProcesses();
763 | int filecopyProcessId = 0;
764 |
765 | long eventCount = 0;
766 | long filecopyEventCount = 0;
767 |
768 | // ConsumerSchedule defines when our parser will be called, for example, we may choose
769 | // SecondPass when buffered processors will be available
770 | trace.UseStreaming().UseUnparsedEvents(ConsumerSchedule.Default, context =>
771 | {
772 | eventCount++;
773 | });
774 |
775 | trace.UseStreaming().UseUnparsedEvents(ConsumerSchedule.SecondPass, context =>
776 | {
777 | if (filecopyProcessId == 0)
778 | {
779 | filecopyProcessId = pendingProcesses.Result.Processes.Where(p => p.ImageName == "filecopy.exe").First().Id;
780 | }
781 | if (context.Event.ProcessId == filecopyProcessId)
782 | {
783 | filecopyEventCount++;
784 | }
785 | });
786 |
787 | trace.Process();
788 |
789 | return (filecopyEventCount, eventCount);
790 | ```
791 |
792 | In my tests, I discovered that **GenericEvents** processor is not very reliable as I could not find some of the events (for example, FileIo), visible in other tools, but maybe I was doing something wrong :)
793 |
794 | ### WPRContol
795 |
796 | WPRControl is the COM object used by, for example, wpr.exe. Its API is [well-documented](https://learn.microsoft.com/en-us/windows-hardware/test/wpt/wprcontrol-api-reference), with `KernelTraceControl.h` and `WindowsPerformanceRecordedControl.h` headers and IDLs available for our usage.
797 |
798 | ### TraceEvent
799 |
800 | [Source code](https://github.com/microsoft/perfview/tree/main/src/TraceEvent) | [Documentation](https://github.com/microsoft/perfview/tree/main/documentation)
801 |
802 | TraceEvent is a huge library which is the tracing engine that PerfView uses for collecting and processing events.
803 |
804 | When iterating through collected events, remember to clone the events you need for future processing as the current `TraceEvent` instance is in-memory replaced by the next analyzed event. For example the `requestStartEvent` and `requestStopEvent` in the code below will contain invalid data at the end of the loop (we should be calling `ev.Clone()` to save the event):
805 |
806 | ```cs
807 | TraceEvent? requestStartEvent = null, requestStopEvent = null;
808 | foreach (var ev in traceLog.Events.Where(ev => ev.ProviderGuid == aspNetProviderId))
809 | {
810 | if (ev.ActivityID == activityIdGuid)
811 | {
812 | if (ev.ID == (TraceEventID)2) // Request/Start
813 | {
814 | requestStartEvent = ev;
815 | }
816 | if (ev.ID == (TraceEventID)3) // Request/Stop
817 | {
818 | requestStopEvent = ev;
819 | }
820 | }
821 | }
822 |
823 | // requestStartEvent i requestStopEvent zawierają błędne dane, ponieważ obiekt, którego wewnętrznie używają ma nadpisane dane przez późniejsze eventy
824 | ```
825 |
826 | If you are interested how TraceEvent library processes the ETW events, the good place to start is the `ETWTraceEventSource.RawDispatchClassic` event callback function. It uses `TraceEvent.Lookup` to create the final instance of the `TraceEvent` class.
827 |
828 | ### KrabsETW
829 |
830 | [Source code](https://github.com/microsoft/krabsetw)
831 |
832 | KrabsETW is used by the Office 365 Security team. An example code to start a live session looks as follows:
833 |
834 | ```cs
835 | using Microsoft.O365.Security.ETW;
836 | using Microsoft.O365.Security.ETW.Kernel;
837 |
838 | using var trace = new KernelTrace("krabsetw-lab");
839 |
840 | var processProvider = new ProcessProvider();
841 |
842 | processProvider.OnEvent += (record) =>
843 | {
844 | if (record.Opcode == 0x01)
845 | {
846 | var image = record.GetAnsiString("ImageFileName", "Unknown");
847 | var pid = record.GetUInt32("ProcessId", 0);
848 | Console.WriteLine($"{image} started with PID {pid}");
849 | }
850 | };
851 |
852 | trace.Enable(processProvider);
853 |
854 | Console.CancelKeyPress += (sender, ev) =>
855 | {
856 | ev.Cancel = true;
857 | trace.Stop();
858 | };
859 |
860 | trace.Start();
861 | ```
862 |
863 | The KrabsETW is implemented in C++ CLI which complicates the deployment. Firstly, I needed to add `win-x64` to my csproj file to fix a problem with missing `Ijwhost.dll` library. However, it still produced errors when trimming and the application was failing:
864 |
865 | ```sh
866 | dotnet publish -c release -r win-x64 -p:PublishSingleFile=true -p:PublishTrimmed=true --self-contained -p:IncludeNativeLibrariesForSelfExtract=true
867 | # MSBuild version 17.6.8+c70978d4d for .NET
868 | # Determining projects to restore...
869 | # All projects are up-to-date for restore.
870 | # krabsetw-lab -> C:\code\krabsetw-lab\bin\release\net7.0-windows\win-x64\krabsetw-lab.dl
871 | # l
872 | # Optimizing assemblies for size. This process might take a while.
873 | # C:\Users\me\.nuget\packages\microsoft.o365.security.native.etw\4.3.1\lib\net6.0\Microsoft.O365.Security.Native.ETW.dll
874 | # : warning IL2104: Assembly 'Microsoft.O365.Security.Native.ETW' produced trim warnings. For more information see https:
875 | # //aka.ms/dotnet-illink/libraries [C:\code\krabsetw-lab\krabsetw-lab.csproj]
876 | # krabsetw-lab -> C:\code\krabsetw-lab\bin\release\net7.0-windows\win-x64\publish\
877 | ```
878 |
879 | ```sh
880 | krabsetw-lab.exe
881 | # Unhandled exception. System.BadImageFormatException:
882 | # File name: 'C:\code\krabsetw-lab\bin\release\net7.0-windows\win-x64\publish\Microsoft.O365.Security.Native.ETW.dll'
883 | # at Program.$(String[] args)
884 | ```
885 |
886 | When processing events, KrabsETW uses `schema_locator` to cache and decode payload of a given event:
887 |
888 | ```cpp
889 | struct schema_key
890 | {
891 | guid provider;
892 | uint16_t id;
893 | uint8_t opcode;
894 | uint8_t version;
895 | uint8_t level;
896 |
897 | // ...
898 | }
899 |
900 |
901 | inline const PTRACE_EVENT_INFO schema_locator::get_event_schema(const EVENT_RECORD &record) const
902 | {
903 | // check the cache
904 | auto key = schema_key(record);
905 | auto& buffer = cache_[key];
906 |
907 | if (!buffer) {
908 | auto temp = get_event_schema_from_tdh(record);
909 | buffer.swap(temp);
910 | }
911 |
912 | return (PTRACE_EVENT_INFO)(buffer.get());
913 | }
914 | ```
915 |
916 | ### Performance Logs and Alerts (PLA)
917 |
918 | [Documentation](https://learn.microsoft.com/en-us/previous-versions/windows/desktop/pla/pla-portal)
919 |
920 | PLA is a COM library used by logman to provide trace collection options. The library registration can be located in the registry:
921 |
922 | ```
923 | Computer\HKEY_CLASSES_ROOT\CLSID\{03837513-098B-11D8-9414-505054503030}
924 | ```
925 |
926 | The main DLLs are **pla.dll** and **plasrv.exe**.
927 |
928 | For example, the `ITraceDataProviderCollection::GetTraceDataProvidersByProcess` method, responsible for querying providers in a process, calls `TraceSession::LoadGuidArray`, which then uses `EnumerateTraceGuidsEx`.
929 |
930 | ### System API
931 |
932 | [Documentation](https://learn.microsoft.com/en-us/windows/win32/api/_etw/)
933 |
934 | Low-level API to collect and analyze traces - all above libraries use these functions.
935 |
936 | {% endraw %}
--------------------------------------------------------------------------------
/guides/diagnosing-dotnet-apps.md:
--------------------------------------------------------------------------------
1 | ---
2 | layout: page
3 | title: Diagnosing .NET applications
4 | date: 2024-01-01 08:00:00 +0200
5 | ---
6 |
7 | {% raw %}
8 |
9 | :point_right: I also authored the **[.NET Diagnostics Expert](https://diagnosticsexpert.com/?utm_source=debugrecipes&utm_medium=banner&utm_campaign=general) course**, available at Dotnetos :hot_pepper: Academy. Apart from the theory, it contains lots of demos and troubleshooting guidelines. Check it out if you're interested in learning .NET troubleshooting. :point_left:
10 |
11 | **Table of contents:**
12 |
13 |
14 |
15 | - [General .NET debugging tips](#general-net-debugging-tips)
16 | - [Loading the SOS extension into WinDbg](#loading-the-sos-extension-into-windbg)
17 | - [Manually loading symbol files for .NET Core](#manually-loading-symbol-files-for-net-core)
18 | - [Disabling JIT optimization](#disabling-jit-optimization)
19 | - [Decoding managed stacks in Sysinternals](#decoding-managed-stacks-in-sysinternals)
20 | - [Check runtime version](#check-runtime-version)
21 | - [Debugging/tracing a containerized .NET application \(Docker\)](#debuggingtracing-a-containerized-net-application-docker)
22 | - [Diagnosing exceptions or erroneous behavior](#diagnosing-exceptions-or-erroneous-behavior)
23 | - [Using Time Travel Debugging \(TTD\)](#using-time-travel-debugging-ttd)
24 | - [Collecting a memory dump](#collecting-a-memory-dump)
25 | - [Analysing exception information](#analysing-exception-information)
26 | - [Diagnosing hangs](#diagnosing-hangs)
27 | - [Listing threads call stacks](#listing-threads-call-stacks)
28 | - [Finding locks in managed code](#finding-locks-in-managed-code)
29 | - [Diagnosing waits or high CPU usage](#diagnosing-waits-or-high-cpu-usage)
30 | - [Diagnosing managed memory leaks](#diagnosing-managed-memory-leaks)
31 | - [Collecting memory snapshots](#collecting-memory-snapshots)
32 | - [Analyzing collected snapshots](#analyzing-collected-snapshots)
33 | - [Diagnosing issues with assembly loading](#diagnosing-issues-with-assembly-loading)
34 | - [Troubleshooting loading with EventPipes/ETW \(.NET\)](#troubleshooting-loading-with-eventpipesetw-net)
35 | - [Troubleshooting loading using ETW \(.NET Framework\)](#troubleshooting-loading-using-etw-net-framework)
36 | - [Troubleshooting loading using Fusion log \(.NET Framework\)](#troubleshooting-loading-using-fusion-log-net-framework)
37 | - [GAC \(.NET Framework\)](#gac-net-framework)
38 | - [Find assembly in cache](#find-assembly-in-cache)
39 | - [Uninstall assembly from cache](#uninstall-assembly-from-cache)
40 | - [Diagnosing network connectivity issues](#diagnosing-network-connectivity-issues)
41 | - [.NET Core](#net-core)
42 | - [.NET Framework](#net-framework)
43 | - [ASP.NET Core](#aspnet-core)
44 | - [Collecting ASP.NET Core logs](#collecting-aspnet-core-logs)
45 | - [ILogger logs](#ilogger-logs)
46 | - [DiagnosticSource logs](#diagnosticsource-logs)
47 | - [Collecting ASP.NET Core performance counters](#collecting-aspnet-core-performance-counters)
48 | - [ASP.NET \(.NET Framework\)](#aspnet-net-framework)
49 | - [Examining ASP.NET process memory \(and dumps\)](#examining-aspnet-process-memory-and-dumps)
50 | - [Profiling ASP.NET](#profiling-aspnet)
51 | - [Application instrumentation](#application-instrumentation)
52 | - [ASP.NET ETW providers](#aspnet-etw-providers)
53 | - [Collect events using the Perfecto tool](#collect-events-using-the-perfecto-tool)
54 | - [Collect events using FREB](#collect-events-using-freb)
55 |
56 |
57 |
58 | ## General .NET debugging tips
59 |
60 | ### Loading the SOS extension into WinDbg
61 |
62 | When debugging a **.NET Framework application**, WinDbgX should automatically find a correct version of the SOS.dll. If it fails to do so and your .NET Framework version matches the one of the target app, use the following command:
63 |
64 | ```
65 | .loadby sos mscorwks (.NET 2.0/3.5)
66 | .loadby sos clr (.NET 4.0+)
67 | ```
68 |
69 | For **.NET Core**, you need to download and install the **dotnet-sos** tool. The install command informs how to load SOS into WinDbg, for example:
70 |
71 | ```
72 | > dotnet tool install -g dotnet-sos
73 | ...
74 | > dotnet sos install
75 | ...
76 | Execute '.load C:\Users\me\.dotnet\sos\sos.dll' to load SOS in your Windows debugger.
77 | Cleaning up...
78 | SOS install succeeded
79 | ```
80 |
81 | SOS commands sometimes get overriden by other extensions help files. In such case, use **!sos.help \[cmd\]** command, for example, `!sos.help !savemodule`.
82 |
83 | ### Manually loading symbol files for .NET Core
84 |
85 | I noticed that sometimes Microsoft public symbol servers do not have .NET Core dlls symbols. That does not allow WinDbg to decode native .NET stacks. Fortunately, we may solve this problem by precaching symbol files using the [dotnet-symbol](https://github.com/dotnet/symstore/tree/master/src/dotnet-symbol) tool. Assuming we set our `_NT_SYMBOL_PATH` to `SRV*C:\symbols\dbg*https://msdl.microsoft.com/download/symbols`, we need to run dotnet-symbol with the **--cache-directory** parameter pointing to our symbol cache folder (for example, `C:\symbols\dbg`):
86 |
87 | ```
88 | dotnet-symbol --recurse-subdirectories --cache-directory c:\symbols\dbg -o C:\temp\toremove "C:\Program Files\dotnet\shared\Microsoft.NETCore.App\3.0.0\*"
89 | ```
90 |
91 | We may later remove the `C:\temp\toremove` folder as all PDB files are indexed in the cache directory. The output folder contains both DLL and PDB files, takes lots of space, and is often not required.
92 |
93 | ### Disabling JIT optimization
94 |
95 | For **.NET Core**, set the **COMPlus_JITMinOptsx** environment variable:
96 |
97 | ```
98 | export COMPlus_JITMinOpts=1
99 | ```
100 |
101 | For **.NET Framework**, you need to create an ini file. The ini file must have the same name as the executable with only extension changed to ini, eg. my.ini file will work with my.exe application.
102 |
103 | ```
104 | [.NET Framework Debugging Control]
105 | GenerateTrackingInfo=1
106 | AllowOptimize=0
107 | ```
108 |
109 | ### Decoding managed stacks in Sysinternals
110 |
111 | As of version 16.22 version, **Process Explorer** understands managed stacks and should display them correctly when you double click on a thread in a process.
112 |
113 | **Process Monitor**, unfortunately, lacks this feature. Pure managed modules will appear as `` in the call stack view. However, we may fix the problem for the ngened assemblies. First, you need to generate a .pdb file for the ngened assembly, for example, `ngen createPDB c:\Windows\assembly\NativeImages_v4.0.30319_64\mscorlib\e2c5db271896923f5450a77229fb2077\mscorlib.ni.dll c:\symbols\private`. Then make sure you have this path in your `_NT_SYMBOL_PATH` variable, for example, `C:\symbols\private;SRV*C:\symbols\dbg*http://msdl.microsoft.com/download/symbols`. If procmon still does not resolve the symbols, go to Options - Configure Symbols and reload the dbghelp.dll. I observe this issue in version 3.50.
114 |
115 | ### Check runtime version
116 |
117 | For .NET Framework 2.0, you could check the version of mscorwks in the file properties or, if in debugger, using lmmv. For .NET Framework 4.x, you need to check clr.dll (or the Release value under the `HKEY_LOCAL_MACHINE\SOFTWARE\Microsoft\NET Framework Setup\NDP\v4\Full` key) and find it in the [Microsoft Docs](https://docs.microsoft.com/en-us/dotnet/framework/migration-guide/versions-and-dependencies).
118 |
119 | In .NET Core, we could run **dotnet --list-runtimes** command to list the available runtimes.
120 |
121 | ### Debugging/tracing a containerized .NET application (Docker)
122 |
123 | With the introduction of EventPipes in .NET Core 2.1, the easiest approach is to create a shared `/tmp` volume and use a sidecar diagnostics container. A sample Dockerfile.netdiag may look as follows:
124 |
125 | ```
126 | FROM mcr.microsoft.com/dotnet/sdk:5.0 AS base
127 |
128 | RUN apt-get update && apt-get install -y lldb; \
129 | dotnet tool install -g dotnet-symbol; \
130 | dotnet tool install -g dotnet-sos; \
131 | /root/.dotnet/tools/dotnet-sos install
132 |
133 | RUN dotnet tool install -g dotnet-counters; \
134 | dotnet tool install -g dotnet-trace; \
135 | dotnet tool install -g dotnet-dump; \
136 | dotnet tool install -g dotnet-gcdump; \
137 | echo 'export PATH="$PATH:/root/.dotnet/tools"' >> /root/.bashrc
138 |
139 | ENTRYPOINT ["/bin/bash"]
140 | ```
141 |
142 | You may use it to create a .NET diagnostics Docker image, for example:
143 |
144 | ```
145 | $ docker build -t netdiag -f .\Dockerfile.netdiag .
146 | ```
147 |
148 | Then, create a `/tmp` volume and mount it into your .NET application container, for example:
149 |
150 | ```
151 | $ docker volume create dotnet-tmp
152 |
153 | $ docker run --rm --name helloserver --mount "source=dotnet-tmp,target=/tmp" -p 13000:13000 helloserver 13000
154 | ```
155 |
156 | And you are ready to run the diagnostics container and diagnose the remote application:
157 |
158 | ```
159 | $ docker run --rm -it --mount "source=dotnet-tmp,target=/tmp" --pid=container:helloserver netdiag
160 |
161 | root@d4bfaa3a9322:/# dotnet-trace ps
162 | 1 dotnet /usr/share/dotnet/dotnet
163 | ```
164 |
165 | If you only want to trace the application with **dotnet-trace**, consider using a shorter Dockerfile.nettrace file:
166 |
167 | ```
168 | FROM mcr.microsoft.com/dotnet/sdk:5.0 AS base
169 |
170 | RUN dotnet tool install -g dotnet-trace
171 |
172 | ENTRYPOINT ["/root/.dotnet/tools/dotnet-trace", "collect", "-n", "dotnet", "-o", "/work/trace.nettrace", "@/work/input.rsp"]
173 | ```
174 |
175 | where input.rsp:
176 |
177 | ```
178 | --providers Microsoft-Windows-DotNETRuntime:0x14C14FCCBD:4,Microsoft-DotNETCore-SampleProfiler:0xF00000000000:4
179 | ```
180 |
181 | The nettrace container will automatically start the tracing session enabling the providers from the input.rsp file. It also assumes the destination process name is dotnet:
182 |
183 | ```
184 | $ docker build -t nettrace -f .\Dockerfile.nettrace .
185 |
186 | $ docker run --rm --pid=container:helloserver --mount "source=dotnet-tmp,target=/tmp" -v "$pwd/:/work" -it nettrace
187 |
188 | Provider Name Keywords Level Enabled By
189 | Microsoft-Windows-DotNETRuntime 0x00000014C14FCCBD Informational(4) --providers
190 | Microsoft-DotNETCore-SampleProfiler 0x0000F00000000000 Informational(4) --providers
191 |
192 | Process : /usr/share/dotnet/dotnet
193 | Output File : /work/trace.nettrace
194 | [00:00:00:02] Recording trace 261.502 (KB)
195 | Press or to exit...11 (KB)
196 | Stopping the trace. This may take up to minutes depending on the application being traced.
197 | ```
198 |
199 | ## Diagnosing exceptions or erroneous behavior
200 |
201 | ### Using Time Travel Debugging (TTD)
202 |
203 | Time Travel Debugging is an excellent way of troubleshooting errors and exceptions. We can step through the code causing the problems at our own pace. I describe TTD in [a WinDbg guide](/guides/windbg). It is my preferred way of debugging issues in applications and I highly recommend giving it a try.
204 |
205 | ### Collecting a memory dump
206 |
207 | **[dotnet-dump](https://docs.microsoft.com/en-us/dotnet/core/diagnostics/dotnet-dump)** is one of the .NET diagnostics CLI tools. You may download it using curl or wget, for example: `curl -JLO https://aka.ms/dotnet-dump/win-x64`.
208 |
209 | To create a full memory dump, run one of the commands:
210 |
211 | ```
212 | dotnet-dump collect -p
213 | dotnet-dump collect -n
214 | ```
215 |
216 | You may create a heap-only memory dump by adding the **--type=Heap** option.
217 |
218 | Createdump shares the location with the coreclr library, for example, for .NET 5: `/usr/share/dotnet/shared/Microsoft.NETCore.App/5.0.3/createdump` or `c:\Program Files\dotnet\shared\Microsoft.NETCore.App\5.0.3\createdump.exe`.
219 |
220 | To create a full memory dump, run **createdump --full {process-id}**. With no options provided, it creates a memory dump with heap memory, which equals to **createdump --withheap {pid}**.
221 |
222 | The .NET application may run **createdump** automatically on crash. We configure this feature through [environment variables](https://learn.microsoft.com/en-us/dotnet/core/diagnostics/collect-dumps-crash), for example:
223 |
224 | ```shell
225 | # enable a memory dump creation on crash
226 | set DOTNET_DbgEnableMiniDump=1
227 | # when crashing, create a heap (2) memory dump, (4) for full memory dump
228 | set DOTNET_DbgMiniDumpType=2
229 | ```
230 |
231 | Apart from the .NET tools described above, you may create memory dumps with tools described in [the guide dedicated to diagnosing native Windows applications](diagnosing-native-windows-apps). As those tools usually do not understand .NET memory layout, I recommend creating full memory dumps to have all the necessary metadata for later analysis.
232 |
233 | ### Analysing exception information
234 |
235 | First make sure with the **!Threads** command (SOS) that your current thread is the one with the exception context:
236 |
237 | ```
238 | 0:000> !Threads
239 | ThreadCount: 2
240 | UnstartedThread: 0
241 | BackgroundThread: 1
242 | PendingThread: 0
243 | DeadThread: 0
244 | Hosted Runtime: no
245 |
246 | ID OSID ThreadOBJ State GC Mode GC Alloc Context Domain Count Apt Exception
247 | 0 1 1ec8 000000000055adf0 2a020 Preemptive 0000000002253560:0000000002253FD0 00000000004fb970 0 Ukn System.ArgumentException 0000000002253438
248 | 5 2 1c74 00000000005851a0 2b220 Preemptive 0000000000000000:0000000000000000 00000000004fb970 0 Ukn (Finalizer)
249 | ```
250 |
251 | In the snippet above we can see that the exception was thrown on the thread no. 0 and this is our currently selected thread (in case it's not, we would use **\~0s** command) so we may use the **!PrintException** command from SOS (alias **!pe**), for example:
252 |
253 | ```
254 | 0:000> !pe
255 | Exception object: 0000000002253438
256 | Exception type: System.ArgumentException
257 | Message: v should not be null
258 | InnerException:
259 | StackTrace (generated):
260 |
261 | StackTraceString:
262 | HResult: 80070057
263 | ```
264 |
265 | To see the full managed call stack, use the **!CLRStack** command. By default, the debugger will stop on an unhandled exception. If you want to stop at the moment when an exception is thrown (first-chance exception), run the **sxe clr** command at the beginning of the debugging session.
266 |
267 | ## Diagnosing hangs
268 |
269 | We usually start the analysis by looking at the threads running in a process. The call stacks help us identify blocked threads. We can use TTD, thread-time trace, or memory dumps to learn about what threads are doing. In the follow-up sections, I will describe how to find lock objects and relations between threads in memory dumps.
270 |
271 | ### Listing threads call stacks
272 |
273 | To list native stacks for all the threads in **WinDbg**, run: **~\*k** or **~\*e!dumpstack**. If you are interested only in managed stacks, you may use the **~\*e!clrstack** SOS command. The **dotnet-dump**'s **analyze** command provides a super useful parallel stacks command:
274 |
275 | ```
276 | > dotnet dump analyze test.dmp
277 | > pstacks
278 | ________________________________________________
279 | ~~~~ 5cd8
280 | 1 System.Threading.Monitor.Enter(Object, Boolean ByRef)
281 | 1 deadlock.Program.Lock2()
282 | ~~~~ 3e58
283 | 1 System.Threading.Monitor.Enter(Object, Boolean ByRef)
284 | 1 deadlock.Program.Lock1()
285 | 2 System.Threading.Tasks.Task.InnerInvoke()
286 | ...
287 | 2 System.Threading.ThreadPoolWorkQueue.Dispatch()
288 | 2 System.Threading._ThreadPoolWaitCallback.PerformWaitCallback()
289 | ```
290 |
291 | In **LLDB**, we may show native call stacks for all the threads with the **bt all** command. Unfortunately, if we want to use !dumpstack or !clrstack commands, we need to manually switch between threads with the thread select command.
292 |
293 | ### Finding locks in managed code
294 |
295 | You may examine thin locks using **!DumpHeap -thinlocks**. To find all sync blocks, use the **!SyncBlk -all** command.
296 |
297 | On .NET Framework, you may also use the **!dlk** command from the SOSEX extension. It is pretty good in detecting deadlocks, for example:
298 |
299 | ```
300 | 0:007> .load sosex
301 | 0:007> !dlk
302 | Examining SyncBlocks...
303 | Scanning for ReaderWriterLock(Slim) instances...
304 | Scanning for holders of ReaderWriterLock locks...
305 | Scanning for holders of ReaderWriterLockSlim locks...
306 | Examining CriticalSections...
307 | Scanning for threads waiting on SyncBlocks...
308 | Scanning for threads waiting on ReaderWriterLock locks...
309 | Scanning for threads waiting on ReaderWriterLocksSlim locks...
310 | *** WARNING: Unable to verify checksum for C:\WINDOWS\assembly\NativeImages_v4.0.30319_32\System\3a4f0a84904c4b568b6621b30306261c\System.ni.dll
311 | *** WARNING: Unable to verify checksum for C:\WINDOWS\assembly\NativeImages_v4.0.30319_32\System.Transactions\ebef418f08844f99287024d1790a62a4\System.Transactions.ni.dll
312 | Scanning for threads waiting on CriticalSections...
313 | *DEADLOCK DETECTED*
314 | CLR thread 0x1 holds the lock on SyncBlock 011e59b0 OBJ:02e93410[System.Object]
315 | ...and is waiting on CriticalSection 01216a58
316 | CLR thread 0x3 holds CriticalSection 01216a58
317 | ...and is waiting for the lock on SyncBlock 011e59b0 OBJ:02e93410[System.Object]
318 | CLR Thread 0x1 is waiting at clr!CrstBase::SpinEnter+0x92
319 | CLR Thread 0x3 is waiting at System.Threading.Monitor.Enter(System.Object, Boolean ByRef)(+0x17 Native)
320 | ```
321 |
322 | When debugging locks in code that is using tasks it is often necessary to examine execution contexts assigned to the running threads. I prepared a simple script which lists threads with their execution contexts. You only need (as in previous script) to find the MT of the Thread class in your appdomain, e.g.
323 |
324 | ```
325 | 0:036> !Name2EE mscorlib.dll System.Threading.Thread
326 | Module: 72551000
327 | Assembly: mscorlib.dll
328 | Token: 020001d1
329 | MethodTable: 72954960
330 | EEClass: 725bc0c4
331 | Name: System.Threading.Thread
332 | ```
333 |
334 | And then paste it in the scripts below:
335 |
336 | x86 version:
337 |
338 | ```
339 | .foreach ($addr {!DumpHeap -short -mt }) { .printf /D "Thread: %i; Execution context: %p\n", poi(${$addr}+28), poi(${$addr}+8), poi(${$addr}+8) }
340 | ```
341 |
342 | x64 version:
343 |
344 | ```
345 | .foreach ($addr {!DumpHeap -short -mt }) { .printf /D "Thread: %i; Execution context: %p\n", poi(${$addr}+4c), poi(${$addr}+10), poi(${$addr}+10) }
346 | ```
347 |
348 | Notice that the thread number from the output is a managed thread id and to map it to the windbg thread number you need to use the !Threads command.
349 |
350 | ## Diagnosing waits or high CPU usage
351 |
352 | Dotnet-trace allows us to enable the runtime CPU sampling provider (**Microsoft-DotNETCore-SampleProfiler**). However, using it might impact application performance as it internally calls **ThreadSuspend::SuspendEE** to suspend managed code execution while collecting the samples. Although it is a sampling profiler, it is a bit special. It runs on a separate thread and collects stacks of all the managed threads, even the waiting ones. This behavior resembles the thread time profiler. Probably that's the reason why PerfView shows us the **Thread Time** view when opening the .nettrace file.
353 |
354 | Sample collect examples:
355 |
356 | ```bash
357 | dotnet-trace collect --profile cpu-sampling -p 12345
358 | dotnet-trace collect --profile cpu-sampling -- myapp.exe
359 | ```
360 |
361 | Dotnet-trace does not automatically enable DiagnosticSource or TPL providers. Therefore, if we want to see activities in PerfView, we need to turn them on manually, for example:
362 |
363 | ```bash
364 | dotnet-trace collect --profile cpu-sampling --providers "Microsoft-Diagnostics-DiagnosticSource:0xFFFFFFFFFFFFF7FF:4:FilterAndPayloadSpecs=HttpHandlerDiagnosticListener/System.Net.Http.Request@Activity2Start:Request.RequestUri\nHttpHandlerDiagnosticListener/System.Net.Http.Response@Activity2Stop:Response.StatusCode,System.Threading.Tasks.TplEventSource:1FF:5" -n testapp
365 | ```
366 |
367 | For diagnosing CPU problems in .NET applications running on Windows, we may also rely on ETW (Event Tracing for Windows). In [a guide dedicated to diagnosing native applications](diagnosing-native-windows-apps), I describe how to collect and analyze ETW traces.
368 |
369 | On Linux, we additionally have the [perfcollect](https://docs.microsoft.com/en-us/dotnet/core/diagnostics/trace-perfcollect-lttng) script. It is the easiest way to use Linux Kernel perf_events for diagnosing .NET apps. In my tests, however, I found that quite often, it did not correctly resolve .NET stacks.
370 |
371 | To collect CPU samples with perfcollect, use the **perfcollect collect** command. To also enable the Thread Time events, add the **-threadtime** option. If only possible, I would recommend opening the traces (even the ones from Linux) in PerfView. But if it's impossible, try the **view** command of the perfcollect script, for example:
372 |
373 | ```bash
374 | perfcollect view sqrt.trace.zip -graphtype caller
375 | ```
376 |
377 | Using the **-graphtype** option, we may switch from the top-down view (`caller`) to the bottom-up view (`callee`).
378 |
379 | ## Diagnosing managed memory leaks
380 |
381 | ### Collecting memory snapshots
382 |
383 | If we are interested only in GC Heaps, we may create the GC Heap snapshot using **PerfView**:
384 |
385 | perfview heapsnapshot
386 |
387 | In GUI, we may use the menu option: **Memory -> Take Heap Snapshot**.
388 |
389 | For .NET Core applications, we have a CLI tool: **dotnet-gcdump**, which you may get from the https://aka.ms/dotnet-gcdump/runtime-id URL, for example, https://aka.ms/dotnet-gcdump/linux-x64. And to collect the GC dump we need to run one of the commands:
390 |
391 | ```
392 | dotnet-gcdump -p
393 | dotnet-gcdump -n
394 | ```
395 |
396 | Sometimes managed heap is not enough to diagnose the memory leak. In such situations, we need to create a memory dump, as described in [a guide dedicated to diagnosing native applications](diagnosing-native-windows-apps).
397 |
398 | ### Analyzing collected snapshots
399 |
400 | **PerfView** can open GC Heap snapshots and dumps. If you only have a memory dump, you may convert a memory dump file to a PerfView snapshot using **PerfView HeapSnapshotFromProcessDump ProcessDumpFile {DataFile}** or using the GUI options **Memory -> Take Heap Snapshot from Dump**.
401 |
402 | I would like to bring your attention to an excellent diffing option available for heap snapshots. Imagine you made two heap snapshots of the leaking process:
403 |
404 | - first named LeakingProcess.gcdump
405 | - second (taken a minute later) named LeakingProcess.1.gcdump
406 |
407 | You may now run PerfView, open two collected snapshots, switch to the LeakingProcess.1.gcdump and under the Diff menu you should see an option to diff this snapshot with the baseline:
408 |
409 | 
410 |
411 | After you choose it, a new window will pop up with a tree of objects which have changed between the snapshots. Of course, if you have more snapshots you can generate diffs between them all. A really powerful feature!
412 |
413 | **WinDbg** allows you to analyze the full memory dumps. **Make sure that bitness of the dump matches bitness of the debugger.** Then load the SOS extension and identify objects which use most of the memory using **!DumpHeap -stat**. Later, analyze the references using the **!GCRoot** command.
414 |
415 | Other SOS commands for analyzing the managed heap include:
416 |
417 | ```
418 | !EEHeap [-gc] [-loader]
419 | !HeapStat [-inclUnrooted | -iu]
420 |
421 | !DumpHeap [-stat]
422 | [-strings]
423 | [-short]
424 | [-min ]
425 | [-max ]
426 | [-live]
427 | [-dead]
428 | [-thinlock]
429 | [-startAtLowerBound]
430 | [-mt ]
431 | [-type ]
432 | [start [end]]
433 |
434 | !ObjSize [