├── .github
└── workflows
│ └── test.yml
├── .gitignore
├── LICENSE
├── Makefile
├── README.md
├── docs
├── articles
│ ├── graph
│ │ ├── 折线图
│ │ │ └── index.html
│ │ └── 柱状图
│ │ │ └── index.html
│ └── md-docs
│ │ ├── README
│ │ └── index.html
│ │ ├── 使用方法
│ │ └── index.html
│ │ ├── 使用示例
│ │ └── index.html
│ │ └── 配色选择
│ │ └── index.html
├── css
│ ├── diff.css
│ ├── index.css
│ ├── python.css
│ └── shell.css
├── img
│ ├── after_copy.png
│ ├── before_copy.png
│ ├── caution.svg
│ ├── enter.png
│ ├── enter.svg
│ ├── important.svg
│ ├── moon.png
│ ├── note.svg
│ ├── question.svg
│ ├── search.svg
│ ├── sun.png
│ ├── tip.svg
│ └── warning.svg
├── index.html
└── js
│ ├── change_mode.js
│ ├── copy_code.js
│ ├── global_js_configuration.js
│ ├── navigator.js
│ ├── next_front.js
│ └── picture_preview.js
├── examples
├── bar1.py
├── bar2.py
├── line_1.py
├── line_2.py
└── stackbar_graph.py
├── images
├── paper
│ ├── 1.png
│ ├── 10.png
│ ├── 11.png
│ ├── 12.png
│ ├── 13.png
│ ├── 14.png
│ ├── 15.png
│ ├── 16.png
│ ├── 17.png
│ ├── 18.png
│ ├── 19.png
│ ├── 2.png
│ ├── 20.png
│ ├── 21.png
│ ├── 3.png
│ ├── 4.png
│ ├── 6.png
│ ├── 7.png
│ ├── 8.png
│ └── 9.png
└── paperplotlib
│ ├── 1.png
│ ├── 2.png
│ ├── 3.png
│ ├── 4.png
│ ├── 5.png
│ ├── 6.png
│ ├── 7.png
│ ├── 8.png
│ └── result.png
├── md-docs
├── README.md
├── dir.yml
├── graph
│ ├── 折线图.md
│ └── 柱状图.md
├── 使用方法.md
├── 使用示例.md
└── 配色选择.md
├── paperplotlib
├── __init__.py
├── bar_graph.py
├── color.css
├── color.py
├── font
│ └── consola-1.ttf
├── graph.py
├── line_graph.py
└── stackbar_graph.py
├── pyproject.toml
└── test.py
/.github/workflows/test.yml:
--------------------------------------------------------------------------------
1 | name: Test with Coverage
2 |
3 | on:
4 | push:
5 | branches: [ main ]
6 | pull_request:
7 | branches: [ main ]
8 |
9 | jobs:
10 | test:
11 | runs-on: ubuntu-latest
12 |
13 | steps:
14 | - name: Checkout code
15 | uses: actions/checkout@v2
16 |
17 | - name: Set up Python
18 | uses: actions/setup-python@v2
19 | with:
20 | python-version: 3.9
21 |
22 | - name: Install dependencies
23 | run: |
24 | python -m pip install --upgrade pip
25 | pip install coverage
26 | pip install matplotlib
27 | pip install numpy
28 |
29 | - name: Run tests with coverage
30 | run: |
31 | coverage run -m unittest
32 | coverage xml -i
33 | env:
34 | COVERAGE_RUN: True
35 |
36 | - name: Upload coverage report to Codecov
37 | uses: codecov/codecov-action@v4
38 | with:
39 | file: ./coverage.xml
--------------------------------------------------------------------------------
/.gitignore:
--------------------------------------------------------------------------------
1 | # Byte-compiled / optimized / DLL files
2 | __pycache__/
3 | *.py[cod]
4 | *$py.class
5 |
6 | # C extensions
7 | *.so
8 |
9 | # Distribution / packaging
10 | .Python
11 | build/
12 | develop-eggs/
13 | dist/
14 | downloads/
15 | eggs/
16 | .eggs/
17 | lib/
18 | lib64/
19 | parts/
20 | sdist/
21 | var/
22 | wheels/
23 | share/python-wheels/
24 | *.egg-info/
25 | .installed.cfg
26 | *.egg
27 | MANIFEST
28 |
29 | # PyInstaller
30 | # Usually these files are written by a python script from a template
31 | # before PyInstaller builds the exe, so as to inject date/other infos into it.
32 | *.manifest
33 | *.spec
34 |
35 | # Installer logs
36 | pip-log.txt
37 | pip-delete-this-directory.txt
38 |
39 | # Unit test / coverage reports
40 | htmlcov/
41 | .tox/
42 | .nox/
43 | .coverage
44 | .coverage.*
45 | .cache
46 | nosetests.xml
47 | coverage.xml
48 | *.cover
49 | *.py,cover
50 | .hypothesis/
51 | .pytest_cache/
52 | cover/
53 |
54 | # Translations
55 | *.mo
56 | *.pot
57 |
58 | # Django stuff:
59 | *.log
60 | local_settings.py
61 | db.sqlite3
62 | db.sqlite3-journal
63 |
64 | # Flask stuff:
65 | instance/
66 | .webassets-cache
67 |
68 | # Scrapy stuff:
69 | .scrapy
70 |
71 | # Sphinx documentation
72 | docs/_build/
73 |
74 | # PyBuilder
75 | .pybuilder/
76 | target/
77 |
78 | # Jupyter Notebook
79 | .ipynb_checkpoints
80 |
81 | # IPython
82 | profile_default/
83 | ipython_config.py
84 |
85 | # pyenv
86 | # For a library or package, you might want to ignore these files since the code is
87 | # intended to run in multiple environments; otherwise, check them in:
88 | # .python-version
89 |
90 | # pipenv
91 | # According to pypa/pipenv#598, it is recommended to include Pipfile.lock in version control.
92 | # However, in case of collaboration, if having platform-specific dependencies or dependencies
93 | # having no cross-platform support, pipenv may install dependencies that don't work, or not
94 | # install all needed dependencies.
95 | #Pipfile.lock
96 |
97 | # poetry
98 | # Similar to Pipfile.lock, it is generally recommended to include poetry.lock in version control.
99 | # This is especially recommended for binary packages to ensure reproducibility, and is more
100 | # commonly ignored for libraries.
101 | # https://python-poetry.org/docs/basic-usage/#commit-your-poetrylock-file-to-version-control
102 | #poetry.lock
103 |
104 | # pdm
105 | # Similar to Pipfile.lock, it is generally recommended to include pdm.lock in version control.
106 | #pdm.lock
107 | # pdm stores project-wide configurations in .pdm.toml, but it is recommended to not include it
108 | # in version control.
109 | # https://pdm.fming.dev/#use-with-ide
110 | .pdm.toml
111 |
112 | # PEP 582; used by e.g. github.com/David-OConnor/pyflow and github.com/pdm-project/pdm
113 | __pypackages__/
114 |
115 | # Celery stuff
116 | celerybeat-schedule
117 | celerybeat.pid
118 |
119 | # SageMath parsed files
120 | *.sage.py
121 |
122 | # Environments
123 | .env
124 | .venv
125 | env/
126 | venv/
127 | ENV/
128 | env.bak/
129 | venv.bak/
130 |
131 | # Spyder project settings
132 | .spyderproject
133 | .spyproject
134 |
135 | # Rope project settings
136 | .ropeproject
137 |
138 | # mkdocs documentation
139 | /site
140 |
141 | # mypy
142 | .mypy_cache/
143 | .dmypy.json
144 | dmypy.json
145 |
146 | # Pyre type checker
147 | .pyre/
148 |
149 | # pytype static type analyzer
150 | .pytype/
151 |
152 | # Cython debug symbols
153 | cython_debug/
154 |
155 | # PyCharm
156 | # JetBrains specific template is maintained in a separate JetBrains.gitignore that can
157 | # be found at https://github.com/github/gitignore/blob/main/Global/JetBrains.gitignore
158 | # and can be added to the global gitignore or merged into this file. For a more nuclear
159 | # option (not recommended) you can uncomment the following to ignore the entire idea folder.
160 | #.idea/
161 |
162 | a.py
163 | .vscode/
164 | /*.png
165 | all.py
--------------------------------------------------------------------------------
/LICENSE:
--------------------------------------------------------------------------------
1 | MIT License
2 |
3 | Copyright (c) 2024 kami-lu
4 |
5 | Permission is hereby granted, free of charge, to any person obtaining a copy
6 | of this software and associated documentation files (the "Software"), to deal
7 | in the Software without restriction, including without limitation the rights
8 | to use, copy, modify, merge, publish, distribute, sublicense, and/or sell
9 | copies of the Software, and to permit persons to whom the Software is
10 | furnished to do so, subject to the following conditions:
11 |
12 | The above copyright notice and this permission notice shall be included in all
13 | copies or substantial portions of the Software.
14 |
15 | THE SOFTWARE IS PROVIDED "AS IS", WITHOUT WARRANTY OF ANY KIND, EXPRESS OR
16 | IMPLIED, INCLUDING BUT NOT LIMITED TO THE WARRANTIES OF MERCHANTABILITY,
17 | FITNESS FOR A PARTICULAR PURPOSE AND NONINFRINGEMENT. IN NO EVENT SHALL THE
18 | AUTHORS OR COPYRIGHT HOLDERS BE LIABLE FOR ANY CLAIM, DAMAGES OR OTHER
19 | LIABILITY, WHETHER IN AN ACTION OF CONTRACT, TORT OR OTHERWISE, ARISING FROM,
20 | OUT OF OR IN CONNECTION WITH THE SOFTWARE OR THE USE OR OTHER DEALINGS IN THE
21 | SOFTWARE.
22 |
--------------------------------------------------------------------------------
/Makefile:
--------------------------------------------------------------------------------
1 |
2 | i = 1
3 |
4 | # 判断平台是 Windows 还是 Linux
5 | ifeq ($(OS),Windows_NT)
6 | RM = del
7 | else
8 | RM = rm
9 | endif
10 |
11 | .PHONY: test lexer cover
12 |
13 | test:
14 | @python test/$(i).py
15 |
16 | cover:
17 | coverage run test.py
18 | coverage html
19 |
20 | all:
21 | @python all.py $(i)
22 |
23 | clean:
24 | $(RM) *.png
--------------------------------------------------------------------------------
/README.md:
--------------------------------------------------------------------------------
1 | # paperplotlib
2 |
3 | [](https://pypi.python.org/pypi/paperplotlib/) [](https://pypi.python.org/pypi/paperplotlib/) [](https://pypi.python.org/pypi/paperplotlib/) [](https://codecov.io/gh/luzhixing12345/paperplotlib)
4 |
5 | paperplotlib 是基于 matplotlib 的论文实验数据绘图库, 意在快速绘制论文实验结果部分中常见的图表
6 |
7 | 本项目意在通过简洁的 API 调用来完成论文实验数据图的快速绘制
8 |
9 | ## 安装
10 |
11 | ```bash
12 | pip install paperplotlib
13 | ```
14 |
15 | ## 快速开始
16 |
17 | ```python
18 | import paperplotlib as ppl
19 | import numpy as np
20 |
21 | # 随机生成一个 5 x 7 的数据
22 | a = 5
23 | b = 7
24 | y = np.random.randint(10, 100, size=(a, b))
25 |
26 | # 初始化一个对象
27 | graph = ppl.BarGraph()
28 |
29 | # 传入数据/组/列的文字信息
30 | group_names = [f"group {i}" for i in range(a)]
31 | column_names = [f"column {i}" for i in range(b)]
32 | graph.plot_2d(y, group_names, column_names)
33 |
34 | # 调整x/y轴文字
35 | graph.x_label = "The number of data"
36 | graph.y_label = "Throughput (Mbps)"
37 |
38 | # 保存图片
39 | graph.save()
40 | ```
41 |
42 | 
43 |
44 | ## 使用文档
45 |
46 | 视频介绍: [【项目分享】论文实验数据绘图](https://www.bilibili.com/video/BV1Qx421m7hx/)
47 |
48 | 更多使用说明请参考: [paperplotlib 使用文档](https://luzhixing12345.github.io/paperplotlib/)
49 |
50 | ## 示例
51 |
52 | 本仓库下的 examples/ 包含可以运行的示例, 可以在 [examples](./examples) 中查看
53 |
54 | ## 参考
55 |
56 | - [matplotlib](https://matplotlib.org/stable/users/index.html)
57 | - [matplotlib.pyplot的使用总结大全](https://www.zhihu.com/tardis/zm/art/139052035?source_id=1003)
58 | - [matplotlib.pyplot常用函数讲解大全(一)](https://zhuanlan.zhihu.com/p/139475633)
59 | - [matplotlib.pyplot常用函数讲解大全(二)](https://zhuanlan.zhihu.com/p/139946399)
60 | - [Presentation练习_科研论文中插图的配色原理与方案](https://www.bilibili.com/video/BV1cJ4m1j7No/)
--------------------------------------------------------------------------------
/docs/articles/graph/折线图/index.html:
--------------------------------------------------------------------------------
1 |
2 |
3 |
4 |
5 |
6 |
7 |
8 |
9 | Document
10 |
11 |
12 |
13 |
14 |
15 |
16 |
17 |
18 | 折线图
19 |
20 |
21 |
22 |
23 |
24 |
--------------------------------------------------------------------------------
/docs/articles/graph/柱状图/index.html:
--------------------------------------------------------------------------------
1 |
2 |
3 |
4 |
5 |
6 |
7 |
8 |
9 | Document
10 |
11 |
12 |
13 |
14 |
15 |
16 |
17 |
18 | 柱状图
19 |
20 |
21 |
22 |
23 |
24 |
--------------------------------------------------------------------------------
/docs/articles/md-docs/README/index.html:
--------------------------------------------------------------------------------
1 |
2 |
3 |
4 |
5 |
6 |
7 |
8 |
9 | Document
10 |
11 |
12 |
13 |
14 |
15 |
16 |
17 |
18 | paperplotlib
paperplotlib 是基于 matplotlib 的论文实验数据绘图库, 意在快速绘制论文实验结果部分中常见的图表
本项目意在通过简洁的 API 调用来完成论文实验数据图的快速绘制
视频介绍: 【项目分享】论文实验数据绘图
安装
pip install paperplotlib
快速开始
import paperplotlib as ppl
19 | import numpy as np
20 |
21 |
22 | a = 5
23 | b = 7
24 | y = np.random.randint(10, 100, size=(a, b))
25 |
26 |
27 | graph = ppl.BarGraph()
28 |
29 |
30 | group_names = [f"group {i}" for i in range(a)]
31 | column_names = [f"column {i}" for i in range(b)]
32 | graph.plot_2d(y, group_names, column_names)
33 |
34 |
35 | graph.x_label = "The number of data"
36 | graph.y_label = "Throughput (Mbps)"
37 |
38 |
39 | graph.save()

参考
使用方法
使用 paperplotlib(下称ppl) 只需要四步
- 初始化一个实例对象
graph
- 准备好你的数据, 将数据添加到
graph 中
- 根据需要适当修改属性
- 保存图片
ppl 为您简化了初始化, 基础配置, 配色, 数据位置等一些小细节, 您可以非常简单方便的绘制一张美观的数据图
总体介绍
ppl 提供了多数据图表的绘图
绘图 api 的使用方式非常类似, 分别对应四步
import paperplotlib as ppl
19 |
20 |
21 | graph = ppl.BarGraph()
22 |
23 |
24 | x = [2, 4, 8, 16, 32]
25 | y = [2, 4, 8, 16, 32]
26 | graph.plot(x, y)
27 |
28 |
29 | graph.x_label = "The number of data"
30 | graph.y_label = "Throughput (Mbps)"
31 |
32 |
33 | graph.save()
两个类均只有两个传入数据的接口: plot plot_2d
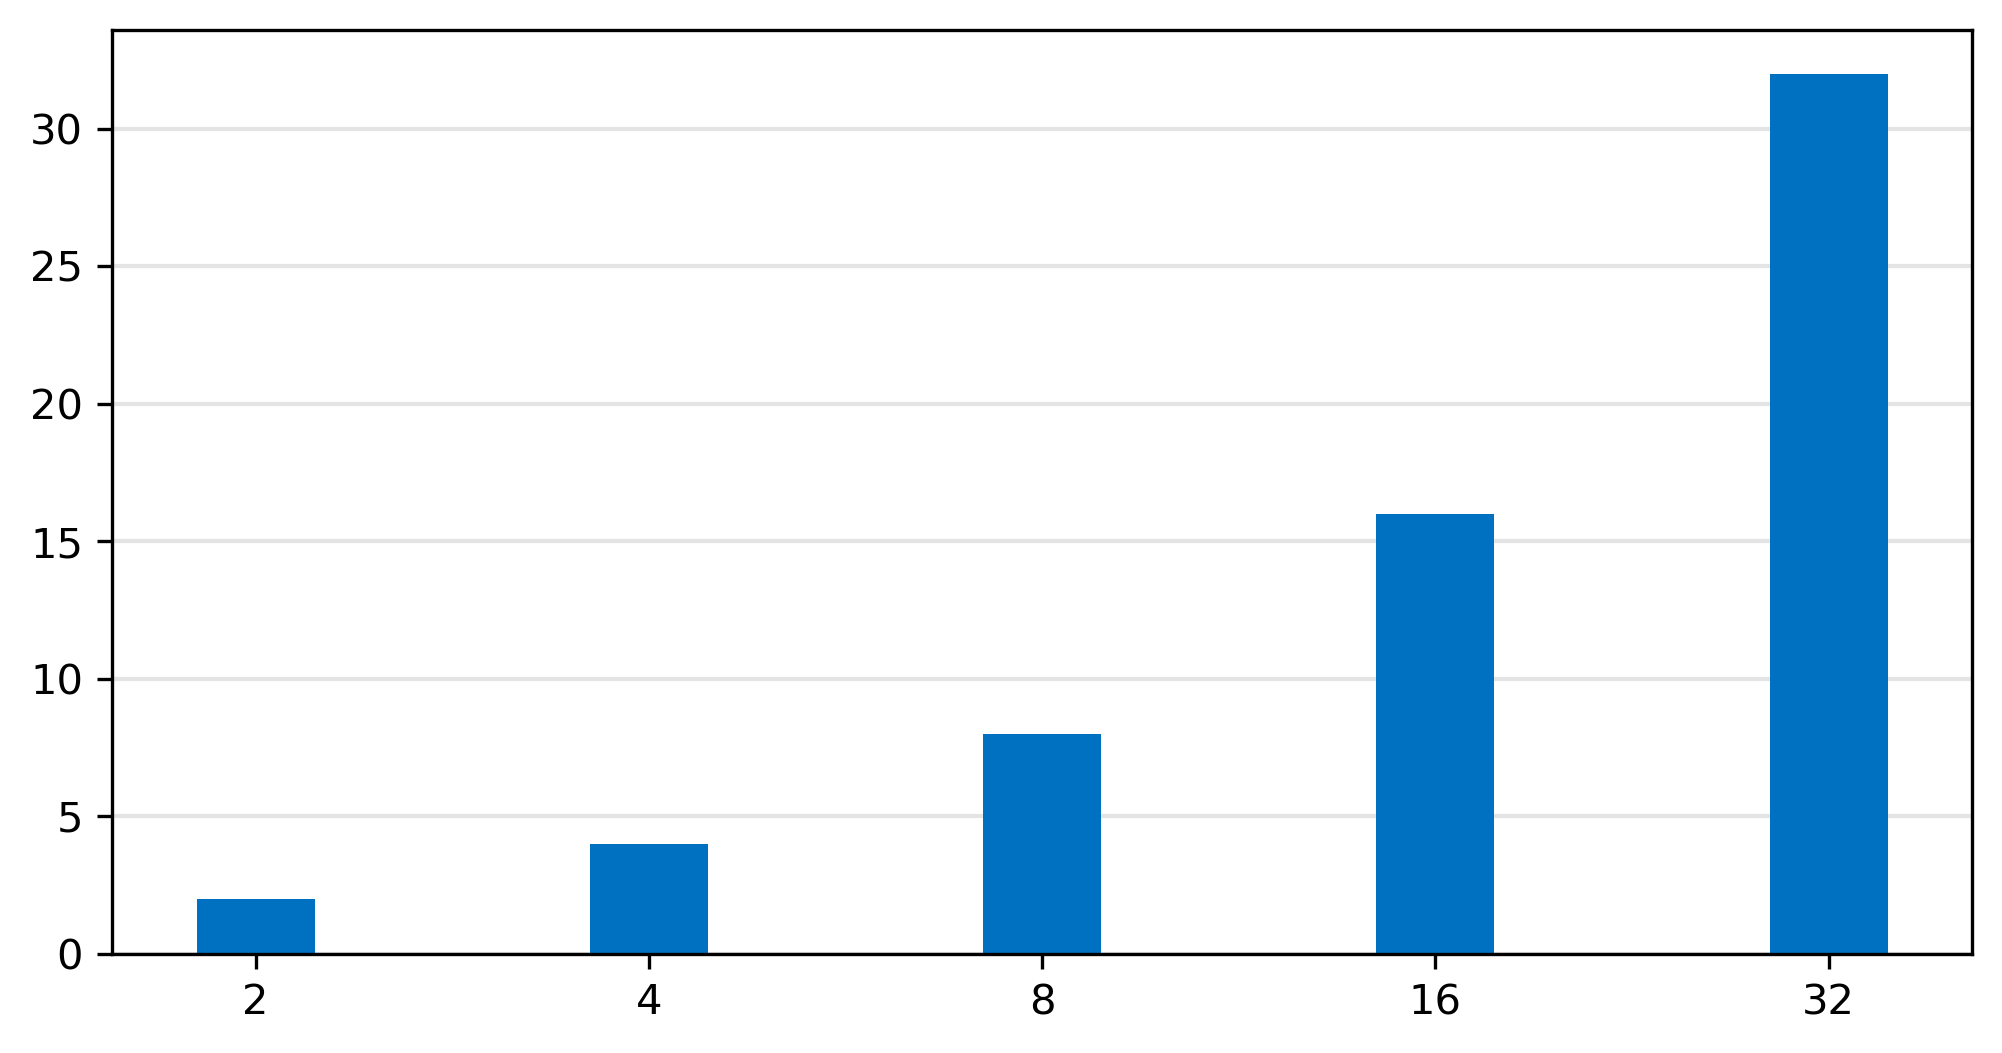
plot 用于绘制简单的一维数据, 如下所示, 传入 x,y 坐标即可
plot_2d 通常来说更为常用, 常见于论文 benchmark/workload 的数据结果中
plot_2d 的函数原型如下, 共有四个参数
def plot_2d(
34 |         self,
35 |         data: List[List[float]],
36 |         group_names: List[str],
37 |         column_names: List[str],
38 |         emphasize_index: int = -1
39 |     ):
40 |     ...
- data: 一个二维数组, 第一维代表有几组, 第二维代表有几列
- emphasize_index: 高亮的列索引(可选)
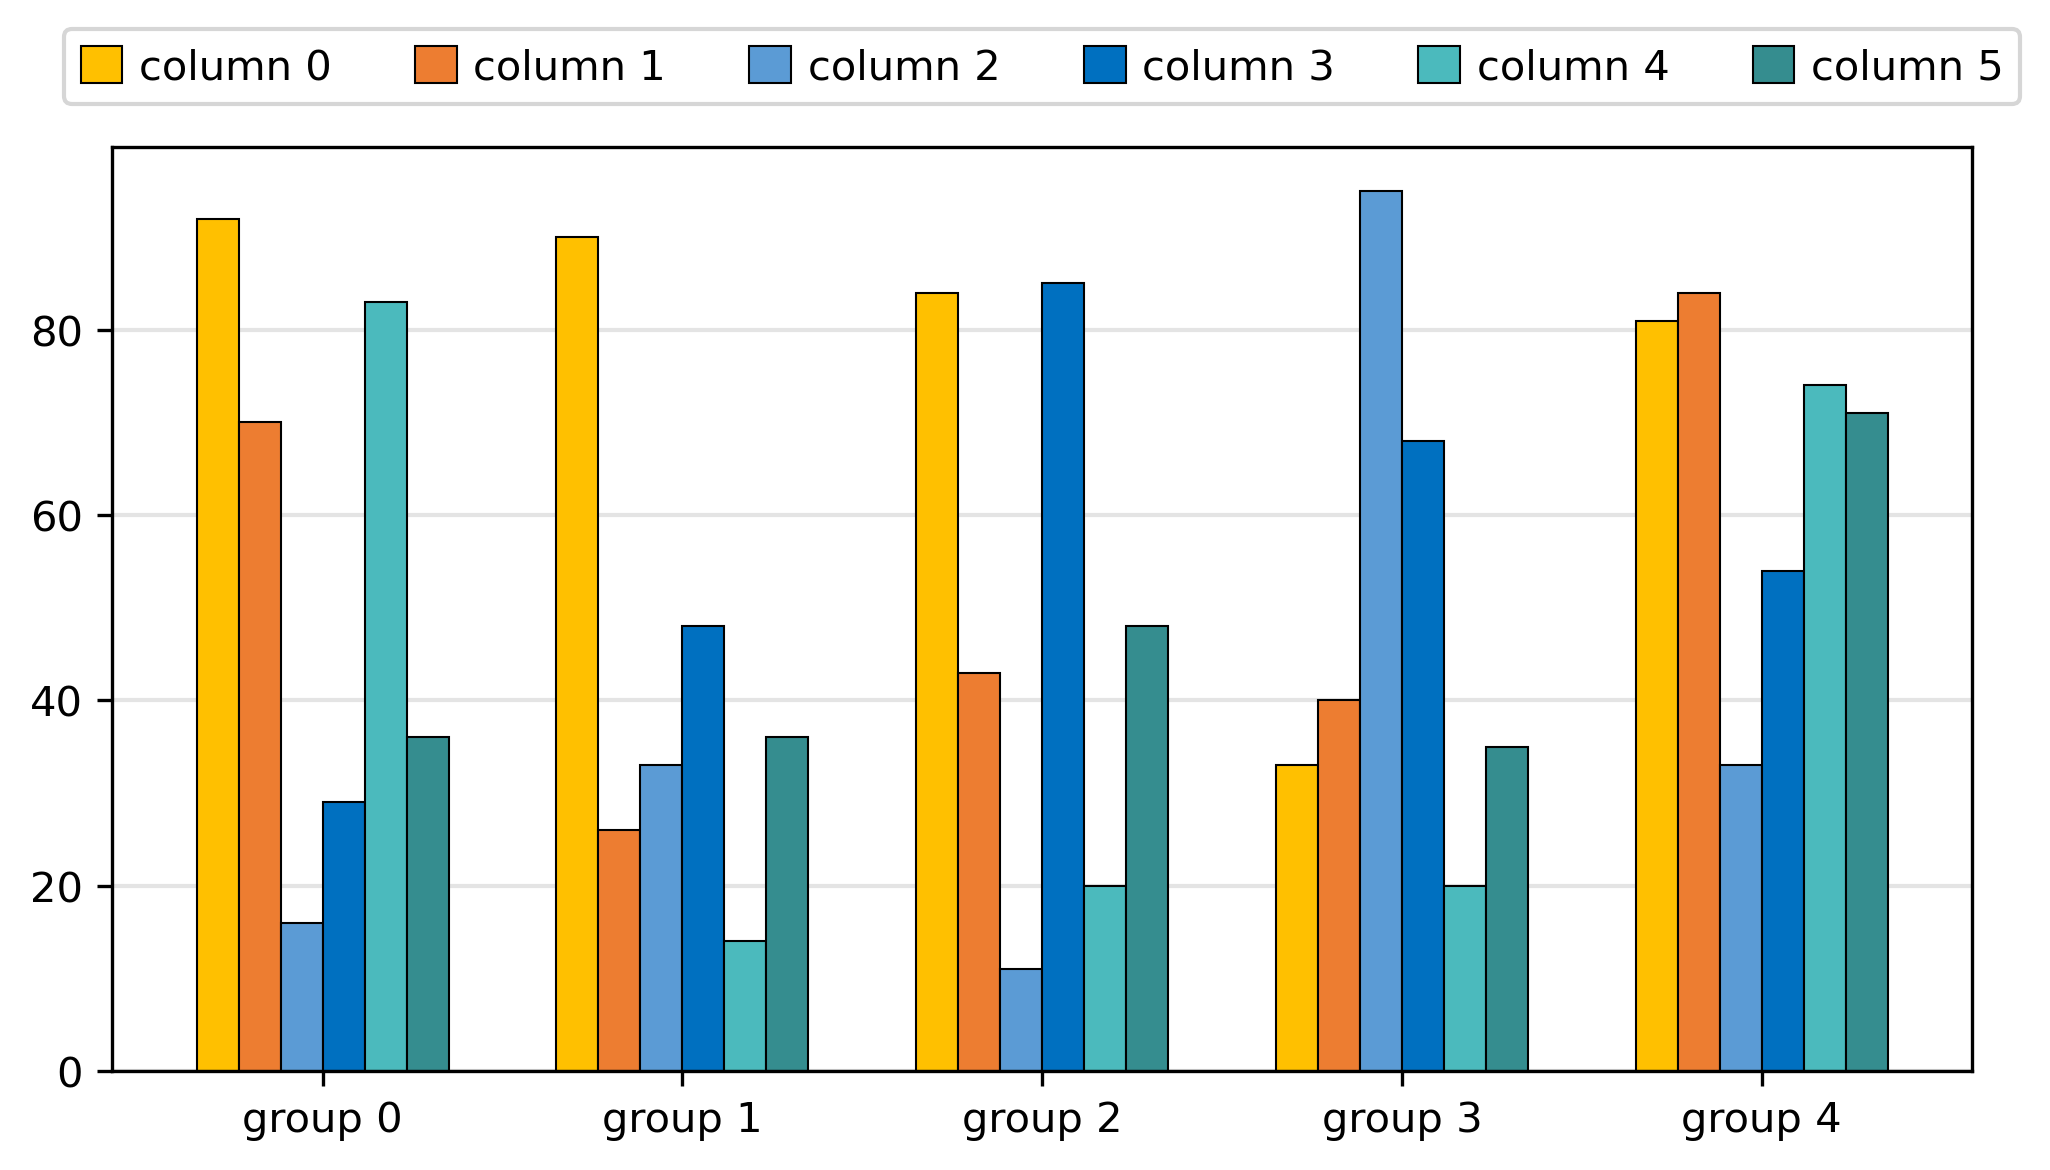
一个简单易懂的示例如下:
import paperplotlib as ppl
41 | import numpy as np
42 |
43 |
44 | a = 5
45 | b = 7
46 | y = np.random.randint(10, 100, size=(a, b))
47 |
48 |
49 | graph = ppl.BarGraph()
50 |
51 |
52 | group_names = [f"group {i}" for i in range(a)]
53 | column_names = [f"column {i}" for i in range(b)]
54 | graph.plot_2d(y, group_names, column_names)
55 |
56 |
57 | graph.x_label = "The number of data"
58 | graph.y_label = "Throughput (Mbps)"
59 |
60 |
61 | graph.save()
其中 emphasize_index 参数用于高亮某一列, 可以传入列的索引值
这通常应用在某一列是新的方法, 其他的是对比方法, 此时其他列将会选择相近的颜色而突出该列

配色
ppl 的配色采用偏冷色调的蓝色, 且是不建议调整的, 对于 1-7 列均可以采用统一的风格绘制


对于超过 7 种配色的情况, 采用渐变色处理

其他配置
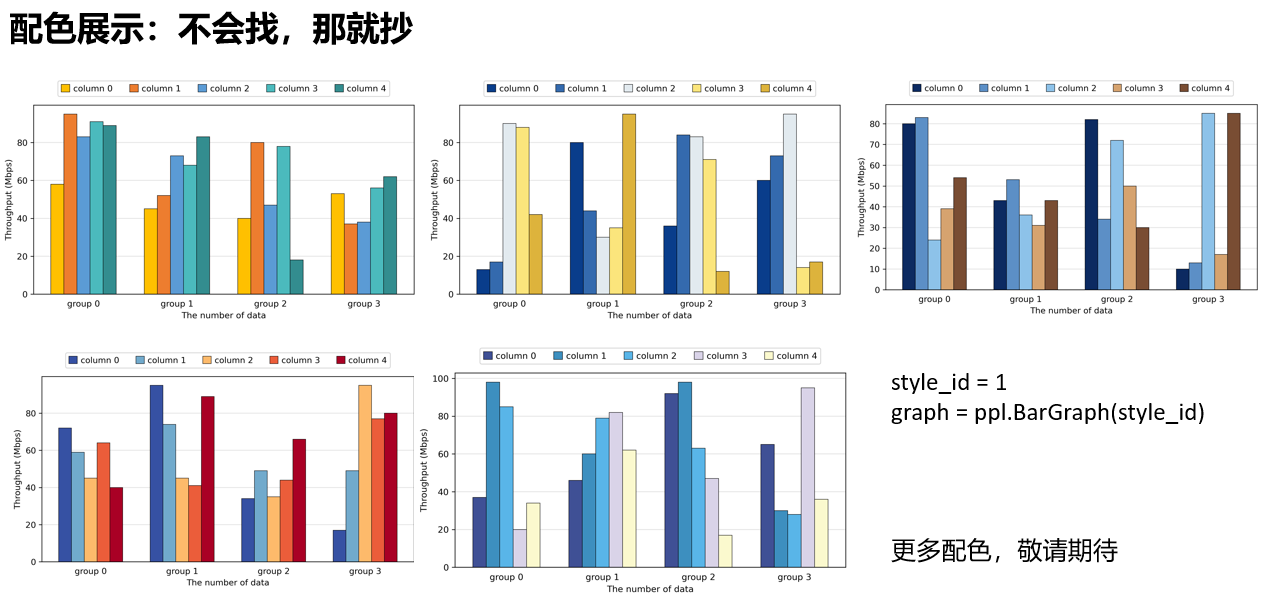
初始化阶段可以传入一个参数来决定配色
style_id = 3
62 | graph = ppl.BarGraph(style_id)
下图顺次对应 1 - 5
长图
对于有大量数据集结果的情况, 您可以将 width_picture 设置为 True, 即可生成一张长图, 可以横跨两栏放置, 类似如下的位置
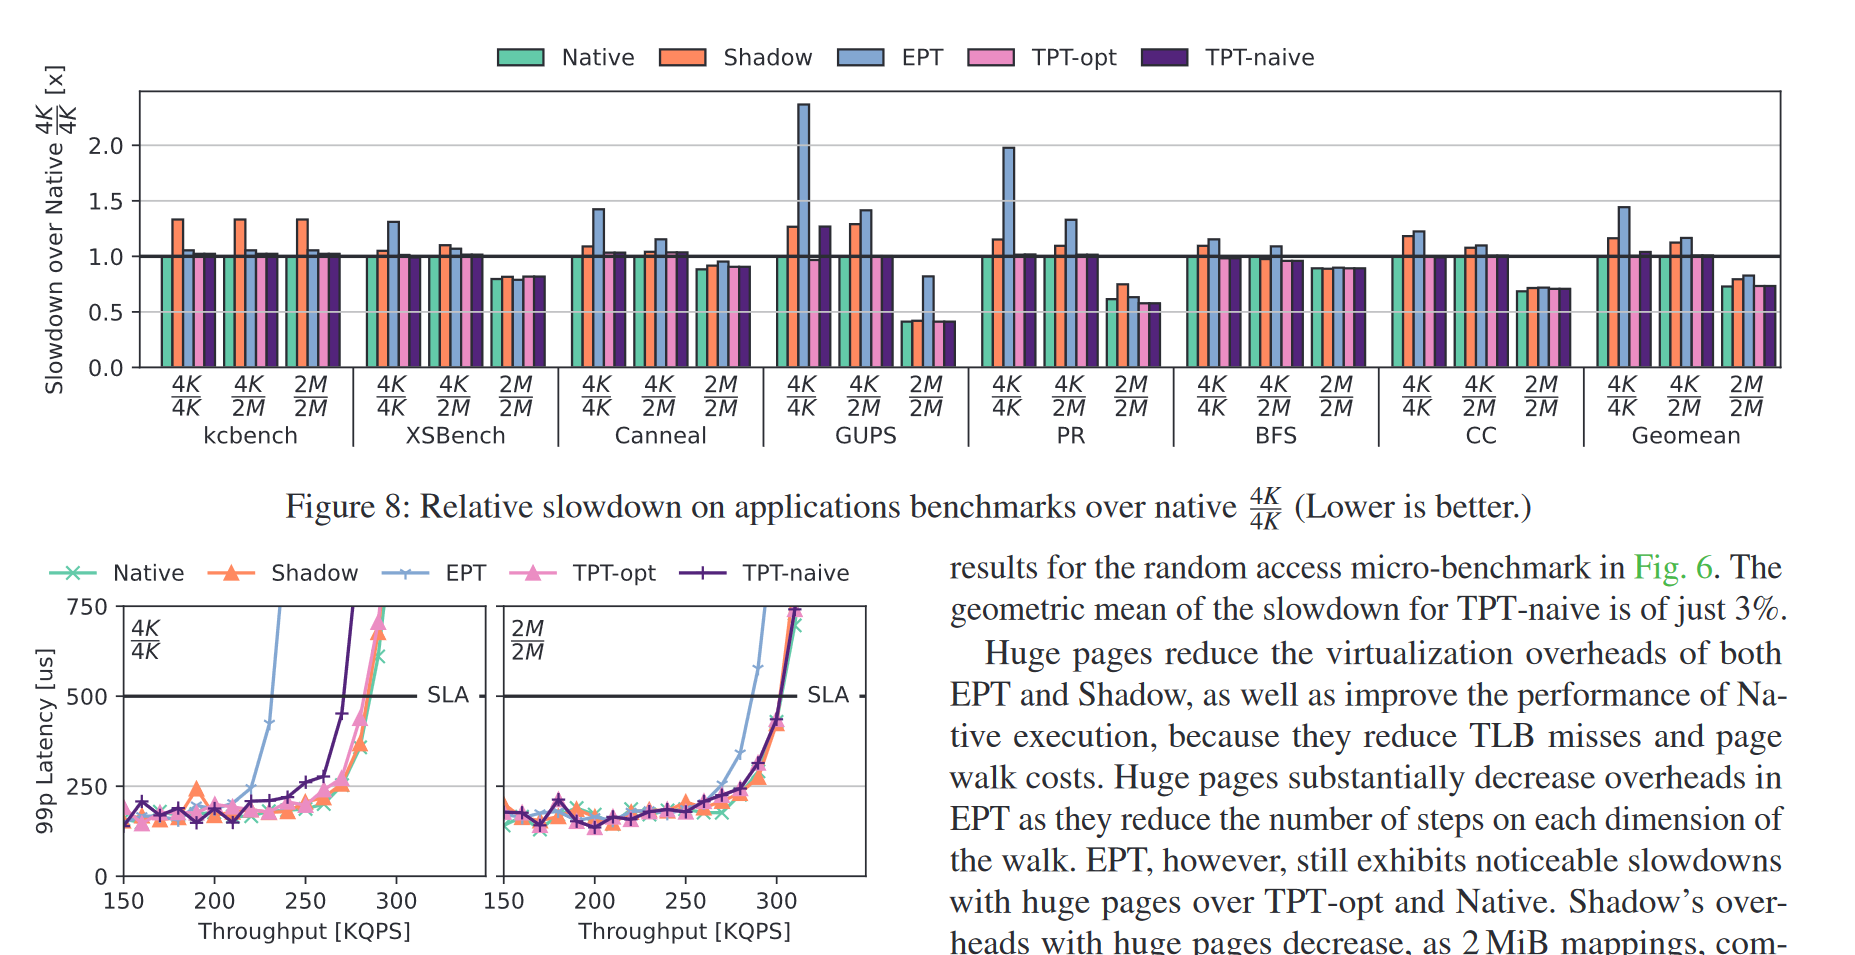
graph.width_picture = True
x y 坐标
直接设置字符串即可
graph.x_label = "Workload"
63 | graph.y_label = "Max QPS\nNormalized DDR 100%"
画一条横线
graph.add_line(50)
y 轴范围
传入一个元组类型设置范围
graph.y_lim = (0, 1.2)
使用示例
import paperplotlib as ppl
19 | import numpy as np
20 |
21 |
22 | a = 6
23 | b = 4
24 | y = np.random.randint(10, 100, size=(a, b))
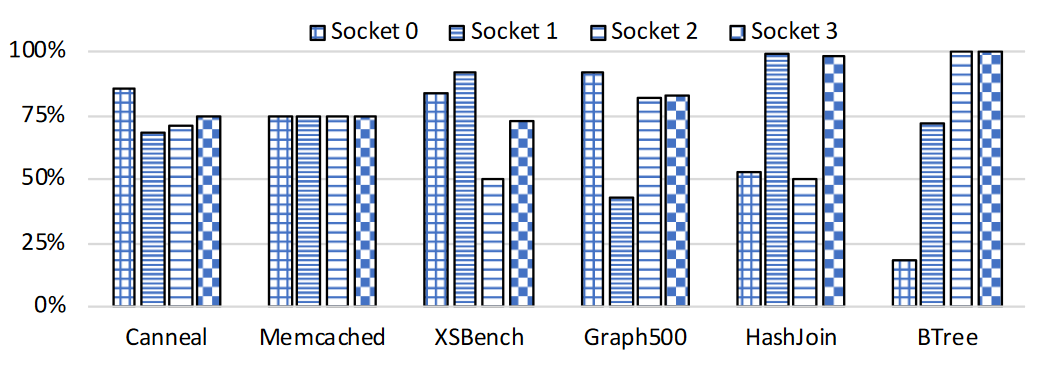
25 |
26 | group_names = ["Canneal", "Memcached", "XSBench", "Graph500", "HashJoin", "BTree"]
27 | column_names = [f"socket {i}" for i in range(b)]
28 |
29 | graph = ppl.BarGraph()
30 | graph.plot_2d(y, group_names, column_names)
31 | graph.y_lim = (0, 100)
32 | graph.save()
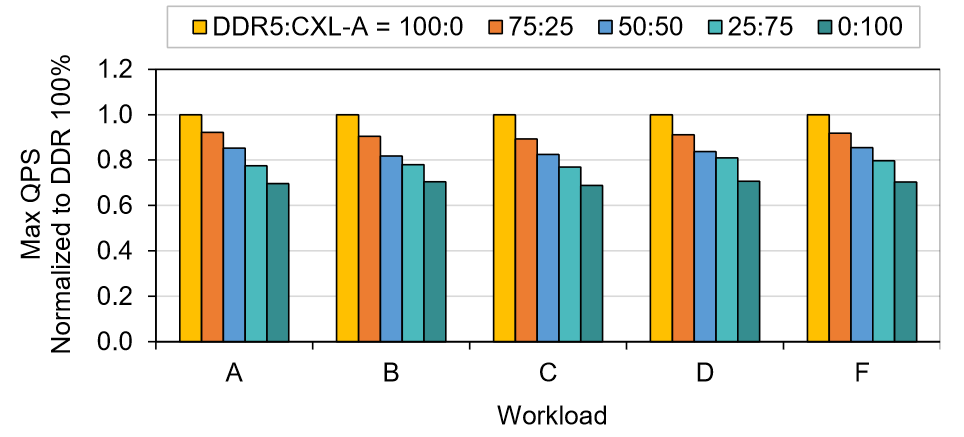
import paperplotlib as ppl
33 | import numpy as np
34 |
35 |
36 | a = 5
37 | b = 5
38 | y = np.random.rand(a,b)
39 |
40 | group_names = ["A", "B", "C", "D", "F"]
41 | column_names = ["DDR5:CXL-A = 100:0", "75:25", "50:50", "25:75", "0:100"]
42 |
43 | graph = ppl.BarGraph()
44 | graph.plot_2d(y, group_names, column_names)
45 | graph.x_label = "Workload"
46 | graph.y_label = "Max QPS\nNormalized DDR 100%"
47 | graph.y_lim = (0, 1.2)
48 | graph.save()
让某一列突出
import paperplotlib as ppl
49 | import numpy as np
50 |
51 | # 设定数组的行数a和列数b
52 | a = 5
53 | b = 5
54 | y = np.random.rand(a,b)
55 |
56 | group_names = ["A", "B", "C", "D", "F"]
57 | column_names = ["DDR5:CXL-A = 100:0", "75:25", "50:50", "25:75", "0:100"]
58 |
59 | graph = ppl.BarGraph()
60 | - graph.plot_2d(y, group_names, column_names)
61 | + graph.plot_2d(y, group_names, column_names, emphasize_index=0)
62 | graph.x_label = "Workload"
63 | graph.y_label = "Max QPS\nNormalized DDR 100%"
64 | graph.y_lim = (0, 1.2)
65 | graph.save()
宽图, 适用于多组数据, 双栏
import paperplotlib as ppl
66 | import numpy as np
67 |
68 |
69 | a = 8
70 | b = 6
71 | y = np.random.randint(10, 100, size=(a, b))
72 |
73 | group_names = [f"group {i}" for i in range(a)]
74 | column_names = [f"column {i}" for i in range(b)]
75 |
76 | graph = ppl.BarGraph()
77 | graph.plot_2d(y, group_names, column_names)
78 | graph.x_label = "The number of data"
79 | graph.y_label = "Throughput (Mbps)"
80 | graph.width_picture = True
81 | graph.save()

配色选择
单色
虽然现在我们选用单色作图的情况并不是很多,因为大多数情况要进行数据比较.如果需要使用单色的情况,建议使用上述的蓝色,要比黑色或者灰色更加活泼.
双色、三色
- 双色、三色搭配要避免选择标准色,千篇一律的标准色搭配容易显得没有质感.
- 双色搭配,可以选择两个互补色,就是两个差别非常大的颜色,这样的对比会更加明显.一般会选黑色、深棕色和其它颜色做搭配.
- 三色搭配,可以选差异性比较大的颜色.颜色少的时候可以偏向于选择深色系颜色做搭配.
四色及以上
有多组数据的时候需要考虑协调和易读性.多组数据的插图建议用邻近色搭配,协调且易读,临近颜色搭配给人一种循序渐进的感觉.
邻近色用暖色或者冷色调都可以.
参考
paperplotlib
paperplotlib 是基于 matplotlib 的论文实验数据绘图库, 意在快速绘制论文实验结果部分中常见的图表
本项目意在通过简洁的 API 调用来完成论文实验数据图的快速绘制
视频介绍: 【项目分享】论文实验数据绘图
安装
pip install paperplotlib
快速开始
import paperplotlib as ppl
19 | import numpy as np
20 |
21 |
22 | a = 5
23 | b = 7
24 | y = np.random.randint(10, 100, size=(a, b))
25 |
26 |
27 | graph = ppl.BarGraph()
28 |
29 |
30 | group_names = [f"group {i}" for i in range(a)]
31 | column_names = [f"column {i}" for i in range(b)]
32 | graph.plot_2d(y, group_names, column_names)
33 |
34 |
35 | graph.x_label = "The number of data"
36 | graph.y_label = "Throughput (Mbps)"
37 |
38 |
39 | graph.save()
参考
元素上
61 | // const blockWidth = code_block.offsetWidth;
62 | // const maxScroll = code_block.scrollWidth - blockWidth;
63 | // code_block.addEventListener('wheel', (event) => horizon_wheel(event, code_block, maxScroll));
64 | // }
65 | }
66 | }
--------------------------------------------------------------------------------
/docs/js/global_js_configuration.js:
--------------------------------------------------------------------------------
1 | // 保存所有全局修改的配置
2 |
3 |
4 | // 美化选择框
5 | // - [ ] xxx
6 | // - [x] aaa
7 | var inputs = document.getElementsByTagName('input')
8 | for(var i=0;i 来加载 Giscus
17 | var giscus = document.createElement('div');
18 | giscus.setAttribute('class', 'giscus');
19 | markdown_part.appendChild(giscus);
20 |
21 | var currentUrl = window.location.href.slice(0, -1);
22 | var dirTree = document.querySelector(".dir-tree");
23 | var links = dirTree.querySelectorAll("a");
24 |
25 | // 如果保存的主题存在,则设置当前主题为保存的主题
26 | const savedTheme = localStorage.getItem('theme');
27 | if (savedTheme !== null) {
28 | if (savedTheme === 'light') {
29 | markdown_part.className = 'markdown-body markdown-light'
30 | } else {
31 | markdown_part.className = 'markdown-body markdown-dark'
32 | }
33 | }
34 | links.forEach(function(link) {
35 | if (link.href === currentUrl) {
36 | link.scrollIntoView({block: 'center', inline:'nearest', container: dirTree });
37 | if (savedTheme) {
38 | if (savedTheme == 'dark') {
39 | link.classList.add("link-active-dark");
40 | } else {
41 | link.classList.add("link-active");
42 | }
43 | } else {
44 | link.classList.add("link-active");
45 | }
46 | }
47 | });
48 |
49 | // 代码段可编辑, 可选中
50 | var code_blocks = document.getElementsByTagName('pre');
51 | for (var i = 0; i < code_blocks.length; i++) {
52 | code_blocks[i].setAttribute('contenteditable', 'true');
53 | }
54 |
55 | document.onkeydown = function (e) {
56 | // 对于左/右键被按下的情况, 切换至上一页下一页
57 | if (e.key === "ArrowLeft") {
58 | // console.log("左箭头键被按下");
59 | // 找到第一个 change-article 类的 button
60 | var button = document.querySelector(".change-article");
61 | if (button.getAttribute('url') !== '.') {
62 | window.location= button.getAttribute('url')
63 | }
64 | } else if (e.key === "ArrowRight") {
65 | // console.log("右箭头键被按下");
66 | // 找到最后一个 change-article 类的 button
67 | var button = document.querySelector(".change-article:last-child");
68 | if (button.getAttribute('url') !== '.') {
69 | window.location= button.getAttribute('url')
70 | }
71 |
72 | }
73 | }
--------------------------------------------------------------------------------
/docs/js/navigator.js:
--------------------------------------------------------------------------------
1 |
2 | const divElement = document.getElementsByClassName("header-navigator")[0]; // 获取目标div元素
3 |
4 | // 监听窗口尺寸变化
5 |
6 | function handleResize() {
7 | var screenWidth = window.innerWidth || document.documentElement.clientWidth || document.body.clientWidth;
8 |
9 | if (screenWidth > 768) {
10 |
11 | divElement.style.display = "block"; // 将display属性设置为block,以显示元素
12 |
13 | let navigator_links = document.querySelectorAll('.header-navigator ul li a[href^="#"]');
14 | navigator_links.forEach(link => {
15 | link.addEventListener('click', function (event) {
16 | event.preventDefault();
17 | let target = document.querySelector(this.getAttribute('href'));
18 | target.scrollIntoView({ behavior: 'smooth', block: 'start', inline: 'nearest' });
19 | // 修改网页 URL
20 | let url = window.location.href.split('#')[0];
21 | let newUrl = url + this.getAttribute('href');
22 | history.pushState(null, null, newUrl);
23 |
24 | });
25 | });
26 |
27 | function isScrolledIntoView(elem) {
28 | var docViewTop = window.pageYOffset;
29 | var docViewBottom = docViewTop + window.innerHeight;
30 | var elemTop = elem.offsetTop;
31 | var elemBottom = elemTop + elem.offsetHeight;
32 | return ((elemTop <= docViewBottom) && (elemBottom >= docViewTop));
33 | }
34 |
35 | var headings = document.querySelectorAll('h1, h2, h3, h4, h5, h6');
36 | var previousHeading;
37 |
38 | window.addEventListener('scroll', function () {
39 | var found = false;
40 | for (var heading of headings) {
41 | if (!found && isScrolledIntoView(heading)) {
42 | var heading_id = heading.id;
43 | var link = document.querySelector(`a[href="#${heading_id}"]`);
44 | if (link) {
45 | link.style.fontWeight = 'bold';
46 | previousHeading = heading;
47 | found = true;
48 | }
49 | } else {
50 | var heading_id = heading.id;
51 | var link = document.querySelector(`a[href="#${heading_id}"]`);
52 | if (link) {
53 | link.style.fontWeight = 'normal';
54 | }
55 | }
56 | }
57 |
58 | // If no heading is found, set the previous heading to bold
59 | if (!found && previousHeading) {
60 | var previousLink = document.querySelector(`a[href="#${previousHeading.id}"]`);
61 | if (previousLink) {
62 | previousLink.style.fontWeight = 'bold';
63 | }
64 | }
65 | });
66 | } else {
67 | // 删除导航栏
68 | divElement.style.display = "none";
69 | }
70 | }
71 |
72 | handleResize()
73 |
74 | window.addEventListener('resize', handleResize)
--------------------------------------------------------------------------------
/docs/js/next_front.js:
--------------------------------------------------------------------------------
1 |
2 | function addButton(x,text,url) {
3 |
4 | var button = document.createElement('button');
5 | button.innerText = text;
6 | button.setAttribute('url',url)
7 | button.className = 'change-article';
8 | button.onclick = function () {
9 | // 如果在原地, 不跳转
10 | if (this.getAttribute('url') === '.') {
11 | return;
12 | }
13 | window.location= this.getAttribute('url')
14 | }
15 | x.appendChild(button)
16 | }
17 |
18 | function addLink(front_url,next_url,control) {
19 |
20 | let body = document.body;
21 | var next_front = document.createElement('div')
22 | next_front.className = 'next-front'
23 |
24 | // a: 只激活前一个
25 | // b: 只激活后一个
26 | // ab: 全部激活
27 | // x: 全部不激活
28 | if (control == 'x') {
29 | return;
30 | } else if (control == 'a') {
31 | addButton(next_front,'上一个',front_url)
32 | } else if (control == 'b') {
33 | addButton(next_front,'下一个',next_url)
34 | } else {
35 | addButton(next_front,'上一个',front_url)
36 | addButton(next_front,'下一个',next_url)
37 | }
38 |
39 | body.appendChild(next_front)
40 | }
41 |
42 |
--------------------------------------------------------------------------------
/examples/bar1.py:
--------------------------------------------------------------------------------
1 | import sys
2 | import os
3 | sys.path.append(os.path.abspath(os.path.join(os.path.dirname(__file__), '..')))
4 |
5 | import paperplotlib as ppl
6 | import numpy as np
7 |
8 | # 随机生成一个 5 x 7 的数据
9 | a = 5
10 | b = 3
11 | y = np.random.randint(10, 100, size=(a, b))
12 |
13 | # 初始化一个对象
14 | graph = ppl.BarGraph()
15 |
16 | # 传入数据/组/列的文字信息
17 | group_names = [f"group {i}" for i in range(a)]
18 | column_names = [f"column {i}" for i in range(b)]
19 | graph.plot_2d(y, group_names, column_names)
20 |
21 | # 调整x/y轴文字
22 | graph.x_label = "The number of data"
23 | graph.y_label = "Throughput (Mbps)"
24 |
25 | # 保存图片
26 | graph.save("bar1.png")
--------------------------------------------------------------------------------
/examples/bar2.py:
--------------------------------------------------------------------------------
1 | import sys
2 | import os
3 | sys.path.append(os.path.abspath(os.path.join(os.path.dirname(__file__), '..')))
4 |
5 | import paperplotlib as ppl
6 |
7 | x = [2, 4, 8, 16, 32]
8 | y = [2, 4, 8, 16, 32]
9 | graph = ppl.BarGraph()
10 | graph.plot(x, y)
11 | graph.save('bar2.png')
--------------------------------------------------------------------------------
/examples/line_1.py:
--------------------------------------------------------------------------------
1 |
2 | # 将上级目录加入环境变量
3 | import sys
4 | import os
5 | sys.path.append(os.path.abspath(os.path.join(os.path.dirname(__file__), '..')))
6 |
7 | import paperplotlib as ppl
8 | import numpy as np
9 |
10 | # 100个数据
11 | y = np.random.randint(10, 100, size=(100,))
12 | x = range(100)
13 |
14 | graph = ppl.LineGraph()
15 | graph.plot(x,y)
16 |
17 | graph.x_label = "The number of data"
18 | graph.y_label = "Throughput (Mbps)"
19 | # graph.disable_x_ticks = True
20 | # graph.disable_points = True
21 | graph.save("line_1.png")
--------------------------------------------------------------------------------
/examples/line_2.py:
--------------------------------------------------------------------------------
1 | # 将上级目录加入环境变量
2 | import sys
3 | import os
4 |
5 | sys.path.append(os.path.abspath(os.path.join(os.path.dirname(__file__), "..")))
6 |
7 | import paperplotlib as ppl
8 | import numpy as np
9 |
10 | a = 3
11 | b = 50
12 | x = [i for i in range(b)]
13 | y = np.random.randint(10, 100, size=(a, b))
14 |
15 |
16 | line_names = ["line 1", "line 2", "line 3", "line 4", "line 5"]
17 |
18 | graph = ppl.LineGraph()
19 | graph.plot_2d(x, y, line_names)
20 |
21 | graph.x_label = "The number of data"
22 | graph.y_label = "Throughput (Mbps)"
23 | # graph.disable_x_ticks = True
24 | # graph.disable_points = True
25 | graph.title = "Line 2"
26 | graph.save("line_2.png")
27 |
--------------------------------------------------------------------------------
/examples/stackbar_graph.py:
--------------------------------------------------------------------------------
1 | import sys
2 | import os
3 |
4 | sys.path.append(os.path.abspath(os.path.join(os.path.dirname(__file__), "..")))
5 |
6 |
7 | import paperplotlib as ppl
8 | import unittest
9 | import numpy as np
10 |
11 |
12 | import paperplotlib as ppl
13 |
14 | # 创建一个堆叠条形图
15 | stackbar_graph = ppl.StackBarGraph()
16 |
17 | # 设置数据
18 | labels = [
19 | "alloc_migration_target",
20 | "try_to_migrate",
21 | "move_to_new_folio",
22 | "folio_add_lru" "remove_migration_ptes",
23 | "migrate_folio_done",
24 | ]
25 |
26 | # move_to_new_folio(30.311% 545/1798)
27 | # try_to_migrate(19.188% 345/1798)
28 | # migrate_folio_done(8.732% 157/1798)
29 | # alloc_migration_target(8.676% 156/1798)
30 | # remove_migration_ptes(8.287% 149/1798)
31 | # folio_add_lru(6.897% 124/1798)
32 |
33 | # 百分比数据(按图片中的顺序)
34 | percentages = [8.676, 19.188, 30.311, 6.897, 8.287, 8.732]
35 |
36 | # 绘制堆叠条形图
37 | stackbar_graph.direction = "horizontal"
38 | stackbar_graph.thinkness = 0.2
39 | stackbar_graph.plot(percentages, labels, name="migrate_page_batch")
40 | stackbar_graph.adjust_legend(alignment=3, font_size=20)
41 | # 保存图像
42 | stackbar_graph.save("stackbar_graph.png")
43 |
--------------------------------------------------------------------------------
/images/paper/1.png:
--------------------------------------------------------------------------------
https://raw.githubusercontent.com/luzhixing12345/paperplotlib/15338a52e915dd37bf37ab821d760b0412cdc564/images/paper/1.png
--------------------------------------------------------------------------------
/images/paper/10.png:
--------------------------------------------------------------------------------
https://raw.githubusercontent.com/luzhixing12345/paperplotlib/15338a52e915dd37bf37ab821d760b0412cdc564/images/paper/10.png
--------------------------------------------------------------------------------
/images/paper/11.png:
--------------------------------------------------------------------------------
https://raw.githubusercontent.com/luzhixing12345/paperplotlib/15338a52e915dd37bf37ab821d760b0412cdc564/images/paper/11.png
--------------------------------------------------------------------------------
/images/paper/12.png:
--------------------------------------------------------------------------------
https://raw.githubusercontent.com/luzhixing12345/paperplotlib/15338a52e915dd37bf37ab821d760b0412cdc564/images/paper/12.png
--------------------------------------------------------------------------------
/images/paper/13.png:
--------------------------------------------------------------------------------
https://raw.githubusercontent.com/luzhixing12345/paperplotlib/15338a52e915dd37bf37ab821d760b0412cdc564/images/paper/13.png
--------------------------------------------------------------------------------
/images/paper/14.png:
--------------------------------------------------------------------------------
https://raw.githubusercontent.com/luzhixing12345/paperplotlib/15338a52e915dd37bf37ab821d760b0412cdc564/images/paper/14.png
--------------------------------------------------------------------------------
/images/paper/15.png:
--------------------------------------------------------------------------------
https://raw.githubusercontent.com/luzhixing12345/paperplotlib/15338a52e915dd37bf37ab821d760b0412cdc564/images/paper/15.png
--------------------------------------------------------------------------------
/images/paper/16.png:
--------------------------------------------------------------------------------
https://raw.githubusercontent.com/luzhixing12345/paperplotlib/15338a52e915dd37bf37ab821d760b0412cdc564/images/paper/16.png
--------------------------------------------------------------------------------
/images/paper/17.png:
--------------------------------------------------------------------------------
https://raw.githubusercontent.com/luzhixing12345/paperplotlib/15338a52e915dd37bf37ab821d760b0412cdc564/images/paper/17.png
--------------------------------------------------------------------------------
/images/paper/18.png:
--------------------------------------------------------------------------------
https://raw.githubusercontent.com/luzhixing12345/paperplotlib/15338a52e915dd37bf37ab821d760b0412cdc564/images/paper/18.png
--------------------------------------------------------------------------------
/images/paper/19.png:
--------------------------------------------------------------------------------
https://raw.githubusercontent.com/luzhixing12345/paperplotlib/15338a52e915dd37bf37ab821d760b0412cdc564/images/paper/19.png
--------------------------------------------------------------------------------
/images/paper/2.png:
--------------------------------------------------------------------------------
https://raw.githubusercontent.com/luzhixing12345/paperplotlib/15338a52e915dd37bf37ab821d760b0412cdc564/images/paper/2.png
--------------------------------------------------------------------------------
/images/paper/20.png:
--------------------------------------------------------------------------------
https://raw.githubusercontent.com/luzhixing12345/paperplotlib/15338a52e915dd37bf37ab821d760b0412cdc564/images/paper/20.png
--------------------------------------------------------------------------------
/images/paper/21.png:
--------------------------------------------------------------------------------
https://raw.githubusercontent.com/luzhixing12345/paperplotlib/15338a52e915dd37bf37ab821d760b0412cdc564/images/paper/21.png
--------------------------------------------------------------------------------
/images/paper/3.png:
--------------------------------------------------------------------------------
https://raw.githubusercontent.com/luzhixing12345/paperplotlib/15338a52e915dd37bf37ab821d760b0412cdc564/images/paper/3.png
--------------------------------------------------------------------------------
/images/paper/4.png:
--------------------------------------------------------------------------------
https://raw.githubusercontent.com/luzhixing12345/paperplotlib/15338a52e915dd37bf37ab821d760b0412cdc564/images/paper/4.png
--------------------------------------------------------------------------------
/images/paper/6.png:
--------------------------------------------------------------------------------
https://raw.githubusercontent.com/luzhixing12345/paperplotlib/15338a52e915dd37bf37ab821d760b0412cdc564/images/paper/6.png
--------------------------------------------------------------------------------
/images/paper/7.png:
--------------------------------------------------------------------------------
https://raw.githubusercontent.com/luzhixing12345/paperplotlib/15338a52e915dd37bf37ab821d760b0412cdc564/images/paper/7.png
--------------------------------------------------------------------------------
/images/paper/8.png:
--------------------------------------------------------------------------------
https://raw.githubusercontent.com/luzhixing12345/paperplotlib/15338a52e915dd37bf37ab821d760b0412cdc564/images/paper/8.png
--------------------------------------------------------------------------------
/images/paper/9.png:
--------------------------------------------------------------------------------
https://raw.githubusercontent.com/luzhixing12345/paperplotlib/15338a52e915dd37bf37ab821d760b0412cdc564/images/paper/9.png
--------------------------------------------------------------------------------
/images/paperplotlib/1.png:
--------------------------------------------------------------------------------
https://raw.githubusercontent.com/luzhixing12345/paperplotlib/15338a52e915dd37bf37ab821d760b0412cdc564/images/paperplotlib/1.png
--------------------------------------------------------------------------------
/images/paperplotlib/2.png:
--------------------------------------------------------------------------------
https://raw.githubusercontent.com/luzhixing12345/paperplotlib/15338a52e915dd37bf37ab821d760b0412cdc564/images/paperplotlib/2.png
--------------------------------------------------------------------------------
/images/paperplotlib/3.png:
--------------------------------------------------------------------------------
https://raw.githubusercontent.com/luzhixing12345/paperplotlib/15338a52e915dd37bf37ab821d760b0412cdc564/images/paperplotlib/3.png
--------------------------------------------------------------------------------
/images/paperplotlib/4.png:
--------------------------------------------------------------------------------
https://raw.githubusercontent.com/luzhixing12345/paperplotlib/15338a52e915dd37bf37ab821d760b0412cdc564/images/paperplotlib/4.png
--------------------------------------------------------------------------------
/images/paperplotlib/5.png:
--------------------------------------------------------------------------------
https://raw.githubusercontent.com/luzhixing12345/paperplotlib/15338a52e915dd37bf37ab821d760b0412cdc564/images/paperplotlib/5.png
--------------------------------------------------------------------------------
/images/paperplotlib/6.png:
--------------------------------------------------------------------------------
https://raw.githubusercontent.com/luzhixing12345/paperplotlib/15338a52e915dd37bf37ab821d760b0412cdc564/images/paperplotlib/6.png
--------------------------------------------------------------------------------
/images/paperplotlib/7.png:
--------------------------------------------------------------------------------
https://raw.githubusercontent.com/luzhixing12345/paperplotlib/15338a52e915dd37bf37ab821d760b0412cdc564/images/paperplotlib/7.png
--------------------------------------------------------------------------------
/images/paperplotlib/8.png:
--------------------------------------------------------------------------------
https://raw.githubusercontent.com/luzhixing12345/paperplotlib/15338a52e915dd37bf37ab821d760b0412cdc564/images/paperplotlib/8.png
--------------------------------------------------------------------------------
/images/paperplotlib/result.png:
--------------------------------------------------------------------------------
https://raw.githubusercontent.com/luzhixing12345/paperplotlib/15338a52e915dd37bf37ab821d760b0412cdc564/images/paperplotlib/result.png
--------------------------------------------------------------------------------
/md-docs/README.md:
--------------------------------------------------------------------------------
1 | # paperplotlib
2 |
3 | paperplotlib 是基于 matplotlib 的论文实验数据绘图库, 意在快速绘制论文实验结果部分中常见的图表
4 |
5 | 本项目意在通过简洁的 API 调用来完成论文实验数据图的快速绘制
6 |
7 | 视频介绍: [【项目分享】论文实验数据绘图](https://www.bilibili.com/video/BV1Qx421m7hx/)
8 |
9 | ## 安装
10 |
11 | ```bash
12 | pip install paperplotlib
13 | ```
14 |
15 | ## 快速开始
16 |
17 | ```python
18 | import paperplotlib as ppl
19 | import numpy as np
20 |
21 | # 随机生成一个 5 x 7 的数据
22 | a = 5
23 | b = 7
24 | y = np.random.randint(10, 100, size=(a, b))
25 |
26 | # 初始化一个对象
27 | graph = ppl.BarGraph()
28 |
29 | # 传入数据/组/列的文字信息
30 | group_names = [f"group {i}" for i in range(a)]
31 | column_names = [f"column {i}" for i in range(b)]
32 | graph.plot_2d(y, group_names, column_names)
33 |
34 | # 调整x/y轴文字
35 | graph.x_label = "The number of data"
36 | graph.y_label = "Throughput (Mbps)"
37 |
38 | # 保存图片
39 | graph.save()
40 | ```
41 |
42 | 
43 |
44 | ## 参考
45 |
46 | - [matplotlib](https://matplotlib.org/stable/users/index.html)
47 | - [matplotlib.pyplot的使用总结大全](https://www.zhihu.com/tardis/zm/art/139052035?source_id=1003)
48 | - [matplotlib.pyplot常用函数讲解大全(一)](https://zhuanlan.zhihu.com/p/139475633)
49 | - [matplotlib.pyplot常用函数讲解大全(二)](https://zhuanlan.zhihu.com/p/139946399)
50 | - [Presentation练习_科研论文中插图的配色原理与方案](https://www.bilibili.com/video/BV1cJ4m1j7No/)
--------------------------------------------------------------------------------
/md-docs/dir.yml:
--------------------------------------------------------------------------------
1 | .:
2 | - README: 1
3 | - 使用方法: 2
4 | - 使用示例: 3
5 | - 配色选择: 4
6 | graph:
7 | - 柱状图: 1
8 | - 折线图: 2
9 |
--------------------------------------------------------------------------------
/md-docs/graph/折线图.md:
--------------------------------------------------------------------------------
1 |
2 | # 折线图
3 |
--------------------------------------------------------------------------------
/md-docs/graph/柱状图.md:
--------------------------------------------------------------------------------
1 |
2 | # 柱状图
3 |
--------------------------------------------------------------------------------
/md-docs/使用方法.md:
--------------------------------------------------------------------------------
1 |
2 | # 使用方法
3 |
4 | 使用 paperplotlib(下称ppl) 只需要四步
5 |
6 | 1. 初始化一个实例对象 `graph`
7 | 2. 准备好你的数据, 将数据添加到 `graph` 中
8 | 3. 根据需要适当修改属性
9 | 4. 保存图片
10 |
11 | ppl 为您简化了初始化, 基础配置, 配色, 数据位置等一些小细节, 您可以非常简单方便的绘制一张美观的数据图
12 |
13 | ## 总体介绍
14 |
15 | ppl 提供了多数据图表的绘图
16 |
17 | - 柱状图 (BarGraph)
18 | - 折线图 (LineGraph)
19 |
20 | 绘图 api 的使用方式非常类似, 分别对应四步
21 |
22 | ```python
23 | import paperplotlib as ppl
24 |
25 | # 1. 初始化一个实例对象
26 | graph = ppl.BarGraph()
27 |
28 | # 2. 准备好你的数据, 将数据添加到 `graph` 中
29 | x = [2, 4, 8, 16, 32]
30 | y = [2, 4, 8, 16, 32]
31 | graph.plot(x, y)
32 |
33 | # 3. 根据需要适当修改属性
34 | graph.x_label = "The number of data"
35 | graph.y_label = "Throughput (Mbps)"
36 |
37 | # 4. 保存图片
38 | graph.save()
39 | ```
40 |
41 | 两个类均只有**两个传入数据的接口**: `plot` `plot_2d`
42 |
43 | `plot` 用于绘制简单的一维数据, 如下所示, 传入 x,y 坐标即可
44 |
45 |
46 | 
47 |
48 | `plot_2d` 通常来说更为常用, 常见于论文 benchmark/workload 的数据结果中
49 |
50 | `plot_2d` 的函数原型如下, 共有四个参数
51 |
52 | ```python
53 | def plot_2d(
54 | self,
55 | data: List[List[float]],
56 | group_names: List[str],
57 | column_names: List[str],
58 | emphasize_index: int = -1
59 | ):
60 | ...
61 | ```
62 |
63 | - **data**: 一个二维数组, 第一维代表有几组, 第二维代表有几列
64 | - **group_names**: 每个组的名称
65 | - **column_names**: 每一列的名称
66 | - **emphasize_index**: 高亮的列索引(可选)
67 |
68 | 一个简单易懂的示例如下:
69 |
70 | ```python
71 | import paperplotlib as ppl
72 | import numpy as np
73 |
74 | # 随机生成一个 5 x 7 的数据
75 | a = 5
76 | b = 7
77 | y = np.random.randint(10, 100, size=(a, b))
78 |
79 | # 初始化一个对象
80 | graph = ppl.BarGraph()
81 |
82 | # 传入数据/组/列的文字信息
83 | group_names = [f"group {i}" for i in range(a)]
84 | column_names = [f"column {i}" for i in range(b)]
85 | graph.plot_2d(y, group_names, column_names)
86 |
87 | # 调整x/y轴文字
88 | graph.x_label = "The number of data"
89 | graph.y_label = "Throughput (Mbps)"
90 |
91 | # 保存图片
92 | graph.save()
93 | ```
94 |
95 | 
96 |
97 | 其中 `emphasize_index` 参数用于高亮某一列, 可以传入列的索引值
98 |
99 | > 这通常应用在某一列是新的方法, 其他的是对比方法, 此时其他列将会选择相近的颜色而突出该列
100 |
101 | 
102 |
103 | ## 配色
104 |
105 | ppl 的配色采用偏冷色调的蓝色, **且是不建议调整的**, 对于 1-7 列均可以采用统一的风格绘制
106 |
107 | 
108 |
109 | 
110 |
111 | 对于超过 7 种配色的情况, 采用渐变色处理
112 |
113 | 
114 |
115 | ## 其他配置
116 |
117 | 初始化阶段可以传入一个参数来决定配色
118 |
119 | ```python
120 | style_id = 3
121 | graph = ppl.BarGraph(style_id)
122 | ```
123 |
124 | > 下图顺次对应 1 - 5
125 |
126 | 
127 |
128 | ### 长图
129 |
130 | 对于有大量数据集结果的情况, 您可以将 `width_picture` 设置为 `True`, 即可生成一张长图, 可以横跨两栏放置, 类似如下的位置
131 |
132 | 
133 |
134 | ```python
135 | graph.width_picture = True
136 | ```
137 |
138 | ### x y 坐标
139 |
140 | 直接设置字符串即可
141 |
142 | ```python
143 | graph.x_label = "Workload"
144 | graph.y_label = "Max QPS\nNormalized DDR 100%"
145 | ```
146 |
147 | ### 画一条横线
148 |
149 | ```python
150 | graph.add_line(50)
151 | ```
152 |
153 | ### y 轴范围
154 |
155 | 传入一个元组类型设置范围
156 |
157 | ```python
158 | graph.y_lim = (0, 1.2)
159 | ```
--------------------------------------------------------------------------------
/md-docs/使用示例.md:
--------------------------------------------------------------------------------
1 |
2 | # 使用示例
3 |
4 | ```python
5 | import paperplotlib as ppl
6 | import numpy as np
7 |
8 | # 设定数组的行数a和列数b
9 | a = 6
10 | b = 4
11 | y = np.random.randint(10, 100, size=(a, b))
12 |
13 | group_names = ["Canneal", "Memcached", "XSBench", "Graph500", "HashJoin", "BTree"]
14 | column_names = [f"socket {i}" for i in range(b)]
15 |
16 | graph = ppl.BarGraph()
17 | graph.plot_2d(y, group_names, column_names)
18 | graph.y_lim = (0, 100)
19 | graph.save()
20 | ```
21 |
22 | 
23 | 
24 |
25 | ```python
26 | import paperplotlib as ppl
27 | import numpy as np
28 |
29 | # 设定数组的行数a和列数b
30 | a = 5
31 | b = 5
32 | y = np.random.rand(a,b)
33 |
34 | group_names = ["A", "B", "C", "D", "F"]
35 | column_names = ["DDR5:CXL-A = 100:0", "75:25", "50:50", "25:75", "0:100"]
36 |
37 | graph = ppl.BarGraph()
38 | graph.plot_2d(y, group_names, column_names)
39 | graph.x_label = "Workload"
40 | graph.y_label = "Max QPS\nNormalized DDR 100%"
41 | graph.y_lim = (0, 1.2)
42 | graph.save()
43 | ```
44 |
45 | 
46 | 
47 |
48 | 让某一列突出
49 |
50 | ```diff
51 | import paperplotlib as ppl
52 | import numpy as np
53 |
54 | # 设定数组的行数a和列数b
55 | a = 5
56 | b = 5
57 | y = np.random.rand(a,b)
58 |
59 | group_names = ["A", "B", "C", "D", "F"]
60 | column_names = ["DDR5:CXL-A = 100:0", "75:25", "50:50", "25:75", "0:100"]
61 |
62 | graph = ppl.BarGraph()
63 | - graph.plot_2d(y, group_names, column_names)
64 | + graph.plot_2d(y, group_names, column_names, emphasize_index=0)
65 | graph.x_label = "Workload"
66 | graph.y_label = "Max QPS\nNormalized DDR 100%"
67 | graph.y_lim = (0, 1.2)
68 | graph.save()
69 | ```
70 |
71 | 
72 |
73 |
74 | 宽图, 适用于多组数据, 双栏
75 |
76 | ```python
77 | import paperplotlib as ppl
78 | import numpy as np
79 |
80 | # 设定数组的行数a和列数b
81 | a = 8
82 | b = 6
83 | y = np.random.randint(10, 100, size=(a, b))
84 |
85 | group_names = [f"group {i}" for i in range(a)]
86 | column_names = [f"column {i}" for i in range(b)]
87 |
88 | graph = ppl.BarGraph()
89 | graph.plot_2d(y, group_names, column_names)
90 | graph.x_label = "The number of data"
91 | graph.y_label = "Throughput (Mbps)"
92 | graph.width_picture = True
93 | graph.save()
94 | ```
95 |
96 | 
97 |
--------------------------------------------------------------------------------
/md-docs/配色选择.md:
--------------------------------------------------------------------------------
1 |
2 | # 配色选择
3 |
4 | 
5 |
6 | ## 单色
7 |
8 | 虽然现在我们选用单色作图的情况并不是很多,因为大多数情况要进行数据比较.如果需要使用单色的情况,建议使用上述的**蓝色**,要比黑色或者灰色更加活泼.
9 |
10 | ## 双色、三色
11 |
12 | - 双色、三色搭配要避免选择标准色,千篇一律的标准色搭配容易显得没有质感.
13 | - 双色搭配,可以选择两个互补色,就是两个差别非常大的颜色,这样的对比会更加明显.一般会选黑色、深棕色和其它颜色做搭配.
14 | - 三色搭配,可以选差异性比较大的颜色.颜色少的时候可以偏向于选择深色系颜色做搭配.
15 |
16 | ## 四色及以上
17 |
18 | 有多组数据的时候需要考虑协调和易读性.多组数据的插图建议用邻近色搭配,协调且易读,临近颜色搭配给人一种循序渐进的感觉.
19 |
20 | 邻近色用暖色或者冷色调都可以.
21 |
22 | ## 参考
23 |
24 | - [审稿人爱的配色这里都有](https://zhuanlan.zhihu.com/p/674796591)
25 | - [跟顶刊学图片配色,1分钟完成一套审稿人最爱的配色方案!](https://zhuanlan.zhihu.com/p/636789620)
26 | - [MATLAB | MATLAB配色不够用?全网最全的colormap补充包来啦!](https://zhuanlan.zhihu.com/p/580945672)
27 | - [分享 | 顶刊高质量论文插图配色(含RGB值及16进制HEX码)(第一期)](https://zhuanlan.zhihu.com/p/670396774)
28 | - [分享 | 顶刊高质量论文插图配色(含RGB值及16进制HEX码)(第二期)](https://zhuanlan.zhihu.com/p/674906660)
29 | - [调色板界的"扛把子"--palettable](https://zhuanlan.zhihu.com/p/374631766)
30 | - [Python数据分析之Seaborn(配色方案)](https://cloud.tencent.com/developer/article/1670419)
31 | - [跟顶刊学配色!SCI论文插图经典配色实例第1期](https://zhuanlan.zhihu.com/p/593320758)
32 | - [coolors trending](https://coolors.co/palettes/trending)
33 | - [eagle cn best-color-tools-for-designers](https://cn.eagle.cool/blog/post/best-color-tools-for-designers)
--------------------------------------------------------------------------------
/paperplotlib/__init__.py:
--------------------------------------------------------------------------------
1 |
2 | from .line_graph import LineGraph
3 | from .bar_graph import BarGraph
4 | from .stackbar_graph import StackBarGraph
5 | from .color import *
--------------------------------------------------------------------------------
/paperplotlib/bar_graph.py:
--------------------------------------------------------------------------------
1 | from typing import List, Union
2 | from .graph import Graph
3 | from .color import COLOR
4 | import numpy as np
5 |
6 |
7 | class BarGraph(Graph):
8 | def __init__(self, style_id: int = 1) -> None:
9 | super().__init__(style_id=style_id)
10 |
11 | self._bar_width = 0.3 # 柱状图宽度 [0-1] (default 0.8)
12 | self._group_threshold = 0.15 # 组间距
13 |
14 | def plot(self, x_data: List[Union[str, int]], y_data: List[float]):
15 | """
16 | 绘制一维柱状图
17 |
18 | ## Parameters
19 | x_data: x 轴数据
20 | y_data: y 轴数据
21 | """
22 | # x 轴坐标等距
23 | x_ticks = range(len(x_data))
24 | self.ax.bar(x_ticks, y_data, width=self._bar_width, color=COLOR.get_colors(1, self.style_id))
25 | # x 轴标签和位置的映射
26 | self.ax.set_xticks(x_ticks, x_data)
27 |
28 | def plot_2d(
29 | self, data: List[List[float]], group_names: List[str], column_names: List[str], emphasize_index: int = -1
30 | ):
31 | """
32 | 绘制二维柱状图
33 |
34 | data: 二维列表,每个元素为一组数据
35 | group_names: 每个组的名称
36 | column_names: 每一列的名称
37 | emphasize_index: 高亮的列索引
38 | """
39 | assert np.shape(data) == (len(group_names), len(column_names)), "二维数据应为二维列表"
40 |
41 | group_len = len(group_names)
42 | column_len = len(column_names)
43 |
44 | if emphasize_index != -1:
45 | assert (
46 | type(emphasize_index) == int and emphasize_index < len(column_names) and emphasize_index >= 0
47 | ), f"emphasize_index应在[0, {len(column_names)})之间"
48 |
49 | # 如果列数很多, 考虑到组间距, 所以重新计算一下柱状图宽度
50 | if column_len >= 3:
51 | self._bar_width = (0.5 - self._group_threshold) / column_len * 2
52 |
53 | colors = COLOR.get_colors(column_len, self.style_id, emphasize_index)
54 | for i in range(column_len):
55 | bar_pos = -column_len + 2 * i + 1
56 | x_ticks = [j + bar_pos / 2 * self._bar_width for j in range(group_len)]
57 | bar_data = [data[j][i] for j in range(group_len)]
58 | self._bars = self.ax.bar(
59 | x_ticks, bar_data, width=self._bar_width, color=colors[i], edgecolor="black", linewidth=0.5
60 | )
61 | self.ax.set_xticks(range(group_len), group_names)
62 | self.ax.tick_params(bottom=False)
63 |
64 | self.set_label_legend(column_names)
65 |
66 | def add_line(self, y: int, line_style="-"):
67 | self.ax.axhline(y, linestyle=line_style, linewidth=0.5, color="black")
68 |
--------------------------------------------------------------------------------
/paperplotlib/color.css:
--------------------------------------------------------------------------------
1 | .cold {
2 | color: #acbcdb #012790;
3 | }
4 |
5 | /* Demystifying CXL Memory with Genuine CXL-Ready Systems and Devices */
6 | .style-1 {
7 | color: #0070c0;
8 | color: #ffc000 #0070c0;
9 | color: #ffc000 #4472c4 #63c0cf;
10 | color: #ffc000 #ed7d31 #0070c0 #63c0cf;
11 | color: #ffc000 #ed7d31 #5b9bd5 #4bbabd #358d8f;
12 | color: #ffc000 #ed7d31 #5b9bd5 #0070c0 #4bbabd #358d8f;
13 | color: #ffc000 #ed7d31 #2f5597 #5b9bd5 #0070c0 #4bbabd #358d8f;
14 | }
15 |
16 | .style-2 {
17 | color: #0e3e8b #fbe57c;
18 | color: #0e3e8b #366bae #fbe57c;
19 | color: #0e3e8b #366bae #e2eaef #fbe57c;
20 | color: #0e3e8b #366bae #e2eaef #fbe57c #ddb33d;
21 | }
22 |
23 | .style-3 {
24 | color: #5c8fc6 #8dc2e9 #d6a370 #794d35 ;
25 | color: #0f2b61 #5c8fc6 #8dc2e9 #d6a370 #794d35;
26 | color: #0f2b61 #5c8fc6 #8dc2e9 #d7af88 #d6a370 #794d35;
27 | }
28 |
29 | .style-4 {
30 | color: #3851a3 #72aacc #fdba6c #eb5d3b;
31 | color: #3851a3 #72aacc #fdba6c #eb5d3b #a90226;
32 | color: #3851a3 #72aacc #fefbba #fdba6c #eb5d3b #a90226 ;
33 | color: #3851a3 #72aacc #cae9f3 #fefbba #fdba6c #eb5d3b #a90226;
34 | }
35 |
36 | .style-5 {
37 | color: #405095 #59b5e8 #d9d3e8 #fbf9ce;
38 | color: #405095 #3e8fbf #59b5e8 #d9d3e8 #fbf9ce;
39 | color: #405095 #3e8fbf #59b5e8 #a6c0e5 #d9d3e8 #fbf9ce;
40 | color: #405095 #3e8fbf #59b5e8 #a6c0e5 #d9d3e8 #fbf9ce #faf6a3;
41 | }
42 |
43 | .style-6 {
44 | color: #205898 #5c9bcf #c9cedb #dcdbc7;
45 | color: #205898 #5c9bcf #cee3f0 #c9cedb #dcdbc7;
46 | color: #205898 #5c9bcf #cee3f0 #c9cedb #dcdbc7 #d8d59c;
47 | }
48 |
49 | /* Harnessing Integrated CPU-GPU System Memory for HPC: a first look into Grace Hopper */
50 | .style-7 {
51 | color: #4184f3;
52 | color: #4184f3 #e94234;
53 | color: #4184f3 #e94234 #fabb03;
54 | color: #4184f3 #e94234 #fabb03 #33a852;
55 | color: #4184f3 #e94234 #fabb03 #33a852 #46bdc5;
56 | }
--------------------------------------------------------------------------------
/paperplotlib/color.py:
--------------------------------------------------------------------------------
1 | import re
2 | import os
3 | import numpy as np
4 | import matplotlib.colors as mcolors
5 | from typing import List, Dict
6 |
7 |
8 | class Color:
9 |
10 | def __init__(self) -> None:
11 | self.colors: Dict[str, Dict[int, List[str]]] = {}
12 |
13 | def add(self, name: str, hex_groups: List[List[str]]):
14 | self.colors[name] = {}
15 | for hex_group in hex_groups:
16 | self.colors[name][len(hex_group)] = hex_group
17 |
18 | def get_colors(self, color_num: int, style_id: int = 1, emphasize_index: int = -1) -> List[str]:
19 | if emphasize_index != -1:
20 | return self.get_emphasize(emphasize_index, color_num)
21 | # 对于更多颜色的情况, 采用渐变
22 | style_name = f"style-{style_id}"
23 | assert style_name in self.colors, f"{style_name} 不存在, 有效的样式为 {list(self.colors.keys())}"
24 |
25 | colors = self.colors[style_name].get(color_num)
26 | # 如果没有该数量的颜色, 采用渐变
27 | if colors is None:
28 | colors = generate_color_gradient(self.colors["cold"][2][0], self.colors["cold"][2][1], color_num)
29 | return colors
30 |
31 | def get_emphasize(self, index, color_num: int) -> List[str]:
32 | emphasized_color = "#ffc000"
33 | colors = generate_color_gradient(self.colors["cold"][2][0], self.colors["cold"][2][1], color_num)
34 | colors.insert(index, emphasized_color)
35 | return colors
36 |
37 |
38 | def parse_colors() -> Color:
39 | """
40 | 从 color.css 中解析颜色
41 | """
42 | with open(os.path.join(os.path.dirname(__file__), "color.css")) as f:
43 | content = f.read()
44 |
45 | plot_color = Color()
46 | css_classes = re.finditer(r"\.(.*?) \{(.*?)\}", content, re.DOTALL)
47 | for css_class in css_classes:
48 | color_name = css_class.group(1).strip()
49 | color_values = css_class.group(2).split("\n")
50 | hex_groups: List[List[str]] = []
51 | for color_value in color_values:
52 | if len(color_value) == 0:
53 | continue
54 | hex_values = re.findall(r"#[0-9a-fA-F]{6}", color_value)
55 | hex_groups.append(hex_values)
56 | plot_color.add(color_name, hex_groups)
57 |
58 | return plot_color
59 |
60 |
61 | def hex_to_rgb(hex_color):
62 | # 将十六进制颜色代码转换为RGB元组
63 | return mcolors.hex2color(hex_color)
64 |
65 |
66 | def rgb_to_hex(rgb_color):
67 | # 将RGB元组转换为十六进制颜色代码
68 | return mcolors.rgb2hex(rgb_color)
69 |
70 |
71 | def generate_color_gradient(hex_color1, hex_color2, num_colors):
72 | # 将十六进制颜色代码转换为RGB元组
73 | color1 = hex_to_rgb(hex_color1)
74 | color2 = hex_to_rgb(hex_color2)
75 |
76 | # 生成颜色渐变
77 | r = np.linspace(color1[0], color2[0], num_colors)
78 | g = np.linspace(color1[1], color2[1], num_colors)
79 | b = np.linspace(color1[2], color2[2], num_colors)
80 |
81 | gradient_colors = [rgb_to_hex((r[i], g[i], b[i])) for i in range(num_colors)]
82 | return gradient_colors
83 |
84 | COLOR = parse_colors()
85 |
--------------------------------------------------------------------------------
/paperplotlib/font/consola-1.ttf:
--------------------------------------------------------------------------------
https://raw.githubusercontent.com/luzhixing12345/paperplotlib/15338a52e915dd37bf37ab821d760b0412cdc564/paperplotlib/font/consola-1.ttf
--------------------------------------------------------------------------------
/paperplotlib/graph.py:
--------------------------------------------------------------------------------
1 | import matplotlib
2 |
3 | # 非交互式 GUI 使用 Agg
4 | matplotlib.use("Agg")
5 | import matplotlib.pyplot as plt
6 | import os
7 | from typing import List, Optional, Union, Tuple
8 | from matplotlib.font_manager import FontProperties
9 | import matplotlib.font_manager as fm
10 |
11 |
12 | class Graph:
13 | """
14 | 图表
15 | """
16 | def __init__(self, style_id: int = 1, subplots: Tuple[int, int] = None) -> None:
17 | self.style_id = style_id
18 | self.subplots = subplots
19 |
20 | if subplots is not None:
21 | self.fig, self.ax = plt.subplots(subplots[0], subplots[1])
22 | else:
23 | self.fig = plt.figure(figsize=(8, 4))
24 | self.ax = self.fig.add_subplot(111)
25 |
26 | # -- configuation --
27 | self.x_label: Optional[str] = None # x轴标签
28 | self.y_label: Optional[str] = None # y轴标签
29 | self.width_picture = False # 是否是宽图
30 | self.grid = "y" # 网格线 x | y | xy | None
31 | self.y_lim: Optional[Tuple[float, float]] = None
32 |
33 | # 基本属性
34 | self.grid_color = "#dedede" # 网格线颜色
35 | self.grid_style = "-" # 网格线类型 - | --
36 | self.grid_width = 1 # 网格线宽度
37 | self.grid_alpha = 0.8 # 网格线透明度
38 |
39 | # 保存图片
40 | self.dpi = 300
41 | self.bbox_inches = "tight" # 适当上下左右留白
42 |
43 | self.title: Optional[str] = None # 图表标题
44 |
45 | font_path = f"{os.path.dirname(__file__)}/font/consola-1.ttf"
46 | fm.fontManager.addfont(font_path)
47 | plt.rcParams["font.family"] = "Consolas"
48 |
49 | # legend
50 | self.legend_labels = None
51 | self.legend_loc = None
52 | self.legend_bbox_to_anchor = None
53 | self.legend_ncols = None
54 | self.legend_font_size = 'medium'
55 |
56 | def plot(self, x_data: List[float], y_data: List[float]): # pragma: no cover
57 | """
58 | 填入数据
59 | """
60 | raise NotImplementedError("请在子类中实现此方法")
61 |
62 | def plot_2d(
63 | self, y_data: List[List[float]], group_names: List[str], column_names: List[str], emphasize_index: int = -1
64 | ): # pragma: no cover
65 | """
66 | 绘制二维柱状图
67 |
68 | ## Parameters
69 | y_data: 二维列表,每个元素为一组数据
70 | group_names: 每个组的名称
71 | column_names: 每一列的名称
72 | """
73 | raise NotImplementedError("请在子类中实现此方法")
74 |
75 | def _create_graph(self): # pragma: no cover
76 | self._check_config()
77 |
78 | if self.width_picture:
79 | self.fig.set_size_inches(16, 4)
80 | self.ax.set_xlabel(self.x_label)
81 | self.ax.set_ylabel(self.y_label)
82 |
83 | if self.grid is not None:
84 | if "x" in self.grid:
85 | self.ax.xaxis.grid(
86 | True,
87 | linestyle=self.grid_style,
88 | linewidth=self.grid_width,
89 | color=self.grid_color,
90 | alpha=self.grid_alpha,
91 | )
92 | if "y" in self.grid:
93 | self.ax.yaxis.grid(
94 | True,
95 | linestyle=self.grid_style,
96 | linewidth=self.grid_width,
97 | color=self.grid_color,
98 | alpha=self.grid_alpha,
99 | )
100 | self.ax.set_axisbelow(True)
101 |
102 | if self.y_lim is not None:
103 | self.ax.set_ylim(self.y_lim)
104 |
105 | if self.title is not None:
106 | self.fig.text(0.5, -0.02, self.title, ha="center", fontsize=14, weight="bold")
107 |
108 | if self.legend_labels is not None:
109 | self.legend = self.ax.legend(
110 | self.legend_labels,
111 | loc=self.legend_loc, # 居中置顶
112 | ncols=self.legend_ncols, # 横向排布
113 | bbox_to_anchor=self.legend_bbox_to_anchor, # 置于图外侧
114 | handlelength=1, # 图例长宽, 修改为正方形
115 | handleheight=1, # 图例长宽, 修改为正方形
116 | handletextpad=0.4, # 缩短文字和图例的间距
117 | fontsize=self.legend_font_size, # 图例文字大小
118 | )
119 |
120 | def adjust_graph(self):
121 | """
122 | 子类中可以重写该函数来调整图表
123 | """
124 |
125 | def save(self, path: str = "result.png"):
126 | """
127 | 保存图片
128 | """
129 | self._create_graph()
130 | self.adjust_graph()
131 | plt.tight_layout()
132 | plt.savefig(path, dpi=self.dpi, bbox_inches=self.bbox_inches)
133 | print(f"save picture in {path}")
134 |
135 | def _check_config(self):
136 | """
137 | 检查配置的属性是否设置的合理
138 | """
139 | assert self.grid in ["x", "y", "xy", None], "grid 参数值只能是 x | y | xy | None"
140 | assert self.width_picture in [True, False], "width_picture 参数值只能是 True | False"
141 |
142 | def set_label_legend(self, column_names, position: str = "w", alignment: str = "-"):
143 | """
144 | position should be 1 or 2 of 'wasd'
145 |
146 | w/a/s/d means up/left/down/right in keyboard
147 | """
148 | self.legend_labels = column_names
149 |
150 | # https://matplotlib.org/stable/api/legend_api.html#module-matplotlib.legend
151 | self.legend_loc = "upper center"
152 | self.legend_bbox_to_anchor = (0.5, 1.15)
153 | self.legend_ncols = len(column_names)
154 |
155 | # legend position
156 |
157 | # bbox_to_anchor
158 | # x:相对于图形的水平位置(通常 0 到 1 的值,1 表示图的最右边).
159 | # y:相对于图形的垂直位置(通常 0 到 1 的值,1 表示图的顶部)
160 | if position == "w":
161 | self.legend_loc = "upper center"
162 | self.legend_bbox_to_anchor = (0.5, 1.15)
163 |
164 | elif position == "d":
165 | self.legend_loc = "upper left"
166 | self.legend_bbox_to_anchor = (1.05, 1)
167 |
168 | elif position == "wd":
169 | self.legend_loc = "upper right"
170 | self.legend_bbox_to_anchor = None
171 |
172 | # legend alignment
173 | if alignment == "-":
174 | self.legend_ncols = len(column_names)
175 | elif alignment == "|":
176 | self.legend_ncols = 1
177 | elif type(alignment) == int:
178 | self.legend_ncols = alignment
179 |
180 | def adjust_legend(self, position: str = None, alignment: str = None, bbox_to_anchor: Tuple[float, float] = None, font_size: int = None):
181 |
182 | if position:
183 | self.legend_loc(position)
184 |
185 | if alignment:
186 | if alignment == "-":
187 | self.legend_ncols = len(self.legend_labels)
188 | elif alignment == "|":
189 | self.legend_ncols = 1
190 | elif type(alignment) == int:
191 | self.legend_ncols = alignment
192 | else:
193 | raise ValueError("alignment should be int or '-' or '|'")
194 |
195 | if bbox_to_anchor:
196 | self.legend_bbox_to_anchor = bbox_to_anchor
197 |
198 | if font_size:
199 | self.legend_font_size = font_size
--------------------------------------------------------------------------------
/paperplotlib/line_graph.py:
--------------------------------------------------------------------------------
1 | from .graph import Graph
2 | from typing import List
3 | from .color import COLOR
4 | import matplotlib.ticker as ticker
5 |
6 |
7 | class LineGraph(Graph):
8 | def __init__(self) -> None:
9 | super().__init__()
10 | self.grid = "xy"
11 | # https://matplotlib.org/stable/api/markers_api.html
12 | self.all_markers = ["o", "^", "x", "s", "D", "*", "+", "v", "p", "P", "h", "H", "1", "2", "3", "4", "X"]
13 | self.disable_x_ticks = False # 是否禁用 x 轴刻度
14 | self.disable_points = False # 是否禁用点
15 | self.line_width = 1.5
16 |
17 | def adjust_graph(self):
18 |
19 | # 线条宽度
20 | for line in self.ax.get_lines():
21 | line.set_linewidth(self.line_width)
22 |
23 | if self.disable_x_ticks:
24 | self.ax.xaxis.set_major_locator(ticker.NullLocator())
25 | if self.disable_points:
26 | # 修改 marker
27 | for line in self.ax.get_lines():
28 | line.set_marker("")
29 | # 修改图例中的 marker
30 | legend = self.ax.get_legend()
31 | if legend is not None: # 检查图例是否存在
32 | for legend_line in legend.get_lines():
33 | legend_line.set_marker("")
34 |
35 | def plot(self, x_data: List[int], y_data: List[float]):
36 | """
37 | 绘制一维折线图
38 |
39 | ## Parameters
40 | x_data: x 轴数据
41 | y_data: y 轴数据
42 | """
43 | # x 轴坐标等距
44 | if x_data is None:
45 | x_data = range(len(y_data))
46 | x_ticks = range(len(x_data))
47 | self.ax.plot(
48 | x_ticks, y_data, linewidth=2, marker="o", markersize=5, color=COLOR.get_colors(1, self.style_id)[0]
49 | )
50 | # x 轴标签和位置的映射
51 | self.ax.set_xticks(x_ticks, x_data)
52 |
53 | def plot_2d(self, x_data: List[int], y_data: List[List[float]], line_names: List[str], emphasize_index: int = -1):
54 | # x 轴坐标等距
55 | if x_data is None:
56 | x_data = range(len(y_data[0]))
57 | x_ticks = range(len(x_data))
58 | line_number = len(line_names)
59 |
60 | assert line_number <= len(self.all_markers), "markers 数量不足"
61 | markers = self.all_markers[:line_number]
62 | colors = COLOR.get_colors(line_number, self.style_id, emphasize_index)
63 | for i, y in enumerate(y_data):
64 | self.ax.plot(x_ticks, y, linewidth=2, label=line_names[i], marker=markers[i], markersize=5, color=colors[i])
65 | # x 轴标签和位置的映射
66 | self.ax.set_xticks(x_ticks, x_data)
67 | self.legend = self.ax.legend(
68 | line_names,
69 | loc="upper center", # 居中置顶
70 | ncols=line_number, # 横向排布
71 | bbox_to_anchor=(0.5, 1.15), # 置于图外侧
72 | handlelength=1, # 图例长宽, 修改为正方形
73 | handleheight=1, # 图例长宽, 修改为正方形
74 | handletextpad=0.4, # 缩短文字和图例的间距
75 | fontsize="x-small" if line_number >= 7 else "medium", # 图例文字大小
76 | )
77 |
--------------------------------------------------------------------------------
/paperplotlib/stackbar_graph.py:
--------------------------------------------------------------------------------
1 | from typing import List, Tuple, Union
2 | from .graph import Graph
3 | from .color import COLOR
4 | import numpy as np
5 |
6 |
7 | class StackBarGraph(Graph):
8 | """
9 | 堆叠条形图
10 | """
11 |
12 | def __init__(self, style_id: int = 1, subplots: Tuple[int, int] = None) -> None:
13 | super().__init__(style_id, subplots)
14 |
15 | self.percentage = False # 是否转换为百分比
16 | # 方向
17 | self.direction = "vertical" # or horizontal
18 |
19 | self._bar_width = 0.3
20 | self.thinkness = 0.5 # [0-1] 越大收缩越多
21 |
22 | def adjust_graph(self):
23 |
24 | left_margin = self.thinkness # 可以根据需要调整空白的大小
25 | right_margin = self.thinkness
26 |
27 | if self.direction == "vertical":
28 | self.fig.set_size_inches(4, 6)
29 | current_xlim = self.ax.get_xlim()
30 | # 设置新的 x 轴范围
31 | self.ax.set_xlim([current_xlim[0] - left_margin, current_xlim[1] + right_margin])
32 | elif self.direction == "horizontal":
33 | self.fig.set_size_inches(16, 4)
34 | current_ylim = self.ax.get_ylim()
35 | # 设置新的 y 轴范围
36 | self.ax.set_ylim([current_ylim[0] - left_margin, current_ylim[1] + right_margin])
37 | else:
38 | raise ValueError("direction must be vertical or horizontal")
39 |
40 | def plot(self, data: List[float], labels: List[str], name: str = ""):
41 | """
42 | @param x_data: x 轴数据
43 | @param y_data: labels
44 | """
45 |
46 | colors = COLOR.get_colors(len(labels), self.style_id)
47 | cumulative = 0
48 |
49 | if self.percentage:
50 | data = np.array(data) / np.sum(data) * 100
51 |
52 | for data, color, label in zip(data, colors, labels):
53 | if self.direction == "vertical":
54 | self.ax.bar(
55 | [name],
56 | data,
57 | color=color,
58 | bottom=cumulative,
59 | label=label,
60 | width=self._bar_width,
61 | edgecolor="black",
62 | linewidth=0.5,
63 | )
64 | else:
65 | self.ax.barh(
66 | [name],
67 | data,
68 | color=color,
69 | left=cumulative,
70 | label=label,
71 | height=self._bar_width,
72 | edgecolor="black",
73 | linewidth=0.5,
74 | )
75 |
76 | cumulative += data
77 |
78 | self.set_label_legend(labels, position="w", alignment="|")
79 |
--------------------------------------------------------------------------------
/pyproject.toml:
--------------------------------------------------------------------------------
1 | [tool.poetry]
2 | name = "paperplotlib"
3 | version = "0.0.7"
4 | description = "论文实验数据绘图"
5 | authors = ["luzhixing12345 "]
6 | license = "MIT"
7 | readme = "README.md"
8 | repository = "https://github.com/luzhixing12345/paperplotlib"
9 | documentation = "https://luzhixing12345.github.io/paperplotlib/"
10 |
11 |
12 | [tool.poetry.dependencies]
13 | python = "^3.7"
14 | matplotlib = "^3.7.0"
15 | numpy = "^1.23.5"
16 |
17 | [build-system]
18 | requires = ["poetry-core"]
19 | build-backend = "poetry.core.masonry.api"
20 |
--------------------------------------------------------------------------------
/test.py:
--------------------------------------------------------------------------------
1 | import sys
2 | import os
3 |
4 | sys.path.append(os.path.abspath(os.path.join(os.path.dirname(__file__), "..")))
5 |
6 |
7 | import paperplotlib as ppl
8 | import unittest
9 | import numpy as np
10 |
11 |
12 | class Test(unittest.TestCase):
13 |
14 | def test_bar_1d(self):
15 | x = [2, 4, 8, 16, 32]
16 | y = [2, 4, 8, 16, 32]
17 | graph = ppl.BarGraph()
18 | graph.plot(x, y)
19 | graph.x_label = "The number of data"
20 | graph.y_label = "Throughput (Mbps)"
21 |
22 | graph.save()
23 |
24 |
25 | def test_bar_2d(self):
26 | # 设定数组的行数a和列数b
27 | a = 8 # 例如:5行
28 | b = 4 # 例如:3列
29 |
30 | # 使用numpy的random.randint函数生成一个a行b列的随机整数数组
31 | # 假设我们想要的随机数范围是从0到99
32 | y = np.random.randint(10, 100, size=(a, b))
33 |
34 | group_names = [f"group {i}" for i in range(a)]
35 | column_names = [f"column {i}" for i in range(b)]
36 |
37 | g1 = ppl.BarGraph()
38 | g1.plot_2d(y, group_names, column_names)
39 | g1.x_label = "The number of data"
40 | g1.y_label = "Throughput (Mbps)"
41 | g1.width_picture = True
42 | g1.add_line(50)
43 | g1.save()
44 |
45 | g2 = ppl.BarGraph()
46 | g2.plot_2d(y, group_names, column_names, 0)
47 |
48 | g3 = ppl.BarGraph()
49 | a = 6
50 | b = 10
51 | y = np.random.randint(10, 100, size=(a, b))
52 | group_names = [f"group {i}" for i in range(a)]
53 | column_names = [f"column {i}" for i in range(b)]
54 | g3.plot_2d(y, group_names, column_names)
55 |
56 | def test_line_1d(self):
57 | x = [2, 4, 8, 16, 32]
58 | y = [2, 4, 8, 16, 32]
59 | graph = ppl.LineGraph()
60 | graph.plot(x, y)
61 | graph.x_label = "The number of data"
62 | graph.y_label = "Throughput (Mbps)"
63 | graph.y_lim = (0, 50)
64 | graph.disable_x_ticks = True
65 | graph.disable_points = True
66 | graph.save()
67 |
68 | def test_line_2d(self):
69 | a = 5
70 | b = 6
71 | y = np.random.randint(10, 100, size=(a, b))
72 |
73 | x_data = [i ** 2 for i in range(1, b+1)]
74 | line_names = [f"line {i}" for i in range(b)]
75 |
76 | g1 = ppl.LineGraph()
77 | g1.plot_2d(x_data, y, line_names)
78 | g1.x_label = "The number of data"
79 | g1.y_label = "Throughput (Mbps)"
80 | g1.save()
81 |
82 |
83 |
84 | if __name__ == "__main__": # pragma: no cover
85 | unittest.main()
--------------------------------------------------------------------------------