├── inst
└── images
│ ├── hover2.png
│ ├── left.png
│ ├── right.png
│ ├── barShort11.png
│ ├── barShort19.png
│ ├── barShort5.png
│ ├── drinkjuice.png
│ ├── juiceBottle.png
│ ├── orange_ico.png
│ ├── pointSquare.png
│ ├── autoPointtest.png
│ ├── barLine11test.png
│ ├── pointCircle1.png
│ ├── pointCircle15.png
│ ├── pointCircle5.png
│ ├── pointDiamond.png
│ ├── test_orange3.png
│ ├── antialiasedHIGH.png
│ ├── antialiasedLOW.png
│ ├── autoClustertest.png
│ ├── barPlotX_orange.png
│ ├── barPlotY_orange.png
│ ├── linePlot_orange.png
│ ├── pointCircleOpen.png
│ ├── drinkjuice_nostraw.png
│ ├── scatterPlot_orange.png
│ ├── Kam_et_al_2003_Fig2.jpg
│ ├── orange_grey_ico_test.png
│ ├── regressionPlot_orange.png
│ ├── icons8-juice-bottle-96.png
│ ├── juicr_hex_small_juicing.png
│ ├── juicr_hex_small_juicing2.png
│ ├── juicr_hex_small_juicing3.png
│ └── Kortum_and_Acymyan_2013_Fig4.jpg
├── vignettes
├── juicr_basic_vignette_v0.1.pdf
├── juicr_basic_vignette_v0.1.pdf.asis
└── juicr_basic_vignette_v0.1.Rmd
├── NAMESPACE
├── man
├── Kortum_and_Acymyan_2013_Fig4.jpg.Rd
├── Kam_et_al_2003_Fig2.jpg.Rd
├── file_getJuicr_Extractions.Rd
├── file_getJuicr_Images.Rd
├── juicr-package.Rd
└── GUI_juicr.Rd
├── NEWS.md
├── DESCRIPTION
├── R
├── file_getJuicr_Extractions.R
├── juicr_data.R
├── juicr_utils.R
├── zzz.R
├── juicr.R
├── file_getJuicr_Images.R
└── GUI_juicr.R
└── README.md
/inst/images/hover2.png:
--------------------------------------------------------------------------------
https://raw.githubusercontent.com/mjlajeunesse/juicr/HEAD/inst/images/hover2.png
--------------------------------------------------------------------------------
/inst/images/left.png:
--------------------------------------------------------------------------------
https://raw.githubusercontent.com/mjlajeunesse/juicr/HEAD/inst/images/left.png
--------------------------------------------------------------------------------
/inst/images/right.png:
--------------------------------------------------------------------------------
https://raw.githubusercontent.com/mjlajeunesse/juicr/HEAD/inst/images/right.png
--------------------------------------------------------------------------------
/inst/images/barShort11.png:
--------------------------------------------------------------------------------
https://raw.githubusercontent.com/mjlajeunesse/juicr/HEAD/inst/images/barShort11.png
--------------------------------------------------------------------------------
/inst/images/barShort19.png:
--------------------------------------------------------------------------------
https://raw.githubusercontent.com/mjlajeunesse/juicr/HEAD/inst/images/barShort19.png
--------------------------------------------------------------------------------
/inst/images/barShort5.png:
--------------------------------------------------------------------------------
https://raw.githubusercontent.com/mjlajeunesse/juicr/HEAD/inst/images/barShort5.png
--------------------------------------------------------------------------------
/inst/images/drinkjuice.png:
--------------------------------------------------------------------------------
https://raw.githubusercontent.com/mjlajeunesse/juicr/HEAD/inst/images/drinkjuice.png
--------------------------------------------------------------------------------
/inst/images/juiceBottle.png:
--------------------------------------------------------------------------------
https://raw.githubusercontent.com/mjlajeunesse/juicr/HEAD/inst/images/juiceBottle.png
--------------------------------------------------------------------------------
/inst/images/orange_ico.png:
--------------------------------------------------------------------------------
https://raw.githubusercontent.com/mjlajeunesse/juicr/HEAD/inst/images/orange_ico.png
--------------------------------------------------------------------------------
/inst/images/pointSquare.png:
--------------------------------------------------------------------------------
https://raw.githubusercontent.com/mjlajeunesse/juicr/HEAD/inst/images/pointSquare.png
--------------------------------------------------------------------------------
/inst/images/autoPointtest.png:
--------------------------------------------------------------------------------
https://raw.githubusercontent.com/mjlajeunesse/juicr/HEAD/inst/images/autoPointtest.png
--------------------------------------------------------------------------------
/inst/images/barLine11test.png:
--------------------------------------------------------------------------------
https://raw.githubusercontent.com/mjlajeunesse/juicr/HEAD/inst/images/barLine11test.png
--------------------------------------------------------------------------------
/inst/images/pointCircle1.png:
--------------------------------------------------------------------------------
https://raw.githubusercontent.com/mjlajeunesse/juicr/HEAD/inst/images/pointCircle1.png
--------------------------------------------------------------------------------
/inst/images/pointCircle15.png:
--------------------------------------------------------------------------------
https://raw.githubusercontent.com/mjlajeunesse/juicr/HEAD/inst/images/pointCircle15.png
--------------------------------------------------------------------------------
/inst/images/pointCircle5.png:
--------------------------------------------------------------------------------
https://raw.githubusercontent.com/mjlajeunesse/juicr/HEAD/inst/images/pointCircle5.png
--------------------------------------------------------------------------------
/inst/images/pointDiamond.png:
--------------------------------------------------------------------------------
https://raw.githubusercontent.com/mjlajeunesse/juicr/HEAD/inst/images/pointDiamond.png
--------------------------------------------------------------------------------
/inst/images/test_orange3.png:
--------------------------------------------------------------------------------
https://raw.githubusercontent.com/mjlajeunesse/juicr/HEAD/inst/images/test_orange3.png
--------------------------------------------------------------------------------
/inst/images/antialiasedHIGH.png:
--------------------------------------------------------------------------------
https://raw.githubusercontent.com/mjlajeunesse/juicr/HEAD/inst/images/antialiasedHIGH.png
--------------------------------------------------------------------------------
/inst/images/antialiasedLOW.png:
--------------------------------------------------------------------------------
https://raw.githubusercontent.com/mjlajeunesse/juicr/HEAD/inst/images/antialiasedLOW.png
--------------------------------------------------------------------------------
/inst/images/autoClustertest.png:
--------------------------------------------------------------------------------
https://raw.githubusercontent.com/mjlajeunesse/juicr/HEAD/inst/images/autoClustertest.png
--------------------------------------------------------------------------------
/inst/images/barPlotX_orange.png:
--------------------------------------------------------------------------------
https://raw.githubusercontent.com/mjlajeunesse/juicr/HEAD/inst/images/barPlotX_orange.png
--------------------------------------------------------------------------------
/inst/images/barPlotY_orange.png:
--------------------------------------------------------------------------------
https://raw.githubusercontent.com/mjlajeunesse/juicr/HEAD/inst/images/barPlotY_orange.png
--------------------------------------------------------------------------------
/inst/images/linePlot_orange.png:
--------------------------------------------------------------------------------
https://raw.githubusercontent.com/mjlajeunesse/juicr/HEAD/inst/images/linePlot_orange.png
--------------------------------------------------------------------------------
/inst/images/pointCircleOpen.png:
--------------------------------------------------------------------------------
https://raw.githubusercontent.com/mjlajeunesse/juicr/HEAD/inst/images/pointCircleOpen.png
--------------------------------------------------------------------------------
/inst/images/drinkjuice_nostraw.png:
--------------------------------------------------------------------------------
https://raw.githubusercontent.com/mjlajeunesse/juicr/HEAD/inst/images/drinkjuice_nostraw.png
--------------------------------------------------------------------------------
/inst/images/scatterPlot_orange.png:
--------------------------------------------------------------------------------
https://raw.githubusercontent.com/mjlajeunesse/juicr/HEAD/inst/images/scatterPlot_orange.png
--------------------------------------------------------------------------------
/inst/images/Kam_et_al_2003_Fig2.jpg:
--------------------------------------------------------------------------------
https://raw.githubusercontent.com/mjlajeunesse/juicr/HEAD/inst/images/Kam_et_al_2003_Fig2.jpg
--------------------------------------------------------------------------------
/inst/images/orange_grey_ico_test.png:
--------------------------------------------------------------------------------
https://raw.githubusercontent.com/mjlajeunesse/juicr/HEAD/inst/images/orange_grey_ico_test.png
--------------------------------------------------------------------------------
/inst/images/regressionPlot_orange.png:
--------------------------------------------------------------------------------
https://raw.githubusercontent.com/mjlajeunesse/juicr/HEAD/inst/images/regressionPlot_orange.png
--------------------------------------------------------------------------------
/inst/images/icons8-juice-bottle-96.png:
--------------------------------------------------------------------------------
https://raw.githubusercontent.com/mjlajeunesse/juicr/HEAD/inst/images/icons8-juice-bottle-96.png
--------------------------------------------------------------------------------
/inst/images/juicr_hex_small_juicing.png:
--------------------------------------------------------------------------------
https://raw.githubusercontent.com/mjlajeunesse/juicr/HEAD/inst/images/juicr_hex_small_juicing.png
--------------------------------------------------------------------------------
/vignettes/juicr_basic_vignette_v0.1.pdf:
--------------------------------------------------------------------------------
https://raw.githubusercontent.com/mjlajeunesse/juicr/HEAD/vignettes/juicr_basic_vignette_v0.1.pdf
--------------------------------------------------------------------------------
/inst/images/juicr_hex_small_juicing2.png:
--------------------------------------------------------------------------------
https://raw.githubusercontent.com/mjlajeunesse/juicr/HEAD/inst/images/juicr_hex_small_juicing2.png
--------------------------------------------------------------------------------
/inst/images/juicr_hex_small_juicing3.png:
--------------------------------------------------------------------------------
https://raw.githubusercontent.com/mjlajeunesse/juicr/HEAD/inst/images/juicr_hex_small_juicing3.png
--------------------------------------------------------------------------------
/inst/images/Kortum_and_Acymyan_2013_Fig4.jpg:
--------------------------------------------------------------------------------
https://raw.githubusercontent.com/mjlajeunesse/juicr/HEAD/inst/images/Kortum_and_Acymyan_2013_Fig4.jpg
--------------------------------------------------------------------------------
/vignettes/juicr_basic_vignette_v0.1.pdf.asis:
--------------------------------------------------------------------------------
1 | %\VignetteIndexEntry{Basic examples of extracting data with the juicr package for R}
2 | %\VignetteEngine{R.rsp::asis}
3 | %\VignetteAuthor{Marc J. Lajeunesse}
4 | %\VignetteKeyword{PDF}
5 | %\VignetteKeyword{package}
6 | %\VignetteKeyword{vignette}
7 | %\VignetteKeyword{installation}
--------------------------------------------------------------------------------
/NAMESPACE:
--------------------------------------------------------------------------------
1 | # Generated by roxygen2: do not edit by hand
2 |
3 | export(GUI_juicr)
4 | export(file_getJuicr_Extractions)
5 | export(file_getJuicr_Images)
6 | import(tcltk)
7 | import(utils)
8 | importFrom(RCurl,base64Decode)
9 | importFrom(RCurl,base64Encode)
10 | importFrom(XML,htmlParse)
11 | importFrom(XML,readHTMLTable)
12 | importFrom(XML,xmlAttrs)
13 | importFrom(XML,xpathSApply)
14 | importFrom(grDevices,col2rgb)
15 | importFrom(grDevices,rgb)
16 | importFrom(stats,sd)
17 |
--------------------------------------------------------------------------------
/man/Kortum_and_Acymyan_2013_Fig4.jpg.Rd:
--------------------------------------------------------------------------------
1 | % Generated by roxygen2: do not edit by hand
2 | % Please edit documentation in R/juicr_data.R
3 | \docType{data}
4 | \name{Kortum_and_Acymyan_2013_Fig4.jpg}
5 | \alias{Kortum_and_Acymyan_2013_Fig4.jpg}
6 | \title{An example image of a bar plot figure}
7 | \format{
8 | A raw jpg-formated image
9 | }
10 | \description{
11 | A jpg image of a bar plot from Figure 4 of Kortum, P., and Acymyan, C.Z.
12 | 2013. How low can you go? Is the System Usability Scale range restricted?
13 | Journal of Usability Studies 9:14-24.
14 | }
15 | \note{
16 | \strong{How to use}\cr\cr
17 | \code{readImage(system.file("images", "Kortum_and_Acymyan_2013_Fig4.jpg", package = "juicr"))}
18 | }
19 | \keyword{datasets}
20 |
--------------------------------------------------------------------------------
/NEWS.md:
--------------------------------------------------------------------------------
1 | Lajeunesse, M.J. (2021) Automated, semi-automated, and manual extraction of numerical data from scientific images, plot, charts, and figures. R package version 0.1. https://CRAN.R-project.org/package=juicr
2 |
3 | # juicr 0.1 (4/26/2021)
4 |
5 | * beta release of package
6 | * added automated tools for multiple images
7 | * added .html reports and .eps image-extraction saving
8 |
9 |
10 | # pre-release juicr (2017 - 2021)
11 |
12 | * informal, unreleased, and distributed to colleagues as a giant function
13 | * contained only semi-automated tools, manual extractor, copy-and-paste extraction retrieval, and no .html record generation
14 | * used on Youtube during hard-boiled synthesis lectures 6-14 (https://youtube.com/playlist?list=PLMDcoG6cxhI0JRfmuv3AwT9Sy0FQNMqCL)
--------------------------------------------------------------------------------
/man/Kam_et_al_2003_Fig2.jpg.Rd:
--------------------------------------------------------------------------------
1 | % Generated by roxygen2: do not edit by hand
2 | % Please edit documentation in R/juicr_data.R
3 | \docType{data}
4 | \name{Kam_et_al_2003_Fig2.jpg}
5 | \alias{Kam_et_al_2003_Fig2.jpg}
6 | \title{An example image of a scatterplot figure}
7 | \format{
8 | A raw jpg-formated image
9 | }
10 | \description{
11 | A jpg image of a scatterplot from Figure 2 of Kam, M., Cohen-Gross, S.,
12 | Khokhlova, I.S., Degen, A.A. and Geffen, E. 2003. Average daily metabolic
13 | rate, reproduction and energy allocation during lactation in the Sundevall
14 | Jird Meriones crassus. Functional Ecology 17:496-503.
15 | }
16 | \note{
17 | \strong{How to use}\cr\cr
18 | \code{readImage(system.file("images", "Kam_et_al_2003_Fig2.jpg", package = "juicr"))}
19 | }
20 | \keyword{datasets}
21 |
--------------------------------------------------------------------------------
/man/file_getJuicr_Extractions.Rd:
--------------------------------------------------------------------------------
1 | % Generated by roxygen2: do not edit by hand
2 | % Please edit documentation in R/file_getJuicr_Extractions.R
3 | \name{file_getJuicr_Extractions}
4 | \alias{file_getJuicr_Extractions}
5 | \title{Reads a *_juicr.html report and retrieves data extractions and history.}
6 | \usage{
7 | file_getJuicr_Extractions(aFileName = file.choose(), quiet = FALSE)
8 | }
9 | \arguments{
10 | \item{aFileName}{The file name and location of a *_juicr.html report. Prompts
11 | for file name if none is explicitly called. Must be .html format.}
12 |
13 | \item{quiet}{When \code{"TRUE"}, does not display all extraction tables.}
14 | }
15 | \value{
16 | A list of tables including all extractions, coordinates, image file
17 | names, and \code{juicr} GUI parameters.
18 | }
19 | \description{
20 | Reads a juicr generated report of image extractions contained within the .html file.
21 | }
22 | \examples{
23 | \dontrun{
24 |
25 | theExtraction <- file_getJuicr_Extractions("pretend_image_juicr.html")
26 | print(theExtraction$points)
27 |
28 | }
29 |
30 | }
31 | \seealso{
32 | \link{file_getJuicr_Images}
33 | }
34 |
--------------------------------------------------------------------------------
/DESCRIPTION:
--------------------------------------------------------------------------------
1 | Package: juicr
2 | Version: 0.2
3 | Date: 2021-03-05
4 | Title: Automated and Manual Extraction of Numerical Data from Scientific Images
5 | Authors@R: person(given = "Marc J.", family = "Lajeunesse", role = c("aut", "cre"),
6 | email = "lajeunesse@usf.edu", comment = c(ORCID = "0000-0002-9678-2080"))
7 | Description: Provides a GUI interface for automating data extraction from
8 | multiple images containing scatter and bar plots, semi-automated tools to tinker
9 | with extraction attempts, and a fully-loaded point-and-click manual extractor
10 | with image zoom, calibrator, and classifier. Also provides detailed and
11 | R-independent extraction reports as fully-embedded .html records.
12 | Type: Package
13 | Depends:
14 | R (>= 3.3.2)
15 | biocViews:
16 | Imports:
17 | XML,
18 | RCurl
19 | SystemRequirements: Tcl/Tk toolkit (X11 Quarts for Mac)
20 | VignetteBuilder: R.rsp
21 | License: GPL (>= 2)
22 | URL: http://lajeunesse.myweb.usf.edu/ https://github.com/mjlajeunesse/ https://www.youtube.com/c/LajeunesseLab/
23 | Encoding: UTF-8
24 | RoxygenNote: 7.1.1
25 | Suggests:
26 | EBImage,
27 | R.rsp
28 |
--------------------------------------------------------------------------------
/R/file_getJuicr_Extractions.R:
--------------------------------------------------------------------------------
1 | #' Reads a *_juicr.html report and retrieves data extractions and history.
2 | #'
3 | #' Reads a juicr generated report of image extractions contained within the .html file.
4 | #'
5 | #' @param aFileName The file name and location of a *_juicr.html report. Prompts
6 | #' for file name if none is explicitly called. Must be .html format.
7 | #' @param quiet When \code{"TRUE"}, does not display all extraction tables.
8 | #'
9 | #' @return A list of tables including all extractions, coordinates, image file
10 | #' names, and \code{juicr} GUI parameters.
11 | #'
12 | #' @examples \dontrun{
13 | #'
14 | #' theExtraction <- file_getJuicr_Extractions("pretend_image_juicr.html")
15 | #' print(theExtraction$points)
16 | #'
17 | #'}
18 | #'
19 | #' @seealso \link{file_getJuicr_Images}
20 | #'
21 | #' @importFrom XML readHTMLTable
22 | #'
23 | #' @export
24 |
25 | file_getJuicr_Extractions <- function(aFileName = file.choose(),
26 | quiet = FALSE) {
27 |
28 | dataTables <- XML::readHTMLTable(aFileName)
29 | if(!quiet) print(dataTables)
30 | return(dataTables)
31 | }
32 |
--------------------------------------------------------------------------------
/man/file_getJuicr_Images.Rd:
--------------------------------------------------------------------------------
1 | % Generated by roxygen2: do not edit by hand
2 | % Please edit documentation in R/file_getJuicr_Images.R
3 | \name{file_getJuicr_Images}
4 | \alias{file_getJuicr_Images}
5 | \title{Reads a *_juicr.html report and extracts images into working directory.}
6 | \usage{
7 | file_getJuicr_Images(aFileName = file.choose(), quiet = FALSE)
8 | }
9 | \arguments{
10 | \item{aFileName}{The file name and location of a *_juicr.html report. Prompts
11 | for file name if none is explicitly called. Must be .html format.}
12 |
13 | \item{quiet}{When \code{"TRUE"}, does not display the file names of all images
14 | extracted and saved to the working directory.}
15 | }
16 | \value{
17 | A vector of file names of each image extracted from the .html file.
18 | }
19 | \description{
20 | Reads a juicr generated report of image extractions contained within the
21 | .html file, and saves all images (e.g., original, standardized,
22 | and standardized with painted extractions).
23 | }
24 | \examples{
25 | \dontrun{
26 |
27 | file_getJuicr_Images("pretend_image_juicr.html")
28 |
29 | }
30 |
31 | }
32 | \seealso{
33 | \link{file_getJuicr_Extractions}
34 | }
35 |
--------------------------------------------------------------------------------
/R/juicr_data.R:
--------------------------------------------------------------------------------
1 | #' An example image of a scatterplot figure
2 | #'
3 | #' A jpg image of a scatterplot from Figure 2 of Kam, M., Cohen-Gross, S.,
4 | #' Khokhlova, I.S., Degen, A.A. and Geffen, E. 2003. Average daily metabolic
5 | #' rate, reproduction and energy allocation during lactation in the Sundevall
6 | #' Jird Meriones crassus. Functional Ecology 17:496-503.
7 | #'
8 | #' @docType data
9 | #' @keywords datasets
10 | #' @name Kam_et_al_2003_Fig2.jpg
11 | #' @format A raw jpg-formated image
12 | #' @note \strong{How to use}\cr\cr
13 | #' \code{readImage(system.file("images", "Kam_et_al_2003_Fig2.jpg", package = "juicr"))}
14 | NULL
15 |
16 | #' An example image of a bar plot figure
17 | #'
18 | #' A jpg image of a bar plot from Figure 4 of Kortum, P., and Acymyan, C.Z.
19 | #' 2013. How low can you go? Is the System Usability Scale range restricted?
20 | #' Journal of Usability Studies 9:14-24.
21 | #'
22 | #' @docType data
23 | #' @keywords datasets
24 | #' @name Kortum_and_Acymyan_2013_Fig4.jpg
25 | #' @format A raw jpg-formated image
26 | #' @note \strong{How to use}\cr\cr
27 | #' \code{readImage(system.file("images", "Kortum_and_Acymyan_2013_Fig4.jpg", package = "juicr"))}
28 | NULL
--------------------------------------------------------------------------------
/R/juicr_utils.R:
--------------------------------------------------------------------------------
1 | .juicrPROBLEM <- function(type, aMessage) {
2 |
3 | newMessage <- paste0("juicr ",
4 | type,
5 | " in ",
6 | as.list(sys.call(-1))[[1]],
7 | "(): ",
8 | aMessage,
9 | ".")
10 | if(type == "error") stop(newMessage, call. = FALSE)
11 | message(newMessage)
12 |
13 | }
14 |
15 | .juicrDependencies <- function(dependency) {
16 |
17 | # to do: generalize for other external packages
18 | if (!requireNamespace(dependency, quietly = TRUE)) {
19 |
20 | if(isTRUE(utils::askYesNo("Extracting data from figures with juicr requires the EBImage package, install now? \n\n NOTE: if YES, during installation choose option: a (to complete updates of EBImage).", FALSE))) {
21 | message("***** Installing EBImage... it will take some time, but choose option: a (to complete)...")
22 | eval(parse(text = "install.packages(\"BiocManager\", repos = \"http://cran.us.r-project.org\", quiet = TRUE); BiocManager::install(\"EBImage\"); library(EBImage);"))
23 | } else {
24 | packageStartupMessage("***** You can install and load later with this R script:")
25 | packageStartupMessage(" install.packages(\"BiocManager\", repos = \"http://cran.us.r-project.org\");")
26 | packageStartupMessage(" BiocManager::install(\"EBImage\");")
27 | packageStartupMessage(" library(EBImage)")
28 |
29 | .juicrPROBLEM("error", "Function disabled until EBImage package is installed.")
30 | }
31 |
32 | message("***** EBImage installed and loaded.")
33 | }
34 |
35 | }
36 |
--------------------------------------------------------------------------------
/R/zzz.R:
--------------------------------------------------------------------------------
1 | .onAttach <- function(libname, pkgname) {
2 |
3 | packageStartupMessage(paste0("** juicr ", utils::packageVersion("juicr"), ", for installing/troubleshooting help see:"))
4 | packageStartupMessage("** http://lajeunesse.myweb.usf.edu/juicr/juicr_basic_vignette.html")
5 | packageStartupMessage("***** External dependencies check:")
6 |
7 | if ((.Platform$OS.type == "windows" || .Platform$GUI == "AQUA") &&
8 | (capabilities("tcltk") || capabilities("X11") || suppressWarnings(tcltk::.TkUp))) {
9 | packageStartupMessage("***** setup supports GUIs [ TRUE ]")
10 | } else {
11 | packageStartupMessage("***** setup supports GUIs [ FALSE ]")
12 | packageStartupMessage("***** NOTE: Your configuration may still support GUIs,")
13 | packageStartupMessage("***** use the fixes below only after you try")
14 | packageStartupMessage("***** running juicr's GUI_juicr().")
15 | packageStartupMessage("**")
16 | packageStartupMessage("** Fix for Windows users:")
17 | packageStartupMessage("** Update R (tcltk is now part of all new R builds).")
18 | packageStartupMessage("** Fix for Mac users:")
19 | packageStartupMessage("** Install xQuartz (X11) from https://www.xquartz.org/")
20 | }
21 |
22 | if (!requireNamespace("EBImage", quietly = TRUE)) {
23 | packageStartupMessage("***** setup supports data extraction from plots/figures [ FALSE ]")
24 | packageStartupMessage("***** NOTE: EBImage package (Bioconductor) will be installed only")
25 | packageStartupMessage("***** once GUI_juicr() function is first used.")
26 | } else {
27 | packageStartupMessage("***** setup supports data extraction from plots/figures [ TRUE ]")
28 | }
29 |
30 | }
31 |
--------------------------------------------------------------------------------
/R/juicr.R:
--------------------------------------------------------------------------------
1 | #' Automated, semi-automated, and manual extraction of numerical data from
2 | #' scientific images, plot, charts, and figures
3 | #'
4 | #' \pkg{juicr} is a GUI interface for automating data extraction from
5 | #' multiple images containing scatter and bar plots, semi-automated tools to
6 | #' tinker with extraction attempts, and a fully-loaded point-and-click manual
7 | #' extractor with image zoom, calibrator, and classifier. Also provides
8 | #' detailed and R-independent extraction reports as fully-embedded .html
9 | #' records. More information about \pkg{juicr} can be found
10 | #' at \url{http://lajeunesse.myweb.usf.edu/}.
11 | #'
12 | #' @details \strong{What to cite?}\cr\cr Lajeunesse, M.J. (2021) Automated,
13 | #' semi-automated, and manual extraction of numerical data from scientific
14 | #' images, plot, charts, and figures. \emph{R package, v.0.1}
15 | #' \cr\cr \strong{Installation and Dependencies.}\cr\cr \pkg{juicr} has one
16 | #' external dependency that need to be installed and loaded prior to use in R.
17 | #' This is the EBImage R package (Pau et al. 2010) available only from the
18 | #' Bioconductor repository: \url{https://www.bioconductor.org/}.
19 | #' \cr\cr To properly install \pkg{juicr}, start with the following
20 | #' R script that loads the Bioconductor resources needed to install the EBImage
21 | #' (also accept all of its dependencies): \cr\cr
22 | #' \code{install.packages("BiocManager");} \cr \code{BiocManager::install("EBImage"))}
23 | #' \cr \code{library(metagear)} \cr\cr Finally for Mac OS users, installation
24 | #' is sometimes not straighforward as the GUI_juicr() requires the
25 | #' Tcl/Tk GUI toolkit to be installed. You can get this toolkit by making sure
26 | #' the latest X11 application (xQuartz) is installed from here:
27 | #' \url{https://www.xquartz.org/}.
28 | #'
29 | #' @references Pau, G., Fuchs, F., Sklyar, O., Boutros, M. and Huber, W. (2010)
30 | #' EBImage: an R package for image processing with applications to cellular
31 | #' phenotypes. Bioinformatics 26: 979-981.
32 | #'
33 | #' @name juicr-package
34 | #' @docType package
35 | #' @author Marc J. Lajeunesse (University of South Florida, Tampa USA)
36 |
37 | NULL
38 |
--------------------------------------------------------------------------------
/man/juicr-package.Rd:
--------------------------------------------------------------------------------
1 | % Generated by roxygen2: do not edit by hand
2 | % Please edit documentation in R/juicr.R
3 | \docType{package}
4 | \name{juicr-package}
5 | \alias{juicr-package}
6 | \title{Automated, semi-automated, and manual extraction of numerical data from
7 | scientific images, plot, charts, and figures}
8 | \description{
9 | \pkg{juicr} is a GUI interface for automating data extraction from
10 | multiple images containing scatter and bar plots, semi-automated tools to
11 | tinker with extraction attempts, and a fully-loaded point-and-click manual
12 | extractor with image zoom, calibrator, and classifier. Also provides
13 | detailed and R-independent extraction reports as fully-embedded .html
14 | records. More information about \pkg{juicr} can be found
15 | at \url{http://lajeunesse.myweb.usf.edu/}.
16 | }
17 | \details{
18 | \strong{What to cite?}\cr\cr Lajeunesse, M.J. (2021) Automated,
19 | semi-automated, and manual extraction of numerical data from scientific
20 | images, plot, charts, and figures. \emph{R package, v.0.1}
21 | \cr\cr \strong{Installation and Dependencies.}\cr\cr \pkg{juicr} has one
22 | external dependency that need to be installed and loaded prior to use in R.
23 | This is the EBImage R package (Pau et al. 2010) available only from the
24 | Bioconductor repository: \url{https://www.bioconductor.org/}.
25 | \cr\cr To properly install \pkg{juicr}, start with the following
26 | R script that loads the Bioconductor resources needed to install the EBImage
27 | (also accept all of its dependencies): \cr\cr
28 | \code{install.packages("BiocManager");} \cr \code{BiocManager::install("EBImage"))}
29 | \cr \code{library(metagear)} \cr\cr Finally for Mac OS users, installation
30 | is sometimes not straighforward as the GUI_juicr() requires the
31 | Tcl/Tk GUI toolkit to be installed. You can get this toolkit by making sure
32 | the latest X11 application (xQuartz) is installed from here:
33 | \url{https://www.xquartz.org/}.
34 | }
35 | \references{
36 | Pau, G., Fuchs, F., Sklyar, O., Boutros, M. and Huber, W. (2010)
37 | EBImage: an R package for image processing with applications to cellular
38 | phenotypes. Bioinformatics 26: 979-981.
39 | }
40 | \author{
41 | Marc J. Lajeunesse (University of South Florida, Tampa USA)
42 | }
43 |
--------------------------------------------------------------------------------
/README.md:
--------------------------------------------------------------------------------
1 | ## juicr package for R  2 |
3 | ### purpose of the juicr package
4 | **juicr** is a GUI interface to automated, semi-automated, and manual tools for extracting data from scientific images -- like scatter or bar plots that contain data, or other images with information that can be converted numerically or coordinates classified. More information about **juicr** can be found at [http://lajeunesse.myweb.usf.edu](http://lajeunesse.myweb.usf.edu).
5 |
6 | ## layout & vignette (click on image)
7 |
2 |
3 | ### purpose of the juicr package
4 | **juicr** is a GUI interface to automated, semi-automated, and manual tools for extracting data from scientific images -- like scatter or bar plots that contain data, or other images with information that can be converted numerically or coordinates classified. More information about **juicr** can be found at [http://lajeunesse.myweb.usf.edu](http://lajeunesse.myweb.usf.edu).
5 |
6 | ## layout & vignette (click on image)
7 | 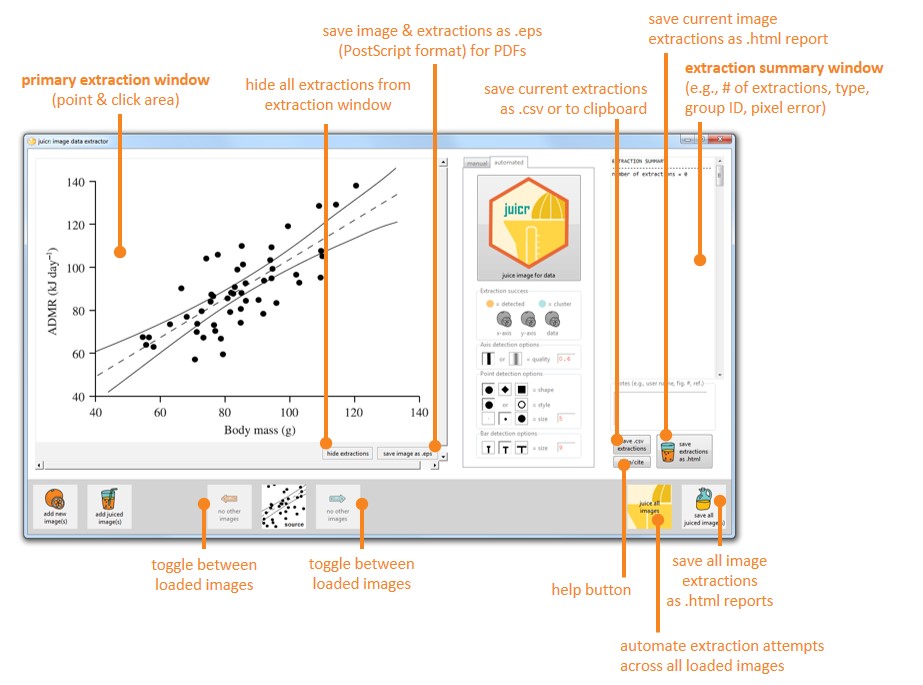 8 |
9 | ### video tutorial
10 | A brief use and installation tutorial for **juicr** can be watched on *Youtube* here:
8 |
9 | ### video tutorial
10 | A brief use and installation tutorial for **juicr** can be watched on *Youtube* here:
11 |  12 |
13 | ### installation instructions and dependencies
14 | **juicr** has an external dependency that needs to be installed and loaded prior to use in R. This is the **EBImage** R package (Pau et al. 2010) available only from the Bioconductor repository: https://www.bioconductor.org.
15 | To properly install **juicr**, start with the following R script that loads the Bioconductor resources needed to install the **EBImage** (also accept all dependencies):
16 |
17 | ``` r
18 | install.packages("BiocManager");
19 | BiocManager::install("EBImage")
20 | library(metagear)
21 | ```
22 |
23 | This dependency sometimes results in CRAN failing to generate a binary of **juicr** for your OS -- which sadly happens often. In this case install from the source, for example:
24 |
25 | ``` r
26 | install.packages("juicr_0.1.tar.gz", repos = "http://cran.us.r-project.org", type = "source", dependencies = TRUE)
27 | library(juicr)
28 | ```
29 |
30 | ### How to cite?
31 | Lajeunesse, M.J. (2021) Automated, semi-automated, and manual extraction of numerical data from scientific images, plot, charts, and figures. R package version 0.1. https://CRAN.R-project.org/package=juicr
32 |
33 | ### Found a bug?
34 | Please email me at lajeunesse@usf.edu with the subject header: "juicr bug" and in the body please include juicr's version, your OS, and a short description of the issue. I will try to include fixes in following releases.
--------------------------------------------------------------------------------
/R/file_getJuicr_Images.R:
--------------------------------------------------------------------------------
1 | #' Reads a *_juicr.html report and extracts images into working directory.
2 | #'
3 | #' Reads a juicr generated report of image extractions contained within the
4 | #' .html file, and saves all images (e.g., original, standardized,
5 | #' and standardized with painted extractions).
6 | #'
7 | #' @param aFileName The file name and location of a *_juicr.html report. Prompts
8 | #' for file name if none is explicitly called. Must be .html format.
9 | #' @param quiet When \code{"TRUE"}, does not display the file names of all images
10 | #' extracted and saved to the working directory.
11 | #'
12 | #' @return A vector of file names of each image extracted from the .html file.
13 | #'
14 | #' @examples \dontrun{
15 | #'
16 | #' file_getJuicr_Images("pretend_image_juicr.html")
17 | #'
18 | #'}
19 | #'
20 | #' @seealso \link{file_getJuicr_Extractions}
21 | #'
22 | #' @importFrom XML readHTMLTable htmlParse xpathSApply xmlAttrs
23 | #' @importFrom RCurl base64Decode
24 | #'
25 | #' @export
26 |
27 | file_getJuicr_Images <- function(aFileName = file.choose(),
28 | quiet = FALSE) {
29 |
30 | # collect tables from juicr .html file
31 | inputTables <- XML::readHTMLTable(aFileName)
32 |
33 | # collect standardized figures from juicr .html file
34 | juicrHTML = XML::htmlParse(aFileName)
35 | inputImages <- XML::xpathSApply(juicrHTML,
36 | "//table/tr/td/img",
37 | XML::xmlAttrs)["src", ]
38 |
39 | # re-create all image files
40 | savedFiles <- c()
41 | for(i in 1:length(inputTables$files$file_name)) {
42 | file.create(file.path(dirname(aFileName),
43 | paste0("extracted_", inputTables$files$file_name[i])))
44 | tempImageFile <- file(file.path(dirname(aFileName),
45 | paste0("extracted_", inputTables$files$file_name[i])),
46 | "wb")
47 | writeBin(RCurl::base64Decode(sub(".*,", "", inputImages[i]), mode = "raw"),
48 | tempImageFile, useBytes = TRUE)
49 | close(tempImageFile)
50 | if(!quiet) print("extracted = ",
51 | file.path(dirname(aFileName),
52 | paste0("extracted_", inputTables$files$file_name[i])))
53 | savedFiles <- c(savedFiles,
54 | file.path(dirname(aFileName),
55 | paste0("extracted_", inputTables$files$file_name[i])))
56 | }
57 |
58 | return(savedFiles)
59 | }
60 |
--------------------------------------------------------------------------------
/man/GUI_juicr.Rd:
--------------------------------------------------------------------------------
1 | % Generated by roxygen2: do not edit by hand
2 | % Please edit documentation in R/GUI_juicr.R
3 | \name{GUI_juicr}
4 | \alias{GUI_juicr}
5 | \title{A GUI screener to quickly code candidate studies for inclusion/exclusion into
6 | a systematic review or meta-analysis.}
7 | \usage{
8 | GUI_juicr(
9 | theFigureFile = "",
10 | theJuicrFile = "",
11 | standardizeTheImage = TRUE,
12 | standardSize = 1000,
13 | figureWindowSize = c(800, 600),
14 | pointSize = 6,
15 | animateDelay = TRUE,
16 | groupNames = c("orangeGrp", "berryGrp", "cherryGrp", "plumGrp", "kiwiGrp",
17 | "bananaGrp", "grapeGrp", "pruneGrp"),
18 | groupColors = c("dark orange", "turquoise3", "tomato3", "orchid", "yellow green",
19 | "goldenrod2", "plum4", "saddle brown")
20 | )
21 | }
22 | \arguments{
23 | \item{theFigureFile}{An optional file name and location of a .jpg, .png, or
24 | .tiff file containing the scientific image/plot/chart/figure to pre-load
25 | in the GUI. Within the GUI there is also a button to select the image file.
26 | Images in other formats should be converted to .png prior to using juicr.}
27 |
28 | \item{theJuicrFile}{An optional file name and location of a *_juicr.html
29 | report containing extractions and images from a previous juicr
30 | session to pre-load into the GUI. Within the GUI there is also a button to
31 | select an .html file.}
32 |
33 | \item{standardizeTheImage}{When \code{"TRUE"}, all large images are
34 | standardized to a common size with a width specified
35 | by \code{"standardSize"}. When \code{"FALSE"}, the image is unaltered
36 | in size.}
37 |
38 | \item{standardSize}{The common width in pixels for standardizing large images;
39 | default is a width of 1000 pixels.}
40 |
41 | \item{figureWindowSize}{Specifies the window size containing the image. By
42 | default, this image-viewer window will be 800 (width) by 600 (height)
43 | pixels, larger images will be scrollable to fit this window.}
44 |
45 | \item{pointSize}{Changes the default size of a clickable data-point on the
46 | image. Size is the radius in pixels (default is 6).}
47 |
48 | \item{animateDelay}{When \code{"TRUE"}, creates a very small pause when
49 | plotting individual automated extractions -- giving an animated effect.}
50 |
51 | \item{groupNames}{A vector of the default eight names specifying the
52 | labels of each group. Default labels are fruit themed. Can be any size,
53 | but GUI will only print first 9 characters.}
54 |
55 | \item{groupColors}{A vector of the default eight color names specifying the
56 | coloring of each group. Are in color-names format, but can also be HEX.}
57 | }
58 | \value{
59 | A console message of where saved .csv or *_juicr.html files are located.
60 | }
61 | \description{
62 | A GUI screener to help scan and evaluate the title and abstract of studies to
63 | be included in a systematic review or meta-analysis. A description of GUI
64 | options and layout is found here: \url{http://lajeunesse.myweb.usf.edu/juicr/juicr_basic_vignette_v0.1.html}.
65 | }
66 | \note{
67 | \strong{Installation and troubleshooting}\cr\cr For Mac OS users,
68 | installation is sometimes not straighforward as this GUI requires the
69 | Tcl/Tk GUI toolkit to be installed. You can get this toolkit by making sure
70 | the latest X11 application (xQuartz) is installed, see here:
71 | \url{https://www.xquartz.org/}. More information on
72 | installation is found in \code{juicrs}'s vignette.
73 | }
74 | \examples{
75 | \dontrun{
76 |
77 | GUI_juicr(system.file("images", "Kortum_and_Acymyan_2013_Fig4.jpg", package = "juicr"))
78 |
79 | }
80 |
81 | }
82 |
--------------------------------------------------------------------------------
/vignettes/juicr_basic_vignette_v0.1.Rmd:
--------------------------------------------------------------------------------
1 |
2 | ---
3 | title: |
4 |
12 |
13 | ### installation instructions and dependencies
14 | **juicr** has an external dependency that needs to be installed and loaded prior to use in R. This is the **EBImage** R package (Pau et al. 2010) available only from the Bioconductor repository: https://www.bioconductor.org.
15 | To properly install **juicr**, start with the following R script that loads the Bioconductor resources needed to install the **EBImage** (also accept all dependencies):
16 |
17 | ``` r
18 | install.packages("BiocManager");
19 | BiocManager::install("EBImage")
20 | library(metagear)
21 | ```
22 |
23 | This dependency sometimes results in CRAN failing to generate a binary of **juicr** for your OS -- which sadly happens often. In this case install from the source, for example:
24 |
25 | ``` r
26 | install.packages("juicr_0.1.tar.gz", repos = "http://cran.us.r-project.org", type = "source", dependencies = TRUE)
27 | library(juicr)
28 | ```
29 |
30 | ### How to cite?
31 | Lajeunesse, M.J. (2021) Automated, semi-automated, and manual extraction of numerical data from scientific images, plot, charts, and figures. R package version 0.1. https://CRAN.R-project.org/package=juicr
32 |
33 | ### Found a bug?
34 | Please email me at lajeunesse@usf.edu with the subject header: "juicr bug" and in the body please include juicr's version, your OS, and a short description of the issue. I will try to include fixes in following releases.
--------------------------------------------------------------------------------
/R/file_getJuicr_Images.R:
--------------------------------------------------------------------------------
1 | #' Reads a *_juicr.html report and extracts images into working directory.
2 | #'
3 | #' Reads a juicr generated report of image extractions contained within the
4 | #' .html file, and saves all images (e.g., original, standardized,
5 | #' and standardized with painted extractions).
6 | #'
7 | #' @param aFileName The file name and location of a *_juicr.html report. Prompts
8 | #' for file name if none is explicitly called. Must be .html format.
9 | #' @param quiet When \code{"TRUE"}, does not display the file names of all images
10 | #' extracted and saved to the working directory.
11 | #'
12 | #' @return A vector of file names of each image extracted from the .html file.
13 | #'
14 | #' @examples \dontrun{
15 | #'
16 | #' file_getJuicr_Images("pretend_image_juicr.html")
17 | #'
18 | #'}
19 | #'
20 | #' @seealso \link{file_getJuicr_Extractions}
21 | #'
22 | #' @importFrom XML readHTMLTable htmlParse xpathSApply xmlAttrs
23 | #' @importFrom RCurl base64Decode
24 | #'
25 | #' @export
26 |
27 | file_getJuicr_Images <- function(aFileName = file.choose(),
28 | quiet = FALSE) {
29 |
30 | # collect tables from juicr .html file
31 | inputTables <- XML::readHTMLTable(aFileName)
32 |
33 | # collect standardized figures from juicr .html file
34 | juicrHTML = XML::htmlParse(aFileName)
35 | inputImages <- XML::xpathSApply(juicrHTML,
36 | "//table/tr/td/img",
37 | XML::xmlAttrs)["src", ]
38 |
39 | # re-create all image files
40 | savedFiles <- c()
41 | for(i in 1:length(inputTables$files$file_name)) {
42 | file.create(file.path(dirname(aFileName),
43 | paste0("extracted_", inputTables$files$file_name[i])))
44 | tempImageFile <- file(file.path(dirname(aFileName),
45 | paste0("extracted_", inputTables$files$file_name[i])),
46 | "wb")
47 | writeBin(RCurl::base64Decode(sub(".*,", "", inputImages[i]), mode = "raw"),
48 | tempImageFile, useBytes = TRUE)
49 | close(tempImageFile)
50 | if(!quiet) print("extracted = ",
51 | file.path(dirname(aFileName),
52 | paste0("extracted_", inputTables$files$file_name[i])))
53 | savedFiles <- c(savedFiles,
54 | file.path(dirname(aFileName),
55 | paste0("extracted_", inputTables$files$file_name[i])))
56 | }
57 |
58 | return(savedFiles)
59 | }
60 |
--------------------------------------------------------------------------------
/man/GUI_juicr.Rd:
--------------------------------------------------------------------------------
1 | % Generated by roxygen2: do not edit by hand
2 | % Please edit documentation in R/GUI_juicr.R
3 | \name{GUI_juicr}
4 | \alias{GUI_juicr}
5 | \title{A GUI screener to quickly code candidate studies for inclusion/exclusion into
6 | a systematic review or meta-analysis.}
7 | \usage{
8 | GUI_juicr(
9 | theFigureFile = "",
10 | theJuicrFile = "",
11 | standardizeTheImage = TRUE,
12 | standardSize = 1000,
13 | figureWindowSize = c(800, 600),
14 | pointSize = 6,
15 | animateDelay = TRUE,
16 | groupNames = c("orangeGrp", "berryGrp", "cherryGrp", "plumGrp", "kiwiGrp",
17 | "bananaGrp", "grapeGrp", "pruneGrp"),
18 | groupColors = c("dark orange", "turquoise3", "tomato3", "orchid", "yellow green",
19 | "goldenrod2", "plum4", "saddle brown")
20 | )
21 | }
22 | \arguments{
23 | \item{theFigureFile}{An optional file name and location of a .jpg, .png, or
24 | .tiff file containing the scientific image/plot/chart/figure to pre-load
25 | in the GUI. Within the GUI there is also a button to select the image file.
26 | Images in other formats should be converted to .png prior to using juicr.}
27 |
28 | \item{theJuicrFile}{An optional file name and location of a *_juicr.html
29 | report containing extractions and images from a previous juicr
30 | session to pre-load into the GUI. Within the GUI there is also a button to
31 | select an .html file.}
32 |
33 | \item{standardizeTheImage}{When \code{"TRUE"}, all large images are
34 | standardized to a common size with a width specified
35 | by \code{"standardSize"}. When \code{"FALSE"}, the image is unaltered
36 | in size.}
37 |
38 | \item{standardSize}{The common width in pixels for standardizing large images;
39 | default is a width of 1000 pixels.}
40 |
41 | \item{figureWindowSize}{Specifies the window size containing the image. By
42 | default, this image-viewer window will be 800 (width) by 600 (height)
43 | pixels, larger images will be scrollable to fit this window.}
44 |
45 | \item{pointSize}{Changes the default size of a clickable data-point on the
46 | image. Size is the radius in pixels (default is 6).}
47 |
48 | \item{animateDelay}{When \code{"TRUE"}, creates a very small pause when
49 | plotting individual automated extractions -- giving an animated effect.}
50 |
51 | \item{groupNames}{A vector of the default eight names specifying the
52 | labels of each group. Default labels are fruit themed. Can be any size,
53 | but GUI will only print first 9 characters.}
54 |
55 | \item{groupColors}{A vector of the default eight color names specifying the
56 | coloring of each group. Are in color-names format, but can also be HEX.}
57 | }
58 | \value{
59 | A console message of where saved .csv or *_juicr.html files are located.
60 | }
61 | \description{
62 | A GUI screener to help scan and evaluate the title and abstract of studies to
63 | be included in a systematic review or meta-analysis. A description of GUI
64 | options and layout is found here: \url{http://lajeunesse.myweb.usf.edu/juicr/juicr_basic_vignette_v0.1.html}.
65 | }
66 | \note{
67 | \strong{Installation and troubleshooting}\cr\cr For Mac OS users,
68 | installation is sometimes not straighforward as this GUI requires the
69 | Tcl/Tk GUI toolkit to be installed. You can get this toolkit by making sure
70 | the latest X11 application (xQuartz) is installed, see here:
71 | \url{https://www.xquartz.org/}. More information on
72 | installation is found in \code{juicrs}'s vignette.
73 | }
74 | \examples{
75 | \dontrun{
76 |
77 | GUI_juicr(system.file("images", "Kortum_and_Acymyan_2013_Fig4.jpg", package = "juicr"))
78 |
79 | }
80 |
81 | }
82 |
--------------------------------------------------------------------------------
/vignettes/juicr_basic_vignette_v0.1.Rmd:
--------------------------------------------------------------------------------
1 |
2 | ---
3 | title: |
4 |

Automated, semi-automated, and manual extraction of numerical data from scientific images with the ***juicr*** package for *R* [BETA]
5 | author: '[Marc J. Lajeunesse](http://lajeunesse.myweb.usf.edu/)'
6 | date: University of South Florida, April 28th 2021 (vignette v. 0.1 for juicr v.0.1)
7 | output:
8 | html_document:
9 | smart: no
10 | toc: yes
11 | word_document:
12 | toc: yes
13 | pdf_document:
14 | keep_tex: yes
15 | latex_engine: xelatex
16 | toc: yes
17 | ---
18 |
19 |
20 | ```{r set-options, echo=FALSE, cache=FALSE}
21 | options(width = 800)
22 | ```
23 |
24 |
25 | 
26 |
27 |
28 |
29 | # Introduction
30 |
31 | ------
32 |
33 | The **juicr** package for [R](http://www.r-project.org/) contains tools for facilitating the extractions of numerical data from scientific images -- like scatter-plots, bar-plots, and other charts/figures found in publications. Below is a description of functionalities and layout.
34 |
35 | Updates to this vignette will be posted on our [research webpage at USF](http://lajeunesse.myweb.usf.edu/).
36 |
37 | For the source code of **juicr** see: .
38 |
39 |
40 |
41 | ### Acknowledgements
42 |
43 | I thank everyone who watched my *YouTube* course [Hard-boiled Synthesis](https://www.youtube.com/c/LajeunesseLab) and reached out to me about using **juicr** -- you gave me the final push to complete this old project I started way back and abandoned in 2017!
44 |
45 |
46 |
47 | ### How to cite? TBA, but for this beta version maybe:
48 |
49 |
50 | Lajeunesse, M.J. (2021) Squeezing data from scientific images with the **juicr** package for *R*. R package, v. 0.1. [CRAN](http://cran.r-project.org/web/packages/juicr/index.html)
51 |
52 |
53 |
54 |
55 | ### Installation and Dependencies
56 | **juicr** has an external dependency that needs to be installed and loaded prior to use in R. This is the **EBImage** R package (Pau *et al.* 2010) available only from [Bioconductor](https://www.bioconductor.org) repository.
57 |
58 | To properly install **juicr**, use the following script in R:
59 |
60 | ```{r eval=FALSE}
61 | # first load Bioconductor resources needed to install the EBImage package
62 | # and accept/download all of its dependencies
63 | install.packages("BiocManager");
64 | BiocManager::install("EBImage")
65 |
66 | # then load juicr
67 | library(juicr)
68 | ```
69 |
70 | Finally for Mac OS users, installation is sometimes not straighforward, as the `GUI_juicr()` requires the Tcl/Tk GUI toolkit to be installed. You can get this toolkit by making sure that the latest X11 application (xQuartz) is installed from here: [xquartz.macosforge.org](http://xquartz.macosforge.org/landing/).
71 |
72 |
73 |
74 |
75 | ### Report a bug? Have comments or suggestions?
76 |
77 | Please email me any bugs, comments, or suggestions and I'll try to include them in future releases: . Also try to include **juicr** in the subject heading of your email. Finally, I'm open to almost anything, but expect a lag before I respond and/or new additions are added.
78 |
79 |
80 |
81 |
82 | ### Video tutorials on Youtube
83 |
84 | [](https://youtu.be/tiL-gZgN9Qk)
85 |
86 |
87 | 
88 |
89 |
90 |
91 | # GUI layout and loading images
92 |
93 | ------
94 |
95 | When running **juicr** without a file specified, the layout is simple:
96 |
97 |
98 | 
99 |
100 |
101 | Images can be loaded into **juicr** using the *add new image(s)* button. Alternatively one or many images (as a vector of file name strings) can be included via console:
102 |
103 | ```{r eval=FALSE}
104 | # then load juicr
105 | library(juicr)
106 | GUI_juicr("Kam_et_al_2003_Fig2.jpg")
107 | # or many files
108 | GUI_juicr(c("Kam_et_al_2003_Fig2.jpg", "Kortum_and_Acymyan_2013_Fig4.jpg"))
109 | ```
110 |
111 | If an image is loaded, the main window will look like this:
112 |
113 | 
114 |
115 |
116 | 
117 |
118 |
119 | # Automated extraction functionality
120 |
121 | ------
122 | The center section of **juicr** includes two options: *automated* or *manual* tools for extracting data. The automated tools include:
123 |
124 |
125 | 
126 |
127 |
128 | By pressing the large **juicr-hex** button, it will first determine automatically plot type (e.g., scatter or bar for now), and then begin attempts to extract data from the image. Successes of extractions, such as whether the y-axis was detected, will presented as an orange orange (detected), and failures as gray oranges (not-detected). Also included a suite of semi-automated tinkering options to help **juicr** detect the desired image objects.
129 |
130 |
131 | 
132 |
133 |
134 |
135 | # Manual extraction functionality
136 |
137 | ------
138 | A large diversity of manual extraction tools are available:
139 |
140 | 
141 |
142 | 
143 |
144 |
145 |
146 | 
147 |
148 |
149 | # Saving extractions and generating reports
150 |
151 | ------
152 | Currently, **juicr** offers extractions to be saved as .csv files, copied into clipboards, saved as postscript .eps files, or as a fully-embedded and standalone .html file that retains all information of extractions, **juicr** setup, and image modifications for permanent and replicable storage of data.
153 |
154 | Here is an example of a report:
155 |
156 |
157 |
158 |
--------------------------------------------------------------------------------
/R/GUI_juicr.R:
--------------------------------------------------------------------------------
1 | #' A GUI screener to quickly code candidate studies for inclusion/exclusion into
2 | #' a systematic review or meta-analysis.
3 | #'
4 | #' A GUI screener to help scan and evaluate the title and abstract of studies to
5 | #' be included in a systematic review or meta-analysis. A description of GUI
6 | #' options and layout is found here: \url{http://lajeunesse.myweb.usf.edu/juicr/juicr_basic_vignette_v0.1.html}.
7 | #'
8 | #' @param theFigureFile An optional file name and location of a .jpg, .png, or
9 | #' .tiff file containing the scientific image/plot/chart/figure to pre-load
10 | #' in the GUI. Within the GUI there is also a button to select the image file.
11 | #' Images in other formats should be converted to .png prior to using juicr.
12 | #' @param theJuicrFile An optional file name and location of a *_juicr.html
13 | #' report containing extractions and images from a previous juicr
14 | #' session to pre-load into the GUI. Within the GUI there is also a button to
15 | #' select an .html file.
16 | #' @param standardizeTheImage When \code{"TRUE"}, all large images are
17 | #' standardized to a common size with a width specified
18 | #' by \code{"standardSize"}. When \code{"FALSE"}, the image is unaltered
19 | #' in size.
20 | #' @param standardSize The common width in pixels for standardizing large images;
21 | #' default is a width of 1000 pixels.
22 | #' @param figureWindowSize Specifies the window size containing the image. By
23 | #' default, this image-viewer window will be 800 (width) by 600 (height)
24 | #' pixels, larger images will be scrollable to fit this window.
25 | #' @param pointSize Changes the default size of a clickable data-point on the
26 | #' image. Size is the radius in pixels (default is 6).
27 | #' @param animateDelay When \code{"TRUE"}, creates a very small pause when
28 | #' plotting individual automated extractions -- giving an animated effect.
29 | #' @param groupNames A vector of the default eight names specifying the
30 | #' labels of each group. Default labels are fruit themed. Can be any size,
31 | #' but GUI will only print first 9 characters.
32 | #' @param groupColors A vector of the default eight color names specifying the
33 | #' coloring of each group. Are in color-names format, but can also be HEX.
34 | #'
35 | #'
36 | #' @return A console message of where saved .csv or *_juicr.html files are located.
37 | #'
38 | #' @examples \dontrun{
39 | #'
40 | #' GUI_juicr(system.file("images", "Kortum_and_Acymyan_2013_Fig4.jpg", package = "juicr"))
41 | #'
42 | #'}
43 | #'
44 | #' @note \strong{Installation and troubleshooting}\cr\cr For Mac OS users,
45 | #' installation is sometimes not straighforward as this GUI requires the
46 | #' Tcl/Tk GUI toolkit to be installed. You can get this toolkit by making sure
47 | #' the latest X11 application (xQuartz) is installed, see here:
48 | #' \url{https://www.xquartz.org/}. More information on
49 | #' installation is found in \code{juicrs}'s vignette.
50 | #'
51 | #' @import tcltk utils
52 | #' @importFrom stats sd
53 | #' @importFrom grDevices rgb col2rgb
54 | #' @importFrom XML readHTMLTable htmlParse xpathSApply xmlAttrs
55 | #' @importFrom RCurl base64Encode base64Decode
56 | #'
57 | #' @export GUI_juicr
58 |
59 | GUI_juicr <- function(theFigureFile = "",
60 | theJuicrFile = "",
61 | standardizeTheImage = TRUE,
62 | standardSize = 1000,
63 | figureWindowSize = c(800, 600),
64 | pointSize = 6,
65 | animateDelay = TRUE,
66 | groupNames = c("orangeGrp",
67 | "berryGrp",
68 | "cherryGrp",
69 | "plumGrp",
70 | "kiwiGrp",
71 | "bananaGrp",
72 | "grapeGrp",
73 | "pruneGrp"),
74 | groupColors = c("dark orange",
75 | "turquoise3",
76 | "tomato3",
77 | "orchid",
78 | "yellow green",
79 | "goldenrod2",
80 | "plum4",
81 | "saddle brown")
82 | ) {
83 |
84 | # if EBImage not installed, do it
85 | .juicrDependencies("EBImage")
86 |
87 | getIMG <- function(aFilename) return(system.file("images", aFilename, package = "juicr"))
88 |
89 |
90 | # checks if tcltk is available and can be loaded
91 | if(requireNamespace("tcltk", quietly = TRUE)) {
92 |
93 | juicrLogo <- tcltk::tcl("image", "create", "photo",
94 | file = getIMG("juicr_hex_small_juicing2.png"))
95 |
96 | #############################################################################
97 | # START: ABOUT WINDOW: citation and authorship info
98 |
99 | aboutJuicrWindow <- function() {
100 |
101 | aboutWindow <- tcltk::tktoplevel()
102 | tcltk::tktitle(aboutWindow) <- "about juicr"
103 | aboutFrame <- tcltk::ttkframe(aboutWindow)
104 | juicrVignette <- tcltk::tkbutton(aboutFrame, text = "go to vignette for help",
105 | width = 180, compound = 'top',
106 | image = juicrLogo,
107 | command = function() utils::browseURL("http://lajeunesse.myweb.usf.edu/metagear/metagear_basic_vignette.html"))
108 | aboutText <- tcltk::tktext(aboutFrame,
109 | font = "Consolas 10",
110 | height = 20, width = 75,
111 | tabs = "0.9i left")
112 | theText <- paste0(c("citation for 0.1 (beta):\n\n",
113 | " Lajeunesse M.J. (2021) juicr: extract data from images. v.0.1 R package\n",
114 | "\n\nabout author:\n\n",
115 | " Marc J. Lajeunesse, Associate Professor\n",
116 | " Department of Integrative Biology\n",
117 | " University of South Florida, Tampa USA\n",
118 | " homepage: http://lajeunesse.myweb.usf.edu/\n",
119 | " email: lajeunesse@usf.edu\n",
120 | " twitter: @LajeunesseLab\n",
121 | " youtube: https://www.youtube.com/c/LajeunesseLab\n",
122 | "\n\nacknowledgements:\n\n",
123 | " Citrus icons provided by: https://icons8.com"),
124 | collapse = "")
125 | tcltk::tkinsert(aboutText, "1.0", theText)
126 | tcltk::tkgrid(juicrVignette, aboutText, padx = 5)
127 | tcltk::tkpack(aboutFrame)
128 |
129 | }
130 |
131 | # END: ABOUT WINDOW: citation and authorship info
132 | #################################################
133 |
134 |
135 |
136 | #############################################################################
137 | # START: DEBUG: totally unnecessary but necessary print
138 | # function for within-GUI debugging
139 |
140 | debugGUI <- function(aTCLTKObject)
141 | message(paste0(as.character(aTCLTKObject), " "))
142 |
143 | # END: DEBUG: totally unnecessary but necessary print
144 | # function for within-GUI debugging
145 | #################################################
146 |
147 |
148 | #############################################################################
149 | # START: GUI THEME & ICONS
150 |
151 | tcltk::.Tcl("ttk::style configure TNotebook -background white")
152 | tcltk::.Tcl("ttk::style configure TNotebook.Tab -background white")
153 | tcltk::.Tcl("ttk::style configure TNotebook.Tab -foreground grey")
154 | tcltk::.Tcl("ttk::style configure TNotebook -focuscolor grey")
155 | tcltk::.Tcl("ttk::style configure TFrame -background white")
156 | tcltk::.Tcl("ttk::style configure TLabelframe -background white")
157 | tcltk::.Tcl("ttk::style configure TLabelframe.Label -background white")
158 | tcltk::.Tcl("ttk::style configure TLabelframe.Label -foreground grey")
159 | tcltk::.Tcl("ttk::style configure TLabel -background white")
160 | tcltk::.Tcl("ttk::style configure TLabel -foreground grey")
161 | tcltk::.Tcl("ttk::style configure TCombobox -background white")
162 | tcltk::.Tcl("ttk::style configure TCombobox -foreground grey")
163 | tcltk::.Tcl("ttk::style configure TScrollbar -background white")
164 | tcltk::.Tcl("ttk::style configure TButton -foreground black")
165 | tcltk::.Tcl("ttk::style configure message.TButton -foreground orange")
166 | tcltk::.Tcl("ttk::style configure TButton -background white")
167 | tcltk::.Tcl("ttk::style map TButton -background [list active white]")
168 | tcltk::.Tcl("ttk::style map TButton -foreground [list active {green}]")
169 |
170 | imageScatter <- tcltk::tcl("image", "create", "photo", file = getIMG("scatterPlot_orange.png"))
171 | imageBarX <- tcltk::tcl("image", "create", "photo", file = getIMG("barPlotX_orange.png"))
172 | imageBarY <- tcltk::tcl("image", "create", "photo", file = getIMG("barPlotY_orange.png"))
173 | imageRegression <- tcltk::tcl("image", "create", "photo", file = getIMG("regressionPlot_orange.png"))
174 | imageLine <- tcltk::tcl("image", "create", "photo", file = getIMG("linePlot_orange.png"))
175 | orangeJuice <- tcltk::tcl("image", "create", "photo", file = getIMG("drinkjuice.png"))
176 | orangeJuiceSave <- tcltk::tcl("image", "create", "photo", file = getIMG("drinkjuice_nostraw.png"))
177 | juicrLogoJuicing <- tcltk::tcl("image", "create", "photo", file = getIMG("juicr_hex_small_juicing.png"))
178 | juiceBottle <- tcltk::tcl("image", "create", "photo", file = getIMG("juiceBottle.png"))
179 | circlePoint1 <- tcltk::tcl("image", "create", "photo", file = getIMG("pointCircle1.png"))
180 | circlePoint5 <- tcltk::tcl("image", "create", "photo", file = getIMG("pointCircle5.png"))
181 | circlePoint15 <- tcltk::tcl("image", "create", "photo", file = getIMG("pointCircle15.png"))
182 | circlePoint15Closed <-tcltk::tcl("image", "create", "photo", file = getIMG("pointCircleOpen.png"))
183 | diamondPoint15 <- tcltk::tcl("image", "create", "photo", file = getIMG("pointDiamond.png"))
184 | squarePoint15 <- tcltk::tcl("image", "create", "photo", file = getIMG("pointSquare.png"))
185 | lineQualityHigh <- tcltk::tcl("image", "create", "photo", file = getIMG("antialiasedLOW.png"))
186 | lineQualityLow <- tcltk::tcl("image", "create", "photo", file = getIMG("antialiasedHIGH.png"))
187 | barPoint1 <- tcltk::tcl("image", "create", "photo", file = getIMG("barShort5.png"))
188 | barPoint5 <- tcltk::tcl("image", "create", "photo", file = getIMG("barShort11.png"))
189 | barPoint15 <- tcltk::tcl("image", "create", "photo", file = getIMG("barShort19.png"))
190 | theOrange <- tcltk::tcl("image", "create", "photo", file = getIMG("orange_ico.png"))
191 | theOrangeGrey <- tcltk::tcl("image", "create", "photo", file = getIMG("orange_grey_ico_test.png"))
192 | autoPointImage <- tcltk::tcl("image", "create", "photo", file = getIMG("autoClustertest.png"))
193 | clusterPointImage <- tcltk::tcl("image", "create", "photo", file = getIMG("autoPointtest.png"))
194 | theBarImage <- tcltk::tcl("image", "create", "photo", file = getIMG("barLine11test.png"))
195 | leftArrowImage <- tcltk::tcl("image", "create", "photo", file = getIMG("left.png"))
196 | rightArrowImage <- tcltk::tcl("image", "create", "photo", file = getIMG("right.png"))
197 | hoverImage <- tcltk::tcl("image", "create", "photo", file = getIMG("hover2.png"))
198 | orangeJuiceFlip <- tcltk::tcl("image", "create", "photo")
199 | tcltk::tcl(orangeJuiceFlip, "copy", orangeJuice, "-subsample", -1, 1)
200 | juiceContainer <- tcltk::tcl("image", "create", "photo", file = getIMG("icons8-juice-bottle-96.png"))
201 | juiceContainerSmall <- tcltk::tcl("image", "create", "photo")
202 | tcltk::tcl(juiceContainerSmall, "copy", juiceContainer, "-subsample", 2, 2)
203 | juiceContainerSmall <- tcltk::tcl("image", "create", "photo")
204 | tcltk::tcl(juiceContainerSmall, "copy", juiceContainer, "-subsample", 2, 2)
205 | juicrLogoSmall <- tcltk::tcl("image", "create", "photo", file = getIMG("juicr_hex_small_juicing3.png"))
206 |
207 |
208 | # END: GUI THEME & ICONS
209 | ########################
210 |
211 |
212 | #############################################################################
213 | # START: juicr figure frame
214 |
215 | createJuicrFrame <- function(aJuicrWindow,
216 | theFigureFile,
217 | theStandardizedImageFile,
218 | theFigure,
219 | theFigureJuiced,
220 | animateDelay,
221 | openJuicrFile = "",
222 | aPointColor = groupColors[1],
223 | aTempPointColor = groupColors[1]) {
224 |
225 | # crate juicr environment to store globals
226 | juicr.env <- new.env()
227 | set_juicr <- function(aJuicrVar, aValue) assign(aJuicrVar, aValue, envir = juicr.env)
228 | get_juicr <- function(aJuicrVar) get(aJuicrVar, envir = juicr.env)
229 |
230 | set_juicr("pointColor", aPointColor)
231 | set_juicr("tempPointColor", aTempPointColor)
232 |
233 | #############################################################################
234 | # START: automated extractor functions
235 |
236 | asOdd <- function(aNum) return(ceiling(aNum) - ceiling(aNum) %% 2 + 1)
237 |
238 | autoX <- function(anEBImage,
239 | binary_threshold = 0.6,
240 | object_threshold = 0.2,
241 | axis_length = 0.5,
242 | asY = FALSE) {
243 |
244 | if(asY == TRUE) anEBImage <- EBImage::transpose(EBImage::flop(anEBImage))
245 |
246 | # convert to binary, remove where axis unlikely, extract
247 | aBinaryFigure <- 1 - (EBImage::channel(anEBImage, mode = "gray") > binary_threshold)
248 | aBinaryFigure[, 1:round(dim(aBinaryFigure)[2] * axis_length)] <- 0
249 | lineBrush <- EBImage::makeBrush(asOdd(dim(aBinaryFigure)[2] * axis_length), shape = "line", angle = 0)
250 | aPaintedPlot <- EBImage::opening(EBImage::distmap(aBinaryFigure), lineBrush)
251 | allDetectedX <- EBImage::watershed(EBImage::distmap(aPaintedPlot), tolerance = object_threshold, ext = 1)
252 |
253 | # if none found, repeat with alternative parameterization
254 | adjust <- 0.1
255 | while((max(allDetectedX) == 0) && (adjust != 0.5)) {
256 | aBinaryFigure <- 1 - (EBImage::channel(anEBImage, mode = "gray") > (binary_threshold + adjust))
257 | aBinaryFigure[, 1:round(dim(aBinaryFigure)[2] * (axis_length - adjust))] <- 0
258 | lineBrush <- EBImage::makeBrush(asOdd(dim(aBinaryFigure)[2] * (axis_length - adjust)), shape = "line", angle = 0)
259 | aPaintedPlot <- EBImage::opening(EBImage::distmap(aBinaryFigure), lineBrush)
260 | allDetectedX <- EBImage::watershed(EBImage::distmap(aPaintedPlot), tolerance = object_threshold, ext = 1)
261 | adjust <- adjust + 0.1
262 | }
263 |
264 | # eliminate all but the longest & lowermost
265 | if(max(allDetectedX) > 1) {
266 | allLines <- EBImage::computeFeatures.shape(allDetectedX)
267 | exclusionList <- which(allLines[, "s.area"] != max(allLines[, "s.area"]))
268 | allDetectedX <- EBImage::rmObjects(allDetectedX, exclusionList)
269 | theCoordinates <- EBImage::computeFeatures.moment(allDetectedX)
270 | exclusionList <- which(theCoordinates[, "m.cy"] != max(theCoordinates[, "m.cy"]))
271 | allDetectedX <- EBImage::rmObjects(allDetectedX, exclusionList)
272 | }
273 |
274 | if(max(allDetectedX) == 0) return(FALSE)
275 | if(asY == TRUE) return(EBImage::flop(EBImage::transpose(allDetectedX)))
276 | return(allDetectedX)
277 | }
278 |
279 | theAutoPointsAreEmpty <- FALSE
280 | theAutoPointsShape <- "disc"
281 |
282 | autoPoints <- function(anEBImage,
283 | theX,
284 | theY,
285 | point_shape = "disc",
286 | point_empty = FALSE,
287 | point_size = 3,
288 | point_tolerance = 2,
289 | binary_threshold = 0.63) {
290 |
291 | aBinaryFigure <- 1 - (EBImage::channel(anEBImage, mode = "gray") > binary_threshold)
292 |
293 | # erase everything outside detected axis
294 | Xcontr <- EBImage::ocontour(theX)
295 | Xmax <- max(Xcontr[[1]][, 1]); Xmin <- min(Xcontr[[1]][, 1])
296 | aBinaryFigure[c(1:(Xmin + 3), Xmax:dim(aBinaryFigure)[1]), ] <- 0
297 | Ycontr <- EBImage::ocontour(theY)
298 | Ymax <- max(Ycontr[[1]][, 2]); Ymin <- min(Ycontr[[1]][, 2])
299 | aBinaryFigure[, c(1:(Ymin + 3), Ymax:dim(aBinaryFigure)[2]) ] <- 0
300 |
301 | if(point_empty == TRUE) {
302 | aBinaryFigure <- EBImage::fillHull(EBImage::watershed(EBImage::distmap(aBinaryFigure), tolerance = 2, ext = 1))
303 | }
304 |
305 | # paint candidate points with box, disc, or diamond brush with defined size
306 | pointBrush <- EBImage::makeBrush(size = asOdd(point_size), shape = point_shape, step = TRUE)
307 | aPaintedFigure <- EBImage::opening(EBImage::distmap(aBinaryFigure), pointBrush)
308 | detectedPoints <- EBImage::watershed(EBImage::distmap(aPaintedFigure), tolerance = point_tolerance, ext = 1)
309 |
310 | # if none found, repeat with alternative parameterization
311 | adjust <- 1
312 | while((max(detectedPoints) == 0) && (adjust != 11)) {
313 | pointBrush <- EBImage::makeBrush(size = asOdd(adjust), shape = point_shape, step = TRUE)
314 | aPaintedFigure <- EBImage::opening(EBImage::distmap(aBinaryFigure), pointBrush)
315 | detectedPoints <- EBImage::watershed(EBImage::distmap(aPaintedFigure), tolerance = point_tolerance, ext = 1)
316 | adjust <- adjust + 2
317 | }
318 |
319 | if(max(detectedPoints) == 0) return(FALSE)
320 | return(detectedPoints)
321 | }
322 |
323 | getClusters <- function(theDectedPoints) {
324 | isCluster <- mean(EBImage::computeFeatures.shape(theDectedPoints)[, "s.area"]) +
325 | stats::sd(EBImage::computeFeatures.shape(theDectedPoints)[, "s.area"])
326 | thenonClusters <- which(EBImage::computeFeatures.shape(theDectedPoints)[, "s.area"] < isCluster)
327 | return(EBImage::rmObjects(theDectedPoints, thenonClusters))
328 | }
329 |
330 | getNonClusters <- function(theDectedPoints) {
331 | isCluster <- mean(EBImage::computeFeatures.shape(theDectedPoints)[, "s.area"]) +
332 | stats::sd(EBImage::computeFeatures.shape(theDectedPoints)[, "s.area"])
333 | theClusters <- which(EBImage::computeFeatures.shape(theDectedPoints)[, "s.area"] >= isCluster)
334 | return(EBImage::rmObjects(theDectedPoints, theClusters))
335 | }
336 |
337 | getCoord_detectedAxis <- function(aDetectedImage) {
338 | theAxis <- EBImage::ocontour(aDetectedImage)
339 | coordX1 <- min(theAxis[[1]][, 1]); coordY1 <- min(theAxis[[1]][, 2]);
340 | coordX2 <- max(theAxis[[1]][, 1]); coordY2 <- max(theAxis[[1]][, 2]);
341 | return(c(coordX1, coordY1, coordX2, coordY2))
342 | }
343 |
344 | getCoord_detectedPoints <- function(aDetectedImage) {
345 | return(EBImage::computeFeatures.moment(aDetectedImage)[, 1:2])
346 | }
347 |
348 | resolve_crossedAxes <- function(theX, theY, asY = FALSE) {
349 | theCoordX <- getCoord_detectedAxis(theX)
350 | theCoordY <- getCoord_detectedAxis(theY)
351 |
352 | if(asY == TRUE) return(c(theCoordY[1], theCoordY[2], theCoordY[3], theCoordX[2]))
353 | return(c(theCoordY[3], theCoordX[2], theCoordX[3], theCoordX[4]))
354 |
355 | }
356 |
357 | autoBars <- function(anEBImage,
358 | theX,
359 | theY,
360 | binary_threshold = 0.6,
361 | object_threshold = 0.1,
362 | bar_length = 9,
363 | axis_length = 0.5,
364 | asY = FALSE) {
365 |
366 | if(asY == TRUE) anEBImage <- EBImage::transpose(EBImage::flop(anEBImage))
367 |
368 | aBinaryFigure <- 1 - (EBImage::channel(anEBImage, mode = "gray") > binary_threshold)
369 |
370 | # erase everything outside detected axis
371 | Xcontr <- EBImage::ocontour(theX)
372 | Xmax <- max(Xcontr[[1]][, 1]); Xmin <- min(Xcontr[[1]][, 1])
373 | aBinaryFigure[c(1:(Xmin + 3), Xmax:dim(aBinaryFigure)[1]), ] <- 0
374 | Ycontr <- EBImage::ocontour(theY)
375 | Ymax <- max(Ycontr[[1]][, 2]); Ymin <- min(Ycontr[[1]][, 2])
376 | aBinaryFigure[, c(1:(Ymin + 3), Ymax:dim(aBinaryFigure)[2]) ] <- 0
377 |
378 | # detect all horizontal lines (the caps of column bars and error bars)
379 | lineBrush <- EBImage::makeBrush(bar_length, shape = "line", angle = 0)
380 | verticalLinesOnlyFigure <- EBImage::opening(EBImage::distmap(aBinaryFigure), lineBrush)
381 | extractedBars <- EBImage::watershed(EBImage::distmap(verticalLinesOnlyFigure), object_threshold)
382 |
383 | # clean up detections: exclude large lines detected, based on % X axis length
384 | theLines <- EBImage::computeFeatures.shape(extractedBars)
385 | exclusionList <- which(theLines[, "s.area"] >= dim(extractedBars)[1] * axis_length)
386 | extractedBars <- EBImage::rmObjects(extractedBars, exclusionList)
387 |
388 | ## clean up detections: outliers
389 | #extractedBars <- figure_removeOutlyingPoints(extractedBars, extractedXFigure, extractedYFigure)
390 |
391 | if(max(extractedBars) == 0) return(FALSE)
392 | if(asY == TRUE) return(EBImage::flop(EBImage::transpose(extractedBars)))
393 | return(extractedBars)
394 |
395 | }
396 |
397 | # END: automated extractor functions
398 | #######################################################
399 |
400 |
401 |
402 | #############################################################################
403 | # START: figure point vector and manipulation functions
404 |
405 | set_juicr("figurePoints", c())
406 |
407 | point_indexToPoint <- function(aPointIndex) return(as.numeric(gsub("pointID", "", aPointIndex)))
408 | point_pointToIndex <- function(aPoint) return(paste0("pointID", aPoint))
409 |
410 | point_add <- function() {
411 | allPoints <- get_juicr("figurePoints")
412 | newPoint <- ifelse(length(allPoints) == 0, 1, max(allPoints) + 1)
413 | set_juicr("figurePoints", c(allPoints, newPoint))
414 | return(newPoint)
415 | }
416 |
417 | point_delete <- function(aPoint) {
418 | allPoints <- get_juicr("figurePoints")
419 | set_juicr("figurePoints", allPoints[!allPoints %in% aPoint])
420 | }
421 | point_getTags <- function(aPointIndex) return(as.character(tcl(mainFigureCanvas, "gettags", aPointIndex)))
422 | point_getAll <- function() return(get_juicr("figurePoints"))
423 | point_getType <- function(aPointIndex) return(as.character(point_getTags(aPointIndex)[3]))
424 | point_getAuto <- function(aPointIndex) return(as.character(point_getTags(aPointIndex)[2]))
425 |
426 | point_getAllbyType <- function(pointType = "point") {
427 | allThePoints <- point_pointToIndex(point_getAll())
428 | theTags <- as.character(sapply(allThePoints, function(x) paste0(point_getType(x))))
429 | return(allThePoints[theTags == pointType])
430 | }
431 |
432 | point_getAllbyAuto <- function(pointType = "auto") {
433 | allThePoints <- point_pointToIndex(point_getAll())
434 | theTags <- as.character(sapply(allThePoints, function(x) paste0(point_getAuto(x))))
435 | return(allThePoints[theTags == pointType])
436 | }
437 |
438 | point_getCoordinates <- function(aPointIndex) {
439 | theCoord <- as.numeric(as.character(tkcoords(mainFigureCanvas, aPointIndex)))
440 | theType <- point_getType(aPointIndex)
441 | if(theType == "point") {
442 | if(point_getAuto(aPointIndex) == "autobar") {
443 | theCoordinates <- c(theCoord[1] + 8, theCoord[2] + 3)
444 | } else if(point_getAuto(aPointIndex) == "auto") {
445 | theCoordinates <- c(theCoord[1] + 8, theCoord[2] + 8)
446 | } else if(point_getAuto(aPointIndex) == "cluster") {
447 | theCoordinates <- c(theCoord[1] + 8, theCoord[2] + 8)
448 | } else {
449 | theCoordinates <- c(theCoord[1] + pointSize, theCoord[2] + pointSize)
450 | }
451 | } else if(theType == "error") {
452 | theCoordinates <- c(theCoord[1], theCoord[2], theCoord[3], theCoord[4])
453 | } else if (theType == "regression") {
454 | theCoordinates <- c(theCoord[1], theCoord[2], theCoord[3], theCoord[4])
455 | } else if (theType == "line") {
456 | theCoordinates <- theCoord
457 | }
458 | return(theCoordinates)
459 | }
460 |
461 | point_getCalibratedValue <- function(aPointIndex, theAxis = "x", coordinates = FALSE) {
462 |
463 | theCoord <- point_getCoordinates(aPointIndex)[ifelse(theAxis == "x", 1, 2)]
464 | if(coordinates == TRUE) return(theCoord)
465 |
466 | if(theAxis == "x") {
467 | xMaxValue <- as.numeric(text_get(figureXmaxDisplay))
468 | xMinValue <- as.numeric(text_get(figureXminDisplay))
469 | if(all(is.na(c(xMaxValue, xMinValue)))) return(theCoord)
470 | }
471 |
472 | if(theAxis == "y") {
473 | yMaxValue <- as.numeric(text_get(figureYmaxDisplay))
474 | yMinValue <- as.numeric(text_get(figureYminDisplay))
475 | if(all(is.na(c(yMaxValue, yMinValue)))) return(theCoord)
476 | }
477 |
478 | return(coordinate_calibrate(theCoord, theAxis))
479 | }
480 |
481 | isEmpty_calibrate <- function(theAxis = "x") {
482 | if(theAxis == "x") {
483 | if(text_get(figureXmaxDisplay) == "" || text_get(figureXminDisplay) == "") return(TRUE)
484 | } else {
485 | if(text_get(figureYmaxDisplay) == "" || text_get(figureYminDisplay) == "") return(TRUE)
486 | }
487 | return(FALSE)
488 | }
489 |
490 | coordinate_calibrate <- function(theCoor, theAxis = "x") {
491 | if(theAxis == "x") {
492 | maxValue <- as.numeric(text_get(figureXmaxDisplay))
493 | minValue <- as.numeric(text_get(figureXminDisplay))
494 | if(all(is.na(c(maxValue, minValue)))) return(NA)
495 | posLine <- as.numeric(tkcoords(mainFigureCanvas, x_calibrationLine))[c(1, 3)]
496 | calibrated <- (theCoor - min(posLine)) * ((maxValue - minValue)/(max(posLine) - min(posLine))) + minValue
497 | } else {
498 | maxValue <- as.numeric(text_get(figureYmaxDisplay))
499 | minValue <- as.numeric(text_get(figureYminDisplay))
500 | if(all(is.na(c(maxValue, minValue)))) return(NA)
501 | posLine <- as.numeric(tkcoords(mainFigureCanvas, y_calibrationLine))[c(2, 4)]
502 | calibrated <- (max(posLine) - theCoor) * ((maxValue - minValue)/(max(posLine) - min(posLine))) + minValue
503 | }
504 | return(calibrated)
505 | }
506 |
507 | point_pixelError <- function(theAxis = "x") {
508 | if(theAxis == "x") {
509 | maxValue <- as.numeric(text_get(figureXmaxDisplay))
510 | minValue <- as.numeric(text_get(figureXminDisplay))
511 | posLine <- as.numeric(tkcoords(mainFigureCanvas, x_calibrationLine))[c(1, 3)]
512 | } else {
513 | maxValue <- as.numeric(text_get(figureYmaxDisplay))
514 | minValue <- as.numeric(text_get(figureYminDisplay))
515 | posLine <- as.numeric(tkcoords(mainFigureCanvas, y_calibrationLine))[c(2, 4)]
516 | }
517 | return((maxValue - minValue)/(max(posLine) - min(posLine)))
518 | }
519 |
520 | text_get <- function(aTextIndex) paste(as.character(tcl(aTextIndex, "get", "1.0", "end")), collapse = " ")
521 |
522 | # END: figure point vector and manipulation functions
523 | #######################################################
524 |
525 |
526 |
527 | #############################################################################
528 | # START: text functions for data tabulation
529 |
530 | displayData <- function(tabDelimitedText, caption) {
531 |
532 | extractionWindow <- tcltk::tktoplevel()
533 |
534 | tcltk::tktitle(extractionWindow) <- paste0(caption, " via juicr")
535 |
536 | dataFrame <- tcltk::ttklabelframe(extractionWindow,
537 | text = caption,
538 | padding = 2)
539 | dataScroll <- tcltk::ttkscrollbar(extractionWindow, orient = "vertical",
540 | command = function(...) tcltk::tkyview(dataText, ...))
541 | dataText <- tcltk::tktext(dataFrame,
542 | font = "Consolas 10",
543 | height = 20, width = 160, tabs = "0.9i left",
544 | yscrollcommand = function(...) tcltk::tkset(dataScroll, ...))
545 |
546 | aText <- tcltk::tkinsert(dataText, "1.0", tabDelimitedText)
547 | tcltk::tktag.add(dataText, "aTag1", "1.0", "1.end")
548 | tcltk::tktag.configure(dataText, "aTag1", font = "Consolas 10 bold")
549 | tcltk::tkgrid(dataText, dataScroll, sticky = "nsew")
550 |
551 | buttonFrame <- tcltk::ttkframe(dataFrame)
552 | clipboardButton <- tcltk::ttkbutton(buttonFrame, width = 12,
553 | text = " copy to\nclipboard",
554 | command = function() utils::writeClipboard(tabDelimitedText))
555 | removeFormatingButton <- tcltk::ttkbutton(buttonFrame, width = 12,
556 | text = " remove\nformatting",
557 | command = function() {
558 | tcltk::tkconfigure(dataText, tabs = "")
559 | tcltk::tktag.delete(dataText, "aTag1")
560 | })
561 | csvButton <- tcltk::ttkbutton(buttonFrame, width = 12,
562 | text = "save as\n .csv",
563 | command = function() {
564 | fileContents <- switch(caption,
565 | "point/sample extractions" = "points",
566 | "bar extractions" = "bars",
567 | "axis line extractions" = "axes",
568 | "error bar extractions" = "error_bars",
569 | "regression line extractions" = "regressions",
570 | "line extractions" = "lines"
571 | )
572 | theNewFile <- paste0(tools::file_path_sans_ext(basename(theFigureFile)),
573 | "_juicr_extracted_",
574 | fileContents,
575 | ".csv")
576 | tcltk::tkconfigure(closeButton, text = paste0("SAVING AS:\n", theNewFile), style = "message.TButton")
577 | tcltk::tcl("update"); Sys.sleep(2);
578 |
579 | someTable <- read.table(text = tabDelimitedText,
580 | sep = "\t", header = TRUE)
581 | write.csv(someTable,
582 | file = theNewFile,
583 | row.names = FALSE)
584 |
585 | tcltk::tkconfigure(closeButton, text = " close\nwindow", style = "TButton")
586 |
587 | })
588 |
589 | closeButton <- tcltk::ttkbutton(buttonFrame, width = 40,
590 | text = " close\nwindow",
591 | command = function() tcltk::tkdestroy(extractionWindow))
592 | tcltk::tkgrid(removeFormatingButton, clipboardButton, csvButton, closeButton)
593 | tcltk::tkgrid(buttonFrame)
594 | tcltk::tkpack(dataFrame)
595 |
596 | }
597 |
598 | get_ExtractionList <- function() {
599 |
600 | fullNotes <- ""
601 | for(i in 1:(as.integer(tcltk::tclvalue(tcltk::tcl(theNotes, "index", "end"))) - 1)) {
602 | lineNotes <- tcltk::tcl(theNotes, "get", paste0(i, ".0"), paste0(i, ".end"))
603 | fullNotes <- paste0(fullNotes, paste0(lineNotes, collapse = " "), "\n")
604 | }
605 |
606 | allExtractions <- list("points" = getPointExtractions(sendToFile = TRUE),
607 | "bars" = getPointExtractions(sendToFile = TRUE),
608 | "axes" = getPointExtractions(sendToFile = TRUE),
609 | "error_bars" = getPointExtractions(sendToFile = TRUE),
610 | "regressions" = getPointExtractions(sendToFile = TRUE),
611 | "lines" = getPointExtractions(sendToFile = TRUE),
612 | "info" = data.frame("file" = theFigureFile,
613 | "date" = Sys.Date(),
614 | "notes" = fullNotes,
615 | "figureXminDisplay" = as.character(text_get(figureXminDisplay)),
616 | "figureXmaxDisplay" = as.character(text_get(figureXmaxDisplay)),
617 | "figureXcaptionDisplay" = as.character(text_get(figureXcaptionDisplay)),
618 | "figureXunitsDisplay" = as.character(text_get(figureXunitsDisplay)),
619 | "figureYminDisplay" = as.character(text_get(figureYminDisplay)),
620 | "figureYmaxDisplay" = as.character(text_get(figureYmaxDisplay)),
621 | "figureYcaptionDisplay" = as.character(text_get(figureYcaptionDisplay)),
622 | "figureYunitsDisplay" = as.character(text_get(figureYunitsDisplay))))
623 | return(allExtractions)
624 |
625 | }
626 |
627 |
628 | set_juicr("theSavedFile", "not saved this session")
629 |
630 | point_summary <- function() {
631 | #TO DO: OUT OF BOUNDS VALUES
632 |
633 | theNumberOfPoints <- length(point_getAll())
634 | theSummary <- "EXTRACTION SUMMARY\n---------------------------------\n"
635 | theSummary <- paste0(theSummary, "number of extractions = ", theNumberOfPoints, "\n")
636 | if(theNumberOfPoints == 0) return(theSummary)
637 |
638 | allThePoints <- point_pointToIndex(point_getAll())
639 | xMaxValue <- suppressWarnings(as.numeric(text_get(figureXmaxDisplay)))
640 | xMinValue <- suppressWarnings(as.numeric(text_get(figureXminDisplay)))
641 | yMaxValue <- suppressWarnings(as.numeric(text_get(figureYmaxDisplay)))
642 | yMinValue <- suppressWarnings(as.numeric(text_get(figureYminDisplay)))
643 |
644 | pointCoorX <- sapply(allThePoints, function(x) point_getCoordinates(x)[1])
645 | pointCoorY <- sapply(allThePoints, function(x) point_getCoordinates(x)[2])
646 |
647 | if(all(is.na(c(xMaxValue, yMaxValue, xMinValue, yMinValue)))) {
648 | xCalibrated <- signif(pointCoorX, 4)
649 | yCalibrated <- signif(pointCoorY, 4)
650 | } else {
651 |
652 | theSummary <- paste0(theSummary, "pixel error per extraction:\n")
653 |
654 | if(length(xMaxValue) == 0 && length(xMinValue) == 0) {
655 | xCalibrated <- NA
656 | } else {
657 | xCalibrated <- sapply(allThePoints, function(x) suppressWarnings(point_getCalibratedValue(x, theAxis = "x")))
658 |
659 | theSummary <- paste0(theSummary, " x = ",
660 | paste0(text_get(figureXcaptionDisplay), sep = " ", collapse = ""),
661 | paste0("(", text_get(figureXunitsDisplay),")", sep = " "),
662 | "+/- ", signif(point_pixelError("x"), 4), "\n")
663 | }
664 |
665 | if(length(yMaxValue) == 0 && length(yMinValue) == 0) {
666 | yCalibrated <- NA
667 | } else {
668 | yCalibrated <- sapply(allThePoints, function(x)suppressWarnings(point_getCalibratedValue(x, theAxis = "y")))
669 | theSummary <- paste0(theSummary, " y = ",
670 | paste0(text_get(figureYcaptionDisplay), sep = " ", collapse = ""),
671 | paste0("(", text_get(figureYunitsDisplay),")", sep = " "),
672 | "+/- ", signif(point_pixelError("y"), 4), "\n")
673 | }
674 |
675 | }
676 | theSummary <- paste0(theSummary, "saved in file =\n")
677 | theSummary <- paste0(theSummary, " ", get_juicr("theSavedFile"), "\n")
678 | theSummary <- paste0(theSummary, "---------------------------------\n")
679 | theSummary <- paste0(theSummary, "x\ty\ttype\tgroup\n")
680 | theSums <- paste0(signif(xCalibrated,4), "\t",
681 | signif(yCalibrated,4), "\t",
682 | sapply(allThePoints, function(x) paste0(abbreviate(point_getTags(x)[3], 3, dot = TRUE), "\t")),
683 | sapply(allThePoints, function(x) paste0(point_getTags(x)[2], "\n")))
684 |
685 | return(paste0(c(theSummary, theSums), collapse = ""))
686 | }
687 |
688 |
689 | getPointExtractions <- function(sendToWindow = FALSE, sendToFile = FALSE, coordinates = FALSE) {
690 |
691 | allThePoints <- point_getAllbyType("point")
692 | if(length(allThePoints) == 0) return(data.frame())
693 | xCoordinate <- sapply(allThePoints, function(x) suppressWarnings(point_getCalibratedValue(x, theAxis = "x", coordinates = TRUE)))
694 | yCoordinate <- sapply(allThePoints, function(x) suppressWarnings(point_getCalibratedValue(x, theAxis = "y", coordinates = TRUE)))
695 | xCalibrated <- sapply(allThePoints, function(x) suppressWarnings(point_getCalibratedValue(x, theAxis = "x")))
696 | yCalibrated <- sapply(allThePoints, function(x) suppressWarnings(point_getCalibratedValue(x, theAxis = "y")))
697 |
698 | theSummary <- paste0(c("x-calibrated\tx-label\tx-units\tx-coord\ty-calibrated\ty-label\ty-units\ty-coord\tgroup\n",
699 | paste0(
700 | signif(as.numeric(xCalibrated), 7), "\t",
701 | text_get(figureXcaptionDisplay), "\t",
702 | text_get(figureXunitsDisplay), "\t",
703 | as.numeric(xCoordinate), "\t",
704 | signif(as.numeric(yCalibrated), 7), "\t",
705 | text_get(figureYcaptionDisplay), "\t",
706 | text_get(figureYunitsDisplay), "\t",
707 | as.numeric(yCoordinate), "\t",
708 | sapply(allThePoints, function(x) paste0(point_getTags(x)[2], "\n"))
709 | )), collapse = "")
710 |
711 | if(sendToFile == TRUE) return(read.table(text = theSummary, sep = "\t", header = TRUE))
712 | if(sendToWindow == TRUE) displayData(theSummary, "point/sample extractions")
713 | return(theSummary)
714 | }
715 |
716 | getBarExtractions <- function(sendToWindow = FALSE, sendToFile = FALSE) {
717 |
718 | allThePoints <- point_getAllbyAuto("autobar")
719 | if(length(allThePoints) == 0) return(data.frame())
720 |
721 | allXCoords <- sapply(allThePoints, function(x) point_getCalibratedValue(x, theAxis = "x"))
722 | allYCoords <- sapply(allThePoints, function(x) point_getCalibratedValue(x, theAxis = "y"))
723 |
724 | numberBars = length(allXCoords) %/% 3
725 | if(max(allXCoords[1:3]) - min(allXCoords[1:3]) >= 3) numberBars = length(allXCoords) %/% 2
726 |
727 | theValues <- data.frame(matrix(allYCoords, nrow = numberBars, byrow = TRUE))
728 | for(i in 1:nrow(theValues))
729 | theValues[i, ] <- theValues[i, (sort(as.numeric(theValues[i,]), index.return = TRUE)$ix)]
730 |
731 | if(numberBars == length(allXCoords) %/% 3) {
732 | theSummary <- paste0(c("bar\tlower\tupper\tgroup\n",
733 | paste0(
734 | signif(as.numeric(theValues[, 2]), 7), "\t",
735 | signif(as.numeric(theValues[, 1]), 7), "\t",
736 | signif(as.numeric(theValues[, 3]), 7), "\t",
737 | paste0("autoBar", 1:nrow(theValues)), "\n"
738 | )), collapse = "")
739 | } else {
740 | theSummary <- paste0(c("bar\terror\tgroup\n",
741 | paste0(
742 | signif(as.numeric(theValues[, 1]), 7), "\t",
743 | signif(as.numeric(theValues[, 2]), 7), "\t",
744 | paste0("autoBar", 1:nrow(theValues)), "\n"
745 | )), collapse = "")
746 | }
747 |
748 | if(sendToFile == TRUE) return(read.table(text = theSummary, sep = "\t", header = TRUE))
749 | if(sendToWindow == TRUE) displayData(theSummary, "bar extractions")
750 | return(theSummary)
751 | }
752 |
753 | getErrorExtractions <- function(sendToWindow = FALSE, sendToFile = FALSE) {
754 |
755 | allThePoints <- point_getAllbyType("error")
756 | if(length(allThePoints) == 0) return(data.frame())
757 |
758 | errorCoords <- lapply(allThePoints, function(x) point_getCoordinates(x))
759 |
760 | theValues <- lapply(errorCoords,
761 | function(x) {
762 | if(x[1] == x[3]) {
763 | theMean <- suppressWarnings(coordinate_calibrate(x[2], "y"))
764 | theError <- suppressWarnings(abs(theMean - coordinate_calibrate(x[4], "y")))
765 | theType <- "y"
766 | meanX <- x[1]
767 | meanY <- x[2]
768 | errorX <- x[3]
769 | errorY <- x[4]
770 | } else {
771 | theMean <- suppressWarnings(coordinate_calibrate(x[1], "x"))
772 | theError <- suppressWarnings(abs(theMean - coordinate_calibrate(x[3], "x")))
773 | theType <- "x"
774 | meanX <- x[1]
775 | meanY <- x[2]
776 | errorX <- x[3]
777 | errorY <- x[4]
778 | }
779 | return(c(mean = theMean,
780 | error = theError,
781 | type = theType,
782 | mx = meanX,
783 | my = meanY,
784 | ex = errorX,
785 | ey = errorY))
786 | })
787 |
788 | theValues <- data.frame(matrix(unlist(theValues), nrow = length(theValues), byrow = TRUE))
789 |
790 | theSummary <- paste0(c("mean\terror\taxis\tgroup\tmean.x\tmean.y\terror.x\terror.y\n",
791 | paste0(
792 | signif(as.numeric(theValues[, 1]), 7), "\t",
793 | signif(as.numeric(theValues[, 2]), 7), "\t",
794 | theValues[, 3], "\t",
795 | sapply(allThePoints, function(x) paste0(point_getTags(x)[2], "\t")),
796 | theValues[, 4], "\t",
797 | theValues[, 5], "\t",
798 | theValues[, 6], "\t",
799 | theValues[, 7], "\n"
800 | )), collapse = "")
801 |
802 | if(sendToFile == TRUE) return(read.table(text = theSummary, sep = "\t", header = TRUE))
803 | if(sendToWindow == TRUE) displayData(theSummary, "error bar extractions")
804 | return(theSummary)
805 | }
806 |
807 | getRegressionExtractions <- function(sendToWindow = FALSE, sendToFile = FALSE) {
808 |
809 | allThePoints <- point_getAllbyType("regression")
810 | if(length(allThePoints) == 0) return(data.frame())
811 |
812 | regressionCoords <- lapply(allThePoints, function(x) point_getCoordinates(x))
813 |
814 | theValues <- lapply(regressionCoords,
815 | function(x) {
816 | x1 <- suppressWarnings(coordinate_calibrate(x[1], "x"))
817 | y1 <- suppressWarnings(coordinate_calibrate(x[2], "y"))
818 | x2 <- suppressWarnings(coordinate_calibrate(x[3], "x"))
819 | y2 <- suppressWarnings(coordinate_calibrate(x[4], "y"))
820 | slope <- (y2 - y1)/(x2 - x1)
821 | intercept <- y1 - slope * x1
822 | x1coord <- x[1]
823 | y1coord <- x[2]
824 | x2coord <- x[3]
825 | y2coord <- x[4]
826 | return(c(x1, y1, x2, y2, slope, intercept, x1coord, y1coord, x2coord, y2coord))
827 | })
828 |
829 | theValues <- data.frame(matrix(unlist(theValues), nrow = length(theValues), byrow = TRUE))
830 |
831 | theSummary <- paste0(c("x1\ty1\tx2\ty2\tslope\tintercept\tx1.coord\ty1.coord\tx2.coord\ty2.coord\tgroup\n",
832 | paste0(
833 | signif(as.numeric(theValues[, 1]), 7), "\t",
834 | signif(as.numeric(theValues[, 2]), 7), "\t",
835 | signif(as.numeric(theValues[, 3]), 7), "\t",
836 | signif(as.numeric(theValues[, 4]), 7), "\t",
837 | signif(as.numeric(theValues[, 5]), 7), "\t",
838 | signif(as.numeric(theValues[, 6]), 7), "\t",
839 | theValues[, 7], "\t",
840 | theValues[, 8], "\t",
841 | theValues[, 9], "\t",
842 | theValues[, 10], "\t",
843 | sapply(allThePoints, function(x) paste0(point_getTags(x)[2], "\n"))
844 | )), collapse = "")
845 |
846 | if(sendToFile == TRUE) return(read.table(text = theSummary, sep = "\t", header = TRUE))
847 | if(sendToWindow == TRUE) displayData(theSummary, "regression line extractions")
848 | return(theSummary)
849 | }
850 |
851 | getAxisExtractions <- function(sendToWindow = FALSE, sendToFile = FALSE) {
852 |
853 | theSummary <- paste0(c("coord\tX.axis\tY.axis\n",
854 | paste0(
855 | c("y1", "x1", "y2", "x2"), "\t",
856 | as.numeric(tkcoords(mainFigureCanvas, x_calibrationLine)), "\t",
857 | as.numeric(tkcoords(mainFigureCanvas, y_calibrationLine)), "\n"
858 | )), collapse = "")
859 |
860 | if(sendToFile == TRUE) return(read.table(text = theSummary, sep = "\t", header = TRUE))
861 | if(sendToWindow == TRUE) displayData(theSummary, "axis line extractions")
862 | return(theSummary)
863 | }
864 |
865 | getLineExtractions <- function(sendToWindow = FALSE, sendToFile = FALSE) {
866 |
867 | allThePoints <- point_getAllbyType("line")
868 | if(length(allThePoints) == 0) return(data.frame())
869 |
870 | lineCoords <- lapply(allThePoints, function(x) point_getCoordinates(x))
871 |
872 | allText <- data.frame()
873 | for(i in 1:length(lineCoords)) {
874 | coordMatrix <- matrix(lineCoords[[i]], ncol = 2, byrow = TRUE)
875 | allCoords <- split(coordMatrix, row(coordMatrix))
876 | theValues <- lapply(allCoords,
877 | function(somePoint) {
878 | x <- suppressWarnings(coordinate_calibrate(somePoint[1], "x"))
879 | y <- suppressWarnings(coordinate_calibrate(somePoint[2], "y"))
880 | xcoord <- somePoint[1]
881 | ycoord <- somePoint[2]
882 | return(c(x, y, xcoord, ycoord))
883 | })
884 | someText <- data.frame(matrix(unlist(theValues), nrow = length(theValues), byrow = TRUE),
885 | c(1:length(theValues)),
886 | i,
887 | point_getTags(allThePoints[i])[2])
888 |
889 | if(is.null(dim(allText))) allText <- someText
890 | else allText <- rbind(allText, someText)
891 | }
892 |
893 | theSummary <- paste0(c("x\ty\tx.coord\ty.coord\tlink\tset\tgroup\n",
894 | paste0(
895 | signif(as.numeric(allText[, 1]), 7), "\t",
896 | signif(as.numeric(allText[, 2]), 7), "\t",
897 | allText[, 3], "\t",
898 | allText[, 4], "\t",
899 | signif(as.numeric(allText[, 5]), 7), "\t",
900 | as.character(allText[, 6]), "\t",
901 | as.character(allText[, 7]), "\n"
902 | )), collapse = "")
903 |
904 | if(sendToFile == TRUE) return(read.table(text = theSummary, sep = "\t", header = TRUE))
905 | if(sendToWindow == TRUE) displayData(theSummary, "line extractions")
906 | return(theSummary)
907 | }
908 |
909 | # END: text functions for data tabulation
910 | #########################################
911 |
912 |
913 | ########################################
914 | ## START: plot/figure/main image frame
915 | ########################################
916 |
917 | figureWindow <- tcltk::ttkframe(aJuicrWindow)
918 |
919 | mainFigureWidth <- as.integer(tcltk::tcl("image", "width", theFigure))
920 | mainFigureHeight <- as.integer(tcltk::tcl("image", "height", theFigure))
921 | mainFigureCanvas <- tcltk::tkcanvas(figureWindow, background = "grey95",
922 | width = figureWindowSize[1], height = figureWindowSize[2],
923 | "-scrollregion",
924 | paste(0, 0, mainFigureWidth + 20, mainFigureHeight + 50))
925 | mainFigure <- tcltk::tcl(mainFigureCanvas, "create", "image", 0,0, image = theFigure, anchor = "nw")
926 | #mainFigureXscroll <- tkscrollbar(figureWindow, command = function(...) tcl(mainFigureCanvas, "xview", ...), orient = "horizontal")
927 | #mainFigureYscroll <- tkscrollbar(figureWindow, command = function(...) tcl(mainFigureCanvas, "yview", ...), orient = "vertical")
928 | mainFigureXscroll <- tcltk::tkscrollbar(figureWindow, command = function(...) tcltk::tkxview(mainFigureCanvas, ...), orient = "horizontal")
929 | mainFigureYscroll <- tcltk::tkscrollbar(figureWindow, command = function(...) tcltk::tkyview(mainFigureCanvas, ...), orient = "vertical")
930 | tcltk::tkconfigure(mainFigureCanvas, xscrollcommand = function(...) tcltk::tkset(mainFigureXscroll, ...))
931 | tcltk::tkconfigure(mainFigureCanvas, yscrollcommand = function(...) tcltk::tkset(mainFigureYscroll, ...))
932 |
933 | hoverText <- tcltk::tkcreate(mainFigureCanvas, "text", 0, 0, justify = "left", text = "", fill = "black", font = "Consolas 8")
934 | hoverShadow <- tcltk::tcl(mainFigureCanvas, "create", "image", 0, 0, image = "", anchor = "nw")
935 |
936 | epsButton <- tcltk::tkbutton(mainFigureCanvas, text = "save image as .eps", relief = "groove",
937 | width = 16, command = function(){
938 | tcltk::tkitemconfigure(mainFigureCanvas, epsWindow, state = "hidden")
939 | tcltk::tkitemconfigure(mainFigureCanvas, clearWindow, state = "hidden")
940 | aEspFile <- tcltk::tkgetSaveFile(filetypes = "{{eps postscript files} {.eps}} {{All files} *}",
941 | defaultextension = ".eps",
942 | title = "juicr: save exact copy of image/extractions as postscript file")
943 | tcltk::tcl(mainFigureCanvas, "postscript", file = aEspFile)
944 | tcltk::tkitemconfigure(mainFigureCanvas, epsWindow, state = "normal")
945 | tcltk::tkitemconfigure(mainFigureCanvas, clearWindow, state = "normal")
946 | })
947 | epsWindow <- tcltk::tkcreate(mainFigureCanvas, "window", mainFigureWidth, mainFigureHeight + 10, anchor = "ne", window = epsButton)
948 |
949 | clearButton <- tcltk::tkbutton(mainFigureCanvas, text = "hide extractions", relief = "groove",
950 | width = 13, command = function(){
951 | if(as.character(tcltk::tkcget(clearButton, "-relief")) == "sunken") {
952 | tcltk::tkconfigure(clearButton, relief = "groove")
953 | tcltk::tkitemconfigure(mainFigureCanvas, "extraction", state = "normal")
954 | } else {
955 | tcltk::tkconfigure(clearButton, relief = "sunken")
956 | tcltk::tkitemconfigure(mainFigureCanvas, "extraction", state = "hidden")
957 | }
958 |
959 | })
960 |
961 | clearWindow <- tcltk::tkcreate(mainFigureCanvas, "window", mainFigureWidth - 130, mainFigureHeight + 10, anchor = "ne", window = clearButton)
962 |
963 | tcltk::tkgrid(mainFigureCanvas, mainFigureYscroll, sticky = "news")
964 | tcltk::tkgrid(mainFigureXscroll, sticky = "ew")
965 |
966 | ########################################
967 | ## END: plot/figure/main image frame
968 | ########################################
969 |
970 |
971 |
972 | #################################
973 | ##### START: options notebook
974 | #################################
975 |
976 | notebookFrame <- tcltk::ttknotebook(aJuicrWindow)
977 |
978 | ########################################
979 | ##### START: automated frame in notebook
980 |
981 | automatedWindow <- tcltk::ttkframe(notebookFrame)
982 |
983 | isBarPlot <- function(thePlot,
984 | binary_threshold = 0.98,
985 | object_threshold = 0.1,
986 | bar_length = 0.05) {
987 | anEBImage <- EBImage::transpose(EBImage::flop(thePlot))
988 | aBinaryFigure <- 1 - (EBImage::channel(anEBImage, mode = "gray") > binary_threshold)
989 |
990 | aBinaryFigure[, round(dim(aBinaryFigure)[2] * 0.3):dim(aBinaryFigure)[2] ] <- 0
991 | aBinaryFigure[1:round(dim(aBinaryFigure)[1] * 0.6), ] <- 0
992 | lineBrush <- EBImage::makeBrush(bar_length * dim(aBinaryFigure)[1], shape = "line", angle = 0)
993 | verticalLinesOnlyFigure <- EBImage::opening(EBImage::distmap(aBinaryFigure), lineBrush)
994 | extractedBars <- EBImage::watershed(EBImage::distmap(verticalLinesOnlyFigure), 0.1)
995 | if(max(extractedBars) > 2) return(TRUE)
996 | return(FALSE)
997 | }
998 |
999 | update_X_axis <- function(y1, x1, y2, x2) {
1000 | tcltk::tkcoords(mainFigureCanvas, x_calibrationLine, y1, x1, y2, x2)
1001 | }
1002 |
1003 | update_Y_axis <- function(y1, x1, y2, x2) {
1004 | tcltk::tkcoords(mainFigureCanvas, y_calibrationLine, y1, x1, y2, x2)
1005 | }
1006 |
1007 |
1008 | juiceItReset <- function() {
1009 |
1010 | tcltk::tkconfigure(juiceButton, image = juicrLogoJuicing); tcltk::tcl("update")
1011 |
1012 | if(length(c(as.character(tcltk::tkget(mainFigureCanvas, "autobar")), as.character(tcltk::tkget(mainFigureCanvas, "auto")))) != 0) {
1013 | update_X_axis(1, 1, 1, 1); update_Y_axis(1, 1, 1, 1);
1014 | tcltk::tkconfigure(xorangeLabel, image = theOrangeGrey)
1015 | tcltk::tkconfigure(yorangeLabel, image = theOrangeGrey)
1016 | tcltk::tkconfigure(dataOrangeLabel, image = theOrangeGrey); tcltk::tcl("update")
1017 | allthePoints <- point_getAllbyType("point")
1018 | for(i in 1:length(allthePoints)) {
1019 | if((point_getTags(allthePoints[i])[2] == "autobar") || (point_getTags(allthePoints[i])[2] == "auto") || (point_getTags(allthePoints[i])[2] == "cluster")) {
1020 | point_delete(point_indexToPoint(point_getTags(allthePoints[i])[1]))
1021 | tcltk::tcl(mainFigureCanvas, "delete", point_getTags(allthePoints[i])[1])
1022 | }
1023 | }
1024 | tcltk::tkitemconfigure(txtCanvas, theDataText, text = point_summary())
1025 | }
1026 |
1027 | }
1028 |
1029 |
1030 | animateAutodetection <- function() {
1031 | if(animateDelay != FALSE) {Sys.sleep(0.01); tcltk::tcl("update");}
1032 | }
1033 |
1034 |
1035 |
1036 | juiceIt <- function() {
1037 |
1038 | # reset all
1039 | juiceItReset()
1040 |
1041 | # start axis detections
1042 | detectedX <- autoX(theFigureJuiced, binary_threshold = as.numeric(text_get(qualityDisplay)))
1043 | if(max(detectedX) == 1) {
1044 | theCoordX <- getCoord_detectedAxis(detectedX)
1045 | tcltk::tkitemconfigure(mainFigureCanvas, x_calibrationLine, width = 10, fill = "orange")
1046 |
1047 | update_X_axis(theCoordX[1], min(theCoordX[2], theCoordX[4]), theCoordX[3], min(theCoordX[2], theCoordX[4]))
1048 | tcltk::tkconfigure(xorangeLabel, image = theOrange); tcltk::tcl("update")
1049 | }
1050 |
1051 | detectedY <- autoX(theFigureJuiced, binary_threshold = as.numeric(text_get(qualityDisplay)), asY = TRUE)
1052 | if(max(detectedY) == 1) {
1053 | theCoordY <- getCoord_detectedAxis(detectedY)
1054 | tcltk::tkitemconfigure(mainFigureCanvas, y_calibrationLine, width = 10, fill = "orange")
1055 | update_Y_axis(max(theCoordY[1],theCoordY[3]), theCoordY[2], max(theCoordY[1],theCoordY[3]), theCoordY[4])
1056 | tcltk::tkconfigure(yorangeLabel, image = theOrange); tcltk::tcl("update")
1057 | }
1058 |
1059 | if((max(detectedX) == 1) && (max(detectedY) == 1)) {
1060 | newXCoord <- resolve_crossedAxes(detectedX, detectedY)
1061 | newYCoord <- resolve_crossedAxes(detectedX, detectedY, asY = TRUE)
1062 | update_X_axis(newXCoord[1], min(newXCoord[2], newXCoord[4]), newXCoord[3], min(newXCoord[2], newXCoord[4]))
1063 | update_Y_axis(max(newYCoord[1],newYCoord[3]), newYCoord[2], max(newYCoord[1],newYCoord[3]), newYCoord[4])
1064 | tcltk::tkitemconfigure(mainFigureCanvas, y_calibrationLine, width = 5, fill = "tomato3")
1065 | tcltk::tkitemconfigure(mainFigureCanvas, x_calibrationLine, width = 5, fill = "tomato")
1066 | }
1067 |
1068 | # extract bar or scatter data
1069 | if(isBarPlot(theFigureJuiced) == TRUE) {
1070 | detectedBars <- autoBars(theFigureJuiced, detectedX, detectedY, binary_threshold = as.numeric(text_get(qualityDisplay)), bar_length = as.numeric(text_get(barSizeDisplay)))
1071 | theCoords <- getCoord_detectedPoints(detectedBars)
1072 | theCoords <- theCoords[order(theCoords[, 1]), ]
1073 |
1074 | if(!is.null(theCoords) && (length(theCoords) > 0)) {
1075 | if(!is.null(nrow(theCoords))) {
1076 | for(i in 1:nrow(theCoords)) {autoBar(theCoords[i, 1], theCoords[i, 2]); animateAutodetection();}
1077 | } else {
1078 | autoBar(theCoords[1], theCoords[2]);
1079 | }
1080 | }
1081 | if(max(detectedBars) >= 1) tcltk::tkconfigure(dataOrangeLabel, image = theOrange); tcltk::tcl("update")
1082 |
1083 | } else {
1084 | detectedPoints <- autoPoints(theFigureJuiced, detectedX, detectedY, point_empty = theAutoPointsAreEmpty, point_shape = theAutoPointsShape, point_size = as.numeric(text_get(circleSizeDisplay)))
1085 | if(max(detectedPoints) >= 1) tcltk::tkconfigure(dataOrangeLabel, image = theOrange); tcltk::tcl("update")
1086 |
1087 | allAutoPoints <- getNonClusters(detectedPoints)
1088 | theCoords <- getCoord_detectedPoints(allAutoPoints)
1089 |
1090 | if(!is.null(theCoords) && (length(theCoords) > 0)) {
1091 | if(!is.null(nrow(theCoords))) {
1092 | for(i in 1:nrow(theCoords)) {autoPoint(theCoords[i, 1], theCoords[i, 2]); animateAutodetection();}
1093 | } else {
1094 | autoPoint(theCoords[1], theCoords[2]);
1095 | }
1096 | }
1097 | allAutoClusters <- getClusters(detectedPoints)
1098 | theCoords <- getCoord_detectedPoints(allAutoClusters)
1099 |
1100 | if(!is.null(theCoords) && (length(theCoords) > 0)) {
1101 | if(!is.null(nrow(theCoords))) {
1102 | for(i in 1:nrow(theCoords)) {autoCluster(theCoords[i, 1], theCoords[i, 2]); animateAutodetection();}
1103 | } else {
1104 | autoCluster(theCoords[1], theCoords[2]);
1105 | }
1106 |
1107 | }
1108 | }
1109 |
1110 | tcltk::tkitemconfigure(txtCanvas, theDataText, text = point_summary())
1111 | tcltk::tkconfigure(juiceButton, image = juicrLogo)
1112 | }
1113 |
1114 |
1115 | #### START: juicr automate button
1116 | juiceItCanvas <- tcltk::ttkframe(automatedWindow)
1117 | juiceButton <- tcltk::ttkbutton(juiceItCanvas, text = "juice image for data", width=33, compound = 'top', image = juicrLogo, command = function(){juiceIt();})
1118 | tcltk::tkgrid(juiceButton, padx = 2, pady = 8)
1119 | #### END: juicr automate button
1120 |
1121 | #### END: juicr progress frame
1122 | progressCanvas <- tcltk::ttklabelframe(automatedWindow, text = "Extraction success", padding = 4)
1123 | progressFrame <- tcltk::ttkframe(progressCanvas)
1124 | xorangeLabel <- tcltk::ttklabel(progressFrame, text = "x-axis", compound = 'top', image = theOrangeGrey)
1125 | yorangeLabel<- tcltk::ttklabel(progressFrame, text = "y-axis", compound = 'top', image = theOrangeGrey)
1126 | dataOrangeLabel <- tcltk::ttklabel(progressFrame, text = "data", compound = 'top', image = theOrangeGrey)
1127 | tcltk::tkgrid(xorangeLabel, yorangeLabel, dataOrangeLabel, padx = 7)
1128 | detectionFrame <- tcltk::ttkframe(progressCanvas)
1129 | autoPointLabel <- tcltk::ttklabel(detectionFrame, text = "= detected", compound = "left", image = autoPointImage)
1130 | clusterPointLabel <- tcltk::ttklabel(detectionFrame, text = "= cluster", compound = "left", image = clusterPointImage)
1131 | tcltk::tkgrid(autoPointLabel, clusterPointLabel, padx = 12, pady = 3)
1132 | tcltk::tkgrid(detectionFrame)
1133 | tcltk::tkgrid(progressFrame)
1134 | #### END: juicr progress frame
1135 |
1136 | #### START: point options frame
1137 | figureTypeCanvas <- tcltk::ttklabelframe(automatedWindow, text = "Point detection options", padding = 6)
1138 | sizeFrame <- tcltk::ttkframe(figureTypeCanvas)
1139 | circleSizeLabel <- tcltk::ttklabel(sizeFrame, text = "= size", width = 7)
1140 | circleSmallButton <- tcltk::tkbutton(sizeFrame, text = "smallest", relief = "groove", image = circlePoint1, command = function(...) {tcltk::tkdelete(circleSizeDisplay, "0.0", "end"); tcltk::tkinsert(circleSizeDisplay, "1.0", as.character(1)); tcltk::tkconfigure(circleSmallButton, relief = "sunken"); tcltk::tkconfigure(circleMediumButton, relief = "groove"); tcltk::tkconfigure(circleBigButton, relief = "groove");} )
1141 | circleMediumButton <- tcltk::tkbutton(sizeFrame, text = "medium", relief = "groove", image = circlePoint5, command = function(...) {tcltk::tkdelete(circleSizeDisplay, "0.0", "end"); tcltk::tkinsert(circleSizeDisplay, "1.0", as.character(5)); tcltk::tkconfigure(circleSmallButton, relief = "groove"); tcltk::tkconfigure(circleMediumButton, relief = "sunken"); tcltk::tkconfigure(circleBigButton, relief = "groove");} )
1142 | tcltk::tkconfigure(circleMediumButton, relief = "sunken")
1143 | circleBigButton <- tcltk::tkbutton(sizeFrame, text = "big", relief = "groove", image = circlePoint15, command = function(...) {tcltk::tkdelete(circleSizeDisplay, "0.0", "end"); tcltk::tkinsert(circleSizeDisplay, "1.0", as.character(15)); tcltk::tkconfigure(circleSmallButton, relief = "groove"); tcltk::tkconfigure(circleMediumButton, relief = "groove"); tcltk::tkconfigure(circleBigButton, relief = "sunken");} )
1144 | circleSizeDisplay <- tcltk::tktext(sizeFrame, foreground = "tomato", height = 1, width = 4)
1145 | tcltk::tkinsert(circleSizeDisplay, "1.0", as.character(5))
1146 | tcltk::tkgrid(circleSmallButton, circleMediumButton, circleBigButton, circleSizeLabel, circleSizeDisplay, padx=3)
1147 | shapeFrame <- tcltk::ttkframe(figureTypeCanvas)
1148 | circleShapeLabel <- tcltk::ttklabel(shapeFrame, text = "= shape", width = 7)
1149 | circleCircleButton <- tcltk::tkbutton(shapeFrame, text = "circle", relief = "groove", image = circlePoint15, command = function(...) {theAutoPointsShape <- "disc"; tcltk::tkconfigure(circleCircleButton, relief = "sunken"); tcltk::tkconfigure(circleDiamondButton, relief = "groove"); tcltk::tkconfigure(circleSquareButton, relief = "groove");})
1150 | tcltk::tkconfigure(circleCircleButton, relief = "sunken")
1151 | circleDiamondButton <- tcltk::tkbutton(shapeFrame, text = "diamond", relief = "groove", image = diamondPoint15, command = function(...) {theAutoPointsShape <- "diamond"; tcltk::tkconfigure(circleCircleButton, relief = "groove"); tcltk::tkconfigure(circleDiamondButton, relief = "sunken"); tcltk::tkconfigure(circleSquareButton, relief = "groove");})
1152 | circleSquareButton <- tcltk::tkbutton(shapeFrame, text = "square", relief = "groove", image = squarePoint15, command = function(...) {theAutoPointsShape <- "box"; tcltk::tkconfigure(circleCircleButton, relief = "groove"); tcltk::tkconfigure(circleDiamondButton, relief = "groove"); tcltk::tkconfigure(circleSquareButton, relief = "sunken");})
1153 | tcltk::tkgrid(circleCircleButton, circleDiamondButton, circleSquareButton, circleShapeLabel, padx=3, pady = 3)
1154 | styleFrame <- tcltk::ttkframe(figureTypeCanvas)
1155 | styleLabel <- tcltk::ttklabel(shapeFrame, text = "= style", width = 7)
1156 | circleClosedButton <- tcltk::tkbutton(shapeFrame, text = "closed", relief = "groove", image = circlePoint15, command = function(...) {theAutoPointsAreEmpty <- FALSE; tcltk::tkconfigure(circleClosedButton, relief = "sunken"); tcltk::tkconfigure(circleOpenButton, relief = "groove");})
1157 | connectLabel <- tcltk::ttklabel(shapeFrame, text = "or")
1158 | tcltk::tkconfigure(circleClosedButton, relief = "sunken")
1159 | circleOpenButton <- tcltk::tkbutton(shapeFrame, text = "open", relief = "groove", image = circlePoint15Closed, command = function(...) {theAutoPointsAreEmpty <- TRUE; tcltk::tkconfigure(circleClosedButton, relief = "groove"); tcltk::tkconfigure(circleOpenButton, relief = "sunken");})
1160 | tcltk::tkgrid(circleClosedButton, connectLabel, circleOpenButton, styleLabel, padx=3)
1161 |
1162 | tcltk::tkgrid(shapeFrame, sticky = "w")
1163 | tcltk::tkgrid(styleFrame, sticky = "w")
1164 | tcltk::tkgrid(sizeFrame, sticky = "w")
1165 | #tkgrid(clusterPointLabel, sticky = "w" )
1166 |
1167 | #### END: point options frame
1168 |
1169 | #### START: line options frame
1170 | lineTypeCanvas <- tcltk::ttklabelframe(automatedWindow, text = "Axis detection options", padding = 6)
1171 | lineFrame <- tcltk::ttkframe(lineTypeCanvas)
1172 | lineQualityLabel <- tcltk::ttklabel(lineFrame, text = "= quality", width = 9)
1173 | highQualityButton <- tcltk::tkbutton(lineFrame, text = "smallest", relief = "groove", width = 21, height = 21, image = lineQualityHigh, command = function(...) {tcltk::tkdelete(qualityDisplay, "0.0", "end"); tcltk::tkinsert(qualityDisplay, "1.0", as.character(0.6)); tcltk::tkconfigure(highQualityButton, relief = "sunken"); tcltk::tkconfigure(lowQualityButton, relief = "groove");} )
1174 | tcltk::tkconfigure(highQualityButton, relief = "sunken")
1175 | lineConnectLabel <- tcltk::ttklabel(lineFrame, text = "or")
1176 | lowQualityButton <- tcltk::tkbutton(lineFrame, text = "medium", relief = "groove", width = 21, height = 21, image = lineQualityLow, command = function(...) {tcltk::tkdelete(qualityDisplay, "0.0", "end"); tcltk::tkinsert(qualityDisplay, "1.0", as.character(0.4)); tcltk::tkconfigure(highQualityButton, relief = "groove"); tcltk::tkconfigure(lowQualityButton, relief = "sunken");} )
1177 | qualityDisplay <- tcltk::tktext(lineFrame, foreground = "tomato", height = 1, width = 4)
1178 | tcltk::tkinsert(qualityDisplay, "1.0", as.character(0.6))
1179 |
1180 | tcltk::tkgrid(highQualityButton, lineConnectLabel, lowQualityButton, lineQualityLabel, qualityDisplay, padx=3)
1181 | tcltk::tkgrid(lineFrame, sticky = "w")
1182 | #### END: line options frame
1183 |
1184 | #### START: bar options frame
1185 | barTypeCanvas <- tcltk::ttklabelframe(automatedWindow, text = "Bar detection options", padding = 6)
1186 | barFrame <- tcltk::ttkframe(barTypeCanvas)
1187 | barSizeLabel <- tcltk::ttklabel(barFrame, text = "= size", width = 7)
1188 | barSmallButton <- tcltk::tkbutton(barFrame, text = "smallest", relief = "groove", image = barPoint1, command = function(...) {tcltk::tkdelete(barSizeDisplay, "0.0", "end"); tcltk::tkinsert(barSizeDisplay, "1.0", as.character(3)); tcltk::tkconfigure(barSmallButton, relief = "sunken"); tcltk::tkconfigure(barMediumButton, relief = "groove"); tcltk::tkconfigure(barBigButton, relief = "groove");})
1189 | barMediumButton <- tcltk::tkbutton(barFrame, text = "medium", relief = "groove", image = barPoint5, command = function(...) {tcltk::tkdelete(barSizeDisplay, "0.0", "end"); tcltk::tkinsert(barSizeDisplay, "1.0", as.character(9)); tcltk::tkconfigure(barSmallButton, relief = "groove"); tcltk::tkconfigure(barMediumButton, relief = "sunken"); tcltk::tkconfigure(barBigButton, relief = "groove");})
1190 | tcltk::tkconfigure(barMediumButton, relief = "sunken")
1191 | barBigButton <- tcltk::tkbutton(barFrame, text = "big", relief = "groove", image = barPoint15, command = function(...) {tcltk::tkdelete(barSizeDisplay, "0.0", "end"); tcltk::tkinsert(barSizeDisplay, "1.0", as.character(19)); tcltk::tkconfigure(barSmallButton, relief = "groove"); tcltk::tkconfigure(barMediumButton, relief = "groove"); tcltk::tkconfigure(barBigButton, relief = "sunken");})
1192 | barSizeDisplay <- tcltk::tktext(barFrame, foreground = "tomato", height = 1, width = 4)
1193 | tcltk::tkinsert(barSizeDisplay, "1.0", as.character(9))
1194 | tcltk::tkgrid(barSmallButton, barMediumButton, barBigButton, barSizeLabel, barSizeDisplay, padx=3)
1195 | tcltk::tkgrid(barFrame, sticky = "w")
1196 | #### END: bar options frame
1197 |
1198 | tcltk::tkgrid(juiceItCanvas, padx = 24, pady = 3)
1199 | tcltk::tkgrid(progressCanvas)
1200 | tcltk::tkgrid(lineTypeCanvas)
1201 | tcltk::tkgrid(figureTypeCanvas)
1202 | tcltk::tkgrid(barTypeCanvas)
1203 |
1204 | tcltk::tkgrid(automatedWindow)
1205 |
1206 | ##### END: automated frame in notebook
1207 | ########################################
1208 |
1209 |
1210 | ########################################
1211 | ##### START: manual frame in notebook
1212 |
1213 | manualWindow <- tcltk::ttkframe(aJuicrWindow)
1214 |
1215 | #### START: zoom frame
1216 | zoomFrame <- tcltk::ttkframe(manualWindow)
1217 | zoomCanvas <- tcltk::tkcanvas(zoomFrame, width = 225, height = 225)
1218 | zoomFigure <- tcltk::tcl("image", "create", "photo")
1219 | tcltk::tcl(zoomFigure, "copy", theFigure, "-from", 0, 0, 77, 77, "-zoom", 3)
1220 | zoomWidth <- as.integer(tcltk::tcl("image", "width", zoomFigure))
1221 | zoomHeight <- as.integer(tcltk::tcl("image", "height", zoomFigure))
1222 | zoomImage <- tcltk::tcl(zoomCanvas, "create", "image", 0, 0, image = zoomFigure, anchor = "nw")
1223 | tcltk::tkcreate(zoomCanvas, "rec", (zoomWidth - 1)/2 - 1, (zoomHeight - 1)/2 - 1, (zoomWidth - 1)/2 + 1, (zoomHeight - 1)/2 + 1, outline = "DarkOrange1", fill = "DarkOrange1")
1224 | tcltk::tkcreate(zoomCanvas, "line", (zoomWidth - 1)/2 - 30, (zoomHeight - 1)/2, (zoomWidth - 1)/2 - 16, (zoomHeight - 1)/2, width = 3, fill = "turquoise3")
1225 | tcltk::tkcreate(zoomCanvas, "line", (zoomWidth - 1)/2 + 30, (zoomHeight - 1)/2, (zoomWidth - 1)/2 + 16, (zoomHeight - 1)/2, width = 3, fill = "turquoise3")
1226 | tcltk::tkcreate(zoomCanvas, "line", (zoomWidth - 1)/2, (zoomHeight - 1)/2 - 30, (zoomWidth - 1)/2, (zoomHeight - 1)/2 - 16, width = 3, fill = "turquoise3")
1227 | tcltk::tkcreate(zoomCanvas, "line", (zoomWidth - 1)/2, (zoomHeight - 1)/2 + 30, (zoomWidth - 1)/2, (zoomHeight - 1)/2 + 16, width = 3, fill = "turquoise3")
1228 |
1229 | coordTypes <- c("pixels", "data"); theValue <- tcltk::tclVar("NA");
1230 | pixelComboBox <- tcltk::ttkcombobox(zoomFrame, value = coordTypes, textvariable = theValue, width = 6, font = "Consolas 8")
1231 | tcltk::tkcreate(zoomCanvas, "window", 5, 206, anchor = "nw", window = pixelComboBox)
1232 | tcltk::tkset(pixelComboBox, coordTypes[1])
1233 | theCOORD <- sprintf("(x,y)=(%5s,%5s)", "NA", "NA")
1234 | zoomText <- tcltk::tkcreate(zoomCanvas, "text", 159, 215, justify = "left", text = theCOORD, fill = "grey", font = "Consolas 9")
1235 |
1236 | tcltk::tkgrid(zoomCanvas, padx = 7, pady = 5)
1237 | #### END: zoom frame
1238 |
1239 | #### START: figure type frame
1240 | figureTypeCanvas <- tcltk::ttklabelframe(manualWindow, text = "plot-type (scatter, error bar, other)", padding = 8)
1241 | scatterPlotButton <- tcltk::tkbutton(figureTypeCanvas,
1242 | command = function(){
1243 | set_juicr("x_error", FALSE); set_juicr("y_error", FALSE); set_juicr("x_regression", FALSE); set_juicr("x_connected", FALSE)
1244 | tcltk::tkconfigure(scatterPlotButton, relief = "sunken"); tcltk::tkconfigure(barPlotButton, relief = "raised"); tcltk::tkconfigure(linePlotButton, relief = "raised");
1245 | tcltk::tkpack.forget(manualWindowItems[4]); tcltk::tkpack.forget(manualWindowItems[5]); tcltk::tkpack(manualWindowItems[3], after = manualWindowItems[2]);
1246 | tcltk::tkcoords(mainFigureCanvas, x_errorLine, 1, 1, 1, 1); tcltk::tkcoords(mainFigureCanvas, y_errorLine, 1, 1, 1, 1);
1247 | tcltk::tkcoords(mainFigureCanvas, x_regressionLine, 1, 1, 1, 1);
1248 | }, text = "scatter", image = imageScatter)
1249 | tcltk::tkconfigure(scatterPlotButton, relief = "sunken")
1250 | barPlotButton <- tcltk::tkbutton(figureTypeCanvas,
1251 | command = function(){
1252 | set_juicr("x_error", FALSE); set_juicr("y_error", TRUE); set_juicr("x_regression", FALSE); set_juicr("x_connected", FALSE)
1253 | tcltk::tkconfigure(scatterPlotButton, relief = "raised"); tcltk::tkconfigure(barPlotButton, relief = "sunken"); tcltk::tkconfigure(linePlotButton, relief = "raised");
1254 | tcltk::tkpack.forget(manualWindowItems[3]); tcltk::tkpack.forget(manualWindowItems[5]); tcltk::tkpack(manualWindowItems[4], after = manualWindowItems[2])
1255 | }, text = "error", image = imageBarX)
1256 | linePlotButton <- tcltk::tkbutton(figureTypeCanvas,
1257 | command = function(){
1258 | set_juicr("y_error", FALSE); set_juicr("x_error", FALSE); set_juicr("x_regression", FALSE); set_juicr("x_connected", FALSE)
1259 | tcltk::tkconfigure(scatterPlotButton, relief = "raised"); tcltk::tkconfigure(barPlotButton, relief = "raised"); tcltk::tkconfigure(linePlotButton, relief = "sunken");
1260 | tcltk::tkpack.forget(manualWindowItems[3]); tcltk::tkpack.forget(manualWindowItems[4]); tcltk::tkpack(manualWindowItems[5], after = manualWindowItems[2])
1261 | tcltk::tkcoords(mainFigureCanvas, x_errorLine, 1, 1, 1, 1); tcltk::tkcoords(mainFigureCanvas, y_errorLine, 1, 1, 1, 1);
1262 | tcltk::tkcoords(mainFigureCanvas, x_regressionLine, 1, 1, 1, 1);
1263 | }, text = "line", image = imageLine)
1264 | tcltk::tkgrid(scatterPlotButton, barPlotButton, linePlotButton, padx = 8)
1265 | #### END: figure type frame
1266 |
1267 |
1268 | #### START: figure calibration frame
1269 | figureCalibration <- tcltk::ttklabelframe(manualWindow, text = "plot-to-data calibration\n (min/max = plotted values on axis)", padding = 8)
1270 | calibrationXButton <- tcltk::tkbutton(figureCalibration, command = function(){set_juicr("x_calibrate", TRUE); tcltk::tkconfigure(calibrationXButton, relief = "sunken");}, text = "add\nx-axis", width = 5, height = 2, foreground = "tomato")
1271 | calibrationYButton <- tcltk::tkbutton(figureCalibration, command = function(){set_juicr("y_calibrate", TRUE); tcltk::tkconfigure(calibrationYButton, relief = "sunken");}, text = "add\ny-axis", width = 5, height = 2, foreground = "tomato3")
1272 |
1273 | xcaptionCanvas <- tcltk::ttkframe(figureCalibration)
1274 | figureXminLabel <- tcltk::ttklabel(xcaptionCanvas, text = "min", font = "Arial 8")
1275 | figureXminDisplay <- tcltk::tktext(xcaptionCanvas, foreground = "tomato", height = 1, width = 4)
1276 | figureXmaxLabel <-tcltk:: ttklabel(xcaptionCanvas, text = "max", font = "Arial 8")
1277 | figureXmaxDisplay <- tcltk::tktext(xcaptionCanvas, foreground = "tomato", height = 1, width = 4)
1278 | figureXcaptionLabel <- tcltk::ttklabel(xcaptionCanvas, text = "label", font = "Arial 8")
1279 | figureXcaptionDisplay <- tcltk::tktext(xcaptionCanvas, foreground = "tomato", height = 1, width = 9)
1280 | tcltk::tkinsert(figureXcaptionDisplay, "1.0", "x")
1281 | figureXunitsLabel <- tcltk::ttklabel(xcaptionCanvas, text = "units", font = "Arial 8")
1282 | figureXunitsDisplay <- tcltk::tktext(xcaptionCanvas, foreground = "tomato", height = 1, width = 9)
1283 | tcltk::tkgrid(figureXcaptionLabel, figureXcaptionDisplay, figureXminLabel, figureXminDisplay)
1284 | tcltk::tkgrid(figureXunitsLabel, figureXunitsDisplay, figureXmaxLabel, figureXmaxDisplay)
1285 |
1286 | ycaptionCanvas <- tcltk::ttkframe(figureCalibration)
1287 | figureYminLabel <- tcltk::ttklabel(ycaptionCanvas, text = "min", font = "Arial 8")
1288 | figureYminDisplay <- tcltk::tktext(ycaptionCanvas, foreground = "tomato3", height = 1, width = 4)
1289 | figureYmaxLabel <- tcltk::ttklabel(ycaptionCanvas, text = "max", font = "Arial 8")
1290 | figureYmaxDisplay <- tcltk::tktext(ycaptionCanvas, foreground = "tomato3", height = 1, width = 4)
1291 | figureYcaptionLabel <- tcltk::ttklabel(ycaptionCanvas, text = "label", font = "Arial 8")
1292 | figureYcaptionDisplay <- tcltk::tktext(ycaptionCanvas, foreground = "tomato3", height = 1, width = 9)
1293 | tcltk::tkinsert(figureYcaptionDisplay, "1.0", "y")
1294 | figureYunitsLabel <- tcltk::ttklabel(ycaptionCanvas, text = "units", font = "Arial 8")
1295 | figureYunitsDisplay <- tcltk::tktext(ycaptionCanvas, foreground = "tomato3", height = 1, width = 9)
1296 | tcltk::tkgrid(figureYcaptionLabel, figureYcaptionDisplay, figureYminLabel, figureYminDisplay)
1297 | tcltk::tkgrid(figureYunitsLabel, figureYunitsDisplay, figureYmaxLabel, figureYmaxDisplay)
1298 |
1299 | tcltk::tkgrid(calibrationXButton, xcaptionCanvas)
1300 | tcltk::tkgrid(calibrationYButton, ycaptionCanvas)
1301 |
1302 | x_calibrationLine <- tcltk::tkcreate(mainFigureCanvas, "line", 1, 1, 1, 1, width = 0, fill = "tomato", arrow = "both")
1303 | tcltk::tkaddtag(mainFigureCanvas, "extraction", "withtag", x_calibrationLine)
1304 | #x_calibrate <- FALSE; x_startCalibrate <- FALSE; x_endCalibrate <- FALSE;
1305 | set_juicr("x_calibrate", FALSE); set_juicr("x_startCalibrate", FALSE); set_juicr("x_endCalibrate", FALSE);
1306 |
1307 | y_calibrationLine <- tcltk::tkcreate(mainFigureCanvas, "line", 1, 1, 1, 1, width = 0, fill = "tomato3", arrow = "both")
1308 | tcltk::tkaddtag(mainFigureCanvas, "extraction", "withtag", y_calibrationLine)
1309 | #y_calibrate <- FALSE; y_startCalibrate <- FALSE; y_endCalibrate <- FALSE;
1310 | set_juicr("y_calibrate", FALSE); set_juicr("y_startCalibrate", FALSE); set_juicr("y_endCalibrate", FALSE);
1311 |
1312 | #### END: figure calibration frame
1313 |
1314 |
1315 | #### END: figure error frame
1316 | figureError <- tcltk::ttklabelframe(manualWindow, text = "add points with error bars\n (e.g., bar, whisker, box plots)", padding = 8)
1317 | errorXbutton <- tcltk::tkbutton(figureError, width = 70,
1318 | command = function(){
1319 | set_juicr("x_error", TRUE); set_juicr("y_error", FALSE);
1320 | tcltk::tkconfigure(errorXbutton, relief = "sunken"); tcltk::tkconfigure(errorYbutton, relief = "raised");
1321 | }, text = "add error\n on x", image = imageBarY)
1322 | errorYbutton <- tcltk::tkbutton(figureError, width = 70,
1323 | command = function(){
1324 | set_juicr("x_error", FALSE); set_juicr("y_error", TRUE);
1325 | tcltk::tkconfigure(errorXbutton, relief = "raised"); tcltk::tkconfigure(errorYbutton, relief = "sunken");
1326 | }, text = "add error\n on x", image = imageBarX)
1327 | tcltk::tkconfigure(errorYbutton, relief = "sunken")
1328 | tcltk::tkgrid(errorYbutton, errorXbutton, pady = 4, padx = 5)
1329 |
1330 | theMean <- tcltk::tclVar("NA"); theError <- tcltk::tclVar("NA"); theSample <- tcltk::tclVar("NA"); theAxisType <- tcltk::tclVar("NA");
1331 | meanTypes <- c("mean", "median", "%", "count", "prediction", "sample", "other", "none")
1332 | meanComboBox <- tcltk::ttkcombobox(figureError, value = meanTypes, textvariable = theMean, width = 6)
1333 | tcltk::tkset(meanComboBox, meanTypes[1])
1334 | errorTypes <- c("SD", "SE", "95%CI", "range", "min", "max", "IQR", "LQ", "UQ", "other", "none")
1335 | errorComboBox <- tcltk::ttkcombobox(figureError, value = errorTypes, textvariable = theError, width = 4)
1336 | tcltk::tkset(errorComboBox, errorTypes[1])
1337 | tcltk::tkgrid(meanComboBox, errorComboBox, sticky = "nwse")
1338 |
1339 | x_errorLine <- tcltk::tkcreate(mainFigureCanvas, "line", 1, 1, 1, 1, width = 0, fill = "tomato", arrow = "first")
1340 | set_juicr("x_error", FALSE); set_juicr("x_startError", FALSE); set_juicr("x_endError", FALSE);
1341 |
1342 | y_errorLine <- tcltk::tkcreate(mainFigureCanvas, "line", 1, 1, 1, 1, width = 0, fill = "tomato3", arrow = "first")
1343 | set_juicr("y_error", FALSE); set_juicr("y_startError", FALSE); set_juicr("y_endError", FALSE);
1344 |
1345 |
1346 | #### END: figure error frame
1347 |
1348 | #### START: figure regression frame
1349 | figureLine <- tcltk::ttklabelframe(manualWindow, text = "add lines\n (e.g., regression, line plot)", padding = 0)
1350 |
1351 | regressionButton <- tcltk::tkbutton(figureLine, width = 70,
1352 | command = function(){
1353 | set_juicr("x_regression", TRUE); set_juicr("x_connected", FALSE);
1354 | tcltk::tkconfigure(regressionButton, relief = "sunken"); tcltk::tkconfigure(connectedButton, relief = "raised");
1355 | }, text = "add\nslope", image = imageRegression)
1356 | x_regressionLine <- tcltk::tkcreate(mainFigureCanvas, "line", 1, 1, 1, 1, width = 0, fill = "tomato")
1357 | #x_regression <- FALSE; x_startRegression <- FALSE; x_endRegression <- FALSE;
1358 | set_juicr("x_regression", FALSE); set_juicr("x_startRegression", FALSE); set_juicr("x_endRegression", FALSE);
1359 |
1360 | connectedButton <- tcltk::tkbutton(figureLine, width = 70,
1361 | command = function(){
1362 | set_juicr("x_regression", FALSE); set_juicr("x_connected", TRUE);
1363 | if(as.character(tcltk::tkcget(connectedButton, "-relief")) == "sunken") {
1364 | xyPos <- as.numeric(tcltk::tkcoords(mainFigureCanvas, x_connectedLine))
1365 | createMultiLine(xyPos)
1366 | tcltk::tkcoords(mainFigureCanvas, x_connectedLine, 1,1,1,1)
1367 | set_juicr("x_startConnected", FALSE); set_juicr("x_endConnected", FALSE); set_juicr("x_connected", FALSE);
1368 | updatedSummary <- point_summary()
1369 | tcltk::tkitemconfigure(txtCanvas, theDataText, text = updatedSummary)
1370 | tcltk::tkconfigure(regressionButton, relief = "raised"); tcltk::tkconfigure(connectedButton, relief = "raised");
1371 | } else {
1372 | tcltk::tkconfigure(regressionButton, relief = "raised"); tcltk::tkconfigure(connectedButton, relief = "sunken");
1373 | }
1374 | }, text = "add\n connected line", image = imageLine)
1375 |
1376 | x_connectedLine <- tcltk::tkcreate(mainFigureCanvas, "line", 1, 1, 1, 1, width = 0, fill = "tomato")
1377 | #x_connected <- FALSE; x_startConnected <- FALSE; x_endConnected <- FALSE;
1378 | #x_connectedPos <- 1; y_connectedPos <- 1
1379 | set_juicr("x_connected", FALSE); set_juicr("x_startConnected", FALSE); set_juicr("x_endConnected", FALSE);
1380 | set_juicr("x_connectedPos", 1); set_juicr("y_connectedPos", 1);
1381 |
1382 | tcltk::tkgrid(regressionButton, connectedButton, pady = 4, padx = 5)
1383 | #### END: figure regression frame
1384 |
1385 |
1386 | #### START: figure grouping frame
1387 | radioGroup <- tcltk::ttklabelframe(manualWindow, text = "extract-by-group (group=color+label)", padding = 8)
1388 |
1389 | groupRadio1 <- tcltk::tkradiobutton(radioGroup, foreground = groupColors[1], background = "white")
1390 | groupRadio2 <- tcltk::tkradiobutton(radioGroup, foreground = groupColors[2], background = "white")
1391 | groupRadio3 <- tcltk::tkradiobutton(radioGroup, foreground = groupColors[3], background = "white")
1392 | groupRadio4 <- tcltk::tkradiobutton(radioGroup, foreground = groupColors[4], background = "white")
1393 | groupRadio5 <- tcltk::tkradiobutton(radioGroup, foreground = groupColors[5], background = "white")
1394 | groupRadio6 <- tcltk::tkradiobutton(radioGroup, foreground = groupColors[6], background = "white")
1395 | groupRadio7 <- tcltk::tkradiobutton(radioGroup, foreground = groupColors[7], background = "white")
1396 | groupRadio8 <- tcltk::tkradiobutton(radioGroup, foreground = groupColors[8], background = "white")
1397 | groupRadio1Label <- tcltk::tktext(radioGroup, foreground = groupColors[1], height = 1, width = 12, font = "Arial 8")
1398 | groupRadio2Label <- tcltk::tktext(radioGroup, foreground = "white", height = 1, width = 12, font = "Arial 8")
1399 | groupRadio3Label <- tcltk::tktext(radioGroup, foreground = "white", height = 1, width = 12, font = "Arial 8")
1400 | groupRadio4Label <- tcltk::tktext(radioGroup, foreground = "white", height = 1, width = 12, font = "Arial 8")
1401 | groupRadio5Label <- tcltk::tktext(radioGroup, foreground = "white", height = 1, width = 12, font = "Arial 8")
1402 | groupRadio6Label <- tcltk::tktext(radioGroup, foreground = "white", height = 1, width = 12, font = "Arial 8")
1403 | groupRadio7Label <- tcltk::tktext(radioGroup, foreground = "white", height = 1, width = 12, font = "Arial 8")
1404 | groupRadio8Label <- tcltk::tktext(radioGroup, foreground = "white", height = 1, width = 12, font = "Arial 8")
1405 | tcltk::tkinsert(groupRadio1Label, "1.0", groupNames[1])
1406 | tcltk::tkinsert(groupRadio2Label, "1.0", groupNames[2])
1407 | tcltk::tkinsert(groupRadio3Label, "1.0", groupNames[3])
1408 | tcltk::tkinsert(groupRadio4Label, "1.0", groupNames[4])
1409 | tcltk::tkinsert(groupRadio5Label, "1.0", groupNames[5])
1410 | tcltk::tkinsert(groupRadio6Label, "1.0", groupNames[6])
1411 | tcltk::tkinsert(groupRadio7Label, "1.0", groupNames[7])
1412 | tcltk::tkinsert(groupRadio8Label, "1.0", groupNames[8])
1413 |
1414 | pointGroup <- tcltk::tclVar("NA")
1415 | tcltk::tkconfigure(groupRadio1, variable = pointGroup, value = as.character(tcltk::tcl(groupRadio1Label, "get", "1.0", "end")), command = function() {set_juicr("pointColor", groupColors[1]); tcltk::tkconfigure(groupRadio1Label, foreground = groupColors[1]);})
1416 | tcltk::tkconfigure(groupRadio2, variable = pointGroup, value = as.character(tcltk::tcl(groupRadio2Label, "get", "1.0", "end")), command = function() {set_juicr("pointColor", groupColors[2]); tcltk::tkconfigure(groupRadio2Label, foreground = groupColors[2]);})
1417 | tcltk::tkconfigure(groupRadio3, variable = pointGroup, value = as.character(tcltk::tcl(groupRadio3Label, "get", "1.0", "end")), command = function() {set_juicr("pointColor", groupColors[3]); tcltk::tkconfigure(groupRadio3Label, foreground = groupColors[3]);})
1418 | tcltk::tkconfigure(groupRadio4, variable = pointGroup, value = as.character(tcltk::tcl(groupRadio4Label, "get", "1.0", "end")), command = function() {set_juicr("pointColor", groupColors[4]); tcltk::tkconfigure(groupRadio4Label, foreground = groupColors[4]);})
1419 | tcltk::tkconfigure(groupRadio5, variable = pointGroup, value = as.character(tcltk::tcl(groupRadio5Label, "get", "1.0", "end")), command = function() {set_juicr("pointColor", groupColors[5]); tcltk::tkconfigure(groupRadio5Label, foreground = groupColors[5]);})
1420 | tcltk::tkconfigure(groupRadio6, variable = pointGroup, value = as.character(tcltk::tcl(groupRadio6Label, "get", "1.0", "end")), command = function() {set_juicr("pointColor", groupColors[6]); tcltk::tkconfigure(groupRadio6Label, foreground = groupColors[6]);})
1421 | tcltk::tkconfigure(groupRadio7, variable = pointGroup, value = as.character(tcltk::tcl(groupRadio7Label, "get", "1.0", "end")), command = function() {set_juicr("pointColor", groupColors[7]); tcltk::tkconfigure(groupRadio7Label, foreground = groupColors[7]);})
1422 | tcltk::tkconfigure(groupRadio8, variable = pointGroup, value = as.character(tcltk::tcl(groupRadio8Label, "get", "1.0", "end")), command = function() {set_juicr("pointColor", groupColors[8]); tcltk::tkconfigure(groupRadio8Label, foreground = groupColors[8]);})
1423 | tcltk::tcl(groupRadio1, "select");
1424 |
1425 | tcltk::tkgrid(groupRadio1, groupRadio1Label, groupRadio2, groupRadio2Label, pady = 0)
1426 | tcltk::tkgrid(groupRadio3, groupRadio3Label, groupRadio4, groupRadio4Label, pady = 0)
1427 | tcltk::tkgrid(groupRadio5, groupRadio5Label, groupRadio6, groupRadio6Label, pady = 0)
1428 | tcltk::tkgrid(groupRadio7, groupRadio7Label, groupRadio8, groupRadio8Label, pady = 0)
1429 |
1430 | tcltk::tkpack(zoomFrame, figureTypeCanvas, figureCalibration, figureError, figureLine, radioGroup)
1431 |
1432 | tcltk::tkgrid(manualWindow)
1433 | manualWindowItems <- as.character(tcltk::tkpack.slaves(manualWindow))
1434 | tcltk::tkpack.forget(manualWindowItems[4])
1435 | tcltk::tkpack.forget(manualWindowItems[5])
1436 |
1437 | ##### END: manual frame in notebook
1438 | ########################################
1439 |
1440 | tcltk::tkadd(notebookFrame, automatedWindow, sticky = "nswe", text = " automated ", compound = "left")
1441 | tcltk::tkinsert(notebookFrame, 0, manualWindow, sticky = "nswe", text = " manual ")
1442 |
1443 | #################################
1444 | ##### END: options notebook
1445 | #################################
1446 |
1447 |
1448 | #######################################
1449 | ##### START: data and save frame
1450 | #######################################
1451 |
1452 | saveJuicr <- function() {
1453 |
1454 | # convert tcltk txt into regular txt
1455 | fullNotes <- ""
1456 | for(i in 1:(as.integer(tclvalue(tcl(theNotes, "index", "end"))) - 1)) {
1457 | lineNotes <- tcltk::tcl(theNotes, "get", paste0(i, ".0"), paste0(i, ".end"))
1458 | fullNotes <- paste0(fullNotes, paste0(lineNotes, collapse = " "), "\n")
1459 | }
1460 |
1461 | # collect juicr settings
1462 | settingsJuicr <- data.frame(
1463 | "theNotes" = fullNotes,
1464 | "circleSmallButton" = as.character(tcltk::tkcget(circleSmallButton, "-relief")),
1465 | "circleMediumButton" = as.character(tcltk::tkcget(circleMediumButton, "-relief")),
1466 | "circleBigButton" = as.character(tcltk::tkcget(circleBigButton, "-relief")),
1467 | "circleSizeDisplay" = as.character(text_get(circleSizeDisplay)),
1468 | "circleCircleButton" = as.character(tcltk::tkcget(circleCircleButton, "-relief")),
1469 | "circleDiamondButton" = as.character(tcltk::tkcget(circleDiamondButton, "-relief")),
1470 | "circleSquareButton" = as.character(tcltk::tkcget(circleSquareButton, "-relief")),
1471 | "circleClosedButton" = as.character(tcltk::tkcget(circleClosedButton, "-relief")),
1472 | "circleOpenButton" = as.character(tcltk::tkcget(circleOpenButton, "-relief")),
1473 | "highQualityButton" = as.character(tcltk::tkcget(highQualityButton, "-relief")),
1474 | "lowQualityButton" = as.character(tcltk::tkcget(lowQualityButton, "-relief")),
1475 | "qualityDisplay" = as.character(text_get(qualityDisplay)),
1476 | "barSmallButton" = as.character(tcltk::tkcget(barSmallButton, "-relief")),
1477 | "barMediumButton" = as.character(tcltk::tkcget(barMediumButton, "-relief")),
1478 | "barBigButton" = as.character(tcltk::tkcget(barBigButton, "-relief")),
1479 | "barSizeDisplay" = as.character(text_get(barSizeDisplay)),
1480 | "figureXminDisplay" = as.character(text_get(figureXminDisplay)),
1481 | "figureXmaxDisplay" = as.character(text_get(figureXmaxDisplay)),
1482 | "figureXcaptionDisplay" = as.character(text_get(figureXcaptionDisplay)),
1483 | "figureXunitsDisplay" = as.character(text_get(figureXunitsDisplay)),
1484 | "figureYminDisplay" = as.character(text_get(figureYminDisplay)),
1485 | "figureYmaxDisplay" = as.character(text_get(figureYmaxDisplay)),
1486 | "figureYcaptionDisplay" = as.character(text_get(figureYcaptionDisplay)),
1487 | "figureYunitsDisplay" = as.character(text_get(figureYunitsDisplay)),
1488 | "meanComboBox" = as.character(tcltk::tkget(meanComboBox)),
1489 | "errorComboBox" = as.character(tcltk::tkget(errorComboBox)),
1490 | "groupRadio1Label" = as.character(text_get(groupRadio1Label)),
1491 | "groupRadio2Label" = as.character(text_get(groupRadio2Label)),
1492 | "groupRadio3Label" = as.character(text_get(groupRadio3Label)),
1493 | "groupRadio4Label" = as.character(text_get(groupRadio4Label)),
1494 | "groupRadio5Label" = as.character(text_get(groupRadio5Label)),
1495 | "groupRadio6Label" = as.character(text_get(groupRadio6Label)),
1496 | "groupRadio7Label" = as.character(text_get(groupRadio7Label)),
1497 | "groupRadio8Label" = as.character(text_get(groupRadio8Label)),
1498 | "groupRadio1LabelStatus" = tclvalue(tcltk::tkcget(groupRadio1Label, "-foreground")),
1499 | "groupRadio2LabelStatus" = tclvalue(tcltk::tkcget(groupRadio2Label, "-foreground")),
1500 | "groupRadio3LabelStatus" = tclvalue(tcltk::tkcget(groupRadio3Label, "-foreground")),
1501 | "groupRadio4LabelStatus" = tclvalue(tcltk::tkcget(groupRadio4Label, "-foreground")),
1502 | "groupRadio5LabelStatus" = tclvalue(tcltk::tkcget(groupRadio5Label, "-foreground")),
1503 | "groupRadio6LabelStatus" = tclvalue(tcltk::tkcget(groupRadio6Label, "-foreground")),
1504 | "groupRadio7LabelStatus" = tclvalue(tcltk::tkcget(groupRadio7Label, "-foreground")),
1505 | "groupRadio8LabelStatus" = tclvalue(tcltk::tkcget(groupRadio8Label, "-foreground"))
1506 | )
1507 |
1508 | # collect extractions
1509 | resultsJuicr <- list("axes" = getAxisExtractions(sendToFile = TRUE),
1510 | "points" = getPointExtractions(sendToFile = TRUE),
1511 | "points_coordinates" = getPointExtractions(sendToFile = TRUE, coordinates = TRUE),
1512 | "autoBars" = getBarExtractions(sendToFile = TRUE),
1513 | "errorBars" = getErrorExtractions(sendToFile = TRUE),
1514 | "regressions" = getRegressionExtractions(sendToFile = TRUE),
1515 | "lines" = getLineExtractions(sendToFile = TRUE))
1516 |
1517 |
1518 | # collect image settings
1519 | theOriginal <- EBImage::readImage(theFigureFile)
1520 | #theStandardized <- theFigure #EBImage::readImage(theStandardizedImageFile)
1521 |
1522 | theFigureExtractions <- theFigureJuiced #EBImage::readImage(theStandardizedImageFile)
1523 |
1524 | theFigureExtractions <- EBImage::drawCircle(theFigureExtractions,
1525 | resultsJuicr$axes$X.axis[1],
1526 | resultsJuicr$axes$X.axis[2],
1527 | radius = 7, col = grDevices::rgb(t(grDevices::col2rgb("mediumseagreen")), maxColorValue = 255),
1528 | fill = TRUE)
1529 | theFigureExtractions <- EBImage::drawCircle(theFigureExtractions,
1530 | resultsJuicr$axes$X.axis[3],
1531 | resultsJuicr$axes$X.axis[4],
1532 | radius = 7, col = grDevices::rgb(t(grDevices::col2rgb("mediumseagreen")), maxColorValue = 255),
1533 | fill = TRUE)
1534 |
1535 |
1536 | theFigureExtractions <- EBImage::drawCircle(theFigureExtractions,
1537 | resultsJuicr$axes$Y.axis[1],
1538 | resultsJuicr$axes$Y.axis[2],
1539 | radius = 7, col = grDevices::rgb(t(grDevices::col2rgb("mediumseagreen")), maxColorValue = 255),
1540 | fill = TRUE)
1541 |
1542 | theFigureExtractions <- EBImage::drawCircle(theFigureExtractions,
1543 | resultsJuicr$axes$Y.axis[3],
1544 | resultsJuicr$axes$Y.axis[4],
1545 | radius = 7, col = grDevices::rgb(t(grDevices::col2rgb("mediumseagreen")), maxColorValue = 255),
1546 | fill = TRUE)
1547 |
1548 | if(nrow(resultsJuicr$points_coordinates) != 0) {
1549 | for(i in 1:nrow(resultsJuicr$points_coordinates)) {
1550 | theFigureExtractions <- EBImage::drawCircle(theFigureExtractions,
1551 | resultsJuicr$points_coordinates$x.coord[i],
1552 | resultsJuicr$points_coordinates$y.coord[i],
1553 | radius = 3, col = grDevices::rgb(t(grDevices::col2rgb("orange")), maxColorValue = 255),
1554 | fill = TRUE)
1555 | }
1556 | }
1557 |
1558 | if(nrow(resultsJuicr$errorBars) != 0) {
1559 | for(i in 1:nrow(resultsJuicr$errorBars)) {
1560 | theFigureExtractions <- EBImage::drawCircle(theFigureExtractions,
1561 | resultsJuicr$errorBars$mean.x[i],
1562 | resultsJuicr$errorBars$mean.y[i],
1563 | radius = 3, col = grDevices::rgb(t(grDevices::col2rgb("dodgerblue")), maxColorValue = 255),
1564 | fill = TRUE)
1565 | theFigureExtractions <- EBImage::drawCircle(theFigureExtractions,
1566 | resultsJuicr$errorBars$error.x[i],
1567 | resultsJuicr$errorBars$error.y[i],
1568 | radius = 3, col = grDevices::rgb(t(grDevices::col2rgb("dodgerblue")), maxColorValue = 255),
1569 | fill = TRUE)
1570 | }
1571 | }
1572 |
1573 | if(nrow(resultsJuicr$regressions) != 0) {
1574 | for(i in 1:nrow(resultsJuicr$regressions)) {
1575 | theFigureExtractions <- EBImage::drawCircle(theFigureExtractions,
1576 | resultsJuicr$regressions$x1.coord[i],
1577 | resultsJuicr$regressions$y1.coord[i],
1578 | radius = 5, col = grDevices::rgb(t(grDevices::col2rgb("violet")), maxColorValue = 255),
1579 | fill = TRUE)
1580 | theFigureExtractions <- EBImage::drawCircle(theFigureExtractions,
1581 | resultsJuicr$regressions$x2.coord[i],
1582 | resultsJuicr$regressions$y2.coord[i],
1583 | radius = 5, col = grDevices::rgb(t(grDevices::col2rgb("violet")), maxColorValue = 255),
1584 | fill = TRUE)
1585 | }
1586 | }
1587 |
1588 |
1589 | if(nrow(resultsJuicr$lines) != 0) {
1590 | for(i in 1:nrow(resultsJuicr$lines)) {
1591 | theFigureExtractions <- EBImage::drawCircle(theFigureExtractions,
1592 | resultsJuicr$lines$x.coord[i],
1593 | resultsJuicr$lines$y.coord[i],
1594 | radius = 3, col = grDevices::rgb(t(grDevices::col2rgb("slateblue")), maxColorValue = 255),
1595 | fill = TRUE)
1596 | }
1597 | }
1598 |
1599 | theExtractions <- paste0(tools::file_path_sans_ext(basename(theFigureFile)), "_juicr_extracted.png")
1600 | EBImage::writeImage(theFigureExtractions, file = theExtractions, type = "png")
1601 | EBImage::writeImage(theFigureJuiced, file = theStandardizedImageFile, type = "png")
1602 |
1603 | filesJurcr <- data.frame("file_name" = c(basename(theFigureFile), basename(theStandardizedImageFile), theExtractions),
1604 | "formated" = c("original", "standardized", "standardized with extractions"),
1605 | "size_bites" = c(file.info(theFigureFile)$size, file.info(theStandardizedImageFile)$size, file.info(theExtractions)$size),
1606 | "date_created" = c(paste(file.info(theFigureFile)$ctime), paste(file.info(theStandardizedImageFile)$ctime), paste(file.info(theExtractions)$ctime)),
1607 | "width_pixels" = c(dim(theOriginal)[1], dim(theFigureJuiced)[1], dim(theFigureExtractions)[1]),
1608 | "height_pixels" = c(dim(theOriginal)[2], dim(theFigureJuiced)[2], dim(theFigureExtractions)[2]))
1609 |
1610 |
1611 | toHTML_table <- function(aDataFrame, theID, aConnection) {
1612 | #message(attributes(aDataFrame))
1613 | if(length(aDataFrame) == 0) {
1614 | cat(paste0("\n"), file = aConnection)
1615 | cat("\n", paste0("| ", "no extractions", " | \n"), "
\n", file = aConnection)
1616 | cat("\n", paste0("| ", "NA" , " | \n"), "
\n", file = aConnection)
1617 | cat("
\n", file = aConnection)
1618 | return("");
1619 | }
1620 |
1621 | cat(paste0("\n"), file = aConnection)
1622 | cat("\n", paste0("| ", labels(aDataFrame)[[2]], " | \n"), "
\n", file = aConnection)
1623 | for(i in 1:nrow(aDataFrame)) cat("\n", paste0("| ", aDataFrame[i, ], " | \n"), "
\n", file = aConnection)
1624 | cat("
\n", file = aConnection)
1625 | }
1626 |
1627 | toHTML_image <- function(theImage, aConnection, type = "jpg", theID = "logo") {
1628 | cat(paste0(" \n", file = aConnection)
1632 | }
1633 |
1634 | toHTML_image2 <- function(theImage, aConnection, type = "jpg", theID = "logo") {
1635 | imgTXT <- paste0("")
1638 | return(imgTXT)
1639 | }
1640 |
1641 | toHTML <- function(theImageFile, allResults) {
1642 |
1643 | aConnection <- file(paste0(tools::file_path_sans_ext(basename(allResults$files[1,1])), "_juicr.html"), "w")
1644 |
1645 | cat("\n",
1646 | "\n",
1647 | "\n",
1648 | paste0("\nJuicr extraction: ", basename(theFigureFile), "\n"),
1649 | paste0("\n"),
1650 | paste0("\n\n"),
1651 | "\n", file = aConnection)
1652 |
1653 | toHTML_image(getIMG("test_orange3.png"), aConnection, type = "png")
1654 | cat(paste0("
\n", file = aConnection)
1632 | }
1633 |
1634 | toHTML_image2 <- function(theImage, aConnection, type = "jpg", theID = "logo") {
1635 | imgTXT <- paste0("")
1638 | return(imgTXT)
1639 | }
1640 |
1641 | toHTML <- function(theImageFile, allResults) {
1642 |
1643 | aConnection <- file(paste0(tools::file_path_sans_ext(basename(allResults$files[1,1])), "_juicr.html"), "w")
1644 |
1645 | cat("\n",
1646 | "\n",
1647 | "\n",
1648 | paste0("\nJuicr extraction: ", basename(theFigureFile), "\n"),
1649 | paste0("\n"),
1650 | paste0("\n\n"),
1651 | "\n", file = aConnection)
1652 |
1653 | toHTML_image(getIMG("test_orange3.png"), aConnection, type = "png")
1654 | cat(paste0("JUICR record of extractions from image:
", allResults$files[1,1] , "
\n"), file = aConnection)
1655 |
1656 | cat(paste0("
File information
\n"), file = aConnection)
1657 | toHTML_table(allResults$files, "files", aConnection)
1658 |
1659 | cat(paste0("
\n"), file = aConnection)
1660 |
1661 | collectImages <- data.frame(
1662 | file_name = c(allResults$files$file_name),
1663 | image = c(
1664 | toHTML_image2(theFigureFile, theID = "original"),
1665 | toHTML_image2(theStandardizedImageFile, theID = "standardized"),
1666 | toHTML_image2(allResults$files[3,1], theID = "extracted"))
1667 | )
1668 | toHTML_table(collectImages, "images", aConnection)
1669 |
1670 | cat(paste0("
Data extractions from: ", allResults$files[2,1], "
\n"), file = aConnection)
1671 | cat(paste0("extracted data: points
\n"), file = aConnection)
1672 | toHTML_table(allResults$extractions$points, "points", aConnection)
1673 | cat(paste0("extracted data: coordinates for X and Y axes
\n"), file = aConnection)
1674 | toHTML_table(allResults$extractions$axes, "axes", aConnection)
1675 | cat(paste0("extracted data: auto-bars
\n"), file = aConnection)
1676 | toHTML_table(allResults$extractions$autoBars, "autobars", aConnection)
1677 | cat(paste0("extracted data: error Bars
\n"), file = aConnection)
1678 | toHTML_table(allResults$extractions$errorBars, "errorbars", aConnection)
1679 | cat(paste0("extracted data: regressions
\n"), file = aConnection)
1680 | toHTML_table(allResults$extractions$regressions, "regressions", aConnection)
1681 | cat(paste0("extracted data: lines
\n"), file = aConnection)
1682 | toHTML_table(allResults$extractions$lines, "lines", aConnection)
1683 |
1684 | cat(paste0("
juicr parameters
\n"), file = aConnection)
1685 | toHTML_table(allResults$settings, "parameters", aConnection)
1686 |
1687 | cat("\n", "\n", file = aConnection)
1688 | close(aConnection)
1689 |
1690 | file.remove(theExtractions)
1691 | file.remove(theStandardizedImageFile)
1692 |
1693 | }
1694 |
1695 | allResults <- list("extractions" = resultsJuicr, "settings" = settingsJuicr, "files" = filesJurcr)
1696 |
1697 |
1698 | toHTML("", allResults)
1699 | #print(paste0(getwd(), "/", paste0(tools::file_path_sans_ext(basename(allResults$files[1,1])), "_juicr.html")))
1700 | return(paste0(tools::file_path_sans_ext(basename(allResults$files[1,1])), "_juicr.html"))
1701 | }
1702 |
1703 |
1704 | ### START OF DATA FRAME
1705 |
1706 | dataWindow <- tcltk::ttkframe(aJuicrWindow)
1707 |
1708 | #### start: text summary frame
1709 | txtCanvas <- tcltk::tkcanvas(dataWindow, background = "white", width = 200, height = 440, "-scrollregion", paste(0, 0, 200, 500 * 13))
1710 | theDataText <- tcltk::tkcreate(txtCanvas, "text", 100, 3, justify = "left", text = point_summary(), font = "Consolas 8", anchor = "n")
1711 | theExtractedScroll <- tcltk::ttkscrollbar(dataWindow, command = function(...) tcltk::tcl(txtCanvas, "yview", ...), orient = "vertical")
1712 | tcltk::tkconfigure(txtCanvas, yscrollcommand = function(...) tcltk::tkset(theExtractedScroll, ...))
1713 | #### end: text summary frame
1714 |
1715 | #### start: notes frame
1716 | notesCanvas <- tcltk::ttklabelframe(dataWindow, text = "Notes (e.g., user name, fig. #, ref.)", padding = 5)
1717 | theNotes <- tcltk::tktext(notesCanvas, height = 4, width = 26, font = "arial 10")
1718 | tcltk::tkinsert(theNotes, "1.0", "")
1719 | #### end: notes frame
1720 |
1721 | #### start: save frame
1722 | saveWindow <- tcltk::ttkframe(dataWindow)
1723 | getDataWindow <- tcltk::ttkframe(saveWindow)
1724 | viewAllDataButton <- tcltk::ttkbutton(getDataWindow, text = " save .csv\nextractions", command = function() {getPointExtractions(sendToWindow = TRUE); getBarExtractions(sendToWindow = TRUE); getErrorExtractions(sendToWindow = TRUE); getRegressionExtractions(sendToWindow = TRUE); getLineExtractions(sendToWindow = TRUE); getAxisExtractions(sendToWindow = TRUE);})
1725 | #exportRButton <- ttkbutton(getDataWindow,text = "export to R", command = function() get_ExtractionList())
1726 | aboutButton <- tcltk::ttkbutton(getDataWindow, text = "help/cite", command = function() aboutJuicrWindow())
1727 |
1728 |
1729 | saveButton <- tcltk::ttkbutton(saveWindow, compound = "left", text = "save\nextractions\nas .html", image = orangeJuiceSave,
1730 | command = function() {
1731 | #tcltk::tk_choose.dir()
1732 | tcltk::tkconfigure(saveButton, text = paste0("saving..."))
1733 | tcltk::tcl("update"); Sys.sleep(2);
1734 | set_juicr("theSavedFile", saveJuicr());
1735 | updatedSummary <- point_summary();
1736 | tcltk::tkitemconfigure(txtCanvas, theDataText, text = updatedSummary);
1737 | tcltk::tkconfigure(saveButton, text = paste0("save\nextractions\nas .html"));})
1738 |
1739 | #### end: save frame
1740 |
1741 | tcltk::tkgrid(txtCanvas, theExtractedScroll, sticky = "news")
1742 | tcltk::tkgrid(theNotes, pady = 3)
1743 | tcltk::tkgrid(notesCanvas, sticky = "news")
1744 | tcltk::tkgrid(viewAllDataButton, pady = 1, sticky = "news")
1745 | #tkgrid(exportRButton, pady = 1, sticky = "news")
1746 | tcltk::tkgrid(aboutButton, pady = 1, sticky = "news")
1747 |
1748 | tcltk::tkgrid(getDataWindow, saveButton, padx = 5, pady = 6, sticky = "news")
1749 | tcltk::tkgrid(saveWindow)
1750 |
1751 |
1752 |
1753 | #######################################
1754 | ##### END: data and save frame
1755 | #######################################
1756 |
1757 | tcltk::tkpack(figureWindow, side = "left", pady = 15, padx = 15)
1758 | tcltk::tkpack(dataWindow, side = "right", pady = 15, padx = 15)
1759 | tcltk::tkpack(notebookFrame, side = "top", pady = 15, padx = 15)
1760 |
1761 |
1762 |
1763 | # # # # # # # # # # # # # # # # # #
1764 | ##### END OF JUICR GUI WINDOW #####
1765 | # # # # # # # # # # # # # # # # # #
1766 |
1767 | #############################################################################
1768 | #############################################################################
1769 |
1770 |
1771 |
1772 |
1773 | ##---------------------------
1774 | ## START: interactivity
1775 | ##---------------------------
1776 |
1777 |
1778 | mainFigureMouseOver <- function(x, y){
1779 |
1780 | xpos <- as.numeric(tcltk::tcl(mainFigureCanvas$ID, "canvasx", as.integer(x)))
1781 | ypos <- as.numeric(tcltk::tcl(mainFigureCanvas$ID, "canvasy", as.integer(y)))
1782 |
1783 | # update the zoom coordinates
1784 | if(as.character(tcltk::tkget(pixelComboBox)) == "pixels") {
1785 | tcltk::tkitemconfigure(zoomCanvas, zoomText, text = sprintf("(x,y)=(%5s,%5s)", xpos, ypos))
1786 | } else {
1787 | tcltk::tkitemconfigure(zoomCanvas, zoomText, text = sprintf("(x,y)=(%5s,%5s)",
1788 | signif(coordinate_calibrate(xpos, "x"), 4),
1789 | signif(coordinate_calibrate(ypos, "y"), 4)))
1790 | }
1791 |
1792 | xfigMax <- as.integer(tcltk::tcl("image", "width", theFigure))
1793 | yfigMax <- as.integer(tcltk::tcl("image", "height", theFigure))
1794 | zoomFigure <- tcltk::tcl("image", "create", "photo", paste(zoomFigure))
1795 | xmin <- ifelse(xpos <= 38, 0, xpos - 38)
1796 | ymin <- ifelse(ypos <= 38, 0, ypos - 38)
1797 | xmax <- ifelse(xpos >= xfigMax - 38, xfigMax, xpos + 38)
1798 | ymax <- ifelse(ypos >= yfigMax - 38, yfigMax, ypos + 38)
1799 | tcltk::tcl(zoomFigure, "copy", theFigure, "-from", xmin, ymin, xmax, ymax, "-zoom", 3)
1800 | tcltk::tkitemconfigure(zoomCanvas, zoomImage, image = zoomFigure)
1801 | tcltk::tkcoords(zoomCanvas, zoomImage, ifelse(xpos <= 38, (77*3)/2 - xpos*3, 0), ifelse(ypos <= 38, (77*3)/2 - ypos*3, 0))
1802 |
1803 | ### START: X-axis calibration
1804 | if(get_juicr("x_calibrate") == TRUE && get_juicr("x_startCalibrate") == FALSE) {
1805 | tcltk::tkitemconfigure(mainFigureCanvas, x_calibrationLine, width = 5)
1806 | update_X_axis(xpos, ypos, xpos + 30, ypos)
1807 | }
1808 |
1809 | if(get_juicr("y_calibrate") == TRUE && get_juicr("y_startCalibrate") == FALSE) {
1810 | tcltk::tkitemconfigure(mainFigureCanvas, y_calibrationLine, width = 5)
1811 | update_Y_axis(xpos, ypos, xpos, ypos + 30)
1812 | }
1813 |
1814 | if(get_juicr("x_startCalibrate") == TRUE) {
1815 | xyPos <- as.numeric(tcltk::tkcoords(mainFigureCanvas, x_calibrationLine))
1816 | update_X_axis(xyPos[1], xyPos[2], xpos, xyPos[2])
1817 | }
1818 | if(get_juicr("y_startCalibrate") == TRUE) {
1819 | xyPos <- as.numeric(tcltk::tkcoords(mainFigureCanvas, y_calibrationLine))
1820 | update_Y_axis(xyPos[1], xyPos[2], xyPos[1], ypos)
1821 | }
1822 | ### END: X-axis calibration
1823 |
1824 | if(as.character(tcltk::tkcget(errorXbutton, "-relief")) == "sunken" && as.character(tcltk::tkcget(barPlotButton, "-relief")) == "sunken") {
1825 | if(get_juicr("x_error") == TRUE && get_juicr("x_startError") == FALSE) {
1826 | tcltk::tkitemconfigure(mainFigureCanvas, x_errorLine, width = 3)
1827 | tcltk::tkcoords(mainFigureCanvas, x_errorLine, xpos, ypos, xpos, ypos,
1828 | xpos, ypos - 7, xpos, ypos + 8)
1829 | }
1830 | if(get_juicr("x_startError") == TRUE) {
1831 | xyPos <- as.numeric(tcltk::tkcoords(mainFigureCanvas, x_errorLine))
1832 | tcltk::tkcoords(mainFigureCanvas, x_errorLine, xyPos[1], xyPos[2], xpos, xyPos[2],
1833 | xpos, xyPos[2] - 7, xpos, xyPos[2] + 8)
1834 | }
1835 | }
1836 |
1837 | if(as.character(tcltk::tkcget(errorYbutton, "-relief")) == "sunken" && as.character(tcltk::tkcget(barPlotButton, "-relief")) == "sunken") {
1838 | if(get_juicr("y_error") == TRUE && get_juicr("y_startError") == FALSE) {
1839 | tcltk::tkitemconfigure(mainFigureCanvas, y_errorLine, width = 3)
1840 | tcltk::tkcoords(mainFigureCanvas, y_errorLine, xpos, ypos, xpos, ypos,
1841 | xpos - 7, ypos, xpos + 8, ypos)
1842 | }
1843 | if(get_juicr("y_startError") == TRUE) {
1844 | xyPos <- as.numeric(tcltk::tkcoords(mainFigureCanvas, y_errorLine))
1845 | tcltk::tkcoords(mainFigureCanvas, y_errorLine, xyPos[1], xyPos[2], xyPos[1], ypos,
1846 | xyPos[1] - 7, ypos, xyPos[1] + 8, ypos)
1847 | }
1848 | }
1849 |
1850 |
1851 | ##############
1852 | if(as.character(tcltk::tkcget(regressionButton, "-relief")) == "sunken" && as.character(tcltk::tkcget(linePlotButton, "-relief")) == "sunken") {
1853 | if(get_juicr("x_regression") == TRUE && get_juicr("x_startRegression") == FALSE) {
1854 | tcltk::tkitemconfigure(mainFigureCanvas, x_regressionLine, width = 3)
1855 | tcltk::tkcoords(mainFigureCanvas, x_regressionLine, xpos, ypos, xpos + 2, ypos + 2)
1856 | }
1857 | if(get_juicr("x_startRegression") == TRUE) {
1858 | xyPos <- as.numeric(tcltk::tkcoords(mainFigureCanvas, x_regressionLine))
1859 | tcltk::tkcoords(mainFigureCanvas, x_regressionLine, xyPos[1], xyPos[2], xpos + 2, ypos + 2)
1860 | }
1861 | }
1862 |
1863 | ##############
1864 | if(as.character(tcltk::tkcget(connectedButton, "-relief")) == "sunken" && as.character(tcltk::tkcget(linePlotButton, "-relief")) == "sunken") {
1865 | if(get_juicr("x_connected") == TRUE && get_juicr("x_startConnected") == FALSE) {
1866 | tcltk::tkitemconfigure(mainFigureCanvas, x_connectedLine, width = 3, arrow = "last")
1867 | xyPos <- as.numeric(tcltk::tkcoords(mainFigureCanvas, x_connectedLine))
1868 | if(length(xyPos) == 4) {tcltk::tkcoords(mainFigureCanvas, x_connectedLine, xpos, ypos, xpos + 2, ypos + 2)}
1869 | else {
1870 | tcltk::tkcoords(mainFigureCanvas, x_connectedLine, as.character(c(head(xyPos,-2L), xpos, ypos)))}
1871 | }
1872 | if(get_juicr("x_startConnected") == TRUE) {
1873 | xyPos <- as.numeric(tcltk::tkcoords(mainFigureCanvas, x_connectedLine))
1874 | if(length(xyPos) == 4) {tcltk::tkcoords(mainFigureCanvas, x_connectedLine, xyPos[1], xyPos[2], xpos + 2, ypos + 2)}
1875 | else {tcltk::tkcoords(mainFigureCanvas, x_connectedLine, as.character(c(head(xyPos,-2L), xpos, ypos)))}
1876 | }
1877 | }
1878 |
1879 | }
1880 |
1881 | deletePoint <- function() {
1882 | point_delete(point_indexToPoint(point_getTags("current")[1]))
1883 | tcltk::tcl(mainFigureCanvas, "delete", "current")
1884 | tcltk::tkitemconfigure(txtCanvas, theDataText, text = point_summary())
1885 | tcltk::tkitemconfigure(mainFigureCanvas, hoverText, text = "")
1886 | tcltk::tkcoords(mainFigureCanvas, hoverText, 0, 0)
1887 | tcltk::tkitemconfigure(mainFigureCanvas, hoverShadow, image = "")
1888 | tcltk::tkcoords(mainFigureCanvas, hoverShadow, 0, 0)
1889 | }
1890 |
1891 | createPoint <- function(xPos, yPos) {
1892 | # create new point
1893 | newPoint <- tcltk::tkcreate(mainFigureCanvas, "oval",
1894 | xPos - pointSize,
1895 | yPos - pointSize,
1896 | xPos + pointSize,
1897 | yPos + pointSize,
1898 | width = 1,
1899 | outline = "white",
1900 | fill = get_juicr("pointColor"))
1901 | # add unique ID
1902 | tcltk::tkaddtag(mainFigureCanvas, point_pointToIndex(point_add()), "withtag", newPoint)
1903 |
1904 | # add grouping ID
1905 | tcltk::tkaddtag(mainFigureCanvas, as.character(tcltk::tclvalue(pointGroup)), "withtag", newPoint)
1906 |
1907 | # add common ID
1908 | tcltk::tkaddtag(mainFigureCanvas, "point", "withtag", newPoint)
1909 |
1910 | # add all common tag ID
1911 | tcltk::tkaddtag(mainFigureCanvas, "extraction", "withtag", newPoint)
1912 |
1913 |
1914 | }
1915 |
1916 |
1917 | autoPoint <- function(xPos, yPos) {
1918 | # create new point
1919 | newPoint <- tcltk::tcl(mainFigureCanvas,
1920 | "create", "image",
1921 | xPos - 8, yPos - 8,
1922 | image = autoPointImage, anchor = "nw")
1923 |
1924 | # add unique ID
1925 | tcltk::tkaddtag(mainFigureCanvas, point_pointToIndex(point_add()), "withtag", newPoint)
1926 |
1927 | # add grouping ID
1928 | tcltk::tkaddtag(mainFigureCanvas, "auto", "withtag", newPoint)
1929 |
1930 | # add common ID
1931 | tcltk::tkaddtag(mainFigureCanvas, "point", "withtag", newPoint)
1932 |
1933 | # add all common tag ID
1934 | tcltk::tkaddtag(mainFigureCanvas, "extraction", "withtag", newPoint)
1935 | }
1936 |
1937 |
1938 | autoCluster <- function(xPos, yPos) {
1939 | # create new point
1940 | newPoint <- tcltk::tcl(mainFigureCanvas,
1941 | "create", "image",
1942 | xPos - 8, yPos - 8,
1943 | image = clusterPointImage, anchor = "nw")
1944 |
1945 | # add unique ID
1946 | tcltk::tkaddtag(mainFigureCanvas, point_pointToIndex(point_add()), "withtag", newPoint)
1947 |
1948 | # add grouping ID
1949 | tcltk::tkaddtag(mainFigureCanvas, "cluster", "withtag", newPoint)
1950 |
1951 | # add common ID
1952 | tcltk::tkaddtag(mainFigureCanvas, "point", "withtag", newPoint)
1953 |
1954 | # add all common tag ID
1955 | tcltk::tkaddtag(mainFigureCanvas, "extraction", "withtag", newPoint)
1956 | }
1957 |
1958 | autoBar <- function(xPos, yPos, xAdjust = 8, yAdjust = 4) {
1959 |
1960 | # create new point
1961 | newPoint <- tcltk::tcl(mainFigureCanvas,
1962 | "create", "image",
1963 | xPos - xAdjust, yPos - yAdjust,
1964 | image = theBarImage, anchor = "nw")
1965 |
1966 | # add unique ID
1967 | tcltk::tkaddtag(mainFigureCanvas, point_pointToIndex(point_add()), "withtag", newPoint)
1968 |
1969 | # add grouping ID
1970 | tcltk::tkaddtag(mainFigureCanvas, "autobar", "withtag", newPoint)
1971 |
1972 | # add common ID
1973 | tcltk::tkaddtag(mainFigureCanvas, "point", "withtag", newPoint)
1974 |
1975 | # add all common tag ID
1976 | tcltk::tkaddtag(mainFigureCanvas, "extraction", "withtag", newPoint)
1977 | }
1978 |
1979 | createErrorBarX <- function(x1, y1, x2, y2) {
1980 |
1981 | errorPoint <- tcltk::tkcreate(mainFigureCanvas, "line",
1982 | x1, y1, x2, y2,
1983 | x2, y1 - 7, x2, y2 + 8, # cap
1984 | width = 3,
1985 | arrow = "first",
1986 | fill = get_juicr("pointColor"))
1987 | # add unique ID
1988 | tcltk::tkaddtag(mainFigureCanvas, point_pointToIndex(point_add()), "withtag", errorPoint)
1989 | # add grouping ID
1990 | tcltk::tkaddtag(mainFigureCanvas, as.character(tcltk::tclvalue(pointGroup)), "withtag", errorPoint)
1991 | # add common ID
1992 | tcltk::tkaddtag(mainFigureCanvas, "error", "withtag", errorPoint)
1993 |
1994 | # add all common tag ID
1995 | tcltk::tkaddtag(mainFigureCanvas, "extraction", "withtag", errorPoint)
1996 |
1997 | }
1998 |
1999 | createErrorBarY <- function(x1, y1, x2, y2) {
2000 |
2001 | errorPoint <- tcltk::tkcreate(mainFigureCanvas, "line",
2002 | x1, y1, x1, y2,
2003 | x1 - 7, y2, x1 + 8, y2, # cap
2004 | width = 3,
2005 | arrow = "first",
2006 | fill = get_juicr("pointColor"))
2007 | # add unique ID
2008 | tcltk::tkaddtag(mainFigureCanvas, point_pointToIndex(point_add()), "withtag", errorPoint)
2009 | # add grouping ID
2010 | tcltk::tkaddtag(mainFigureCanvas, as.character(tcltk::tclvalue(pointGroup)), "withtag", errorPoint)
2011 | # add common ID
2012 | tcltk::tkaddtag(mainFigureCanvas, "error", "withtag", errorPoint)
2013 |
2014 | # add all common tag ID
2015 | tcltk::tkaddtag(mainFigureCanvas, "extraction", "withtag", errorPoint)
2016 |
2017 | }
2018 |
2019 | createRegressionLine <- function (x1, y1, x2, y2) {
2020 |
2021 | regressionPoint <- tcltk::tkcreate(mainFigureCanvas, "line",
2022 | x1, y1, x2, y2,
2023 | width = 3,
2024 | fill = get_juicr("pointColor"))
2025 | # add unique ID
2026 | tcltk::tkaddtag(mainFigureCanvas, point_pointToIndex(point_add()), "withtag", regressionPoint)
2027 | # add grouping ID
2028 | tcltk::tkaddtag(mainFigureCanvas, as.character(tcltk::tclvalue(pointGroup)), "withtag", regressionPoint)
2029 | # add common ID
2030 | tcltk::tkaddtag(mainFigureCanvas, "regression", "withtag", regressionPoint)
2031 |
2032 | # add all common tag ID
2033 | tcltk::tkaddtag(mainFigureCanvas, "extraction", "withtag", regressionPoint)
2034 |
2035 |
2036 | }
2037 |
2038 | createMultiLine <- function (theXYs) {
2039 |
2040 | connectedPoints <- tcltk::tkcreate(mainFigureCanvas, "line",
2041 | as.character(c(head(theXYs,-2L))),
2042 | width = 3,
2043 | fill = get_juicr("pointColor"),
2044 | arrow = "last")
2045 | # add unique ID
2046 | tcltk::tkaddtag(mainFigureCanvas, point_pointToIndex(point_add()), "withtag", connectedPoints)
2047 | # add grouping ID
2048 | tcltk::tkaddtag(mainFigureCanvas, as.character(tcltk::tclvalue(pointGroup)), "withtag", connectedPoints)
2049 | # add common ID
2050 | tcltk::tkaddtag(mainFigureCanvas, "line", "withtag", connectedPoints)
2051 |
2052 | # add all common tag ID
2053 | tcltk::tkaddtag(mainFigureCanvas, "extraction", "withtag", connectedPoints)
2054 |
2055 | }
2056 |
2057 | mainFigureClick <- function(x, y) {
2058 |
2059 | xPos <- as.numeric(tcltk::tcl(mainFigureCanvas$ID, "canvasx", as.integer(x)))
2060 | yPos <- as.numeric(tcltk::tcl(mainFigureCanvas$ID, "canvasy", as.integer(y)))
2061 |
2062 | if(!any(get_juicr("y_calibrate"), get_juicr("x_calibrate"), get_juicr("y_startCalibrate"), get_juicr("x_startCalibrate"), get_juicr("y_endCalibrate"), get_juicr("x_endCalibrate"), as.character(tcltk::tkcget(barPlotButton, "-relief")) == "sunken", as.character(tcltk::tkcget(linePlotButton, "-relief")) == "sunken")) {
2063 | createPoint(xPos, yPos)
2064 | }
2065 |
2066 | ### START: axis calibration
2067 | if(get_juicr("x_startCalibrate") == TRUE) {
2068 | xyPos <- as.numeric(tcltk::tkcoords(mainFigureCanvas, x_calibrationLine))
2069 | update_X_axis(xyPos[1], xyPos[2], xPos, xyPos[2])
2070 | set_juicr("x_startCalibrate", FALSE); set_juicr("x_endCalibrate", FALSE); set_juicr("x_calibrate", FALSE);
2071 | tcltk::tkconfigure(calibrationXButton, relief = "raised");
2072 | }
2073 |
2074 | if(get_juicr("x_calibrate") == TRUE) {
2075 | update_X_axis(xPos, yPos, xPos + 30, yPos)
2076 | set_juicr("x_startCalibrate", TRUE)
2077 | }
2078 |
2079 | if(get_juicr("y_startCalibrate") == TRUE) {
2080 | xyPos <- as.numeric(tcltk::tkcoords(mainFigureCanvas, y_calibrationLine))
2081 | update_Y_axis(xyPos[1], xyPos[2], xyPos[1], yPos)
2082 | set_juicr("y_startCalibrate", FALSE); set_juicr("y_endCalibrate", FALSE); set_juicr("y_calibrate", FALSE);
2083 | tcltk::tkconfigure(calibrationYButton, relief = "raised");
2084 | }
2085 |
2086 | if(get_juicr("y_calibrate") == TRUE) {
2087 | update_Y_axis(xPos, yPos, xPos, yPos + 30)
2088 | set_juicr("y_startCalibrate", TRUE)
2089 | }
2090 | ### END: X-axis calibration
2091 |
2092 | if(as.character(tcltk::tkcget(errorXbutton, "-relief")) == "sunken" && as.character(tcltk::tkcget(barPlotButton, "-relief")) == "sunken") {
2093 | if(get_juicr("x_startError") == TRUE) {
2094 | xyPos <- as.numeric(tcltk::tkcoords(mainFigureCanvas, x_errorLine))
2095 | createErrorBarX(xyPos[1], xyPos[2], xPos, xyPos[2])
2096 | tcltk::tkcoords(mainFigureCanvas, x_errorLine, 1, 1, 1, 1)
2097 | set_juicr("x_startError", FALSE); set_juicr("x_endError", FALSE); set_juicr("x_error", FALSE);
2098 | }
2099 |
2100 | if(get_juicr("x_error") == TRUE) {
2101 | tcltk::tkitemconfigure(mainFigureCanvas, x_errorLine, width = 3)
2102 | tcltk::tkcoords(mainFigureCanvas, x_errorLine, xPos, yPos, xPos, yPos,
2103 | xPos, yPos - 7, xPos, yPos + 8)
2104 | set_juicr("x_startError", TRUE)
2105 | }
2106 | }
2107 |
2108 | if(as.character(tcltk::tkcget(errorYbutton, "-relief")) == "sunken" && as.character(tcltk::tkcget(barPlotButton, "-relief")) == "sunken") {
2109 | if(get_juicr("y_startError") == TRUE) {
2110 | xyPos <- as.numeric(tcltk::tkcoords(mainFigureCanvas, y_errorLine))
2111 | createErrorBarY(xyPos[1], xyPos[2], xyPos[1], yPos)
2112 | tcltk::tkcoords(mainFigureCanvas, y_errorLine, 1, 1, 1, 1)
2113 | set_juicr("y_startError", FALSE); set_juicr("y_endError", FALSE); set_juicr("y_error", FALSE);
2114 | }
2115 |
2116 | if(get_juicr("y_error") == TRUE) {
2117 | tcltk::tkitemconfigure(mainFigureCanvas, y_errorLine, width = 3)
2118 | tcltk::tkcoords(mainFigureCanvas, y_errorLine, xPos, yPos, xPos, yPos,
2119 | xPos - 7, yPos, xPos + 8, yPos)
2120 | set_juicr("y_startError", TRUE)
2121 | }
2122 | }
2123 |
2124 | if(as.character(tcltk::tkcget(errorXbutton, "-relief")) == "sunken" && as.character(tcltk::tkcget(barPlotButton, "-relief")) == "sunken") {set_juicr("x_error", TRUE); set_juicr("y_error", FALSE);}
2125 | if(as.character(tcltk::tkcget(errorYbutton, "-relief")) == "sunken" && as.character(tcltk::tkcget(barPlotButton, "-relief")) == "sunken") {set_juicr("y_error", TRUE); set_juicr("x_error", FALSE);}
2126 |
2127 |
2128 | if(as.character(tcltk::tkcget(regressionButton, "-relief")) == "sunken" && as.character(tcltk::tkcget(linePlotButton, "-relief")) == "sunken") {
2129 | if(get_juicr("x_startRegression") == TRUE) {
2130 | xyPos <- as.numeric(tcltk::tkcoords(mainFigureCanvas, x_regressionLine))
2131 | createRegressionLine(xyPos[1], xyPos[2], xPos, yPos)
2132 | tcltk::tkcoords(mainFigureCanvas, x_regressionLine, 1, 1, 1, 1)
2133 | set_juicr("x_startRegression", FALSE); set_juicr("x_endRegression", FALSE); set_juicr("x_regression", FALSE);
2134 | }
2135 | if(get_juicr("x_regression") == TRUE) {
2136 | tcltk::tkitemconfigure(mainFigureCanvas, x_regressionLine, width = 3)
2137 | tcltk::tkcoords(mainFigureCanvas, x_regressionLine, xPos, yPos, xPos, yPos)
2138 | set_juicr("x_startRegression", TRUE)
2139 | }
2140 | }
2141 |
2142 | if(as.character(tcltk::tkcget(regressionButton, "-relief")) == "sunken" && as.character(tcltk::tkcget(linePlotButton, "-relief")) == "sunken") {set_juicr("x_regression", TRUE);}
2143 |
2144 | if(as.character(tcltk::tkcget(connectedButton, "-relief")) == "sunken" && as.character(tcltk::tkcget(linePlotButton, "-relief")) == "sunken") {
2145 | if(get_juicr("x_startConnected") == TRUE) {
2146 | xyPos <- as.numeric(tcltk::tkcoords(mainFigureCanvas, x_connectedLine))
2147 | set_juicr("x_connectedPos", xPos); set_juicr("y_connectedPos", yPos)
2148 | tcltk::tkcoords(mainFigureCanvas, x_connectedLine, as.character(c(xyPos, xPos, yPos)))
2149 |
2150 | set_juicr("x_startConnected", FALSE); set_juicr("x_endConnected", FALSE); #set_juicr("x_connected", FALSE);
2151 | }
2152 | if(get_juicr("x_connected") == TRUE) {
2153 | tcltk::tkitemconfigure(mainFigureCanvas, x_connectedLine, width = 3)
2154 | xyPos <- as.numeric(tcltk::tkcoords(mainFigureCanvas, x_connectedLine))
2155 | if(length(xyPos) == 4) {tcltk::tkcoords(mainFigureCanvas, x_connectedLine, xPos, yPos, xPos, yPos)}
2156 | else {tcltk::tkcoords(mainFigureCanvas, x_connectedLine, as.character(c(head(xyPos,-2L), xPos, yPos)))}
2157 | set_juicr("x_startConnected", TRUE)
2158 | }
2159 | }
2160 |
2161 | if(as.character(tcltk::tkcget(connectedButton, "-relief")) == "sunken" && as.character(tcltk::tkcget(linePlotButton, "-relief")) == "sunken") {set_juicr("x_connected", TRUE);}
2162 |
2163 | # update summary canvas
2164 | updatedSummary <- point_summary()
2165 | tcltk::tkitemconfigure(txtCanvas, theDataText, text = updatedSummary)
2166 |
2167 | }
2168 |
2169 | ##---------------------------
2170 | ## END: interactivity
2171 | ##---------------------------
2172 |
2173 |
2174 |
2175 | if(openJuicrFile != "") {
2176 |
2177 | openJuicr <- function(openJuicrFile){
2178 |
2179 | # collect tables from juicr .html file
2180 | inputTables <- XML::readHTMLTable(openJuicrFile)
2181 |
2182 | # update parameters
2183 | tcltk::tkdelete(theNotes, "0.0", "end"); tcltk::tkinsert(theNotes, "1.0", inputTables$parameters$theNotes)
2184 |
2185 | tcltk::tkconfigure(circleSmallButton, relief = inputTables$parameters$circleSmallButton)
2186 | tcltk::tkconfigure(circleMediumButton, relief = inputTables$parameters$circleMediumButton)
2187 | tcltk::tkconfigure(circleBigButton, relief = inputTables$parameters$circleBigButton)
2188 | tcltk::tkdelete(circleSizeDisplay, "0.0", "end"); tcltk::tkinsert(circleSizeDisplay, "1.0", inputTables$parameters$circleSizeDisplay)
2189 |
2190 | tcltk::tkconfigure(highQualityButton, relief = inputTables$parameters$highQualityButton)
2191 | tcltk::tkconfigure(lowQualityButton, relief = inputTables$parameters$lowQualityButton)
2192 | tcltk::tkdelete(qualityDisplay, "0.0", "end"); tcltk::tkinsert(qualityDisplay, "1.0", inputTables$parameters$qualityDisplay)
2193 |
2194 | tcltk::tkconfigure(circleCircleButton, relief = inputTables$parameters$circleCircleButton)
2195 | tcltk::tkconfigure(circleDiamondButton, relief = inputTables$parameters$circleDiamondButton)
2196 | tcltk::tkconfigure(circleSquareButton, relief = inputTables$parameters$circleSquareButton)
2197 | tcltk::tkconfigure(circleClosedButton, relief = inputTables$parameters$circleClosedButton)
2198 | tcltk::tkconfigure(circleOpenButton, relief = inputTables$parameters$circleOpenButton)
2199 |
2200 | tcltk::tkconfigure(barSmallButton, relief = inputTables$parameters$barSmallButton)
2201 | tcltk::tkconfigure(barMediumButton, relief = inputTables$parameters$barMediumButton)
2202 | tcltk::tkconfigure(barBigButton, relief = inputTables$parameters$barBigButton)
2203 | tcltk::tkdelete(barSizeDisplay, "0.0", "end"); tcltk::tkinsert(barSizeDisplay, "1.0", inputTables$parameters$barSizeDisplay)
2204 |
2205 | tcltk::tkdelete(figureXminDisplay, "0.0", "end"); tcltk::tkinsert(figureXminDisplay, "1.0", inputTables$parameters$figureXminDisplay)
2206 | tcltk::tkdelete(figureXmaxDisplay, "0.0", "end"); tcltk::tkinsert(figureXmaxDisplay, "1.0", inputTables$parameters$figureXmaxDisplay)
2207 | tcltk::tkdelete(figureXcaptionDisplay, "0.0", "end"); tcltk::tkinsert(figureXcaptionDisplay, "1.0", inputTables$parameters$figureXcaptionDisplay)
2208 | tcltk::tkdelete(figureXunitsDisplay, "0.0", "end"); tcltk::tkinsert(figureXunitsDisplay, "1.0", inputTables$parameters$figureXunitsDisplay)
2209 | tcltk::tkdelete(figureYminDisplay, "0.0", "end"); tcltk::tkinsert(figureYminDisplay, "1.0", inputTables$parameters$figureYminDisplay)
2210 | tcltk::tkdelete(figureYmaxDisplay, "0.0", "end"); tcltk::tkinsert(figureYmaxDisplay, "1.0", inputTables$parameters$figureYmaxDisplay)
2211 | tcltk::tkdelete(figureYcaptionDisplay, "0.0", "end"); tcltk::tkinsert(figureYcaptionDisplay, "1.0", inputTables$parameters$figureYcaptionDisplay)
2212 | tcltk::tkdelete(figureYunitsDisplay, "0.0", "end"); tcltk::tkinsert(figureYunitsDisplay, "1.0", inputTables$parameters$figureYunitsDisplay)
2213 |
2214 | tcltk::tkset(meanComboBox, inputTables$parameters$meanComboBox)
2215 | tcltk::tkset(errorComboBox, inputTables$parameters$errorComboBox)
2216 |
2217 | for(i in 1:8) {
2218 | eval(parse(text = paste0(
2219 | " tcltk::tkconfigure(groupRadio", i ,"Label, foreground = inputTables$parameters$groupRadio", i ,"LabelStatus)
2220 | tcltk::tkdelete(groupRadio", i ,"Label, \"0.0\", \"end\")
2221 | tcltk::tkinsert(groupRadio", i ,"Label, \"1.0\", inputTables$parameters$groupRadio", i ,"Label)
2222 | "))
2223 | )
2224 | }
2225 |
2226 | # collect color groups
2227 | theColorGroups <- c(inputTables$parameters$groupRadio1Label,
2228 | inputTables$parameters$groupRadio2Label,
2229 | inputTables$parameters$groupRadio3Label,
2230 | inputTables$parameters$groupRadio4Label,
2231 | inputTables$parameters$groupRadio5Label,
2232 | inputTables$parameters$groupRadio6Label,
2233 | inputTables$parameters$groupRadio7Label,
2234 | inputTables$parameters$groupRadio8Label)
2235 |
2236 | theColorGroupsColor <- c(inputTables$parameters$groupRadio1LabelStatus,
2237 | inputTables$parameters$groupRadio2LabelStatus,
2238 | inputTables$parameters$groupRadio3LabelStatus,
2239 | inputTables$parameters$groupRadio4LabelStatus,
2240 | inputTables$parameters$groupRadio5LabelStatus,
2241 | inputTables$parameters$groupRadio6LabelStatus,
2242 | inputTables$parameters$groupRadio7LabelStatus,
2243 | inputTables$parameters$groupRadio8LabelStatus)
2244 |
2245 |
2246 | # update calibration lines
2247 | tcltk::tkitemconfigure(mainFigureCanvas, x_calibrationLine, width = 5)
2248 | loadedX <- as.numeric(inputTables$axes$X); update_X_axis(loadedX[1],
2249 | loadedX[2],
2250 | loadedX[3],
2251 | loadedX[4])
2252 | tcltk::tkitemconfigure(mainFigureCanvas, y_calibrationLine, width = 5)
2253 | loadedY <- as.numeric(inputTables$axes$Y); update_Y_axis(loadedY[1],
2254 | loadedY[2],
2255 | loadedY[3],
2256 | loadedY[4])
2257 |
2258 |
2259 |
2260 | # add autobars
2261 | loadedAutoBars <- inputTables$points[inputTables$points$group == "autobar", ]
2262 | if(nrow(loadedAutoBars) != 0) {
2263 | for(i in 1:nrow(loadedAutoBars)) autoBar(as.numeric(loadedAutoBars$x.coord[i]),
2264 | as.numeric(loadedAutoBars$y.coord[i]),
2265 | yAdjust = 3)
2266 | }
2267 |
2268 |
2269 | # add autopoints
2270 | loadedAutoPoints <- inputTables$points[inputTables$points$group == "auto", ]
2271 | if(nrow(loadedAutoPoints) != 0) {
2272 | for(i in 1:nrow(loadedAutoPoints)) autoPoint(as.numeric(loadedAutoPoints$x.coord[i]),
2273 | as.numeric(loadedAutoPoints$y.coord[i]))
2274 | }
2275 |
2276 | # add autoclusters
2277 | loadedAutoClusters <- inputTables$points[inputTables$points$group == "cluster", ]
2278 | if(nrow(loadedAutoClusters) != 0) {
2279 | for(i in 1:nrow(loadedAutoClusters)) autoCluster(as.numeric(loadedAutoClusters$x.coord[i]),
2280 | as.numeric(loadedAutoClusters$y.coord[i]))
2281 | }
2282 |
2283 | # add manual points
2284 | for(i in 1:8) {
2285 | eval(parse(text = paste0(
2286 | "if(inputTables$parameters$groupRadio", i ,"LabelStatus != \"white\") {
2287 | loadedManualPoints <- inputTables$points[inputTables$points$group == inputTables$parameters$groupRadio", i ,"Label, ]
2288 | if(nrow(loadedManualPoints) != 0) {
2289 | set_juicr(\"pointColor\", inputTables$parameters$groupRadio", i ,"LabelStatus)
2290 | tcltk::tcl(groupRadio", i ,", \"select\")
2291 | for(i in 1:nrow(loadedManualPoints)) createPoint(as.numeric(loadedManualPoints$x.coord[i]),
2292 | as.numeric(loadedManualPoints$y.coord[i]))
2293 | }
2294 | }"))
2295 | )
2296 | }
2297 |
2298 | # add error bars TODO: colors
2299 | loadedErrorBars <- inputTables$errorbars
2300 | if(colnames(loadedErrorBars)[1] != "no extractions") {
2301 | for(i in 1:nrow(loadedErrorBars)) {
2302 |
2303 | if(loadedErrorBars$axis[i] == "y") {
2304 |
2305 | eval(parse(text = paste0("tcltk::tcl(groupRadio", which(theColorGroups == loadedErrorBars$group[i]), " , \"select\")")))
2306 | set_juicr("pointColor", theColorGroupsColor[which(theColorGroups == loadedErrorBars$group[i])])
2307 | createErrorBarY(as.numeric(loadedErrorBars$mean.x[i]),
2308 | as.numeric(loadedErrorBars$mean.y[i]),
2309 | as.numeric(loadedErrorBars$error.x[i]),
2310 | as.numeric(loadedErrorBars$error.y[i]))
2311 | }
2312 |
2313 | if(loadedErrorBars$axis[i] == "x") {
2314 | eval(parse(text = paste0("tcltk::tcl(groupRadio", which(theColorGroups == loadedErrorBars$group[i]), " , \"select\")")))
2315 | set_juicr("pointColor", theColorGroupsColor[which(theColorGroups == loadedErrorBars$group[i])])
2316 | createErrorBarX(as.numeric(loadedErrorBars$mean.x[i]),
2317 | as.numeric(loadedErrorBars$mean.y[i]),
2318 | as.numeric(loadedErrorBars$error.x[i]),
2319 | as.numeric(loadedErrorBars$error.y[i]))
2320 | }
2321 | }
2322 | }
2323 |
2324 |
2325 | loadedRegressions <- inputTables$regressions
2326 | if(colnames(loadedRegressions)[1] != "no extractions") {
2327 | for(i in 1:nrow(loadedRegressions)) {
2328 | eval(parse(text = paste0("tcltk::tcl(groupRadio", which(theColorGroups == loadedRegressions$group[i]), " , \"select\")")))
2329 | set_juicr("pointColor", theColorGroupsColor[which(theColorGroups == loadedRegressions$group[i])])
2330 | createRegressionLine(as.numeric(loadedRegressions$x1.coord[i]),
2331 | as.numeric(loadedRegressions$y1.coord[i]),
2332 | as.numeric(loadedRegressions$x2.coord[i]),
2333 | as.numeric(loadedRegressions$y2.coord[i]))
2334 | }
2335 | }
2336 |
2337 | loadedMultiLines <- inputTables$lines
2338 | if(colnames(loadedMultiLines)[1] != "no extractions") {
2339 |
2340 | for(j in unique(inputTables$lines$set)) {
2341 | theSet <- inputTables$lines[ which(j == inputTables$lines$set), ]
2342 | eval(parse(text = paste0("tcltk::tcl(groupRadio", which(theColorGroups == theSet$group[1]), " , \"select\")")))
2343 |
2344 | setCoords <- unlist(strsplit(paste(theSet[, 3], theSet[, 4], sep = " ", collapse = " "), " "))
2345 | set_juicr("pointColor", theColorGroupsColor[which(theColorGroups == theSet$group[1])])
2346 |
2347 | createMultiLine(setCoords)
2348 | }
2349 | }
2350 |
2351 | tcltk::tkitemconfigure(txtCanvas, theDataText, text = point_summary())
2352 | }
2353 |
2354 | openJuicr(openJuicrFile)
2355 | }
2356 |
2357 |
2358 |
2359 |
2360 |
2361 | ####################################
2362 | # START: mouse and keyboard bindings
2363 |
2364 | tcltk::tkitembind(mainFigureCanvas, mainFigure, "", mainFigureMouseOver)
2365 | tcltk::tkitembind(mainFigureCanvas, mainFigure, "", mainFigureClick)
2366 |
2367 | tcltk::tkitembind(mainFigureCanvas, x_calibrationLine, "", mainFigureClick)
2368 | tcltk::tkitembind(mainFigureCanvas, x_calibrationLine, "", mainFigureMouseOver)
2369 | tcltk::tkitembind(mainFigureCanvas, y_calibrationLine, "", mainFigureClick)
2370 | tcltk::tkitembind(mainFigureCanvas, y_calibrationLine, "", mainFigureMouseOver)
2371 |
2372 | tcltk::tkitembind(mainFigureCanvas, x_errorLine, "", mainFigureClick)
2373 | tcltk::tkitembind(mainFigureCanvas, x_errorLine, "", mainFigureMouseOver)
2374 | tcltk::tkitembind(mainFigureCanvas, y_errorLine, "", mainFigureClick)
2375 | tcltk::tkitembind(mainFigureCanvas, y_errorLine, "", mainFigureMouseOver)
2376 |
2377 | tcltk::tkitembind(mainFigureCanvas, x_regressionLine, "", mainFigureClick)
2378 | tcltk::tkitembind(mainFigureCanvas, x_regressionLine, "", mainFigureMouseOver)
2379 |
2380 | tcltk::tkitembind(mainFigureCanvas, x_connectedLine, "", mainFigureClick)
2381 | tcltk::tkitembind(mainFigureCanvas, x_connectedLine, "", mainFigureMouseOver)
2382 |
2383 | tcltk::tkitembind(mainFigureCanvas, "point", "", mainFigureClick)
2384 | tcltk::tkitembind(mainFigureCanvas, "point", "", function() {
2385 | if((point_getTags("current")[2] != "autobar") && (point_getTags("current")[2] != "auto") && (point_getTags("current")[2] != "cluster")) {set_juicr("tempPointColor", tcltk::tkitemcget(mainFigureCanvas, "current", "-fill")); tcltk::tkitemconfigure(mainFigureCanvas, "current", width = 4, outline = "tomato3", fill = "tomato3");}
2386 | theCoords <- point_getCoordinates("current")
2387 | theCOORD <- sprintf(" %5s,%5s ", round(theCoords[1], 1), round(theCoords[2], 1))
2388 | tcltk::tkcoords(mainFigureCanvas, hoverText, round(theCoords[1], 2) + 50, round(theCoords[2], 2) - 2)
2389 | tcltk::tkitemconfigure(mainFigureCanvas, hoverText, text = theCOORD)
2390 | tcltk::tkitemconfigure(mainFigureCanvas, hoverShadow, image = hoverImage)
2391 | tcltk::tkcoords(mainFigureCanvas, hoverShadow, round(theCoords[1], 2) + 13, round(theCoords[2], 2) - 9)
2392 | tcltk::tkitemraise(mainFigureCanvas, hoverShadow)
2393 | tcltk::tkitemraise(mainFigureCanvas, hoverText)
2394 | })
2395 | tcltk::tkitembind(mainFigureCanvas, "point", "", function() {
2396 | if((point_getTags("current")[2] != "autobar") && (point_getTags("current")[2] != "auto") && (point_getTags("current")[2] != "cluster")) {tcltk::tkitemconfigure(mainFigureCanvas, "current", width = 1, outline = "white", fill = get_juicr("tempPointColor"));}
2397 | tcltk::tkitemconfigure(mainFigureCanvas, hoverText, text = "")
2398 | tcltk::tkcoords(mainFigureCanvas, hoverText, 0, 0)
2399 | tcltk::tkitemconfigure(mainFigureCanvas, hoverShadow, image = "")
2400 | tcltk::tkcoords(mainFigureCanvas, hoverShadow, 0, 0)
2401 | })
2402 | tcltk::tkitembind(mainFigureCanvas, "point", "", deletePoint)
2403 | tcltk::tkitembind(mainFigureCanvas, "point", "", mainFigureMouseOver)
2404 |
2405 | tcltk::tkitembind(mainFigureCanvas, "error", "", mainFigureClick)
2406 | tcltk::tkitembind(mainFigureCanvas, "error", "", function() {tcltk::tkitemconfigure(mainFigureCanvas, "current", width = 4, fill = "tomato3")})
2407 | tcltk::tkitembind(mainFigureCanvas, "error", "", function() {tcltk::tkitemconfigure(mainFigureCanvas, "current", width = 3, fill = get_juicr("pointColor"))})
2408 | tcltk::tkitembind(mainFigureCanvas, "error", "", deletePoint)
2409 | tcltk::tkitembind(mainFigureCanvas, "error", "", mainFigureMouseOver)
2410 |
2411 | tcltk::tkitembind(mainFigureCanvas, "regression", "", mainFigureClick)
2412 | tcltk::tkitembind(mainFigureCanvas, "regression", "", function() {tcltk::tkitemconfigure(mainFigureCanvas, "current", width = 4, fill = "tomato3")})
2413 | tcltk::tkitembind(mainFigureCanvas, "regression", "", function() {tcltk::tkitemconfigure(mainFigureCanvas, "current", width = 3, fill = get_juicr("pointColor"))})
2414 | tcltk::tkitembind(mainFigureCanvas, "regression", "", deletePoint)
2415 | tcltk::tkitembind(mainFigureCanvas, "regression", "", mainFigureMouseOver)
2416 |
2417 | tcltk::tkitembind(mainFigureCanvas, "line", "", mainFigureClick)
2418 | tcltk::tkitembind(mainFigureCanvas, "line", "", function() {tcltk::tkitemconfigure(mainFigureCanvas, "current", width = 4, fill = "tomato3")})
2419 | tcltk::tkitembind(mainFigureCanvas, "line", "", function() {tcltk::tkitemconfigure(mainFigureCanvas, "current", width = 3, fill = get_juicr("pointColor"))})
2420 | tcltk::tkitembind(mainFigureCanvas, "line", "", deletePoint)
2421 | tcltk::tkitembind(mainFigureCanvas, "line", "", mainFigureMouseOver)
2422 |
2423 | theInputText <- c(paste0("groupRadio", 1:8, "Label"), "figureXcaptionDisplay", "figureYcaptionDisplay", "figureXunitsDisplay", "figureYunitsDisplay", "figureXminDisplay", "figureXmaxDisplay", "figureYminDisplay", "figureYmaxDisplay")
2424 | for(i in theInputText) eval(parse(text = paste0("tcltk::tkbind(", i, ", \"\", function() {tcltk::tkitemconfigure(txtCanvas, theDataText, text = point_summary())})")))
2425 |
2426 | ####################################
2427 | # END: mouse and keyboard bindings
2428 | }
2429 |
2430 |
2431 |
2432 | #############################################################################
2433 | #############################################################################
2434 |
2435 |
2436 | #############################################################################
2437 | # START: LOAD & PROCESS FIGURE IMAGE
2438 |
2439 | # FIGURE IMAGE PROCESSING
2440 | get_standardizedFileNames <- function(aFileName) {
2441 | return(paste0(strsplit(aFileName, "[.]")[[1]][1],"_juicr.png"))
2442 | }
2443 |
2444 | standardizeImage <- function(aFileName) {
2445 | newImage <- EBImage::readImage(aFileName)
2446 |
2447 | if(standardizeTheImage == TRUE) {
2448 | if(dim(newImage)[1] > standardSize) newImage <- EBImage::resize(newImage, w = standardSize)
2449 | }
2450 |
2451 | EBImage::writeImage(x = newImage,
2452 | file = paste0(strsplit(aFileName, "[.]")[[1]][1],"_juicr.png"),
2453 | type = "png")
2454 | return(get_standardizedFileNames(aFileName))
2455 | }
2456 | # END: LOAD & PROCESS FIGURE IMAGE
2457 | ##################################
2458 |
2459 |
2460 | # # # # # # # # # # # # # # # # # # #
2461 | ##### START OF JUICR GUI WINDOW #####
2462 | # # # # # # # # # # # # # # # # # # #
2463 |
2464 |
2465 |
2466 | mainExtractorWindow <- tcltk::tktoplevel(bg = "white", width = 2000, height = 1000)
2467 | tcltk::tktitle(mainExtractorWindow) <- "juicr: image data extractor"
2468 | tcltk::tcl("wm", "iconphoto", mainExtractorWindow, juicrLogo)
2469 |
2470 | # create mainExtractorWindow environment to store globals
2471 | main.env <- new.env()
2472 | set_main <- function(aMainVar, aValue) assign(aMainVar, aValue, envir = main.env)
2473 | get_main <- function(aMainVar) get(aMainVar, envir = main.env)
2474 |
2475 | # image summary functions
2476 | theFigureSmall <- tcltk::tcl("image", "create", "photo")
2477 | getFigureSmall <- function() return(theFigureSmall)
2478 | update_FigureSmall <- function() {
2479 | tcltk::tcl(theFigureSmall, "copy", get_allJuicrImages()[getCurrentJuicrFrame()], "-subsample", 2, 2)
2480 | tcltk::tkconfigure(button_previewImage, image = getFigureSmall())
2481 | }
2482 |
2483 | # START of multi-juicr frames
2484 | set_main("numberJuicrFrames", 0)
2485 | addAJuicrFrame <- function() set_main("numberJuicrFrames", get_main("numberJuicrFrames") + 1)
2486 |
2487 | createNewJuicrFrame <- function(aFileName, sourceHTML) {
2488 |
2489 | if(sourceHTML == TRUE) {
2490 |
2491 | # collect tables from juicr .html file
2492 | inputTables <- XML::readHTMLTable(aFileName)
2493 |
2494 | # collect standardized figure from juicr .html file
2495 | juicrHTML = XML::htmlParse(aFileName)
2496 | inputImages <- XML::xpathSApply(juicrHTML, "//table/tr/td/img", XML::xmlAttrs)["src", ]
2497 | sourceHTML <- aFileName
2498 |
2499 |
2500 | # re-create original image but avoid erasing original if in folder
2501 |
2502 | tempOrginalFileName <- paste0("temp_", inputTables$files$file_name[1])
2503 | file.create(tempOrginalFileName)
2504 | tempImageFile <- file(tempOrginalFileName, "wb")
2505 | writeBin(RCurl::base64Decode(sub(".*,", "", inputImages[1]), mode = "raw"),
2506 | tempImageFile, useBytes = TRUE)
2507 | close(tempImageFile)
2508 | aFileName <- tempOrginalFileName
2509 |
2510 | # re-create standardized image
2511 | file.create(inputTables$files$file_name[2])
2512 | tempImageFile <- file(inputTables$files$file_name[2], "wb")
2513 | writeBin(RCurl::base64Decode(sub(".*,", "", inputImages[2]), mode = "raw"),
2514 | tempImageFile, useBytes = TRUE)
2515 | close(tempImageFile)
2516 | theStandardizedImageFile <- inputTables$files$file_name[2]
2517 |
2518 | } else {
2519 | theStandardizedImageFile <- standardizeImage(aFileName)
2520 | sourceHTML <- ""
2521 | }
2522 |
2523 | #theOriginalFigure <- EBImage::readImage(theStandardizedImageFile)
2524 |
2525 | # the figure displayed in frame widget
2526 | theFigure <- tcltk::tcl("image", "create", "photo", file = theStandardizedImageFile)
2527 |
2528 | # the figure not displayed but gets juiced for extractions
2529 | theFigureJuiced <- EBImage::readImage(theStandardizedImageFile)
2530 |
2531 | addAJuicrFrame()
2532 | add_allJuicrImages(as.character(theFigure))
2533 |
2534 | eval(parse(text = paste0("juicrFrame", get_main("numberJuicrFrames"),
2535 | " <- tcltk::tkframe(mainExtractorWindow, background = \"white\"); createJuicrFrame(juicrFrame", get_main("numberJuicrFrames"),
2536 | ", aFileName, theStandardizedImageFile, theFigure, theFigureJuiced, ", animateDelay,
2537 | ", sourceHTML);")))
2538 |
2539 | if(get_main("numberJuicrFrames") == 1) {
2540 | eval(parse(text = "tcltk::tkpack(juicrFrame1)"))
2541 | tcltk::tcl(theFigureSmall, "copy", theFigure, "-subsample", 2, 2)
2542 | }
2543 | #file.remove(theStandardizedImageFile)
2544 | #update_ArrowButtons(); if(animateDelay != FALSE) {tcltk::tcl("update"); Sys.sleep(1);}
2545 | eval(parse(text = paste0("return(as.character(juicrFrame", get_main("numberJuicrFrames"), "))")))
2546 | }
2547 |
2548 | createManyJuicrFrames <- function(aFileList, sourceHTML = FALSE) {
2549 | theJuicrFrames <- c()
2550 | if(length(aFileList) != 1) {
2551 | tempPB <- tcltk::tkProgressBar(title = "juicr: Processing files", label = "",
2552 | min = 1, max = length(aFileList), initial = 1, width = 500)
2553 | for(i in 1:length(aFileList)) {
2554 | tcltk::setTkProgressBar(tempPB, i, title = paste("juicr: Processing files = ", basename(aFileList[i])), "")
2555 | theJuicrFrames <- c(theJuicrFrames, createNewJuicrFrame(aFileList[i], sourceHTML)[1])
2556 | #update_ArrowButtons(); if(animateDelay != FALSE) {tcltk::tcl("update"); Sys.sleep(1); };
2557 | tcltk::tcl("update");
2558 | }
2559 | close(tempPB)
2560 | } else {
2561 | theJuicrFrames <- c(theJuicrFrames, createNewJuicrFrame(aFileList, sourceHTML)[1])
2562 | #update_ArrowButtons(); if(animateDelay != FALSE) {tcltk::tcl("update"); Sys.sleep(1); };
2563 | }
2564 | set_main("currentJuicrFrame", 1)
2565 | return(theJuicrFrames)
2566 | }
2567 |
2568 |
2569 | # juicr frame management
2570 |
2571 | set_main("currentJuicrFrame", 0)
2572 | getCurrentJuicrFrame <- function() return(get_main("currentJuicrFrame"))
2573 |
2574 | previousJuicrFrame <- function() {
2575 | if(getCurrentJuicrFrame() <= 1) return()
2576 | tcltk::tkpack.forget(get_main("allJuicrFrames")[getCurrentJuicrFrame()])
2577 | set_main("currentJuicrFrame", getCurrentJuicrFrame() - 1)
2578 | tcltk::tkpack(get_main("allJuicrFrames")[getCurrentJuicrFrame()])
2579 | return()
2580 | }
2581 |
2582 | nextJuicrFrame <- function() {
2583 | if(getCurrentJuicrFrame() == length(get_main("allJuicrFrames"))) return()
2584 | tcltk::tkpack.forget(get_main("allJuicrFrames")[getCurrentJuicrFrame()])
2585 | set_main("currentJuicrFrame", getCurrentJuicrFrame() + 1)
2586 | tcltk::tkpack(get_main("allJuicrFrames")[getCurrentJuicrFrame()])
2587 | return()
2588 | }
2589 |
2590 | set_main("allJuicrFrames", c())
2591 | get_allJuicrFrames <- function() return(get_main("allJuicrFrames"))
2592 | set_allJuicrFrames <- function(aJuicrFrameList) set_main("allJuicrFrames", aJuicrFrameList)
2593 | add_allJuicrFrames <- function(someJuicrFiles, sourceHTML = FALSE) {
2594 | set_allJuicrFrames(c(get_allJuicrFrames(), createManyJuicrFrames(someJuicrFiles, sourceHTML)))
2595 | }
2596 |
2597 | next_numberJuicrFrames <- function() return(length(get_main("allJuicrFrames")) - getCurrentJuicrFrame())
2598 | previous_numberJuicrFrames <- function() return(length(get_main("allJuicrFrames")) - next_numberJuicrFrames() - 1)
2599 |
2600 | get_JuicrFilenames <- function() {
2601 | aFile <- tcltk::tkgetOpenFile(filetypes = "{{juicr files} {_juicr.html}} {{All files} *}",
2602 | multiple = TRUE,
2603 | title = "juicr: open 1 or many juicr files")
2604 |
2605 | return(as.character(aFile))
2606 | }
2607 |
2608 | get_ImageFilenames <- function() {
2609 | aFile <- tcltk::tkgetOpenFile(filetypes = "{{image files} {.jpg .png .tiff}} {{All files} *}",
2610 | multiple = TRUE,
2611 | title = "juicr: open 1 or many image files with a plot to extract")
2612 | return(as.character(aFile))
2613 | }
2614 |
2615 | get_SourceFilenames <- function() {
2616 | aFile <- tcltk::tkgetOpenFile(filetypes = paste0("{{source file} {", theFigureFile[getCurrentJuicrFrame()], "}}"),
2617 | multiple = TRUE,
2618 | title = "juicr: source of the current image")
2619 | return(aFile)
2620 | }
2621 |
2622 | # update_theFigureFile [was global] function(newFiles) theFigureFile <- c(theFigureFile, newFiles)
2623 | update_theFigureFile <- function(newFiles) theFigureFile <- c(theFigureFile, newFiles)
2624 |
2625 | set_main("allJuicrImages", c())
2626 | get_allJuicrImages <- function() return(get_main("allJuicrImages"))
2627 | set_allJuicrImages <- function(aJuicrImagesList) set_main("allJuicrImages", aJuicrImagesList)
2628 | add_allJuicrImages <- function(someJuicrImage) {
2629 | set_allJuicrImages(c(get_allJuicrImages(), someJuicrImage))
2630 | }
2631 |
2632 |
2633 | # START: image manipulation bar
2634 | fhead <- tcltk::tkframe(mainExtractorWindow, relief = "flat", bd = "1", background = "lightgrey", width = 1000)
2635 |
2636 | # get images or juicr html images
2637 | button_OpenNewImage <- tcltk::tkbutton(fhead, compound = "top",
2638 | text = "add new\n image(s)",
2639 | width = 80, height = 80, image = theOrange,
2640 | relief = "flat",
2641 | command = function(){
2642 | newFrames <- get_ImageFilenames();
2643 | if(!identical(newFrames, character(0))) {
2644 | tcltk::tkconfigure(button_OpenNewImage, text = paste0("adding ", length(newFrames), "\nimages..."));
2645 | tcltk::tcl("update");
2646 | add_allJuicrFrames(newFrames);
2647 | update_theFigureFile(newFrames);
2648 | update_ArrowButtons();
2649 | tcltk::tkconfigure(button_OpenNewImage, text = "add new\n image(s)");
2650 | tcltk::tkconfigure(button_previewImage, state = "active")
2651 | tcltk::tkconfigure(button_SaveAllImages, state = "active")
2652 | tcltk::tkconfigure(button_JuiceAllImages, state = "active")
2653 | tcltk::tkconfigure(button_leftArrow, state = "active");
2654 | tcltk::tkconfigure(button_rightArrow, state = "active");
2655 | }
2656 | })
2657 |
2658 | button_OpenJuicedImage <- tcltk::tkbutton(fhead, compound = "top",
2659 | text = "add juiced\n image(s)",
2660 | width = 80, height = 80, image = orangeJuice,
2661 | relief = "flat",
2662 | command = function(){
2663 | newFrames <- get_JuicrFilenames();
2664 | if(!identical(newFrames, character(0))) {
2665 | tcltk::tkconfigure(button_OpenJuicedImage, text = paste0("adding ", length(newFrames), "\nimages..."));
2666 | tcltk::tcl("update");
2667 | add_allJuicrFrames(newFrames, TRUE);
2668 | update_theFigureFile(newFrames);
2669 | update_ArrowButtons();
2670 | tcltk::tkconfigure(button_OpenJuicedImage, text = "add juiced\n image(s)");
2671 | tcltk::tkconfigure(button_previewImage, state = "active")
2672 | tcltk::tkconfigure(button_SaveAllImages, state = "active")
2673 | tcltk::tkconfigure(button_JuiceAllImages, state = "active")
2674 | tcltk::tkconfigure(button_leftArrow, state = "active");
2675 | tcltk::tkconfigure(button_rightArrow, state = "active");
2676 | }
2677 | })
2678 |
2679 | # start of multi-image toggle buttons
2680 | getText_leftArrow <- function() {
2681 | if(length(get_main("allJuicrFrames")) == 0) return("no other\nimages")
2682 | return(paste0("previous\n", previous_numberJuicrFrames(), " images"))
2683 | }
2684 |
2685 | getText_rightArrow <- function() {
2686 | if(length(get_main("allJuicrFrames")) == 0) return("no other\nimages")
2687 | return(paste0("next\n", next_numberJuicrFrames(), " images"))
2688 | }
2689 |
2690 | update_ArrowButtons <- function() {
2691 | tcltk::tkconfigure(button_leftArrow, text = getText_leftArrow())
2692 | tcltk::tkconfigure(button_rightArrow, text = getText_rightArrow())
2693 | tcltk::tkconfigure(button_leftArrow, state = "active")
2694 | tcltk::tkconfigure(button_rightArrow, state = "active")
2695 | }
2696 |
2697 | button_leftArrow <- tcltk::tkbutton(fhead, compound = "top", state = "disabled",
2698 | text = getText_leftArrow(),
2699 | width = 80, height = 80, image = leftArrowImage,
2700 | relief = "flat",
2701 | command = function(){ previousJuicrFrame(); update_ArrowButtons(); update_FigureSmall();})
2702 | button_previewImage <- tcltk::tkbutton(fhead, compound = "center", font = "Helvetica 8 bold", state = "disabled",
2703 | foreground = "tomato3",
2704 | text = "\n\n\n\n\n source",
2705 | width = 80, height = 80, image = getFigureSmall(),
2706 | relief = "flat",
2707 | command = function(){get_SourceFilenames();})
2708 | imageInformation <- tcltk::tktext(fhead, foreground = "lightgrey",
2709 | height = 6, width = 80, background = "lightgrey",
2710 | relief = "flat", font = "Helvetica 7")
2711 | button_rightArrow <- tcltk::tkbutton(fhead, compound = "top", state = "disabled",
2712 | text = getText_rightArrow(),
2713 | width = 80, height = 80, image = rightArrowImage,
2714 | relief = "flat",
2715 | command = function(){ nextJuicrFrame(); update_ArrowButtons(); update_FigureSmall();})
2716 |
2717 | # save multi-image button
2718 | button_SaveAllImages <- tcltk::tkbutton(fhead, compound = "top", state = "disabled",
2719 | text = "save all\n juiced image(s)",
2720 | width = 80, height = 80, image = juiceContainerSmall,
2721 | relief = "flat",
2722 | command = function() {
2723 | #theSaveDirectory <- tcltk::tkchooseDirectory()
2724 | someJuicrFrames <- get_allJuicrFrames()
2725 | for(i in 1:length(someJuicrFrames)) {
2726 | tcltk::tkconfigure(button_SaveAllImages, text = paste0("saving ", i, " of ", length(someJuicrFrames), "\n.html files"))
2727 | tcltk::tcl("update")
2728 | tcltk::tkinvoke(paste0(someJuicrFrames[i], ".4.4.2"));
2729 | nextJuicrFrame(); update_ArrowButtons(); update_FigureSmall();
2730 | }
2731 | tcltk::tkconfigure(button_SaveAllImages, text = "save all\n juiced image(s)")
2732 | })
2733 |
2734 | # save multi-image button
2735 | button_JuiceAllImages <- tcltk::tkbutton(fhead, compound = "center", state = "disabled",
2736 | text = "juice all\nimages",
2737 | width = 80, height = 80, image = juicrLogoSmall,
2738 | relief = "flat",
2739 | command = function() {
2740 | someJuicrFrames <- get_allJuicrFrames()
2741 | for(i in 1:length(someJuicrFrames)) {
2742 | tcltk::tkconfigure(button_JuiceAllImages, text = paste0("juicing ", i, " of ", length(someJuicrFrames), "\nimages"))
2743 | tcltk::tcl("update")
2744 | tcltk::tkinvoke(paste0(someJuicrFrames[i], ".2.1.1.1"));
2745 | nextJuicrFrame(); update_ArrowButtons(); update_FigureSmall();
2746 | }
2747 | tcltk::tkconfigure(button_JuiceAllImages, text = "juice all\nimages")
2748 | })
2749 |
2750 |
2751 | tcltk::tkgrid(button_OpenNewImage , row = 0, column = 0, sticky = "w", padx = 10, pady = 10)
2752 | tcltk::tkgrid(button_OpenJuicedImage, row = 0, column = 1, sticky = "w", padx = 10, pady = 10)
2753 |
2754 | tcltk::tkgrid(button_leftArrow, row = 0, column = 2, sticky = "e", padx = 10, pady = 10)
2755 | tcltk::tkgrid(button_previewImage, row = 0, column = 3, padx = 10, pady = 10)
2756 | tcltk::tkgrid(button_rightArrow, row = 0, column = 4, sticky = "w", padx = 10, pady = 10)
2757 | tcltk::tkgrid(imageInformation, row = 0, column = 5, sticky = "w", padx = 10, pady = 10)
2758 |
2759 | tcltk::tkgrid(button_SaveAllImages, row = 0, column = 7, sticky = "e", padx = 10, pady = 10)
2760 | tcltk::tkgrid(button_JuiceAllImages, row = 0, column = 6, sticky = "e", padx = 10, pady = 10)
2761 |
2762 | tcltk::tkgrid.columnconfigure(fhead, 2, weight = 3)
2763 | tcltk::tkgrid.columnconfigure(fhead, 6, weight = 2)
2764 |
2765 | tcltk::tkpack(fhead, side = "bottom", fill = "x")
2766 |
2767 | tcltk::tkbind(button_OpenNewImage, "", function() {tcltk::tkconfigure(button_OpenNewImage, background = "floral white");})
2768 | tcltk::tkbind(button_OpenNewImage, "", function() {tcltk::tkconfigure(button_OpenNewImage, background = "grey95");})
2769 | tcltk::tkbind(button_OpenJuicedImage, "", function() {tcltk::tkconfigure(button_OpenJuicedImage, background = "floral white");})
2770 | tcltk::tkbind(button_OpenJuicedImage, "", function() {tcltk::tkconfigure(button_OpenJuicedImage, background = "grey95");})
2771 | tcltk::tkbind(button_leftArrow, "", function() {tcltk::tkconfigure(button_leftArrow, background = "floral white");})
2772 | tcltk::tkbind(button_leftArrow, "", function() {tcltk::tkconfigure(button_leftArrow, background = "grey95");})
2773 |
2774 | tcltk::tkbind(button_previewImage, "", function() {
2775 | if(theFigureFile != "") {
2776 |
2777 | theSavedFilename <- paste0(tools::file_path_sans_ext(basename(theFigureFile[getCurrentJuicrFrame()])), "_juicr.html")
2778 | theLastSavedTime <- "never"
2779 |
2780 | if(file.exists(theSavedFilename) == TRUE) {
2781 | theLastSavedTime <- paste(file.info(theSavedFilename)$ctime)
2782 | } else {
2783 | theSavedFilename <- "NA"
2784 | }
2785 |
2786 | if(file.exists(theFigureFile[getCurrentJuicrFrame()]) == TRUE) {
2787 | theImageSummary <- paste("current image: ", theFigureFile[getCurrentJuicrFrame()],
2788 | "\nsize: ", file.size(theFigureFile[getCurrentJuicrFrame()]),
2789 | "\ndimentions: ", paste(paste(dim(EBImage::readImage(theFigureFile[getCurrentJuicrFrame()]))[1:2], collapse = " by "), "pixels"),
2790 | "\n\nlast saved: ", theLastSavedTime,
2791 | "\nsaved filename: ", theSavedFilename,
2792 | "\n\n");
2793 | } else {
2794 | theImageSummary <- paste("current image: ", theFigureFile[getCurrentJuicrFrame()],
2795 | "\n\nlast saved: ", theLastSavedTime,
2796 | "\nsaved filename: ", theSavedFilename,
2797 | "\n\n");
2798 | }
2799 |
2800 | tcltk::tkinsert(imageInformation, "1.0", theImageSummary);
2801 | tcltk::tkconfigure(imageInformation, foreground = "black");
2802 | tcltk::tkconfigure(button_previewImage, text = "\n\n\n\n\n get source");
2803 | }
2804 | })
2805 |
2806 | tcltk::tkbind(button_previewImage, "", function() {tcltk::tkconfigure(imageInformation, foreground = "lightgrey");
2807 | tcltk::tkconfigure(button_previewImage, text = "\n\n\n\n\n source");
2808 | })
2809 |
2810 |
2811 | tcltk::tkbind(button_rightArrow, "", function() {tcltk::tkconfigure(button_rightArrow, background = "floral white");})
2812 | tcltk::tkbind(button_rightArrow, "", function() {tcltk::tkconfigure(button_rightArrow, background = "grey95");})
2813 | tcltk::tkbind(button_SaveAllImages, "", function() {tcltk::tkconfigure(button_SaveAllImages, background = "floral white");})
2814 | tcltk::tkbind(button_SaveAllImages, "", function() {tcltk::tkconfigure(button_SaveAllImages, background = "grey95");})
2815 | tcltk::tkbind(button_JuiceAllImages, "", function() {tcltk::tkconfigure(button_JuiceAllImages, foreground = "orange");})
2816 | tcltk::tkbind(button_JuiceAllImages, "", function() {tcltk::tkconfigure(button_JuiceAllImages, foreground = "black");})
2817 |
2818 |
2819 | # CATCHING FILES INPUTED VIA GUI_juicr FUNCTION CALL
2820 |
2821 | if(theFigureFile != "") {
2822 | if(length(theFigureFile) == 1) {
2823 | add_allJuicrFrames(theFigureFile);
2824 | }
2825 | else {
2826 | add_allJuicrFrames(theFigureFile);
2827 | update_ArrowButtons();
2828 | tcltk::tkconfigure(button_leftArrow, state = "active")
2829 | tcltk::tkconfigure(button_rightArrow, state = "active")
2830 | }
2831 | tcltk::tkconfigure(button_previewImage, state = "active")
2832 | tcltk::tkconfigure(button_SaveAllImages, state = "active")
2833 | tcltk::tkconfigure(button_JuiceAllImages, state = "active")
2834 | }
2835 |
2836 | if(theJuicrFile != "") {
2837 | if(length(theJuicrFile) == 1) {
2838 | add_allJuicrFrames(theJuicrFile, TRUE);
2839 | }
2840 | else {
2841 | add_allJuicrFrames(theJuicrFile, TRUE);
2842 | update_ArrowButtons();
2843 | tcltk::tkconfigure(button_leftArrow, state = "active")
2844 | tcltk::tkconfigure(button_rightArrow, state = "active")
2845 | }
2846 | tcltk::tkconfigure(button_previewImage, state = "active")
2847 | tcltk::tkconfigure(button_SaveAllImages, state = "active")
2848 | tcltk::tkconfigure(button_JuiceAllImages, state = "active")
2849 | }
2850 |
2851 |
2852 | tcltk::tkfocus(mainExtractorWindow)
2853 |
2854 | # # # # # # # # # # # # # # # # #
2855 | ##### END OF JUICR
2856 | # # # # # # # # # # # # # # # # #
2857 |
2858 |
2859 | # TCLTK GARBAGE COLLECTION
2860 | # deletes all images (need better solution for avoiding memory leaks)
2861 | imageCleanUp <- function() {
2862 | oldImages <- as.character(tkimage.names())
2863 | oldImages <- oldImages[grep("image", oldImages)]
2864 | for(someImage in oldImages) tcltk::tkimage.delete(someImage)
2865 | }
2866 | tcltk::tkbind(mainExtractorWindow, "", imageCleanUp)
2867 |
2868 | # only have one juicr window open at a time
2869 | tcltk::tkwait.window(mainExtractorWindow)
2870 | tcltk::tkdestroy(mainExtractorWindow)
2871 |
2872 | } else {
2873 |
2874 | .juicrPROBLEM("error",
2875 | paste("\n tcltk package is missing and is needed to generate the GUI.",
2876 | " --> If using Windows/Linux, try 'install.packages('tcltk')'",
2877 | " --> If using a Mac, install latest XQuartz application (X11) from:",
2878 | " https://www.xquartz.org/",
2879 | sep = "\n"))
2880 | }
2881 |
2882 | message(paste0("juicr exit note: if files were saved, they are found here:\n ", getwd(), "/n"))
2883 | return("")
2884 | }
2885 |
--------------------------------------------------------------------------------