 10 |
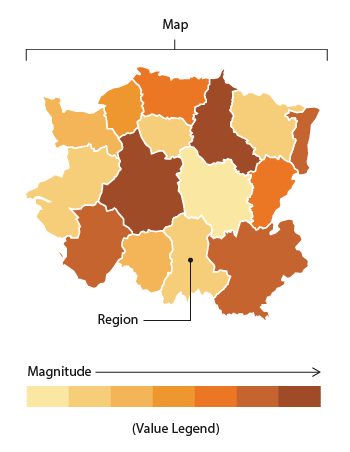
11 | >A choropleth map is a type of thematic map in which areas are shaded or patterned in proportion to a statistical variable that represents an aggregate summary of a geographic characteristic within each area, such as population density or per-capita income.
12 |
13 | ## Terminologies
14 |
15 |
16 | ### [Plotly](https://plotly.com/)
17 | Plotly is a technical computing company that develops online data analytics and visualization tools. Plotly provides online graphing, analytics, and statistics tools for individuals and collaboration, as well as scientific graphing libraries for Python, R, MATLAB, Perl, Julia, Arduino, and REST.
18 |
19 | ### [plotly.py](https://plotly.com/python/)
20 | An interactive, open-source, and browser-based graphing library for Python.
21 |
22 | ```bash
23 | $ pip install plotly
24 | ```
25 |
26 | >Plotly Express is a new high-level Python visualization library: it's a wrapper for Plotly.py that exposes a simple syntax for complex charts.
27 |
28 | ### [GeoJSON](https://geojson.org/)
29 | An open standard format designed for representing simple geographical features, along with their non-spatial attributes.
30 |
31 | ### [Mapbox](https://mapbox.com/)
32 | An open source mapping platform for custom designed maps.
33 |
34 |
35 | ## References
36 |
37 |
38 | - https://en.wikipedia.org/wiki/List_of_states_and_union_territories_of_India_by_population
39 |
40 | - https://un-mapped.carto.com/tables/states_india/public/map
41 |
42 | - https://plotly.com/python/choropleth-maps/
43 |
44 | - https://plotly.com/python/colorscales/
45 |
46 | - https://www.mapbox.com/
47 |
48 | - https://plotly.com/python/mapbox-county-choropleth/
49 |
50 | - https://plotly.com/python/mapbox-layers/
--------------------------------------------------------------------------------
/india_census.csv:
--------------------------------------------------------------------------------
1 | Rank,State or union territory,Population,Population (%),Decadal growth(2001–2011),Rural population,Percent rural,Urban population,Percent urban,Area[16],Density[a],Sex ratio
2 | 1,Uttar Pradesh,199812341,,20.20%,155317278,,44495063,,"240,928 km2 (93,023 sq mi)","828/km2 (2,140/sq mi)",912
3 | 2,Maharashtra,112374333,,20.00%,61556074,,50818259,,"307,713 km2 (118,809 sq mi)",365/km2 (950/sq mi),929
4 | 3,Bihar,104099452,,25.40%,92341436,,11758016,,"94,163 km2 (36,357 sq mi)","1,102/km2 (2,850/sq mi)",918
5 | 4,West Bengal,91276115,,13.80%,62183113,,29093002,,"88,752 km2 (34,267 sq mi)","1,029/km2 (2,670/sq mi)",953
6 | 5,Madhya Pradesh,72626809,,16.30%,52557404,,20069405,,"308,245 km2 (119,014 sq mi)",236/km2 (610/sq mi),931
7 | 6,Tamil Nadu,72147030,,15.60%,37229590,,34917440,,"130,058 km2 (50,216 sq mi)","555/km2 (1,440/sq mi)",996
8 | 7,Rajasthan,68548437,,21.30%,51500352,,17048085,,"342,239 km2 (132,139 sq mi)",201/km2 (520/sq mi),928
9 | 8,Karnataka,61095297,,15.60%,37469335,,23625962,,"191,791 km2 (74,051 sq mi)",319/km2 (830/sq mi),973
10 | 9,Gujarat,60439692,,19.30%,34694609,,25745083,,"196,024 km2 (75,685 sq mi)",308/km2 (800/sq mi),919
11 | 10,Andhra Pradesh,49577103,,11.00%,34966693,,14610410,,"162,968 km2 (62,922 sq mi)",303/km2 (780/sq mi),993
12 | 11,Odisha,41974219,,14.00%,34970562,,7003656,,"155,707 km2 (60,119 sq mi)",269/km2 (700/sq mi),979
13 | 12,Telangana,35003674,,13.58%,21395009,,13608665,,"112,077 km2 (43,273 sq mi)",312/km2 (810/sq mi),988
14 | 13,Kerala,33406061,,4.90%,17471135,,15934926,,"38,863 km2 (15,005 sq mi)","859/km2 (2,220/sq mi)",1084
15 | 14,Jharkhand,32988134,,22.40%,25055073,,7933061,,"79,714 km2 (30,778 sq mi)","414/km2 (1,070/sq mi)",948
16 | 15,Assam,31205576,,17.10%,26807034,,4398542,,"78,438 km2 (30,285 sq mi)","397/km2 (1,030/sq mi)",954
17 | 16,Punjab,27743338,,13.90%,17344192,,10399146,,"50,362 km2 (19,445 sq mi)","550/km2 (1,400/sq mi)",895
18 | 17,Chhattisgarh,25545198,,22.60%,19607961,,5937237,,"135,191 km2 (52,198 sq mi)",189/km2 (490/sq mi),991
19 | 18,Haryana,25351462,,19.90%,16509359,,8842103,,"44,212 km2 (17,070 sq mi)","573/km2 (1,480/sq mi)",879
20 | 19,Uttarakhand,10086292,,18.80%,7036954,,3049338,,"53,483 km2 (20,650 sq mi)",189/km2 (490/sq mi),963
21 | 20,Himachal Pradesh,6864602,,12.90%,6176050,,688552,,"55,673 km2 (21,495 sq mi)",123/km2 (320/sq mi),972
22 | 21,Tripura,3673917,,14.80%,2712464,,961453,,"10,486 km2 (4,049 sq mi)",350/km2 (910/sq mi),960
23 | 22,Meghalaya,2966889,,27.90%,2371439,,595450,,"22,429 km2 (8,660 sq mi)",132/km2 (340/sq mi),989
24 | 23,Manipur,2570390,,18.60%,1793875,,776515,,"22,327 km2 (8,621 sq mi)",122/km2 (320/sq mi),992
25 | 24,Nagaland,1978502,,−0.6%,1407536,,570966,,"16,579 km2 (6,401 sq mi)",119/km2 (310/sq mi),931
26 | 25,Goa,1458545,,8.20%,551731,,906814,,"3,702 km2 (1,429 sq mi)","394/km2 (1,020/sq mi)",973
27 | 26,Arunanchal Pradesh,1383727,,26.00%,1066358,,317369,,"83,743 km2 (32,333 sq mi)",17/km2 (44/sq mi),938
28 | 27,Mizoram,1097206,,23.50%,525435,,571771,,"21,081 km2 (8,139 sq mi)",52/km2 (130/sq mi),976
29 | 28,Sikkim,610577,,12.90%,456999,,153578,,"7,096 km2 (2,740 sq mi)",86/km2 (220/sq mi),890
30 | ,NCT of Delhi,16787941,,21.20%,419042,,16368899,,"1,484 km2 (573 sq mi)","11,297/km2 (29,260/sq mi)",868
31 | ,Jammu & Kashmir,12267032,,23.60%,9064220,,3202812,,"42,241 km2 (16,309 sq mi)[d]",297/km2 (770/sq mi),890
32 | ,Puducherry,1247953,,28.10%,395200,,852753,,479 km2 (185 sq mi),"2,598/km2 (6,730/sq mi)",1037
33 | ,Chandigarh,1055450,,17.20%,28991,,1026459,,114 km2 (44 sq mi),"9,252/km2 (23,960/sq mi)",818
34 | ,Dadara & Nagar Havelli,585764,,55.10%,243510,,342254,,603 km2 (233 sq mi),"970/km2 (2,500/sq mi)",711
35 | ,Daman & Diu,585764,,55.10%,243510,,342254,,603 km2 (233 sq mi),"970/km2 (2,500/sq mi)",711
36 | ,Andaman & Nicobar Island,380581,,6.90%,237093,,143488,,"8,249 km2 (3,185 sq mi)",46/km2 (120/sq mi),876
37 | ,Lakshadweep,64473,,6.30%,14141,,50332,,32 km2 (12 sq mi),"2,013/km2 (5,210/sq mi)",946
--------------------------------------------------------------------------------
/ChoroplethTutorial.ipynb:
--------------------------------------------------------------------------------
1 | {
2 | "cells": [
3 | {
4 | "cell_type": "markdown",
5 | "metadata": {},
6 | "source": [
7 | "# Plotting Choropleth Maps using Python\n",
8 | "---\n",
9 | "A choropleth map uses colour coding to indicate quantitative values across geographical areas on a map.\n",
10 | "\n",
11 | "\n",
12 | "\n",
13 | ">A choropleth map is a type of thematic map in which areas are shaded or patterned in proportion to a statistical variable that represents an aggregate summary of a geographic characteristic within each area, such as population density or per-capita income.\n",
14 | "\n",
15 | "## Terminologies\n",
16 | "---\n",
17 | "\n",
18 | "## [Plotly](https://plotly.com/)\n",
19 | "Plotly is a technical computing company that develops online data analytics and visualization tools. Plotly provides online graphing, analytics, and statistics tools for individuals and collaboration, as well as scientific graphing libraries for Python, R, MATLAB, Perl, Julia, Arduino, and REST.\n",
20 | "\n",
21 | "### [plotly.py](https://plotly.com/python/)\n",
22 | "An interactive, open-source, and browser-based graphing library for Python.\n",
23 | "\n",
24 | "```bash\n",
25 | "$ pip install plotly\n",
26 | "```\n",
27 | "\n",
28 | ">Plotly Express is a new high-level Python visualization library: it's a wrapper for Plotly.py that exposes a simple syntax for complex charts.\n",
29 | "\n",
30 | "### [GeoJSON](https://geojson.org/)\n",
31 | "An open standard format designed for representing simple geographical features, along with their non-spatial attributes.\n",
32 | "\n",
33 | "### [Mapbox](https://mapbox.com/)\n",
34 | "An open source mapping platform for custom designed maps."
35 | ]
36 | },
37 | {
38 | "cell_type": "code",
39 | "execution_count": 1,
40 | "metadata": {},
41 | "outputs": [],
42 | "source": [
43 | "import json\n",
44 | "import numpy as np\n",
45 | "import pandas as pd\n",
46 | "import plotly.express as px"
47 | ]
48 | },
49 | {
50 | "cell_type": "code",
51 | "execution_count": 2,
52 | "metadata": {},
53 | "outputs": [],
54 | "source": [
55 | "import plotly.io as pio\n",
56 | "pio.renderers.default = 'browser'"
57 | ]
58 | },
59 | {
60 | "cell_type": "code",
61 | "execution_count": 4,
62 | "metadata": {},
63 | "outputs": [
64 | {
65 | "data": {
66 | "application/javascript": [
67 | "\n",
68 | " setTimeout(function() {\n",
69 | " var nbb_cell_id = 4;\n",
70 | " var nbb_unformatted_code = \"india_states = json.load(open(\\\"states_india.geojson\\\", 'r'))\";\n",
71 | " var nbb_formatted_code = \"india_states = json.load(open(\\\"states_india.geojson\\\", \\\"r\\\"))\";\n",
72 | " var nbb_cells = Jupyter.notebook.get_cells();\n",
73 | " for (var i = 0; i < nbb_cells.length; ++i) {\n",
74 | " if (nbb_cells[i].input_prompt_number == nbb_cell_id) {\n",
75 | " if (nbb_cells[i].get_text() == nbb_unformatted_code) {\n",
76 | " nbb_cells[i].set_text(nbb_formatted_code);\n",
77 | " }\n",
78 | " break;\n",
79 | " }\n",
80 | " }\n",
81 | " }, 500);\n",
82 | " "
83 | ],
84 | "text/plain": [
85 | "
10 |
11 | >A choropleth map is a type of thematic map in which areas are shaded or patterned in proportion to a statistical variable that represents an aggregate summary of a geographic characteristic within each area, such as population density or per-capita income.
12 |
13 | ## Terminologies
14 |
15 |
16 | ### [Plotly](https://plotly.com/)
17 | Plotly is a technical computing company that develops online data analytics and visualization tools. Plotly provides online graphing, analytics, and statistics tools for individuals and collaboration, as well as scientific graphing libraries for Python, R, MATLAB, Perl, Julia, Arduino, and REST.
18 |
19 | ### [plotly.py](https://plotly.com/python/)
20 | An interactive, open-source, and browser-based graphing library for Python.
21 |
22 | ```bash
23 | $ pip install plotly
24 | ```
25 |
26 | >Plotly Express is a new high-level Python visualization library: it's a wrapper for Plotly.py that exposes a simple syntax for complex charts.
27 |
28 | ### [GeoJSON](https://geojson.org/)
29 | An open standard format designed for representing simple geographical features, along with their non-spatial attributes.
30 |
31 | ### [Mapbox](https://mapbox.com/)
32 | An open source mapping platform for custom designed maps.
33 |
34 |
35 | ## References
36 |
37 |
38 | - https://en.wikipedia.org/wiki/List_of_states_and_union_territories_of_India_by_population
39 |
40 | - https://un-mapped.carto.com/tables/states_india/public/map
41 |
42 | - https://plotly.com/python/choropleth-maps/
43 |
44 | - https://plotly.com/python/colorscales/
45 |
46 | - https://www.mapbox.com/
47 |
48 | - https://plotly.com/python/mapbox-county-choropleth/
49 |
50 | - https://plotly.com/python/mapbox-layers/
--------------------------------------------------------------------------------
/india_census.csv:
--------------------------------------------------------------------------------
1 | Rank,State or union territory,Population,Population (%),Decadal growth(2001–2011),Rural population,Percent rural,Urban population,Percent urban,Area[16],Density[a],Sex ratio
2 | 1,Uttar Pradesh,199812341,,20.20%,155317278,,44495063,,"240,928 km2 (93,023 sq mi)","828/km2 (2,140/sq mi)",912
3 | 2,Maharashtra,112374333,,20.00%,61556074,,50818259,,"307,713 km2 (118,809 sq mi)",365/km2 (950/sq mi),929
4 | 3,Bihar,104099452,,25.40%,92341436,,11758016,,"94,163 km2 (36,357 sq mi)","1,102/km2 (2,850/sq mi)",918
5 | 4,West Bengal,91276115,,13.80%,62183113,,29093002,,"88,752 km2 (34,267 sq mi)","1,029/km2 (2,670/sq mi)",953
6 | 5,Madhya Pradesh,72626809,,16.30%,52557404,,20069405,,"308,245 km2 (119,014 sq mi)",236/km2 (610/sq mi),931
7 | 6,Tamil Nadu,72147030,,15.60%,37229590,,34917440,,"130,058 km2 (50,216 sq mi)","555/km2 (1,440/sq mi)",996
8 | 7,Rajasthan,68548437,,21.30%,51500352,,17048085,,"342,239 km2 (132,139 sq mi)",201/km2 (520/sq mi),928
9 | 8,Karnataka,61095297,,15.60%,37469335,,23625962,,"191,791 km2 (74,051 sq mi)",319/km2 (830/sq mi),973
10 | 9,Gujarat,60439692,,19.30%,34694609,,25745083,,"196,024 km2 (75,685 sq mi)",308/km2 (800/sq mi),919
11 | 10,Andhra Pradesh,49577103,,11.00%,34966693,,14610410,,"162,968 km2 (62,922 sq mi)",303/km2 (780/sq mi),993
12 | 11,Odisha,41974219,,14.00%,34970562,,7003656,,"155,707 km2 (60,119 sq mi)",269/km2 (700/sq mi),979
13 | 12,Telangana,35003674,,13.58%,21395009,,13608665,,"112,077 km2 (43,273 sq mi)",312/km2 (810/sq mi),988
14 | 13,Kerala,33406061,,4.90%,17471135,,15934926,,"38,863 km2 (15,005 sq mi)","859/km2 (2,220/sq mi)",1084
15 | 14,Jharkhand,32988134,,22.40%,25055073,,7933061,,"79,714 km2 (30,778 sq mi)","414/km2 (1,070/sq mi)",948
16 | 15,Assam,31205576,,17.10%,26807034,,4398542,,"78,438 km2 (30,285 sq mi)","397/km2 (1,030/sq mi)",954
17 | 16,Punjab,27743338,,13.90%,17344192,,10399146,,"50,362 km2 (19,445 sq mi)","550/km2 (1,400/sq mi)",895
18 | 17,Chhattisgarh,25545198,,22.60%,19607961,,5937237,,"135,191 km2 (52,198 sq mi)",189/km2 (490/sq mi),991
19 | 18,Haryana,25351462,,19.90%,16509359,,8842103,,"44,212 km2 (17,070 sq mi)","573/km2 (1,480/sq mi)",879
20 | 19,Uttarakhand,10086292,,18.80%,7036954,,3049338,,"53,483 km2 (20,650 sq mi)",189/km2 (490/sq mi),963
21 | 20,Himachal Pradesh,6864602,,12.90%,6176050,,688552,,"55,673 km2 (21,495 sq mi)",123/km2 (320/sq mi),972
22 | 21,Tripura,3673917,,14.80%,2712464,,961453,,"10,486 km2 (4,049 sq mi)",350/km2 (910/sq mi),960
23 | 22,Meghalaya,2966889,,27.90%,2371439,,595450,,"22,429 km2 (8,660 sq mi)",132/km2 (340/sq mi),989
24 | 23,Manipur,2570390,,18.60%,1793875,,776515,,"22,327 km2 (8,621 sq mi)",122/km2 (320/sq mi),992
25 | 24,Nagaland,1978502,,−0.6%,1407536,,570966,,"16,579 km2 (6,401 sq mi)",119/km2 (310/sq mi),931
26 | 25,Goa,1458545,,8.20%,551731,,906814,,"3,702 km2 (1,429 sq mi)","394/km2 (1,020/sq mi)",973
27 | 26,Arunanchal Pradesh,1383727,,26.00%,1066358,,317369,,"83,743 km2 (32,333 sq mi)",17/km2 (44/sq mi),938
28 | 27,Mizoram,1097206,,23.50%,525435,,571771,,"21,081 km2 (8,139 sq mi)",52/km2 (130/sq mi),976
29 | 28,Sikkim,610577,,12.90%,456999,,153578,,"7,096 km2 (2,740 sq mi)",86/km2 (220/sq mi),890
30 | ,NCT of Delhi,16787941,,21.20%,419042,,16368899,,"1,484 km2 (573 sq mi)","11,297/km2 (29,260/sq mi)",868
31 | ,Jammu & Kashmir,12267032,,23.60%,9064220,,3202812,,"42,241 km2 (16,309 sq mi)[d]",297/km2 (770/sq mi),890
32 | ,Puducherry,1247953,,28.10%,395200,,852753,,479 km2 (185 sq mi),"2,598/km2 (6,730/sq mi)",1037
33 | ,Chandigarh,1055450,,17.20%,28991,,1026459,,114 km2 (44 sq mi),"9,252/km2 (23,960/sq mi)",818
34 | ,Dadara & Nagar Havelli,585764,,55.10%,243510,,342254,,603 km2 (233 sq mi),"970/km2 (2,500/sq mi)",711
35 | ,Daman & Diu,585764,,55.10%,243510,,342254,,603 km2 (233 sq mi),"970/km2 (2,500/sq mi)",711
36 | ,Andaman & Nicobar Island,380581,,6.90%,237093,,143488,,"8,249 km2 (3,185 sq mi)",46/km2 (120/sq mi),876
37 | ,Lakshadweep,64473,,6.30%,14141,,50332,,32 km2 (12 sq mi),"2,013/km2 (5,210/sq mi)",946
--------------------------------------------------------------------------------
/ChoroplethTutorial.ipynb:
--------------------------------------------------------------------------------
1 | {
2 | "cells": [
3 | {
4 | "cell_type": "markdown",
5 | "metadata": {},
6 | "source": [
7 | "# Plotting Choropleth Maps using Python\n",
8 | "---\n",
9 | "A choropleth map uses colour coding to indicate quantitative values across geographical areas on a map.\n",
10 | "\n",
11 | "\n",
12 | "\n",
13 | ">A choropleth map is a type of thematic map in which areas are shaded or patterned in proportion to a statistical variable that represents an aggregate summary of a geographic characteristic within each area, such as population density or per-capita income.\n",
14 | "\n",
15 | "## Terminologies\n",
16 | "---\n",
17 | "\n",
18 | "## [Plotly](https://plotly.com/)\n",
19 | "Plotly is a technical computing company that develops online data analytics and visualization tools. Plotly provides online graphing, analytics, and statistics tools for individuals and collaboration, as well as scientific graphing libraries for Python, R, MATLAB, Perl, Julia, Arduino, and REST.\n",
20 | "\n",
21 | "### [plotly.py](https://plotly.com/python/)\n",
22 | "An interactive, open-source, and browser-based graphing library for Python.\n",
23 | "\n",
24 | "```bash\n",
25 | "$ pip install plotly\n",
26 | "```\n",
27 | "\n",
28 | ">Plotly Express is a new high-level Python visualization library: it's a wrapper for Plotly.py that exposes a simple syntax for complex charts.\n",
29 | "\n",
30 | "### [GeoJSON](https://geojson.org/)\n",
31 | "An open standard format designed for representing simple geographical features, along with their non-spatial attributes.\n",
32 | "\n",
33 | "### [Mapbox](https://mapbox.com/)\n",
34 | "An open source mapping platform for custom designed maps."
35 | ]
36 | },
37 | {
38 | "cell_type": "code",
39 | "execution_count": 1,
40 | "metadata": {},
41 | "outputs": [],
42 | "source": [
43 | "import json\n",
44 | "import numpy as np\n",
45 | "import pandas as pd\n",
46 | "import plotly.express as px"
47 | ]
48 | },
49 | {
50 | "cell_type": "code",
51 | "execution_count": 2,
52 | "metadata": {},
53 | "outputs": [],
54 | "source": [
55 | "import plotly.io as pio\n",
56 | "pio.renderers.default = 'browser'"
57 | ]
58 | },
59 | {
60 | "cell_type": "code",
61 | "execution_count": 4,
62 | "metadata": {},
63 | "outputs": [
64 | {
65 | "data": {
66 | "application/javascript": [
67 | "\n",
68 | " setTimeout(function() {\n",
69 | " var nbb_cell_id = 4;\n",
70 | " var nbb_unformatted_code = \"india_states = json.load(open(\\\"states_india.geojson\\\", 'r'))\";\n",
71 | " var nbb_formatted_code = \"india_states = json.load(open(\\\"states_india.geojson\\\", \\\"r\\\"))\";\n",
72 | " var nbb_cells = Jupyter.notebook.get_cells();\n",
73 | " for (var i = 0; i < nbb_cells.length; ++i) {\n",
74 | " if (nbb_cells[i].input_prompt_number == nbb_cell_id) {\n",
75 | " if (nbb_cells[i].get_text() == nbb_unformatted_code) {\n",
76 | " nbb_cells[i].set_text(nbb_formatted_code);\n",
77 | " }\n",
78 | " break;\n",
79 | " }\n",
80 | " }\n",
81 | " }, 500);\n",
82 | " "
83 | ],
84 | "text/plain": [
85 | "| \n", 201 | " | Rank | \n", 202 | "State or union territory | \n", 203 | "Population | \n", 204 | "Population (%) | \n", 205 | "Decadal growth(2001–2011) | \n", 206 | "Rural population | \n", 207 | "Percent rural | \n", 208 | "Urban population | \n", 209 | "Percent urban | \n", 210 | "Area[16] | \n", 211 | "Density[a] | \n", 212 | "Sex ratio | \n", 213 | "Density | \n", 214 | "id | \n", 215 | "
|---|---|---|---|---|---|---|---|---|---|---|---|---|---|---|
| 0 | \n", 220 | "1.0 | \n", 221 | "Uttar Pradesh | \n", 222 | "199812341 | \n", 223 | "NaN | \n", 224 | "20.20% | \n", 225 | "155317278 | \n", 226 | "NaN | \n", 227 | "44495063 | \n", 228 | "NaN | \n", 229 | "240,928 km2 (93,023 sq mi) | \n", 230 | "828/km2 (2,140/sq mi) | \n", 231 | "912 | \n", 232 | "828 | \n", 233 | "9 | \n", 234 | "
| 1 | \n", 237 | "2.0 | \n", 238 | "Maharashtra | \n", 239 | "112374333 | \n", 240 | "NaN | \n", 241 | "20.00% | \n", 242 | "61556074 | \n", 243 | "NaN | \n", 244 | "50818259 | \n", 245 | "NaN | \n", 246 | "307,713 km2 (118,809 sq mi) | \n", 247 | "365/km2 (950/sq mi) | \n", 248 | "929 | \n", 249 | "365 | \n", 250 | "27 | \n", 251 | "
| 2 | \n", 254 | "3.0 | \n", 255 | "Bihar | \n", 256 | "104099452 | \n", 257 | "NaN | \n", 258 | "25.40% | \n", 259 | "92341436 | \n", 260 | "NaN | \n", 261 | "11758016 | \n", 262 | "NaN | \n", 263 | "94,163 km2 (36,357 sq mi) | \n", 264 | "1,102/km2 (2,850/sq mi) | \n", 265 | "918 | \n", 266 | "1102 | \n", 267 | "10 | \n", 268 | "
| 3 | \n", 271 | "4.0 | \n", 272 | "West Bengal | \n", 273 | "91276115 | \n", 274 | "NaN | \n", 275 | "13.80% | \n", 276 | "62183113 | \n", 277 | "NaN | \n", 278 | "29093002 | \n", 279 | "NaN | \n", 280 | "88,752 km2 (34,267 sq mi) | \n", 281 | "1,029/km2 (2,670/sq mi) | \n", 282 | "953 | \n", 283 | "1029 | \n", 284 | "19 | \n", 285 | "
| 4 | \n", 288 | "5.0 | \n", 289 | "Madhya Pradesh | \n", 290 | "72626809 | \n", 291 | "NaN | \n", 292 | "16.30% | \n", 293 | "52557404 | \n", 294 | "NaN | \n", 295 | "20069405 | \n", 296 | "NaN | \n", 297 | "308,245 km2 (119,014 sq mi) | \n", 298 | "236/km2 (610/sq mi) | \n", 299 | "931 | \n", 300 | "236 | \n", 301 | "23 | \n", 302 | "