├── .gitignore
├── LANGS.md
├── README.md
├── book.json
├── en
├── 10changelog.md
├── 21_environment_preparation.md
├── 22.md
├── 23.md
├── 24.md
├── 310_portal.md
├── 311_heartbeat_server.md
├── 312_judge.md
├── 313_links.md
├── 314_alarm.md
├── 315_task.md
├── 316_gateway.md
├── 317_nodata.md
├── 318_aggregator.md
├── 319_agent-updater.md
├── 31environment_preparation.md
├── 32_agent.md
├── 33transfer.md
├── 34graph.md
├── 35_query.md
├── 36_dashboard.md
├── 37_email_and_message_sending_interface.md
├── 38_sender.md
├── 39_webqianduan.md
├── 3yuanmaanzhuang.md
├── 410_mongodb_monitoring.md
├── 411_memcache_monitoring.md
├── 412_rabbitmq_monitoring.md
├── 413_switch_monitoring.md
├── 414_monitoring_windows_platform.md
├── 415_haproxy_monitoring.md
├── 416_dockercontainer_monitoring_practice.md
├── 417_nginx_monitoring.md
├── 418_jmx_monitoring.md
├── 419_hardware_monitoring.md
├── 42_nodata_configuration.md
├── 43_cluster_aggregation.md
├── 44_alarm_function_description.md
├── 45_user-defined_and_push_data_to_open-falcon.md
├── 46_historical_data_inquiry.md
├── 47_introduction.md
├── 48_mysql_monitor_practice.md
├── 49_redis_monitor.md
├── 4user_manual.md
├── 51_data_model.md
├── 52_about_data_collection.md
├── 53_plugin_mechanism.md
├── 54_tag_and_hostgroup.md
├── 5data_model.md
├── 61_deployment.md
├── 62_self-monitoring_practice.md
├── 6practical_experience.md
├── 71_community_contribution.md
├── 72_modify_the_drawing_curve_precision.md
├── 73_modifying_the_network_card_flux_unit.md
├── 74_supporting_grnfana_view_show.md
├── 7secondary_development.md
├── 8api.md
├── 91_about_collection.md
├── 91about_collection_md.md
├── 92_about_alert.md
├── 93_about_drawing.md
├── 94_linux_common_monitor_control_index.md
├── 95_qq_group_q&a.md
├── README.md
├── SUMMARY.md
├── chapter1.md
├── community.md
├── contributionlistbox.md
├── erjinzhi.md
└── kuai_su_ru_men.md
├── en_0_2
├── GLOSSARY.md
├── README.md
├── SUMMARY.md
├── api
│ └── README.md
├── authors.md
├── changelog
│ └── README.md
├── contributing.md
├── dev
│ ├── README.md
│ ├── change_graph_rra.md
│ ├── change_net_unit.md
│ ├── community_resource.md
│ └── support_grafana.md
├── distributed_install
│ ├── README.md
│ ├── agent-updater.md
│ ├── agent.md
│ ├── aggregator.md
│ ├── alarm.md
│ ├── api.md
│ ├── gateway.md
│ ├── graph.md
│ ├── hbs.md
│ ├── judge.md
│ ├── mail-sms.md
│ ├── nodata.md
│ ├── prepare.md
│ ├── task.md
│ └── transfer.md
├── donate.md
├── faq
│ ├── README.md
│ ├── alarm.md
│ ├── collect.md
│ ├── graph.md
│ ├── linux-metrics.md
│ └── qq.md
├── image
│ ├── OpenFalcon_wechat.jpg
│ ├── func_aggregator_1.png
│ ├── func_aggregator_2.png
│ ├── func_aggregator_3.png
│ ├── func_aggregator_4.png
│ ├── func_aggregator_5.png
│ ├── func_getting_started_1.png
│ ├── func_getting_started_10.png
│ ├── func_getting_started_11.png
│ ├── func_getting_started_12.png
│ ├── func_getting_started_2.png
│ ├── func_getting_started_3.png
│ ├── func_getting_started_4.png
│ ├── func_getting_started_5.png
│ ├── func_getting_started_6.png
│ ├── func_getting_started_7.png
│ ├── func_getting_started_8.png
│ ├── func_getting_started_9.png
│ ├── func_intro_1.png
│ ├── func_intro_2.png
│ ├── func_intro_3.png
│ ├── func_intro_4.png
│ ├── func_intro_5.png
│ ├── func_intro_6.png
│ ├── func_intro_7.png
│ ├── func_intro_8.png
│ ├── func_nodata_1.png
│ ├── func_nodata_2.png
│ ├── func_nodata_3.png
│ ├── linkedsee_1.png
│ ├── linkedsee_2.png
│ ├── linkedsee_3.png
│ ├── linkedsee_4.png
│ ├── linkedsee_5.png
│ ├── practice_graph-scaling_io01.png
│ ├── practice_graph-scaling_io02.png
│ ├── practice_graph-scaling_io03.png
│ ├── practice_graph-scaling_quantity.png
│ ├── practice_graph-scaling_rrd.png
│ └── practice_graph-scaling_stats.png
├── intro
│ └── README.md
├── philosophy
│ ├── README.md
│ ├── data-collect.md
│ ├── data-model.md
│ ├── plugin.md
│ └── tags-and-hostgroup.md
├── practice
│ ├── README.md
│ ├── deploy.md
│ ├── graph-scaling.md
│ └── monitor.md
├── quick_install
│ ├── README.md
│ ├── backend.md
│ ├── frontend.md
│ ├── prepare.md
│ └── upgrade.md
├── styles
│ └── website.css
└── usage
│ ├── MongoDB.md
│ ├── README.md
│ ├── aggregator.md
│ ├── data-push.md
│ ├── docker.md
│ ├── du-proc.md
│ ├── esxi.md
│ ├── flume.md
│ ├── func.md
│ ├── getting-started.md
│ ├── haproxy.md
│ ├── hwcheck.md
│ ├── jmx.md
│ ├── lvs.md
│ ├── memcache.md
│ ├── mesos.md
│ ├── mymon.md
│ ├── ngx_metric.md
│ ├── nodata.md
│ ├── proc-port-monitor.md
│ ├── query.md
│ ├── rabbitmq.md
│ ├── redis.md
│ ├── solr.md
│ ├── switch.md
│ ├── urlooker.md
│ ├── vsphere-esxi.md
│ ├── vsphere.md
│ └── win.md
├── plugins.txt
├── zh
├── GLOSSARY.md
├── README.md
├── SUMMARY.md
├── api
│ └── README.md
├── authors.md
├── changelog
│ └── README.md
├── contributing.md
├── dev
│ ├── README.md
│ ├── change_graph_rra.md
│ ├── change_net_unit.md
│ ├── community_resource.md
│ └── support_grafana.md
├── donate.md
├── faq
│ ├── README.md
│ ├── alarm.md
│ ├── collect.md
│ ├── graph.md
│ ├── linux-metrics.md
│ └── qq.md
├── image
│ └── OpenFalcon_wechat.jpg
├── images
│ └── practice
│ │ └── deploy.png
├── install_from_src
│ ├── README.md
│ ├── agent-updater.md
│ ├── agent.md
│ ├── aggregator.md
│ ├── alarm.md
│ ├── dashboard.md
│ ├── fe.md
│ ├── gateway.md
│ ├── graph.md
│ ├── hbs.md
│ ├── judge.md
│ ├── links.md
│ ├── mail-sms.md
│ ├── nodata.md
│ ├── portal.md
│ ├── prepare.md
│ ├── query.md
│ ├── sender.md
│ ├── task.md
│ └── transfer.md
├── intro
│ └── README.md
├── philosophy
│ ├── README.md
│ ├── data-collect.md
│ ├── data-model.md
│ ├── plugin.md
│ └── tags-and-hostgroup.md
├── practice
│ ├── README.md
│ ├── deploy.md
│ └── monitor.md
├── quick_install
│ ├── README.md
│ ├── graph_components.md
│ ├── judge_components.md
│ ├── links.md
│ └── prepare.md
└── usage
│ ├── MongoDB.md
│ ├── README.md
│ ├── aggregator.md
│ ├── data-push.md
│ ├── docker.md
│ ├── esxi.md
│ ├── func.md
│ ├── getting-started.md
│ ├── haproxy.md
│ ├── hwcheck.md
│ ├── jmx.md
│ ├── lvs.md
│ ├── memcache.md
│ ├── mesos.md
│ ├── mymon.md
│ ├── ngx_metric.md
│ ├── nodata.md
│ ├── proc-port-monitor.md
│ ├── query.md
│ ├── rabbitmq.md
│ ├── redis.md
│ ├── solr.md
│ ├── switch.md
│ ├── urlooker.md
│ ├── vsphere.md
│ └── win.md
└── zh_0_2
├── GLOSSARY.md
├── README.md
├── SUMMARY.md
├── api
└── README.md
├── authors.md
├── changelog
└── README.md
├── contributing.md
├── dev
├── README.md
├── change_graph_rra.md
├── change_net_unit.md
├── community_resource.md
└── support_grafana.md
├── distributed_install
├── README.md
├── agent-updater.md
├── agent.md
├── aggregator.md
├── alarm.md
├── api.md
├── gateway.md
├── graph.md
├── hbs.md
├── judge.md
├── mail-sms.md
├── nodata.md
├── prepare.md
├── task.md
└── transfer.md
├── donate.md
├── faq
├── README.md
├── alarm.md
├── collect.md
├── graph.md
├── linux-metrics.md
└── qq.md
├── image
├── OpenFalcon_wechat.jpg
├── func_aggregator_1.png
├── func_aggregator_2.png
├── func_aggregator_3.png
├── func_aggregator_4.png
├── func_aggregator_5.png
├── func_getting_started_1.png
├── func_getting_started_10.png
├── func_getting_started_11.png
├── func_getting_started_12.png
├── func_getting_started_2.png
├── func_getting_started_3.png
├── func_getting_started_4.png
├── func_getting_started_5.png
├── func_getting_started_6.png
├── func_getting_started_7.png
├── func_getting_started_8.png
├── func_getting_started_9.png
├── func_intro_1.png
├── func_intro_2.png
├── func_intro_3.png
├── func_intro_4.png
├── func_intro_5.png
├── func_intro_6.png
├── func_intro_7.png
├── func_intro_8.png
├── func_nodata_1.png
├── func_nodata_2.png
├── func_nodata_3.png
├── linkedsee_1.png
├── linkedsee_2.png
├── linkedsee_3.png
├── linkedsee_4.png
├── linkedsee_5.png
├── practice_graph-scaling_io01.png
├── practice_graph-scaling_io02.png
├── practice_graph-scaling_io03.png
├── practice_graph-scaling_quantity.png
├── practice_graph-scaling_rrd.png
└── practice_graph-scaling_stats.png
├── intro
└── README.md
├── philosophy
├── README.md
├── data-collect.md
├── data-model.md
├── plugin.md
└── tags-and-hostgroup.md
├── practice
├── README.md
├── deploy.md
├── graph-scaling.md
└── monitor.md
├── quick_install
├── README.md
├── backend.md
├── frontend.md
├── prepare.md
└── upgrade.md
├── styles
└── website.css
└── usage
├── MongoDB.md
├── README.md
├── aggregator.md
├── data-push.md
├── docker.md
├── du-proc.md
├── esxi.md
├── fault-recovery.md
├── flume.md
├── func.md
├── getting-started.md
├── haproxy.md
├── hwcheck.md
├── jmx.md
├── lvs.md
├── memcache.md
├── mesos.md
├── mymon.md
├── ngx_metric.md
├── nodata.md
├── proc-port-monitor.md
├── prometheus-exporter.md
├── query.md
├── rabbitmq.md
├── redis.md
├── solr.md
├── switch.md
├── urlooker.md
├── vsphere-esxi.md
├── vsphere.md
└── win.md
/.gitignore:
--------------------------------------------------------------------------------
1 | # Compiled Object files, Static and Dynamic libs (Shared Objects)
2 | *.o
3 | *.a
4 | *.so
5 |
6 | # Folders
7 | _obj
8 | _test
9 |
10 | # Architecture specific extensions/prefixes
11 | *.[568vq]
12 | [568vq].out
13 |
14 | *.cgo1.go
15 | *.cgo2.c
16 | _cgo_defun.c
17 | _cgo_gotypes.go
18 | _cgo_export.*
19 |
20 | _testmain.go
21 |
22 | *.exe
23 | *.test
24 | *.prof
25 |
26 | *.swp
27 | *.swo
28 | *.log
29 | .idea
30 | .DS_Store
31 | _book
32 | node_modules
33 | package-lock.json
34 |
--------------------------------------------------------------------------------
/LANGS.md:
--------------------------------------------------------------------------------
1 | * [简体中文 v0.2 - 最新版本](zh_0_2)
2 | * [English v0.2 - latest version](en_0_2)
3 | * [ ](en)
4 | * [ ](zh)
5 |
--------------------------------------------------------------------------------
/en/21_environment_preparation.md:
--------------------------------------------------------------------------------
1 |
2 | ##Environment Preparation
3 |
4 | ###Install Redis
5 |
6 | ```
7 | yum install -y redis
8 | ```
9 | ###Install MySQL
10 | ```
11 | yum install -y mysql-server
12 |
13 | ```
14 |
15 | ###create work directory
16 |
17 | ```
18 | export HOME=/home/work
19 | export WORKSPACE=$HOME/open-falcon
20 | mkdir -p $WORKSPACE
21 | cd $WORKSPACE
22 | ```
23 |
24 | ###Initialize the MySQL table structure
25 |
26 | ```
27 | # All components of open-falcon can start without the root account. It is recommended that common accounts be used for installation to increase security. Here we use a common account work to install and deploy all components.
28 | # However, the root account is required when yum is used to install some dependent lib databases.
29 | export HOME=/home/work
30 | export WORKSPACE=$HOME/open-falcon
31 | mkdir -p $WORKSPACE
32 | cd $WORKSPACE
33 |
34 | git clone https://github.com/open-falcon/scripts.git
35 | cd ./scripts/
36 | mysql -h localhost -u root -p < db_schema/graph-db-schema.sql
37 | mysql -h localhost -u root -p < db_schema/dashboard-db-schema.sql
38 |
39 | mysql -h localhost -u root -p < db_schema/portal-db-schema.sql
40 | mysql -h localhost -u root -p < db_schema/links-db-schema.sql
41 | mysql -h localhost -u root -p < db_schema/uic-db-schema.sql
42 |
43 | ```
44 |
45 | ##Download compiled component
46 |
47 | We have compiled relevant component into binary version to make it easier to use. The binaries can only run on 64 bit Linux
48 |
49 | Domestic users please click here to quickly download the compiled binary version.
50 | ```
51 | DOWNLOAD="https://github.com/open-falcon/of-release/releases/download/v0.1.0/open-falcon-v0.1.0.tar.gz"
52 | cd $WORKSPACE
53 |
54 | mkdir ./tmp
55 | wget $DOWNLOAD -O open-falcon-latest.tar.gz
56 | #uncompress
57 | tar -zxf open-falcon-latest.tar.gz -C ./tmp/
58 |
59 | for x in `find ./tmp/ -name "*.tar.gz"`; do
60 | app=`echo $x|cut -d '-' -f2`;
61 | mkdir -p $app;
62 | tar -zxf $x -C $app;
63 | done
64 |
65 | rm -rf ./tmp && rm -f open-falcon-latest.tar.gz
66 | ```
67 |
68 | ##Changelog
69 |
70 | http://book.open-falcon.com/zh/changelog/README.html
71 |
72 |
73 |
74 |
75 |
76 |
--------------------------------------------------------------------------------
/en/24.md:
--------------------------------------------------------------------------------
1 |
2 |
3 | The following two steps should be processed to open alarm merging function:
4 |
5 | ##Adjust the configuration of alarm
6 |
7 | ```
8 | cd $WORKSPACE/alarm/
9 |
10 | 1. Adjust the content of highQueues configuration in cfg.json into
11 | [
12 | "event:p0",
13 | "event:p1"
14 | ]
15 | 2. Adjust the content of lowQueues configuration in cfg.json into
16 | [
17 | "event:p2",
18 | "event:p3",
19 | "event:p4",
20 | "event:p5",
21 | "event:p6"
22 | ]
23 |
24 | Instruction:
25 | - In Open-Falcon, alarm is categorized into P0, P1... P6, the priority of alarm decreases successfully.
26 | - For alarm of high priority, Open-Falcon will ensure it is sent preferentially.
27 | - Alarm merging function only applies to alarms of low priority, because alarms of high priority are normally very important, which highly need real-time response, and we do not suggest for alarm combination.
28 | - Therefore, it will not be combined in highQueues configuratio
29 |
30 | ```
31 |
32 | ##Links components installation
33 |
34 | The function of links components: when multiple alarms merger into one alarm, the http link addresses with details of alarms will be attached in the message for users to check the details.
35 |
36 | ###install dependency
37 |
38 | ```
39 | # yum install -y python-virtualenv
40 | $ cd $WORKSPACE/links/
41 | $ virtualenv ./env
42 | $ ./env/bin/pip install -r pip_requirements.txt
43 | ```
44 | ###init database and config
45 |
46 | ```
47 | - database schema: https://github.com/open-falcon/scripts/blob/master/db_schema/links-db-schema.sql
48 | - database config: ./frame/config.py
49 | - initialize the data for Links.Of course,you can reference the part of Links in connecting with environment preparing
50 |
51 | ```
52 | ###start
53 |
54 | ```
55 | $ cd $WORKSPACE/links/
56 | $ ./control start
57 | --> goto http://127.0.0.1:5090
58 |
59 | $ ./control tail
60 | --> tail log
61 | ```
62 |
63 |
64 |
--------------------------------------------------------------------------------
/en/316_gateway.md:
--------------------------------------------------------------------------------
1 | ##Gateway
2 |
3 | **If you haven't come across the machine room partitioning problem, please ignore the module directly.**
4 |
5 | If you have already come across the machine room partitioning problem and are eager to resolve the monitoring data backhaul problem occurred when machine room partitioning, please use this component. More information is here.
6 |
7 |
--------------------------------------------------------------------------------
/en/319_agent-updater.md:
--------------------------------------------------------------------------------
1 | ##Agent-updater
2 |
3 | It is required to deploy "falcon-agent" for each machine. If there are just a small number of machines in the company, it is OK to install manually with tools such as pssh, ansible and fabric. But if there is a large number of machines in the company, installing, upgrading and rollbacking "falcon-agent" manually can be a nightmare.
4 |
5 | A tool named "agent-updater" is developed, which can be used to manage "falcon-agent". "agent-updater" also has an agent: "ops-updater", which can be regarded as a super agent and used to manage the agents of other agents. It is recommended to install ops-updater together when setting the machine up. Usually, ops-upgrader doesn't need upgrades.
6 |
7 | Please refer to https://github.com/open-falcon/ops-updater for details.
8 |
9 | If you want to learn how to use the Go language to write a complete project, you can study "agent-updater". I have even recorded a Video course to demonstrate how to develop it step by step. Tutorial link:
10 |
11 | * http://www.jikexueyuan.com/course/1336.html
12 | * http://www.jikexueyuan.com/course/1357.html
13 | * http://www.jikexueyuan.com/course/1462.html
14 | * http://www.jikexueyuan.com/course/1490.html
15 |
--------------------------------------------------------------------------------
/en/37_email_and_message_sending_interface.md:
--------------------------------------------------------------------------------
1 | ##Email and Message Sending Interface
2 |
3 | This component has no code and each company needs to provide code by itself.
4 |
5 | The monitoring system needs to send alarm emails or messages after alarm events occur. Each company may have its own email server and sending method and its own message channel and sending method. To adapt to different companies, falcon sets up a specification for the access scheme where each company needs to provide message and email sending http interfaces.
6 |
7 | Short message sending http interface:
8 |
9 | ```
10 | method: post
11 | params:
12 | - content: Short message content
13 | - tos: Multiple mobile phone numbers separated by commas
14 |
15 | ```
16 | Email sending http interface:
17 |
18 | ```
19 | method: post
20 | params:
21 | - content:Email content
22 | - subject: Email subject
23 | - tos: Multiple email addresses separated by commas
24 |
25 | ```
26 |
27 |
--------------------------------------------------------------------------------
/en/3yuanmaanzhuang.md:
--------------------------------------------------------------------------------
1 | #
2 |
3 |
--------------------------------------------------------------------------------
/en/411_memcache_monitoring.md:
--------------------------------------------------------------------------------
1 | ##Memcache monitoring
2 |
3 | We have introduced the usual monitoring data source in section of Data Collection. As a monitoring frame, open-falcon can collect monitoring index data in any system and it just need to organize the monitoring data to the normative format of open-falcon.
4 |
5 | The data of Memcache can be collected by collecting script memcached-monitor.
6 |
7 | ##Operating principle
8 |
9 | Memcached-monitor is a cron, and the collecting script is run per minute.
10 | ```Memcached-monitor```.py can automatically detect the port of Memcached, and connect to Memcached instance to collect some monitoring index, for example get_hit_ratio, usage and so on, then assembling to the normative format of open-falcon to post to the host falcon-agent. Falcon-agent provides a http interface, and as for the using method, please refer to the instances in Data Collection.
11 |
12 | For example, we have 1000 machines deployed Memcached instance, and we can deploy 1000 crons for the 1000 machines, i.e. it is one-to-one corresponded to the Memcached instance.
13 |
14 | Notice, script ```memcached-monitor.py``` automatically finds the Memcached port by ````ps -ef |grep memcached|grep -v grep |sed -n 's/.* *-p *\([0-9]\{1,5\}\).*/\1/p```. If port is not designated by –p when Memcached initiates, the self-finding would be failed, and at this time, the script needs to be modified and designate the very port.
15 |
--------------------------------------------------------------------------------
/en/412_rabbitmq_monitoring.md:
--------------------------------------------------------------------------------
1 | ##RabbitMQ monitoring
2 |
3 | We have introduced the usual monitoring data source in section Data Collection. As a monitoring frame, open-falcon can collect monitoring index data in any system and it just need to organize the monitoring data to the normative format of open-falcon
4 |
5 | The data of RMQ can be collected by script rabbitmq-monitor.
6 |
7 | ##Operating principle
8 |
9 | rabbitmq-monitor is a cron, and the script ```rabbitmq-monitor.py``` is run every minute, wherein RMQ username and password and so on are deployed. The script connects to the RMQ instance and collect some monitoring index such as messages_ready, messages_total, deliver_rate, publish_rate and so on, and then assemble to the normative format of open-falcon to post to the host falcon-agent.
10 |
11 | Falcon-agent provides a http interface, and as for the using method, please refer to the instances in Data Collection.
12 |
13 | For example, we deployed 5 RMQ instance, and a cron can be run in every RMQ machine, i.e. it is one-to-one corresponded to the Memcached instance.
14 |
--------------------------------------------------------------------------------
/en/414_monitoring_windows_platform.md:
--------------------------------------------------------------------------------
1 | ##monitoring windows platform
2 |
3 | We have introduced the usual monitoring data source in section of Data Collection. As a monitoring frame, open-falcon can collect monitoring index data in any system and it just need to organize the monitoring data to the normative format of open-falcon.
4 |
5 | The running index of switch collection: we can write a python to collect each item of running index of switch by SNMP protocol, including memory usage, CPU usage, disk usage, network traffic, etc.
6 |
7 | We can collect the monitoring index of windows host directly by windows_collect script.
8 |
9 | ###Usage
10 | * Modify the configuration parameter at the head of the script according to the real deployment condition.
11 | * Change the mysql into utf8 in graph to support Chinese. This step is important because windows mac may be Chinese.
12 | * Test: python windows_collect.py
13 | * Run windows plan mission and complete
14 |
15 | ###The environment tested:
16 | * windows 10
17 | * windows 7
18 | * windows server 2012
19 | ________________________________________
20 | Otherwise you can use the golang version windows agent: https://github.com/LeonZYang/agent
21 |
22 |
--------------------------------------------------------------------------------
/en/415_haproxy_monitoring.md:
--------------------------------------------------------------------------------
1 | ##HAProxy monitoring
2 |
3 | We have introduced the usual monitoring data source in section of Data Collection. As a monitoring frame, open-falcon can collect monitoring index data in any system and it just need to organize the monitoring data to the normative format of open-falcon.
4 |
5 | The data collection of HAProxy can be done by haproxymon.
6 |
7 | ##Operating principle
8 |
9 | Haproxymon is a cron and the ```haproxymon.py``` is run every minute. Haproxymon collects the haproxy basic state information by the stats socket interface of haproxy, such as qcur、scur、rate etc., and then assemble to the normative format of open-falcon to post to the host falcon-agent.
10 |
11 | Falcon-agent provides a http interface, and as for the using method, please refer to the instances in Data Collection.
12 |
--------------------------------------------------------------------------------
/en/416_dockercontainer_monitoring_practice.md:
--------------------------------------------------------------------------------
1 | ##Dockercontainer monitoring practice
2 |
3 | We have introduced the usual monitoring data source in section of Data Collection. As a monitoring frame, open-falcon can collect monitoring index data in any system and it just need to organize the monitoring data to the normative format of open-falcon.
4 |
5 | The data collection of docker container can be done by micadvisor_open.
6 |
7 | ##Operating principle
8 |
9 | Micadvisor-open is the docker container resources monitoring plug-in based on open-falcon, which monitors the CPU, memory, diskio and net io etc. and collects the data and reports to open-falcon.
10 |
11 | ##The index collected
12 |
13 | | Counters | Notes |
14 | | -- | -- |
15 | | cpu.busy | Cpu usage percent |
16 | | cpu.user | Cpu usage percent in user mode |
17 | | cpu.system | Cpu usage percent in kernel mode |
18 | | cpu.core.busy | Every cpu usage percent |
19 | | mem.memused.percent | Memory usage percent |
20 | | mem.memused | Memory usage original value |
21 | | mem.memtotal | Total memory |
22 | | mem.memused.hot | Memory heat usage percent |
23 | | disk.io.read_bytes | Disk io read bytes |
24 | | disk.io.write_bytes | Disk io write bytes |
25 | | net.if.in.bytes | Net io in bytes |
26 | | net.if.in.packets | Net io in packets |
27 | | net.if.in.errors | Net io in errors |
28 | | net.if.in.dropped | Net io in dropped |
29 | | net.if.out.bytes | Net io out bytes |
30 | | net.if.out.packets | Net io out packets |
31 | | net.if.out.errors | Net io out errors |
32 | | net.if.out.dropped | Net io out dropped |
33 |
34 | ##Contributors
35 | mengzhuo: QQ:296142139; MAIL:mengzhuo@xiaomi.com
36 |
37 | ##Supplement
38 | * another lib bank of docker metric collection:https://github.com/projecteru/eru-metric
39 |
40 |
--------------------------------------------------------------------------------
/en/417_nginx_monitoring.md:
--------------------------------------------------------------------------------
1 | ##Nginx monitoring
2 |
3 | We have introduced the usual monitoring data source in section of Data Collection. As a monitoring frame, open-falcon can collect monitoring index data in any system and it just need to organize the monitoring data to the normative format of open-falcon.
4 |
5 | The data collection of Nginx can be done by ngx_metric.
6 |
7 | ##Operating principle
8 |
9 | ngx_metric makes the real-time analysis of nginx request using the ```log by lua ```function of lua - nginx - the module , and stores the intermediate results with the help of ```NGX. shared. DICT```, and finally takes out the intermediate results to calculate, format and output through external python scripts. The falcon can be directly pushed to the falcon agent according to the output results falcon format.
10 |
11 | ##Help
12 |
13 | For more detail please refer to: ngx metric
--------------------------------------------------------------------------------
/en/418_jmx_monitoring.md:
--------------------------------------------------------------------------------
1 | # 4.18 JMX monitoring
2 |
3 |
--------------------------------------------------------------------------------
/en/44_alarm_function_description.md:
--------------------------------------------------------------------------------
1 | ##Alarm function description
2 |
3 | While configuring alarm strategies, open-falcon supports multiple alarm trigger function, for example, all(#3) diff(#10), etc., the numbers after # indicates that it is a newest historic point. For instance, #3 means the newest 3 points.
4 |
5 | ```
6 | all(#3): send alarm when all three newest points reach the threshold value
7 | max(#3): send alarm when the maximum value of all three newest points reaches the threshold value
8 | min(#3): send alarm when the minimum value of all three newest points reaches the threshold value
9 | sum(#3): send alarm when the sum of all three newest points reaches the threshold value
10 | avg(#3): send alarm when the average value of all three newest points reaches the threshold value
11 | diff(#3): the newest point pushed (minuend) minus 3 newest points (3 subtrahends) equals 3 numbers, if one of them reaches the threshold value, then alarm will be sent
12 | pdiff(#3): the newest point pushed minus 3 newest points equals 3 numbers, and divide the 3 numbers respectively by the 3 newest points (3 subtrahends) equals 3 values, if one of them reaches the threshold value, then alarm will be sent
13 | ```
14 |
15 | The most commonly used function is ```all```, for instance cpu.idle ```all(#3) < 5```, means alarm will be sent when the value of cpu.idle is less than 5% for 3 consecutive times.
16 |
17 | It is not so easy to understand diff and pdiff. The design of diff and pdiff is to solve the problem of alarm for the sudden increase and decrease of flow. If you still cannot understand it, then you can only read the original codes: https://github.com/open-falcon/judge/blob/master/store/func.go
18 |
19 |
--------------------------------------------------------------------------------
/en/46_historical_data_inquiry.md:
--------------------------------------------------------------------------------
1 | ##Historical data inquiry
2 |
3 | Any data pushed in open-falcon can be inquired through API provided by query component afterwards.
4 |
5 | ##Inquire historical data
6 |
7 | Use the port HTTP POST /graph/history to inquire the historical data of certain period in the past. The port cannot be used to inquire the two newly submitted data points. One python example is as follows:
8 |
9 | ```
10 | #-*- coding:utf8 -*-
11 |
12 | import requests
13 | import time
14 | import json
15 |
16 | end = int(time.time()) # starting time
17 | start = end - 3600 # ending time (In example,the data is queried an hour ago)
18 |
19 | d = {
20 | "start": start,
21 | "end": end,
22 | "cf": "AVERAGE",
23 | "endpoint_counters": [
24 | {
25 | "endpoint": "host1",
26 | "counter": "cpu.idle",
27 | },
28 | {
29 | "endpoint": "host1",
30 | "counter": "load.1min",
31 | },
32 | ],
33 | }
34 |
35 | query_api = "http://127.0.0.1:9966/graph/history"
36 | r = requests.post(query_api, data=json.dumps(d))
37 | print r.text
38 | ```
39 | Among which,
40 |
41 | 1.start: the start time point of the historical data need to be inquired (as the form of UNIX time)
42 |
43 | 2.end: the end time point of the historical data need to be inquired (as the form of UNIX time)
44 |
45 | 3.cf: appointed sample mode, can choose from: AVERAGE, MAX, and MIN
46 |
47 | 4.endpoint_counters: arrays, among which each element is a key value composed of endpoint and counter, among which counter is comprised by metric/sorted(tags), if there is no tags then it is metric by itself.
48 |
49 | 5.query_api: the monitor address of query module + api
50 |
51 | ##Inquire newly submitted data
52 |
53 | Use the port HTTP POST /graph/last to inquire a newly submitted data point. A bash example is as follows
54 |
55 |
--------------------------------------------------------------------------------
/en/48_mysql_monitor_practice.md:
--------------------------------------------------------------------------------
1 | ##MySQL monitoring practice
2 |
3 | In the part of Data Collection, we introduced common monitor data source. Open-falcon as a monitor frame can collect monitor index data of any system. The only thing is to change monitor data into the standard format of open-falcon.
4 |
5 | The data collection of MySQL can be managed through mymon.
6 |
7 | ##Operating principle
8 |
9 | Mymon is a cron. It runs once every minute. In the configuration file, the database link address is configured. Mymon is connected to the database to collect some monitor indexes such as global status, global variables, slave status, etc., and then packed into a standard format data for open-falcon and posted to falcon-agent of this machine. falcon-agent provides a http port, and you can refer to the examples in Data Collection for its application method.
10 |
11 | For instance, we have 1000 machines which are configured with MySQL instance. We can deploy 1000 cron in the 1000 machines, i.e.: one-to-one correspondence with instance in database.
12 |
13 | ##Supplement
14 |
15 | Remote monitor mysql instance If you want to collect mysql instance indexes in hostB through mymon of hostA, you can do it like this: "set the endpoint in the configuration file of mymon in hostA as the machine name of hostB, meanwhile, set mysql instance in hostB as the configuration item of [mysql]". When checking mysql indexes and adding strategies to mysql indexes, we need to find corresponding indexes for the machine name of hostB.
16 |
17 |
18 |
--------------------------------------------------------------------------------
/en/49_redis_monitor.md:
--------------------------------------------------------------------------------
1 | # 4.9 Redis monitoring
2 |
3 | In the part of Data Collection, we introduced common monitor data source. Open-falcon as a monitor frame can collect monitor index data of any system. The only thing is to change monitor data into the standard format of open-falcon.
4 |
5 | The data collection of redis can be managed through collecting script redis-monitor or redismon.
6 |
7 | ##Operating principle
8 |
9 | redis-monitor is a cron. It runs a collecting script redis-monitor.py every minute, and the address of redis service is configured. redis-monitor is connected to redis instance to collect some monitor indexessuch as connected_clients, used_memory, etc., and then packed into a standard format data for open-falcon and posted to falcon-agent of this machine. falcon-agent provides a http port, and you can refer to the examples in Data Collection for its application method.
10 |
11 | For instance, we have 1000 machines which are configured with Redis instance. We can deploy 1000 cron in the 1000 machines, i.e.: one-to-one correspondence with Redis isntance.
--------------------------------------------------------------------------------
/en/4user_manual.md:
--------------------------------------------------------------------------------
1 | ##The User`s Manual for open-falcon
2 |
3 |
4 |
5 |
--------------------------------------------------------------------------------
/en/51_data_model.md:
--------------------------------------------------------------------------------
1 | # 5.1 Data Model
2 |
3 | Data model
4 | Open-Falcon uses the data format similar to OpenTSDB: metric, endpoint, plus multi-group key value tags. There are two examples:
5 | ```
6 | {
7 | metric: load.1min,
8 | endpoint: open-Falcon-host,
9 | tags: srv=Falcon,idc=aws-sgp,group=az1,
10 | value: 1.5,
11 | timestamp: `date +%s`,
12 | counterType: GAUGE,
13 | step: 60
14 | }
15 | {
16 | metric: net.port.listen,
17 | endpoint: open-Falcon-host,
18 | tags: port=3306,
19 | value: 1,
20 | timestamp: `date +%s`,
21 | counterType: GAUGE,
22 | step: 60
23 | }
24 | ```
25 | Among them, metric is the name of monitoring metrics, endpoint is the monitoring entity, tags is the attribute tag of monitoring data, counterType is the data type defined by Open-Falcon (the values are GAUGE, COUNTER), step is the reported period of monitoring data, value and timestamp is the valid monitoring data.
--------------------------------------------------------------------------------
/en/54_tag_and_hostgroup.md:
--------------------------------------------------------------------------------
1 | # 5.4 Tag and HostGroup
2 |
3 |
--------------------------------------------------------------------------------
/en/5data_model.md:
--------------------------------------------------------------------------------
1 | # 5.Data Model
2 |
3 |
--------------------------------------------------------------------------------
/en/61_deployment.md:
--------------------------------------------------------------------------------
1 | # 6.1 Deployment
2 |
3 |
--------------------------------------------------------------------------------
/en/6practical_experience.md:
--------------------------------------------------------------------------------
1 | # 6.Practical Experience
2 |
3 |
--------------------------------------------------------------------------------
/en/71_community_contribution.md:
--------------------------------------------------------------------------------
1 | # 7.1 Community contribution
2 |
3 | ##Business monitoring
4 | * Windows Agent
5 | * MySQL Monitor
6 | * Redis Monitor
7 | * RPC Monitor
8 | * Switch Monitor
9 | * Falcon-Agent downtime monitoring
10 | * memcached
11 | * Docker monitoring Lib
12 | * mesos monitoring
13 | * Winodws/Linux automatically report the property
14 | * Nginx monitoring: enterprise-level monitoring standard
15 | * JMX monitoring: monitoring plug-in based on open-falcon
16 | * [Baidu-RPC Monitor](https://github.com/solrex/brpc-open-falcon)
17 | * [Elasticsearch Monitor](https://github.com/solrex/es-open-falcon)
18 | * [Redis Monitor (Multiple Instance)](https://github.com/solrex/redis-open-falcon)
19 | * [SSDB Monitor](https://github.com/solrex/ssdb-open-falcon)
20 |
21 | ##Script
22 | * Summarize the plugin script of each cpu core
23 | * Summarize the plugin script the process wastes
24 | * The monitoring script and service aiming at falcon
25 | * Windows metrics collector
26 | * Monitoring script of Dell server hardware state
27 | ##SDK
28 | * Node.js perfcounter
29 | * Golang perfcounter
30 | ##Else
31 | * SMS sender
32 | * Mail sender
33 | * Open-Falcon Ansible Playbook
34 | * Open-Falcon Docker
35 | ##The text
36 | * OpenFalcon communication: a PPT suitable for generalizing OpenFalcon in the company
37 | * OpenFalcon @ SACC-2015
38 | * The whole brain process of OpenFalcon writing: the weigh and compromise during the development process
39 | * OpenFalcon oprating and recording the screen showing for 10 minutes more
40 | * 7 means when MIUI open-source monitoring system OpenFalcon faced with high concurrency
41 |
42 | ##The meeting
43 | **Kylin meeting technology salon-Open-Falcon v0.1.0 published:**
44 |
45 | * Lai Wei——Open-Falcon new version character analysis and planning
46 | * Xie Danbo——the falling and subliming of Open-Falcon in Meituan
47 | * Ou Yaowei——the revolution and evolution of enterprise-level monitoring platform
48 |
--------------------------------------------------------------------------------
/en/74_supporting_grnfana_view_show.md:
--------------------------------------------------------------------------------
1 | # 7.4 Supporting Grnfana view show
2 |
3 | ##Supporting Grnfana view show
4 |
5 | Compared to the Dashboard created by Open-Falcon, Grafana can self-define chart flexibly and control the permission, assign label as well as query aiming at Dashboard, and the show option is more diverse. The teaching help you do well in the show of Open-Falcon.
6 |
7 | ##Before start
8 |
9 | Open-Falcon and Grafana don’t support each other at present, so you need the following PR
10 |
11 | * Grafana PR#3787 ( v2.6 supported)
12 | * Query PR#5(combined to the latest query code, please inspect if you are using the latest version)
13 | *
14 | For more details please refer to Youku
15 |
16 | ##Set Datasource
17 |
18 | When you get the abovementioned PR Grafana SC, install it as the official teaching, and compile it as follows:
19 | 1.Compile the front code go run build.go build
20 |
21 | 2.Comile the back code grunt
22 |
23 | 3.Execute grafana-server
24 |
25 | After initiating Grafana, add new Open-Falcon Datasource as the following picture. Notice that the URL we use here is the newly added API in falcon-query.
26 |
27 | ##picture
28 |
29 | ##Newly added Templating variable
30 |
31 | It’s unrealistic to add new monitoring items to the chart one by one when there are already more than one hundred machines in Open-Falcon, so Grafana provides a variable of Templating so that we can dynamically choose the machine we want to pay attention to.
32 |
33 | 1.Set to click Templating
34 |
35 | 2.Newly add Templating variable
36 |
37 | ##Newly added chart
38 |
39 | As for Templating, we can replace Endpoint name with it and choose the monitoring item we focus on to finish the adding of chart.
40 |
41 | ##picture
--------------------------------------------------------------------------------
/en/7secondary_development.md:
--------------------------------------------------------------------------------
1 | # 7.Secondary Development
2 |
3 | ##The construction of go development environment:
4 | ```
5 | cd ~
6 | wget http://dinp.qiniudn.com/go1.4.1.linux-amd64.tar.gz
7 | tar zxf go1.4.1.linux-amd64.tar.gz
8 | mkdir -p workspace/src
9 | echo "" >> .bashrcecho 'export GOROOT=$HOME/go' >> .bashrcecho 'export GOPATH=$HOME/workspace' >> .bashrcecho 'export PATH=$GOROOT/bin:$GOPATH/bin:$PATH' >> .bashrcecho "" >> .bashrc
10 | source .bashrc
11 | ```
12 | ##clone code
13 | ```
14 | cd $GOPATH/src
15 | mkdir github.comcd github.com
16 | git clone --recursive https://github.com/XiaoMi/open-falcon.git
17 | ```
18 | ##compiling an element(taking agent as an example)
19 | ```
20 | cd $GOPATH/src/github.com/open-falcon/agent
21 | go get ./...
22 | ./control build
23 | ```
24 | ##User defined modification filing strategy
25 | Modify open-falcon/graph/rrdtool/rrdtool.go
26 |
27 | ##picture
28 |
29 | Compile element graph again, and replace the original binary
30 |
31 | Eliminate all the original rrd files(under /home/work/data/6070/ by default)
32 |
33 | ##Plugin mechanism
34 | 1.Find a git to store all the plugins of company
35 |
36 | 2.Download the repo plugin to the local by calling the /plugin/update interface of agent
37 |
38 | 3.Deploy which hosts can execute which plugins in portal
39 |
40 | 4.The naming way of plugin: $step_xx.yy, which needs the execute permission to save to the each directory by classification
41 |
42 | 5.Print the collected data to stdout
43 |
44 | 6.You may modify the agent and download the plugin.tar.gz from a http address at fixed period if you find the git way inconvenient
--------------------------------------------------------------------------------
/en/8api.md:
--------------------------------------------------------------------------------
1 | # 8.API
2 |
3 | ##open-falcon api
4 |
5 |
6 |
--------------------------------------------------------------------------------
/en/91_about_collection.md:
--------------------------------------------------------------------------------
1 | # 9.1 About collection
2 |
3 |
4 | Open-Falcon data collection, including drawing data collection and alert data collection. We will introduce how to verify whether the data collection in two links is normal or not below.
5 |
6 | ##How to verify whether the drawing data collection is normal
7 |
8 | The data link is: ```agent->transfer->graph->query->dashboard.``` There is a http interface of graph to verify the link ```agent->transfer->graph.``` For example, the http port of graph is 6071, and we may access the verification in this way:
9 | ```
10 | # $endpointand$counter are variables
11 | curl http://127.0.0.1:6071/history/$endpoint/$counter
12 | # If the data reported are without tags, the access method is as follows:
13 | curl http://127.0.0.1:6071/history/host01/agent.alive
14 | # If the data reported are with tags, the access method is as follows, wherein the tags are module=graph,project=falcon
15 | curl http://127.0.0.1:6071/history/host01/qps/module=graph,project=falcon
16 | ```
17 | If null value is returned by the said interface, it means that agent doesn’t report data or there is an error in transfer service.
18 |
19 | ##How to verify whether the alert data collection is normal
20 |
21 | The data link is: ```agent->transfer->judge``` . There is a http interface of judge to verify the link ```agent->transfer->judge```. For example, the http port of judge is 6081, and we may access the verification in this way:
22 | ```
23 | curl http://127.0.0.1:6081/history/$endpoint/$counter
24 | # $endpointare $counterare variables, for example:
25 | curl http://127.0.0.1:6081/history/host01/cpu.idle
26 | # counter=$metric/sorted($tags)# If the data reported are with tags, the access method is as follows, for example:
27 | curl http://127.0.0.1:6081/history/host01/qps/module=judge,project=falcon
28 | ```
29 | If null value is returned by the said interface, it means that agent doesn’t report data or there is an error in transfer service.
--------------------------------------------------------------------------------
/en/91about_collection_md.md:
--------------------------------------------------------------------------------
1 | # 9.FAQ
2 |
3 | ##The most common questions
4 |
5 |
--------------------------------------------------------------------------------
/en/92_about_alert.md:
--------------------------------------------------------------------------------
1 | # 9.2 About alert
2 |
3 | ##Problems about alert
4 | ###After the strategy is deployed, there has been no alert. How to troubleshoot the problem?
5 |
6 | 1.Troubleshoot the log of sender、alarm、judge、hbs、agent、transfer
7 |
8 | 2.Access the http page of alarm by browser to see if there is unrecovered alert. If there is, the alert is generated and isn’t sent out. The interfaces of e-mail and message may go wrong and the deployed api in sender needs to be inspected.
9 |
10 | 3.Open the debug of agent to see if the push data is normal.
11 |
12 | 4.Inspect the agent configuration to see if the address of heartbeat(hbs) and transfer is correctly deployed and enabled.
13 |
14 | 5.Inspect the transfer configuration to see if the address of judge is correctly deployed.
15 |
16 | 6.Judge provides a http interface to debug and inspect if some data is correctly pushed up, for example, the cpu.idle data of qd-open-falcon-judge01.hd may be checked in this way:
17 | ```curl 127.0.0.1:6081/history/qd-open-falcon-judge01.hd/cpu.idle```
18 |
19 | 7.Inspect if the time of server is synchronized, we may use ntp or chrony :
20 |
21 | **The said 127.0.0.1:6081 refers to the http port of judge.**
22 |
23 | 1.Inspect whether the hbs address judge deployed is correct
24 |
25 | 2.Inspect whether the database address hbs deployed is correct
26 |
27 | 3.Inspect whether the deployed strategy template in portal is deployed with the alert receiver
28 |
29 | 4.Inspect whether the deployed strategy template in portal is bound to some HostGroup and the aim machine is just in the HostGroup
30 |
31 | 5.Go to UIC and inspect whether it added itself in the alert receiver group
32 |
33 | 6.Go to UIC and inspect whether the contact information of itself is correct
34 |
35 | ###Creat a HostGroup in Portal page and report the error when adding machine to HostGroup
36 |
37 | 1.Inspect whether agent deployed the heartbeat address correctly and enabled
38 |
39 | 2.Inspect hbs log
40 |
41 | 3.Inspect the database address hbs deployed is correct
42 |
43 | 4.Inspect the deploy hosts of hbs is deployed to sync. Hbs will write the host table only when it is blank, and we may add machine on the page only when there is data in the host table
44 |
--------------------------------------------------------------------------------
/en/README.md:
--------------------------------------------------------------------------------
1 | # Welcome to Open-Falcon community
2 |
3 | With everyone's enthusiastic support and help,Open-Falcon is developing at full speed . Now:
4 |
5 | 1. During half a year, we have getted more than 1300 stars on github.
6 |
7 | 2. We received dozens of pull-requests,much 100 problems and the Community College has more than 2000 members.
8 |
9 | 3. We received lots of plugins from members who support us all the time.This plugins for example:MySQL,redis,RabbitMQ,windows-agent,switch-agent,nginx-stats.They also received many documents.
10 |
11 | 4. In different degrees,Hundreds of Internet Company use Open-Falcon,such as: 美团、金山云、快网、宜信、七牛、又拍云、赶集、滴滴、金山办公、爱奇艺、一点资讯、快牙、开心网、借贷宝、百度、迅雷等等
12 |
13 |
14 | NOTICE:
15 |
16 | 1. QQ群已全部满员,请添加我的微信 `laiweivic` ,注明个人介绍和来源自open-falcon,我会拉你进入交流群组;
17 | 2. 我们更推荐您升级到[夜莺监控](https://github.com/ccfos/nightingale): 关于open-falcon和夜莺的对比介绍,请参考阅读[云原生监控的十个特点和趋势](https://mp.weixin.qq.com/s?__biz=MzkzNjI5OTM5Nw==&mid=2247483738&idx=1&sn=e8bdbb974a2cd003c1abcc2b5405dd18&chksm=c2a19fb0f5d616a63185cd79277a79a6b80118ef2185890d0683d2bb20451bd9303c78d083c5#rd);
18 |
19 |
20 | 请大家优先在 github 上提交 [issue](https://github.com/open-falcon/falcon-plus/issues), 方便问题沉淀,github issue 会最高优先级解决。
21 | - QQ五群:42607978 (已满员)
22 | - QQ四群:697503992 (已满员)
23 | - QQ一群:373249123 (已满员)
24 | - QQ二群:516088946 (已满员)
25 | - QQ三群:469342415 (已满员)
26 |
27 | # Acknowledgement
28 |
29 | This english document is translated and maintained by [宋立岭](https://github.com/songliling),thanks a lot.
30 |
--------------------------------------------------------------------------------
/en/community.md:
--------------------------------------------------------------------------------
1 | # welcome to Open-Falcon community
2 |
3 |
4 | With everyone's enthusiastic support and help,Open-Falcon is developing at full speed . Now:
5 |
6 | 1. During half a year, we have getted more than 1300 stars on github.
7 |
8 | 2. We received dozens of pull-requests,much 100 problems and the Community College has more than 2000 members.
9 |
10 | 3. We received lots of plugins from members who support us all the time.This plugins for example:MySQL,redis,RabbitMQ,windows-agent,switch-agent,nginx-stats.They also received many documents.
11 |
12 | 4. In different degrees,Hundreds of Internet Company use Open-Falcon,such as: 美团、金山云、快网、宜信、七牛、又拍云、赶集、滴滴、金山办公、爱奇艺、一点资讯、快牙、开心网、借贷宝、百度、迅雷等等
13 |
14 |
15 |
16 | * QQ gruop:373249123(FULL)
17 | * QQ 2th group:516088946(FULL)
18 | * QQ 3rd group:469342415(JOIN US)
19 |
20 |
21 |
22 |
23 |
--------------------------------------------------------------------------------
/en/contributionlistbox.md:
--------------------------------------------------------------------------------
1 | ##Authors' contributions
2 |
3 | * laiwei 来炜没睡醒@微博 / hellolaiwei@微信
4 | * 秦晓辉 UlricQin@微博 微信公众号:sa-dev,语音答疑
5 | * yubo x80386@微信
6 | * niean niean_sail@微信
7 | * 小米运维部
8 |
9 |
--------------------------------------------------------------------------------
/en/erjinzhi.md:
--------------------------------------------------------------------------------
1 | The Open-Falcon can be divided into two parts: mapping component and alarm component. These two parts can work independently.
2 |
3 | * Installation of mapping component is to manage collecting, gathering, storing, archiving, sampling, querying and displaying of data (Dashboard/Screen). It can work independently as a storage presentation solution of time-series data.
4 | * Installation of alarm component is to manage alarm policy configuration (portal), alarm judge (judge), alarm handling (alarm/sender), user group management (uic), etc. It can work independently.
5 | * If you are proficient in docker and want to quickly set up and experience Open-Falcon, please refer to Install Open-Falcon with Docker Mirror.
6 |
7 |
--------------------------------------------------------------------------------
/en_0_2/GLOSSARY.md:
--------------------------------------------------------------------------------
1 |
2 |
3 |
--------------------------------------------------------------------------------
/en_0_2/README.md:
--------------------------------------------------------------------------------
1 |
2 |
3 | [OpenFalcon](http://open-falcon.com) is an expandable open source monitor resolution with high availability at enterprise-level.
4 |
5 | With the warm support and help of everyone, OpenFalcon has become one of the most popular monitor systems in China.
6 |
7 | Now:
8 | - Thousands of stars, hundreds of forks, hundreds of pull-requests received at [github](https://github.com/open-falcon/falcon-plus);
9 | - More than 6000 community users;
10 | - Used by more than 200 companies in varying degrees, including companies in Mainland China, Singapore and Taiwan;
11 | - Dozens of plugin support contributed by the community, like MySQL, Redis, Windows, switch, LVS, Mongodb, Memcache, docker, mesos、URL monitor etc.
12 |
13 | -----
14 | **Acknowledgements**
15 |
16 | - OpenFalcon was initially started by Xiaomi and we would also like to acknowledge contributions by engineers from [these companies](./contributing.html) and [these individual developers](./contributing.html).
17 | - The OpenFalcon logo and website were contributed by Cepave Design Team.
18 | - [Wei Lai](https://github.com/laiwei) is the founder of OpenFalcon software and community.
19 | - The [english doc](http://book.open-falcon.com/en/index.html) is translated by [Liling Song](https://github.com/songliling).
20 |
21 | NOTICE:
22 |
23 | 1. QQ群已全部满员,请添加我的微信 `laiweivic` ,注明个人介绍和来源自open-falcon,我会拉你进入交流群组;
24 | 2. 我们更推荐您升级到[夜莺监控](https://github.com/ccfos/nightingale): 关于open-falcon和夜莺的对比介绍,请参考阅读[云原生监控的十个特点和趋势](https://mp.weixin.qq.com/s?__biz=MzkzNjI5OTM5Nw==&mid=2247483738&idx=1&sn=e8bdbb974a2cd003c1abcc2b5405dd18&chksm=c2a19fb0f5d616a63185cd79277a79a6b80118ef2185890d0683d2bb20451bd9303c78d083c5#rd);
25 |
26 |
27 | 请大家优先在 github 上提交 [issue](https://github.com/open-falcon/falcon-plus/issues), 方便问题沉淀,github issue 会最高优先级解决。
28 | - QQ五群:42607978 (已满员)
29 | - QQ四群:697503992 (已满员)
30 | - QQ一群:373249123 (已满员)
31 | - QQ二群:516088946 (已满员)
32 | - QQ三群:469342415 (已满员)
33 |
34 |  35 |
--------------------------------------------------------------------------------
/en_0_2/api/README.md:
--------------------------------------------------------------------------------
1 | # open-falcon api
2 | - [api v0.2](http://open-falcon.com/falcon-plus/)
3 |
--------------------------------------------------------------------------------
/en_0_2/authors.md:
--------------------------------------------------------------------------------
1 |
2 |
3 | ##Authors' contributions
4 |
5 | * laiwei 来炜没睡醒@微博 / hellolaiwei@微信
6 | * 秦晓辉 UlricQin@微博 微信公众号:sa-dev,语音答疑
7 | * yubo x80386@微信
8 | * niean niean_sail@微信
9 | * 小米运维部
--------------------------------------------------------------------------------
/en_0_2/dev/README.md:
--------------------------------------------------------------------------------
1 |
2 |
3 | # Environment Preparation
4 |
5 | Please refer to [Environment Preparation](../quick_install/prepare.md)
6 | # Changing Custom Archiving Strategy
7 | Change open-falcon/graph/rrdtool/rrdtool.go
8 |
9 | 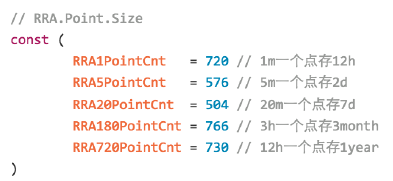
10 | 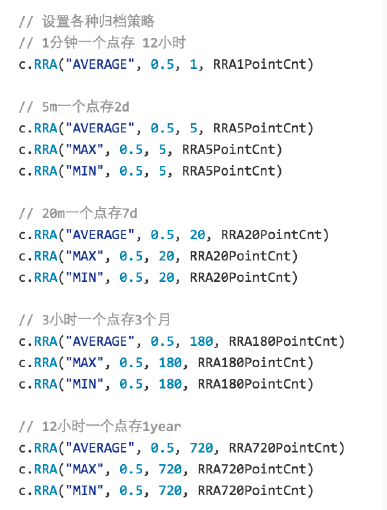
11 |
12 | Recompile Graph module and substitute the existing binary for a newer one
13 |
14 | Delete all previous RRD files (saved at "/home/work/data/6070/" by default)
15 |
16 | # Plugin Mechanism
17 | 1. Find a git that can store all the plugins of our company
18 | 2. Pull the Repo pulgin to local system by calling the /plugin/update port of Agent
19 | 3. Set which machine can execute which plugin in Portal
20 | 4. Plugins are named in form of "$step_xx.yy" and stored with executable permission in each directory of Repo by category
21 | 5. Print collected data to Stdout
22 | 6. Modify Agent if you find the git method inconvenient, just download zip files "plugin.tar.gz" from certain http address regularly
23 |
24 |
--------------------------------------------------------------------------------
/en_0_2/dev/support_grafana.md:
--------------------------------------------------------------------------------
1 |
2 |
3 | ## Supporting Grafana View
4 |
5 | Compared with builtin Dashboard of Open-Falcon, Grafana has flexible custom diagram. It can also set access control, add label and query information for Dashboard. Display setting of diagram is more various than before.
6 |
7 | This tutorial will help you with the look of Open-Falcon!
8 |
9 | ### Installation and Instruction
10 |
11 | Please refer to [grafana open-falcon](https://github.com/open-falcon/grafana-openfalcon-datasource)
12 |
13 |
14 | ### Acknowledges
15 | - the contribution of fastweb @kordan @masato25 and etc.
16 |
--------------------------------------------------------------------------------
/en_0_2/distributed_install/README.md:
--------------------------------------------------------------------------------
1 |
2 |
3 | # Summary
4 |
5 | Open-Falcon is a large distributed system with more than 10 modules. They can be divided by function into basic module, graph link module and alarm link module. The architecture of its installation and deployment is shown in the picture below.
6 |
7 | 
8 |
9 | ## Quick Installation on One Macine
10 |
11 | Please refer to [quick_install](../quick_install/README.md)
12 |
13 | ## Open-Falcon Installation in Docker Format
14 |
15 | Refer to:
16 | - https://github.com/open-falcon/falcon-plus/blob/master/docker/README.md
17 | - https://github.com/open-falcon/dashboard/blob/master/README.md
18 |
19 | ## Distributed Installation on Several Machines
20 |
21 | This chapter is about distributed installation on several machines. Please follow the steps to install every module.
22 |
23 | ## Video Tutorial of Installation
24 |
25 | 《[The analysis of Deployment and Architecture of Open-Falcon](http://www.jikexueyuan.com/course/1651.html)》
26 |
27 |
--------------------------------------------------------------------------------
/en_0_2/distributed_install/agent-updater.md:
--------------------------------------------------------------------------------
1 |
2 |
3 | # Agent-updater
4 |
5 | Falcon-agent needs to be deployed in every machine. If the quantity of company's machine is relatively small, it does not matter that you install falcon-agent manually using tools like pssh, ansible and fabric. But when the quantity increases, it will become a nightmare that you finish all the installation, update and rolling back manually.
6 |
7 | I personally developed a tool called Agent-updater for Falcon-agent management. Agent-updater also has a agent called ops-updater, which can be considered as a super agent that manage the agent of other agents. Ops-updater is recommended during installing. Usually, it does not require an update.
8 |
9 | For more information, please visit: https://github.com/open-falcon/ops-updater
10 |
11 | If you want to learn how to write a full project using Go language, you can also study agent-updater. I even recorded a video tutorial to show you how it is developed. The links are down below:
12 |
13 | - http://www.jikexueyuan.com/course/1336.html
14 | - http://www.jikexueyuan.com/course/1357.html
15 | - http://www.jikexueyuan.com/course/1462.html
16 | - http://www.jikexueyuan.com/course/1490.html
17 |
18 |
--------------------------------------------------------------------------------
/en_0_2/distributed_install/aggregator.md:
--------------------------------------------------------------------------------
1 |
2 |
3 | # Aggregator
4 |
5 | Cluster aggregation module aggregates the value of one specified index of all machines in one cluster, providing a monitoring experience with cluster perspective.
6 |
7 |
8 | ## Service Deployment
9 | Service deployment includes configuration changes, starting the service, testing the service, stopping the service etc. Before this, you need to unzip installation package to deployment directory of the service.
10 |
11 | ```
12 | # Change the configuration (the meaning of each setting is as follow)
13 | mv cfg.example.json cfg.json
14 | vim cfg.json
15 |
16 | # Start the service
17 | ./open-falcon start aggregator
18 |
19 | # Check the log
20 | ./open-falcon monitor aggregator
21 |
22 | # Stop the service
23 | ./open-falcon stop aggregator
24 |
25 | ```
26 |
27 |
28 | ## Configuraion Informaion
29 | The configuration file is "./cfg.json" and there will be an example configuration file "cfg.example.json" in each installation package by default. The meaning of each setting is as follows
30 |
31 | ```
32 | {
33 | "debug": true,
34 | "http": {
35 | "enabled": true,
36 | "listen": "0.0.0.0:6055"
37 | },
38 | "database": {
39 | "addr": "root:@tcp(127.0.0.1:3306)/falcon_portal?loc=Local&parseTime=true",
40 | "idle": 10,
41 | "ids": [1, -1],
42 | "interval": 55
43 | },
44 | "api": {
45 | "connect_timeout": 500,
46 | "request_timeout": 2000,
47 | "plus_api": "http://127.0.0.1:8080", #address where falcon-plus api module is running
48 | "plus_api_token": "default-token-used-in-server-side", #token used in mutual authentication with falcon-plus api module
49 | "push_api": "http://127.0.0.1:1988/v1/push" #http port of push's data provided by Agent
50 | }
51 | }
52 |
53 |
54 | ```
55 |
--------------------------------------------------------------------------------
/en_0_2/distributed_install/gateway.md:
--------------------------------------------------------------------------------
1 |
2 |
3 | # Gateway
4 |
5 | **If no problem comes up in room partition, please omit this component**。
6 |
7 | If there is something wrong with room partition and you need an urgent solution to the problem of data return in room partition, please use this component. For more information please visit [Here](https://github.com/open-falcon/falcon-plus/blob/master/modules/gateway/README.md).
--------------------------------------------------------------------------------
/en_0_2/distributed_install/prepare.md:
--------------------------------------------------------------------------------
1 |
2 |
3 | ## Environment Preparation
4 | Please refer to [Environment Preparation](../quick_install/prepare.md)
5 |
--------------------------------------------------------------------------------
/en_0_2/donate.md:
--------------------------------------------------------------------------------
https://raw.githubusercontent.com/open-falcon/book/f5ac09ca0c92d3c3d77aee4767aaab80edad1bbf/en_0_2/donate.md
--------------------------------------------------------------------------------
/en_0_2/faq/collect.md:
--------------------------------------------------------------------------------
1 |
2 |
3 | # FAQ about Data Collection
4 | Open-Falcon data collection includes [Graph Data] collection and [Alarm Data] collection. Here is how to check if the data collection works properly in these two links.
5 |
6 |
7 | ### How to check if [Graph Data] collection works properly?
8 | The data link is `agent->transfer->graph->query->dashboard`. There is a http port in Graph that can check the link `agent->transfer->graph`. For example, if the http port in Graph is 6071, then you can check by visiting:
9 |
10 | ```bash
11 | # $endpoint and $counter are variables
12 | curl http://127.0.0.1:6071/history/$endpoint/$counter
13 |
14 | # If the data are sent without tags, then you should visit
15 | curl http://127.0.0.1:6071/history/host01/agent.alive
16 |
17 | # If the data are sent with tags, then you should visit
18 | curl http://127.0.0.1:6071/history/host01/qps/module=graph,project=falcon
19 | "module=graph" and "project=falcon" are tags
20 | ```
21 | If those ports return void, that means Agent does not send data or an error occurs in Transfer.
22 |
23 |
24 | ### How to check if [Alarm Data] collection works properly?
25 |
26 | The data link is `agent->transfer->judge`. There is an http port in Judge that can check the link `agent->transfer->judge`. For example, if the http port in Judge is 6081, then you can check by visiting:
27 |
28 | ```bash
29 | curl http://127.0.0.1:6081/history/$endpoint/$counter
30 |
31 | # $endpoint and $counter are variables
32 | curl http://127.0.0.1:6081/history/host01/cpu.idle
33 |
34 | # counter=$metric/sorted($tags)
35 | # If the data are sent with tags, then you should visit
36 | curl http://127.0.0.1:6081/history/host01/qps/module=judge,project=falcon
37 | ```
38 | If those ports return void, that means Agent did not send data or an error occurs in Transfer.
39 |
40 |
--------------------------------------------------------------------------------
/en_0_2/image/OpenFalcon_wechat.jpg:
--------------------------------------------------------------------------------
https://raw.githubusercontent.com/open-falcon/book/f5ac09ca0c92d3c3d77aee4767aaab80edad1bbf/en_0_2/image/OpenFalcon_wechat.jpg
--------------------------------------------------------------------------------
/en_0_2/image/func_aggregator_1.png:
--------------------------------------------------------------------------------
https://raw.githubusercontent.com/open-falcon/book/f5ac09ca0c92d3c3d77aee4767aaab80edad1bbf/en_0_2/image/func_aggregator_1.png
--------------------------------------------------------------------------------
/en_0_2/image/func_aggregator_2.png:
--------------------------------------------------------------------------------
https://raw.githubusercontent.com/open-falcon/book/f5ac09ca0c92d3c3d77aee4767aaab80edad1bbf/en_0_2/image/func_aggregator_2.png
--------------------------------------------------------------------------------
/en_0_2/image/func_aggregator_3.png:
--------------------------------------------------------------------------------
https://raw.githubusercontent.com/open-falcon/book/f5ac09ca0c92d3c3d77aee4767aaab80edad1bbf/en_0_2/image/func_aggregator_3.png
--------------------------------------------------------------------------------
/en_0_2/image/func_aggregator_4.png:
--------------------------------------------------------------------------------
https://raw.githubusercontent.com/open-falcon/book/f5ac09ca0c92d3c3d77aee4767aaab80edad1bbf/en_0_2/image/func_aggregator_4.png
--------------------------------------------------------------------------------
/en_0_2/image/func_aggregator_5.png:
--------------------------------------------------------------------------------
https://raw.githubusercontent.com/open-falcon/book/f5ac09ca0c92d3c3d77aee4767aaab80edad1bbf/en_0_2/image/func_aggregator_5.png
--------------------------------------------------------------------------------
/en_0_2/image/func_getting_started_1.png:
--------------------------------------------------------------------------------
https://raw.githubusercontent.com/open-falcon/book/f5ac09ca0c92d3c3d77aee4767aaab80edad1bbf/en_0_2/image/func_getting_started_1.png
--------------------------------------------------------------------------------
/en_0_2/image/func_getting_started_10.png:
--------------------------------------------------------------------------------
https://raw.githubusercontent.com/open-falcon/book/f5ac09ca0c92d3c3d77aee4767aaab80edad1bbf/en_0_2/image/func_getting_started_10.png
--------------------------------------------------------------------------------
/en_0_2/image/func_getting_started_11.png:
--------------------------------------------------------------------------------
https://raw.githubusercontent.com/open-falcon/book/f5ac09ca0c92d3c3d77aee4767aaab80edad1bbf/en_0_2/image/func_getting_started_11.png
--------------------------------------------------------------------------------
/en_0_2/image/func_getting_started_12.png:
--------------------------------------------------------------------------------
https://raw.githubusercontent.com/open-falcon/book/f5ac09ca0c92d3c3d77aee4767aaab80edad1bbf/en_0_2/image/func_getting_started_12.png
--------------------------------------------------------------------------------
/en_0_2/image/func_getting_started_2.png:
--------------------------------------------------------------------------------
https://raw.githubusercontent.com/open-falcon/book/f5ac09ca0c92d3c3d77aee4767aaab80edad1bbf/en_0_2/image/func_getting_started_2.png
--------------------------------------------------------------------------------
/en_0_2/image/func_getting_started_3.png:
--------------------------------------------------------------------------------
https://raw.githubusercontent.com/open-falcon/book/f5ac09ca0c92d3c3d77aee4767aaab80edad1bbf/en_0_2/image/func_getting_started_3.png
--------------------------------------------------------------------------------
/en_0_2/image/func_getting_started_4.png:
--------------------------------------------------------------------------------
https://raw.githubusercontent.com/open-falcon/book/f5ac09ca0c92d3c3d77aee4767aaab80edad1bbf/en_0_2/image/func_getting_started_4.png
--------------------------------------------------------------------------------
/en_0_2/image/func_getting_started_5.png:
--------------------------------------------------------------------------------
https://raw.githubusercontent.com/open-falcon/book/f5ac09ca0c92d3c3d77aee4767aaab80edad1bbf/en_0_2/image/func_getting_started_5.png
--------------------------------------------------------------------------------
/en_0_2/image/func_getting_started_6.png:
--------------------------------------------------------------------------------
https://raw.githubusercontent.com/open-falcon/book/f5ac09ca0c92d3c3d77aee4767aaab80edad1bbf/en_0_2/image/func_getting_started_6.png
--------------------------------------------------------------------------------
/en_0_2/image/func_getting_started_7.png:
--------------------------------------------------------------------------------
https://raw.githubusercontent.com/open-falcon/book/f5ac09ca0c92d3c3d77aee4767aaab80edad1bbf/en_0_2/image/func_getting_started_7.png
--------------------------------------------------------------------------------
/en_0_2/image/func_getting_started_8.png:
--------------------------------------------------------------------------------
https://raw.githubusercontent.com/open-falcon/book/f5ac09ca0c92d3c3d77aee4767aaab80edad1bbf/en_0_2/image/func_getting_started_8.png
--------------------------------------------------------------------------------
/en_0_2/image/func_getting_started_9.png:
--------------------------------------------------------------------------------
https://raw.githubusercontent.com/open-falcon/book/f5ac09ca0c92d3c3d77aee4767aaab80edad1bbf/en_0_2/image/func_getting_started_9.png
--------------------------------------------------------------------------------
/en_0_2/image/func_intro_1.png:
--------------------------------------------------------------------------------
https://raw.githubusercontent.com/open-falcon/book/f5ac09ca0c92d3c3d77aee4767aaab80edad1bbf/en_0_2/image/func_intro_1.png
--------------------------------------------------------------------------------
/en_0_2/image/func_intro_2.png:
--------------------------------------------------------------------------------
https://raw.githubusercontent.com/open-falcon/book/f5ac09ca0c92d3c3d77aee4767aaab80edad1bbf/en_0_2/image/func_intro_2.png
--------------------------------------------------------------------------------
/en_0_2/image/func_intro_3.png:
--------------------------------------------------------------------------------
https://raw.githubusercontent.com/open-falcon/book/f5ac09ca0c92d3c3d77aee4767aaab80edad1bbf/en_0_2/image/func_intro_3.png
--------------------------------------------------------------------------------
/en_0_2/image/func_intro_4.png:
--------------------------------------------------------------------------------
https://raw.githubusercontent.com/open-falcon/book/f5ac09ca0c92d3c3d77aee4767aaab80edad1bbf/en_0_2/image/func_intro_4.png
--------------------------------------------------------------------------------
/en_0_2/image/func_intro_5.png:
--------------------------------------------------------------------------------
https://raw.githubusercontent.com/open-falcon/book/f5ac09ca0c92d3c3d77aee4767aaab80edad1bbf/en_0_2/image/func_intro_5.png
--------------------------------------------------------------------------------
/en_0_2/image/func_intro_6.png:
--------------------------------------------------------------------------------
https://raw.githubusercontent.com/open-falcon/book/f5ac09ca0c92d3c3d77aee4767aaab80edad1bbf/en_0_2/image/func_intro_6.png
--------------------------------------------------------------------------------
/en_0_2/image/func_intro_7.png:
--------------------------------------------------------------------------------
https://raw.githubusercontent.com/open-falcon/book/f5ac09ca0c92d3c3d77aee4767aaab80edad1bbf/en_0_2/image/func_intro_7.png
--------------------------------------------------------------------------------
/en_0_2/image/func_intro_8.png:
--------------------------------------------------------------------------------
https://raw.githubusercontent.com/open-falcon/book/f5ac09ca0c92d3c3d77aee4767aaab80edad1bbf/en_0_2/image/func_intro_8.png
--------------------------------------------------------------------------------
/en_0_2/image/func_nodata_1.png:
--------------------------------------------------------------------------------
https://raw.githubusercontent.com/open-falcon/book/f5ac09ca0c92d3c3d77aee4767aaab80edad1bbf/en_0_2/image/func_nodata_1.png
--------------------------------------------------------------------------------
/en_0_2/image/func_nodata_2.png:
--------------------------------------------------------------------------------
https://raw.githubusercontent.com/open-falcon/book/f5ac09ca0c92d3c3d77aee4767aaab80edad1bbf/en_0_2/image/func_nodata_2.png
--------------------------------------------------------------------------------
/en_0_2/image/func_nodata_3.png:
--------------------------------------------------------------------------------
https://raw.githubusercontent.com/open-falcon/book/f5ac09ca0c92d3c3d77aee4767aaab80edad1bbf/en_0_2/image/func_nodata_3.png
--------------------------------------------------------------------------------
/en_0_2/image/linkedsee_1.png:
--------------------------------------------------------------------------------
https://raw.githubusercontent.com/open-falcon/book/f5ac09ca0c92d3c3d77aee4767aaab80edad1bbf/en_0_2/image/linkedsee_1.png
--------------------------------------------------------------------------------
/en_0_2/image/linkedsee_2.png:
--------------------------------------------------------------------------------
https://raw.githubusercontent.com/open-falcon/book/f5ac09ca0c92d3c3d77aee4767aaab80edad1bbf/en_0_2/image/linkedsee_2.png
--------------------------------------------------------------------------------
/en_0_2/image/linkedsee_3.png:
--------------------------------------------------------------------------------
https://raw.githubusercontent.com/open-falcon/book/f5ac09ca0c92d3c3d77aee4767aaab80edad1bbf/en_0_2/image/linkedsee_3.png
--------------------------------------------------------------------------------
/en_0_2/image/linkedsee_4.png:
--------------------------------------------------------------------------------
https://raw.githubusercontent.com/open-falcon/book/f5ac09ca0c92d3c3d77aee4767aaab80edad1bbf/en_0_2/image/linkedsee_4.png
--------------------------------------------------------------------------------
/en_0_2/image/linkedsee_5.png:
--------------------------------------------------------------------------------
https://raw.githubusercontent.com/open-falcon/book/f5ac09ca0c92d3c3d77aee4767aaab80edad1bbf/en_0_2/image/linkedsee_5.png
--------------------------------------------------------------------------------
/en_0_2/image/practice_graph-scaling_io01.png:
--------------------------------------------------------------------------------
https://raw.githubusercontent.com/open-falcon/book/f5ac09ca0c92d3c3d77aee4767aaab80edad1bbf/en_0_2/image/practice_graph-scaling_io01.png
--------------------------------------------------------------------------------
/en_0_2/image/practice_graph-scaling_io02.png:
--------------------------------------------------------------------------------
https://raw.githubusercontent.com/open-falcon/book/f5ac09ca0c92d3c3d77aee4767aaab80edad1bbf/en_0_2/image/practice_graph-scaling_io02.png
--------------------------------------------------------------------------------
/en_0_2/image/practice_graph-scaling_io03.png:
--------------------------------------------------------------------------------
https://raw.githubusercontent.com/open-falcon/book/f5ac09ca0c92d3c3d77aee4767aaab80edad1bbf/en_0_2/image/practice_graph-scaling_io03.png
--------------------------------------------------------------------------------
/en_0_2/image/practice_graph-scaling_quantity.png:
--------------------------------------------------------------------------------
https://raw.githubusercontent.com/open-falcon/book/f5ac09ca0c92d3c3d77aee4767aaab80edad1bbf/en_0_2/image/practice_graph-scaling_quantity.png
--------------------------------------------------------------------------------
/en_0_2/image/practice_graph-scaling_rrd.png:
--------------------------------------------------------------------------------
https://raw.githubusercontent.com/open-falcon/book/f5ac09ca0c92d3c3d77aee4767aaab80edad1bbf/en_0_2/image/practice_graph-scaling_rrd.png
--------------------------------------------------------------------------------
/en_0_2/image/practice_graph-scaling_stats.png:
--------------------------------------------------------------------------------
https://raw.githubusercontent.com/open-falcon/book/f5ac09ca0c92d3c3d77aee4767aaab80edad1bbf/en_0_2/image/practice_graph-scaling_stats.png
--------------------------------------------------------------------------------
/en_0_2/philosophy/README.md:
--------------------------------------------------------------------------------
1 |
2 |
3 | # Design Intention
4 |
5 | It is about all the conceptions about the design of open-falcon.
6 |
--------------------------------------------------------------------------------
/en_0_2/philosophy/data-model.md:
--------------------------------------------------------------------------------
1 |
2 |
3 | # Data model
4 |
5 | The data model in Open-Falcon is similar to the one in OpenTSDB:metric and endpoint with a couple of key value tags. Here are two examples:
6 |
7 | ```bash
8 | {
9 | metric: load.1min,
10 | endpoint: open-falcon-host,
11 | tags: srv=falcon,idc=aws-sgp,group=az1,
12 | value: 1.5,
13 | timestamp: `date +%s`,
14 | counterType: GAUGE,
15 | step: 60
16 | }
17 | {
18 | metric: net.port.listen,
19 | endpoint: open-falcon-host,
20 | tags: port=3306,
21 | value: 1,
22 | timestamp: `date +%s`,
23 | counterType: GAUGE,
24 | step: 60
25 | }
26 | ```
27 |
28 | In those two examples, metric is the name of monitor index, endpoint is the object that is being monitoed, tags are about the attributes the monitor data, counterType is the data type defined by Open-Falcon (which can be GAUGE or COUNTER), step is the reporting cycle of monitor data, and value and timestamp arw valid monitor data.
--------------------------------------------------------------------------------
/en_0_2/practice/README.md:
--------------------------------------------------------------------------------
1 |
2 |
3 | The experience of practing Open-Falcon
4 |
--------------------------------------------------------------------------------
/en_0_2/quick_install/README.md:
--------------------------------------------------------------------------------
1 |
2 |
3 | Open-Falcon are divided into frontend structure and backend structure:
4 |
5 | - [Backend Installation](./backend.md)
6 | - [Frontend Installation](./frontend.md)
7 |
--------------------------------------------------------------------------------
/en_0_2/quick_install/backend.md:
--------------------------------------------------------------------------------
1 |
2 |
3 | ## Environment Preparation
4 |
5 | Please refer to [Environment Preparation](./prepare.md)
6 |
7 | ### Create a Working Directory
8 | ```bash
9 | export FALCON_HOME=/home/work
10 | export WORKSPACE=$FALCON_HOME/open-falcon
11 | mkdir -p $WORKSPACE
12 | ```
13 |
14 | ### Unzip the Binary Pack
15 | ```bash
16 | tar -xzvf open-falcon-v0.2.1.tar.gz -C $WORKSPACE
17 | ```
18 |
19 | ### Execute All the Backend Modules on One Machine
20 |
21 | # First, make sure that the username and password in the configuration file of database are valid, or the configuration file should be edited.
22 | ```
23 | cd $WORKSPACE
24 | grep -Ilr 3306 ./ | xargs -n1 -- sed -i 's/root:/real_user:real_password/g'
25 | ```
26 | # Execute
27 | ```bash
28 | cd $WORKSPACE
29 | ./open-falcon start
30 |
31 | # check the startup of all the modules
32 | ./open-falcon check
33 |
34 | ```
35 |
36 | ### More usage of command line tools
37 | ```bash
38 | # ./open-falcon [start|stop|restart|check|monitor|reload] module
39 | ./open-falcon start agent
40 |
41 | ./open-falcon check
42 | falcon-graph UP 53007
43 | falcon-hbs UP 53014
44 | falcon-judge UP 53020
45 | falcon-transfer UP 53026
46 | falcon-nodata UP 53032
47 | falcon-aggregator UP 53038
48 | falcon-agent UP 53044
49 | falcon-gateway UP 53050
50 | falcon-api UP 53056
51 | falcon-alarm UP 53063
52 |
53 | For debugging , You can check $WorkDir/$moduleName/log/logs/xxx.log
54 | ```
55 |
--------------------------------------------------------------------------------
/en_0_2/quick_install/prepare.md:
--------------------------------------------------------------------------------
1 |
2 |
3 | # Environment Preparation
4 |
5 | ### Install Redis
6 | yum install -y redis
7 |
8 | ### Install MySQL
9 | yum install -y mysql-server
10 |
11 | **Attention: Make sure Redis and MySQL are enabled.**
12 |
13 | ### Initialize the Structure of MySQL List
14 |
15 | ```
16 | cd /tmp/ && git clone https://github.com/open-falcon/falcon-plus.git
17 | cd /tmp/falcon-plus/scripts/mysql/db_schema/
18 | mysql -h 127.0.0.1 -u root -p < 1_uic-db-schema.sql
19 | mysql -h 127.0.0.1 -u root -p < 2_portal-db-schema.sql
20 | mysql -h 127.0.0.1 -u root -p < 3_dashboard-db-schema.sql
21 | mysql -h 127.0.0.1 -u root -p < 4_graph-db-schema.sql
22 | mysql -h 127.0.0.1 -u root -p < 5_alarms-db-schema.sql
23 | rm -rf /tmp/falcon-plus/
24 | ```
25 |
26 | **If you update v0.1.0 to the current v0.2.0,you only need to execute the following command:**
27 |
28 | ```
29 | mysql -h 127.0.0.1 -u root -p < 5_alarms-db-schema.sql
30 | ```
31 |
32 | # Compile from the Source Code
33 |
34 | First, make sure you have installed golang environment. If not, please refer to https://golang.org/doc/install
35 |
36 | ```
37 | cd $GOPATH/src/github.com/open-falcon/falcon-plus/
38 |
39 | # make all modules
40 | make all
41 |
42 | # pack all modules
43 | make pack
44 |
45 | ```
46 |
47 | Then you will get a zipped pack of open-falcon-v0.2.0.tar.gz in the current directory, which means the compilation and packaging are successfully finished.
48 |
49 | # Download the Compiled Binary Version
50 |
51 | If you do not want to compile by yourself, you can download the compiled [Binary Version(x86 64-bit system)](https://github.com/open-falcon/falcon-plus/releases)。
52 |
53 |
54 | The preparation is finished until this step. Unzip the binary pack open-falcon-v0.2.0.tar.gz in appropriate directory and save it for later use.
55 |
--------------------------------------------------------------------------------
/en_0_2/styles/website.css:
--------------------------------------------------------------------------------
1 | /* CSS for website */
2 | h1 , h2{
3 | border-bottom: 1px solid #EFEAEA;
4 | padding-bottom: 3px;
5 | }
6 | .markdown-section>:first-child {
7 | margin-top: 0!important;
8 | }
9 | .markdown-section blockquote:last-child {
10 | margin-bottom: 0.85em!important;
11 | }
12 | .page-wrapper {
13 | margin-top: -1.275em;
14 | }
15 | .book .book-body .page-wrapper .page-inner section.normal {
16 | min-height:350px;
17 | margin-bottom: 30px;
18 | }
19 |
20 | .book .book-body .page-wrapper .page-inner section.normal hr {
21 | height: 0px;
22 | padding: 0;
23 | margin: 1.7em 0;
24 | overflow: hidden;
25 | background-color: #e7e7e7;
26 | border-bottom: 1px dotted #e7e7e7;
27 | }
28 |
29 | .video-js {
30 | width:100%;
31 | height: 100%;
32 | }
33 |
34 | pre[class*="language-"] {
35 | border: none;
36 | background-color: #f7f7f7;
37 | font-size: 1em;
38 | line-height: 1.2em;
39 | }
40 |
41 | .book .book-body .page-wrapper .page-inner section.normal {
42 | font-size: 14px;
43 | font-family: "ubuntu", "Tahoma", "Microsoft YaHei", arial, sans-serif;
44 | }
45 |
46 | .aceCode {
47 | font-size: 14px !important;
48 | }
49 |
50 | input[type=checkbox]{
51 | margin-left: -2em;
52 | }
53 |
54 | .page-footer span{
55 | font-size: 12px;
56 | }
57 |
58 | .page-footer .copyright {
59 | float: left;
60 | }
61 |
62 | .body, html {
63 | overflow-y: hidden;
64 | }
65 |
66 | .versions-select select {
67 | height: 2em;
68 | line-height: 2em;
69 | border-radius: 4px;
70 | background: #efefef;
71 | }
72 |
73 |
--------------------------------------------------------------------------------
/en_0_2/usage/README.md:
--------------------------------------------------------------------------------
1 |
2 |
3 | User's Manual of Open-falcon
4 |
5 |
--------------------------------------------------------------------------------
/en_0_2/usage/docker.md:
--------------------------------------------------------------------------------
1 |
2 |
3 |
4 | # Practice of Monitoring Docker Container
5 |
6 | In [Data Collection](../philosophy/data-collect.md), we introduced the common data sources. As a monitor framework, Open-Falcon can collect the monitor index data of any system as long as they are converted to the standard format of Open-Falcon.
7 |
8 | The data collection of docker container can be done through [micadvisor_open](https://github.com/open-falcon/micadvisor_open).
9 |
10 | ## Working Principle
11 |
12 | Micadvisor-open is a module for monitoring the resource of docker container based on Open-Falcon. The data of CPU, memory, diskio and networkio will be pushed to Open-Falcon after being collected.
13 |
14 | ## Collected Index
15 |
16 | | Counters | Notes|
17 | |-----|------|
18 | |cpu.busy|percentage of cpu usage|
19 | |cpu.user|user-mode percentage of cpu usage|
20 | |cpu.system|kernel-mode percentage of cpu usage|
21 | |cpu.core.busy|usage of each cpu|
22 | |mem.memused.percent|percentage of memory usage|
23 | |mem.memused|amount of memory usage|
24 | |mem.memtotal|total amount of memory|
25 | |mem.memused.hot|hot usage of cpu|
26 | |disk.io.read_bytes|bytes diskio reads|
27 | |disk.io.write_bytes|bytes diskio write|
28 | |net.if.in.bytes|incoming bytes of networkio|
29 | |net.if.in.packets|incoming packets of networkio|
30 | |net.if.in.errors|incoming errors of networkio|
31 | |net.if.in.dropped|incoming droppings of networkio|
32 | |net.if.out.bytes|outgoing bytes of networkio|
33 | |net.if.out.packets|outgoing packets of networkio|
34 | |net.if.out.errors|outgoing errors of networkio|
35 | |net.if.out.dropped|outgoing droppings of networkio|
36 |
37 | ## Contributors
38 | - mengzhuo: QQ:296142139; MAIL:mengzhuo@xiaomi.com
39 |
40 | ## Complementary Information
41 | - The lib database collected by another docker metric: https://github.com/projecteru/eru-metric
42 |
43 |
--------------------------------------------------------------------------------
/en_0_2/usage/du-proc.md:
--------------------------------------------------------------------------------
1 |
2 |
3 |
4 | # Practice of monitoring directory size and process detail
5 |
6 | To collect the data of directory size and process details, we can use the scripts [falcon-scripts](https://github.com/ZoneTong/falcon-scripts)
7 |
8 | ## Collected Index
9 |
10 | Below is the metrics:
11 |
12 | | METRIC | NOTE |
13 | |--------|------|
14 | |du.bytes.used|directory size, byte|
15 | |proc.cpu|process cpu, percent|
16 | |proc.mem|process memory, byte|
17 | |proc.io.in|process io input, byte|
18 | |proc.io.out|process io output, byte|
19 |
20 | ## Working Principle
21 |
22 | du.sh collects data by command du
23 |
24 | proc.sh analyzes the data in /proc/$PID/status /proc/$PID/io and etc.
25 |
--------------------------------------------------------------------------------
/en_0_2/usage/flume.md:
--------------------------------------------------------------------------------
1 |
2 |
3 | # Flume Monitor
4 |
5 | In [Data Collection](../philosophy/data-collect.md), we introduced the common data sources. As a monitor framework, Open-Falcon can collect the monitor index data of any system as long as they are converted to the standard format of Open-Falcon.
6 |
7 | The data collection of Flume can be done through [flume-monitor](https://github.com/mdh67899/openfalcon-monitor-scripts/tree/master/flume).
8 |
9 | ## Working Principle
10 | ```flume-monitor.py``` is a collecting script. Users only need to put it in the Plugin directory of the Falcon-Agent and bind corresponding pluging to the hostgroup in Portal. Falcon-agent automatically execute the script ```flume-monitor.py```. After the execution of the script, the result data of ```flume-monitor.py``` is output in json format which is read analysed by Falcon-Agent.
11 |
12 | Java environment varible is supposed to be added in the configuration file when Flume is running. After booting up, Flume process will provide a monitor port. Users can collect the metrics provided by flume through http request. The script ```flume-monitor.py``` configures the Flume metric that needs to be collected, the module information that needs to be collected from flume port through http method, and output data in json format.
13 |
14 | If we deploy three flumes on one machine, users can copy the script to three, edit the address of ```http url```, which makes it corresponding to the http port that flume monitors, and bind the plugin in Protal.
15 |
--------------------------------------------------------------------------------
/en_0_2/usage/haproxy.md:
--------------------------------------------------------------------------------
1 |
2 |
3 | #HAProxy Monitor
4 |
5 | In [Data Collection](../philosophy/data-collect.md), we introduced the common data sources. As a monitor framework, Open-Falcon can collect the monitor index data of any system as long as they are converted to the standard format of Open-Falcon.
6 |
7 | The data collection of HAProxy can be done through [haproxymon](https://github.com/iask/haproxymon).
8 |
9 | ## Working Principle
10 |
11 | Haproxymon is a cron that execute the collecting script ```haproxymon.py``` every minute. Haproxymon collects the basic state information of Haproxy, like qcur, scur and rate and etc., through the state socket of Haporxy, encapsulate them in the format that is suitable for Open-Falcon, and post them to the local falcon-agent. Falcon-Agent provides an http port. You can refer to [Data Collection](../philosophy/data-collect.md) for its use.
--------------------------------------------------------------------------------
/en_0_2/usage/jmx.md:
--------------------------------------------------------------------------------
1 |
2 |
3 | # Jmxmon Introduction
4 | Jmxmon is a jmx monitor module based on Open-falcon. Along with the agent of open-falcon, it can collect the service state of any java process whose JMX service port is open and push the collected data to the service of Open-falcon.
5 |
6 | ## Main Feature
7 |
8 | Collecting jvm information of java process through jmx, including gc time consuming, gc frequency, gc throughput, utilization rate of old generation, size of new generation promotion, active threads and etc.。
9 |
10 | It does not hack the code of programm and cost little resources in the system.
11 |
12 |
13 | ## Collected Metrics
14 | | Counters | Type | Notes|
15 | |-----|------|------|
16 | | parnew.gc.avg.time | GAUGE | average time consuming of each YoungGC(parnew) in a minute|
17 | | concurrentmarksweep.gc.avg.time | GAUGE | average time consuming of each CMSGC in a minute|
18 | | parnew.gc.count | GAUGE | counter of the YoungGC(parnew) in a minute |
19 | | concurrentmarksweep.gc.count | GAUGE | ounter of the CMSGC in a minute |
20 | | gc.throughput | GAUGE | total traffic ratio of GC (application running time/process total running time) |
21 | | new.gen.promotion | GAUGE | size of the new generation memory promotion in a minute |
22 | | new.gen.avg.promotion | GAUGE | average size of all new generation memory promotion in a minute |
23 | | old.gen.mem.used | GAUGE | memory usage of old generation老年代的内存使用量 |
24 | | old.gen.mem.ratio | GAUGE | memory usage percentage of old generation |
25 | | thread.active.count | GAUGE | number of currently active thread |
26 | | thread.peak.count | GAUGE | peak number of thread |
27 |
28 | ## Recommended Metrics in Monitor Alarm
29 |
30 | The alarm metric and the threshold can be congifured flexibility according to their different features.
31 |
32 | | Metric | Condition | Note|
33 | |-----|------|------|
34 | | gc.throughput | all(#3)<98 | gc thtoughput rate stays below 98% will affect the performance |
35 | | old.gen.mem.ratio | all(#3)>90 | it needs to be optimized that the old generation memory usage 10 over 90% |
36 | | thread.active.count | all(#3)>500 | too many threads will affect the performance |
37 |
38 |
39 | # Help
40 | Please visit [jmxmon](https://github.com/toomanyopenfiles/jmxmon) for more detailed instruction.
41 |
42 |
--------------------------------------------------------------------------------
/en_0_2/usage/lvs.md:
--------------------------------------------------------------------------------
1 |
2 |
3 | # Lvs-metrics Introduction
4 | Lvs-metrics is a LVS monitor module based on Open-falcon. Along with the agent and transfer of open-falcon, it can collect the state data of LVS service and push the collected data to the service of Open-falcon.
5 |
6 | ## Main Feature
7 |
8 | Collecting the monitor data of LVS service through open source ipvs/netlink database from google and the files in proc, including the connection number of all the VIPs (active/inactive), the connection number of all the LVS machines (active/inactive) and the data size (packets) in the data traffic.
9 |
10 | It does not hack the code of programm and cost little resources in the system.
11 |
12 |
13 | ## Collected Metrics
14 |
15 | | Counters | Type | Notes |
16 | |-----|-----|-----|
17 | | lvs.in.bytes | GUAGE | network in bytes per host |
18 | | lvs.out.bytes | GUAGE | network out bytes per host |
19 | | lvs.in.packets | GUAGE | network in packets per host |
20 | | lvs.out.packets | GUAGE | network out packets per host |
21 | | lvs.total.conns | GUAGE | lvs total connections per vip now |
22 | | lvs.active.conn | GUAGE | lvs active connections per vip now |
23 | | lvs.inact.conn | GUAGE | lvs inactive connections per vip now |
24 | | lvs.realserver.num | GUAGE | lvs live realserver num per vip now |
25 | | lvs.vip.conns | COUNTER | lvs conns counter from service start per vip |
26 | | lvs.vip.inbytes | COUNTER | lvs inbytes counter from service start per vip |
27 | | lvs.vip.outbytes | COUNTER | lvs outpkts counter from service start per vip |
28 | | lvs.vip.inpkts | COUNTER | lvs inpkts counter from service start per vip |
29 | | lvs.vip.outpkts | COUNTER | lvs outpkts counter from service start per vip |
30 |
31 |
32 | # Help
33 | Please visit [lvs-metrics](https://github.com/mesos-utility/lvs-metrics) for more detailed instruction.
34 |
35 |
--------------------------------------------------------------------------------
/en_0_2/usage/memcache.md:
--------------------------------------------------------------------------------
1 |
2 |
3 | # Memcache Monitor
4 |
5 | In [Data Collection](../philosophy/data-collect.md), we introduced the common data sources. As a monitor framework, Open-Falcon can collect the monitor index data of any system as long as they are converted to the standard format of Open-Falcon.
6 |
7 | The data collection of Flume can be done through the script [memcached-monitor](https://github.com/iambocai/falcon-monit-scripts/tree/master/memcached).
8 |
9 | ## Working Principle
10 |
11 | Memcached-monitor is a cron. It executes the script ```memcached-monitor.py``` once a minute that will automatically detect the port of Memcached , connect Memcached instance and collect some monitor metrics, like get_hit_ratio, usage and etc. Next, it convert the data to the format that is suitable for the Open-Falcon and post them to local falcon-agent. Falcon-agent provides an http port, and you can refer to the examples in [Data Collection](../philosophy/data-collect.md).
12 |
13 | For example, if we deploy a Memcached instance in each of the 1000 machines, then we can deploy a cron instance in each machine that matches every Memcached instance.
14 |
15 | What needs to be clarified is that the script ```memcached-monitor.py``` automatically finds Memcached port through ```ps -ef |grep memcached|grep -v grep |sed -n 's/.* *-p *\([0-9]\{1,5\}\).*/\1/p``` If user does not specify a port by configuring parameter ```-p``` when starting Memcached , the automatic detect of port will fail and user has to edit the script manually and specify a port.
--------------------------------------------------------------------------------
/en_0_2/usage/mesos.md:
--------------------------------------------------------------------------------
1 |
2 |
3 | # Mesos Monitor
4 |
5 | Mesos.py is a script of Open-Falcon developed by leancloud. Along with the Agent/Transfer of Open-Falcon, it can collect mesos data and automatically send them to the service of Open-Falcon.
6 |
7 | [https://github.com/leancloud/satori/tree/master/satori-rules/plugin/mesos](https://github.com/leancloud/satori/tree/master/satori-rules/plugin/mesos)
8 |
--------------------------------------------------------------------------------
/en_0_2/usage/mymon.md:
--------------------------------------------------------------------------------
1 |
2 |
3 | # MySQL Monitor
4 |
5 | In [Data Collection](../philosophy/data-collect.md), we introduced the common data sources. As a monitor framework, Open-Falcon can collect the monitor index data of any system as long as they are converted to the standard format of Open-Falcon.
6 |
7 | The data collection of MySQL can be done through [mymon](https://github.com/open-falcon/mymon).
8 |
9 | ## Working Principle
10 |
11 | Mymon is a cron that runs every minute. Its configuration has a database address. Mymon will be connected to that database and collect the state data, like global status, global variables, slave status and etc. Next it encapsulates them in the format that is suitable for Open-Falcon and post them to the local falcon-agent. Falcon-Agent provides an http port. You can refer to [Data Collection](../philosophy/data-collect.md) for its use.
12 |
13 | If we deploy a MySQL instance in each on our 1000 machines, then we can deploy a cron in each machine, which means the database and the instance are matched one-to-one.
14 |
15 | ## Complementary Information
16 | ***Instance of Remote MySQL Monitor ***
17 | If you want to collect the MySQL metric data of Host B through the mymon of Host A, here is the resolution: set the Endpoint configuration in mymon of Host A to the machine name of Host B and set the MySQL configuration to the MySQL instance of Host B. User needs to find the metric that is corresponding to the machine name of Host B while viewing MySQL metric and adding strategy to MySQL metric.
--------------------------------------------------------------------------------
/en_0_2/usage/ngx_metric.md:
--------------------------------------------------------------------------------
1 |
2 |
3 | # Nginx Monitor
4 |
5 | In [Data Collection](../philosophy/data-collect.md), we introduced the common data sources. As a monitor framework, Open-Falcon can collect the monitor index data of any system as long as they are converted to the standard format of Open-Falcon.
6 |
7 | The data collection of Nginx can be done through [ngx_metric](https://github.com/GuyCheung/falcon-ngx_metric).
8 |
9 | # Working Principle
10 | Ngx_metric achieves the real-time analysis of nginx through the `log_by_lua` feature in lua-nginx-module, and save the intermediate result through `ngx.shared.DICT`. Finally extract the intermediate result, calculate, format and output the final result through external python script. The result in Falcon output format can be directly pushed to Falcon-Agent.
11 |
12 | # Help
13 |
14 | For detailed instruction please wisit [ngx_metric](https://github.com/GuyCheung/falcon-ngx_metric).
15 |
--------------------------------------------------------------------------------
/en_0_2/usage/query.md:
--------------------------------------------------------------------------------
1 |
2 |
3 | # History Data Query
4 |
5 | Any data pushed to Open-falcon can be queried through restAPI provided by API module.
6 |
7 | For more inforamtion, please refer to [API file](http://open-falcon.com/falcon-plus/#/graph_histroy).
8 |
--------------------------------------------------------------------------------
/en_0_2/usage/rabbitmq.md:
--------------------------------------------------------------------------------
1 |
2 |
3 | ##RabbitMQ monitoring
4 |
5 | We have introduced the usual monitoring data source in section Data Collection. As a monitoring frame, open-falcon can collect monitoring index data in any system and it just need to organize the monitoring data to the normative format of open-falcon
6 |
7 | The data of RMQ can be collected by script rabbitmq-monitor.
8 |
9 | ##Operating principle
10 |
11 | rabbitmq-monitor is a cron, and the script ```rabbitmq-monitor.py``` is run every minute, wherein RMQ username and password and so on are deployed. The script connects to the RMQ instance and collect some monitoring index such as messages_ready, messages_total, deliver_rate, publish_rate and so on, and then assemble to the normative format of open-falcon to post to the host falcon-agent.
12 |
13 | Falcon-agent provides a http interface, and as for the using method, please refer to the instances in Data Collection.
14 |
15 | For example, we deployed 5 RMQ instance, and a cron can be run in every RMQ machine, i.e. it is one-to-one corresponded to the Memcached instance.
16 |
--------------------------------------------------------------------------------
/en_0_2/usage/redis.md:
--------------------------------------------------------------------------------
1 |
2 |
3 | # Redis Monitor
4 |
5 | In [Data Collection](../philosophy/data-collect.md), we introduced the common data sources. As a monitor framework, Open-Falcon can collect the monitor index data of any system as long as they are converted to the standard format of Open-Falcon.
6 |
7 | The data collection of Redis can be done through the script [redis-monitor](https://github.com/iambocai/falcon-monit-scripts/tree/master/redis) or [redismon](https://github.com/ZhuoRoger/redismon).
8 |
9 | ## Working Principle
10 |
11 | Redis-monitor is a cron that runs the script ```redis-monitor.py``` every minute. Its configuration has the address of redis service. Redis-monitor will be connected to redis instance and collect the monitor data, like connected_clients, used_memory and etc. Next it encapsulates them in the format that is suitable for Open-Falcon and post them to the local falcon-agent. Falcon-Agent provides an http port. You can refer to [Data Collection](../philosophy/data-collect.md) for its use.
12 |
13 | For example, if we deploy a Redis instance in each of the 1000 machines, then we can deploy a cron in each of the 1000 machine. Therefore, Redis instance and cron matches one-to-one.
14 |
--------------------------------------------------------------------------------
/en_0_2/usage/solr.md:
--------------------------------------------------------------------------------
1 |
2 |
3 | # Solr Monitor
4 |
5 | In [Data Collection](../philosophy/data-collect.md), we introduced the common data sources. As a monitor framework, Open-Falcon can collect the monitor index data of any system as long as they are converted to the standard format of Open-Falcon.
6 |
7 | The data collection of solr can be done through the script [solr_monitor](https://github.com/shanshouchen/falcon-scripts/tree/master/solr-monitor).
8 |
9 | ## Working Principle
10 |
11 | Solr-monitor is a cron that runs the script ```solr_monitor.py``` every minute. It mainly collects the information of solr instance memory, cache hit and etc. Next it encapsulates them in the format that is suitable for Open-Falcon and post them to the local falcon-agent.
12 |
13 | The script can be deployed in each Solr instance with a cron that collects the data reguarly. Therefore, Solr instance and cron matches one-to-one.
14 |
15 | If a server has multiple solr instances, user can change the ```servers``` property in ```solr_monitor.py``` to add the address of Solr instance to realize the local one-to-many data collection.
16 |
--------------------------------------------------------------------------------
/en_0_2/usage/urlooker.md:
--------------------------------------------------------------------------------
1 |
2 |
3 | ## [urlooker](https://github.com/710leo/urlooker)
4 | -Urlooker, which is written in Go language, monitors the availability of Web service and the visit quality and it is easy to install and redevelop.
5 |
6 | ## Feature
7 | - status code
8 | - respose time
9 | - page keyword
10 | - customize header
11 | - customize post body
12 | - support get post put method
13 | - send to open-falcon、statsd、prometheus
14 |
15 | ## Architecture
16 | 
17 |
18 | ## ScreenShot
19 |
20 | 
21 | 
22 | 
23 |
24 | ## FAQ
25 | - [wiki](https://github.com/710leo/urlooker/wiki)
26 | - [FAQ](https://github.com/710leo/urlooker/wiki/FAQ)
27 | - default user/password:admin/password
28 |
29 | ## Install
30 | ##### install by docker
31 |
32 | ```bash
33 | git clone https://github.com/710leo/urlooker.git
34 | cd urlooker
35 | docker build .
36 | docker volume create urlooker-vol
37 | docker run -p 1984:1984 -d --name urlooker --mount source=urlooker-vol,target=/var/lib/mysql --restart=always [CONTAINER ID]
38 | ```
39 |
40 | ##### install by code
41 | ```bash
42 | # install dependence
43 | yum install -y mysql-server
44 | wget https://raw.githubusercontent.com/710leo/urlooker/master/sql/schema.sql
45 | mysql -h 127.0.0.1 -u root -p < schema.sql
46 |
47 | curl https://raw.githubusercontent.com/710leo/urlooker/master/install.sh|bash
48 | cd $GOPATH/src/github.com/710leo/urlooker
49 |
50 | # change [mysql root password]to your mysql root password
51 | sed -i 's/urlooker.pass/[mysql root password]/g' configs/web.yml
52 |
53 | ./control start all
54 | ```
55 |
56 | open http://127.0.0.1:1984 in browser
57 |
58 | ## Q&A
59 | Gitter: [urlooker](https://gitter.im/urllooker/community)
60 |
--------------------------------------------------------------------------------
/en_0_2/usage/win.md:
--------------------------------------------------------------------------------
1 |
2 |
3 | # Windows System Monitor
4 |
5 | In [Data Collection](../philosophy/data-collect.md), we introduced the common data sources. As a monitor framework, Open-Falcon can collect the monitor index data of any system as long as they are converted to the standard format of Open-Falcon.
6 |
7 | The running data collection of Windows system, like memory usage, Cpu usage, disk usage, data traffic, and etc., can be done every minute through a Python script in scheduled tasks of Windows.s
8 |
9 | The following monitor programs can collect the monitor metrics of machiens with Windows system:
10 |
11 | - [windows_collect](https://github.com/freedomkk-qfeng/falcon-scripts/tree/master/windows_collect):python script
12 | - [windows-agent](https://github.com/LeonZYang/agent): Agent realized in Go language
13 | - [Windows-Agent](https://github.com/AutohomeRadar/Windows-Agent):Agent executes as a Windows service open-sourced by AutoHome realized in Python
14 | - [windows-agent](https://github.com/freedomkk-qfeng/windows-agent):another Windows-Agent realized in Go language supporting port monitor, process monitor and service running in the background
15 |
16 |
--------------------------------------------------------------------------------
/plugins.txt:
--------------------------------------------------------------------------------
1 | versions-select
2 | splitter
3 | tbfed-pagefooter
4 | expandable-chapters-small
5 | sectionx
6 | github-buttons
7 | ace
8 | simple-page-toc
9 | anchors
10 | todo
11 | alerts
12 | emphasize
13 | anchor-navigation-ex
14 | ad
15 |
--------------------------------------------------------------------------------
/zh/GLOSSARY.md:
--------------------------------------------------------------------------------
https://raw.githubusercontent.com/open-falcon/book/f5ac09ca0c92d3c3d77aee4767aaab80edad1bbf/zh/GLOSSARY.md
--------------------------------------------------------------------------------
/zh/README.md:
--------------------------------------------------------------------------------
1 | # 欢迎加入Open-Falcon社区
2 |
3 | 在大家的热心支持和帮助下,[Open-Falcon](https://github.com/open-falcon/of-release)在一天天成长。目前:
4 |
5 | 1. 半年多时间,在github上取得了1300+ star
6 | 1. 收到了几十个pull-request,上百个issue,用户讨论组成员4000+。
7 | 1. 社区成员贡献了包括MySQL、redis、rabbitmq、windows-agent、switch-agent、nginx-stats 等多种插件支持,以及文档支持
8 | 1. 上百家互联网公司都在不同程度的使用Open-Falcon,包括不限于:美团、金山云、快网、宜信、七牛、又拍云、赶集、滴滴、金山办公、爱奇艺、一点资讯、快牙、开心网、借贷宝、百度、迅雷等等
9 |
10 | NOTICE:
11 |
12 | 1. QQ群已全部满员,请添加我的微信 `laiweivic` ,注明个人介绍和来源自open-falcon,我会拉你进入交流群组;
13 | 2. 我们更推荐您升级到[夜莺监控](https://github.com/ccfos/nightingale): 关于open-falcon和夜莺的对比介绍,请参考阅读[云原生监控的十个特点和趋势](https://mp.weixin.qq.com/s?__biz=MzkzNjI5OTM5Nw==&mid=2247483738&idx=1&sn=e8bdbb974a2cd003c1abcc2b5405dd18&chksm=c2a19fb0f5d616a63185cd79277a79a6b80118ef2185890d0683d2bb20451bd9303c78d083c5#rd);
14 |
15 |
16 | 请大家优先在 github 上提交 [issue](https://github.com/open-falcon/falcon-plus/issues), 方便问题沉淀,github issue 会最高优先级解决。
17 | - QQ五群:42607978 (已满员)
18 | - QQ四群:697503992 (已满员)
19 | - QQ一群:373249123 (已满员)
20 | - QQ二群:516088946 (已满员)
21 | - QQ三群:469342415 (已满员)
22 |
23 |
24 | ----
25 |
26 |
27 |
28 | ----
29 | 该文档的[英文版本](http://book.open-falcon.com/en/index.html)由[宋立岭](https://github.com/songliling)翻译和维护,非常感谢!
30 |
--------------------------------------------------------------------------------
/zh/api/README.md:
--------------------------------------------------------------------------------
1 | # open-falcon api
2 |
3 | 请移步[docs.openfalcon.apiary.io](http://docs.openfalcon.apiary.io)
4 |
--------------------------------------------------------------------------------
/zh/authors.md:
--------------------------------------------------------------------------------
1 | - [laiwei](https://github.com/laiwei) 来炜没睡醒@微博 / hellolaiwei@微信
2 | - [秦晓辉](http://ulricqin.com) UlricQin@微博 微信公众号:sa-dev,语音答疑
3 | - [yubo](https://github.com/yubo) x80386@微信
4 | - [niean](https://github.com/niean) niean_sail@微信
5 | - [小米运维部](http://noops.me)
6 |
--------------------------------------------------------------------------------
/zh/dev/README.md:
--------------------------------------------------------------------------------
1 | # go开发环境搭建
2 | ```bash
3 | cd ~
4 | wget http://dinp.qiniudn.com/go1.4.1.linux-amd64.tar.gz
5 | tar zxf go1.4.1.linux-amd64.tar.gz
6 | mkdir -p workspace/src
7 |
8 | echo "" >> .bashrc
9 | echo 'export GOROOT=$HOME/go' >> .bashrc
10 | echo 'export GOPATH=$HOME/workspace' >> .bashrc
11 | echo 'export PATH=$GOROOT/bin:$GOPATH/bin:$PATH' >> .bashrc
12 | echo "" >> .bashrc
13 |
14 | source .bashrc
15 | ```
16 |
17 | # clone代码
18 |
19 | ```bash
20 | cd $GOPATH/src
21 | mkdir github.com
22 | cd github.com
23 | git clone --recursive https://github.com/XiaoMi/open-falcon.git
24 | ```
25 |
26 | # 编译一个组件(以agent为例)
27 | ```bash
28 | cd $GOPATH/src/github.com/open-falcon/agent
29 | go get ./...
30 | ./control build
31 | ```
32 |
33 | # 自定义修改归档策略
34 | 修改open-falcon/graph/rrdtool/rrdtool.go
35 |
36 | 
37 | 
38 |
39 | 重新编译graph组件,并替换原有的二进制
40 |
41 | 清理掉原来的所有rrd文件(默认在/home/work/data/6070/下面)
42 |
43 | # 插件机制
44 | 1. 找一个git存放公司的所有插件
45 | 2. 通过调用agent的/plugin/update接口拉取插件repo到本地
46 | 3. 在portal中配置哪些机器可以执行哪些插件
47 | 4. 插件命名方式:$step_xx.yy,需要有可执行权限,分门别类存放到repo的各个目录
48 | 5. 把采集到的数据打印到stdout
49 | 6. 如果觉得git方式不方便,可以改造agent,定期从某个http地址下载打包好的plugin.tar.gz
50 |
51 |
--------------------------------------------------------------------------------
/zh/dev/change_graph_rra.md:
--------------------------------------------------------------------------------
1 | ## 修改绘图曲线精度
2 |
3 | 默认的,Open-Falcon只保存最近12小时的原始监控数据,12小时之后的数据被降低精度、采样存储。
4 |
5 | 如果默认的精度不能满足你的需求,可以按照如下步骤,修改绘图曲线的存储精度。
6 |
7 | #### 第一步,修改graph组件的RRA,并重新编译graph组件
8 | graph组件的RRA,定义在文件 graph/rrdtool/[rrdtool.go](https://github.com/open-falcon/graph/blob/master/rrdtool/rrdtool.go#L57)中,默认如下:
9 |
10 | ```golang
11 | // RRA.Point.Size
12 | const (
13 | RRA1PointCnt = 720 // 1m一个点存12h
14 | RRA5PointCnt = 576 // 5m一个点存2d
15 | // ...
16 | )
17 |
18 | func create(filename string, item *cmodel.GraphItem) error {
19 | now := time.Now()
20 | start := now.Add(time.Duration(-24) * time.Hour)
21 | step := uint(item.Step)
22 |
23 | c := rrdlite.NewCreator(filename, start, step)
24 | c.DS("metric", item.DsType, item.Heartbeat, item.Min, item.Max)
25 |
26 | // 设置各种归档策略
27 | // 1分钟一个点存 12小时
28 | c.RRA("AVERAGE", 0.5, 1, RRA1PointCnt)
29 |
30 | // 5m一个点存2d
31 | c.RRA("AVERAGE", 0.5, 5, RRA5PointCnt)
32 | c.RRA("MAX", 0.5, 5, RRA5PointCnt)
33 | c.RRA("MIN", 0.5, 5, RRA5PointCnt)
34 |
35 | // ...
36 |
37 | return c.Create(true)
38 | }
39 |
40 | ```
41 |
42 | 比如,你只想保存90天的原始数据,可以将代码修改为:
43 |
44 | ```golang
45 | // RRA.Point.Size
46 | const (
47 | RRA1PointCnt = 129600 // 1m一个点存90d,取值 90*24*3600/60
48 | )
49 |
50 | func create(filename string, item *cmodel.GraphItem) error {
51 | now := time.Now()
52 | start := now.Add(time.Duration(-24) * time.Hour)
53 | step := uint(item.Step)
54 |
55 | c := rrdlite.NewCreator(filename, start, step)
56 | c.DS("metric", item.DsType, item.Heartbeat, item.Min, item.Max)
57 |
58 | // 设置各种归档策略
59 | // 1分钟一个点存 90d
60 | c.RRA("AVERAGE", 0.5, 1, RRA1PointCnt)
61 |
62 | return c.Create(true)
63 | }
64 | ```
65 |
66 | #### 第二步,清除graph的历史数据
67 | 清除已上报的所有指标的历史数据,即删除所有的rrdfile。不删除历史数据,已上报指标的精度更改将不能生效。
68 |
69 | #### 第三步,重新部署graph服务
70 | 编译修改后的graph源码,关停原有的graph老服务、发布修改后的graph。
71 |
72 | 只需要修改graph组件、不需要修改Open-Falcon的其他组件,新的精度就能生效。你可以通过Dashboard、Screen来查看新的精度的绘图曲线。
73 |
74 |
75 |
76 | ### 注意事项:
77 |
78 | 修改监控绘图曲线精度时,需要:
79 |
80 | + 修改graph源代码,更新RRA
81 | + 清除graph的历史数据。不删除历史数据,已上报指标的精度更改将不能生效
82 | + 除了graph之外,Open-Falcon的其他任何组件 不需要被修改
83 | + 修改RRA后,可能会出现"绘图曲线点数过多、浏览器被卡死"的问题。请合理规划RRA存储的点数,或者调整绘图曲线查询时的时间段选择。
84 |
85 |
86 |
--------------------------------------------------------------------------------
/zh/dev/support_grafana.md:
--------------------------------------------------------------------------------
1 | ## 支持 Grafana 视图展现
2 |
3 | 相较于 Open-Falcon 内建的 Dashboard,Grafana 可以很有弹性的自定义图表,并且可以针对 Dashboard 做权限控管、上标签以及查询,图表的展示选项也更多样化。本篇教学帮助您
4 | 做好 Open-Falcon 的面子工程!
5 |
6 | ### 开始之前
7 |
8 | Open-Falcon 跟 Grafana 目前并不互相支持,所以您需要下面的PR
9 |
10 | - Grafana [PR#3787](https://github.com/grafana/grafana/pull/3787) (支持到 v2.6 版)
11 | - Query [PR#5](https://github.com/open-falcon/query/pull/5)(已合并到最新的query代码中了,请检查您是否使用的是最新版)
12 |
13 | > 详细可以参考[优酷同学写的教程](http://blueswind8306.iteye.com/blog/2287561)
14 |
15 | ### 设定 Datasource
16 |
17 | 当您取得包含上述 PR 的 Grafana 源代码之后,按照官方教学安装后依下述步骤编译:
18 |
19 | 1. 编译前端代码 `go run build.go build`
20 | 2. 编译后端代码 `grunt`
21 | 3. 执行 `grafana-server`
22 |
23 | 启动 Grafana 后,依照下图添加新的 Open-Falcon Datasource,需要注意的是我们这里使用的 URL 是在 falcon-query 中新增的 API。
24 |
25 | 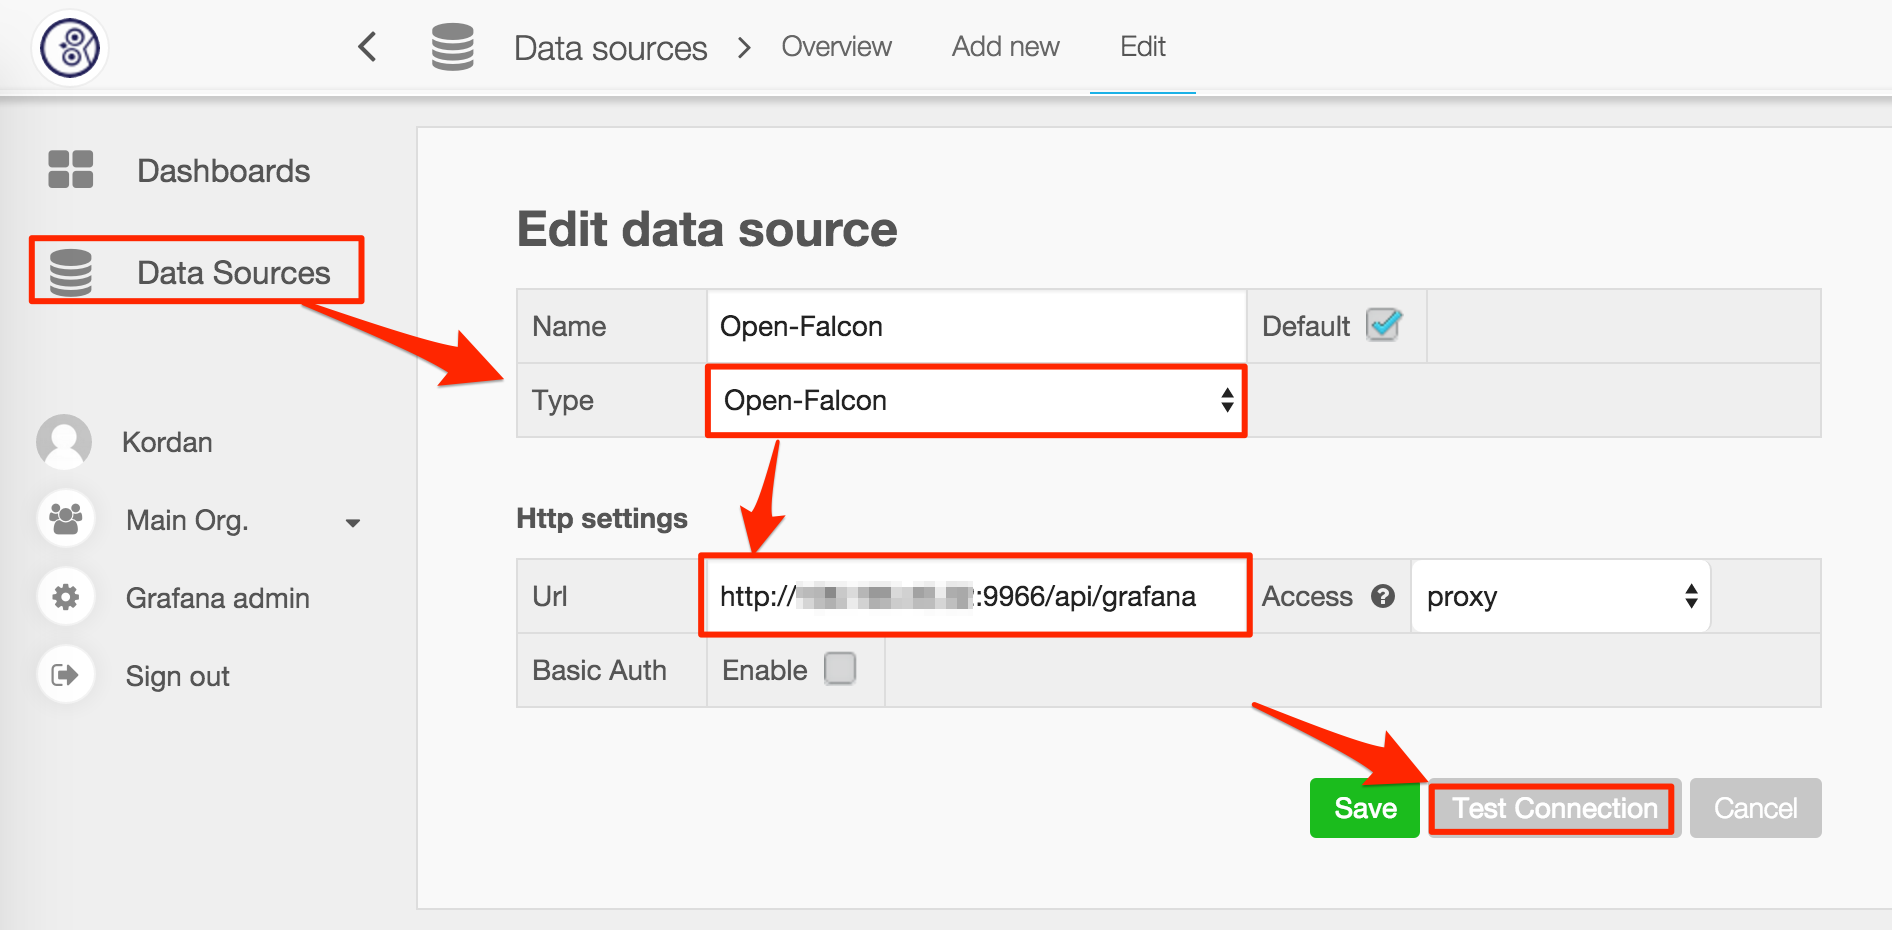
26 |
27 | ### 新增 Templating 变量
28 |
29 | 当 Open-Falcon 中已经有上百台机器时,一个个新增监控项到图表中是不切实际的,所以 Grafana 提供了一个 Templating 的变量让我们可以动态地选择想要关注的机器。
30 |
31 | 1. 上方设定点击 Templating
32 | 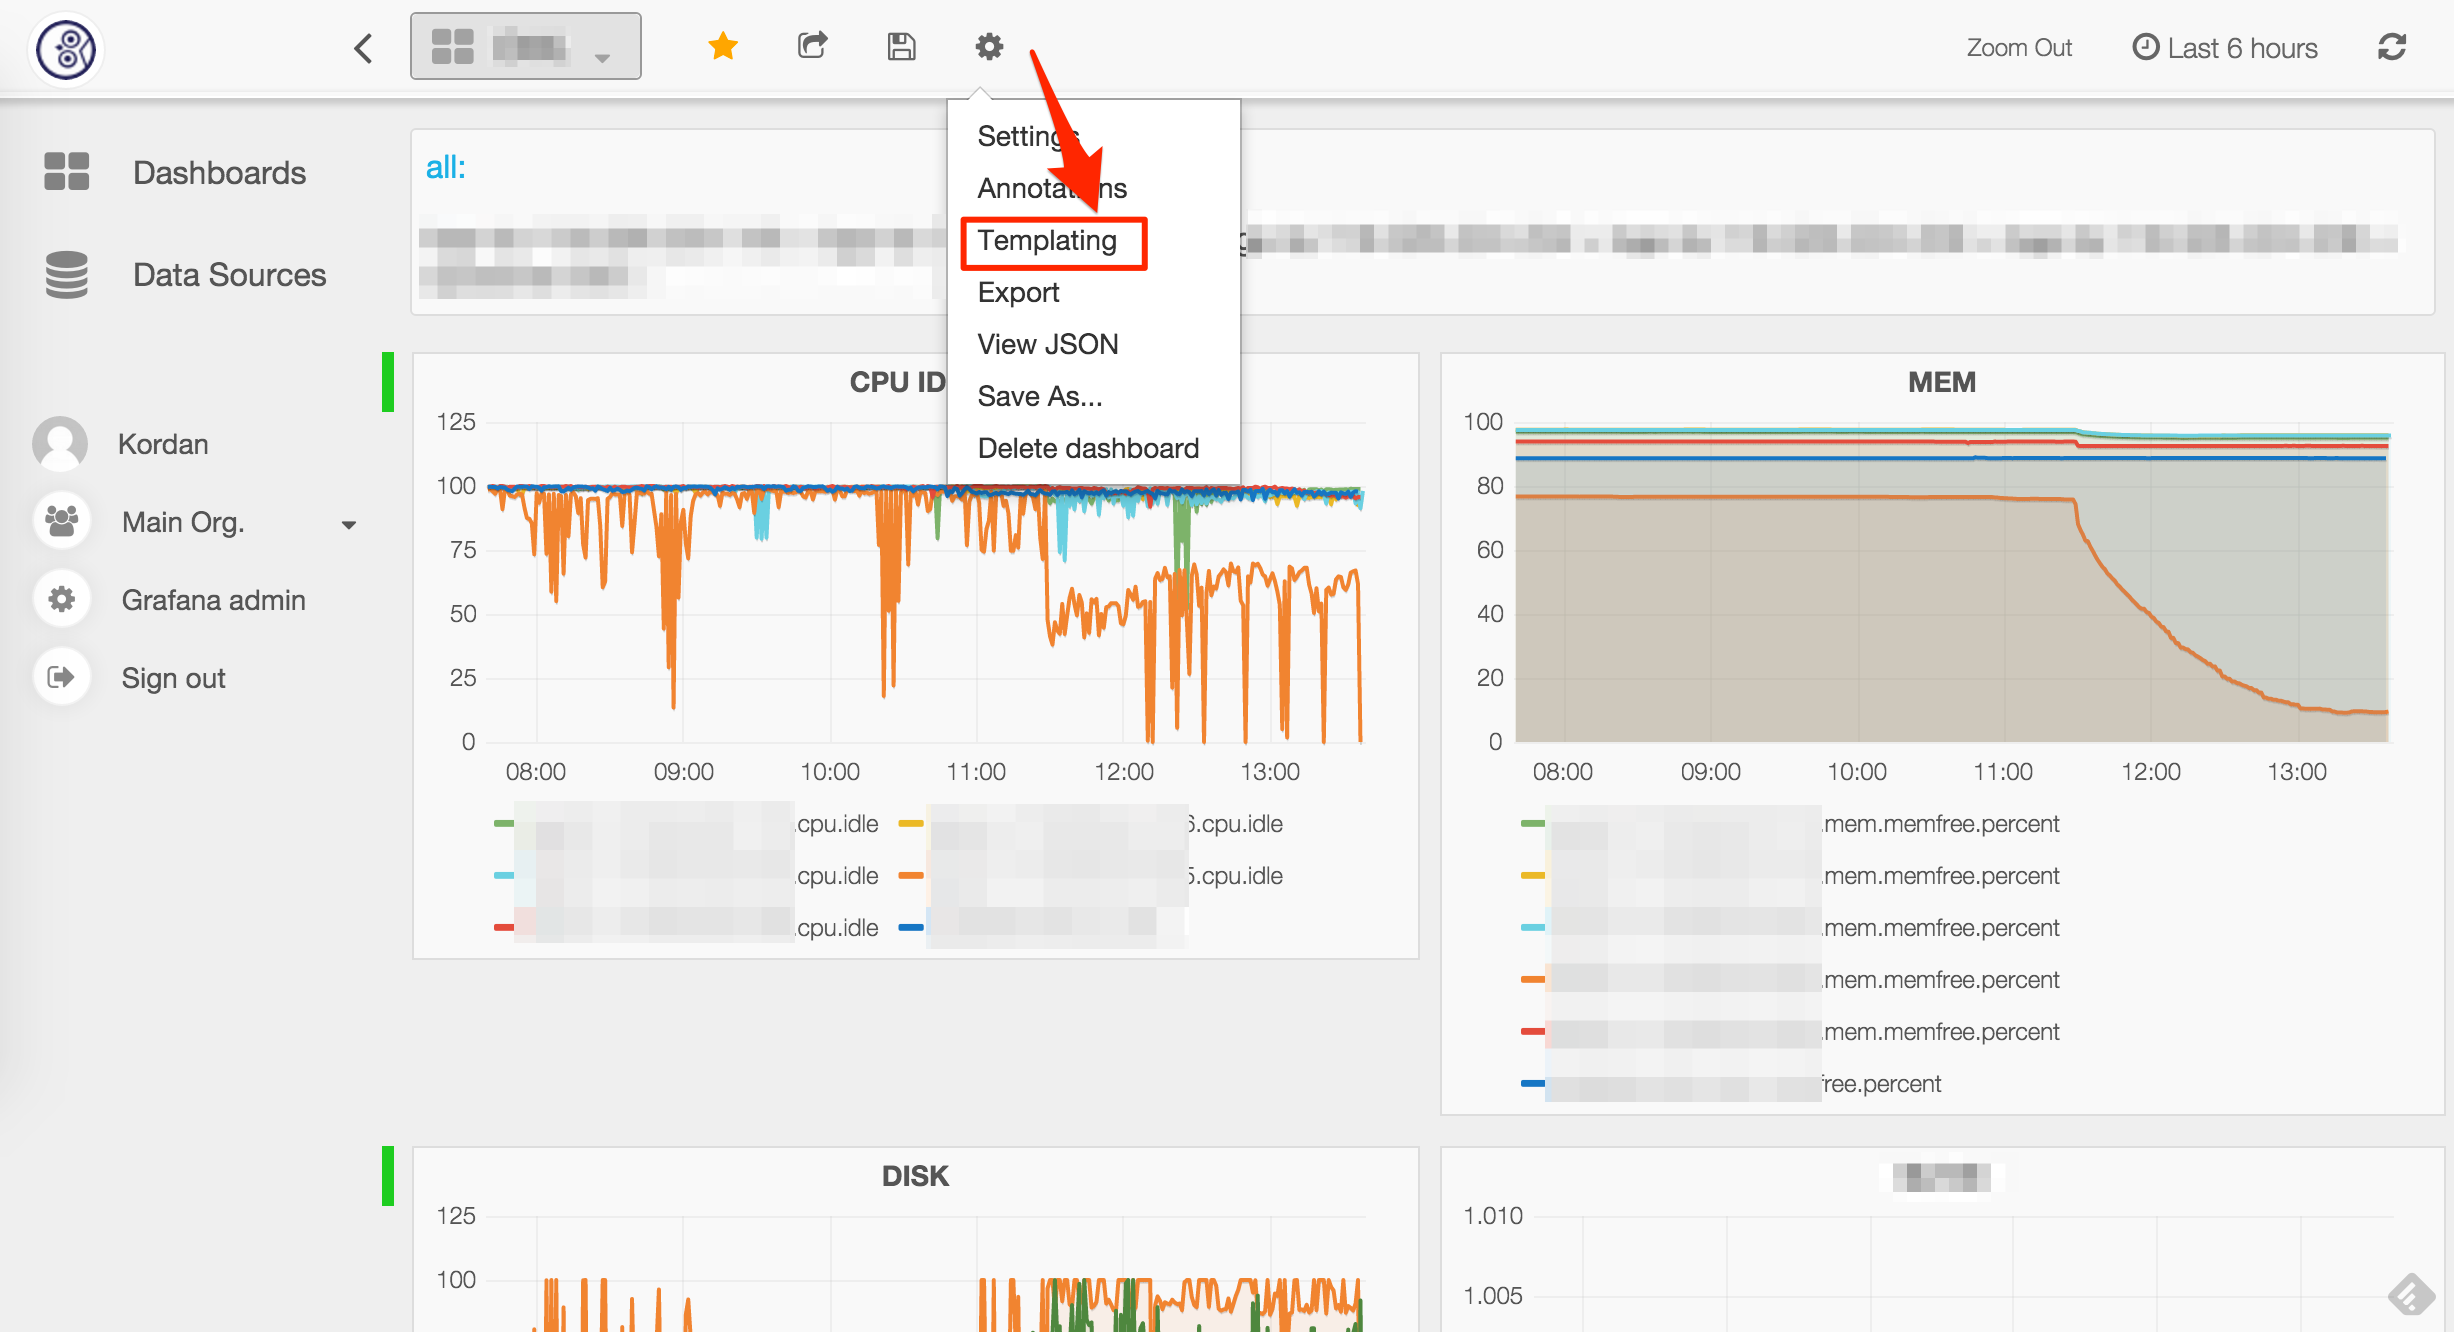
33 |
34 | 2. 新增 Templating 变量
35 | 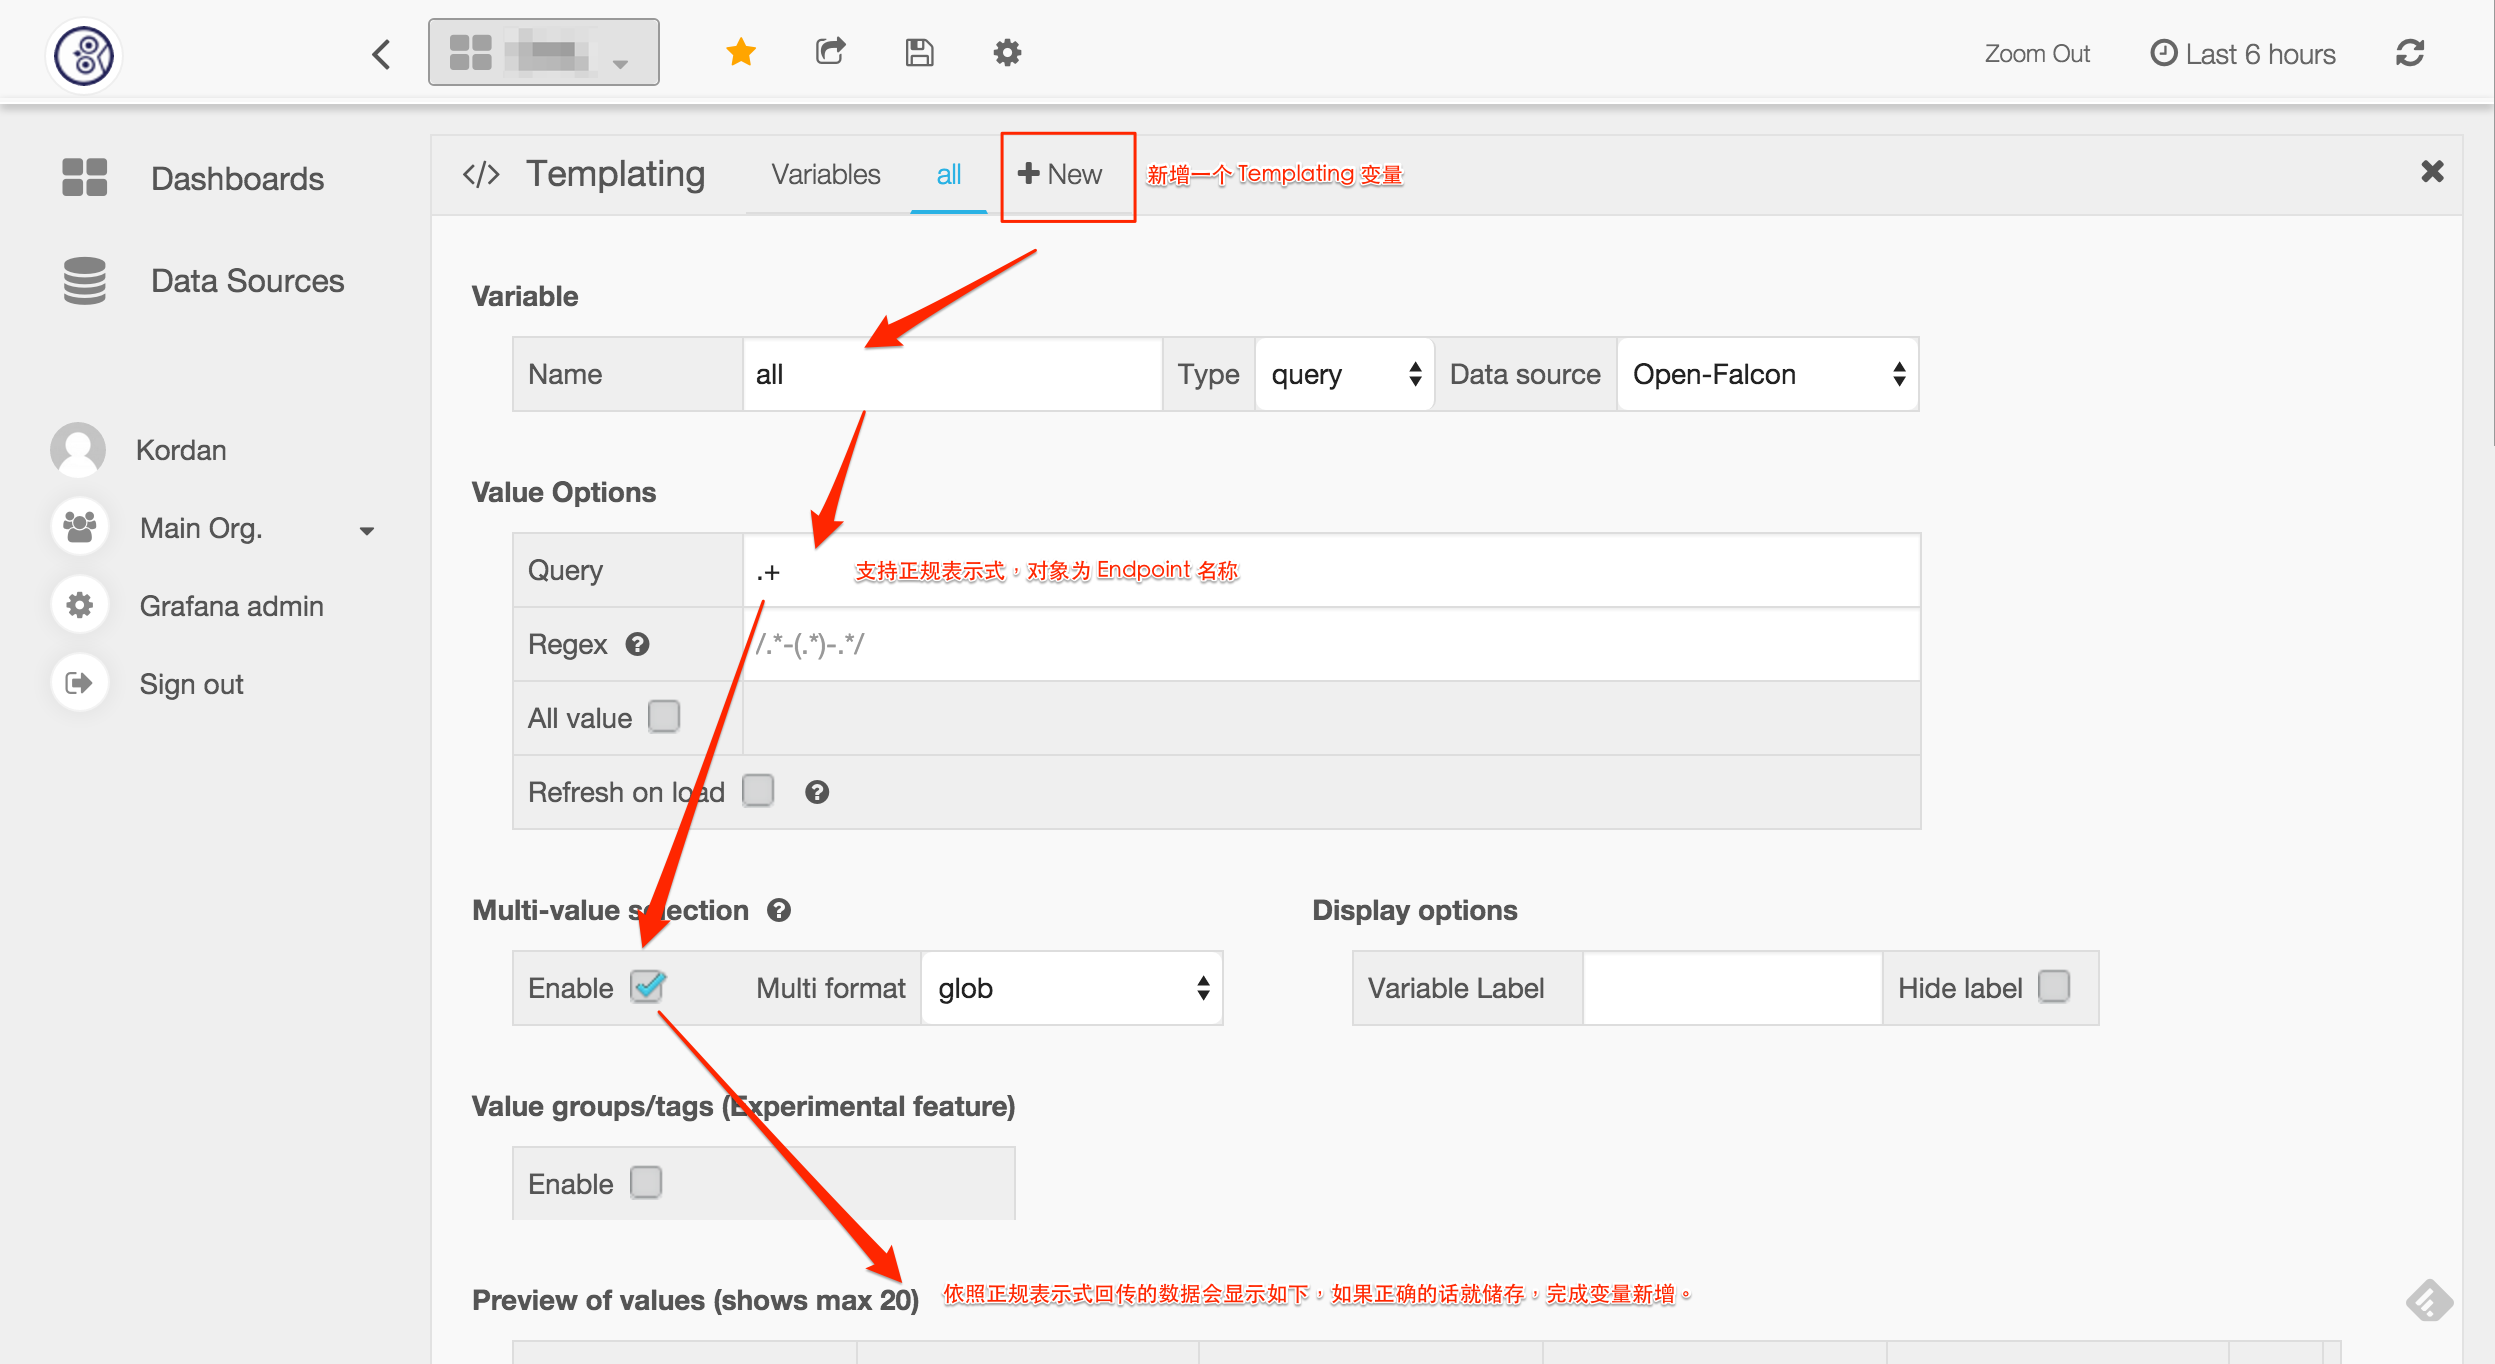
36 |
37 | ### 新增圖表
38 |
39 | 有了 Templating 变量之后,我们就可以以它来代替 Endpoint 名称,选择我们关注的监控项,完成图表的新增。
40 |
41 | 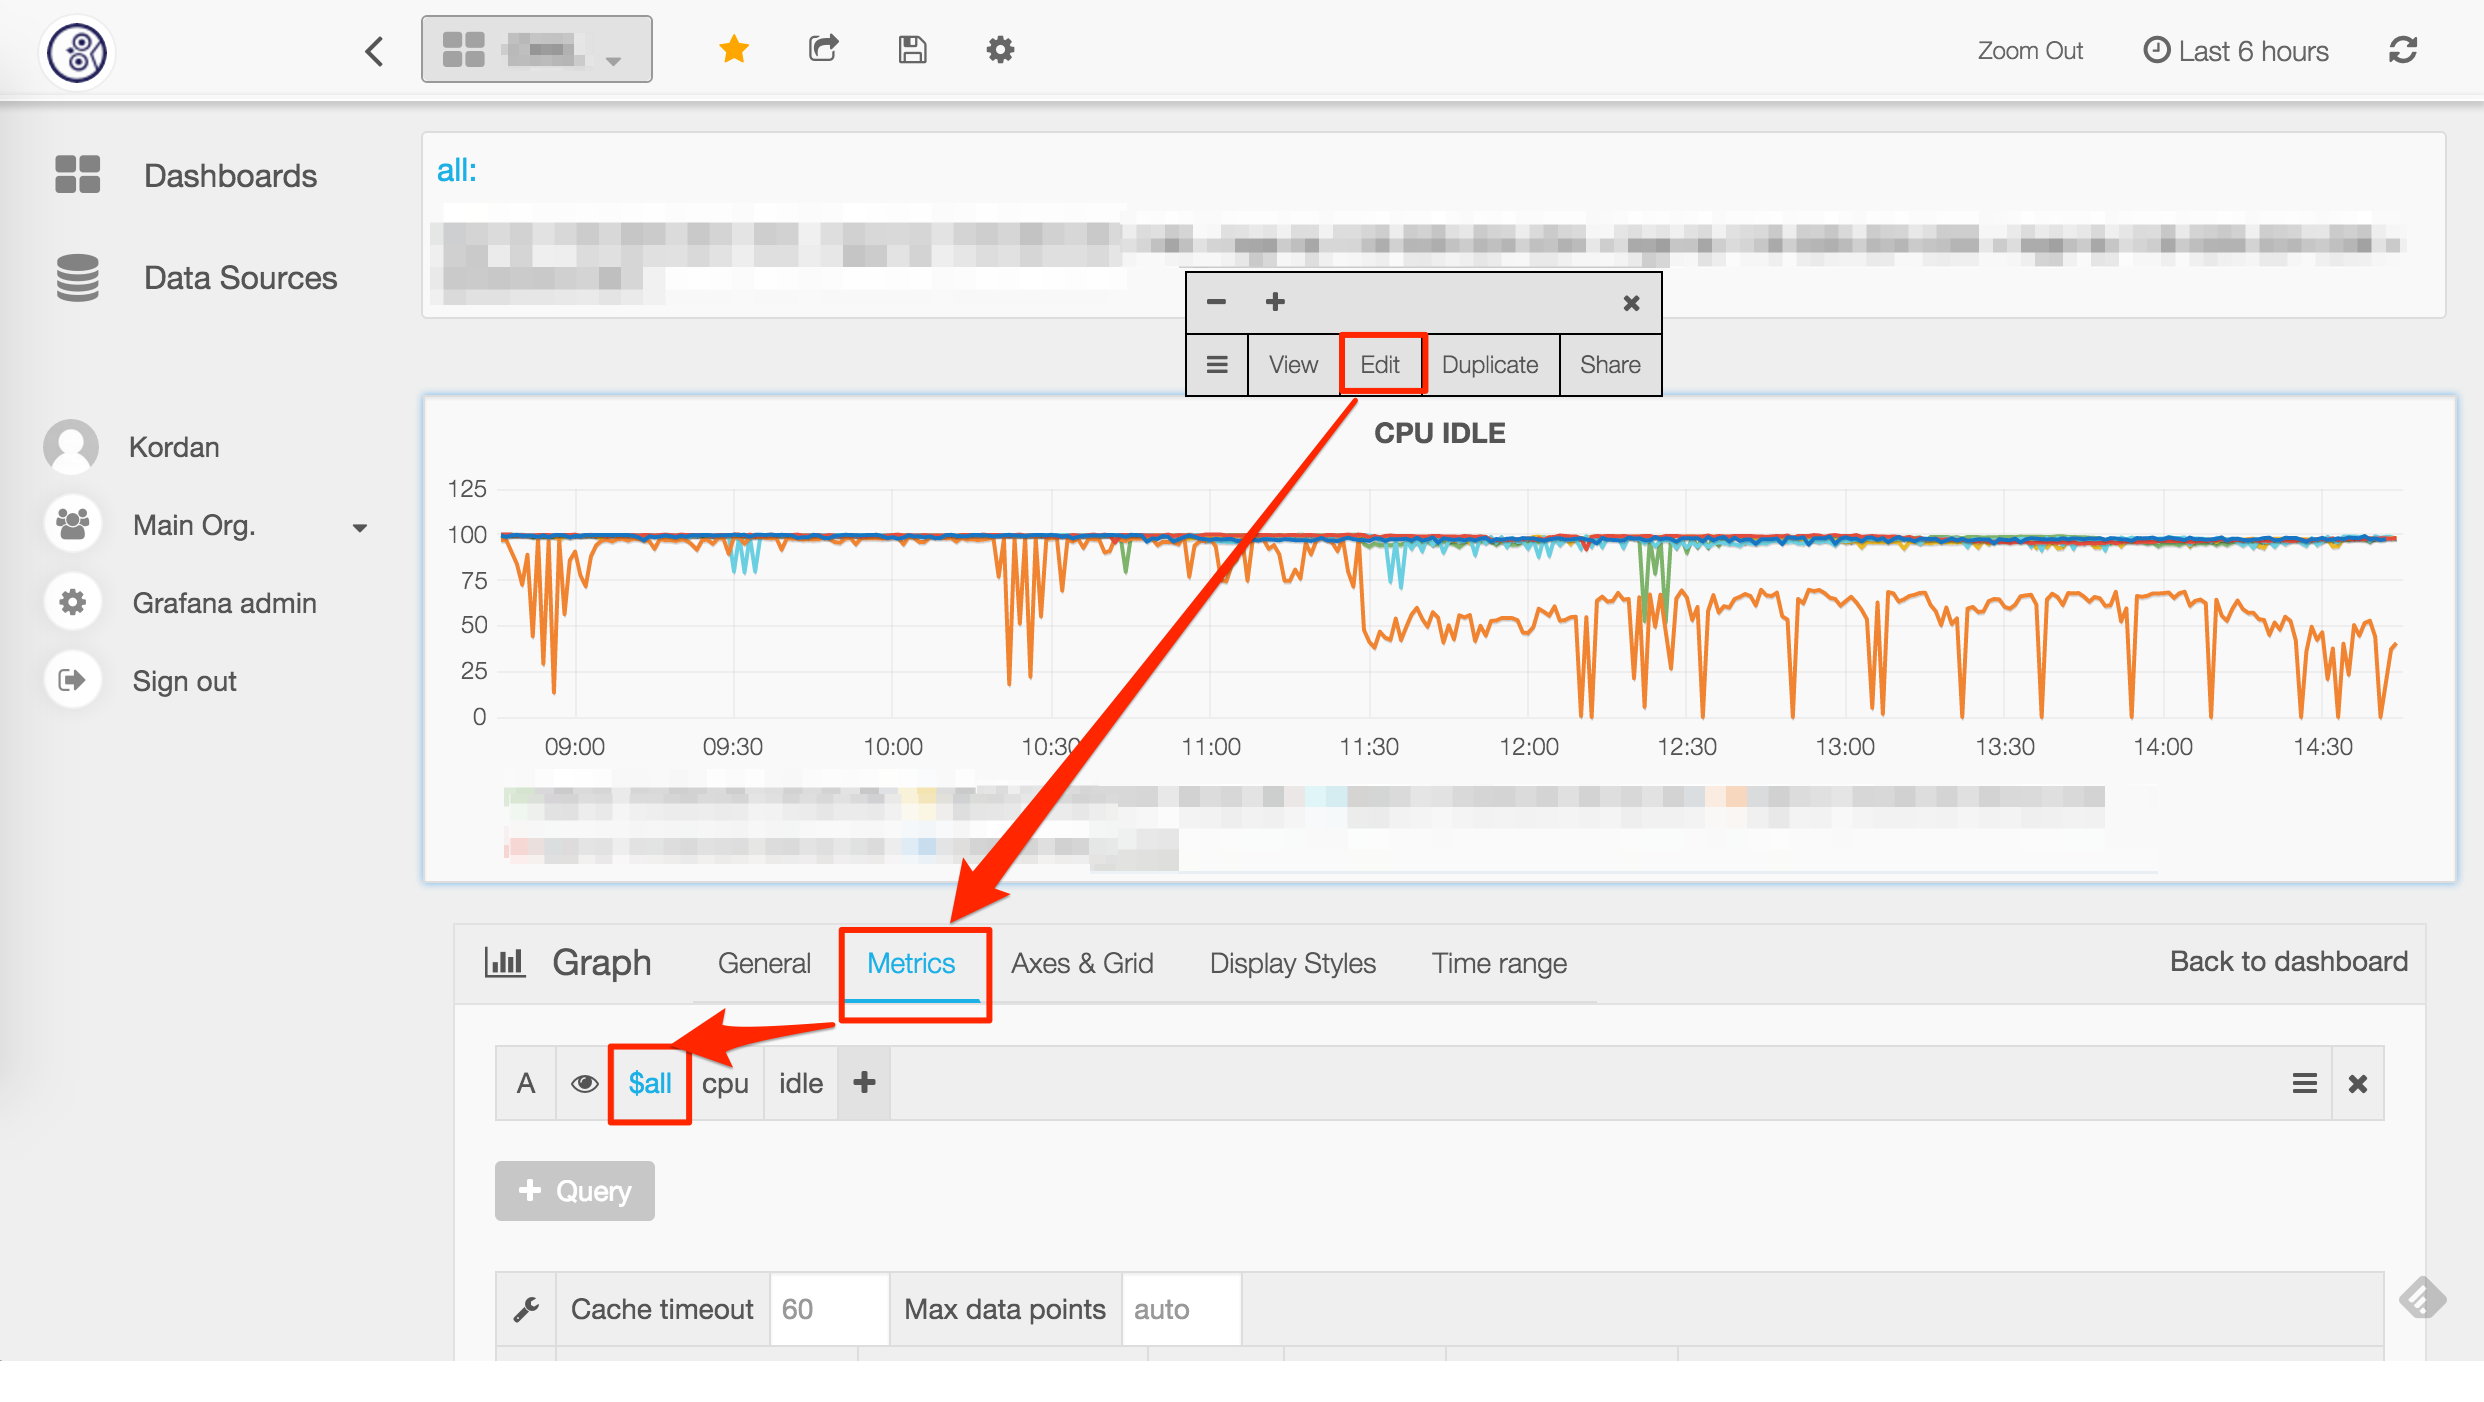
42 |
--------------------------------------------------------------------------------
/zh/donate.md:
--------------------------------------------------------------------------------
https://raw.githubusercontent.com/open-falcon/book/f5ac09ca0c92d3c3d77aee4767aaab80edad1bbf/zh/donate.md
--------------------------------------------------------------------------------
/zh/faq/README.md:
--------------------------------------------------------------------------------
1 | # 大家最常问的问题
--------------------------------------------------------------------------------
/zh/faq/alarm.md:
--------------------------------------------------------------------------------
1 | # 报警相关常见问题
2 |
3 | #### 配置了策略,一直没有报警,如何排查?
4 |
5 | 1. 排查sender、alarm、judge、hbs、agent、transfer的log
6 | 2. 浏览器访问alarm的http页面,看是否有未恢复的告警,如果有就是生成报警了,后面没发出去,很可能是邮件、短信发送接口出问题了,检查sender中配置的api
7 | 3. 打开agent的debug,看是否在正常push数据
8 | 4. 看agent配置,是否正确配置了heartbeat(hbs)和transfer的地址,并enabled
9 | 5. 看transfer配置,是否正确配置了judge地址
10 | 6. jduge提供了一个http接口用于debug,可以检查某个数据是否正确push上来了,比如qd-open-falcon-judge01.hd这个机器的cpu.idle数据,可以这么查看
11 | ```bash
12 | curl http://127.0.0.1:6081/history/qd-open-falcon-judge01.hd/cpu.idle
13 | ```
14 | 7. 检查服务器的时间是否已经同步,可以用 [ntp](https://access.redhat.com/documentation/en-US/Red_Hat_Enterprise_Linux/7/html/System_Administrators_Guide/sect-Understanding_chrony_and-its_configuration.html) 或 chrony 来实现
15 |
16 | 上面的127.0.0.1:6081指的是judge的http端口
17 | 7. 检查judge配置的hbs地址是否正确
18 | 8. 检查hbs配置的数据库地址是否正确
19 | 9. 检查portal中配置的策略模板是否配置了报警接收人
20 | 10. 检查portal中配置的策略模板是否绑定到某个HostGroup了,并且目标机器恰好在这个HostGroup中
21 | 11. 去UIC检查报警接收组中是否把自己加进去了
22 | 12. 去UIC检查自己的联系信息是否正确
23 |
24 | #### 在Portal页面创建了一个HostGroup,往HostGroup中增加机器的时候报错
25 |
26 | 1. 检查agent是否正确配置了heartbeat地址,并enabled了
27 | 2. 检查hbs log
28 | 3. 检查hbs配置的数据库地址是否正确
29 | 4. 检查hbs的配置hosts是否配置为sync了,只有留空的时候hbs才会去写host表,host表中有数据才能在页面上添加机器
30 |
--------------------------------------------------------------------------------
/zh/faq/collect.md:
--------------------------------------------------------------------------------
1 | # 数据收集相关问题
2 | Open-Falcon数据收集,分为[绘图数据]收集和[报警数据]收集。下面介绍,如何验证两个链路的数据收集是否正常。
3 |
4 |
5 | ### 如何验证[绘图数据]收集是否正常
6 | 数据链路是:`agent->transfer->graph->query->dashboard`。graph有一个http接口可以验证`agent->transfer->graph`这条链路,比如graph的http端口是6071,可以这么访问验证:
7 |
8 | ```bash
9 | # $endpoint和$counter是变量
10 | curl http://127.0.0.1:6071/history/$endpoint/$counter
11 |
12 | # 如果上报的数据不带tags,访问方式是这样的:
13 | curl http://127.0.0.1:6071/history/host01/agent.alive
14 |
15 | # 如果上报的数据带有tags,访问方式如下,其中tags为module=graph,project=falcon
16 | curl http://127.0.0.1:6071/history/host01/qps/module=graph,project=falcon
17 | ```
18 | 如果调用上述接口返回空值,则说明agent没有上报数据、或者transfer服务异常。
19 |
20 |
21 | ### 如何验证[报警数据]收集是否正常
22 |
23 | 数据链路是:`agent->transfer->judge`,judge有一个http接口可以验证`agent->transfer->judge`这条链路,比如judge的http端口是6081,可以这么访问验证:
24 |
25 | ```bash
26 | curl http://127.0.0.1:6081/history/$endpoint/$counter
27 |
28 | # $endpoint和$counter是变量,举个例子:
29 | curl http://127.0.0.1:6081/history/host01/cpu.idle
30 |
31 | # counter=$metric/sorted($tags)
32 | # 如果上报的数据带有tag,访问方式是这样的,比如:
33 | curl http://127.0.0.1:6081/history/host01/qps/module=judge,project=falcon
34 | ```
35 | 如果调用上述接口返回空值,则说明agent没有上报数据、或者transfer服务异常。
36 |
37 |
--------------------------------------------------------------------------------
/zh/image/OpenFalcon_wechat.jpg:
--------------------------------------------------------------------------------
https://raw.githubusercontent.com/open-falcon/book/f5ac09ca0c92d3c3d77aee4767aaab80edad1bbf/zh/image/OpenFalcon_wechat.jpg
--------------------------------------------------------------------------------
/zh/images/practice/deploy.png:
--------------------------------------------------------------------------------
https://raw.githubusercontent.com/open-falcon/book/f5ac09ca0c92d3c3d77aee4767aaab80edad1bbf/zh/images/practice/deploy.png
--------------------------------------------------------------------------------
/zh/install_from_src/README.md:
--------------------------------------------------------------------------------
1 | # 概述
2 |
3 | Open-Falcon是一个比较大的分布式系统,有十几个组件。按照功能,这十几个组件可以划分为 基础组件、作图链路组件和报警链路组件,其安装部署的架构如下图所示,
4 |
5 | 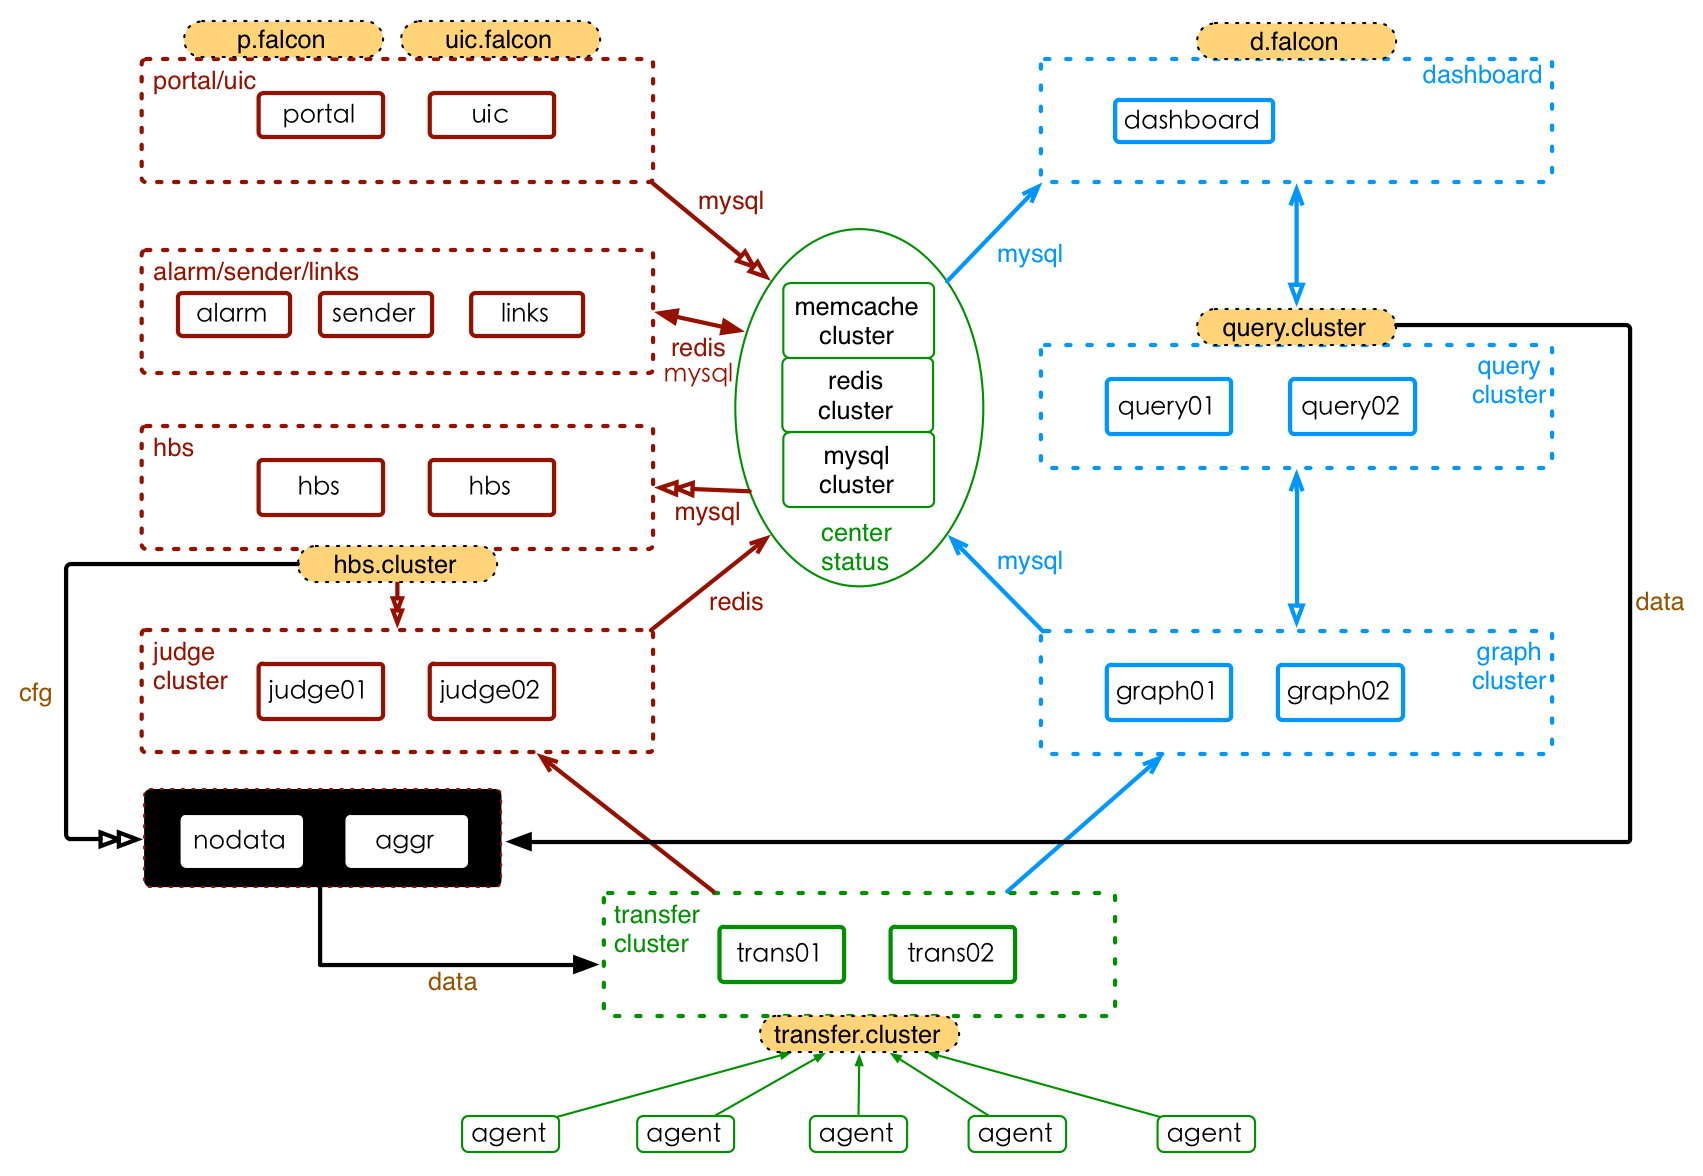
6 |
7 | 其中,基础组件以绿色标注圈住、作图链路组件以蓝色圈住、报警链路组件以红色圈住,橙色填充的组件为域名。OpenTSDB功能尚未完成。
8 |
9 | ## 二进制快速安装
10 |
11 | 请直接参考[quick_install](../quick_install/README.md)
12 |
13 | ## Docker化的Open-Falcon安装
14 |
15 | 参看:https://github.com/frostynova/open-falcon-docker
16 |
17 | ## 从源码安装
18 |
19 | 从源码,编译安装每个模块,就是本章的内容,请按照本章节的顺序,安装每个组件。
20 |
21 | ## 视频教程教你安装
22 |
23 | 《[Open-Falcon部署与架构解析](http://www.jikexueyuan.com/course/1651.html)》
24 |
25 |
--------------------------------------------------------------------------------
/zh/install_from_src/agent-updater.md:
--------------------------------------------------------------------------------
1 | # Agent-updater
2 |
3 | 每台机器都要部署falcon-agent,如果公司机器量比较少,用pssh、ansible、fabric之类的工具手工安装问题也不大。但是公司机器量多了之后,手工安装、升级、回滚falcon-agent将成为噩梦。
4 |
5 | 个人开发了agent-updater这个工具,用于管理falcon-agent,agent-updater也有一个agent:ops-updater,可以看做是一个超级agent,用于管理其他agent的agent,呵呵,ops-updater推荐在装机的时候一起安装上。ops-updater通常是不会升级的。
6 |
7 | 具体参看:https://github.com/open-falcon/ops-updater
8 |
9 | 如果你想学习如何使用Go语言编写一个完整的项目,也可以研究一下agent-updater,我甚至录制了一个视频教程来演示一步一步如何开发出来的。课程链接:
10 |
11 | - http://www.jikexueyuan.com/course/1336.html
12 | - http://www.jikexueyuan.com/course/1357.html
13 | - http://www.jikexueyuan.com/course/1462.html
14 | - http://www.jikexueyuan.com/course/1490.html
15 |
16 |
--------------------------------------------------------------------------------
/zh/install_from_src/dashboard.md:
--------------------------------------------------------------------------------
1 | # Dashboard
2 | dashboard是面向用户的查询界面。在这里,用户可以看到push到graph中的所有数据,并查看其趋势图。
3 |
4 | ## 依赖安装
5 |
6 | Dashboard是个Python的项目。安装&部署Dashboard时,需要安装一些依赖库。依赖库安装,步骤如下,
7 |
8 | ```bash
9 | # 安装virtualenv。需要root权限。
10 | yum install -y python-virtualenv
11 |
12 | # 安装依赖。不需要root权限、使用普通账号执行就可以。需要到dashboard的目录下执行。
13 | cd /path/to/dashboard/
14 | virtualenv ./env
15 | ./env/bin/pip install -r pip_requirements.txt
16 |
17 | ```
18 | 对于ubuntu用户,安装mysql-python时可能会失败。请自行安装依赖libmysqld-dev、libmysqlclient-dev等。
19 |
20 |
21 | ## 服务部署
22 |
23 | 部署dashboard,包括配置修改、启动服务、停止服务等。在此之前,需要进入dashboard的部署目录,然后执行下列步骤
24 |
25 | ```
26 | # 修改配置。各配置的含义,见下文。
27 | vim ./gunicorn.conf
28 | vim ./rrd/config.py
29 |
30 | # 启动服务
31 | ./control start
32 |
33 | # 校验服务
34 | # TODO
35 |
36 | ...
37 | # 停止服务
38 | ./control stop
39 |
40 | ```
41 | 服务启动后,可以通过日志查看服务的运行状态,日志文件地址为./var/app.log。可以通过```http://localhost:8081```访问dashboard主页(这里假设 dashboard的http监听端口为8081)。
42 |
43 |
44 | ## 配置说明
45 | dashboard有两个需要更改的配置文件: ./gunicorn.conf 和 ./rrd/config.py。./gunicorn.conf各字段,含义如下
46 |
47 | ```bash
48 | - workers,dashboard并发进程数
49 | - bind,dashboard的http监听端口
50 | - proc_name,进程名称
51 | - pidfile,pid文件全名称
52 | - limit_request_field_size,TODO
53 | - limit_request_line,TODO
54 | ```
55 |
56 | 配置文件./rrd/config.py,各字段含义为
57 |
58 | ```python
59 | # dashboard的数据库配置
60 | DASHBOARD_DB_HOST = "127.0.0.1"
61 | DASHBOARD_DB_PORT = 3306
62 | DASHBOARD_DB_USER = "root"
63 | DASHBOARD_DB_PASSWD = ""
64 | DASHBOARD_DB_NAME = "dashboard"
65 |
66 | # graph的数据库配置
67 | GRAPH_DB_HOST = "127.0.0.1"
68 | GRAPH_DB_PORT = 3306
69 | GRAPH_DB_USER = "root"
70 | GRAPH_DB_PASSWD = ""
71 | GRAPH_DB_NAME = "graph"
72 |
73 | # dashboard的配置
74 | DEBUG = True
75 | SECRET_KEY = "secret-key"
76 | SESSION_COOKIE_NAME = "open-falcon"
77 | PERMANENT_SESSION_LIFETIME = 3600 * 24 * 30
78 | SITE_COOKIE = "open-falcon-ck"
79 |
80 | # query服务的地址
81 | QUERY_ADDR = "http://127.0.0.1:9966"
82 |
83 | BASE_DIR = "/home/work/open-falcon/dashboard/"
84 | LOG_PATH = os.path.join(BASE_DIR,"log/")
85 |
86 | try:
87 | from rrd.local_config import *
88 | except:
89 | pass
90 | ```
91 |
92 | ## 补充说明
93 |
94 | Dashboard正常启动之后,就可以回去配置Fe这个项目的shortcut了。省得以后还要单独输入ip:port来打开dashboard。修改完了shortcut,要重启fe模块。
95 |
--------------------------------------------------------------------------------
/zh/install_from_src/gateway.md:
--------------------------------------------------------------------------------
1 | # Gateway
2 |
3 | **如果您没有遇到机房分区问题,请直接忽略此组件**。
4 |
5 | 如果您已经遇到机房分区问题、并急需解决机房分区时监控数据回传的问题,请使用该组件。更多的资料在[这里](https://github.com/open-falcon/gateway)。
6 |
--------------------------------------------------------------------------------
/zh/install_from_src/graph.md:
--------------------------------------------------------------------------------
1 | # Graph
2 |
3 | graph是存储绘图数据的组件。graph组件 接收transfer组件推送上来的监控数据,同时处理query组件的查询请求、返回绘图数据。
4 |
5 | ## 源码编译
6 |
7 | ```bash
8 | # update common lib
9 | cd $GOPATH/src/github.com/open-falcon/common
10 | git pull
11 |
12 | # compile
13 | cd $GOPATH/src/github.com/open-falcon/graph
14 | go get ./...
15 | ./control build
16 | ./control pack
17 | ```
18 |
19 | 最后一步会pack出一个tar.gz的安装包,拿着这个包去部署服务即可。
20 |
21 | ## 服务部署
22 | 服务部署,包括配置修改、启动服务、检验服务、停止服务等。这之前,需要将安装包解压到服务的部署目录下。
23 |
24 | ```bash
25 | # 修改配置, 配置项含义见下文
26 | mv cfg.example.json cfg.json
27 | vim cfg.json
28 |
29 | # 启动服务
30 | ./control start
31 |
32 | # 校验服务,这里假定服务开启了6071的http监听端口。检验结果为ok表明服务正常启动。
33 | curl -s "127.0.0.1:6071/health"
34 |
35 | ...
36 | # 停止服务
37 | ./control stop
38 |
39 | ```
40 | 启动服务后,可以通过日志查看服务的运行状态,日志文件地址为./var/app.log;如果需要详细的日志,可以将配置项debug设置为true。可以通过调试脚本```./test/debug```查看服务器的内部状态数据,如 运行 ```bash ./test/debug``` 可以得到服务器内部状态的统计信息。
41 |
42 | ## 配置说明
43 | 配置文件默认为./cfg.json。默认情况下,安装包会有一个cfg.example.json的配置文件示例。各配置项的含义,如下
44 |
45 | ```python
46 | {
47 | "debug": false, //true or false, 是否开启debug日志
48 | "http": {
49 | "enabled": true, //true or false, 表示是否开启该http端口,该端口为控制端口,主要用来对graph发送控制命令、统计命令、debug命令
50 | "listen": "0.0.0.0:6071" //表示监听的http端口
51 | },
52 | "rpc": {
53 | "enabled": true, //true or false, 表示是否开启该rpc端口,该端口为数据接收端口
54 | "listen": "0.0.0.0:6070" //表示监听的rpc端口
55 | },
56 | "rrd": {
57 | "storage": "/home/work/data/6070" //绝对路径,历史数据的文件存储路径(如有必要,请修改为合适的路)
58 | },
59 | "db": {
60 | "dsn": "root:@tcp(127.0.0.1:3306)/graph?loc=Local&parseTime=true", //MySQL的连接信息,默认用户名是root,密码为空,host为127.0.0.1,database为graph(如有必要,请修改)
61 | "maxIdle": 4 //MySQL连接池配置,连接池允许的最大连接数,保持默认即可
62 | },
63 | "callTimeout": 5000, //RPC调用超时时间,单位ms
64 | "migrate": { //扩容graph时历史数据自动迁移
65 | "enabled": false, //true or false, 表示graph是否处于数据迁移状态
66 | "concurrency": 2, //数据迁移时的并发连接数,建议保持默认
67 | "replicas": 500, //这是一致性hash算法需要的节点副本数量,建议不要变更,保持默认即可(必须和transfer的配置中保持一致)
68 | "cluster": { //未扩容前老的graph实例列表
69 | "graph-00" : "127.0.0.1:6070"
70 | }
71 | }
72 | }
73 |
74 | ```
75 |
76 | ## 补充说明
77 | 部署完graph组件后,请修改transfer和query的配置,使这两个组件可以寻址到graph。
78 |
--------------------------------------------------------------------------------
/zh/install_from_src/judge.md:
--------------------------------------------------------------------------------
1 | # Judge
2 |
3 | Judge用于告警判断,agent将数据push给Transfer,Transfer不但会转发给Graph组件来绘图,还会转发给Judge用于判断是否触发告警。
4 |
5 | ## 设计初衷
6 |
7 | 因为监控系统数据量比较大,一台机器显然是搞不定的,所以必须要有个数据分片方案。Transfer通过一致性哈希来分片,每个Judge就只需要处理一小部分数据就可以了。所以判断告警的功能不能放在直接的数据接收端:Transfer,而应该放到Transfer后面的组件里。
8 |
9 | ## 源码安装
10 |
11 | ```bash
12 | cd $GOPATH/src/github.com/open-falcon/judge
13 | go get ./...
14 | ./control build
15 | ./control pack
16 | ```
17 |
18 | 最后一步会pack出一个tar.gz的包,拿着这个包去部署即可。
19 |
20 | ## 部署说明
21 |
22 | Judge监听了一个http端口,提供了一个http接口:/count,访问之,可以得悉当前Judge实例处理了多少数据量。推荐的做法是一个Judge实例处理50万~100万数据,用个5G~10G内存,如果所用物理机内存比较大,比如有128G,可以在一个物理机上部署多个Judge实例。
23 |
24 | ## 配置说明
25 |
26 | 配置文件必须叫cfg.json,可以基于cfg.example.json修改
27 |
28 | ```
29 | {
30 | "debug": true,
31 | "debugHost": "nil",
32 | "remain": 11,
33 | "http": {
34 | "enabled": true,
35 | "listen": "0.0.0.0:6081"
36 | },
37 | "rpc": {
38 | "enabled": true,
39 | "listen": "0.0.0.0:6080"
40 | },
41 | "hbs": {
42 | "servers": ["127.0.0.1:6030"], # hbs最好放到lvs vip后面,所以此处最好配置为vip:port
43 | "timeout": 300,
44 | "interval": 60
45 | },
46 | "alarm": {
47 | "enabled": true,
48 | "minInterval": 300, # 连续两个报警之间至少相隔的秒数,维持默认即可
49 | "queuePattern": "event:p%v",
50 | "redis": {
51 | "dsn": "127.0.0.1:6379", # 与alarm、sender使用一个redis
52 | "maxIdle": 5,
53 | "connTimeout": 5000,
54 | "readTimeout": 5000,
55 | "writeTimeout": 5000
56 | }
57 | }
58 | }
59 | ```
60 |
61 | remain这个配置详细解释一下:
62 | remain指定了judge内存中针对某个数据存多少个点,比如host01这个机器的cpu.idle的值在内存中最多存多少个,配置报警的时候比如all(#3),这个#后面的数字不能超过remain-1,一般维持默认就够用了
63 |
64 | ## 进程管理
65 |
66 | 我们提供了一个control脚本来完成常用操作
67 |
68 | ```bash
69 | ./control start 启动进程
70 | ./control stop 停止进程
71 | ./control restart 重启进程
72 | ./control status 查看进程状态
73 | ./control tail 用tail -f的方式查看var/app.log
74 | ```
75 |
76 | ## 验证
77 |
78 | 访问/health接口验证Judge是否工作正常。
79 |
80 | ```bash
81 | curl 127.0.0.1:6081/health
82 | ```
83 |
84 | 另外就是查看Judge的log,log在var目录下
85 |
86 | ## 视频教程
87 |
88 | 为judge模块录制了一个视频,做了源码级解读:http://www.jikexueyuan.com/course/1850.html
89 |
90 |
--------------------------------------------------------------------------------
/zh/install_from_src/links.md:
--------------------------------------------------------------------------------
1 | # Links
2 |
3 | Links是为报警合并功能写的组件。如果你不想使用报警合并功能,这个组件是无需安装的。
4 |
5 | ## 源码安装
6 |
7 | Links个Python的项目,无需像Go的项目那样去做编译。不过Go的项目是静态编译的,编译好了之后二进制无依赖,拿到其他机器也可以跑起来,Python的项目就需要安装一些依赖库了。
8 |
9 | ```bash
10 | # 我们使用virtualenv来管理Python环境,yum安装需切到root账号
11 | # yum install -y python-virtualenv
12 |
13 | $ cd /path/to/links/
14 | $ virtualenv ./env
15 |
16 | $ ./env/bin/pip install -r pip_requirements.txt
17 | ```
18 |
19 | 安装完依赖的lib之后就可以用control脚本启动了,log在var目录。不过启动之前要先把配置文件修改成相应配置。另外,监听的端口在gunicorn.conf中配置。
20 |
21 |
22 | ## 部署说明
23 |
24 | Links是个web项目,无状态,可以水平扩展,至少部署两台机器以保证可用性,前面架设nginx或者lvs这种负载设备,申请一个域名,搞定!
25 |
26 | ## 配置说明
27 |
28 | Links的配置文件在frame/config.py
29 |
30 | ```python
31 | # 修改一下数据库配置,数据库schema文件在scripts目录
32 | DB_HOST = "127.0.0.1"
33 | DB_PORT = 3306
34 | DB_USER = "root"
35 | DB_PASS = ""
36 | DB_NAME = "falcon_links"
37 |
38 | # SECRET_KEY尽量搞一个复杂点的随机字符串
39 | SECRET_KEY = "4e.5tyg8-u9ioj"
40 | SESSION_COOKIE_NAME = "falcon-links"
41 | PERMANENT_SESSION_LIFETIME = 3600 * 24 * 30
42 |
43 | # 我们可以cp config.py local_config.py用local_config.py中的配置覆盖config.py中的配置
44 | # 嫌麻烦的话维持默认即可,也不用制作local_config.py
45 | try:
46 | from frame.local_config import *
47 | except Exception, e:
48 | print "[warning] %s" % e
49 | ```
50 |
51 | ## 进程管理
52 |
53 | 我们提供了一个control脚本来完成常用操作
54 |
55 | ```bash
56 | ./control start 启动进程
57 | ./control stop 停止进程
58 | ./control restart 重启进程
59 | ./control status 查看进程状态
60 | ./control tail 用tail -f的方式查看var/app.log
61 | ```
62 |
63 | ## 验证
64 |
65 | 启动之后要看看log是否正常,log在var目录。
66 |
67 | 然后浏览器访问之,发现首页404,这是正常的。之后alarm模块会用到links。
68 |
69 | 或者我们可以这么验证:
70 |
71 | ```bash
72 | curl http://links.example.com/store -d "abc"
73 | ```
74 |
75 | 上面命令会返回一个随机字符串,拿着这个随机字符串拼接到links地址后面,浏览器访问之即可。比如返回的随机字符串是dot9kg8b,浏览器访问:http://links.example.com/dot9kg8b 即可
76 |
77 |
--------------------------------------------------------------------------------
/zh/install_from_src/mail-sms.md:
--------------------------------------------------------------------------------
1 | # 邮件短信发送接口
2 |
3 | 这个组件没有代码,需要各个公司自行提供。
4 |
5 | 监控系统产生报警事件之后需要发送报警邮件或者报警短信,各个公司可能有自己的邮件服务器,有自己的邮件发送方法;有自己的短信通道,有自己的短信发送方法。falcon为了适配各个公司,在接入方案上做了一个规范,需要各公司提供http的短信和邮件发送接口
6 |
7 | 短信发送http接口:
8 |
9 | ```
10 | method: post
11 | params:
12 | - content: 短信内容
13 | - tos: 使用逗号分隔的多个手机号
14 | ```
15 |
16 | 邮件发送http接口:
17 |
18 | ```
19 | method: post
20 | params:
21 | - content: 邮件内容
22 | - subject: 邮件标题
23 | - tos: 使用逗号分隔的多个邮件地址
24 | ```
25 |
26 |
--------------------------------------------------------------------------------
/zh/install_from_src/portal.md:
--------------------------------------------------------------------------------
1 | # Portal
2 |
3 | Portal是用来配置报警策略的
4 |
5 | ## 源码安装
6 |
7 | Portal是个Python的项目,无需像Go的项目那样去做编译。不过Go的项目是静态编译的,编译好了之后二进制无依赖,拿到其他机器也可以跑起来,Python的项目就需要安装一些依赖库了。
8 |
9 | ```bash
10 | # 我们使用virtualenv来管理Python环境,yum安装需切到root账号
11 | # yum install -y python-virtualenv
12 |
13 | $ cd /path/to/portal/
14 | $ virtualenv ./env
15 |
16 | $ ./env/bin/pip install -r pip_requirements.txt
17 | ```
18 |
19 | 安装完依赖的lib之后就可以用control脚本启动了,log在var目录。不过启动之前要先把配置文件修改成相应配置。另外,监听的端口在gunicorn.conf中配置。
20 |
21 |
22 | ## 部署说明
23 |
24 | Portal是个web项目,无状态,可以水平扩展,至少部署两台机器以保证可用性,前面架设nginx或者lvs这种负载设备,申请一个域名,搞定!
25 |
26 | ## 配置说明
27 |
28 | Portal的配置文件在frame/config.py
29 |
30 | ```python
31 | # 修改一下数据库配置,数据库schema文件在scripts目录
32 | DB_HOST = "127.0.0.1"
33 | DB_PORT = 3306
34 | DB_USER = "root"
35 | DB_PASS = ""
36 | DB_NAME = "falcon_portal"
37 |
38 | # SECRET_KEY尽量搞一个复杂点的随机字符串
39 | SECRET_KEY = "4e.5tyg8-u9ioj"
40 | SESSION_COOKIE_NAME = "falcon-portal"
41 | PERMANENT_SESSION_LIFETIME = 3600 * 24 * 30
42 |
43 | # 如果你使用的是Go版本的UIC,即Fe那个项目,下面的配置就配置成Fe的地址即可,注意端口,Fe的默认端口是1234
44 | # internal是内网可访问的UIC(或者Fe)地址
45 | # external是外网可访问的UIC(或者Fe)地址,即用户通过浏览器访问的UIC(或者Fe)地址
46 | UIC_ADDRESS = {
47 | 'internal': 'http://127.0.0.1:8080',
48 | 'external': 'http://11.11.11.11:8080',
49 | }
50 |
51 | MAINTAINERS = ['root']
52 | CONTACT = 'ulric.qin@gmail.com'
53 |
54 | # 社区版必须维持默认配置
55 | COMMUNITY = True
56 |
57 | # 我们可以cp config.py local_config.py用local_config.py中的配置覆盖config.py中的配置
58 | # 嫌麻烦的话维持默认即可,也不用制作local_config.py
59 | try:
60 | from frame.local_config import *
61 | except Exception, e:
62 | print "[warning] %s" % e
63 | ```
64 |
65 | ## 进程管理
66 |
67 | 我们提供了一个control脚本来完成常用操作
68 |
69 | ```bash
70 | ./control start 启动进程
71 | ./control stop 停止进程
72 | ./control restart 重启进程
73 | ./control status 查看进程状态
74 | ./control tail 用tail -f的方式查看var/app.log
75 | ```
76 |
77 | # 补充
78 |
79 | Portal正常启动之后,就可以回去配置Fe这个项目的shortcut了。当然,dashboard和alarm还没有搭建,这俩shortcut还没法配置。修改完了shortcut,要重启fe模块。
80 |
81 |
82 | ## 视频教程
83 |
84 | 为该模块录制了一个视频,做了源码级解读:http://www.jikexueyuan.com/course/1796.html
85 |
86 |
--------------------------------------------------------------------------------
/zh/install_from_src/prepare.md:
--------------------------------------------------------------------------------
1 | # 环境准备
2 | 环境准备,包括安装基础的依赖组件 和 准备Open-Falcon的安装环境。
3 |
4 | ## 依赖组件
5 | ### 安装redis
6 | yum install -y redis
7 |
8 | ### 安装mysql
9 | yum install -y mysql-server
10 |
11 | ### 初始化mysql表结构
12 | ```bash
13 | # open-falcon所有组件都无需root账号启动,推荐使用普通账号安装,提升安全性。此处我们使用普通账号:work来安装部署所有组件
14 | # 当然了,使用yum安装依赖的一些lib库的时候还是要有root权限的。
15 | export HOME=/home/work
16 | export WORKSPACE=$HOME/open-falcon
17 | mkdir -p $WORKSPACE
18 | cd $WORKSPACE
19 |
20 | git clone https://github.com/open-falcon/scripts.git
21 | cd ./scripts/
22 | mysql -h localhost -u root -p < db_schema/graph-db-schema.sql
23 | mysql -h localhost -u root -p < db_schema/dashboard-db-schema.sql
24 |
25 | mysql -h localhost -u root -p < db_schema/portal-db-schema.sql
26 | mysql -h localhost -u root -p < db_schema/links-db-schema.sql
27 | mysql -h localhost -u root -p < db_schema/uic-db-schema.sql
28 | ```
29 |
30 | ## 安装环境
31 | open-falcon的后端组件都是使用Go语言编写的,本节我们搭建Go语言开发环境,clone代码
32 |
33 | 我们使用64位Linux作为开发环境,与线上环境保持一致。如果你所用的环境不同,请自行解决不同平台的命令差异
34 |
35 | 首先安装Go语言开发环境:
36 |
37 | ```bash
38 | cd ~
39 | wget http://dinp.qiniudn.com/go1.4.1.linux-amd64.tar.gz
40 | tar zxf go1.4.1.linux-amd64.tar.gz
41 | mkdir -p workspace/src
42 | echo "" >> .bashrc
43 | echo 'export GOROOT=$HOME/go' >> .bashrc
44 | echo 'export GOPATH=$HOME/workspace' >> .bashrc
45 | echo 'export PATH=$GOROOT/bin:$GOPATH/bin:$PATH' >> .bashrc
46 | echo "" >> .bashrc
47 | source .bashrc
48 | ```
49 |
50 | 接下来clone代码,以备后用
51 |
52 | ```bash
53 | cd $GOPATH/src
54 | mkdir github.com
55 | cd github.com
56 | git clone --recursive https://github.com/open-falcon/of-release.git
57 | ```
58 |
--------------------------------------------------------------------------------
/zh/install_from_src/query.md:
--------------------------------------------------------------------------------
1 | # Query
2 | query组件,提供统一的绘图数据查询入口。query组件接收查询请求,根据一致性哈希算法去相应的graph实例查询不同metric的数据,然后汇总拿到的数据,最后统一返回给用户。
3 |
4 | ## 源码编译
5 |
6 | ```bash
7 | # update common lib
8 | cd $GOPATH/src/github.com/open-falcon/common
9 | git pull
10 |
11 | # compile
12 | cd $GOPATH/src/github.com/open-falcon/query
13 | go get ./...
14 | ./control build
15 | ./control pack
16 | ```
17 |
18 | 最后一步会pack出一个tar.gz的安装包,拿着这个包去部署服务即可。
19 |
20 | ## 服务部署
21 | 服务部署,包括配置修改、启动服务、检验服务、停止服务等。这之前,需要将安装包解压到服务的部署目录下。
22 |
23 | ```bash
24 | # 修改配置, 配置项含义见下文, 注意graph集群的配置
25 | mv cfg.example.json cfg.json
26 | vim cfg.json
27 |
28 | ## 修改graph集群配置, 默认在./graph_backends.txt中定义
29 | vim graph_backends.txt
30 |
31 |
32 | # 启动服务
33 | ./control start
34 |
35 | # 校验服务,这里假定服务开启了9966的http监听端口。检验结果为ok表明服务正常启动。
36 | curl -s "127.0.0.1:9966/health"
37 |
38 | ...
39 | # 停止服务
40 | ./control stop
41 |
42 | ```
43 | 服务启动后,可以通过日志查看服务的运行状态,日志文件地址为./var/app.log。可以通过查询脚本```./scripts/query```读取绘图数据,如 运行 ```bash ./scripts/query "ur.endpoint" "ur.counter"```可以查询Endpoint="ur.endpoint" & Counter="ur.counter"对应的绘图数据。
44 |
45 | ## 配置说明
46 |
47 | 注意: 请确保 `graph.replicas`和`graph.cluster` 的内容与transfer的配置**完全一致**
48 |
49 | ```bash
50 | {
51 | "debug": "false", // 是否开启debug日志
52 | "http": {
53 | "enabled": true, // 是否开启http.server
54 | "listen": "0.0.0.0:9966" // http.server监听地址&端口
55 | },
56 | "graph": {
57 | "connTimeout": 1000, // 单位是毫秒,与后端graph建立连接的超时时间,可以根据网络质量微调,建议保持默认
58 | "callTimeout": 5000, // 单位是毫秒,从后端graph读取数据的超时时间,可以根据网络质量微调,建议保持默认
59 | "maxConns": 32, // 连接池相关配置,最大连接数,建议保持默认
60 | "maxIdle": 32, // 连接池相关配置,最大空闲连接数,建议保持默认
61 | "replicas": 500, // 这是一致性hash算法需要的节点副本数量,应该与transfer配置保持一致
62 | "cluster": { // 后端的graph列表,应该与transfer配置保持一致;不支持一条记录中配置两个地址
63 | "graph-00": "test.hostname01:6070",
64 | "graph-01": "test.hostname02:6070"
65 | }
66 | },
67 | "api": { // 适配grafana需要的API配置
68 | "query": "http://127.0.0.1:9966", // query的http地址
69 | "dashboard": "http://127.0.0.1:8081", // dashboard的http地址
70 | "max": 500 //API返回结果的最大数量
71 | }
72 | }
73 | ```
74 |
75 | ## 补充说明
76 | 部署完成query组件后,请修改dashboard组件的配置、使其能够正确寻址到query组件。请确保query组件的graph列表 与 transfer的配置 一致。
77 |
--------------------------------------------------------------------------------
/zh/install_from_src/sender.md:
--------------------------------------------------------------------------------
1 | # Sender
2 |
3 | 上节我们利用http接口规范屏蔽了邮件、短信发送的问题。Sender这个模块专门用于调用各公司提供的邮件、短信发送接口。
4 |
5 | ## 设计初衷
6 |
7 | 各个公司会提供邮件、短信发送接口,我们产生了报警之后就立马调用这些接口发送报警,是不合适的。因为这些接口可能无法处理巨大的并发量,而且接口本身的处理速度可能也比较慢,这会拖慢我们的处理逻辑。所以一个比较好的方式是把邮件、短信发送这个事情做成异步的。
8 |
9 | 我们提供一个短信redis队列,提供一个邮件redis队列。当有短信要发送的时候,直接将短信内容写入短信redis队列即可,当有邮件要发送的时候,直接将邮件内容写入邮件redis队列。针对每个队列,后面有一个预设大小的worker线程池来处理。
10 |
11 | 有了队列的缓冲,即便某个时刻产生了大量报警,造成邮件、短信发送的突发流量,也不会对邮件、短信发送接口造成冲击。
12 |
13 | ## 源码安装
14 |
15 | ```bash
16 | cd $GOPATH/src/github.com/open-falcon/sender
17 | go get ./...
18 | ./control build
19 | ./control pack
20 | ```
21 |
22 | 最后一步会pack出一个tar.gz的包,拿着这个包去部署即可。
23 |
24 | ## 部署说明
25 |
26 | sender这个模块和redis队列部署在一台机器上即可。公司即使有几十万台机器,一个sender也足够了。
27 |
28 | ## 配置说明
29 |
30 | 配置文件必须叫cfg.json,可以基于cfg.example.json修改
31 |
32 | ```
33 | {
34 | "debug": true,
35 | "http": {
36 | "enabled": true,
37 | "listen": "0.0.0.0:6066"
38 | },
39 | "redis": {
40 | "addr": "127.0.0.1:6379", # 此处配置的redis地址要和后面的judge、alarm配置成相同的
41 | "maxIdle": 5
42 | },
43 | "queue": {
44 | "sms": "/sms", # 短信队列名称,维持默认即可,alarm中也会有一个相同的配置
45 | "mail": "/mail" # 邮件队列名称,维持默认即可,alarm中也会有一个相同的配置
46 | },
47 | "worker": {
48 | "sms": 10, # 调用短信接口的最大并发量
49 | "mail": 50 # 调用邮件接口的最大并发量
50 | },
51 | "api": {
52 | "sms": "http://11.11.11.11:8000/sms", # 各公司自行提供的短信发送接口,11.11.11.11这个ip只是个例子喽
53 | "mail": "http://11.11.11.11:9000/mail" # 各公司自行提供的邮件发送接口
54 | }
55 | }
56 | ```
57 |
58 | 如果没有邮件发送接口,可以使用 [Open-Falcon mail-provider](https://github.com/open-falcon/mail-provider)。
59 |
60 | ## 进程管理
61 |
62 | 我们提供了一个control脚本来完成常用操作
63 |
64 | ```bash
65 | ./control start 启动进程
66 | ./control stop 停止进程
67 | ./control restart 重启进程
68 | ./control status 查看进程状态
69 | ./control tail 用tail -f的方式查看var/app.log
70 | ```
71 |
72 | ## 验证
73 |
74 | sender的配置文件中配置了监听的http端口,我们可以访问一下/health接口看是否返回ok,我们所有的Go后端模块都提供了/health接口,上面的配置的话就是这样验证:
75 |
76 | ```bash
77 | curl 127.0.0.1:6066/health
78 | ```
79 |
80 | 另外就是查看sender的log,log在var目录下
81 |
82 | ## 视频教程
83 |
84 | 为sender模块录制了一个视频,做了源码级解读:http://www.jikexueyuan.com/course/1641.html
85 |
86 |
--------------------------------------------------------------------------------
/zh/philosophy/README.md:
--------------------------------------------------------------------------------
1 | # 设计理念
2 |
3 | 阐述open-falcon设计过程中的各种思考
4 |
--------------------------------------------------------------------------------
/zh/philosophy/data-collect.md:
--------------------------------------------------------------------------------
1 | 作为监控系统来讲,首先得有监控数据,然后才能做后面的分析处理、绘图报警等事情,那falcon是如何处理数据采集这个问题的呢?
2 |
3 | 我们先要考虑有哪些数据要采集,脑洞打开~
4 |
5 | - 机器负载信息,这个最常见,cpu.idle/load.1min/mem.memfree.percent/df.bytes.free.percent等等
6 | - 硬件信息,比如功耗、风扇转速、磁盘是否可写,系统组同学对这些比较关注
7 | - 服务监控数据,比如某个接口每分钟调用的次数,latency等等
8 | - 数据库、HBase、Redis、Openstack等开源软件的监控指标
9 |
10 | 要采集的数据还挺多哩,监控系统的开发人员不是神,没法搞定所有数据,比如MySQL,DBA最懂,他知道应该采集哪些指标,监控只要提供一个数据push的接口即可,大家共建。想知道push给Server的数据长啥样?可以参考[Tag与HostGroup设计理念](tags-and-hostgroup.md)中提到的两条json数据
11 |
12 | 上面四个方面比较有代表性,咱们挨个阐述。
13 |
14 | **机器负载信息**
15 |
16 | 这部分比较通用,我们提供了一个agent部署在所有机器上去采集。不像zabbix,要采集什么数据需要在服务端配置,falcon无需配置,只要agent部署到机器上,配置好heartbeat和Transfer地址,就自动开始采集了,省去了用户配置的麻烦。目前agent只支持64位Linux,Mac、Windows均不支持。
17 |
18 | **硬件信息**
19 |
20 | 硬件信息的采集脚本由系统组同学提供,作为plugin依托于agent运行,plugin机制介绍请看[这里](plugin.md)。
21 |
22 | **服务监控数据**
23 |
24 | 服务的监控指标采集脚本,通常都是跟着服务的code走的,服务上线或者扩容,这个脚本也跟着上线或者扩容,服务下线,这个采集脚本也要相应下线。公司里Java的项目有不少,研发那边就提供了一个通用jar包,只要引入这个jar包,就可以自动采集接口的调用次数、延迟时间等数据。然后将采集到的数据push给监控,一分钟push一次。目前falcon的agent提供了一个简单的http接口,这个jar包采集到数据之后是post给本机agent。向agent推送数据的一个简单例子,如下:
25 |
26 | ```bash
27 | curl -X POST -d '[{"metric": "qps", "endpoint": "open-falcon-graph01.bj", "timestamp": 1431347802, "step": 60,"value": 9,"counterType": "GAUGE","tags": "project=falcon,module=graph"}]' http://127.0.0.1:1988/v1/push
28 | ```
29 |
30 | **各种开源软件的监控指标**
31 |
32 | 这都是大用户,比如DBA自己写一些采集脚本,连到各个MySQL实例上去采集数据,完事直接调用server端的jsonrpc汇报数据,一分钟一次,每次甚至push几十万条数据,比较好的发送方式是500条数据做一个batch,别几十万数据一次性发送。
33 |
34 |
--------------------------------------------------------------------------------
/zh/philosophy/data-model.md:
--------------------------------------------------------------------------------
1 | # Data model
2 |
3 | Open-Falcon,采用和OpenTSDB相似的数据格式:metric、endpoint加多组key value tags,举两个例子:
4 |
5 | ```bash
6 | {
7 | metric: load.1min,
8 | endpoint: open-falcon-host,
9 | tags: srv=falcon,idc=aws-sgp,group=az1,
10 | value: 1.5,
11 | timestamp: `date +%s`,
12 | counterType: GAUGE,
13 | step: 60
14 | }
15 | {
16 | metric: net.port.listen,
17 | endpoint: open-falcon-host,
18 | tags: port=3306,
19 | value: 1,
20 | timestamp: `date +%s`,
21 | counterType: GAUGE,
22 | step: 60
23 | }
24 | ```
25 |
26 | 其中,metric是监控指标名称,endpoint是监控实体,tags是监控数据的属性标签,counterType是Open-Falcon定义的数据类型(取值为GAUGE、COUNTER),step为监控数据的上报周期,value和timestamp是有效的监控数据。
27 |
--------------------------------------------------------------------------------
/zh/philosophy/plugin.md:
--------------------------------------------------------------------------------
1 | 对于Plugin机制,叙述之前必须要强调一下:
2 |
3 | > Plugin可以看做是对agent功能的扩充。对于业务系统的监控指标采集,最好不要做成plugin,而是把采集脚本放到业务程序发布包中,随着业务代码上线而上线,随着业务代码升级而升级,这样会比较容易管理。
4 |
5 | 要使用Plugin,步骤如下:
6 |
7 | **1. 编写采集脚本**
8 |
9 | 用什么语言写没关系,只要目标机器上有运行环境就行,脚本本身要有可执行权限。采集到数据之后直接打印到stdout即可,agent会截获并push给server。数据格式是json,举个例子:
10 |
11 | ```bash
12 | [root@host01:/path/to/plugins/plugin/sys/ntp]#./600_ntp.py
13 | [{"endpoint": "host01", "tags": "", "timestamp": 1431349763, "metric": "sys.ntp.offset", "value": 0.73699999999999999, "counterType": "GAUGE", "step": 600}]
14 | ```
15 |
16 | 注意,这个json数据是个list哦
17 |
18 | **2. 上传脚本到git**
19 |
20 | 插件脚本也是code,所以最好也用git、svn管理,这里我们使用git管理,公司内部如果没有搭建gitlab,可以使用gitcafe、coding.net之类的,将写好的脚本push到git仓库,比如上例中的600_ntp.py,姑且放到git仓库的sys/ntp目录下。注意,这个脚本在push到git仓库之前要加上可执行权限。
21 |
22 | **3. 检查agent配置**
23 |
24 | 大家之前部署agent的时候应该注意到agent配置文件中有配置plugin吧,现在到了用的时候了,把git仓库地址配置上,enabled设置为true。注意,配置的git仓库地址需要是任何机器上都可以拉取的,即`git://`或者`https://`打头的。如果agent之前已经部署到公司所有机器上了,那现在手工改配置可能略麻烦,之前讲过的嘛,用[ops-updater](https://github.com/open-falcon/ops-updater)管理起来~
25 |
26 | **4. 拉取plugin脚本**
27 |
28 | agent开了一个http端口1988,我们可以挨个curl一下http://ip:1988/plugin/update 这个地址,这会让agent主动git pull这个插件仓库。为啥没做成定期拉取这个仓库呢?主要是怕给git服务器压力太大……大家悠着点用,别给人pull挂了……
29 |
30 | **5. 让plugin run起来**
31 |
32 | 上一步我们拉取了plugin脚本到所有机器上,不过plugin并没有执行。哪些机器执行哪些plugin脚本,是在portal上面配置的。其实我很想做成,只要插件拉取下来了就立马执行,不过实际实践中,有些插件还是不能在所有机器上跑,所以就在portal上通过配置控制了。在portal上找到要执行插件的HostGroup,点击对应的plugins超链接,对于上例sys/ntp目录下的600_ntp.py,直接把sys/ntp绑定上去即可。sys/ntp下的所有插件就都执行了。
33 |
34 | **6. 补充**
35 |
36 | portal上配置完成之后并不会立马生效,有个同步的过程,最终是agent通过调用hbs的接口获取的,需要一两分钟。上例我们绑定了sys/ntp,这实际是个目录,这个目录下的所有插件都会被执行,那什么样的文件会被看做插件呢?文件名是数字下划线打头的~这个数字代表的是step,即多长时间跑一次,单位是秒,比如60_a.py,就是在通过命名告诉agent,这个插件每60秒跑一次。sys/ntp目录下的子目录、其他命名方式的文件都会被忽略。
37 |
--------------------------------------------------------------------------------
/zh/practice/README.md:
--------------------------------------------------------------------------------
1 | Open-Falcon实践经验整理
2 |
--------------------------------------------------------------------------------
/zh/quick_install/README.md:
--------------------------------------------------------------------------------
1 | Open-Falcon,整体可以分为两部分,即绘图组件、告警组件。这两个部分都可以独立工作,其中:
2 |
3 | - [安装绘图组件](./graph_components.md) 负责数据的采集、收集、存储、归档、采样、查询、展示(Dashboard/Screen)等功能,可以单独工作,作为time-series data的一种存储展示方案。
4 | - [安装告警组件](./judge_components.md) 负责告警策略配置(portal)、告警判定(judge)、告警处理(alarm/sender)、用户组管理(uic)等,可以单独工作。
5 | - 如果你熟悉docker,想快速搭建并体验Open-Falcon的话,请参考 [使用Docker镜像安装Open-Falcon](https://github.com/frostynova/open-falcon-docker)
6 |
--------------------------------------------------------------------------------
/zh/quick_install/links.md:
--------------------------------------------------------------------------------
1 | 开启告警合并功能,需要完成一下两个步骤:
2 |
3 | ## 调整alarm的配置
4 |
5 | cd $WORKSPACE/alarm/
6 |
7 | 1. 将cfg.json中 highQueues 配置项的内容调整为
8 | [
9 | "event:p0",
10 | "event:p1"
11 | ]
12 | 2. 将cfg.json中 lowQueues 配置项的内容调整为
13 | [
14 | "event:p2",
15 | "event:p3",
16 | "event:p4",
17 | "event:p5",
18 | "event:p6"
19 | ]
20 |
21 | 说明:
22 | - 在Open-Falcon中,告警是分级别的,包括P0、P1 ... P6,告警优先级依次下降。
23 | - 对于高优先级的告警,Open-Falcon会保障优先发送。
24 | - 告警合并功能,只针对低优先级的告警生效,因为高优先级的告警一般都很重要,对实时性要求很高,不建议做告警合并。
25 | - 因此,在highQueues中配置的不会被合并,在lowQueues 中的会被合并,各位可以根据需求进行调整。
26 |
27 | ## 安装Links组件
28 |
29 | links组件的作用:当多个告警被合并为一条告警信息时,短信中会附带一个告警详情的http链接地址,供用户查看详情。
30 |
31 | ### install dependency
32 |
33 | # yum install -y python-virtualenv
34 | $ cd $WORKSPACE/links/
35 | $ virtualenv ./env
36 | $ ./env/bin/pip install -r pip_requirements.txt
37 |
38 |
39 | ### init database and config
40 |
41 | - database schema: https://github.com/open-falcon/scripts/blob/master/db_schema/links-db-schema.sql
42 | - database config: ./frame/config.py
43 | - 初始化Links的数据,也可以参考 [环境准备](https://github.com/open-falcon/doc/wiki/%E7%8E%AF%E5%A2%83%E5%87%86%E5%A4%87)有关Links的部分
44 |
45 |
46 | ### start
47 |
48 | $ cd $WORKSPACE/links/
49 | $ ./control start
50 | --> goto http://127.0.0.1:5090
51 |
52 | $ ./control tail
53 | --> tail log
54 |
55 |
56 |
--------------------------------------------------------------------------------
/zh/quick_install/prepare.md:
--------------------------------------------------------------------------------
1 | # 环境准备
2 |
3 | ### 安装redis
4 | yum install -y redis
5 |
6 | ### 安装mysql
7 | yum install -y mysql-server
8 |
9 | ### 创建工作目录
10 | ```bash
11 | export HOME=/home/work
12 | export WORKSPACE=$HOME/open-falcon
13 | mkdir -p $WORKSPACE
14 | cd $WORKSPACE
15 | ```
16 |
17 | ### 初始化mysql表结构
18 | ```bash
19 | # open-falcon所有组件都无需root账号启动,推荐使用普通账号安装,提升安全性。此处我们使用普通账号:work来安装部署所有组件
20 | # 当然了,使用yum安装依赖的一些lib库的时候还是要有root权限的。
21 |
22 | git clone https://github.com/open-falcon/scripts.git
23 | cd ./scripts/
24 | mysql -h localhost -u root --password="" < db_schema/graph-db-schema.sql
25 | mysql -h localhost -u root --password="" < db_schema/dashboard-db-schema.sql
26 |
27 | mysql -h localhost -u root --password="" < db_schema/portal-db-schema.sql
28 | mysql -h localhost -u root --password="" < db_schema/links-db-schema.sql
29 | mysql -h localhost -u root --password="" < db_schema/uic-db-schema.sql
30 | ```
31 |
32 |
33 | ### 下载编译好的组件
34 | ** 我们把相关组件编译成了二进制,方便大家直接使用,这些二进制只能跑在64位Linux上 **
35 |
36 | > 国内用户点这里高速下载编[译好的二进制版本](http://pan.baidu.com/s/1eR1cNj8)
37 |
38 | ```bash
39 | DOWNLOAD="https://github.com/open-falcon/of-release/releases/download/v0.1.0/open-falcon-v0.1.0.tar.gz"
40 | cd $WORKSPACE
41 |
42 | mkdir ./tmp
43 | #下载
44 | wget $DOWNLOAD -O open-falcon-latest.tar.gz
45 |
46 | #解压
47 | tar -zxf open-falcon-latest.tar.gz -C ./tmp/
48 | for x in `find ./tmp/ -name "*.tar.gz"`;do \
49 | app=`echo $x|cut -d '-' -f2`; \
50 | mkdir -p $app; \
51 | tar -zxf $x -C $app; \
52 | done
53 | ```
54 |
55 | ### Changelog
56 |
57 | http://book.open-falcon.com/zh/changelog/README.html
58 |
--------------------------------------------------------------------------------
/zh/usage/README.md:
--------------------------------------------------------------------------------
1 | open-falcon使用手册
2 |
3 |
--------------------------------------------------------------------------------
/zh/usage/docker.md:
--------------------------------------------------------------------------------
1 |
2 | # Docker容器监控实践
3 |
4 | 在[数据采集](../philosophy/data-collect.md)一节中我们介绍了常见的监控数据源。open-falcon作为一个监控框架,可以去采集任何系统的监控指标数据,只要将监控数据组织为open-falcon规范的格式就OK了。
5 |
6 | docker container的数据采集可以通过[micadvisor_open](https://github.com/open-falcon/micadvisor_open)来做。
7 |
8 | ## 工作原理
9 |
10 | micadvisor-open是基于open-falcon的docker容器资源监控插件,监控容器的cpu、内存、diskio以及网络io等,数据采集后上报到open-falcon
11 |
12 | ## 采集的指标
13 |
14 | | Counters | Notes|
15 | |-----|------|
16 | |cpu.busy|cpu使用情况百分比|
17 | |cpu.user|用户态使用的CPU百分比|
18 | |cpu.system|内核态使用的CPU百分比|
19 | |cpu.core.busy|每个cpu的使用情况|
20 | |mem.memused.percent|内存使用百分比|
21 | |mem.memused|内存使用原值|
22 | |mem.memtotal|内存总量|
23 | |mem.memused.hot|内存热使用情况|
24 | |disk.io.read_bytes|磁盘io读字节数|
25 | |disk.io.write_bytes|磁盘io写字节数|
26 | |net.if.in.bytes|网络io流入字节数|
27 | |net.if.in.packets|网络io流入包数|
28 | |net.if.in.errors|网络io流入出错数|
29 | |net.if.in.dropped|网络io流入丢弃数|
30 | |net.if.out.bytes|网络io流出字节数|
31 | |net.if.out.packets|网络io流出包数|
32 | |net.if.out.errors|网络io流出出错数|
33 | |net.if.out.dropped|网络io流出丢弃数|
34 |
35 | ## Contributors
36 | - mengzhuo: QQ:296142139; MAIL:mengzhuo@xiaomi.com
37 |
38 | ## 补充
39 | - 另外一个docker metric采集的lib库:https://github.com/projecteru/eru-metric
40 |
41 |
--------------------------------------------------------------------------------
/zh/usage/esxi.md:
--------------------------------------------------------------------------------
1 | # ESXi监控
2 |
3 | VMware的主体机器(host machine)是运行ESXi作业系统。没有办法安装Open-Falcon agent来监控,所以不能用普通的方式来做监控。
4 |
5 | ESXi作业系统设备的运行指标的采集,可以透过写脚本,通过SNMP协议来采集交换机的各项运行指标,包括内存占用、CPU使用、流量、磁盘用量等。[esxicollector](https://github.com/humorless/esxicollector)就是這樣子的腳本。
6 |
7 | ## 工作原理
8 |
9 | esxicollector是一系列整理过的脚本。由[humorless](https://github.com/humorless/)设计开发。
10 |
11 | esxicollector需要透过cronjob来配置。在一台可以跑cronjob的机器上,配置好cronjob。并且在esxi_collector.sh这个脚本中,写清楚要监控的设备、用来接受监控结果的Open-Falcon agent的位址。esxicollector就会照cronjob的时间间隔,预设是每分钟一次,定期地去采集ESXi作业系统设备的监控项,并透过上报到Open-Falcon的agent。
12 |
13 | 采集的metric列表:
14 |
15 | * CPU利用率
16 |
17 | `esxi.cpu.core`
18 |
19 | * 内存總量/利用率
20 |
21 | `esxi.cpu.memory.kliobytes.size`
22 | `esxi.cpu.memory.kliobytes.used`
23 | `esxi.cpu.memory.kliobytes.avail`
24 |
25 | * 运行的进程数
26 |
27 | `esxi.current.process`
28 |
29 | * 登入的使用者数
30 |
31 | `esxi.current.user`
32 |
33 | * 虚拟机器数
34 |
35 | `esxi.current.vhost`
36 |
37 | * 磁盤總量/利用率
38 |
39 | `esxi.df.size.kilobytes`
40 | `esxi.df.used.percentage`
41 |
42 | * 磁盤錯誤
43 |
44 | `esxi.disk.allocationfailure`
45 |
46 | * 網卡的輸出入流量/封包數
47 |
48 | `esxi.net.in.octets`
49 | `esxi.net.in.ucast.pkts`
50 | `esxi.net.in.multicast.pkts`
51 | `esxi.net.in.broadcast.pkts`
52 | `esxi.net.out.octets`
53 | `esxi.net.out.ucast.pkts`
54 | `esxi.net.out.multicast.pkts`
55 | `esxi.net.out.broadcast.pkts`
56 |
57 |
58 | ## 安装
59 |
60 | 从[这里](https://github.com/humorless/esxicollector)下载。
61 |
62 | 1. 安装SNMP指令
63 |
64 | `yum -y install net-snmp net-snmp-utils`
65 |
66 | 2. 下载VMware ESXi MIB档案,并且复制它们到资料夹`/usr/share/snmp/mibs`
67 |
68 | 3. 设置SNMP的环境
69 |
70 | `mkdir ~/.snmp`
71 | `echo "mibs +ALL" > ~/.snmp/snmp.conf`
72 |
73 | 4. 在`esxi_collector.sh`填入合适的参数
74 |
75 | 5. 设置cronjobs
76 |
77 | ` * * * * * esxi_collector.sh `
78 |
79 |
80 | ## 延伸开发新的监控项
81 |
82 | 脚本 ```snmp_queries.sh``` 会呼叫基本的snmp指令,并且输出snmp执行完的结果。可以透过比较执行 ```60_esxi_*.sh```的结果,来设计新的脚本。
83 |
--------------------------------------------------------------------------------
/zh/usage/func.md:
--------------------------------------------------------------------------------
1 | # 报警函数说明
2 |
3 | 配置报警策略的时候open-falcon支持多种报警触发函数,比如`all(#3)` `diff(#10)`等等,这些#后面的数字表示的是最新的历史点。比如`#3`代表的是最新的三个点。
4 |
5 | ```bash
6 | all(#3): 最新的3个点都满足阈值条件则报警
7 | max(#3): 对于最新的3个点,其最大值满足阈值条件则报警
8 | min(#3): 对于最新的3个点,其最小值满足阈值条件则报警
9 | sum(#3): 对于最新的3个点,其和满足阈值条件则报警
10 | avg(#3): 对于最新的3个点,其平均值满足阈值条件则报警
11 | diff(#3): 拿最新push上来的点(被减数),与历史最新的3个点(3个减数)相减,得到3个差,只要有一个差满足阈值条件则报警
12 | pdiff(#3): 拿最新push上来的点,与历史最新的3个点相减,得到3个差,再将3个差值分别除以减数,得到3个商值,只要有一个商值满足阈值则报警
13 | ```
14 |
15 | 最常用的就是`all`函数了,比如cpu.idle `all(#3) < 5`,表示cpu.idle的值连续3次小于5%则报警。
16 |
17 | diff和pdiff理解起来没那么容易,设计diff和pdiff是为了解决流量突增突降报警。实在看不懂,那只能去读代码了:https://github.com/open-falcon/judge/blob/master/store/func.go
18 |
--------------------------------------------------------------------------------
/zh/usage/haproxy.md:
--------------------------------------------------------------------------------
1 | #HAProxy 监控
2 |
3 | 在[数据采集](../philosophy/data-collect.md)一节中我们介绍了常见的监控数据源。open-falcon作为一个监控框架,可以去采集任何系统的监控指标数据,只要将监控数据组织为open-falcon规范的格式就OK了。
4 |
5 | HAProxy的数据采集可以通过[haproxymon](https://github.com/iask/haproxymon)来做。
6 |
7 | ## 工作原理
8 |
9 | haproxymon是一个cron,每分钟跑一次采集脚本```haproxymon.py```,haproxymon通过Haproxy的stats socket接口来采集Haproxy基础状态信息,比如qcur、scur、rate等,然后组装为open-falcon规定的格式的数据,post给本机的falcon-agent。falcon-agent提供了一个http接口,使用方法可以参考[数据采集](../philosophy/data-collect.md)中的例子。
--------------------------------------------------------------------------------
/zh/usage/jmx.md:
--------------------------------------------------------------------------------
1 | # jmxmon 简介
2 | jmxmon是一个基于open-falcon的jmx监控插件,通过这个插件,结合open-falcon agent,可以采集任何开启了JMX服务端口的java进程的服务状态,并将采集信息自动上报给open-falcon服务端
3 |
4 | ## 主要功能
5 |
6 | 通过jmx采集java进程的jvm信息,包括gc耗时、gc次数、gc吞吐、老年代使用率、新生代晋升大小、活跃线程数等信息。
7 |
8 | 对应用程序代码无侵入,几乎不占用系统资源。
9 |
10 |
11 | ## 采集指标
12 | | Counters | Type | Notes|
13 | |-----|------|------|
14 | | parnew.gc.avg.time | GAUGE | 一分钟内,每次YoungGC(parnew)的平均耗时 |
15 | | concurrentmarksweep.gc.avg.time | GAUGE | 一分钟内,每次CMSGC的平均耗时 |
16 | | parnew.gc.count | GAUGE | 一分钟内,YoungGC(parnew)的总次数 |
17 | | concurrentmarksweep.gc.count | GAUGE | 一分钟内,CMSGC的总次数 |
18 | | gc.throughput | GAUGE | GC的总吞吐率(应用运行时间/进程总运行时间) |
19 | | new.gen.promotion | GAUGE | 一分钟内,新生代的内存晋升总大小 |
20 | | new.gen.avg.promotion | GAUGE | 一分钟内,平均每次YoungGC的新生代内存晋升大小 |
21 | | old.gen.mem.used | GAUGE | 老年代的内存使用量 |
22 | | old.gen.mem.ratio | GAUGE | 老年代的内存使用率 |
23 | | thread.active.count | GAUGE | 当前活跃线程数 |
24 | | thread.peak.count | GAUGE | 峰值线程数 |
25 |
26 | ## 建议设置监控告警项
27 |
28 | 不同应用根据其特点,可以灵活调整触发条件及触发阈值
29 |
30 | | 告警项 | 触发条件 | 备注|
31 | |-----|------|------|
32 | | gc.throughput | all(#3)<98 | gc吞吐率低于98%,影响性能 |
33 | | old.gen.mem.ratio | all(#3)>90 | 老年代内存使用率高于90%,需要调优 |
34 | | thread.active.count | all(#3)>500 | 线程数过多,影响性能 |
35 |
36 |
37 | # 使用帮助
38 | 详细的使用方法常见:[jmxmon](https://github.com/toomanyopenfiles/jmxmon)
39 |
40 |
--------------------------------------------------------------------------------
/zh/usage/lvs.md:
--------------------------------------------------------------------------------
1 | # lvs-metrics 简介
2 | lvs-metrics是一个基于open-falcon的LVS监控插件,通过这个插件,结合open-falcon agent/transfer,可以采集LVS服务状态,并将采集信息自动上报给open-falcon服务端
3 |
4 | ## 主要功能
5 |
6 | 通过google开源的ipvs/netlink库及proc下文件采集lvs的监控信息,包括所有VIP的连接数(活跃/非活跃)/LVS主机的连接数(活跃/非活跃).进出数据包数/字节数.
7 |
8 | 对应用程序代码无侵入,几乎不占用系统资源。
9 |
10 |
11 | ## 采集指标
12 |
13 | | Counters | Type | Notes |
14 | |-----|-----|-----|
15 | | lvs.in.bytes | GUAGE | network in bytes per host |
16 | | lvs.out.bytes | GUAGE | network out bytes per host |
17 | | lvs.in.packets | GUAGE | network in packets per host |
18 | | lvs.out.packets | GUAGE | network out packets per host |
19 | | lvs.total.conns | GUAGE | lvs total connections per vip now |
20 | | lvs.active.conn | GUAGE | lvs active connections per vip now |
21 | | lvs.inact.conn | GUAGE | lvs inactive connections per vip now |
22 | | lvs.realserver.num | GUAGE | lvs live realserver num per vip now |
23 | | lvs.vip.conns | COUNTER | lvs conns counter from service start per vip |
24 | | lvs.vip.inbytes | COUNTER | lvs inbytes counter from service start per vip |
25 | | lvs.vip.outbytes | COUNTER | lvs outpkts counter from service start per vip |
26 | | lvs.vip.inpkts | COUNTER | lvs inpkts counter from service start per vip |
27 | | lvs.vip.outpkts | COUNTER | lvs outpkts counter from service start per vip |
28 |
29 |
30 | # 使用帮助
31 | 详细的使用方法常见:[lvs-metrics](https://github.com/mesos-utility/lvs-metrics)
32 |
33 |
--------------------------------------------------------------------------------
/zh/usage/memcache.md:
--------------------------------------------------------------------------------
1 | # Memcache监控
2 |
3 | 在[数据采集](../philosophy/data-collect.md)一节中我们介绍了常见的监控数据源。open-falcon作为一个监控框架,可以去采集任何系统的监控指标数据,只要将监控数据组织为open-falcon规范的格式就OK了。
4 |
5 | Memcache的数据采集可以通过采集脚本[memcached-monitor](https://github.com/iambocai/falcon-monit-scripts/tree/master/memcached)来做。
6 |
7 | ## 工作原理
8 |
9 | memcached-monitor是一个cron,每分钟跑一次采集脚本```memcached-monitor.py```,脚本可以自动检测Memcached的端口,并连到Memcached实例,采集一些监控指标,比如get_hit_ratio、usage等等,然后组装为open-falcon规定的格式的数据,post给本机的falcon-agent。falcon-agent提供了一个http接口,使用方法可以参考[数据采集](../philosophy/data-collect.md)中的例子。
10 |
11 | 比如,我们有1000台机器都部署了Memcached实例,可以在这1000台机器上分别部署1000个cron,即:与Memcached实例一一对应。
12 |
13 | 需要说明的是,脚本```memcached-monitor.py```通过```ps -ef |grep memcached|grep -v grep |sed -n 's/.* *-p *\([0-9]\{1,5\}\).*/\1/p```来自动发现Memcached端口的。如果Memcached启动时 没有通过 ```-p```参数来指定端口,端口的自动发现将失败,这时需要手动修改脚本、指定端口。
--------------------------------------------------------------------------------
/zh/usage/mesos.md:
--------------------------------------------------------------------------------
1 | # mesos监控
2 |
3 | mesos.py是leancloud开发的open-falcon插件脚本,通过这个插件,结合open-falcon agent/transfer,可以采集mesos相关数据,并将采集信息自动上报给open-falcon服务端
4 |
5 | [https://github.com/leancloud/satori/tree/master/satori-rules/plugin/mesos](https://github.com/leancloud/satori/tree/master/satori-rules/plugin/mesos)
6 |
--------------------------------------------------------------------------------
/zh/usage/mymon.md:
--------------------------------------------------------------------------------
1 | # MySQL监控实践
2 |
3 | 在[数据采集](../philosophy/data-collect.md)一节中我们介绍了常见的监控数据源。open-falcon作为一个监控框架,可以去采集任何系统的监控指标数据,只要将监控数据组织为open-falcon规范的格式就OK了。
4 |
5 | MySQL的数据采集可以通过[mymon](https://github.com/open-falcon/mymon)来做。
6 |
7 | ## 工作原理
8 |
9 | mymon是一个cron,每分钟跑一次,配置文件中配置了数据库连接地址,mymon连到该数据库,采集一些监控指标,比如global status, global variables, slave status等等,然后组装为open-falcon规定的格式的数据,post给本机的falcon-agent。falcon-agent提供了一个http接口,使用方法可以参考[数据采集](../philosophy/data-collect.md)中的例子。
10 |
11 | 比如我们有1000台机器都部署了MySQL实例,可以在这1000台机器上分别部署1000个cron,即:与数据库实例一一对应。
12 |
13 | ## 补充
14 | ***远程监控mysql实例***
15 | 如果希望通过hostA上的mymon、采集hostB上的mysql实例指标,你可以这样做:将hostA上mymon的配置文件中的"endpoint设置为hostB的机器名、同时将[mysql]配置项设置为hostB的mysql实例"。查看mysql指标、对mysql指标加策略时,需要找hostB机器名对应的指标。
16 |
--------------------------------------------------------------------------------
/zh/usage/ngx_metric.md:
--------------------------------------------------------------------------------
1 | # Nginx 监控
2 |
3 | 在[数据采集](../philosophy/data-collect.md)一节中我们介绍了常见的监控数据源。open-falcon作为一个监控框架,可以去采集任何系统的监控指标数据,只要将监控数据组织为open-falcon规范的格式就OK了。
4 |
5 | Nginx的数据采集可以通过[ngx_metric](https://github.com/GuyCheung/falcon-ngx_metric)来做。
6 |
7 | # 工作原理
8 |
9 | ngx_metric是借助lua-nginx-module的`log_by_lua`功能实现nginx请求的实时分析,然后借助`ngx.shared.DICT`存储中间结果。最后通过外部python脚本取出中间结果加以计算、格式化并输出。按falcon格式输出的结果可直接push到falcon agent。
10 |
11 | # 使用帮助
12 |
13 | 详细的使用方法常见:[ngx_metric](https://github.com/GuyCheung/falcon-ngx_metric)
14 |
--------------------------------------------------------------------------------
/zh/usage/nodata.md:
--------------------------------------------------------------------------------
1 | # Nodata配置
2 | 使用Nodata,需要进行两个配置: Nodata配置 和 策略配置。下面,我们以一个例子,讲述如何使用Nodata提供的服务。
3 |
4 | ### 用户需求
5 | 当机器分组`cop.xiaomi_owt.inf_pdl.falcon_service.task`下的所有机器,其采集指标 `agent.alive` 上报中断时,通知用户。
6 |
7 | ### Nodata配置
8 | 进入Nodata配置主页,点击右上角的添加按钮,添加nodata配置。
9 | 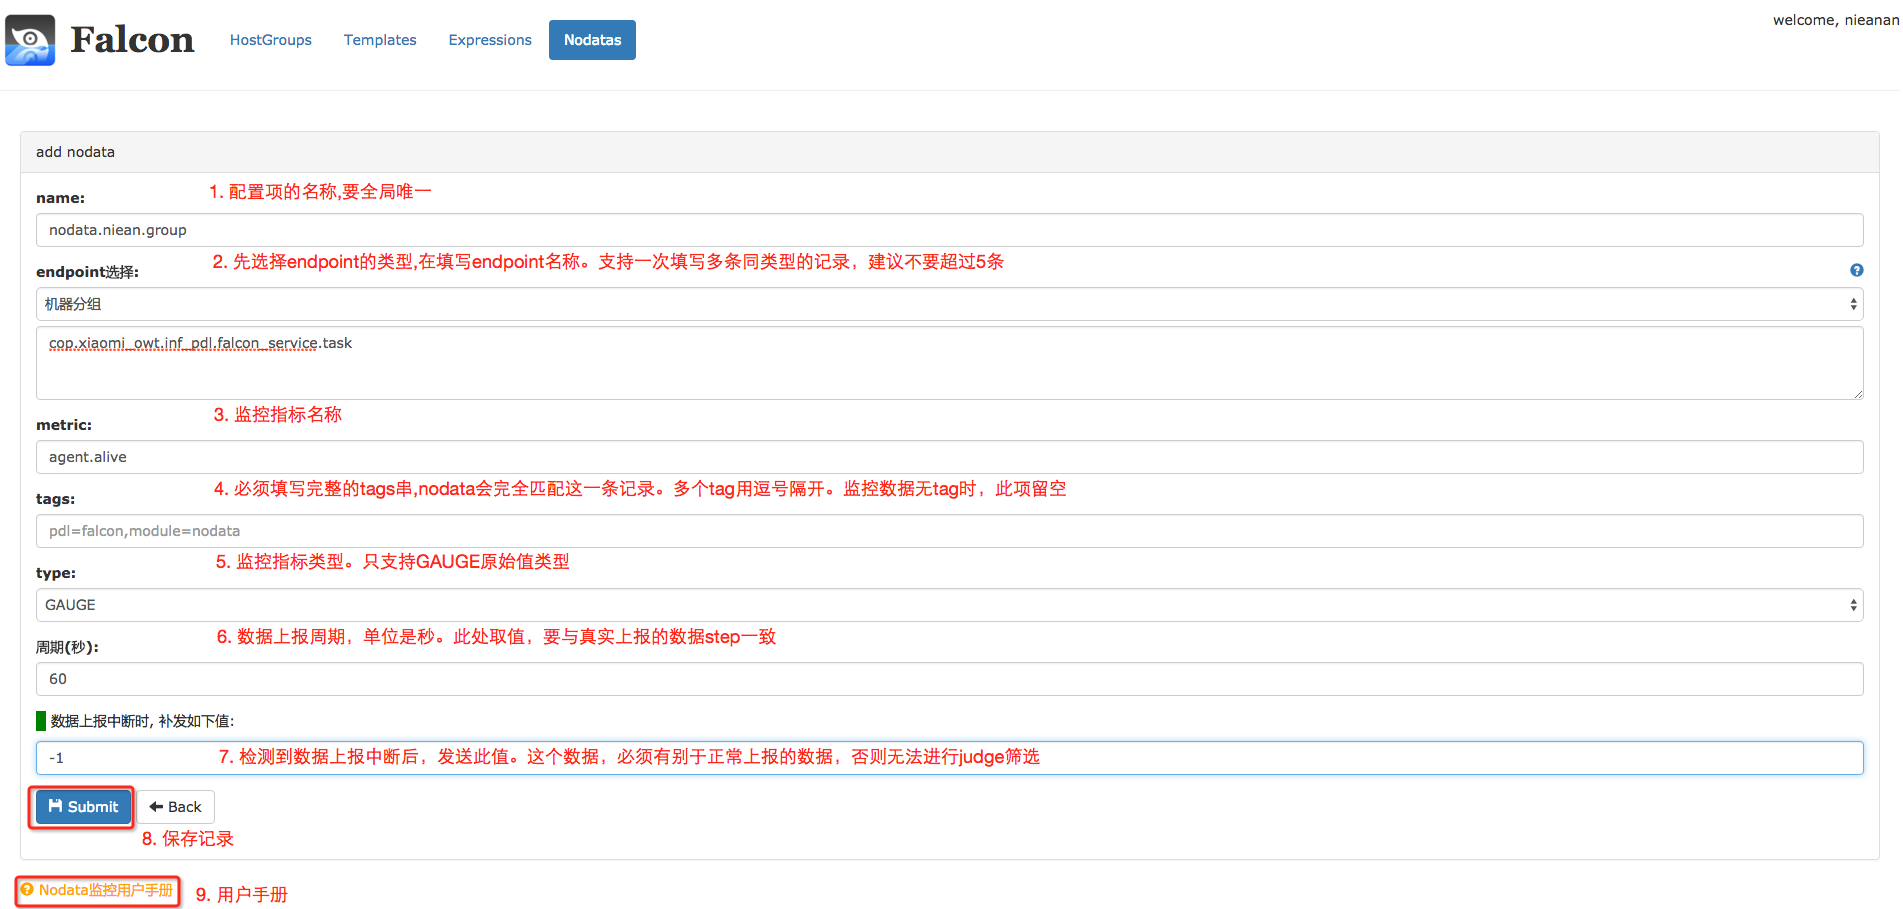
10 |
11 | 进行完上述配置后,分组`cop.xiaomi_owt.inf_pdl.falcon_service.task`下的所有机器,其采集项 `agent.alive`上报中断后,nodata服务就会补发一个取值为 `-1.0`、agent.alive的监控数据给监控系统。
12 |
13 | ### 策略配置
14 | 配置了Nodata后,如果有数据上报中断的情况,Nodata配置中的默认值就会被上报。我们可以针对这个默认值,设置报警;只要收到了默认值,就认为发生了数据上报的中断(如果你设置的默认值,可能与正常上报的数据相等,那么请修改你的Nodata配置、使默认值有别于正常值)。将此策略,绑定到分组`cop.xiaomi_owt.inf_pdl.falcon_service.task`即可。
15 |
16 | 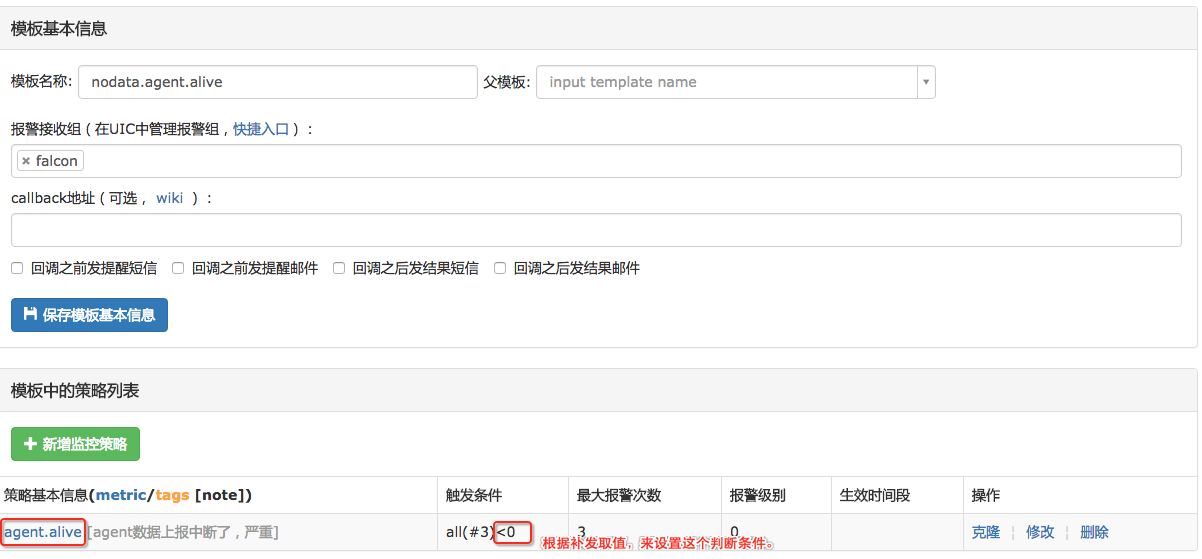
17 |
18 | ### 注意事项
19 | 1. 配置名称name,要全局唯一。这是为了方便Nodata配置的管理。
20 | 2. 监控实例endpoint, 可以是机器分组、机器名或者其他 这三种类型,只能选择其中的一种。同一类型,支持多个记录,但建议不超过5个,多条记录换行分割、每行一条记录。选择机器分组时,系统会帮忙展开成具体机器名,支持动态生效。监控实体不是机器名时,只能选择“其他”类型。
21 | 3. 监控指标metric。
22 | 4. 数据标签tags,多个tag要用逗号隔开。必须填写完整的tags串,因为nodata会按照此tags串,去完全匹配、筛选监控数指标项。
23 | 5. 数据类型type,只支持原始值类型GAUGE。因为,nodata只应该监控 "特征指标"(如agent.alive),"特征指标"都是GAUGE类型的。
24 | 6. 采集周期step,单位是秒。必须填写 完整&真实step。该字段不完整 或者 不真实,将会导致nodata监控的误报、漏报。
25 | 7. 补发值default,必须有别于上报的真实数据。比如,`cpu.idle`的取值范围是[0,100],那么它的nodata默认取值 只能取小于0或者大于100的值。否则,会发生误报、漏报。
26 |
--------------------------------------------------------------------------------
/zh/usage/proc-port-monitor.md:
--------------------------------------------------------------------------------
1 | # 引言
2 |
3 | 我们说falcon-agent是无需配置即可自动化采集200多项监控指标数据,比如cpu相关的、内存相关的、磁盘io相关的、网卡相关的等等,都可以自动发现,自动采集。
4 |
5 | # 端口监控
6 |
7 | falcon-agent编写初期是把本机监听的所有端口上报给server端,比如机器监听了80、443、22三个端口,就会自动上报三条数据:
8 |
9 | ```
10 | net.port.listen/port=22
11 | net.port.listen/port=80
12 | net.port.listen/port=443
13 | ```
14 |
15 | 上报的端口数据,value是1,如果后来某些端口不再监听了,那就会停止上报数据。这样是否OK呢?存在两个问题:
16 |
17 | - 机器监听的端口可能很多很多,但是真正想做监控的端口可能不多,这会造成资源浪费
18 | - 目前Open-Falcon还不支持nodata监控,端口挂了不上报数据了,没有nodata机制,是发现不了的
19 |
20 | 改进之。
21 |
22 | agent到底要采集哪些端口是通过用户配置的策略自动计算得出的。因为无论如何,监控配置策略是少不了的。比如用户配置了2个端口:
23 |
24 | ```
25 | net.port.listen/port=8080 if all(#3) == 0 then alarm()
26 | net.port.listen/port=8081 if all(#3) == 0 then alarm()
27 | ```
28 |
29 | 将策略绑定到某个HostGroup,那么这个HostGroup下的机器就要去采集8080和8081这俩端口的情况了。这个信息是通过agent和hbs的心跳机制下发的。
30 |
31 | agent通过`ss -tln`拿到当前有哪些端口在监听,如果8080在监听,就设置value=1,汇报给transfer,如果发现8081没在监听,就设置value=0,汇报给transfer。
32 |
33 | # 进程监控
34 |
35 | 进程监控和端口监控类似,也是通过用户配置的策略自动计算出来要采集哪个进程的信息然后上报。举个例子:
36 |
37 | ```
38 | proc.num/name=ntpd if all(#2) == 0 then alarm()
39 | proc.num/name=crond if all(#2) == 0 then alarm()
40 | proc.num/cmdline=uic.properties if all(#2) == 0 then alarm()
41 | ```
42 |
43 | proc.num表示进程数,比如进程名叫做crond的进程,其实可以有多个。支持两种tag配置,一个是进程name,一个是配置进程cmdline,但是不能同时出现。
44 |
45 | 那现在DEV写了一个程序,我怎么知道进程名呢?
46 | 首先要拿到进程ID,然后`cat /proc/$pid/status`,看到里面的name字段了么?falcon-agent就是根据这个name字段来采集的。此处有个坑,就是这个name字段最多15个字节,所以,如果你的进程名特别长可能被截断,截断之前的原始进程名我们不管,agent以这个status文件中的name为准。所以,你配置name这个tag的时候,一定要看一眼这个status文件,从这里获取name,而不是想当然的去写一个你自认为对的进程名。
47 |
48 | 再说说cmdline,name是从`/proc/$pid/status`文件采集的,cmdline是从`/proc/$pid/cmdline`采集的。这个文件存放的是你启动进程的时候用到的命令,比如你用`java -c uic.properties`启动了一个Java进程,进程名是java,其实所有的java进程,进程名都是java,那我们是没法通过name字段做区分的。怎么办呢?此时就要求助于这个`/proc/$pid/cmdline`文件的内容了。
49 |
50 | cmdline中的内容是你的启动命令,这么说不准确,你会发现空格都没了。其实是把空格自动替换成`\0`了。不用关心,直接鼠标选中,拷贝之即可。不要自以为是的手工加空格配置到策略中哈,监控策略的tag是不允许有空格的。
51 |
52 | 上面的例子,`java -c uic.properties`在cmdline中的内容会变成:`java-cuic.properties`,无需把整个cmdline都拷贝并配置到策略中。虽然name这个tag是全匹配的,即用的`==`比较name,但是cmdline不是,我们只需要拷贝cmdline的一部分字符串,能够与其他进程区分开即可。比如上面的配置:
53 |
54 | ```
55 | proc.num/cmdline=uic.properties if all(#2) == 0 then alarm()
56 | ```
57 |
58 | 就已经OK了。falcon-agent拿到cmdline文件的内容之后会使用`strings.Contains()`方法来做判断
59 |
60 | 听起来是不是挺复杂的?呵呵,如果你的进程有端口在监听,就配置一个端口监控就可以了,无需既配置端口监控、又配置进程监控,毕竟如果进程挂了,端口肯定就不会监听了。
61 |
62 |
63 |
--------------------------------------------------------------------------------
/zh/usage/query.md:
--------------------------------------------------------------------------------
1 | # 历史数据查询
2 |
3 | 任何push到open-falcon中的数据,事后都可以通过query组件提供的API,来查询得到。
4 |
5 | ## 查询历史数据
6 | 查询过去一段时间内的历史数据,使用接口 `HTTP POST /graph/history`。该接口不能查询最新上报的两个数据点。一个python例子,如下
7 |
8 | ```python
9 | #-*- coding:utf8 -*-
10 |
11 | import requests
12 | import time
13 | import json
14 |
15 | end = int(time.time()) # 起始时间戳
16 | start = end - 3600 # 截至时间戳 (例子中为查询过去一个小时的数据)
17 |
18 | d = {
19 | "start": start,
20 | "end": end,
21 | "cf": "AVERAGE",
22 | "endpoint_counters": [
23 | {
24 | "endpoint": "host1",
25 | "counter": "cpu.idle",
26 | },
27 | {
28 | "endpoint": "host1",
29 | "counter": "load.1min",
30 | },
31 | ],
32 | }
33 |
34 | query_api = "http://127.0.0.1:9966/graph/history"
35 | r = requests.post(query_api, data=json.dumps(d))
36 | print r.text
37 |
38 | ```
39 | 其中,
40 | 1. start: 要查询的历史数据起始时间点(为UNIX时间戳形式)
41 | 2. end: 要查询的历史数据结束时间点(为UNIX时间戳形式)
42 | 3. cf: 指定的采样方式,可以选择的有:AVERAGE、MAX、MIN
43 | 4. endpoint_counters: 数组,其中每个元素为 endpoint和counter组成的键值对, 其中counter是由metric/sorted(tags)构成的,没有tags的话就是metric本身。
44 | 5. query_api: query组件的监听地址 + api
45 |
46 |
47 | ## 查询最新上报的数据
48 | 查询最新上报的一个数据点,使用接口`HTTP POST /graph/last`。一个bash的例子,如下
49 |
50 | ```bash
51 | #!/bin/bash
52 | if [ $# != 2 ];then
53 | printf "format:./last \"endpoint\" \"counter\"\n"
54 | exit 1
55 | fi
56 |
57 | # args
58 | endpoint=$1
59 | counter=$2
60 |
61 | # form request body
62 | req="[{\"endpoint\":\"$endpoint\", \"counter\":\"$counter\"}]"
63 |
64 | # request
65 | url="http://127.0.0.1:9966/graph/last"
66 | curl -s -X POST -d "$req" "$url" | python -m json.tool
67 |
68 | ```
69 |
--------------------------------------------------------------------------------
/zh/usage/rabbitmq.md:
--------------------------------------------------------------------------------
1 | # RMQ监控
2 |
3 | 在[数据采集](../philosophy/data-collect.md)一节中我们介绍了常见的监控数据源。open-falcon作为一个监控框架,可以去采集任何系统的监控指标数据,只要将监控数据组织为open-falcon规范的格式就OK了。
4 |
5 | RMQ的数据采集可以通过脚本[rabbitmq-monitor](https://github.com/iambocai/falcon-monit-scripts/tree/master/rabbitmq)来做。
6 |
7 | ## 工作原理
8 |
9 | rabbitmq-monitor是一个cron,每分钟跑一次脚本```rabbitmq-monitor.py```,其中配置了RMQ的用户名&密码等,脚本连到该RMQ实例,采集一些监控指标,比如messages_ready、messages_total、deliver_rate、publish_rate等等,然后组装为open-falcon规定的格式的数据,post给本机的falcon-agent。falcon-agent提供了一个http接口,使用方法可以参考[数据采集](../philosophy/data-collect.md)中的例子。
10 |
11 | 比如我们部署了5个RMQ实例,可以在 每个RMQ实例机器上运行一个cron,即:与RMQ实例一一对应。
12 |
--------------------------------------------------------------------------------
/zh/usage/redis.md:
--------------------------------------------------------------------------------
1 | # Redis监控
2 |
3 | 在[数据采集](../philosophy/data-collect.md)一节中我们介绍了常见的监控数据源。open-falcon作为一个监控框架,可以去采集任何系统的监控指标数据,只要将监控数据组织为open-falcon规范的格式就OK了。
4 |
5 | Redis的数据采集可以通过采集脚本[redis-monitor](https://github.com/iambocai/falcon-monit-scripts/tree/master/redis) 或者 [redismon](https://github.com/ZhuoRoger/redismon)来做。
6 |
7 | ## 工作原理
8 |
9 | redis-monitor是一个cron,每分钟跑一次采集脚本```redis-monitor.py```,其中配置了redis服务的地址,redis-monitor连到redis实例,采集一些监控指标,比如connected_clients、used_memory等等,然后组装为open-falcon规定的格式的数据,post给本机的falcon-agent。falcon-agent提供了一个http接口,使用方法可以参考[数据采集](../philosophy/data-collect.md)中的例子。
10 |
11 | 比如,我们有1000台机器都部署了Redis实例,可以在这1000台机器上分别部署1000个cron,即:与Redis实例一一对应。
12 |
--------------------------------------------------------------------------------
/zh/usage/solr.md:
--------------------------------------------------------------------------------
1 | # Solr监控
2 |
3 | 在[数据采集](../philosophy/data-collect.md)一节中我们介绍了常见的监控数据源。open-falcon作为一个监控框架,可以去采集任何系统的监控指标数据,只要将监控数据组织为open-falcon规范的格式就OK了。
4 |
5 | Solr的数据采集可以通过脚本[solr_monitor](https://github.com/shanshouchen/falcon-scripts/tree/master/solr-monitor)来做。
6 |
7 | ## 工作原理
8 |
9 | solr_monitor是一个cron,每分钟跑一次脚本```solr_monitor.py```,主要采集一些solr实例内存信息和缓存命中信息等等,然后组装为open-falcon规定的格式的数据,post给本机的falcon-agent。
10 |
11 | 脚本可以部署到Solr的各个实例,每个实例上运行一个cron,定时执行数据收集,即:与Solr实例一一对应
12 |
13 | 如果一台服务器存在多个Solr实例,可以通过修改```solr_monitor.py```中的```servers```属性,增加Solr实例的地址完成本地一对多的数据收集
14 |
--------------------------------------------------------------------------------
/zh/usage/urlooker.md:
--------------------------------------------------------------------------------
1 | ## [urlooker](https://github.com/710leo/urlooker)
2 | 监控web服务可用性及访问质量,采用go语言编写,易于安装和二次开发
3 |
4 | ## Feature
5 | - 返回状态码检测
6 | - 页面响应时间检测
7 | - 页面关键词匹配检测
8 | - 自定义Header
9 | - GET、POST、PUT访问
10 | - 自定义POST BODY
11 | - 检测结果支持推送 open-falcon
12 |
13 | ## Architecture
14 | 
15 |
16 | ## ScreenShot
17 |
18 | 
19 | 
20 |
35 |
--------------------------------------------------------------------------------
/en_0_2/api/README.md:
--------------------------------------------------------------------------------
1 | # open-falcon api
2 | - [api v0.2](http://open-falcon.com/falcon-plus/)
3 |
--------------------------------------------------------------------------------
/en_0_2/authors.md:
--------------------------------------------------------------------------------
1 |
2 |
3 | ##Authors' contributions
4 |
5 | * laiwei 来炜没睡醒@微博 / hellolaiwei@微信
6 | * 秦晓辉 UlricQin@微博 微信公众号:sa-dev,语音答疑
7 | * yubo x80386@微信
8 | * niean niean_sail@微信
9 | * 小米运维部
--------------------------------------------------------------------------------
/en_0_2/dev/README.md:
--------------------------------------------------------------------------------
1 |
2 |
3 | # Environment Preparation
4 |
5 | Please refer to [Environment Preparation](../quick_install/prepare.md)
6 | # Changing Custom Archiving Strategy
7 | Change open-falcon/graph/rrdtool/rrdtool.go
8 |
9 | 
10 | 
11 |
12 | Recompile Graph module and substitute the existing binary for a newer one
13 |
14 | Delete all previous RRD files (saved at "/home/work/data/6070/" by default)
15 |
16 | # Plugin Mechanism
17 | 1. Find a git that can store all the plugins of our company
18 | 2. Pull the Repo pulgin to local system by calling the /plugin/update port of Agent
19 | 3. Set which machine can execute which plugin in Portal
20 | 4. Plugins are named in form of "$step_xx.yy" and stored with executable permission in each directory of Repo by category
21 | 5. Print collected data to Stdout
22 | 6. Modify Agent if you find the git method inconvenient, just download zip files "plugin.tar.gz" from certain http address regularly
23 |
24 |
--------------------------------------------------------------------------------
/en_0_2/dev/support_grafana.md:
--------------------------------------------------------------------------------
1 |
2 |
3 | ## Supporting Grafana View
4 |
5 | Compared with builtin Dashboard of Open-Falcon, Grafana has flexible custom diagram. It can also set access control, add label and query information for Dashboard. Display setting of diagram is more various than before.
6 |
7 | This tutorial will help you with the look of Open-Falcon!
8 |
9 | ### Installation and Instruction
10 |
11 | Please refer to [grafana open-falcon](https://github.com/open-falcon/grafana-openfalcon-datasource)
12 |
13 |
14 | ### Acknowledges
15 | - the contribution of fastweb @kordan @masato25 and etc.
16 |
--------------------------------------------------------------------------------
/en_0_2/distributed_install/README.md:
--------------------------------------------------------------------------------
1 |
2 |
3 | # Summary
4 |
5 | Open-Falcon is a large distributed system with more than 10 modules. They can be divided by function into basic module, graph link module and alarm link module. The architecture of its installation and deployment is shown in the picture below.
6 |
7 | 
8 |
9 | ## Quick Installation on One Macine
10 |
11 | Please refer to [quick_install](../quick_install/README.md)
12 |
13 | ## Open-Falcon Installation in Docker Format
14 |
15 | Refer to:
16 | - https://github.com/open-falcon/falcon-plus/blob/master/docker/README.md
17 | - https://github.com/open-falcon/dashboard/blob/master/README.md
18 |
19 | ## Distributed Installation on Several Machines
20 |
21 | This chapter is about distributed installation on several machines. Please follow the steps to install every module.
22 |
23 | ## Video Tutorial of Installation
24 |
25 | 《[The analysis of Deployment and Architecture of Open-Falcon](http://www.jikexueyuan.com/course/1651.html)》
26 |
27 |
--------------------------------------------------------------------------------
/en_0_2/distributed_install/agent-updater.md:
--------------------------------------------------------------------------------
1 |
2 |
3 | # Agent-updater
4 |
5 | Falcon-agent needs to be deployed in every machine. If the quantity of company's machine is relatively small, it does not matter that you install falcon-agent manually using tools like pssh, ansible and fabric. But when the quantity increases, it will become a nightmare that you finish all the installation, update and rolling back manually.
6 |
7 | I personally developed a tool called Agent-updater for Falcon-agent management. Agent-updater also has a agent called ops-updater, which can be considered as a super agent that manage the agent of other agents. Ops-updater is recommended during installing. Usually, it does not require an update.
8 |
9 | For more information, please visit: https://github.com/open-falcon/ops-updater
10 |
11 | If you want to learn how to write a full project using Go language, you can also study agent-updater. I even recorded a video tutorial to show you how it is developed. The links are down below:
12 |
13 | - http://www.jikexueyuan.com/course/1336.html
14 | - http://www.jikexueyuan.com/course/1357.html
15 | - http://www.jikexueyuan.com/course/1462.html
16 | - http://www.jikexueyuan.com/course/1490.html
17 |
18 |
--------------------------------------------------------------------------------
/en_0_2/distributed_install/aggregator.md:
--------------------------------------------------------------------------------
1 |
2 |
3 | # Aggregator
4 |
5 | Cluster aggregation module aggregates the value of one specified index of all machines in one cluster, providing a monitoring experience with cluster perspective.
6 |
7 |
8 | ## Service Deployment
9 | Service deployment includes configuration changes, starting the service, testing the service, stopping the service etc. Before this, you need to unzip installation package to deployment directory of the service.
10 |
11 | ```
12 | # Change the configuration (the meaning of each setting is as follow)
13 | mv cfg.example.json cfg.json
14 | vim cfg.json
15 |
16 | # Start the service
17 | ./open-falcon start aggregator
18 |
19 | # Check the log
20 | ./open-falcon monitor aggregator
21 |
22 | # Stop the service
23 | ./open-falcon stop aggregator
24 |
25 | ```
26 |
27 |
28 | ## Configuraion Informaion
29 | The configuration file is "./cfg.json" and there will be an example configuration file "cfg.example.json" in each installation package by default. The meaning of each setting is as follows
30 |
31 | ```
32 | {
33 | "debug": true,
34 | "http": {
35 | "enabled": true,
36 | "listen": "0.0.0.0:6055"
37 | },
38 | "database": {
39 | "addr": "root:@tcp(127.0.0.1:3306)/falcon_portal?loc=Local&parseTime=true",
40 | "idle": 10,
41 | "ids": [1, -1],
42 | "interval": 55
43 | },
44 | "api": {
45 | "connect_timeout": 500,
46 | "request_timeout": 2000,
47 | "plus_api": "http://127.0.0.1:8080", #address where falcon-plus api module is running
48 | "plus_api_token": "default-token-used-in-server-side", #token used in mutual authentication with falcon-plus api module
49 | "push_api": "http://127.0.0.1:1988/v1/push" #http port of push's data provided by Agent
50 | }
51 | }
52 |
53 |
54 | ```
55 |
--------------------------------------------------------------------------------
/en_0_2/distributed_install/gateway.md:
--------------------------------------------------------------------------------
1 |
2 |
3 | # Gateway
4 |
5 | **If no problem comes up in room partition, please omit this component**。
6 |
7 | If there is something wrong with room partition and you need an urgent solution to the problem of data return in room partition, please use this component. For more information please visit [Here](https://github.com/open-falcon/falcon-plus/blob/master/modules/gateway/README.md).
--------------------------------------------------------------------------------
/en_0_2/distributed_install/prepare.md:
--------------------------------------------------------------------------------
1 |
2 |
3 | ## Environment Preparation
4 | Please refer to [Environment Preparation](../quick_install/prepare.md)
5 |
--------------------------------------------------------------------------------
/en_0_2/donate.md:
--------------------------------------------------------------------------------
https://raw.githubusercontent.com/open-falcon/book/f5ac09ca0c92d3c3d77aee4767aaab80edad1bbf/en_0_2/donate.md
--------------------------------------------------------------------------------
/en_0_2/faq/collect.md:
--------------------------------------------------------------------------------
1 |
2 |
3 | # FAQ about Data Collection
4 | Open-Falcon data collection includes [Graph Data] collection and [Alarm Data] collection. Here is how to check if the data collection works properly in these two links.
5 |
6 |
7 | ### How to check if [Graph Data] collection works properly?
8 | The data link is `agent->transfer->graph->query->dashboard`. There is a http port in Graph that can check the link `agent->transfer->graph`. For example, if the http port in Graph is 6071, then you can check by visiting:
9 |
10 | ```bash
11 | # $endpoint and $counter are variables
12 | curl http://127.0.0.1:6071/history/$endpoint/$counter
13 |
14 | # If the data are sent without tags, then you should visit
15 | curl http://127.0.0.1:6071/history/host01/agent.alive
16 |
17 | # If the data are sent with tags, then you should visit
18 | curl http://127.0.0.1:6071/history/host01/qps/module=graph,project=falcon
19 | "module=graph" and "project=falcon" are tags
20 | ```
21 | If those ports return void, that means Agent does not send data or an error occurs in Transfer.
22 |
23 |
24 | ### How to check if [Alarm Data] collection works properly?
25 |
26 | The data link is `agent->transfer->judge`. There is an http port in Judge that can check the link `agent->transfer->judge`. For example, if the http port in Judge is 6081, then you can check by visiting:
27 |
28 | ```bash
29 | curl http://127.0.0.1:6081/history/$endpoint/$counter
30 |
31 | # $endpoint and $counter are variables
32 | curl http://127.0.0.1:6081/history/host01/cpu.idle
33 |
34 | # counter=$metric/sorted($tags)
35 | # If the data are sent with tags, then you should visit
36 | curl http://127.0.0.1:6081/history/host01/qps/module=judge,project=falcon
37 | ```
38 | If those ports return void, that means Agent did not send data or an error occurs in Transfer.
39 |
40 |
--------------------------------------------------------------------------------
/en_0_2/image/OpenFalcon_wechat.jpg:
--------------------------------------------------------------------------------
https://raw.githubusercontent.com/open-falcon/book/f5ac09ca0c92d3c3d77aee4767aaab80edad1bbf/en_0_2/image/OpenFalcon_wechat.jpg
--------------------------------------------------------------------------------
/en_0_2/image/func_aggregator_1.png:
--------------------------------------------------------------------------------
https://raw.githubusercontent.com/open-falcon/book/f5ac09ca0c92d3c3d77aee4767aaab80edad1bbf/en_0_2/image/func_aggregator_1.png
--------------------------------------------------------------------------------
/en_0_2/image/func_aggregator_2.png:
--------------------------------------------------------------------------------
https://raw.githubusercontent.com/open-falcon/book/f5ac09ca0c92d3c3d77aee4767aaab80edad1bbf/en_0_2/image/func_aggregator_2.png
--------------------------------------------------------------------------------
/en_0_2/image/func_aggregator_3.png:
--------------------------------------------------------------------------------
https://raw.githubusercontent.com/open-falcon/book/f5ac09ca0c92d3c3d77aee4767aaab80edad1bbf/en_0_2/image/func_aggregator_3.png
--------------------------------------------------------------------------------
/en_0_2/image/func_aggregator_4.png:
--------------------------------------------------------------------------------
https://raw.githubusercontent.com/open-falcon/book/f5ac09ca0c92d3c3d77aee4767aaab80edad1bbf/en_0_2/image/func_aggregator_4.png
--------------------------------------------------------------------------------
/en_0_2/image/func_aggregator_5.png:
--------------------------------------------------------------------------------
https://raw.githubusercontent.com/open-falcon/book/f5ac09ca0c92d3c3d77aee4767aaab80edad1bbf/en_0_2/image/func_aggregator_5.png
--------------------------------------------------------------------------------
/en_0_2/image/func_getting_started_1.png:
--------------------------------------------------------------------------------
https://raw.githubusercontent.com/open-falcon/book/f5ac09ca0c92d3c3d77aee4767aaab80edad1bbf/en_0_2/image/func_getting_started_1.png
--------------------------------------------------------------------------------
/en_0_2/image/func_getting_started_10.png:
--------------------------------------------------------------------------------
https://raw.githubusercontent.com/open-falcon/book/f5ac09ca0c92d3c3d77aee4767aaab80edad1bbf/en_0_2/image/func_getting_started_10.png
--------------------------------------------------------------------------------
/en_0_2/image/func_getting_started_11.png:
--------------------------------------------------------------------------------
https://raw.githubusercontent.com/open-falcon/book/f5ac09ca0c92d3c3d77aee4767aaab80edad1bbf/en_0_2/image/func_getting_started_11.png
--------------------------------------------------------------------------------
/en_0_2/image/func_getting_started_12.png:
--------------------------------------------------------------------------------
https://raw.githubusercontent.com/open-falcon/book/f5ac09ca0c92d3c3d77aee4767aaab80edad1bbf/en_0_2/image/func_getting_started_12.png
--------------------------------------------------------------------------------
/en_0_2/image/func_getting_started_2.png:
--------------------------------------------------------------------------------
https://raw.githubusercontent.com/open-falcon/book/f5ac09ca0c92d3c3d77aee4767aaab80edad1bbf/en_0_2/image/func_getting_started_2.png
--------------------------------------------------------------------------------
/en_0_2/image/func_getting_started_3.png:
--------------------------------------------------------------------------------
https://raw.githubusercontent.com/open-falcon/book/f5ac09ca0c92d3c3d77aee4767aaab80edad1bbf/en_0_2/image/func_getting_started_3.png
--------------------------------------------------------------------------------
/en_0_2/image/func_getting_started_4.png:
--------------------------------------------------------------------------------
https://raw.githubusercontent.com/open-falcon/book/f5ac09ca0c92d3c3d77aee4767aaab80edad1bbf/en_0_2/image/func_getting_started_4.png
--------------------------------------------------------------------------------
/en_0_2/image/func_getting_started_5.png:
--------------------------------------------------------------------------------
https://raw.githubusercontent.com/open-falcon/book/f5ac09ca0c92d3c3d77aee4767aaab80edad1bbf/en_0_2/image/func_getting_started_5.png
--------------------------------------------------------------------------------
/en_0_2/image/func_getting_started_6.png:
--------------------------------------------------------------------------------
https://raw.githubusercontent.com/open-falcon/book/f5ac09ca0c92d3c3d77aee4767aaab80edad1bbf/en_0_2/image/func_getting_started_6.png
--------------------------------------------------------------------------------
/en_0_2/image/func_getting_started_7.png:
--------------------------------------------------------------------------------
https://raw.githubusercontent.com/open-falcon/book/f5ac09ca0c92d3c3d77aee4767aaab80edad1bbf/en_0_2/image/func_getting_started_7.png
--------------------------------------------------------------------------------
/en_0_2/image/func_getting_started_8.png:
--------------------------------------------------------------------------------
https://raw.githubusercontent.com/open-falcon/book/f5ac09ca0c92d3c3d77aee4767aaab80edad1bbf/en_0_2/image/func_getting_started_8.png
--------------------------------------------------------------------------------
/en_0_2/image/func_getting_started_9.png:
--------------------------------------------------------------------------------
https://raw.githubusercontent.com/open-falcon/book/f5ac09ca0c92d3c3d77aee4767aaab80edad1bbf/en_0_2/image/func_getting_started_9.png
--------------------------------------------------------------------------------
/en_0_2/image/func_intro_1.png:
--------------------------------------------------------------------------------
https://raw.githubusercontent.com/open-falcon/book/f5ac09ca0c92d3c3d77aee4767aaab80edad1bbf/en_0_2/image/func_intro_1.png
--------------------------------------------------------------------------------
/en_0_2/image/func_intro_2.png:
--------------------------------------------------------------------------------
https://raw.githubusercontent.com/open-falcon/book/f5ac09ca0c92d3c3d77aee4767aaab80edad1bbf/en_0_2/image/func_intro_2.png
--------------------------------------------------------------------------------
/en_0_2/image/func_intro_3.png:
--------------------------------------------------------------------------------
https://raw.githubusercontent.com/open-falcon/book/f5ac09ca0c92d3c3d77aee4767aaab80edad1bbf/en_0_2/image/func_intro_3.png
--------------------------------------------------------------------------------
/en_0_2/image/func_intro_4.png:
--------------------------------------------------------------------------------
https://raw.githubusercontent.com/open-falcon/book/f5ac09ca0c92d3c3d77aee4767aaab80edad1bbf/en_0_2/image/func_intro_4.png
--------------------------------------------------------------------------------
/en_0_2/image/func_intro_5.png:
--------------------------------------------------------------------------------
https://raw.githubusercontent.com/open-falcon/book/f5ac09ca0c92d3c3d77aee4767aaab80edad1bbf/en_0_2/image/func_intro_5.png
--------------------------------------------------------------------------------
/en_0_2/image/func_intro_6.png:
--------------------------------------------------------------------------------
https://raw.githubusercontent.com/open-falcon/book/f5ac09ca0c92d3c3d77aee4767aaab80edad1bbf/en_0_2/image/func_intro_6.png
--------------------------------------------------------------------------------
/en_0_2/image/func_intro_7.png:
--------------------------------------------------------------------------------
https://raw.githubusercontent.com/open-falcon/book/f5ac09ca0c92d3c3d77aee4767aaab80edad1bbf/en_0_2/image/func_intro_7.png
--------------------------------------------------------------------------------
/en_0_2/image/func_intro_8.png:
--------------------------------------------------------------------------------
https://raw.githubusercontent.com/open-falcon/book/f5ac09ca0c92d3c3d77aee4767aaab80edad1bbf/en_0_2/image/func_intro_8.png
--------------------------------------------------------------------------------
/en_0_2/image/func_nodata_1.png:
--------------------------------------------------------------------------------
https://raw.githubusercontent.com/open-falcon/book/f5ac09ca0c92d3c3d77aee4767aaab80edad1bbf/en_0_2/image/func_nodata_1.png
--------------------------------------------------------------------------------
/en_0_2/image/func_nodata_2.png:
--------------------------------------------------------------------------------
https://raw.githubusercontent.com/open-falcon/book/f5ac09ca0c92d3c3d77aee4767aaab80edad1bbf/en_0_2/image/func_nodata_2.png
--------------------------------------------------------------------------------
/en_0_2/image/func_nodata_3.png:
--------------------------------------------------------------------------------
https://raw.githubusercontent.com/open-falcon/book/f5ac09ca0c92d3c3d77aee4767aaab80edad1bbf/en_0_2/image/func_nodata_3.png
--------------------------------------------------------------------------------
/en_0_2/image/linkedsee_1.png:
--------------------------------------------------------------------------------
https://raw.githubusercontent.com/open-falcon/book/f5ac09ca0c92d3c3d77aee4767aaab80edad1bbf/en_0_2/image/linkedsee_1.png
--------------------------------------------------------------------------------
/en_0_2/image/linkedsee_2.png:
--------------------------------------------------------------------------------
https://raw.githubusercontent.com/open-falcon/book/f5ac09ca0c92d3c3d77aee4767aaab80edad1bbf/en_0_2/image/linkedsee_2.png
--------------------------------------------------------------------------------
/en_0_2/image/linkedsee_3.png:
--------------------------------------------------------------------------------
https://raw.githubusercontent.com/open-falcon/book/f5ac09ca0c92d3c3d77aee4767aaab80edad1bbf/en_0_2/image/linkedsee_3.png
--------------------------------------------------------------------------------
/en_0_2/image/linkedsee_4.png:
--------------------------------------------------------------------------------
https://raw.githubusercontent.com/open-falcon/book/f5ac09ca0c92d3c3d77aee4767aaab80edad1bbf/en_0_2/image/linkedsee_4.png
--------------------------------------------------------------------------------
/en_0_2/image/linkedsee_5.png:
--------------------------------------------------------------------------------
https://raw.githubusercontent.com/open-falcon/book/f5ac09ca0c92d3c3d77aee4767aaab80edad1bbf/en_0_2/image/linkedsee_5.png
--------------------------------------------------------------------------------
/en_0_2/image/practice_graph-scaling_io01.png:
--------------------------------------------------------------------------------
https://raw.githubusercontent.com/open-falcon/book/f5ac09ca0c92d3c3d77aee4767aaab80edad1bbf/en_0_2/image/practice_graph-scaling_io01.png
--------------------------------------------------------------------------------
/en_0_2/image/practice_graph-scaling_io02.png:
--------------------------------------------------------------------------------
https://raw.githubusercontent.com/open-falcon/book/f5ac09ca0c92d3c3d77aee4767aaab80edad1bbf/en_0_2/image/practice_graph-scaling_io02.png
--------------------------------------------------------------------------------
/en_0_2/image/practice_graph-scaling_io03.png:
--------------------------------------------------------------------------------
https://raw.githubusercontent.com/open-falcon/book/f5ac09ca0c92d3c3d77aee4767aaab80edad1bbf/en_0_2/image/practice_graph-scaling_io03.png
--------------------------------------------------------------------------------
/en_0_2/image/practice_graph-scaling_quantity.png:
--------------------------------------------------------------------------------
https://raw.githubusercontent.com/open-falcon/book/f5ac09ca0c92d3c3d77aee4767aaab80edad1bbf/en_0_2/image/practice_graph-scaling_quantity.png
--------------------------------------------------------------------------------
/en_0_2/image/practice_graph-scaling_rrd.png:
--------------------------------------------------------------------------------
https://raw.githubusercontent.com/open-falcon/book/f5ac09ca0c92d3c3d77aee4767aaab80edad1bbf/en_0_2/image/practice_graph-scaling_rrd.png
--------------------------------------------------------------------------------
/en_0_2/image/practice_graph-scaling_stats.png:
--------------------------------------------------------------------------------
https://raw.githubusercontent.com/open-falcon/book/f5ac09ca0c92d3c3d77aee4767aaab80edad1bbf/en_0_2/image/practice_graph-scaling_stats.png
--------------------------------------------------------------------------------
/en_0_2/philosophy/README.md:
--------------------------------------------------------------------------------
1 |
2 |
3 | # Design Intention
4 |
5 | It is about all the conceptions about the design of open-falcon.
6 |
--------------------------------------------------------------------------------
/en_0_2/philosophy/data-model.md:
--------------------------------------------------------------------------------
1 |
2 |
3 | # Data model
4 |
5 | The data model in Open-Falcon is similar to the one in OpenTSDB:metric and endpoint with a couple of key value tags. Here are two examples:
6 |
7 | ```bash
8 | {
9 | metric: load.1min,
10 | endpoint: open-falcon-host,
11 | tags: srv=falcon,idc=aws-sgp,group=az1,
12 | value: 1.5,
13 | timestamp: `date +%s`,
14 | counterType: GAUGE,
15 | step: 60
16 | }
17 | {
18 | metric: net.port.listen,
19 | endpoint: open-falcon-host,
20 | tags: port=3306,
21 | value: 1,
22 | timestamp: `date +%s`,
23 | counterType: GAUGE,
24 | step: 60
25 | }
26 | ```
27 |
28 | In those two examples, metric is the name of monitor index, endpoint is the object that is being monitoed, tags are about the attributes the monitor data, counterType is the data type defined by Open-Falcon (which can be GAUGE or COUNTER), step is the reporting cycle of monitor data, and value and timestamp arw valid monitor data.
--------------------------------------------------------------------------------
/en_0_2/practice/README.md:
--------------------------------------------------------------------------------
1 |
2 |
3 | The experience of practing Open-Falcon
4 |
--------------------------------------------------------------------------------
/en_0_2/quick_install/README.md:
--------------------------------------------------------------------------------
1 |
2 |
3 | Open-Falcon are divided into frontend structure and backend structure:
4 |
5 | - [Backend Installation](./backend.md)
6 | - [Frontend Installation](./frontend.md)
7 |
--------------------------------------------------------------------------------
/en_0_2/quick_install/backend.md:
--------------------------------------------------------------------------------
1 |
2 |
3 | ## Environment Preparation
4 |
5 | Please refer to [Environment Preparation](./prepare.md)
6 |
7 | ### Create a Working Directory
8 | ```bash
9 | export FALCON_HOME=/home/work
10 | export WORKSPACE=$FALCON_HOME/open-falcon
11 | mkdir -p $WORKSPACE
12 | ```
13 |
14 | ### Unzip the Binary Pack
15 | ```bash
16 | tar -xzvf open-falcon-v0.2.1.tar.gz -C $WORKSPACE
17 | ```
18 |
19 | ### Execute All the Backend Modules on One Machine
20 |
21 | # First, make sure that the username and password in the configuration file of database are valid, or the configuration file should be edited.
22 | ```
23 | cd $WORKSPACE
24 | grep -Ilr 3306 ./ | xargs -n1 -- sed -i 's/root:/real_user:real_password/g'
25 | ```
26 | # Execute
27 | ```bash
28 | cd $WORKSPACE
29 | ./open-falcon start
30 |
31 | # check the startup of all the modules
32 | ./open-falcon check
33 |
34 | ```
35 |
36 | ### More usage of command line tools
37 | ```bash
38 | # ./open-falcon [start|stop|restart|check|monitor|reload] module
39 | ./open-falcon start agent
40 |
41 | ./open-falcon check
42 | falcon-graph UP 53007
43 | falcon-hbs UP 53014
44 | falcon-judge UP 53020
45 | falcon-transfer UP 53026
46 | falcon-nodata UP 53032
47 | falcon-aggregator UP 53038
48 | falcon-agent UP 53044
49 | falcon-gateway UP 53050
50 | falcon-api UP 53056
51 | falcon-alarm UP 53063
52 |
53 | For debugging , You can check $WorkDir/$moduleName/log/logs/xxx.log
54 | ```
55 |
--------------------------------------------------------------------------------
/en_0_2/quick_install/prepare.md:
--------------------------------------------------------------------------------
1 |
2 |
3 | # Environment Preparation
4 |
5 | ### Install Redis
6 | yum install -y redis
7 |
8 | ### Install MySQL
9 | yum install -y mysql-server
10 |
11 | **Attention: Make sure Redis and MySQL are enabled.**
12 |
13 | ### Initialize the Structure of MySQL List
14 |
15 | ```
16 | cd /tmp/ && git clone https://github.com/open-falcon/falcon-plus.git
17 | cd /tmp/falcon-plus/scripts/mysql/db_schema/
18 | mysql -h 127.0.0.1 -u root -p < 1_uic-db-schema.sql
19 | mysql -h 127.0.0.1 -u root -p < 2_portal-db-schema.sql
20 | mysql -h 127.0.0.1 -u root -p < 3_dashboard-db-schema.sql
21 | mysql -h 127.0.0.1 -u root -p < 4_graph-db-schema.sql
22 | mysql -h 127.0.0.1 -u root -p < 5_alarms-db-schema.sql
23 | rm -rf /tmp/falcon-plus/
24 | ```
25 |
26 | **If you update v0.1.0 to the current v0.2.0,you only need to execute the following command:**
27 |
28 | ```
29 | mysql -h 127.0.0.1 -u root -p < 5_alarms-db-schema.sql
30 | ```
31 |
32 | # Compile from the Source Code
33 |
34 | First, make sure you have installed golang environment. If not, please refer to https://golang.org/doc/install
35 |
36 | ```
37 | cd $GOPATH/src/github.com/open-falcon/falcon-plus/
38 |
39 | # make all modules
40 | make all
41 |
42 | # pack all modules
43 | make pack
44 |
45 | ```
46 |
47 | Then you will get a zipped pack of open-falcon-v0.2.0.tar.gz in the current directory, which means the compilation and packaging are successfully finished.
48 |
49 | # Download the Compiled Binary Version
50 |
51 | If you do not want to compile by yourself, you can download the compiled [Binary Version(x86 64-bit system)](https://github.com/open-falcon/falcon-plus/releases)。
52 |
53 |
54 | The preparation is finished until this step. Unzip the binary pack open-falcon-v0.2.0.tar.gz in appropriate directory and save it for later use.
55 |
--------------------------------------------------------------------------------
/en_0_2/styles/website.css:
--------------------------------------------------------------------------------
1 | /* CSS for website */
2 | h1 , h2{
3 | border-bottom: 1px solid #EFEAEA;
4 | padding-bottom: 3px;
5 | }
6 | .markdown-section>:first-child {
7 | margin-top: 0!important;
8 | }
9 | .markdown-section blockquote:last-child {
10 | margin-bottom: 0.85em!important;
11 | }
12 | .page-wrapper {
13 | margin-top: -1.275em;
14 | }
15 | .book .book-body .page-wrapper .page-inner section.normal {
16 | min-height:350px;
17 | margin-bottom: 30px;
18 | }
19 |
20 | .book .book-body .page-wrapper .page-inner section.normal hr {
21 | height: 0px;
22 | padding: 0;
23 | margin: 1.7em 0;
24 | overflow: hidden;
25 | background-color: #e7e7e7;
26 | border-bottom: 1px dotted #e7e7e7;
27 | }
28 |
29 | .video-js {
30 | width:100%;
31 | height: 100%;
32 | }
33 |
34 | pre[class*="language-"] {
35 | border: none;
36 | background-color: #f7f7f7;
37 | font-size: 1em;
38 | line-height: 1.2em;
39 | }
40 |
41 | .book .book-body .page-wrapper .page-inner section.normal {
42 | font-size: 14px;
43 | font-family: "ubuntu", "Tahoma", "Microsoft YaHei", arial, sans-serif;
44 | }
45 |
46 | .aceCode {
47 | font-size: 14px !important;
48 | }
49 |
50 | input[type=checkbox]{
51 | margin-left: -2em;
52 | }
53 |
54 | .page-footer span{
55 | font-size: 12px;
56 | }
57 |
58 | .page-footer .copyright {
59 | float: left;
60 | }
61 |
62 | .body, html {
63 | overflow-y: hidden;
64 | }
65 |
66 | .versions-select select {
67 | height: 2em;
68 | line-height: 2em;
69 | border-radius: 4px;
70 | background: #efefef;
71 | }
72 |
73 |
--------------------------------------------------------------------------------
/en_0_2/usage/README.md:
--------------------------------------------------------------------------------
1 |
2 |
3 | User's Manual of Open-falcon
4 |
5 |
--------------------------------------------------------------------------------
/en_0_2/usage/docker.md:
--------------------------------------------------------------------------------
1 |
2 |
3 |
4 | # Practice of Monitoring Docker Container
5 |
6 | In [Data Collection](../philosophy/data-collect.md), we introduced the common data sources. As a monitor framework, Open-Falcon can collect the monitor index data of any system as long as they are converted to the standard format of Open-Falcon.
7 |
8 | The data collection of docker container can be done through [micadvisor_open](https://github.com/open-falcon/micadvisor_open).
9 |
10 | ## Working Principle
11 |
12 | Micadvisor-open is a module for monitoring the resource of docker container based on Open-Falcon. The data of CPU, memory, diskio and networkio will be pushed to Open-Falcon after being collected.
13 |
14 | ## Collected Index
15 |
16 | | Counters | Notes|
17 | |-----|------|
18 | |cpu.busy|percentage of cpu usage|
19 | |cpu.user|user-mode percentage of cpu usage|
20 | |cpu.system|kernel-mode percentage of cpu usage|
21 | |cpu.core.busy|usage of each cpu|
22 | |mem.memused.percent|percentage of memory usage|
23 | |mem.memused|amount of memory usage|
24 | |mem.memtotal|total amount of memory|
25 | |mem.memused.hot|hot usage of cpu|
26 | |disk.io.read_bytes|bytes diskio reads|
27 | |disk.io.write_bytes|bytes diskio write|
28 | |net.if.in.bytes|incoming bytes of networkio|
29 | |net.if.in.packets|incoming packets of networkio|
30 | |net.if.in.errors|incoming errors of networkio|
31 | |net.if.in.dropped|incoming droppings of networkio|
32 | |net.if.out.bytes|outgoing bytes of networkio|
33 | |net.if.out.packets|outgoing packets of networkio|
34 | |net.if.out.errors|outgoing errors of networkio|
35 | |net.if.out.dropped|outgoing droppings of networkio|
36 |
37 | ## Contributors
38 | - mengzhuo: QQ:296142139; MAIL:mengzhuo@xiaomi.com
39 |
40 | ## Complementary Information
41 | - The lib database collected by another docker metric: https://github.com/projecteru/eru-metric
42 |
43 |
--------------------------------------------------------------------------------
/en_0_2/usage/du-proc.md:
--------------------------------------------------------------------------------
1 |
2 |
3 |
4 | # Practice of monitoring directory size and process detail
5 |
6 | To collect the data of directory size and process details, we can use the scripts [falcon-scripts](https://github.com/ZoneTong/falcon-scripts)
7 |
8 | ## Collected Index
9 |
10 | Below is the metrics:
11 |
12 | | METRIC | NOTE |
13 | |--------|------|
14 | |du.bytes.used|directory size, byte|
15 | |proc.cpu|process cpu, percent|
16 | |proc.mem|process memory, byte|
17 | |proc.io.in|process io input, byte|
18 | |proc.io.out|process io output, byte|
19 |
20 | ## Working Principle
21 |
22 | du.sh collects data by command du
23 |
24 | proc.sh analyzes the data in /proc/$PID/status /proc/$PID/io and etc.
25 |
--------------------------------------------------------------------------------
/en_0_2/usage/flume.md:
--------------------------------------------------------------------------------
1 |
2 |
3 | # Flume Monitor
4 |
5 | In [Data Collection](../philosophy/data-collect.md), we introduced the common data sources. As a monitor framework, Open-Falcon can collect the monitor index data of any system as long as they are converted to the standard format of Open-Falcon.
6 |
7 | The data collection of Flume can be done through [flume-monitor](https://github.com/mdh67899/openfalcon-monitor-scripts/tree/master/flume).
8 |
9 | ## Working Principle
10 | ```flume-monitor.py``` is a collecting script. Users only need to put it in the Plugin directory of the Falcon-Agent and bind corresponding pluging to the hostgroup in Portal. Falcon-agent automatically execute the script ```flume-monitor.py```. After the execution of the script, the result data of ```flume-monitor.py``` is output in json format which is read analysed by Falcon-Agent.
11 |
12 | Java environment varible is supposed to be added in the configuration file when Flume is running. After booting up, Flume process will provide a monitor port. Users can collect the metrics provided by flume through http request. The script ```flume-monitor.py``` configures the Flume metric that needs to be collected, the module information that needs to be collected from flume port through http method, and output data in json format.
13 |
14 | If we deploy three flumes on one machine, users can copy the script to three, edit the address of ```http url```, which makes it corresponding to the http port that flume monitors, and bind the plugin in Protal.
15 |
--------------------------------------------------------------------------------
/en_0_2/usage/haproxy.md:
--------------------------------------------------------------------------------
1 |
2 |
3 | #HAProxy Monitor
4 |
5 | In [Data Collection](../philosophy/data-collect.md), we introduced the common data sources. As a monitor framework, Open-Falcon can collect the monitor index data of any system as long as they are converted to the standard format of Open-Falcon.
6 |
7 | The data collection of HAProxy can be done through [haproxymon](https://github.com/iask/haproxymon).
8 |
9 | ## Working Principle
10 |
11 | Haproxymon is a cron that execute the collecting script ```haproxymon.py``` every minute. Haproxymon collects the basic state information of Haproxy, like qcur, scur and rate and etc., through the state socket of Haporxy, encapsulate them in the format that is suitable for Open-Falcon, and post them to the local falcon-agent. Falcon-Agent provides an http port. You can refer to [Data Collection](../philosophy/data-collect.md) for its use.
--------------------------------------------------------------------------------
/en_0_2/usage/jmx.md:
--------------------------------------------------------------------------------
1 |
2 |
3 | # Jmxmon Introduction
4 | Jmxmon is a jmx monitor module based on Open-falcon. Along with the agent of open-falcon, it can collect the service state of any java process whose JMX service port is open and push the collected data to the service of Open-falcon.
5 |
6 | ## Main Feature
7 |
8 | Collecting jvm information of java process through jmx, including gc time consuming, gc frequency, gc throughput, utilization rate of old generation, size of new generation promotion, active threads and etc.。
9 |
10 | It does not hack the code of programm and cost little resources in the system.
11 |
12 |
13 | ## Collected Metrics
14 | | Counters | Type | Notes|
15 | |-----|------|------|
16 | | parnew.gc.avg.time | GAUGE | average time consuming of each YoungGC(parnew) in a minute|
17 | | concurrentmarksweep.gc.avg.time | GAUGE | average time consuming of each CMSGC in a minute|
18 | | parnew.gc.count | GAUGE | counter of the YoungGC(parnew) in a minute |
19 | | concurrentmarksweep.gc.count | GAUGE | ounter of the CMSGC in a minute |
20 | | gc.throughput | GAUGE | total traffic ratio of GC (application running time/process total running time) |
21 | | new.gen.promotion | GAUGE | size of the new generation memory promotion in a minute |
22 | | new.gen.avg.promotion | GAUGE | average size of all new generation memory promotion in a minute |
23 | | old.gen.mem.used | GAUGE | memory usage of old generation老年代的内存使用量 |
24 | | old.gen.mem.ratio | GAUGE | memory usage percentage of old generation |
25 | | thread.active.count | GAUGE | number of currently active thread |
26 | | thread.peak.count | GAUGE | peak number of thread |
27 |
28 | ## Recommended Metrics in Monitor Alarm
29 |
30 | The alarm metric and the threshold can be congifured flexibility according to their different features.
31 |
32 | | Metric | Condition | Note|
33 | |-----|------|------|
34 | | gc.throughput | all(#3)<98 | gc thtoughput rate stays below 98% will affect the performance |
35 | | old.gen.mem.ratio | all(#3)>90 | it needs to be optimized that the old generation memory usage 10 over 90% |
36 | | thread.active.count | all(#3)>500 | too many threads will affect the performance |
37 |
38 |
39 | # Help
40 | Please visit [jmxmon](https://github.com/toomanyopenfiles/jmxmon) for more detailed instruction.
41 |
42 |
--------------------------------------------------------------------------------
/en_0_2/usage/lvs.md:
--------------------------------------------------------------------------------
1 |
2 |
3 | # Lvs-metrics Introduction
4 | Lvs-metrics is a LVS monitor module based on Open-falcon. Along with the agent and transfer of open-falcon, it can collect the state data of LVS service and push the collected data to the service of Open-falcon.
5 |
6 | ## Main Feature
7 |
8 | Collecting the monitor data of LVS service through open source ipvs/netlink database from google and the files in proc, including the connection number of all the VIPs (active/inactive), the connection number of all the LVS machines (active/inactive) and the data size (packets) in the data traffic.
9 |
10 | It does not hack the code of programm and cost little resources in the system.
11 |
12 |
13 | ## Collected Metrics
14 |
15 | | Counters | Type | Notes |
16 | |-----|-----|-----|
17 | | lvs.in.bytes | GUAGE | network in bytes per host |
18 | | lvs.out.bytes | GUAGE | network out bytes per host |
19 | | lvs.in.packets | GUAGE | network in packets per host |
20 | | lvs.out.packets | GUAGE | network out packets per host |
21 | | lvs.total.conns | GUAGE | lvs total connections per vip now |
22 | | lvs.active.conn | GUAGE | lvs active connections per vip now |
23 | | lvs.inact.conn | GUAGE | lvs inactive connections per vip now |
24 | | lvs.realserver.num | GUAGE | lvs live realserver num per vip now |
25 | | lvs.vip.conns | COUNTER | lvs conns counter from service start per vip |
26 | | lvs.vip.inbytes | COUNTER | lvs inbytes counter from service start per vip |
27 | | lvs.vip.outbytes | COUNTER | lvs outpkts counter from service start per vip |
28 | | lvs.vip.inpkts | COUNTER | lvs inpkts counter from service start per vip |
29 | | lvs.vip.outpkts | COUNTER | lvs outpkts counter from service start per vip |
30 |
31 |
32 | # Help
33 | Please visit [lvs-metrics](https://github.com/mesos-utility/lvs-metrics) for more detailed instruction.
34 |
35 |
--------------------------------------------------------------------------------
/en_0_2/usage/memcache.md:
--------------------------------------------------------------------------------
1 |
2 |
3 | # Memcache Monitor
4 |
5 | In [Data Collection](../philosophy/data-collect.md), we introduced the common data sources. As a monitor framework, Open-Falcon can collect the monitor index data of any system as long as they are converted to the standard format of Open-Falcon.
6 |
7 | The data collection of Flume can be done through the script [memcached-monitor](https://github.com/iambocai/falcon-monit-scripts/tree/master/memcached).
8 |
9 | ## Working Principle
10 |
11 | Memcached-monitor is a cron. It executes the script ```memcached-monitor.py``` once a minute that will automatically detect the port of Memcached , connect Memcached instance and collect some monitor metrics, like get_hit_ratio, usage and etc. Next, it convert the data to the format that is suitable for the Open-Falcon and post them to local falcon-agent. Falcon-agent provides an http port, and you can refer to the examples in [Data Collection](../philosophy/data-collect.md).
12 |
13 | For example, if we deploy a Memcached instance in each of the 1000 machines, then we can deploy a cron instance in each machine that matches every Memcached instance.
14 |
15 | What needs to be clarified is that the script ```memcached-monitor.py``` automatically finds Memcached port through ```ps -ef |grep memcached|grep -v grep |sed -n 's/.* *-p *\([0-9]\{1,5\}\).*/\1/p``` If user does not specify a port by configuring parameter ```-p``` when starting Memcached , the automatic detect of port will fail and user has to edit the script manually and specify a port.
--------------------------------------------------------------------------------
/en_0_2/usage/mesos.md:
--------------------------------------------------------------------------------
1 |
2 |
3 | # Mesos Monitor
4 |
5 | Mesos.py is a script of Open-Falcon developed by leancloud. Along with the Agent/Transfer of Open-Falcon, it can collect mesos data and automatically send them to the service of Open-Falcon.
6 |
7 | [https://github.com/leancloud/satori/tree/master/satori-rules/plugin/mesos](https://github.com/leancloud/satori/tree/master/satori-rules/plugin/mesos)
8 |
--------------------------------------------------------------------------------
/en_0_2/usage/mymon.md:
--------------------------------------------------------------------------------
1 |
2 |
3 | # MySQL Monitor
4 |
5 | In [Data Collection](../philosophy/data-collect.md), we introduced the common data sources. As a monitor framework, Open-Falcon can collect the monitor index data of any system as long as they are converted to the standard format of Open-Falcon.
6 |
7 | The data collection of MySQL can be done through [mymon](https://github.com/open-falcon/mymon).
8 |
9 | ## Working Principle
10 |
11 | Mymon is a cron that runs every minute. Its configuration has a database address. Mymon will be connected to that database and collect the state data, like global status, global variables, slave status and etc. Next it encapsulates them in the format that is suitable for Open-Falcon and post them to the local falcon-agent. Falcon-Agent provides an http port. You can refer to [Data Collection](../philosophy/data-collect.md) for its use.
12 |
13 | If we deploy a MySQL instance in each on our 1000 machines, then we can deploy a cron in each machine, which means the database and the instance are matched one-to-one.
14 |
15 | ## Complementary Information
16 | ***Instance of Remote MySQL Monitor ***
17 | If you want to collect the MySQL metric data of Host B through the mymon of Host A, here is the resolution: set the Endpoint configuration in mymon of Host A to the machine name of Host B and set the MySQL configuration to the MySQL instance of Host B. User needs to find the metric that is corresponding to the machine name of Host B while viewing MySQL metric and adding strategy to MySQL metric.
--------------------------------------------------------------------------------
/en_0_2/usage/ngx_metric.md:
--------------------------------------------------------------------------------
1 |
2 |
3 | # Nginx Monitor
4 |
5 | In [Data Collection](../philosophy/data-collect.md), we introduced the common data sources. As a monitor framework, Open-Falcon can collect the monitor index data of any system as long as they are converted to the standard format of Open-Falcon.
6 |
7 | The data collection of Nginx can be done through [ngx_metric](https://github.com/GuyCheung/falcon-ngx_metric).
8 |
9 | # Working Principle
10 | Ngx_metric achieves the real-time analysis of nginx through the `log_by_lua` feature in lua-nginx-module, and save the intermediate result through `ngx.shared.DICT`. Finally extract the intermediate result, calculate, format and output the final result through external python script. The result in Falcon output format can be directly pushed to Falcon-Agent.
11 |
12 | # Help
13 |
14 | For detailed instruction please wisit [ngx_metric](https://github.com/GuyCheung/falcon-ngx_metric).
15 |
--------------------------------------------------------------------------------
/en_0_2/usage/query.md:
--------------------------------------------------------------------------------
1 |
2 |
3 | # History Data Query
4 |
5 | Any data pushed to Open-falcon can be queried through restAPI provided by API module.
6 |
7 | For more inforamtion, please refer to [API file](http://open-falcon.com/falcon-plus/#/graph_histroy).
8 |
--------------------------------------------------------------------------------
/en_0_2/usage/rabbitmq.md:
--------------------------------------------------------------------------------
1 |
2 |
3 | ##RabbitMQ monitoring
4 |
5 | We have introduced the usual monitoring data source in section Data Collection. As a monitoring frame, open-falcon can collect monitoring index data in any system and it just need to organize the monitoring data to the normative format of open-falcon
6 |
7 | The data of RMQ can be collected by script rabbitmq-monitor.
8 |
9 | ##Operating principle
10 |
11 | rabbitmq-monitor is a cron, and the script ```rabbitmq-monitor.py``` is run every minute, wherein RMQ username and password and so on are deployed. The script connects to the RMQ instance and collect some monitoring index such as messages_ready, messages_total, deliver_rate, publish_rate and so on, and then assemble to the normative format of open-falcon to post to the host falcon-agent.
12 |
13 | Falcon-agent provides a http interface, and as for the using method, please refer to the instances in Data Collection.
14 |
15 | For example, we deployed 5 RMQ instance, and a cron can be run in every RMQ machine, i.e. it is one-to-one corresponded to the Memcached instance.
16 |
--------------------------------------------------------------------------------
/en_0_2/usage/redis.md:
--------------------------------------------------------------------------------
1 |
2 |
3 | # Redis Monitor
4 |
5 | In [Data Collection](../philosophy/data-collect.md), we introduced the common data sources. As a monitor framework, Open-Falcon can collect the monitor index data of any system as long as they are converted to the standard format of Open-Falcon.
6 |
7 | The data collection of Redis can be done through the script [redis-monitor](https://github.com/iambocai/falcon-monit-scripts/tree/master/redis) or [redismon](https://github.com/ZhuoRoger/redismon).
8 |
9 | ## Working Principle
10 |
11 | Redis-monitor is a cron that runs the script ```redis-monitor.py``` every minute. Its configuration has the address of redis service. Redis-monitor will be connected to redis instance and collect the monitor data, like connected_clients, used_memory and etc. Next it encapsulates them in the format that is suitable for Open-Falcon and post them to the local falcon-agent. Falcon-Agent provides an http port. You can refer to [Data Collection](../philosophy/data-collect.md) for its use.
12 |
13 | For example, if we deploy a Redis instance in each of the 1000 machines, then we can deploy a cron in each of the 1000 machine. Therefore, Redis instance and cron matches one-to-one.
14 |
--------------------------------------------------------------------------------
/en_0_2/usage/solr.md:
--------------------------------------------------------------------------------
1 |
2 |
3 | # Solr Monitor
4 |
5 | In [Data Collection](../philosophy/data-collect.md), we introduced the common data sources. As a monitor framework, Open-Falcon can collect the monitor index data of any system as long as they are converted to the standard format of Open-Falcon.
6 |
7 | The data collection of solr can be done through the script [solr_monitor](https://github.com/shanshouchen/falcon-scripts/tree/master/solr-monitor).
8 |
9 | ## Working Principle
10 |
11 | Solr-monitor is a cron that runs the script ```solr_monitor.py``` every minute. It mainly collects the information of solr instance memory, cache hit and etc. Next it encapsulates them in the format that is suitable for Open-Falcon and post them to the local falcon-agent.
12 |
13 | The script can be deployed in each Solr instance with a cron that collects the data reguarly. Therefore, Solr instance and cron matches one-to-one.
14 |
15 | If a server has multiple solr instances, user can change the ```servers``` property in ```solr_monitor.py``` to add the address of Solr instance to realize the local one-to-many data collection.
16 |
--------------------------------------------------------------------------------
/en_0_2/usage/urlooker.md:
--------------------------------------------------------------------------------
1 |
2 |
3 | ## [urlooker](https://github.com/710leo/urlooker)
4 | -Urlooker, which is written in Go language, monitors the availability of Web service and the visit quality and it is easy to install and redevelop.
5 |
6 | ## Feature
7 | - status code
8 | - respose time
9 | - page keyword
10 | - customize header
11 | - customize post body
12 | - support get post put method
13 | - send to open-falcon、statsd、prometheus
14 |
15 | ## Architecture
16 | 
17 |
18 | ## ScreenShot
19 |
20 | 
21 | 
22 | 
23 |
24 | ## FAQ
25 | - [wiki](https://github.com/710leo/urlooker/wiki)
26 | - [FAQ](https://github.com/710leo/urlooker/wiki/FAQ)
27 | - default user/password:admin/password
28 |
29 | ## Install
30 | ##### install by docker
31 |
32 | ```bash
33 | git clone https://github.com/710leo/urlooker.git
34 | cd urlooker
35 | docker build .
36 | docker volume create urlooker-vol
37 | docker run -p 1984:1984 -d --name urlooker --mount source=urlooker-vol,target=/var/lib/mysql --restart=always [CONTAINER ID]
38 | ```
39 |
40 | ##### install by code
41 | ```bash
42 | # install dependence
43 | yum install -y mysql-server
44 | wget https://raw.githubusercontent.com/710leo/urlooker/master/sql/schema.sql
45 | mysql -h 127.0.0.1 -u root -p < schema.sql
46 |
47 | curl https://raw.githubusercontent.com/710leo/urlooker/master/install.sh|bash
48 | cd $GOPATH/src/github.com/710leo/urlooker
49 |
50 | # change [mysql root password]to your mysql root password
51 | sed -i 's/urlooker.pass/[mysql root password]/g' configs/web.yml
52 |
53 | ./control start all
54 | ```
55 |
56 | open http://127.0.0.1:1984 in browser
57 |
58 | ## Q&A
59 | Gitter: [urlooker](https://gitter.im/urllooker/community)
60 |
--------------------------------------------------------------------------------
/en_0_2/usage/win.md:
--------------------------------------------------------------------------------
1 |
2 |
3 | # Windows System Monitor
4 |
5 | In [Data Collection](../philosophy/data-collect.md), we introduced the common data sources. As a monitor framework, Open-Falcon can collect the monitor index data of any system as long as they are converted to the standard format of Open-Falcon.
6 |
7 | The running data collection of Windows system, like memory usage, Cpu usage, disk usage, data traffic, and etc., can be done every minute through a Python script in scheduled tasks of Windows.s
8 |
9 | The following monitor programs can collect the monitor metrics of machiens with Windows system:
10 |
11 | - [windows_collect](https://github.com/freedomkk-qfeng/falcon-scripts/tree/master/windows_collect):python script
12 | - [windows-agent](https://github.com/LeonZYang/agent): Agent realized in Go language
13 | - [Windows-Agent](https://github.com/AutohomeRadar/Windows-Agent):Agent executes as a Windows service open-sourced by AutoHome realized in Python
14 | - [windows-agent](https://github.com/freedomkk-qfeng/windows-agent):another Windows-Agent realized in Go language supporting port monitor, process monitor and service running in the background
15 |
16 |
--------------------------------------------------------------------------------
/plugins.txt:
--------------------------------------------------------------------------------
1 | versions-select
2 | splitter
3 | tbfed-pagefooter
4 | expandable-chapters-small
5 | sectionx
6 | github-buttons
7 | ace
8 | simple-page-toc
9 | anchors
10 | todo
11 | alerts
12 | emphasize
13 | anchor-navigation-ex
14 | ad
15 |
--------------------------------------------------------------------------------
/zh/GLOSSARY.md:
--------------------------------------------------------------------------------
https://raw.githubusercontent.com/open-falcon/book/f5ac09ca0c92d3c3d77aee4767aaab80edad1bbf/zh/GLOSSARY.md
--------------------------------------------------------------------------------
/zh/README.md:
--------------------------------------------------------------------------------
1 | # 欢迎加入Open-Falcon社区
2 |
3 | 在大家的热心支持和帮助下,[Open-Falcon](https://github.com/open-falcon/of-release)在一天天成长。目前:
4 |
5 | 1. 半年多时间,在github上取得了1300+ star
6 | 1. 收到了几十个pull-request,上百个issue,用户讨论组成员4000+。
7 | 1. 社区成员贡献了包括MySQL、redis、rabbitmq、windows-agent、switch-agent、nginx-stats 等多种插件支持,以及文档支持
8 | 1. 上百家互联网公司都在不同程度的使用Open-Falcon,包括不限于:美团、金山云、快网、宜信、七牛、又拍云、赶集、滴滴、金山办公、爱奇艺、一点资讯、快牙、开心网、借贷宝、百度、迅雷等等
9 |
10 | NOTICE:
11 |
12 | 1. QQ群已全部满员,请添加我的微信 `laiweivic` ,注明个人介绍和来源自open-falcon,我会拉你进入交流群组;
13 | 2. 我们更推荐您升级到[夜莺监控](https://github.com/ccfos/nightingale): 关于open-falcon和夜莺的对比介绍,请参考阅读[云原生监控的十个特点和趋势](https://mp.weixin.qq.com/s?__biz=MzkzNjI5OTM5Nw==&mid=2247483738&idx=1&sn=e8bdbb974a2cd003c1abcc2b5405dd18&chksm=c2a19fb0f5d616a63185cd79277a79a6b80118ef2185890d0683d2bb20451bd9303c78d083c5#rd);
14 |
15 |
16 | 请大家优先在 github 上提交 [issue](https://github.com/open-falcon/falcon-plus/issues), 方便问题沉淀,github issue 会最高优先级解决。
17 | - QQ五群:42607978 (已满员)
18 | - QQ四群:697503992 (已满员)
19 | - QQ一群:373249123 (已满员)
20 | - QQ二群:516088946 (已满员)
21 | - QQ三群:469342415 (已满员)
22 |
23 |
24 | ----
25 |
26 |
27 |
28 | ----
29 | 该文档的[英文版本](http://book.open-falcon.com/en/index.html)由[宋立岭](https://github.com/songliling)翻译和维护,非常感谢!
30 |
--------------------------------------------------------------------------------
/zh/api/README.md:
--------------------------------------------------------------------------------
1 | # open-falcon api
2 |
3 | 请移步[docs.openfalcon.apiary.io](http://docs.openfalcon.apiary.io)
4 |
--------------------------------------------------------------------------------
/zh/authors.md:
--------------------------------------------------------------------------------
1 | - [laiwei](https://github.com/laiwei) 来炜没睡醒@微博 / hellolaiwei@微信
2 | - [秦晓辉](http://ulricqin.com) UlricQin@微博 微信公众号:sa-dev,语音答疑
3 | - [yubo](https://github.com/yubo) x80386@微信
4 | - [niean](https://github.com/niean) niean_sail@微信
5 | - [小米运维部](http://noops.me)
6 |
--------------------------------------------------------------------------------
/zh/dev/README.md:
--------------------------------------------------------------------------------
1 | # go开发环境搭建
2 | ```bash
3 | cd ~
4 | wget http://dinp.qiniudn.com/go1.4.1.linux-amd64.tar.gz
5 | tar zxf go1.4.1.linux-amd64.tar.gz
6 | mkdir -p workspace/src
7 |
8 | echo "" >> .bashrc
9 | echo 'export GOROOT=$HOME/go' >> .bashrc
10 | echo 'export GOPATH=$HOME/workspace' >> .bashrc
11 | echo 'export PATH=$GOROOT/bin:$GOPATH/bin:$PATH' >> .bashrc
12 | echo "" >> .bashrc
13 |
14 | source .bashrc
15 | ```
16 |
17 | # clone代码
18 |
19 | ```bash
20 | cd $GOPATH/src
21 | mkdir github.com
22 | cd github.com
23 | git clone --recursive https://github.com/XiaoMi/open-falcon.git
24 | ```
25 |
26 | # 编译一个组件(以agent为例)
27 | ```bash
28 | cd $GOPATH/src/github.com/open-falcon/agent
29 | go get ./...
30 | ./control build
31 | ```
32 |
33 | # 自定义修改归档策略
34 | 修改open-falcon/graph/rrdtool/rrdtool.go
35 |
36 | 
37 | 
38 |
39 | 重新编译graph组件,并替换原有的二进制
40 |
41 | 清理掉原来的所有rrd文件(默认在/home/work/data/6070/下面)
42 |
43 | # 插件机制
44 | 1. 找一个git存放公司的所有插件
45 | 2. 通过调用agent的/plugin/update接口拉取插件repo到本地
46 | 3. 在portal中配置哪些机器可以执行哪些插件
47 | 4. 插件命名方式:$step_xx.yy,需要有可执行权限,分门别类存放到repo的各个目录
48 | 5. 把采集到的数据打印到stdout
49 | 6. 如果觉得git方式不方便,可以改造agent,定期从某个http地址下载打包好的plugin.tar.gz
50 |
51 |
--------------------------------------------------------------------------------
/zh/dev/change_graph_rra.md:
--------------------------------------------------------------------------------
1 | ## 修改绘图曲线精度
2 |
3 | 默认的,Open-Falcon只保存最近12小时的原始监控数据,12小时之后的数据被降低精度、采样存储。
4 |
5 | 如果默认的精度不能满足你的需求,可以按照如下步骤,修改绘图曲线的存储精度。
6 |
7 | #### 第一步,修改graph组件的RRA,并重新编译graph组件
8 | graph组件的RRA,定义在文件 graph/rrdtool/[rrdtool.go](https://github.com/open-falcon/graph/blob/master/rrdtool/rrdtool.go#L57)中,默认如下:
9 |
10 | ```golang
11 | // RRA.Point.Size
12 | const (
13 | RRA1PointCnt = 720 // 1m一个点存12h
14 | RRA5PointCnt = 576 // 5m一个点存2d
15 | // ...
16 | )
17 |
18 | func create(filename string, item *cmodel.GraphItem) error {
19 | now := time.Now()
20 | start := now.Add(time.Duration(-24) * time.Hour)
21 | step := uint(item.Step)
22 |
23 | c := rrdlite.NewCreator(filename, start, step)
24 | c.DS("metric", item.DsType, item.Heartbeat, item.Min, item.Max)
25 |
26 | // 设置各种归档策略
27 | // 1分钟一个点存 12小时
28 | c.RRA("AVERAGE", 0.5, 1, RRA1PointCnt)
29 |
30 | // 5m一个点存2d
31 | c.RRA("AVERAGE", 0.5, 5, RRA5PointCnt)
32 | c.RRA("MAX", 0.5, 5, RRA5PointCnt)
33 | c.RRA("MIN", 0.5, 5, RRA5PointCnt)
34 |
35 | // ...
36 |
37 | return c.Create(true)
38 | }
39 |
40 | ```
41 |
42 | 比如,你只想保存90天的原始数据,可以将代码修改为:
43 |
44 | ```golang
45 | // RRA.Point.Size
46 | const (
47 | RRA1PointCnt = 129600 // 1m一个点存90d,取值 90*24*3600/60
48 | )
49 |
50 | func create(filename string, item *cmodel.GraphItem) error {
51 | now := time.Now()
52 | start := now.Add(time.Duration(-24) * time.Hour)
53 | step := uint(item.Step)
54 |
55 | c := rrdlite.NewCreator(filename, start, step)
56 | c.DS("metric", item.DsType, item.Heartbeat, item.Min, item.Max)
57 |
58 | // 设置各种归档策略
59 | // 1分钟一个点存 90d
60 | c.RRA("AVERAGE", 0.5, 1, RRA1PointCnt)
61 |
62 | return c.Create(true)
63 | }
64 | ```
65 |
66 | #### 第二步,清除graph的历史数据
67 | 清除已上报的所有指标的历史数据,即删除所有的rrdfile。不删除历史数据,已上报指标的精度更改将不能生效。
68 |
69 | #### 第三步,重新部署graph服务
70 | 编译修改后的graph源码,关停原有的graph老服务、发布修改后的graph。
71 |
72 | 只需要修改graph组件、不需要修改Open-Falcon的其他组件,新的精度就能生效。你可以通过Dashboard、Screen来查看新的精度的绘图曲线。
73 |
74 |
75 |
76 | ### 注意事项:
77 |
78 | 修改监控绘图曲线精度时,需要:
79 |
80 | + 修改graph源代码,更新RRA
81 | + 清除graph的历史数据。不删除历史数据,已上报指标的精度更改将不能生效
82 | + 除了graph之外,Open-Falcon的其他任何组件 不需要被修改
83 | + 修改RRA后,可能会出现"绘图曲线点数过多、浏览器被卡死"的问题。请合理规划RRA存储的点数,或者调整绘图曲线查询时的时间段选择。
84 |
85 |
86 |
--------------------------------------------------------------------------------
/zh/dev/support_grafana.md:
--------------------------------------------------------------------------------
1 | ## 支持 Grafana 视图展现
2 |
3 | 相较于 Open-Falcon 内建的 Dashboard,Grafana 可以很有弹性的自定义图表,并且可以针对 Dashboard 做权限控管、上标签以及查询,图表的展示选项也更多样化。本篇教学帮助您
4 | 做好 Open-Falcon 的面子工程!
5 |
6 | ### 开始之前
7 |
8 | Open-Falcon 跟 Grafana 目前并不互相支持,所以您需要下面的PR
9 |
10 | - Grafana [PR#3787](https://github.com/grafana/grafana/pull/3787) (支持到 v2.6 版)
11 | - Query [PR#5](https://github.com/open-falcon/query/pull/5)(已合并到最新的query代码中了,请检查您是否使用的是最新版)
12 |
13 | > 详细可以参考[优酷同学写的教程](http://blueswind8306.iteye.com/blog/2287561)
14 |
15 | ### 设定 Datasource
16 |
17 | 当您取得包含上述 PR 的 Grafana 源代码之后,按照官方教学安装后依下述步骤编译:
18 |
19 | 1. 编译前端代码 `go run build.go build`
20 | 2. 编译后端代码 `grunt`
21 | 3. 执行 `grafana-server`
22 |
23 | 启动 Grafana 后,依照下图添加新的 Open-Falcon Datasource,需要注意的是我们这里使用的 URL 是在 falcon-query 中新增的 API。
24 |
25 | 
26 |
27 | ### 新增 Templating 变量
28 |
29 | 当 Open-Falcon 中已经有上百台机器时,一个个新增监控项到图表中是不切实际的,所以 Grafana 提供了一个 Templating 的变量让我们可以动态地选择想要关注的机器。
30 |
31 | 1. 上方设定点击 Templating
32 | 
33 |
34 | 2. 新增 Templating 变量
35 | 
36 |
37 | ### 新增圖表
38 |
39 | 有了 Templating 变量之后,我们就可以以它来代替 Endpoint 名称,选择我们关注的监控项,完成图表的新增。
40 |
41 | 
42 |
--------------------------------------------------------------------------------
/zh/donate.md:
--------------------------------------------------------------------------------
https://raw.githubusercontent.com/open-falcon/book/f5ac09ca0c92d3c3d77aee4767aaab80edad1bbf/zh/donate.md
--------------------------------------------------------------------------------
/zh/faq/README.md:
--------------------------------------------------------------------------------
1 | # 大家最常问的问题
--------------------------------------------------------------------------------
/zh/faq/alarm.md:
--------------------------------------------------------------------------------
1 | # 报警相关常见问题
2 |
3 | #### 配置了策略,一直没有报警,如何排查?
4 |
5 | 1. 排查sender、alarm、judge、hbs、agent、transfer的log
6 | 2. 浏览器访问alarm的http页面,看是否有未恢复的告警,如果有就是生成报警了,后面没发出去,很可能是邮件、短信发送接口出问题了,检查sender中配置的api
7 | 3. 打开agent的debug,看是否在正常push数据
8 | 4. 看agent配置,是否正确配置了heartbeat(hbs)和transfer的地址,并enabled
9 | 5. 看transfer配置,是否正确配置了judge地址
10 | 6. jduge提供了一个http接口用于debug,可以检查某个数据是否正确push上来了,比如qd-open-falcon-judge01.hd这个机器的cpu.idle数据,可以这么查看
11 | ```bash
12 | curl http://127.0.0.1:6081/history/qd-open-falcon-judge01.hd/cpu.idle
13 | ```
14 | 7. 检查服务器的时间是否已经同步,可以用 [ntp](https://access.redhat.com/documentation/en-US/Red_Hat_Enterprise_Linux/7/html/System_Administrators_Guide/sect-Understanding_chrony_and-its_configuration.html) 或 chrony 来实现
15 |
16 | 上面的127.0.0.1:6081指的是judge的http端口
17 | 7. 检查judge配置的hbs地址是否正确
18 | 8. 检查hbs配置的数据库地址是否正确
19 | 9. 检查portal中配置的策略模板是否配置了报警接收人
20 | 10. 检查portal中配置的策略模板是否绑定到某个HostGroup了,并且目标机器恰好在这个HostGroup中
21 | 11. 去UIC检查报警接收组中是否把自己加进去了
22 | 12. 去UIC检查自己的联系信息是否正确
23 |
24 | #### 在Portal页面创建了一个HostGroup,往HostGroup中增加机器的时候报错
25 |
26 | 1. 检查agent是否正确配置了heartbeat地址,并enabled了
27 | 2. 检查hbs log
28 | 3. 检查hbs配置的数据库地址是否正确
29 | 4. 检查hbs的配置hosts是否配置为sync了,只有留空的时候hbs才会去写host表,host表中有数据才能在页面上添加机器
30 |
--------------------------------------------------------------------------------
/zh/faq/collect.md:
--------------------------------------------------------------------------------
1 | # 数据收集相关问题
2 | Open-Falcon数据收集,分为[绘图数据]收集和[报警数据]收集。下面介绍,如何验证两个链路的数据收集是否正常。
3 |
4 |
5 | ### 如何验证[绘图数据]收集是否正常
6 | 数据链路是:`agent->transfer->graph->query->dashboard`。graph有一个http接口可以验证`agent->transfer->graph`这条链路,比如graph的http端口是6071,可以这么访问验证:
7 |
8 | ```bash
9 | # $endpoint和$counter是变量
10 | curl http://127.0.0.1:6071/history/$endpoint/$counter
11 |
12 | # 如果上报的数据不带tags,访问方式是这样的:
13 | curl http://127.0.0.1:6071/history/host01/agent.alive
14 |
15 | # 如果上报的数据带有tags,访问方式如下,其中tags为module=graph,project=falcon
16 | curl http://127.0.0.1:6071/history/host01/qps/module=graph,project=falcon
17 | ```
18 | 如果调用上述接口返回空值,则说明agent没有上报数据、或者transfer服务异常。
19 |
20 |
21 | ### 如何验证[报警数据]收集是否正常
22 |
23 | 数据链路是:`agent->transfer->judge`,judge有一个http接口可以验证`agent->transfer->judge`这条链路,比如judge的http端口是6081,可以这么访问验证:
24 |
25 | ```bash
26 | curl http://127.0.0.1:6081/history/$endpoint/$counter
27 |
28 | # $endpoint和$counter是变量,举个例子:
29 | curl http://127.0.0.1:6081/history/host01/cpu.idle
30 |
31 | # counter=$metric/sorted($tags)
32 | # 如果上报的数据带有tag,访问方式是这样的,比如:
33 | curl http://127.0.0.1:6081/history/host01/qps/module=judge,project=falcon
34 | ```
35 | 如果调用上述接口返回空值,则说明agent没有上报数据、或者transfer服务异常。
36 |
37 |
--------------------------------------------------------------------------------
/zh/image/OpenFalcon_wechat.jpg:
--------------------------------------------------------------------------------
https://raw.githubusercontent.com/open-falcon/book/f5ac09ca0c92d3c3d77aee4767aaab80edad1bbf/zh/image/OpenFalcon_wechat.jpg
--------------------------------------------------------------------------------
/zh/images/practice/deploy.png:
--------------------------------------------------------------------------------
https://raw.githubusercontent.com/open-falcon/book/f5ac09ca0c92d3c3d77aee4767aaab80edad1bbf/zh/images/practice/deploy.png
--------------------------------------------------------------------------------
/zh/install_from_src/README.md:
--------------------------------------------------------------------------------
1 | # 概述
2 |
3 | Open-Falcon是一个比较大的分布式系统,有十几个组件。按照功能,这十几个组件可以划分为 基础组件、作图链路组件和报警链路组件,其安装部署的架构如下图所示,
4 |
5 | 
6 |
7 | 其中,基础组件以绿色标注圈住、作图链路组件以蓝色圈住、报警链路组件以红色圈住,橙色填充的组件为域名。OpenTSDB功能尚未完成。
8 |
9 | ## 二进制快速安装
10 |
11 | 请直接参考[quick_install](../quick_install/README.md)
12 |
13 | ## Docker化的Open-Falcon安装
14 |
15 | 参看:https://github.com/frostynova/open-falcon-docker
16 |
17 | ## 从源码安装
18 |
19 | 从源码,编译安装每个模块,就是本章的内容,请按照本章节的顺序,安装每个组件。
20 |
21 | ## 视频教程教你安装
22 |
23 | 《[Open-Falcon部署与架构解析](http://www.jikexueyuan.com/course/1651.html)》
24 |
25 |
--------------------------------------------------------------------------------
/zh/install_from_src/agent-updater.md:
--------------------------------------------------------------------------------
1 | # Agent-updater
2 |
3 | 每台机器都要部署falcon-agent,如果公司机器量比较少,用pssh、ansible、fabric之类的工具手工安装问题也不大。但是公司机器量多了之后,手工安装、升级、回滚falcon-agent将成为噩梦。
4 |
5 | 个人开发了agent-updater这个工具,用于管理falcon-agent,agent-updater也有一个agent:ops-updater,可以看做是一个超级agent,用于管理其他agent的agent,呵呵,ops-updater推荐在装机的时候一起安装上。ops-updater通常是不会升级的。
6 |
7 | 具体参看:https://github.com/open-falcon/ops-updater
8 |
9 | 如果你想学习如何使用Go语言编写一个完整的项目,也可以研究一下agent-updater,我甚至录制了一个视频教程来演示一步一步如何开发出来的。课程链接:
10 |
11 | - http://www.jikexueyuan.com/course/1336.html
12 | - http://www.jikexueyuan.com/course/1357.html
13 | - http://www.jikexueyuan.com/course/1462.html
14 | - http://www.jikexueyuan.com/course/1490.html
15 |
16 |
--------------------------------------------------------------------------------
/zh/install_from_src/dashboard.md:
--------------------------------------------------------------------------------
1 | # Dashboard
2 | dashboard是面向用户的查询界面。在这里,用户可以看到push到graph中的所有数据,并查看其趋势图。
3 |
4 | ## 依赖安装
5 |
6 | Dashboard是个Python的项目。安装&部署Dashboard时,需要安装一些依赖库。依赖库安装,步骤如下,
7 |
8 | ```bash
9 | # 安装virtualenv。需要root权限。
10 | yum install -y python-virtualenv
11 |
12 | # 安装依赖。不需要root权限、使用普通账号执行就可以。需要到dashboard的目录下执行。
13 | cd /path/to/dashboard/
14 | virtualenv ./env
15 | ./env/bin/pip install -r pip_requirements.txt
16 |
17 | ```
18 | 对于ubuntu用户,安装mysql-python时可能会失败。请自行安装依赖libmysqld-dev、libmysqlclient-dev等。
19 |
20 |
21 | ## 服务部署
22 |
23 | 部署dashboard,包括配置修改、启动服务、停止服务等。在此之前,需要进入dashboard的部署目录,然后执行下列步骤
24 |
25 | ```
26 | # 修改配置。各配置的含义,见下文。
27 | vim ./gunicorn.conf
28 | vim ./rrd/config.py
29 |
30 | # 启动服务
31 | ./control start
32 |
33 | # 校验服务
34 | # TODO
35 |
36 | ...
37 | # 停止服务
38 | ./control stop
39 |
40 | ```
41 | 服务启动后,可以通过日志查看服务的运行状态,日志文件地址为./var/app.log。可以通过```http://localhost:8081```访问dashboard主页(这里假设 dashboard的http监听端口为8081)。
42 |
43 |
44 | ## 配置说明
45 | dashboard有两个需要更改的配置文件: ./gunicorn.conf 和 ./rrd/config.py。./gunicorn.conf各字段,含义如下
46 |
47 | ```bash
48 | - workers,dashboard并发进程数
49 | - bind,dashboard的http监听端口
50 | - proc_name,进程名称
51 | - pidfile,pid文件全名称
52 | - limit_request_field_size,TODO
53 | - limit_request_line,TODO
54 | ```
55 |
56 | 配置文件./rrd/config.py,各字段含义为
57 |
58 | ```python
59 | # dashboard的数据库配置
60 | DASHBOARD_DB_HOST = "127.0.0.1"
61 | DASHBOARD_DB_PORT = 3306
62 | DASHBOARD_DB_USER = "root"
63 | DASHBOARD_DB_PASSWD = ""
64 | DASHBOARD_DB_NAME = "dashboard"
65 |
66 | # graph的数据库配置
67 | GRAPH_DB_HOST = "127.0.0.1"
68 | GRAPH_DB_PORT = 3306
69 | GRAPH_DB_USER = "root"
70 | GRAPH_DB_PASSWD = ""
71 | GRAPH_DB_NAME = "graph"
72 |
73 | # dashboard的配置
74 | DEBUG = True
75 | SECRET_KEY = "secret-key"
76 | SESSION_COOKIE_NAME = "open-falcon"
77 | PERMANENT_SESSION_LIFETIME = 3600 * 24 * 30
78 | SITE_COOKIE = "open-falcon-ck"
79 |
80 | # query服务的地址
81 | QUERY_ADDR = "http://127.0.0.1:9966"
82 |
83 | BASE_DIR = "/home/work/open-falcon/dashboard/"
84 | LOG_PATH = os.path.join(BASE_DIR,"log/")
85 |
86 | try:
87 | from rrd.local_config import *
88 | except:
89 | pass
90 | ```
91 |
92 | ## 补充说明
93 |
94 | Dashboard正常启动之后,就可以回去配置Fe这个项目的shortcut了。省得以后还要单独输入ip:port来打开dashboard。修改完了shortcut,要重启fe模块。
95 |
--------------------------------------------------------------------------------
/zh/install_from_src/gateway.md:
--------------------------------------------------------------------------------
1 | # Gateway
2 |
3 | **如果您没有遇到机房分区问题,请直接忽略此组件**。
4 |
5 | 如果您已经遇到机房分区问题、并急需解决机房分区时监控数据回传的问题,请使用该组件。更多的资料在[这里](https://github.com/open-falcon/gateway)。
6 |
--------------------------------------------------------------------------------
/zh/install_from_src/graph.md:
--------------------------------------------------------------------------------
1 | # Graph
2 |
3 | graph是存储绘图数据的组件。graph组件 接收transfer组件推送上来的监控数据,同时处理query组件的查询请求、返回绘图数据。
4 |
5 | ## 源码编译
6 |
7 | ```bash
8 | # update common lib
9 | cd $GOPATH/src/github.com/open-falcon/common
10 | git pull
11 |
12 | # compile
13 | cd $GOPATH/src/github.com/open-falcon/graph
14 | go get ./...
15 | ./control build
16 | ./control pack
17 | ```
18 |
19 | 最后一步会pack出一个tar.gz的安装包,拿着这个包去部署服务即可。
20 |
21 | ## 服务部署
22 | 服务部署,包括配置修改、启动服务、检验服务、停止服务等。这之前,需要将安装包解压到服务的部署目录下。
23 |
24 | ```bash
25 | # 修改配置, 配置项含义见下文
26 | mv cfg.example.json cfg.json
27 | vim cfg.json
28 |
29 | # 启动服务
30 | ./control start
31 |
32 | # 校验服务,这里假定服务开启了6071的http监听端口。检验结果为ok表明服务正常启动。
33 | curl -s "127.0.0.1:6071/health"
34 |
35 | ...
36 | # 停止服务
37 | ./control stop
38 |
39 | ```
40 | 启动服务后,可以通过日志查看服务的运行状态,日志文件地址为./var/app.log;如果需要详细的日志,可以将配置项debug设置为true。可以通过调试脚本```./test/debug```查看服务器的内部状态数据,如 运行 ```bash ./test/debug``` 可以得到服务器内部状态的统计信息。
41 |
42 | ## 配置说明
43 | 配置文件默认为./cfg.json。默认情况下,安装包会有一个cfg.example.json的配置文件示例。各配置项的含义,如下
44 |
45 | ```python
46 | {
47 | "debug": false, //true or false, 是否开启debug日志
48 | "http": {
49 | "enabled": true, //true or false, 表示是否开启该http端口,该端口为控制端口,主要用来对graph发送控制命令、统计命令、debug命令
50 | "listen": "0.0.0.0:6071" //表示监听的http端口
51 | },
52 | "rpc": {
53 | "enabled": true, //true or false, 表示是否开启该rpc端口,该端口为数据接收端口
54 | "listen": "0.0.0.0:6070" //表示监听的rpc端口
55 | },
56 | "rrd": {
57 | "storage": "/home/work/data/6070" //绝对路径,历史数据的文件存储路径(如有必要,请修改为合适的路)
58 | },
59 | "db": {
60 | "dsn": "root:@tcp(127.0.0.1:3306)/graph?loc=Local&parseTime=true", //MySQL的连接信息,默认用户名是root,密码为空,host为127.0.0.1,database为graph(如有必要,请修改)
61 | "maxIdle": 4 //MySQL连接池配置,连接池允许的最大连接数,保持默认即可
62 | },
63 | "callTimeout": 5000, //RPC调用超时时间,单位ms
64 | "migrate": { //扩容graph时历史数据自动迁移
65 | "enabled": false, //true or false, 表示graph是否处于数据迁移状态
66 | "concurrency": 2, //数据迁移时的并发连接数,建议保持默认
67 | "replicas": 500, //这是一致性hash算法需要的节点副本数量,建议不要变更,保持默认即可(必须和transfer的配置中保持一致)
68 | "cluster": { //未扩容前老的graph实例列表
69 | "graph-00" : "127.0.0.1:6070"
70 | }
71 | }
72 | }
73 |
74 | ```
75 |
76 | ## 补充说明
77 | 部署完graph组件后,请修改transfer和query的配置,使这两个组件可以寻址到graph。
78 |
--------------------------------------------------------------------------------
/zh/install_from_src/judge.md:
--------------------------------------------------------------------------------
1 | # Judge
2 |
3 | Judge用于告警判断,agent将数据push给Transfer,Transfer不但会转发给Graph组件来绘图,还会转发给Judge用于判断是否触发告警。
4 |
5 | ## 设计初衷
6 |
7 | 因为监控系统数据量比较大,一台机器显然是搞不定的,所以必须要有个数据分片方案。Transfer通过一致性哈希来分片,每个Judge就只需要处理一小部分数据就可以了。所以判断告警的功能不能放在直接的数据接收端:Transfer,而应该放到Transfer后面的组件里。
8 |
9 | ## 源码安装
10 |
11 | ```bash
12 | cd $GOPATH/src/github.com/open-falcon/judge
13 | go get ./...
14 | ./control build
15 | ./control pack
16 | ```
17 |
18 | 最后一步会pack出一个tar.gz的包,拿着这个包去部署即可。
19 |
20 | ## 部署说明
21 |
22 | Judge监听了一个http端口,提供了一个http接口:/count,访问之,可以得悉当前Judge实例处理了多少数据量。推荐的做法是一个Judge实例处理50万~100万数据,用个5G~10G内存,如果所用物理机内存比较大,比如有128G,可以在一个物理机上部署多个Judge实例。
23 |
24 | ## 配置说明
25 |
26 | 配置文件必须叫cfg.json,可以基于cfg.example.json修改
27 |
28 | ```
29 | {
30 | "debug": true,
31 | "debugHost": "nil",
32 | "remain": 11,
33 | "http": {
34 | "enabled": true,
35 | "listen": "0.0.0.0:6081"
36 | },
37 | "rpc": {
38 | "enabled": true,
39 | "listen": "0.0.0.0:6080"
40 | },
41 | "hbs": {
42 | "servers": ["127.0.0.1:6030"], # hbs最好放到lvs vip后面,所以此处最好配置为vip:port
43 | "timeout": 300,
44 | "interval": 60
45 | },
46 | "alarm": {
47 | "enabled": true,
48 | "minInterval": 300, # 连续两个报警之间至少相隔的秒数,维持默认即可
49 | "queuePattern": "event:p%v",
50 | "redis": {
51 | "dsn": "127.0.0.1:6379", # 与alarm、sender使用一个redis
52 | "maxIdle": 5,
53 | "connTimeout": 5000,
54 | "readTimeout": 5000,
55 | "writeTimeout": 5000
56 | }
57 | }
58 | }
59 | ```
60 |
61 | remain这个配置详细解释一下:
62 | remain指定了judge内存中针对某个数据存多少个点,比如host01这个机器的cpu.idle的值在内存中最多存多少个,配置报警的时候比如all(#3),这个#后面的数字不能超过remain-1,一般维持默认就够用了
63 |
64 | ## 进程管理
65 |
66 | 我们提供了一个control脚本来完成常用操作
67 |
68 | ```bash
69 | ./control start 启动进程
70 | ./control stop 停止进程
71 | ./control restart 重启进程
72 | ./control status 查看进程状态
73 | ./control tail 用tail -f的方式查看var/app.log
74 | ```
75 |
76 | ## 验证
77 |
78 | 访问/health接口验证Judge是否工作正常。
79 |
80 | ```bash
81 | curl 127.0.0.1:6081/health
82 | ```
83 |
84 | 另外就是查看Judge的log,log在var目录下
85 |
86 | ## 视频教程
87 |
88 | 为judge模块录制了一个视频,做了源码级解读:http://www.jikexueyuan.com/course/1850.html
89 |
90 |
--------------------------------------------------------------------------------
/zh/install_from_src/links.md:
--------------------------------------------------------------------------------
1 | # Links
2 |
3 | Links是为报警合并功能写的组件。如果你不想使用报警合并功能,这个组件是无需安装的。
4 |
5 | ## 源码安装
6 |
7 | Links个Python的项目,无需像Go的项目那样去做编译。不过Go的项目是静态编译的,编译好了之后二进制无依赖,拿到其他机器也可以跑起来,Python的项目就需要安装一些依赖库了。
8 |
9 | ```bash
10 | # 我们使用virtualenv来管理Python环境,yum安装需切到root账号
11 | # yum install -y python-virtualenv
12 |
13 | $ cd /path/to/links/
14 | $ virtualenv ./env
15 |
16 | $ ./env/bin/pip install -r pip_requirements.txt
17 | ```
18 |
19 | 安装完依赖的lib之后就可以用control脚本启动了,log在var目录。不过启动之前要先把配置文件修改成相应配置。另外,监听的端口在gunicorn.conf中配置。
20 |
21 |
22 | ## 部署说明
23 |
24 | Links是个web项目,无状态,可以水平扩展,至少部署两台机器以保证可用性,前面架设nginx或者lvs这种负载设备,申请一个域名,搞定!
25 |
26 | ## 配置说明
27 |
28 | Links的配置文件在frame/config.py
29 |
30 | ```python
31 | # 修改一下数据库配置,数据库schema文件在scripts目录
32 | DB_HOST = "127.0.0.1"
33 | DB_PORT = 3306
34 | DB_USER = "root"
35 | DB_PASS = ""
36 | DB_NAME = "falcon_links"
37 |
38 | # SECRET_KEY尽量搞一个复杂点的随机字符串
39 | SECRET_KEY = "4e.5tyg8-u9ioj"
40 | SESSION_COOKIE_NAME = "falcon-links"
41 | PERMANENT_SESSION_LIFETIME = 3600 * 24 * 30
42 |
43 | # 我们可以cp config.py local_config.py用local_config.py中的配置覆盖config.py中的配置
44 | # 嫌麻烦的话维持默认即可,也不用制作local_config.py
45 | try:
46 | from frame.local_config import *
47 | except Exception, e:
48 | print "[warning] %s" % e
49 | ```
50 |
51 | ## 进程管理
52 |
53 | 我们提供了一个control脚本来完成常用操作
54 |
55 | ```bash
56 | ./control start 启动进程
57 | ./control stop 停止进程
58 | ./control restart 重启进程
59 | ./control status 查看进程状态
60 | ./control tail 用tail -f的方式查看var/app.log
61 | ```
62 |
63 | ## 验证
64 |
65 | 启动之后要看看log是否正常,log在var目录。
66 |
67 | 然后浏览器访问之,发现首页404,这是正常的。之后alarm模块会用到links。
68 |
69 | 或者我们可以这么验证:
70 |
71 | ```bash
72 | curl http://links.example.com/store -d "abc"
73 | ```
74 |
75 | 上面命令会返回一个随机字符串,拿着这个随机字符串拼接到links地址后面,浏览器访问之即可。比如返回的随机字符串是dot9kg8b,浏览器访问:http://links.example.com/dot9kg8b 即可
76 |
77 |
--------------------------------------------------------------------------------
/zh/install_from_src/mail-sms.md:
--------------------------------------------------------------------------------
1 | # 邮件短信发送接口
2 |
3 | 这个组件没有代码,需要各个公司自行提供。
4 |
5 | 监控系统产生报警事件之后需要发送报警邮件或者报警短信,各个公司可能有自己的邮件服务器,有自己的邮件发送方法;有自己的短信通道,有自己的短信发送方法。falcon为了适配各个公司,在接入方案上做了一个规范,需要各公司提供http的短信和邮件发送接口
6 |
7 | 短信发送http接口:
8 |
9 | ```
10 | method: post
11 | params:
12 | - content: 短信内容
13 | - tos: 使用逗号分隔的多个手机号
14 | ```
15 |
16 | 邮件发送http接口:
17 |
18 | ```
19 | method: post
20 | params:
21 | - content: 邮件内容
22 | - subject: 邮件标题
23 | - tos: 使用逗号分隔的多个邮件地址
24 | ```
25 |
26 |
--------------------------------------------------------------------------------
/zh/install_from_src/portal.md:
--------------------------------------------------------------------------------
1 | # Portal
2 |
3 | Portal是用来配置报警策略的
4 |
5 | ## 源码安装
6 |
7 | Portal是个Python的项目,无需像Go的项目那样去做编译。不过Go的项目是静态编译的,编译好了之后二进制无依赖,拿到其他机器也可以跑起来,Python的项目就需要安装一些依赖库了。
8 |
9 | ```bash
10 | # 我们使用virtualenv来管理Python环境,yum安装需切到root账号
11 | # yum install -y python-virtualenv
12 |
13 | $ cd /path/to/portal/
14 | $ virtualenv ./env
15 |
16 | $ ./env/bin/pip install -r pip_requirements.txt
17 | ```
18 |
19 | 安装完依赖的lib之后就可以用control脚本启动了,log在var目录。不过启动之前要先把配置文件修改成相应配置。另外,监听的端口在gunicorn.conf中配置。
20 |
21 |
22 | ## 部署说明
23 |
24 | Portal是个web项目,无状态,可以水平扩展,至少部署两台机器以保证可用性,前面架设nginx或者lvs这种负载设备,申请一个域名,搞定!
25 |
26 | ## 配置说明
27 |
28 | Portal的配置文件在frame/config.py
29 |
30 | ```python
31 | # 修改一下数据库配置,数据库schema文件在scripts目录
32 | DB_HOST = "127.0.0.1"
33 | DB_PORT = 3306
34 | DB_USER = "root"
35 | DB_PASS = ""
36 | DB_NAME = "falcon_portal"
37 |
38 | # SECRET_KEY尽量搞一个复杂点的随机字符串
39 | SECRET_KEY = "4e.5tyg8-u9ioj"
40 | SESSION_COOKIE_NAME = "falcon-portal"
41 | PERMANENT_SESSION_LIFETIME = 3600 * 24 * 30
42 |
43 | # 如果你使用的是Go版本的UIC,即Fe那个项目,下面的配置就配置成Fe的地址即可,注意端口,Fe的默认端口是1234
44 | # internal是内网可访问的UIC(或者Fe)地址
45 | # external是外网可访问的UIC(或者Fe)地址,即用户通过浏览器访问的UIC(或者Fe)地址
46 | UIC_ADDRESS = {
47 | 'internal': 'http://127.0.0.1:8080',
48 | 'external': 'http://11.11.11.11:8080',
49 | }
50 |
51 | MAINTAINERS = ['root']
52 | CONTACT = 'ulric.qin@gmail.com'
53 |
54 | # 社区版必须维持默认配置
55 | COMMUNITY = True
56 |
57 | # 我们可以cp config.py local_config.py用local_config.py中的配置覆盖config.py中的配置
58 | # 嫌麻烦的话维持默认即可,也不用制作local_config.py
59 | try:
60 | from frame.local_config import *
61 | except Exception, e:
62 | print "[warning] %s" % e
63 | ```
64 |
65 | ## 进程管理
66 |
67 | 我们提供了一个control脚本来完成常用操作
68 |
69 | ```bash
70 | ./control start 启动进程
71 | ./control stop 停止进程
72 | ./control restart 重启进程
73 | ./control status 查看进程状态
74 | ./control tail 用tail -f的方式查看var/app.log
75 | ```
76 |
77 | # 补充
78 |
79 | Portal正常启动之后,就可以回去配置Fe这个项目的shortcut了。当然,dashboard和alarm还没有搭建,这俩shortcut还没法配置。修改完了shortcut,要重启fe模块。
80 |
81 |
82 | ## 视频教程
83 |
84 | 为该模块录制了一个视频,做了源码级解读:http://www.jikexueyuan.com/course/1796.html
85 |
86 |
--------------------------------------------------------------------------------
/zh/install_from_src/prepare.md:
--------------------------------------------------------------------------------
1 | # 环境准备
2 | 环境准备,包括安装基础的依赖组件 和 准备Open-Falcon的安装环境。
3 |
4 | ## 依赖组件
5 | ### 安装redis
6 | yum install -y redis
7 |
8 | ### 安装mysql
9 | yum install -y mysql-server
10 |
11 | ### 初始化mysql表结构
12 | ```bash
13 | # open-falcon所有组件都无需root账号启动,推荐使用普通账号安装,提升安全性。此处我们使用普通账号:work来安装部署所有组件
14 | # 当然了,使用yum安装依赖的一些lib库的时候还是要有root权限的。
15 | export HOME=/home/work
16 | export WORKSPACE=$HOME/open-falcon
17 | mkdir -p $WORKSPACE
18 | cd $WORKSPACE
19 |
20 | git clone https://github.com/open-falcon/scripts.git
21 | cd ./scripts/
22 | mysql -h localhost -u root -p < db_schema/graph-db-schema.sql
23 | mysql -h localhost -u root -p < db_schema/dashboard-db-schema.sql
24 |
25 | mysql -h localhost -u root -p < db_schema/portal-db-schema.sql
26 | mysql -h localhost -u root -p < db_schema/links-db-schema.sql
27 | mysql -h localhost -u root -p < db_schema/uic-db-schema.sql
28 | ```
29 |
30 | ## 安装环境
31 | open-falcon的后端组件都是使用Go语言编写的,本节我们搭建Go语言开发环境,clone代码
32 |
33 | 我们使用64位Linux作为开发环境,与线上环境保持一致。如果你所用的环境不同,请自行解决不同平台的命令差异
34 |
35 | 首先安装Go语言开发环境:
36 |
37 | ```bash
38 | cd ~
39 | wget http://dinp.qiniudn.com/go1.4.1.linux-amd64.tar.gz
40 | tar zxf go1.4.1.linux-amd64.tar.gz
41 | mkdir -p workspace/src
42 | echo "" >> .bashrc
43 | echo 'export GOROOT=$HOME/go' >> .bashrc
44 | echo 'export GOPATH=$HOME/workspace' >> .bashrc
45 | echo 'export PATH=$GOROOT/bin:$GOPATH/bin:$PATH' >> .bashrc
46 | echo "" >> .bashrc
47 | source .bashrc
48 | ```
49 |
50 | 接下来clone代码,以备后用
51 |
52 | ```bash
53 | cd $GOPATH/src
54 | mkdir github.com
55 | cd github.com
56 | git clone --recursive https://github.com/open-falcon/of-release.git
57 | ```
58 |
--------------------------------------------------------------------------------
/zh/install_from_src/query.md:
--------------------------------------------------------------------------------
1 | # Query
2 | query组件,提供统一的绘图数据查询入口。query组件接收查询请求,根据一致性哈希算法去相应的graph实例查询不同metric的数据,然后汇总拿到的数据,最后统一返回给用户。
3 |
4 | ## 源码编译
5 |
6 | ```bash
7 | # update common lib
8 | cd $GOPATH/src/github.com/open-falcon/common
9 | git pull
10 |
11 | # compile
12 | cd $GOPATH/src/github.com/open-falcon/query
13 | go get ./...
14 | ./control build
15 | ./control pack
16 | ```
17 |
18 | 最后一步会pack出一个tar.gz的安装包,拿着这个包去部署服务即可。
19 |
20 | ## 服务部署
21 | 服务部署,包括配置修改、启动服务、检验服务、停止服务等。这之前,需要将安装包解压到服务的部署目录下。
22 |
23 | ```bash
24 | # 修改配置, 配置项含义见下文, 注意graph集群的配置
25 | mv cfg.example.json cfg.json
26 | vim cfg.json
27 |
28 | ## 修改graph集群配置, 默认在./graph_backends.txt中定义
29 | vim graph_backends.txt
30 |
31 |
32 | # 启动服务
33 | ./control start
34 |
35 | # 校验服务,这里假定服务开启了9966的http监听端口。检验结果为ok表明服务正常启动。
36 | curl -s "127.0.0.1:9966/health"
37 |
38 | ...
39 | # 停止服务
40 | ./control stop
41 |
42 | ```
43 | 服务启动后,可以通过日志查看服务的运行状态,日志文件地址为./var/app.log。可以通过查询脚本```./scripts/query```读取绘图数据,如 运行 ```bash ./scripts/query "ur.endpoint" "ur.counter"```可以查询Endpoint="ur.endpoint" & Counter="ur.counter"对应的绘图数据。
44 |
45 | ## 配置说明
46 |
47 | 注意: 请确保 `graph.replicas`和`graph.cluster` 的内容与transfer的配置**完全一致**
48 |
49 | ```bash
50 | {
51 | "debug": "false", // 是否开启debug日志
52 | "http": {
53 | "enabled": true, // 是否开启http.server
54 | "listen": "0.0.0.0:9966" // http.server监听地址&端口
55 | },
56 | "graph": {
57 | "connTimeout": 1000, // 单位是毫秒,与后端graph建立连接的超时时间,可以根据网络质量微调,建议保持默认
58 | "callTimeout": 5000, // 单位是毫秒,从后端graph读取数据的超时时间,可以根据网络质量微调,建议保持默认
59 | "maxConns": 32, // 连接池相关配置,最大连接数,建议保持默认
60 | "maxIdle": 32, // 连接池相关配置,最大空闲连接数,建议保持默认
61 | "replicas": 500, // 这是一致性hash算法需要的节点副本数量,应该与transfer配置保持一致
62 | "cluster": { // 后端的graph列表,应该与transfer配置保持一致;不支持一条记录中配置两个地址
63 | "graph-00": "test.hostname01:6070",
64 | "graph-01": "test.hostname02:6070"
65 | }
66 | },
67 | "api": { // 适配grafana需要的API配置
68 | "query": "http://127.0.0.1:9966", // query的http地址
69 | "dashboard": "http://127.0.0.1:8081", // dashboard的http地址
70 | "max": 500 //API返回结果的最大数量
71 | }
72 | }
73 | ```
74 |
75 | ## 补充说明
76 | 部署完成query组件后,请修改dashboard组件的配置、使其能够正确寻址到query组件。请确保query组件的graph列表 与 transfer的配置 一致。
77 |
--------------------------------------------------------------------------------
/zh/install_from_src/sender.md:
--------------------------------------------------------------------------------
1 | # Sender
2 |
3 | 上节我们利用http接口规范屏蔽了邮件、短信发送的问题。Sender这个模块专门用于调用各公司提供的邮件、短信发送接口。
4 |
5 | ## 设计初衷
6 |
7 | 各个公司会提供邮件、短信发送接口,我们产生了报警之后就立马调用这些接口发送报警,是不合适的。因为这些接口可能无法处理巨大的并发量,而且接口本身的处理速度可能也比较慢,这会拖慢我们的处理逻辑。所以一个比较好的方式是把邮件、短信发送这个事情做成异步的。
8 |
9 | 我们提供一个短信redis队列,提供一个邮件redis队列。当有短信要发送的时候,直接将短信内容写入短信redis队列即可,当有邮件要发送的时候,直接将邮件内容写入邮件redis队列。针对每个队列,后面有一个预设大小的worker线程池来处理。
10 |
11 | 有了队列的缓冲,即便某个时刻产生了大量报警,造成邮件、短信发送的突发流量,也不会对邮件、短信发送接口造成冲击。
12 |
13 | ## 源码安装
14 |
15 | ```bash
16 | cd $GOPATH/src/github.com/open-falcon/sender
17 | go get ./...
18 | ./control build
19 | ./control pack
20 | ```
21 |
22 | 最后一步会pack出一个tar.gz的包,拿着这个包去部署即可。
23 |
24 | ## 部署说明
25 |
26 | sender这个模块和redis队列部署在一台机器上即可。公司即使有几十万台机器,一个sender也足够了。
27 |
28 | ## 配置说明
29 |
30 | 配置文件必须叫cfg.json,可以基于cfg.example.json修改
31 |
32 | ```
33 | {
34 | "debug": true,
35 | "http": {
36 | "enabled": true,
37 | "listen": "0.0.0.0:6066"
38 | },
39 | "redis": {
40 | "addr": "127.0.0.1:6379", # 此处配置的redis地址要和后面的judge、alarm配置成相同的
41 | "maxIdle": 5
42 | },
43 | "queue": {
44 | "sms": "/sms", # 短信队列名称,维持默认即可,alarm中也会有一个相同的配置
45 | "mail": "/mail" # 邮件队列名称,维持默认即可,alarm中也会有一个相同的配置
46 | },
47 | "worker": {
48 | "sms": 10, # 调用短信接口的最大并发量
49 | "mail": 50 # 调用邮件接口的最大并发量
50 | },
51 | "api": {
52 | "sms": "http://11.11.11.11:8000/sms", # 各公司自行提供的短信发送接口,11.11.11.11这个ip只是个例子喽
53 | "mail": "http://11.11.11.11:9000/mail" # 各公司自行提供的邮件发送接口
54 | }
55 | }
56 | ```
57 |
58 | 如果没有邮件发送接口,可以使用 [Open-Falcon mail-provider](https://github.com/open-falcon/mail-provider)。
59 |
60 | ## 进程管理
61 |
62 | 我们提供了一个control脚本来完成常用操作
63 |
64 | ```bash
65 | ./control start 启动进程
66 | ./control stop 停止进程
67 | ./control restart 重启进程
68 | ./control status 查看进程状态
69 | ./control tail 用tail -f的方式查看var/app.log
70 | ```
71 |
72 | ## 验证
73 |
74 | sender的配置文件中配置了监听的http端口,我们可以访问一下/health接口看是否返回ok,我们所有的Go后端模块都提供了/health接口,上面的配置的话就是这样验证:
75 |
76 | ```bash
77 | curl 127.0.0.1:6066/health
78 | ```
79 |
80 | 另外就是查看sender的log,log在var目录下
81 |
82 | ## 视频教程
83 |
84 | 为sender模块录制了一个视频,做了源码级解读:http://www.jikexueyuan.com/course/1641.html
85 |
86 |
--------------------------------------------------------------------------------
/zh/philosophy/README.md:
--------------------------------------------------------------------------------
1 | # 设计理念
2 |
3 | 阐述open-falcon设计过程中的各种思考
4 |
--------------------------------------------------------------------------------
/zh/philosophy/data-collect.md:
--------------------------------------------------------------------------------
1 | 作为监控系统来讲,首先得有监控数据,然后才能做后面的分析处理、绘图报警等事情,那falcon是如何处理数据采集这个问题的呢?
2 |
3 | 我们先要考虑有哪些数据要采集,脑洞打开~
4 |
5 | - 机器负载信息,这个最常见,cpu.idle/load.1min/mem.memfree.percent/df.bytes.free.percent等等
6 | - 硬件信息,比如功耗、风扇转速、磁盘是否可写,系统组同学对这些比较关注
7 | - 服务监控数据,比如某个接口每分钟调用的次数,latency等等
8 | - 数据库、HBase、Redis、Openstack等开源软件的监控指标
9 |
10 | 要采集的数据还挺多哩,监控系统的开发人员不是神,没法搞定所有数据,比如MySQL,DBA最懂,他知道应该采集哪些指标,监控只要提供一个数据push的接口即可,大家共建。想知道push给Server的数据长啥样?可以参考[Tag与HostGroup设计理念](tags-and-hostgroup.md)中提到的两条json数据
11 |
12 | 上面四个方面比较有代表性,咱们挨个阐述。
13 |
14 | **机器负载信息**
15 |
16 | 这部分比较通用,我们提供了一个agent部署在所有机器上去采集。不像zabbix,要采集什么数据需要在服务端配置,falcon无需配置,只要agent部署到机器上,配置好heartbeat和Transfer地址,就自动开始采集了,省去了用户配置的麻烦。目前agent只支持64位Linux,Mac、Windows均不支持。
17 |
18 | **硬件信息**
19 |
20 | 硬件信息的采集脚本由系统组同学提供,作为plugin依托于agent运行,plugin机制介绍请看[这里](plugin.md)。
21 |
22 | **服务监控数据**
23 |
24 | 服务的监控指标采集脚本,通常都是跟着服务的code走的,服务上线或者扩容,这个脚本也跟着上线或者扩容,服务下线,这个采集脚本也要相应下线。公司里Java的项目有不少,研发那边就提供了一个通用jar包,只要引入这个jar包,就可以自动采集接口的调用次数、延迟时间等数据。然后将采集到的数据push给监控,一分钟push一次。目前falcon的agent提供了一个简单的http接口,这个jar包采集到数据之后是post给本机agent。向agent推送数据的一个简单例子,如下:
25 |
26 | ```bash
27 | curl -X POST -d '[{"metric": "qps", "endpoint": "open-falcon-graph01.bj", "timestamp": 1431347802, "step": 60,"value": 9,"counterType": "GAUGE","tags": "project=falcon,module=graph"}]' http://127.0.0.1:1988/v1/push
28 | ```
29 |
30 | **各种开源软件的监控指标**
31 |
32 | 这都是大用户,比如DBA自己写一些采集脚本,连到各个MySQL实例上去采集数据,完事直接调用server端的jsonrpc汇报数据,一分钟一次,每次甚至push几十万条数据,比较好的发送方式是500条数据做一个batch,别几十万数据一次性发送。
33 |
34 |
--------------------------------------------------------------------------------
/zh/philosophy/data-model.md:
--------------------------------------------------------------------------------
1 | # Data model
2 |
3 | Open-Falcon,采用和OpenTSDB相似的数据格式:metric、endpoint加多组key value tags,举两个例子:
4 |
5 | ```bash
6 | {
7 | metric: load.1min,
8 | endpoint: open-falcon-host,
9 | tags: srv=falcon,idc=aws-sgp,group=az1,
10 | value: 1.5,
11 | timestamp: `date +%s`,
12 | counterType: GAUGE,
13 | step: 60
14 | }
15 | {
16 | metric: net.port.listen,
17 | endpoint: open-falcon-host,
18 | tags: port=3306,
19 | value: 1,
20 | timestamp: `date +%s`,
21 | counterType: GAUGE,
22 | step: 60
23 | }
24 | ```
25 |
26 | 其中,metric是监控指标名称,endpoint是监控实体,tags是监控数据的属性标签,counterType是Open-Falcon定义的数据类型(取值为GAUGE、COUNTER),step为监控数据的上报周期,value和timestamp是有效的监控数据。
27 |
--------------------------------------------------------------------------------
/zh/philosophy/plugin.md:
--------------------------------------------------------------------------------
1 | 对于Plugin机制,叙述之前必须要强调一下:
2 |
3 | > Plugin可以看做是对agent功能的扩充。对于业务系统的监控指标采集,最好不要做成plugin,而是把采集脚本放到业务程序发布包中,随着业务代码上线而上线,随着业务代码升级而升级,这样会比较容易管理。
4 |
5 | 要使用Plugin,步骤如下:
6 |
7 | **1. 编写采集脚本**
8 |
9 | 用什么语言写没关系,只要目标机器上有运行环境就行,脚本本身要有可执行权限。采集到数据之后直接打印到stdout即可,agent会截获并push给server。数据格式是json,举个例子:
10 |
11 | ```bash
12 | [root@host01:/path/to/plugins/plugin/sys/ntp]#./600_ntp.py
13 | [{"endpoint": "host01", "tags": "", "timestamp": 1431349763, "metric": "sys.ntp.offset", "value": 0.73699999999999999, "counterType": "GAUGE", "step": 600}]
14 | ```
15 |
16 | 注意,这个json数据是个list哦
17 |
18 | **2. 上传脚本到git**
19 |
20 | 插件脚本也是code,所以最好也用git、svn管理,这里我们使用git管理,公司内部如果没有搭建gitlab,可以使用gitcafe、coding.net之类的,将写好的脚本push到git仓库,比如上例中的600_ntp.py,姑且放到git仓库的sys/ntp目录下。注意,这个脚本在push到git仓库之前要加上可执行权限。
21 |
22 | **3. 检查agent配置**
23 |
24 | 大家之前部署agent的时候应该注意到agent配置文件中有配置plugin吧,现在到了用的时候了,把git仓库地址配置上,enabled设置为true。注意,配置的git仓库地址需要是任何机器上都可以拉取的,即`git://`或者`https://`打头的。如果agent之前已经部署到公司所有机器上了,那现在手工改配置可能略麻烦,之前讲过的嘛,用[ops-updater](https://github.com/open-falcon/ops-updater)管理起来~
25 |
26 | **4. 拉取plugin脚本**
27 |
28 | agent开了一个http端口1988,我们可以挨个curl一下http://ip:1988/plugin/update 这个地址,这会让agent主动git pull这个插件仓库。为啥没做成定期拉取这个仓库呢?主要是怕给git服务器压力太大……大家悠着点用,别给人pull挂了……
29 |
30 | **5. 让plugin run起来**
31 |
32 | 上一步我们拉取了plugin脚本到所有机器上,不过plugin并没有执行。哪些机器执行哪些plugin脚本,是在portal上面配置的。其实我很想做成,只要插件拉取下来了就立马执行,不过实际实践中,有些插件还是不能在所有机器上跑,所以就在portal上通过配置控制了。在portal上找到要执行插件的HostGroup,点击对应的plugins超链接,对于上例sys/ntp目录下的600_ntp.py,直接把sys/ntp绑定上去即可。sys/ntp下的所有插件就都执行了。
33 |
34 | **6. 补充**
35 |
36 | portal上配置完成之后并不会立马生效,有个同步的过程,最终是agent通过调用hbs的接口获取的,需要一两分钟。上例我们绑定了sys/ntp,这实际是个目录,这个目录下的所有插件都会被执行,那什么样的文件会被看做插件呢?文件名是数字下划线打头的~这个数字代表的是step,即多长时间跑一次,单位是秒,比如60_a.py,就是在通过命名告诉agent,这个插件每60秒跑一次。sys/ntp目录下的子目录、其他命名方式的文件都会被忽略。
37 |
--------------------------------------------------------------------------------
/zh/practice/README.md:
--------------------------------------------------------------------------------
1 | Open-Falcon实践经验整理
2 |
--------------------------------------------------------------------------------
/zh/quick_install/README.md:
--------------------------------------------------------------------------------
1 | Open-Falcon,整体可以分为两部分,即绘图组件、告警组件。这两个部分都可以独立工作,其中:
2 |
3 | - [安装绘图组件](./graph_components.md) 负责数据的采集、收集、存储、归档、采样、查询、展示(Dashboard/Screen)等功能,可以单独工作,作为time-series data的一种存储展示方案。
4 | - [安装告警组件](./judge_components.md) 负责告警策略配置(portal)、告警判定(judge)、告警处理(alarm/sender)、用户组管理(uic)等,可以单独工作。
5 | - 如果你熟悉docker,想快速搭建并体验Open-Falcon的话,请参考 [使用Docker镜像安装Open-Falcon](https://github.com/frostynova/open-falcon-docker)
6 |
--------------------------------------------------------------------------------
/zh/quick_install/links.md:
--------------------------------------------------------------------------------
1 | 开启告警合并功能,需要完成一下两个步骤:
2 |
3 | ## 调整alarm的配置
4 |
5 | cd $WORKSPACE/alarm/
6 |
7 | 1. 将cfg.json中 highQueues 配置项的内容调整为
8 | [
9 | "event:p0",
10 | "event:p1"
11 | ]
12 | 2. 将cfg.json中 lowQueues 配置项的内容调整为
13 | [
14 | "event:p2",
15 | "event:p3",
16 | "event:p4",
17 | "event:p5",
18 | "event:p6"
19 | ]
20 |
21 | 说明:
22 | - 在Open-Falcon中,告警是分级别的,包括P0、P1 ... P6,告警优先级依次下降。
23 | - 对于高优先级的告警,Open-Falcon会保障优先发送。
24 | - 告警合并功能,只针对低优先级的告警生效,因为高优先级的告警一般都很重要,对实时性要求很高,不建议做告警合并。
25 | - 因此,在highQueues中配置的不会被合并,在lowQueues 中的会被合并,各位可以根据需求进行调整。
26 |
27 | ## 安装Links组件
28 |
29 | links组件的作用:当多个告警被合并为一条告警信息时,短信中会附带一个告警详情的http链接地址,供用户查看详情。
30 |
31 | ### install dependency
32 |
33 | # yum install -y python-virtualenv
34 | $ cd $WORKSPACE/links/
35 | $ virtualenv ./env
36 | $ ./env/bin/pip install -r pip_requirements.txt
37 |
38 |
39 | ### init database and config
40 |
41 | - database schema: https://github.com/open-falcon/scripts/blob/master/db_schema/links-db-schema.sql
42 | - database config: ./frame/config.py
43 | - 初始化Links的数据,也可以参考 [环境准备](https://github.com/open-falcon/doc/wiki/%E7%8E%AF%E5%A2%83%E5%87%86%E5%A4%87)有关Links的部分
44 |
45 |
46 | ### start
47 |
48 | $ cd $WORKSPACE/links/
49 | $ ./control start
50 | --> goto http://127.0.0.1:5090
51 |
52 | $ ./control tail
53 | --> tail log
54 |
55 |
56 |
--------------------------------------------------------------------------------
/zh/quick_install/prepare.md:
--------------------------------------------------------------------------------
1 | # 环境准备
2 |
3 | ### 安装redis
4 | yum install -y redis
5 |
6 | ### 安装mysql
7 | yum install -y mysql-server
8 |
9 | ### 创建工作目录
10 | ```bash
11 | export HOME=/home/work
12 | export WORKSPACE=$HOME/open-falcon
13 | mkdir -p $WORKSPACE
14 | cd $WORKSPACE
15 | ```
16 |
17 | ### 初始化mysql表结构
18 | ```bash
19 | # open-falcon所有组件都无需root账号启动,推荐使用普通账号安装,提升安全性。此处我们使用普通账号:work来安装部署所有组件
20 | # 当然了,使用yum安装依赖的一些lib库的时候还是要有root权限的。
21 |
22 | git clone https://github.com/open-falcon/scripts.git
23 | cd ./scripts/
24 | mysql -h localhost -u root --password="" < db_schema/graph-db-schema.sql
25 | mysql -h localhost -u root --password="" < db_schema/dashboard-db-schema.sql
26 |
27 | mysql -h localhost -u root --password="" < db_schema/portal-db-schema.sql
28 | mysql -h localhost -u root --password="" < db_schema/links-db-schema.sql
29 | mysql -h localhost -u root --password="" < db_schema/uic-db-schema.sql
30 | ```
31 |
32 |
33 | ### 下载编译好的组件
34 | ** 我们把相关组件编译成了二进制,方便大家直接使用,这些二进制只能跑在64位Linux上 **
35 |
36 | > 国内用户点这里高速下载编[译好的二进制版本](http://pan.baidu.com/s/1eR1cNj8)
37 |
38 | ```bash
39 | DOWNLOAD="https://github.com/open-falcon/of-release/releases/download/v0.1.0/open-falcon-v0.1.0.tar.gz"
40 | cd $WORKSPACE
41 |
42 | mkdir ./tmp
43 | #下载
44 | wget $DOWNLOAD -O open-falcon-latest.tar.gz
45 |
46 | #解压
47 | tar -zxf open-falcon-latest.tar.gz -C ./tmp/
48 | for x in `find ./tmp/ -name "*.tar.gz"`;do \
49 | app=`echo $x|cut -d '-' -f2`; \
50 | mkdir -p $app; \
51 | tar -zxf $x -C $app; \
52 | done
53 | ```
54 |
55 | ### Changelog
56 |
57 | http://book.open-falcon.com/zh/changelog/README.html
58 |
--------------------------------------------------------------------------------
/zh/usage/README.md:
--------------------------------------------------------------------------------
1 | open-falcon使用手册
2 |
3 |
--------------------------------------------------------------------------------
/zh/usage/docker.md:
--------------------------------------------------------------------------------
1 |
2 | # Docker容器监控实践
3 |
4 | 在[数据采集](../philosophy/data-collect.md)一节中我们介绍了常见的监控数据源。open-falcon作为一个监控框架,可以去采集任何系统的监控指标数据,只要将监控数据组织为open-falcon规范的格式就OK了。
5 |
6 | docker container的数据采集可以通过[micadvisor_open](https://github.com/open-falcon/micadvisor_open)来做。
7 |
8 | ## 工作原理
9 |
10 | micadvisor-open是基于open-falcon的docker容器资源监控插件,监控容器的cpu、内存、diskio以及网络io等,数据采集后上报到open-falcon
11 |
12 | ## 采集的指标
13 |
14 | | Counters | Notes|
15 | |-----|------|
16 | |cpu.busy|cpu使用情况百分比|
17 | |cpu.user|用户态使用的CPU百分比|
18 | |cpu.system|内核态使用的CPU百分比|
19 | |cpu.core.busy|每个cpu的使用情况|
20 | |mem.memused.percent|内存使用百分比|
21 | |mem.memused|内存使用原值|
22 | |mem.memtotal|内存总量|
23 | |mem.memused.hot|内存热使用情况|
24 | |disk.io.read_bytes|磁盘io读字节数|
25 | |disk.io.write_bytes|磁盘io写字节数|
26 | |net.if.in.bytes|网络io流入字节数|
27 | |net.if.in.packets|网络io流入包数|
28 | |net.if.in.errors|网络io流入出错数|
29 | |net.if.in.dropped|网络io流入丢弃数|
30 | |net.if.out.bytes|网络io流出字节数|
31 | |net.if.out.packets|网络io流出包数|
32 | |net.if.out.errors|网络io流出出错数|
33 | |net.if.out.dropped|网络io流出丢弃数|
34 |
35 | ## Contributors
36 | - mengzhuo: QQ:296142139; MAIL:mengzhuo@xiaomi.com
37 |
38 | ## 补充
39 | - 另外一个docker metric采集的lib库:https://github.com/projecteru/eru-metric
40 |
41 |
--------------------------------------------------------------------------------
/zh/usage/esxi.md:
--------------------------------------------------------------------------------
1 | # ESXi监控
2 |
3 | VMware的主体机器(host machine)是运行ESXi作业系统。没有办法安装Open-Falcon agent来监控,所以不能用普通的方式来做监控。
4 |
5 | ESXi作业系统设备的运行指标的采集,可以透过写脚本,通过SNMP协议来采集交换机的各项运行指标,包括内存占用、CPU使用、流量、磁盘用量等。[esxicollector](https://github.com/humorless/esxicollector)就是這樣子的腳本。
6 |
7 | ## 工作原理
8 |
9 | esxicollector是一系列整理过的脚本。由[humorless](https://github.com/humorless/)设计开发。
10 |
11 | esxicollector需要透过cronjob来配置。在一台可以跑cronjob的机器上,配置好cronjob。并且在esxi_collector.sh这个脚本中,写清楚要监控的设备、用来接受监控结果的Open-Falcon agent的位址。esxicollector就会照cronjob的时间间隔,预设是每分钟一次,定期地去采集ESXi作业系统设备的监控项,并透过上报到Open-Falcon的agent。
12 |
13 | 采集的metric列表:
14 |
15 | * CPU利用率
16 |
17 | `esxi.cpu.core`
18 |
19 | * 内存總量/利用率
20 |
21 | `esxi.cpu.memory.kliobytes.size`
22 | `esxi.cpu.memory.kliobytes.used`
23 | `esxi.cpu.memory.kliobytes.avail`
24 |
25 | * 运行的进程数
26 |
27 | `esxi.current.process`
28 |
29 | * 登入的使用者数
30 |
31 | `esxi.current.user`
32 |
33 | * 虚拟机器数
34 |
35 | `esxi.current.vhost`
36 |
37 | * 磁盤總量/利用率
38 |
39 | `esxi.df.size.kilobytes`
40 | `esxi.df.used.percentage`
41 |
42 | * 磁盤錯誤
43 |
44 | `esxi.disk.allocationfailure`
45 |
46 | * 網卡的輸出入流量/封包數
47 |
48 | `esxi.net.in.octets`
49 | `esxi.net.in.ucast.pkts`
50 | `esxi.net.in.multicast.pkts`
51 | `esxi.net.in.broadcast.pkts`
52 | `esxi.net.out.octets`
53 | `esxi.net.out.ucast.pkts`
54 | `esxi.net.out.multicast.pkts`
55 | `esxi.net.out.broadcast.pkts`
56 |
57 |
58 | ## 安装
59 |
60 | 从[这里](https://github.com/humorless/esxicollector)下载。
61 |
62 | 1. 安装SNMP指令
63 |
64 | `yum -y install net-snmp net-snmp-utils`
65 |
66 | 2. 下载VMware ESXi MIB档案,并且复制它们到资料夹`/usr/share/snmp/mibs`
67 |
68 | 3. 设置SNMP的环境
69 |
70 | `mkdir ~/.snmp`
71 | `echo "mibs +ALL" > ~/.snmp/snmp.conf`
72 |
73 | 4. 在`esxi_collector.sh`填入合适的参数
74 |
75 | 5. 设置cronjobs
76 |
77 | ` * * * * * esxi_collector.sh `
78 |
79 |
80 | ## 延伸开发新的监控项
81 |
82 | 脚本 ```snmp_queries.sh``` 会呼叫基本的snmp指令,并且输出snmp执行完的结果。可以透过比较执行 ```60_esxi_*.sh```的结果,来设计新的脚本。
83 |
--------------------------------------------------------------------------------
/zh/usage/func.md:
--------------------------------------------------------------------------------
1 | # 报警函数说明
2 |
3 | 配置报警策略的时候open-falcon支持多种报警触发函数,比如`all(#3)` `diff(#10)`等等,这些#后面的数字表示的是最新的历史点。比如`#3`代表的是最新的三个点。
4 |
5 | ```bash
6 | all(#3): 最新的3个点都满足阈值条件则报警
7 | max(#3): 对于最新的3个点,其最大值满足阈值条件则报警
8 | min(#3): 对于最新的3个点,其最小值满足阈值条件则报警
9 | sum(#3): 对于最新的3个点,其和满足阈值条件则报警
10 | avg(#3): 对于最新的3个点,其平均值满足阈值条件则报警
11 | diff(#3): 拿最新push上来的点(被减数),与历史最新的3个点(3个减数)相减,得到3个差,只要有一个差满足阈值条件则报警
12 | pdiff(#3): 拿最新push上来的点,与历史最新的3个点相减,得到3个差,再将3个差值分别除以减数,得到3个商值,只要有一个商值满足阈值则报警
13 | ```
14 |
15 | 最常用的就是`all`函数了,比如cpu.idle `all(#3) < 5`,表示cpu.idle的值连续3次小于5%则报警。
16 |
17 | diff和pdiff理解起来没那么容易,设计diff和pdiff是为了解决流量突增突降报警。实在看不懂,那只能去读代码了:https://github.com/open-falcon/judge/blob/master/store/func.go
18 |
--------------------------------------------------------------------------------
/zh/usage/haproxy.md:
--------------------------------------------------------------------------------
1 | #HAProxy 监控
2 |
3 | 在[数据采集](../philosophy/data-collect.md)一节中我们介绍了常见的监控数据源。open-falcon作为一个监控框架,可以去采集任何系统的监控指标数据,只要将监控数据组织为open-falcon规范的格式就OK了。
4 |
5 | HAProxy的数据采集可以通过[haproxymon](https://github.com/iask/haproxymon)来做。
6 |
7 | ## 工作原理
8 |
9 | haproxymon是一个cron,每分钟跑一次采集脚本```haproxymon.py```,haproxymon通过Haproxy的stats socket接口来采集Haproxy基础状态信息,比如qcur、scur、rate等,然后组装为open-falcon规定的格式的数据,post给本机的falcon-agent。falcon-agent提供了一个http接口,使用方法可以参考[数据采集](../philosophy/data-collect.md)中的例子。
--------------------------------------------------------------------------------
/zh/usage/jmx.md:
--------------------------------------------------------------------------------
1 | # jmxmon 简介
2 | jmxmon是一个基于open-falcon的jmx监控插件,通过这个插件,结合open-falcon agent,可以采集任何开启了JMX服务端口的java进程的服务状态,并将采集信息自动上报给open-falcon服务端
3 |
4 | ## 主要功能
5 |
6 | 通过jmx采集java进程的jvm信息,包括gc耗时、gc次数、gc吞吐、老年代使用率、新生代晋升大小、活跃线程数等信息。
7 |
8 | 对应用程序代码无侵入,几乎不占用系统资源。
9 |
10 |
11 | ## 采集指标
12 | | Counters | Type | Notes|
13 | |-----|------|------|
14 | | parnew.gc.avg.time | GAUGE | 一分钟内,每次YoungGC(parnew)的平均耗时 |
15 | | concurrentmarksweep.gc.avg.time | GAUGE | 一分钟内,每次CMSGC的平均耗时 |
16 | | parnew.gc.count | GAUGE | 一分钟内,YoungGC(parnew)的总次数 |
17 | | concurrentmarksweep.gc.count | GAUGE | 一分钟内,CMSGC的总次数 |
18 | | gc.throughput | GAUGE | GC的总吞吐率(应用运行时间/进程总运行时间) |
19 | | new.gen.promotion | GAUGE | 一分钟内,新生代的内存晋升总大小 |
20 | | new.gen.avg.promotion | GAUGE | 一分钟内,平均每次YoungGC的新生代内存晋升大小 |
21 | | old.gen.mem.used | GAUGE | 老年代的内存使用量 |
22 | | old.gen.mem.ratio | GAUGE | 老年代的内存使用率 |
23 | | thread.active.count | GAUGE | 当前活跃线程数 |
24 | | thread.peak.count | GAUGE | 峰值线程数 |
25 |
26 | ## 建议设置监控告警项
27 |
28 | 不同应用根据其特点,可以灵活调整触发条件及触发阈值
29 |
30 | | 告警项 | 触发条件 | 备注|
31 | |-----|------|------|
32 | | gc.throughput | all(#3)<98 | gc吞吐率低于98%,影响性能 |
33 | | old.gen.mem.ratio | all(#3)>90 | 老年代内存使用率高于90%,需要调优 |
34 | | thread.active.count | all(#3)>500 | 线程数过多,影响性能 |
35 |
36 |
37 | # 使用帮助
38 | 详细的使用方法常见:[jmxmon](https://github.com/toomanyopenfiles/jmxmon)
39 |
40 |
--------------------------------------------------------------------------------
/zh/usage/lvs.md:
--------------------------------------------------------------------------------
1 | # lvs-metrics 简介
2 | lvs-metrics是一个基于open-falcon的LVS监控插件,通过这个插件,结合open-falcon agent/transfer,可以采集LVS服务状态,并将采集信息自动上报给open-falcon服务端
3 |
4 | ## 主要功能
5 |
6 | 通过google开源的ipvs/netlink库及proc下文件采集lvs的监控信息,包括所有VIP的连接数(活跃/非活跃)/LVS主机的连接数(活跃/非活跃).进出数据包数/字节数.
7 |
8 | 对应用程序代码无侵入,几乎不占用系统资源。
9 |
10 |
11 | ## 采集指标
12 |
13 | | Counters | Type | Notes |
14 | |-----|-----|-----|
15 | | lvs.in.bytes | GUAGE | network in bytes per host |
16 | | lvs.out.bytes | GUAGE | network out bytes per host |
17 | | lvs.in.packets | GUAGE | network in packets per host |
18 | | lvs.out.packets | GUAGE | network out packets per host |
19 | | lvs.total.conns | GUAGE | lvs total connections per vip now |
20 | | lvs.active.conn | GUAGE | lvs active connections per vip now |
21 | | lvs.inact.conn | GUAGE | lvs inactive connections per vip now |
22 | | lvs.realserver.num | GUAGE | lvs live realserver num per vip now |
23 | | lvs.vip.conns | COUNTER | lvs conns counter from service start per vip |
24 | | lvs.vip.inbytes | COUNTER | lvs inbytes counter from service start per vip |
25 | | lvs.vip.outbytes | COUNTER | lvs outpkts counter from service start per vip |
26 | | lvs.vip.inpkts | COUNTER | lvs inpkts counter from service start per vip |
27 | | lvs.vip.outpkts | COUNTER | lvs outpkts counter from service start per vip |
28 |
29 |
30 | # 使用帮助
31 | 详细的使用方法常见:[lvs-metrics](https://github.com/mesos-utility/lvs-metrics)
32 |
33 |
--------------------------------------------------------------------------------
/zh/usage/memcache.md:
--------------------------------------------------------------------------------
1 | # Memcache监控
2 |
3 | 在[数据采集](../philosophy/data-collect.md)一节中我们介绍了常见的监控数据源。open-falcon作为一个监控框架,可以去采集任何系统的监控指标数据,只要将监控数据组织为open-falcon规范的格式就OK了。
4 |
5 | Memcache的数据采集可以通过采集脚本[memcached-monitor](https://github.com/iambocai/falcon-monit-scripts/tree/master/memcached)来做。
6 |
7 | ## 工作原理
8 |
9 | memcached-monitor是一个cron,每分钟跑一次采集脚本```memcached-monitor.py```,脚本可以自动检测Memcached的端口,并连到Memcached实例,采集一些监控指标,比如get_hit_ratio、usage等等,然后组装为open-falcon规定的格式的数据,post给本机的falcon-agent。falcon-agent提供了一个http接口,使用方法可以参考[数据采集](../philosophy/data-collect.md)中的例子。
10 |
11 | 比如,我们有1000台机器都部署了Memcached实例,可以在这1000台机器上分别部署1000个cron,即:与Memcached实例一一对应。
12 |
13 | 需要说明的是,脚本```memcached-monitor.py```通过```ps -ef |grep memcached|grep -v grep |sed -n 's/.* *-p *\([0-9]\{1,5\}\).*/\1/p```来自动发现Memcached端口的。如果Memcached启动时 没有通过 ```-p```参数来指定端口,端口的自动发现将失败,这时需要手动修改脚本、指定端口。
--------------------------------------------------------------------------------
/zh/usage/mesos.md:
--------------------------------------------------------------------------------
1 | # mesos监控
2 |
3 | mesos.py是leancloud开发的open-falcon插件脚本,通过这个插件,结合open-falcon agent/transfer,可以采集mesos相关数据,并将采集信息自动上报给open-falcon服务端
4 |
5 | [https://github.com/leancloud/satori/tree/master/satori-rules/plugin/mesos](https://github.com/leancloud/satori/tree/master/satori-rules/plugin/mesos)
6 |
--------------------------------------------------------------------------------
/zh/usage/mymon.md:
--------------------------------------------------------------------------------
1 | # MySQL监控实践
2 |
3 | 在[数据采集](../philosophy/data-collect.md)一节中我们介绍了常见的监控数据源。open-falcon作为一个监控框架,可以去采集任何系统的监控指标数据,只要将监控数据组织为open-falcon规范的格式就OK了。
4 |
5 | MySQL的数据采集可以通过[mymon](https://github.com/open-falcon/mymon)来做。
6 |
7 | ## 工作原理
8 |
9 | mymon是一个cron,每分钟跑一次,配置文件中配置了数据库连接地址,mymon连到该数据库,采集一些监控指标,比如global status, global variables, slave status等等,然后组装为open-falcon规定的格式的数据,post给本机的falcon-agent。falcon-agent提供了一个http接口,使用方法可以参考[数据采集](../philosophy/data-collect.md)中的例子。
10 |
11 | 比如我们有1000台机器都部署了MySQL实例,可以在这1000台机器上分别部署1000个cron,即:与数据库实例一一对应。
12 |
13 | ## 补充
14 | ***远程监控mysql实例***
15 | 如果希望通过hostA上的mymon、采集hostB上的mysql实例指标,你可以这样做:将hostA上mymon的配置文件中的"endpoint设置为hostB的机器名、同时将[mysql]配置项设置为hostB的mysql实例"。查看mysql指标、对mysql指标加策略时,需要找hostB机器名对应的指标。
16 |
--------------------------------------------------------------------------------
/zh/usage/ngx_metric.md:
--------------------------------------------------------------------------------
1 | # Nginx 监控
2 |
3 | 在[数据采集](../philosophy/data-collect.md)一节中我们介绍了常见的监控数据源。open-falcon作为一个监控框架,可以去采集任何系统的监控指标数据,只要将监控数据组织为open-falcon规范的格式就OK了。
4 |
5 | Nginx的数据采集可以通过[ngx_metric](https://github.com/GuyCheung/falcon-ngx_metric)来做。
6 |
7 | # 工作原理
8 |
9 | ngx_metric是借助lua-nginx-module的`log_by_lua`功能实现nginx请求的实时分析,然后借助`ngx.shared.DICT`存储中间结果。最后通过外部python脚本取出中间结果加以计算、格式化并输出。按falcon格式输出的结果可直接push到falcon agent。
10 |
11 | # 使用帮助
12 |
13 | 详细的使用方法常见:[ngx_metric](https://github.com/GuyCheung/falcon-ngx_metric)
14 |
--------------------------------------------------------------------------------
/zh/usage/nodata.md:
--------------------------------------------------------------------------------
1 | # Nodata配置
2 | 使用Nodata,需要进行两个配置: Nodata配置 和 策略配置。下面,我们以一个例子,讲述如何使用Nodata提供的服务。
3 |
4 | ### 用户需求
5 | 当机器分组`cop.xiaomi_owt.inf_pdl.falcon_service.task`下的所有机器,其采集指标 `agent.alive` 上报中断时,通知用户。
6 |
7 | ### Nodata配置
8 | 进入Nodata配置主页,点击右上角的添加按钮,添加nodata配置。
9 | 
10 |
11 | 进行完上述配置后,分组`cop.xiaomi_owt.inf_pdl.falcon_service.task`下的所有机器,其采集项 `agent.alive`上报中断后,nodata服务就会补发一个取值为 `-1.0`、agent.alive的监控数据给监控系统。
12 |
13 | ### 策略配置
14 | 配置了Nodata后,如果有数据上报中断的情况,Nodata配置中的默认值就会被上报。我们可以针对这个默认值,设置报警;只要收到了默认值,就认为发生了数据上报的中断(如果你设置的默认值,可能与正常上报的数据相等,那么请修改你的Nodata配置、使默认值有别于正常值)。将此策略,绑定到分组`cop.xiaomi_owt.inf_pdl.falcon_service.task`即可。
15 |
16 | 
17 |
18 | ### 注意事项
19 | 1. 配置名称name,要全局唯一。这是为了方便Nodata配置的管理。
20 | 2. 监控实例endpoint, 可以是机器分组、机器名或者其他 这三种类型,只能选择其中的一种。同一类型,支持多个记录,但建议不超过5个,多条记录换行分割、每行一条记录。选择机器分组时,系统会帮忙展开成具体机器名,支持动态生效。监控实体不是机器名时,只能选择“其他”类型。
21 | 3. 监控指标metric。
22 | 4. 数据标签tags,多个tag要用逗号隔开。必须填写完整的tags串,因为nodata会按照此tags串,去完全匹配、筛选监控数指标项。
23 | 5. 数据类型type,只支持原始值类型GAUGE。因为,nodata只应该监控 "特征指标"(如agent.alive),"特征指标"都是GAUGE类型的。
24 | 6. 采集周期step,单位是秒。必须填写 完整&真实step。该字段不完整 或者 不真实,将会导致nodata监控的误报、漏报。
25 | 7. 补发值default,必须有别于上报的真实数据。比如,`cpu.idle`的取值范围是[0,100],那么它的nodata默认取值 只能取小于0或者大于100的值。否则,会发生误报、漏报。
26 |
--------------------------------------------------------------------------------
/zh/usage/proc-port-monitor.md:
--------------------------------------------------------------------------------
1 | # 引言
2 |
3 | 我们说falcon-agent是无需配置即可自动化采集200多项监控指标数据,比如cpu相关的、内存相关的、磁盘io相关的、网卡相关的等等,都可以自动发现,自动采集。
4 |
5 | # 端口监控
6 |
7 | falcon-agent编写初期是把本机监听的所有端口上报给server端,比如机器监听了80、443、22三个端口,就会自动上报三条数据:
8 |
9 | ```
10 | net.port.listen/port=22
11 | net.port.listen/port=80
12 | net.port.listen/port=443
13 | ```
14 |
15 | 上报的端口数据,value是1,如果后来某些端口不再监听了,那就会停止上报数据。这样是否OK呢?存在两个问题:
16 |
17 | - 机器监听的端口可能很多很多,但是真正想做监控的端口可能不多,这会造成资源浪费
18 | - 目前Open-Falcon还不支持nodata监控,端口挂了不上报数据了,没有nodata机制,是发现不了的
19 |
20 | 改进之。
21 |
22 | agent到底要采集哪些端口是通过用户配置的策略自动计算得出的。因为无论如何,监控配置策略是少不了的。比如用户配置了2个端口:
23 |
24 | ```
25 | net.port.listen/port=8080 if all(#3) == 0 then alarm()
26 | net.port.listen/port=8081 if all(#3) == 0 then alarm()
27 | ```
28 |
29 | 将策略绑定到某个HostGroup,那么这个HostGroup下的机器就要去采集8080和8081这俩端口的情况了。这个信息是通过agent和hbs的心跳机制下发的。
30 |
31 | agent通过`ss -tln`拿到当前有哪些端口在监听,如果8080在监听,就设置value=1,汇报给transfer,如果发现8081没在监听,就设置value=0,汇报给transfer。
32 |
33 | # 进程监控
34 |
35 | 进程监控和端口监控类似,也是通过用户配置的策略自动计算出来要采集哪个进程的信息然后上报。举个例子:
36 |
37 | ```
38 | proc.num/name=ntpd if all(#2) == 0 then alarm()
39 | proc.num/name=crond if all(#2) == 0 then alarm()
40 | proc.num/cmdline=uic.properties if all(#2) == 0 then alarm()
41 | ```
42 |
43 | proc.num表示进程数,比如进程名叫做crond的进程,其实可以有多个。支持两种tag配置,一个是进程name,一个是配置进程cmdline,但是不能同时出现。
44 |
45 | 那现在DEV写了一个程序,我怎么知道进程名呢?
46 | 首先要拿到进程ID,然后`cat /proc/$pid/status`,看到里面的name字段了么?falcon-agent就是根据这个name字段来采集的。此处有个坑,就是这个name字段最多15个字节,所以,如果你的进程名特别长可能被截断,截断之前的原始进程名我们不管,agent以这个status文件中的name为准。所以,你配置name这个tag的时候,一定要看一眼这个status文件,从这里获取name,而不是想当然的去写一个你自认为对的进程名。
47 |
48 | 再说说cmdline,name是从`/proc/$pid/status`文件采集的,cmdline是从`/proc/$pid/cmdline`采集的。这个文件存放的是你启动进程的时候用到的命令,比如你用`java -c uic.properties`启动了一个Java进程,进程名是java,其实所有的java进程,进程名都是java,那我们是没法通过name字段做区分的。怎么办呢?此时就要求助于这个`/proc/$pid/cmdline`文件的内容了。
49 |
50 | cmdline中的内容是你的启动命令,这么说不准确,你会发现空格都没了。其实是把空格自动替换成`\0`了。不用关心,直接鼠标选中,拷贝之即可。不要自以为是的手工加空格配置到策略中哈,监控策略的tag是不允许有空格的。
51 |
52 | 上面的例子,`java -c uic.properties`在cmdline中的内容会变成:`java-cuic.properties`,无需把整个cmdline都拷贝并配置到策略中。虽然name这个tag是全匹配的,即用的`==`比较name,但是cmdline不是,我们只需要拷贝cmdline的一部分字符串,能够与其他进程区分开即可。比如上面的配置:
53 |
54 | ```
55 | proc.num/cmdline=uic.properties if all(#2) == 0 then alarm()
56 | ```
57 |
58 | 就已经OK了。falcon-agent拿到cmdline文件的内容之后会使用`strings.Contains()`方法来做判断
59 |
60 | 听起来是不是挺复杂的?呵呵,如果你的进程有端口在监听,就配置一个端口监控就可以了,无需既配置端口监控、又配置进程监控,毕竟如果进程挂了,端口肯定就不会监听了。
61 |
62 |
63 |
--------------------------------------------------------------------------------
/zh/usage/query.md:
--------------------------------------------------------------------------------
1 | # 历史数据查询
2 |
3 | 任何push到open-falcon中的数据,事后都可以通过query组件提供的API,来查询得到。
4 |
5 | ## 查询历史数据
6 | 查询过去一段时间内的历史数据,使用接口 `HTTP POST /graph/history`。该接口不能查询最新上报的两个数据点。一个python例子,如下
7 |
8 | ```python
9 | #-*- coding:utf8 -*-
10 |
11 | import requests
12 | import time
13 | import json
14 |
15 | end = int(time.time()) # 起始时间戳
16 | start = end - 3600 # 截至时间戳 (例子中为查询过去一个小时的数据)
17 |
18 | d = {
19 | "start": start,
20 | "end": end,
21 | "cf": "AVERAGE",
22 | "endpoint_counters": [
23 | {
24 | "endpoint": "host1",
25 | "counter": "cpu.idle",
26 | },
27 | {
28 | "endpoint": "host1",
29 | "counter": "load.1min",
30 | },
31 | ],
32 | }
33 |
34 | query_api = "http://127.0.0.1:9966/graph/history"
35 | r = requests.post(query_api, data=json.dumps(d))
36 | print r.text
37 |
38 | ```
39 | 其中,
40 | 1. start: 要查询的历史数据起始时间点(为UNIX时间戳形式)
41 | 2. end: 要查询的历史数据结束时间点(为UNIX时间戳形式)
42 | 3. cf: 指定的采样方式,可以选择的有:AVERAGE、MAX、MIN
43 | 4. endpoint_counters: 数组,其中每个元素为 endpoint和counter组成的键值对, 其中counter是由metric/sorted(tags)构成的,没有tags的话就是metric本身。
44 | 5. query_api: query组件的监听地址 + api
45 |
46 |
47 | ## 查询最新上报的数据
48 | 查询最新上报的一个数据点,使用接口`HTTP POST /graph/last`。一个bash的例子,如下
49 |
50 | ```bash
51 | #!/bin/bash
52 | if [ $# != 2 ];then
53 | printf "format:./last \"endpoint\" \"counter\"\n"
54 | exit 1
55 | fi
56 |
57 | # args
58 | endpoint=$1
59 | counter=$2
60 |
61 | # form request body
62 | req="[{\"endpoint\":\"$endpoint\", \"counter\":\"$counter\"}]"
63 |
64 | # request
65 | url="http://127.0.0.1:9966/graph/last"
66 | curl -s -X POST -d "$req" "$url" | python -m json.tool
67 |
68 | ```
69 |
--------------------------------------------------------------------------------
/zh/usage/rabbitmq.md:
--------------------------------------------------------------------------------
1 | # RMQ监控
2 |
3 | 在[数据采集](../philosophy/data-collect.md)一节中我们介绍了常见的监控数据源。open-falcon作为一个监控框架,可以去采集任何系统的监控指标数据,只要将监控数据组织为open-falcon规范的格式就OK了。
4 |
5 | RMQ的数据采集可以通过脚本[rabbitmq-monitor](https://github.com/iambocai/falcon-monit-scripts/tree/master/rabbitmq)来做。
6 |
7 | ## 工作原理
8 |
9 | rabbitmq-monitor是一个cron,每分钟跑一次脚本```rabbitmq-monitor.py```,其中配置了RMQ的用户名&密码等,脚本连到该RMQ实例,采集一些监控指标,比如messages_ready、messages_total、deliver_rate、publish_rate等等,然后组装为open-falcon规定的格式的数据,post给本机的falcon-agent。falcon-agent提供了一个http接口,使用方法可以参考[数据采集](../philosophy/data-collect.md)中的例子。
10 |
11 | 比如我们部署了5个RMQ实例,可以在 每个RMQ实例机器上运行一个cron,即:与RMQ实例一一对应。
12 |
--------------------------------------------------------------------------------
/zh/usage/redis.md:
--------------------------------------------------------------------------------
1 | # Redis监控
2 |
3 | 在[数据采集](../philosophy/data-collect.md)一节中我们介绍了常见的监控数据源。open-falcon作为一个监控框架,可以去采集任何系统的监控指标数据,只要将监控数据组织为open-falcon规范的格式就OK了。
4 |
5 | Redis的数据采集可以通过采集脚本[redis-monitor](https://github.com/iambocai/falcon-monit-scripts/tree/master/redis) 或者 [redismon](https://github.com/ZhuoRoger/redismon)来做。
6 |
7 | ## 工作原理
8 |
9 | redis-monitor是一个cron,每分钟跑一次采集脚本```redis-monitor.py```,其中配置了redis服务的地址,redis-monitor连到redis实例,采集一些监控指标,比如connected_clients、used_memory等等,然后组装为open-falcon规定的格式的数据,post给本机的falcon-agent。falcon-agent提供了一个http接口,使用方法可以参考[数据采集](../philosophy/data-collect.md)中的例子。
10 |
11 | 比如,我们有1000台机器都部署了Redis实例,可以在这1000台机器上分别部署1000个cron,即:与Redis实例一一对应。
12 |
--------------------------------------------------------------------------------
/zh/usage/solr.md:
--------------------------------------------------------------------------------
1 | # Solr监控
2 |
3 | 在[数据采集](../philosophy/data-collect.md)一节中我们介绍了常见的监控数据源。open-falcon作为一个监控框架,可以去采集任何系统的监控指标数据,只要将监控数据组织为open-falcon规范的格式就OK了。
4 |
5 | Solr的数据采集可以通过脚本[solr_monitor](https://github.com/shanshouchen/falcon-scripts/tree/master/solr-monitor)来做。
6 |
7 | ## 工作原理
8 |
9 | solr_monitor是一个cron,每分钟跑一次脚本```solr_monitor.py```,主要采集一些solr实例内存信息和缓存命中信息等等,然后组装为open-falcon规定的格式的数据,post给本机的falcon-agent。
10 |
11 | 脚本可以部署到Solr的各个实例,每个实例上运行一个cron,定时执行数据收集,即:与Solr实例一一对应
12 |
13 | 如果一台服务器存在多个Solr实例,可以通过修改```solr_monitor.py```中的```servers```属性,增加Solr实例的地址完成本地一对多的数据收集
14 |
--------------------------------------------------------------------------------
/zh/usage/urlooker.md:
--------------------------------------------------------------------------------
1 | ## [urlooker](https://github.com/710leo/urlooker)
2 | 监控web服务可用性及访问质量,采用go语言编写,易于安装和二次开发
3 |
4 | ## Feature
5 | - 返回状态码检测
6 | - 页面响应时间检测
7 | - 页面关键词匹配检测
8 | - 自定义Header
9 | - GET、POST、PUT访问
10 | - 自定义POST BODY
11 | - 检测结果支持推送 open-falcon
12 |
13 | ## Architecture
14 | 
15 |
16 | ## ScreenShot
17 |
18 | 
19 | 
20 |  21 |
22 | ## 常见问题
23 | - [wiki手册](https://github.com/710leo/urlooker/wiki)
24 | - [常见问题](https://github.com/710leo/urlooker/wiki/FAQ)
25 | - 初始用户名密码:admin/password
26 |
27 | ## Install
28 | #### docker 安装
29 |
30 | ```bash
31 | git clone https://github.com/710leo/urlooker.git
32 | cd urlooker
33 | docker build .
34 | docker volume create urlooker-vol
35 | # [CONTAINER ID] 在实际操作中需要替换为实际的镜像的ID
36 | docker run -p 1984:1984 -d --name urlooker --mount source=urlooker-vol,target=/var/lib/mysql --restart=always [CONTAINER ID]
37 | ```
38 |
39 | #### 源码安装
40 |
41 | ```bash
42 | # 安装mysql
43 | yum install -y mysql-server
44 | wget https://raw.githubusercontent.com/710leo/urlooker/master/sql/schema.sql
45 | mysql -h 127.0.0.1 -u root -p < schema.sql
46 |
47 | # 安装组件
48 | curl https://raw.githubusercontent.com/710leo/urlooker/master/install.sh|bash
49 | cd $GOPATH/src/github.com/710leo/urlooker
50 |
51 | # 将[mysql root password]替换为mysql root 数据库密码
52 | sed -i 's/urlooker.pass/[mysql root password]/g' configs/web.yml
53 |
54 | ./control start all
55 | ```
56 |
57 | 打开浏览器访问 http://127.0.0.1:1984 即可
58 |
59 | ## 答疑
60 | QQ群:556988374
--------------------------------------------------------------------------------
/zh/usage/win.md:
--------------------------------------------------------------------------------
1 | # 监控Windows平台
2 |
3 | 在[数据采集](../philosophy/data-collect.md)一节中我们介绍了常见的监控数据源。open-falcon作为一个监控框架,可以去采集任何系统的监控指标数据,只要将监控数据组织为open-falcon规范的格式就OK了。
4 |
5 | Windows主机的运行指标的采集,可以写Python脚本,通过windows的计划任务来每分钟执行采集各项运行指标,包括内存占用、CPU使用、磁盘使用量、网卡流量等。
6 |
7 | 可以直接使用以下 window 监控程序进行 windows 主机的监控指标采集。
8 |
9 | - [windows_collect](https://github.com/freedomkk-qfeng/falcon-scripts/tree/master/windows_collect):python脚本
10 | - [windows-agent](https://github.com/LeonZYang/agent): go 语言实现的 agent
11 | - [Windows-Agent](https://github.com/AutohomeRadar/Windows-Agent):汽车之家开源的作为Windows Service运行的Agent,python实现。
12 | - [windows-agent](https://github.com/freedomkk-qfeng/windows-agent):另一个 go 语言实现的 windows-agent。支持端口,进程监控,支持后台服务运行。
13 |
14 |
--------------------------------------------------------------------------------
/zh_0_2/GLOSSARY.md:
--------------------------------------------------------------------------------
1 |
2 |
3 |
--------------------------------------------------------------------------------
/zh_0_2/README.md:
--------------------------------------------------------------------------------
1 |
2 |
3 | [OpenFalcon](http://open-falcon.com)是一款企业级、高可用、可扩展的开源监控解决方案。
4 |
5 | 在大家的热心支持和帮助下,OpenFalcon 已经成为国内最流行的监控系统之一。
6 |
7 | 目前:
8 | - 在 [github](https://github.com/open-falcon/falcon-plus) 上取得了数千个star,数百次fork,上百个pull-request;
9 | - 社区用户6000+;
10 | - 超过200家公司都在不同程度使用open-falcon,包括大陆、新加坡、台湾等地;
11 | - 社区贡献了包括MySQL、redis、windows、交换机、LVS、Mongodb、Memcache、docker、mesos、URL监控等多种插件支持;
12 |
13 | -----
14 | **Acknowledgements**
15 |
16 | - OpenFalcon was initially started by Xiaomi and we would also like to acknowledge contributions by engineers from [these companies](./contributing.html) and [these individual developers](./contributing.html).
17 | - The OpenFalcon logo and website were contributed by Cepave Design Team.
18 | - [Wei Lai](https://github.com/laiwei) is the founder of OpenFalcon software and community.
19 | - The [english doc](http://book.open-falcon.com/en/index.html) is translated by [宋立岭](https://github.com/songliling).
20 |
21 | -----
22 |
23 | NOTICE:
24 |
25 | 1. QQ群已全部满员,请添加我的微信 `laiweivic` ,注明个人介绍和来源自open-falcon,我会拉你进入交流群组;
26 | 2. 我们更推荐您升级到[夜莺监控](https://github.com/ccfos/nightingale): 关于open-falcon和夜莺的对比介绍,请参考阅读[云原生监控的十个特点和趋势](https://mp.weixin.qq.com/s?__biz=MzkzNjI5OTM5Nw==&mid=2247483738&idx=1&sn=e8bdbb974a2cd003c1abcc2b5405dd18&chksm=c2a19fb0f5d616a63185cd79277a79a6b80118ef2185890d0683d2bb20451bd9303c78d083c5#rd);
27 |
28 |
29 | 请大家优先在 github 上提交 [issue](https://github.com/open-falcon/falcon-plus/issues), 方便问题沉淀,github issue 会最高优先级解决。
30 | - QQ五群:42607978 (已满员)
31 | - QQ四群:697503992 (已满员)
32 | - QQ一群:373249123 (已满员)
33 | - QQ二群:516088946 (已满员)
34 | - QQ三群:469342415 (已满员)
35 |
36 |
37 |
38 |
--------------------------------------------------------------------------------
/zh_0_2/api/README.md:
--------------------------------------------------------------------------------
1 | # open-falcon api
2 | - [api v0.2](http://open-falcon.com/falcon-plus/)
3 |
--------------------------------------------------------------------------------
/zh_0_2/authors.md:
--------------------------------------------------------------------------------
1 | ../zh/authors.md
--------------------------------------------------------------------------------
/zh_0_2/contributing.md:
--------------------------------------------------------------------------------
1 | ../zh/contributing.md
--------------------------------------------------------------------------------
/zh_0_2/dev/README.md:
--------------------------------------------------------------------------------
1 |
2 |
3 | # 环境准备
4 |
5 | 请参考[环境准备](quick_install/prepare.md)
6 | # 自定义修改归档策略
7 | 修改open-falcon/graph/rrdtool/rrdtool.go
8 |
9 | 
10 | 
11 |
12 | 重新编译graph组件,并替换原有的二进制
13 |
14 | 清理掉原来的所有rrd文件(默认在/home/work/data/6070/下面)
15 |
16 | # 插件机制
17 | 1. 找一个git存放公司的所有插件
18 | 2. 通过调用agent的/plugin/update接口拉取插件repo到本地
19 | 3. 在portal中配置哪些机器可以执行哪些插件
20 | 4. 插件命名方式:$step_xx.yy,需要有可执行权限,分门别类存放到repo的各个目录
21 | 5. 把采集到的数据打印到stdout
22 | 6. 如果觉得git方式不方便,可以改造agent,定期从某个http地址下载打包好的plugin.tar.gz
23 |
24 |
--------------------------------------------------------------------------------
/zh_0_2/dev/change_graph_rra.md:
--------------------------------------------------------------------------------
1 |
2 |
3 | ## 修改绘图曲线精度
4 |
5 | 默认的,Open-Falcon只保存最近12小时的原始监控数据,12小时之后的数据被降低精度、采样存储。
6 |
7 | 如果默认的精度不能满足你的需求,可以按照如下步骤,修改绘图曲线的存储精度。
8 |
9 | #### 第一步,修改graph组件的RRA,并重新编译graph组件
10 | graph组件的RRA,定义在文件 graph/rrdtool/[rrdtool.go](https://github.com/open-falcon/graph/blob/master/rrdtool/rrdtool.go#L57)中,默认如下:
11 |
12 | ```golang
13 | // RRA.Point.Size
14 | const (
15 | RRA1PointCnt = 720 // 1m一个点存12h
16 | RRA5PointCnt = 576 // 5m一个点存2d
17 | // ...
18 | )
19 |
20 | func create(filename string, item *cmodel.GraphItem) error {
21 | now := time.Now()
22 | start := now.Add(time.Duration(-24) * time.Hour)
23 | step := uint(item.Step)
24 |
25 | c := rrdlite.NewCreator(filename, start, step)
26 | c.DS("metric", item.DsType, item.Heartbeat, item.Min, item.Max)
27 |
28 | // 设置各种归档策略
29 | // 1分钟一个点存 12小时
30 | c.RRA("AVERAGE", 0.5, 1, RRA1PointCnt)
31 |
32 | // 5m一个点存2d
33 | c.RRA("AVERAGE", 0.5, 5, RRA5PointCnt)
34 | c.RRA("MAX", 0.5, 5, RRA5PointCnt)
35 | c.RRA("MIN", 0.5, 5, RRA5PointCnt)
36 |
37 | // ...
38 |
39 | return c.Create(true)
40 | }
41 |
42 | ```
43 |
44 | 比如,你只想保存90天的原始数据,可以将代码修改为:
45 |
46 | ```golang
47 | // RRA.Point.Size
48 | const (
49 | RRA1PointCnt = 129600 // 1m一个点存90d,取值 90*24*3600/60
50 | )
51 |
52 | func create(filename string, item *cmodel.GraphItem) error {
53 | now := time.Now()
54 | start := now.Add(time.Duration(-24) * time.Hour)
55 | step := uint(item.Step)
56 |
57 | c := rrdlite.NewCreator(filename, start, step)
58 | c.DS("metric", item.DsType, item.Heartbeat, item.Min, item.Max)
59 |
60 | // 设置各种归档策略
61 | // 1分钟一个点存 90d
62 | c.RRA("AVERAGE", 0.5, 1, RRA1PointCnt)
63 |
64 | return c.Create(true)
65 | }
66 | ```
67 |
68 | #### 第二步,清除graph的历史数据
69 | 清除已上报的所有指标的历史数据,即删除所有的rrdfile。不删除历史数据,已上报指标的精度更改将不能生效。
70 |
71 | #### 第三步,重新部署graph服务
72 | 编译修改后的graph源码,关停原有的graph老服务、发布修改后的graph。
73 |
74 | 只需要修改graph组件、不需要修改Open-Falcon的其他组件,新的精度就能生效。你可以通过Dashboard、Screen来查看新的精度的绘图曲线。
75 |
76 |
77 |
78 | ### 注意事项:
79 |
80 | 修改监控绘图曲线精度时,需要:
81 |
82 | + 修改graph源代码,更新RRA
83 | + 清除graph的历史数据。不删除历史数据,已上报指标的精度更改将不能生效
84 | + 除了graph之外,Open-Falcon的其他任何组件 不需要被修改
85 | + 修改RRA后,可能会出现"绘图曲线点数过多、浏览器被卡死"的问题。请合理规划RRA存储的点数,或者调整绘图曲线查询时的时间段选择。
86 |
87 |
88 |
--------------------------------------------------------------------------------
/zh_0_2/dev/support_grafana.md:
--------------------------------------------------------------------------------
1 |
2 |
3 | ## 支持 Grafana 视图展现
4 |
5 | 相较于 Open-Falcon 内建的 Dashboard,Grafana 可以很有弹性的自定义图表,并且可以针对 Dashboard 做权限控管、上标签以及查询,图表的展示选项也更多样化。本篇教学帮助您
6 | 做好 Open-Falcon 的面子工程!
7 |
8 | ### 安装和使用步骤
9 |
10 | 请参考 [grafana open-falcon](https://github.com/open-falcon/grafana-openfalcon-datasource)
11 |
12 |
13 | ### 致谢
14 | - 感谢fastweb @kordan @masato25 等朋友的贡献;
15 |
--------------------------------------------------------------------------------
/zh_0_2/distributed_install/README.md:
--------------------------------------------------------------------------------
1 |
2 |
3 | # 概述
4 |
5 | Open-Falcon是一个比较大的分布式系统,有十几个组件。按照功能,这十几个组件可以划分为 基础组件、作图链路组件和报警链路组件,其安装部署的架构如下图所示,
6 |
7 | 
8 |
9 | ## 在单台机器上快速安装
10 |
11 | 请直接参考[quick_install](../quick_install/README.md)
12 |
13 | ## Docker化的Open-Falcon安装
14 |
15 | 参考:
16 | - https://github.com/open-falcon/falcon-plus/blob/master/docker/README.md
17 | - https://github.com/open-falcon/dashboard/blob/master/README.md
18 |
19 | ## 在多台机器上分布式安装
20 |
21 | 在多台机器上,分布式安装open-falcon,就是本章的内容,请按照本章节的顺序,安装每个组件。
22 |
23 | ## 视频教程教你安装
24 |
25 | 《[Open-Falcon部署与架构解析](http://www.jikexueyuan.com/course/1651.html)》
26 |
27 |
--------------------------------------------------------------------------------
/zh_0_2/distributed_install/agent-updater.md:
--------------------------------------------------------------------------------
1 |
2 |
3 | # Agent-updater
4 |
5 | 每台机器都要部署falcon-agent,如果公司机器量比较少,用pssh、ansible、fabric之类的工具手工安装问题也不大。但是公司机器量多了之后,手工安装、升级、回滚falcon-agent将成为噩梦。
6 |
7 | 个人开发了agent-updater这个工具,用于管理falcon-agent,agent-updater也有一个agent:ops-updater,可以看做是一个超级agent,用于管理其他agent的agent,呵呵,ops-updater推荐在装机的时候一起安装上。ops-updater通常是不会升级的。
8 |
9 | 具体参看:https://github.com/open-falcon/ops-updater
10 |
11 | 如果你想学习如何使用Go语言编写一个完整的项目,也可以研究一下agent-updater,我甚至录制了一个视频教程来演示一步一步如何开发出来的。课程链接:
12 |
13 | - http://www.jikexueyuan.com/course/1336.html
14 | - http://www.jikexueyuan.com/course/1357.html
15 | - http://www.jikexueyuan.com/course/1462.html
16 | - http://www.jikexueyuan.com/course/1490.html
17 |
18 |
--------------------------------------------------------------------------------
/zh_0_2/distributed_install/aggregator.md:
--------------------------------------------------------------------------------
1 |
2 |
3 | # Aggregator
4 |
5 | 集群聚合模块。聚合某集群下的所有机器的某个指标的值,提供一种集群视角的监控体验。
6 |
7 |
8 | ## 服务部署
9 | 服务部署,包括配置修改、启动服务、检验服务、停止服务等。这之前,需要将安装包解压到服务的部署目录下。
10 |
11 | ```
12 | # 修改配置, 配置项含义见下文
13 | mv cfg.example.json cfg.json
14 | vim cfg.json
15 |
16 | # 启动服务
17 | ./open-falcon start aggregator
18 |
19 | # 检查log
20 | ./open-falcon monitor aggregator
21 |
22 | # 停止服务
23 | ./open-falcon stop aggregator
24 |
25 | ```
26 |
27 |
28 | ## 配置说明
29 | 配置文件默认为./cfg.json。默认情况下,安装包会有一个cfg.example.json的配置文件示例。各配置项的含义,如下
30 |
31 | ```
32 | {
33 | "debug": true,
34 | "http": {
35 | "enabled": true,
36 | "listen": "0.0.0.0:6055"
37 | },
38 | "database": {
39 | "addr": "root:@tcp(127.0.0.1:3306)/falcon_portal?loc=Local&parseTime=true",
40 | "idle": 10,
41 | "ids": [1, -1],
42 | "interval": 55
43 | },
44 | "api": {
45 | "connect_timeout": 500,
46 | "request_timeout": 2000,
47 | "plus_api": "http://127.0.0.1:8080", #falcon-plus api模块的运行地址
48 | "plus_api_token": "default-token-used-in-server-side", #和falcon-plus api 模块交互的认证token
49 | "push_api": "http://127.0.0.1:1988/v1/push" #push数据的http接口,这是agent提供的接口
50 | }
51 | }
52 |
53 |
54 | ```
55 |
--------------------------------------------------------------------------------
/zh_0_2/distributed_install/api.md:
--------------------------------------------------------------------------------
1 |
2 |
3 | # API
4 | api组件,提供统一的restAPI操作接口。比如:api组件接收查询请求,根据一致性哈希算法去相应的graph实例查询不同metric的数据,然后汇总拿到的数据,最后统一返回给用户。
5 |
6 | ## 服务部署
7 | 服务部署,包括配置修改、启动服务、检验服务、停止服务等。这之前,需要将安装包解压到服务的部署目录下。
8 |
9 | ```
10 | # 修改配置, 配置项含义见下文, 注意graph集群的配置
11 | mv cfg.example.json cfg.json
12 | vim cfg.json
13 |
14 | # 启动服务
15 | ./open-falcon start api
16 |
17 | # 停止服务
18 | ./open-falcon stop api
19 |
20 | # 查看日志
21 | ./open-falcon monitor api
22 |
23 | ```
24 |
25 | ## 配置说明
26 |
27 | 注意: 请确保 `graphs`的内容与transfer的配置**完全一致**
28 |
29 | ```
30 | {
31 | "log_level": "debug",
32 | "db": { //数据库相关的连接配置信息
33 | "faclon_portal": "root:@tcp(127.0.0.1:3306)/falcon_portal?charset=utf8&parseTime=True&loc=Local",
34 | "graph": "root:@tcp(127.0.0.1:3306)/graph?charset=utf8&parseTime=True&loc=Local",
35 | "uic": "root:@tcp(127.0.0.1:3306)/uic?charset=utf8&parseTime=True&loc=Local",
36 | "dashboard": "root:@tcp(127.0.0.1:3306)/dashboard?charset=utf8&parseTime=True&loc=Local",
37 | "alarms": "root:@tcp(127.0.0.1:3306)/alarms?charset=utf8&parseTime=True&loc=Local",
38 | "db_bug": true
39 | },
40 | "graphs": { // graph模块的部署列表信息
41 | "cluster": {
42 | "graph-00": "127.0.0.1:6070"
43 | },
44 | "max_conns": 100,
45 | "max_idle": 100,
46 | "conn_timeout": 1000,
47 | "call_timeout": 5000,
48 | "numberOfReplicas": 500
49 | },
50 | "metric_list_file": "./api/data/metric",
51 | "web_port": ":8080", // http监听端口
52 | "access_control": true, // 如果设置为false,那么任何用户都可以具备管理员权限
53 | "salt": "pleaseinputwhichyouareusingnow", //数据库加密密码的时候的salt
54 | "skip_auth": false, //如果设置为true,那么访问api就不需要经过认证
55 | "default_token": "default-token-used-in-server-side", //用于服务端各模块间的访问授权
56 | "gen_doc": false,
57 | "gen_doc_path": "doc/module.html"
58 | }
59 |
60 |
61 |
62 | ```
63 |
64 | ## 补充说明
65 | - 部署完成api组件后,请修改dashboard组件的配置、使其能够正确寻址到api组件。
66 | - 请确保api组件的graph列表 与 transfer的配置 一致。
67 |
--------------------------------------------------------------------------------
/zh_0_2/distributed_install/gateway.md:
--------------------------------------------------------------------------------
1 |
2 |
3 | # Gateway
4 |
5 | **如果您没有遇到机房分区问题,请直接忽略此组件**。
6 |
7 | 如果您已经遇到机房分区问题、并急需解决机房分区时监控数据回传的问题,请使用该组件。更多的资料在[这里](https://github.com/open-falcon/falcon-plus/blob/master/modules/gateway/README.md)。
8 |
--------------------------------------------------------------------------------
/zh_0_2/distributed_install/graph.md:
--------------------------------------------------------------------------------
1 |
2 |
3 | # Graph
4 |
5 | graph是存储绘图数据的组件。graph组件 接收transfer组件推送上来的监控数据,同时处理api组件的查询请求、返回绘图数据。
6 |
7 | ## 服务部署
8 | 服务部署,包括配置修改、启动服务、检验服务、停止服务等。这之前,需要将安装包解压到服务的部署目录下。
9 |
10 | ```
11 | # 修改配置, 配置项含义见下文
12 | mv cfg.example.json cfg.json
13 | vim cfg.json
14 |
15 | # 启动服务
16 | ./open-falcon start graph
17 |
18 | # 停止服务
19 | ./open-falcon stop graph
20 |
21 | # 查看日志
22 | ./open-falcon monitor graph
23 |
24 | ```
25 |
26 | ## 配置说明
27 | 配置文件默认为./cfg.json。默认情况下,安装包会有一个cfg.example.json的配置文件示例。各配置项的含义,如下
28 |
29 | ```
30 | {
31 | "debug": false, //true or false, 是否开启debug日志
32 | "http": {
33 | "enabled": true, //true or false, 表示是否开启该http端口,该端口为控制端口,主要用来对graph发送控制命令、统计命令、debug命令
34 | "listen": "0.0.0.0:6071" //表示监听的http端口
35 | },
36 | "rpc": {
37 | "enabled": true, //true or false, 表示是否开启该rpc端口,该端口为数据接收端口
38 | "listen": "0.0.0.0:6070" //表示监听的rpc端口
39 | },
40 | "rrd": {
41 | "storage": "./data/6070" // 历史数据的文件存储路径(如有必要,请修改为合适的路)
42 | },
43 | "db": {
44 | "dsn": "root:@tcp(127.0.0.1:3306)/graph?loc=Local&parseTime=true", //MySQL的连接信息,默认用户名是root,密码为空,host为127.0.0.1,database为graph(如有必要,请修改)
45 | "maxIdle": 4 //MySQL连接池配置,连接池允许的最大连接数,保持默认即可
46 | },
47 | "callTimeout": 5000, //RPC调用超时时间,单位ms
48 | "ioWorkerNum": 64, //底层io.Worker的数量, 注意: 这个功能是v0.2.1版本之后引入的,v0.2.1版本之前的配置文件不需要该参数
49 | "migrate": { //扩容graph时历史数据自动迁移
50 | "enabled": false, //true or false, 表示graph是否处于数据迁移状态
51 | "concurrency": 2, //数据迁移时的并发连接数,建议保持默认
52 | "replicas": 500, //这是一致性hash算法需要的节点副本数量,建议不要变更,保持默认即可(必须和transfer的配置中保持一致)
53 | "cluster": { //未扩容前老的graph实例列表
54 | "graph-00" : "127.0.0.1:6070"
55 | }
56 | }
57 | }
58 |
59 | ```
60 |
61 | ## 补充说明
62 | 部署完graph组件后,请修改transfer和api的配置,使这两个组件可以寻址到graph。
63 |
--------------------------------------------------------------------------------
/zh_0_2/distributed_install/hbs.md:
--------------------------------------------------------------------------------
1 |
2 |
3 | # HBS(Heartbeat Server)
4 |
5 | 心跳服务器,公司所有agent都会连到HBS,每分钟发一次心跳请求。
6 |
7 | ## 设计初衷
8 |
9 | Portal的数据库中有一个host表,维护了公司所有机器的信息,比如hostname、ip等等。这个表中的数据通常是从公司CMDB中同步过来的。但是有些规模小一些的公司是没有CMDB的,那此时就需要手工往host表中录入数据,这很麻烦。于是我们赋予了HBS第一个功能:agent发送心跳信息给HBS的时候,会把hostname、ip、agent version、plugin version等信息告诉HBS,HBS负责更新host表。
10 |
11 | falcon-agent有一个很大的特点,就是自发现,不用配置它应该采集什么数据,就自动去采集了。比如cpu、内存、磁盘、网卡流量等等都会自动采集。我们除了要采集这些基础信息之外,还需要做端口存活监控和进程数监控。那我们是否也要自动采集监听的端口和各个进程数目呢?我们没有这么做,因为这个数据量比较大,汇报上去之后用户大部分都是不关心的,太浪费。于是我们换了一个方式,只采集用户配置的。比如用户配置了对某个机器80端口的监控,我们才会去采集这个机器80端口的存活性。那agent如何知道自己应该采集哪些端口和进程呢?向HBS要,HBS去读取Portal的数据库,返回给agent。
12 |
13 | 之后我们会介绍一个用于判断报警的组件:Judge,Judge需要获取所有的报警策略,让Judge去读取Portal的DB么?不太好。因为Judge的实例数目比较多,如果公司有几十万机器,Judge实例数目可能会是几百个,几百个Judge实例去访问Portal数据库,也是一个比较大的压力。既然HBS无论如何都要访问Portal的数据库了,那就让HBS去获取所有的报警策略缓存在内存里,然后Judge去向HBS请求。这样一来,对Portal DB的压力就会大大减小。
14 |
15 |
16 | ## 部署说明
17 |
18 | hbs是可以水平扩展的,至少部署两个实例以保证可用性。一般一个实例可以搞定5000台机器,所以说,如果公司有10万台机器,可以部署20个hbs实例,前面架设lvs,agent中就配置上lvs vip即可。
19 |
20 | ## 配置说明
21 |
22 | 配置文件必须叫cfg.json,可以基于cfg.example.json修改
23 |
24 | ```
25 | {
26 | "debug": true,
27 | "database": "root:password@tcp(127.0.0.1:3306)/falcon_portal?loc=Local&parseTime=true", # Portal的数据库地址
28 | "hosts": "", # portal数据库中有个host表,如果表中数据是从其他系统同步过来的,此处配置为sync,否则就维持默认,留空即可
29 | "maxIdle": 100,
30 | "listen": ":6030", # hbs监听的rpc地址
31 | "trustable": [""],
32 | "http": {
33 | "enabled": true,
34 | "listen": "0.0.0.0:6031" # hbs监听的http地址
35 | }
36 | }
37 | ```
38 |
39 | ## 进程管理
40 |
41 | ```
42 | # 启动
43 | ./open-falcon start hbs
44 |
45 | # 停止
46 | ./open-falcon stop hbs
47 |
48 | # 查看日志
49 | ./open-falcon monitor hbs
50 |
51 | ```
52 |
53 | ## 补充
54 |
55 | 如果你先部署了agent,后部署的hbs,那咱们部署完hbs之后需要回去修改agent的配置,把agent配置中的heartbeat部分enabled设置为true,addr设置为hbs的rpc地址。如果hbs的配置文件维持默认,rpc端口就是6030,http端口是6031,agent中应该配置为hbs的rpc端口,小心别弄错了。
56 |
57 |
58 | ## 视频教程
59 |
60 | 为hbs模块录制了一个视频,做了源码级解读:http://www.jikexueyuan.com/course/1873.html
61 |
62 |
--------------------------------------------------------------------------------
/zh_0_2/distributed_install/judge.md:
--------------------------------------------------------------------------------
1 |
2 |
3 | # Judge
4 |
5 | Judge用于告警判断,agent将数据push给Transfer,Transfer不但会转发给Graph组件来绘图,还会转发给Judge用于判断是否触发告警。
6 |
7 | ## 设计初衷
8 |
9 | 因为监控系统数据量比较大,一台机器显然是搞不定的,所以必须要有个数据分片方案。Transfer通过一致性哈希来分片,每个Judge就只需要处理一小部分数据就可以了。所以判断告警的功能不能放在直接的数据接收端:Transfer,而应该放到Transfer后面的组件里。
10 |
11 |
12 | ## 部署说明
13 |
14 | Judge监听了一个http端口,提供了一个http接口:/count,访问之,可以得悉当前Judge实例处理了多少数据量。推荐的做法是一个Judge实例处理50万~100万数据,用个5G~10G内存,如果所用物理机内存比较大,比如有128G,可以在一个物理机上部署多个Judge实例。
15 |
16 | ## 配置说明
17 |
18 | 配置文件必须叫cfg.json,可以基于cfg.example.json修改
19 |
20 | ```
21 | {
22 | "debug": true,
23 | "debugHost": "nil",
24 | "remain": 11,
25 | "http": {
26 | "enabled": true,
27 | "listen": "0.0.0.0:6081"
28 | },
29 | "rpc": {
30 | "enabled": true,
31 | "listen": "0.0.0.0:6080"
32 | },
33 | "hbs": {
34 | "servers": ["127.0.0.1:6030"], # hbs最好放到lvs vip后面,所以此处最好配置为vip:port
35 | "timeout": 300,
36 | "interval": 60
37 | },
38 | "alarm": {
39 | "enabled": true,
40 | "minInterval": 300, # 连续两个报警之间至少相隔的秒数,维持默认即可
41 | "queuePattern": "event:p%v",
42 | "redis": {
43 | "dsn": "127.0.0.1:6379", # 与alarm、sender使用一个redis
44 | "maxIdle": 5,
45 | "connTimeout": 5000,
46 | "readTimeout": 5000,
47 | "writeTimeout": 5000
48 | }
49 | }
50 | }
51 | ```
52 |
53 | remain这个配置详细解释一下:
54 | remain指定了judge内存中针对某个数据存多少个点,比如host01这个机器的cpu.idle的值在内存中最多存多少个,配置报警的时候比如all(#3),这个#后面的数字不能超过remain-1,一般维持默认就够用了
55 |
56 | ## 进程管理
57 |
58 | 我们提供了一个control脚本来完成常用操作
59 |
60 | ```
61 | # 启动
62 | ./open-falcon start judge
63 |
64 | # 停止
65 | ./open-falcon stop judge
66 |
67 | # 查看日志
68 | ./open-falcon monitor judge
69 | ```
70 |
71 | ## 视频教程
72 |
73 | 为judge模块录制了一个视频,做了源码级解读:http://www.jikexueyuan.com/course/1850.html
74 |
75 |
--------------------------------------------------------------------------------
/zh_0_2/distributed_install/nodata.md:
--------------------------------------------------------------------------------
1 |
2 |
3 | # Nodata
4 |
5 | nodata用于检测监控数据的上报异常。nodata和实时报警judge模块协同工作,过程为: 配置了nodata的采集项超时未上报数据,nodata生成一条默认的模拟数据;用户配置相应的报警策略,收到mock数据就产生报警。采集项上报异常检测,作为judge模块的一个必要补充,能够使judge的实时报警功能更加可靠、完善。
6 |
7 | ## 服务部署
8 | 服务部署,包括配置修改、启动服务、检验服务、停止服务等。这之前,需要将安装包解压到服务的部署目录下。
9 |
10 | ```
11 | # 修改配置, 配置项含义见下文
12 | mv cfg.example.json cfg.json
13 | vim cfg.json
14 |
15 | # 启动服务
16 | ./open-falcon start nodata
17 |
18 | # 停止服务
19 | ./open-falcon stop nodata
20 |
21 | # 检查日志
22 | ./open-falcon monitor nodata
23 |
24 | ```
25 |
26 | ## 配置说明
27 | 配置文件默认为./cfg.json。默认情况下,安装包会有一个cfg.example.json的配置文件示例。各配置项的含义,如下
28 |
29 | ```
30 | {
31 | "debug": true,
32 | "http": {
33 | "enabled": true,
34 | "listen": "0.0.0.0:6090"
35 | },
36 | "plus_api":{
37 | "connectTimeout": 500,
38 | "requestTimeout": 2000,
39 | "addr": "http://127.0.0.1:8080", #falcon-plus api模块的运行地址
40 | "token": "default-token-used-in-server-side" #用于和falcon-plus api模块的交互认证token
41 | },
42 | "config": {
43 | "enabled": true,
44 | "dsn": "root:@tcp(127.0.0.1:3306)/falcon_portal?loc=Local&parseTime=true&wait_timeout=604800",
45 | "maxIdle": 4
46 | },
47 | "collector":{
48 | "enabled": true,
49 | "batch": 200,
50 | "concurrent": 10
51 | },
52 | "sender":{
53 | "enabled": true,
54 | "connectTimeout": 500,
55 | "requestTimeout": 2000,
56 | "transferAddr": "127.0.0.1:6060", #transfer的http监听地址,一般形如"domain.transfer.service:6060"
57 | "batch": 500
58 | }
59 | }
60 |
61 | ```
62 |
--------------------------------------------------------------------------------
/zh_0_2/distributed_install/prepare.md:
--------------------------------------------------------------------------------
1 |
2 |
3 | ## 环境准备
4 | 请参考[环境准备](../quick_install/prepare.md)
5 |
--------------------------------------------------------------------------------
/zh_0_2/donate.md:
--------------------------------------------------------------------------------
1 | ../zh/donate.md
--------------------------------------------------------------------------------
/zh_0_2/faq/alarm.md:
--------------------------------------------------------------------------------
1 |
2 |
3 | # 报警相关常见问题
4 |
5 | #### 配置了策略,一直没有报警,如何排查?
6 |
7 | 1. 排查sender、alarm、judge、hbs、agent、transfer的log
8 | 2. 浏览器访问alarm的http页面,看是否有未恢复的告警,如果有就是生成报警了,后面没发出去,很可能是邮件、短信发送接口出问题了,检查sender中配置的api
9 | 3. 打开agent的debug,看是否在正常push数据
10 | 4. 看agent配置,是否正确配置了heartbeat(hbs)和transfer的地址,并enabled
11 | 5. 看transfer配置,是否正确配置了judge地址
12 | 6. jduge提供了一个http接口用于debug,可以检查某个数据是否正确push上来了,比如qd-open-falcon-judge01.hd这个机器的cpu.idle数据,可以这么查看
13 | ```bash
14 | curl http://127.0.0.1:6081/history/qd-open-falcon-judge01.hd/cpu.idle
15 | ```
16 | 7. 检查服务器的时间是否已经同步,可以用 [ntp](https://access.redhat.com/documentation/en-US/Red_Hat_Enterprise_Linux/7/html/System_Administrators_Guide/sect-Understanding_chrony_and-its_configuration.html) 或 chrony 来实现
17 |
18 | 上面的127.0.0.1:6081指的是judge的http端口
19 | 7. 检查judge配置的hbs地址是否正确
20 | 8. 检查hbs配置的数据库地址是否正确
21 | 9. 检查portal中配置的策略模板是否配置了报警接收人
22 | 10. 检查portal中配置的策略模板是否绑定到某个HostGroup了,并且目标机器恰好在这个HostGroup中
23 | 11. 去UIC检查报警接收组中是否把自己加进去了
24 | 12. 去UIC检查自己的联系信息是否正确
25 |
26 | #### 在Portal页面创建了一个HostGroup,往HostGroup中增加机器的时候报错
27 |
28 | 1. 检查agent是否正确配置了heartbeat地址,并enabled了
29 | 2. 检查hbs log
30 | 3. 检查hbs配置的数据库地址是否正确
31 | 4. 检查hbs的配置hosts是否配置为sync了,只有留空的时候hbs才会去写host表,host表中有数据才能在页面上添加机器
32 |
33 |
34 | #### 在alarm这边配置了短信、邮件、微信通知,在alarm 日志中看到告警写入 redis 队列都有,但实际发送有时候只有1种,有时2种,有时3种都有。
35 | 1. 检查是否有多个alarm进程同时读取一个redis队列,引起相互干扰,如urlooker的alarm。
36 | 2. 修改redis队列名称,如修改urlooker的redis队列名称,使2个alarm读取不同的队列,避免造成干扰。
37 |
38 |
39 |
40 |
--------------------------------------------------------------------------------
/zh_0_2/faq/collect.md:
--------------------------------------------------------------------------------
1 |
2 |
3 | # 数据收集相关问题
4 | Open-Falcon数据收集,分为[绘图数据]收集和[报警数据]收集。下面介绍,如何验证两个链路的数据收集是否正常。
5 |
6 |
7 | ### 如何验证[绘图数据]收集是否正常
8 | 数据链路是:`agent->transfer->graph->query->dashboard`。graph有一个http接口可以验证`agent->transfer->graph`这条链路,比如graph的http端口是6071,可以这么访问验证:
9 |
10 | ```bash
11 | # $endpoint和$counter是变量
12 | curl http://127.0.0.1:6071/history/$endpoint/$counter
13 |
14 | # 如果上报的数据不带tags,访问方式是这样的:
15 | curl http://127.0.0.1:6071/history/host01/agent.alive
16 |
17 | # 如果上报的数据带有tags,访问方式如下,其中tags为module=graph,project=falcon
18 | curl http://127.0.0.1:6071/history/host01/qps/module=graph,project=falcon
19 | ```
20 | 如果调用上述接口返回空值,则说明agent没有上报数据、或者transfer服务异常。
21 |
22 |
23 | ### 如何验证[报警数据]收集是否正常
24 |
25 | 数据链路是:`agent->transfer->judge`,judge有一个http接口可以验证`agent->transfer->judge`这条链路,比如judge的http端口是6081,可以这么访问验证:
26 |
27 | ```bash
28 | curl http://127.0.0.1:6081/history/$endpoint/$counter
29 |
30 | # $endpoint和$counter是变量,举个例子:
31 | curl http://127.0.0.1:6081/history/host01/cpu.idle
32 |
33 | # counter=$metric/sorted($tags)
34 | # 如果上报的数据带有tag,访问方式是这样的,比如:
35 | curl http://127.0.0.1:6081/history/host01/qps/module=judge,project=falcon
36 | ```
37 | 如果调用上述接口返回空值,则说明agent没有上报数据、或者transfer服务异常。
38 |
39 | **注意**: v0.2.1版本之后judge新增了优化内存使用的功能,如果metric没有对应的strategy或者expression,judge内存中不会存储该metirc的历史数据,所以判断报警数据收集这条链路是否正常时需要先确定metric是否有对应的报警条件
40 |
41 | ```bash
42 | # 检查metric是否有对应的strategy
43 | curl http://127.0.0.1:6081/strategy/$endpoint/$counter
44 |
45 | # 检查metric是否有对应的expression
46 | curl http://127.0.0.1:6081/expression/$counter
47 |
48 |
49 | # $endpoint和$counter是变量
50 | # expression报警条件必须包含tag,当metric上报数据没有携带tag时只检测是否有对应的strategy即可
51 | # 举个例子:
52 | curl http://127.0.0.1:6081/strategy/host01/cpu.idle
53 |
54 | # counter=$metric/sorted($tags)
55 | # 如果上报的数据带有tag,需要检测streategy和expression是否存在
56 | # 举个例子: 当上报的metric为qps, tag为module=judge,project=falcon时, 访问方式是这样的:
57 | curl http://127.0.0.1:6081/strategy/host01/qps
58 |
59 | curl http://127.0.0.1:6081/expression/qps/module=judge
60 |
61 | curl http://127.0.0.1:6081/expression/qps/project=falcon
62 | ```
63 |
--------------------------------------------------------------------------------
/zh_0_2/image/OpenFalcon_wechat.jpg:
--------------------------------------------------------------------------------
https://raw.githubusercontent.com/open-falcon/book/f5ac09ca0c92d3c3d77aee4767aaab80edad1bbf/zh_0_2/image/OpenFalcon_wechat.jpg
--------------------------------------------------------------------------------
/zh_0_2/image/func_aggregator_1.png:
--------------------------------------------------------------------------------
https://raw.githubusercontent.com/open-falcon/book/f5ac09ca0c92d3c3d77aee4767aaab80edad1bbf/zh_0_2/image/func_aggregator_1.png
--------------------------------------------------------------------------------
/zh_0_2/image/func_aggregator_2.png:
--------------------------------------------------------------------------------
https://raw.githubusercontent.com/open-falcon/book/f5ac09ca0c92d3c3d77aee4767aaab80edad1bbf/zh_0_2/image/func_aggregator_2.png
--------------------------------------------------------------------------------
/zh_0_2/image/func_aggregator_3.png:
--------------------------------------------------------------------------------
https://raw.githubusercontent.com/open-falcon/book/f5ac09ca0c92d3c3d77aee4767aaab80edad1bbf/zh_0_2/image/func_aggregator_3.png
--------------------------------------------------------------------------------
/zh_0_2/image/func_aggregator_4.png:
--------------------------------------------------------------------------------
https://raw.githubusercontent.com/open-falcon/book/f5ac09ca0c92d3c3d77aee4767aaab80edad1bbf/zh_0_2/image/func_aggregator_4.png
--------------------------------------------------------------------------------
/zh_0_2/image/func_aggregator_5.png:
--------------------------------------------------------------------------------
https://raw.githubusercontent.com/open-falcon/book/f5ac09ca0c92d3c3d77aee4767aaab80edad1bbf/zh_0_2/image/func_aggregator_5.png
--------------------------------------------------------------------------------
/zh_0_2/image/func_getting_started_1.png:
--------------------------------------------------------------------------------
https://raw.githubusercontent.com/open-falcon/book/f5ac09ca0c92d3c3d77aee4767aaab80edad1bbf/zh_0_2/image/func_getting_started_1.png
--------------------------------------------------------------------------------
/zh_0_2/image/func_getting_started_10.png:
--------------------------------------------------------------------------------
https://raw.githubusercontent.com/open-falcon/book/f5ac09ca0c92d3c3d77aee4767aaab80edad1bbf/zh_0_2/image/func_getting_started_10.png
--------------------------------------------------------------------------------
/zh_0_2/image/func_getting_started_11.png:
--------------------------------------------------------------------------------
https://raw.githubusercontent.com/open-falcon/book/f5ac09ca0c92d3c3d77aee4767aaab80edad1bbf/zh_0_2/image/func_getting_started_11.png
--------------------------------------------------------------------------------
/zh_0_2/image/func_getting_started_12.png:
--------------------------------------------------------------------------------
https://raw.githubusercontent.com/open-falcon/book/f5ac09ca0c92d3c3d77aee4767aaab80edad1bbf/zh_0_2/image/func_getting_started_12.png
--------------------------------------------------------------------------------
/zh_0_2/image/func_getting_started_2.png:
--------------------------------------------------------------------------------
https://raw.githubusercontent.com/open-falcon/book/f5ac09ca0c92d3c3d77aee4767aaab80edad1bbf/zh_0_2/image/func_getting_started_2.png
--------------------------------------------------------------------------------
/zh_0_2/image/func_getting_started_3.png:
--------------------------------------------------------------------------------
https://raw.githubusercontent.com/open-falcon/book/f5ac09ca0c92d3c3d77aee4767aaab80edad1bbf/zh_0_2/image/func_getting_started_3.png
--------------------------------------------------------------------------------
/zh_0_2/image/func_getting_started_4.png:
--------------------------------------------------------------------------------
https://raw.githubusercontent.com/open-falcon/book/f5ac09ca0c92d3c3d77aee4767aaab80edad1bbf/zh_0_2/image/func_getting_started_4.png
--------------------------------------------------------------------------------
/zh_0_2/image/func_getting_started_5.png:
--------------------------------------------------------------------------------
https://raw.githubusercontent.com/open-falcon/book/f5ac09ca0c92d3c3d77aee4767aaab80edad1bbf/zh_0_2/image/func_getting_started_5.png
--------------------------------------------------------------------------------
/zh_0_2/image/func_getting_started_6.png:
--------------------------------------------------------------------------------
https://raw.githubusercontent.com/open-falcon/book/f5ac09ca0c92d3c3d77aee4767aaab80edad1bbf/zh_0_2/image/func_getting_started_6.png
--------------------------------------------------------------------------------
/zh_0_2/image/func_getting_started_7.png:
--------------------------------------------------------------------------------
https://raw.githubusercontent.com/open-falcon/book/f5ac09ca0c92d3c3d77aee4767aaab80edad1bbf/zh_0_2/image/func_getting_started_7.png
--------------------------------------------------------------------------------
/zh_0_2/image/func_getting_started_8.png:
--------------------------------------------------------------------------------
https://raw.githubusercontent.com/open-falcon/book/f5ac09ca0c92d3c3d77aee4767aaab80edad1bbf/zh_0_2/image/func_getting_started_8.png
--------------------------------------------------------------------------------
/zh_0_2/image/func_getting_started_9.png:
--------------------------------------------------------------------------------
https://raw.githubusercontent.com/open-falcon/book/f5ac09ca0c92d3c3d77aee4767aaab80edad1bbf/zh_0_2/image/func_getting_started_9.png
--------------------------------------------------------------------------------
/zh_0_2/image/func_intro_1.png:
--------------------------------------------------------------------------------
https://raw.githubusercontent.com/open-falcon/book/f5ac09ca0c92d3c3d77aee4767aaab80edad1bbf/zh_0_2/image/func_intro_1.png
--------------------------------------------------------------------------------
/zh_0_2/image/func_intro_2.png:
--------------------------------------------------------------------------------
https://raw.githubusercontent.com/open-falcon/book/f5ac09ca0c92d3c3d77aee4767aaab80edad1bbf/zh_0_2/image/func_intro_2.png
--------------------------------------------------------------------------------
/zh_0_2/image/func_intro_3.png:
--------------------------------------------------------------------------------
https://raw.githubusercontent.com/open-falcon/book/f5ac09ca0c92d3c3d77aee4767aaab80edad1bbf/zh_0_2/image/func_intro_3.png
--------------------------------------------------------------------------------
/zh_0_2/image/func_intro_4.png:
--------------------------------------------------------------------------------
https://raw.githubusercontent.com/open-falcon/book/f5ac09ca0c92d3c3d77aee4767aaab80edad1bbf/zh_0_2/image/func_intro_4.png
--------------------------------------------------------------------------------
/zh_0_2/image/func_intro_5.png:
--------------------------------------------------------------------------------
https://raw.githubusercontent.com/open-falcon/book/f5ac09ca0c92d3c3d77aee4767aaab80edad1bbf/zh_0_2/image/func_intro_5.png
--------------------------------------------------------------------------------
/zh_0_2/image/func_intro_6.png:
--------------------------------------------------------------------------------
https://raw.githubusercontent.com/open-falcon/book/f5ac09ca0c92d3c3d77aee4767aaab80edad1bbf/zh_0_2/image/func_intro_6.png
--------------------------------------------------------------------------------
/zh_0_2/image/func_intro_7.png:
--------------------------------------------------------------------------------
https://raw.githubusercontent.com/open-falcon/book/f5ac09ca0c92d3c3d77aee4767aaab80edad1bbf/zh_0_2/image/func_intro_7.png
--------------------------------------------------------------------------------
/zh_0_2/image/func_intro_8.png:
--------------------------------------------------------------------------------
https://raw.githubusercontent.com/open-falcon/book/f5ac09ca0c92d3c3d77aee4767aaab80edad1bbf/zh_0_2/image/func_intro_8.png
--------------------------------------------------------------------------------
/zh_0_2/image/func_nodata_1.png:
--------------------------------------------------------------------------------
https://raw.githubusercontent.com/open-falcon/book/f5ac09ca0c92d3c3d77aee4767aaab80edad1bbf/zh_0_2/image/func_nodata_1.png
--------------------------------------------------------------------------------
/zh_0_2/image/func_nodata_2.png:
--------------------------------------------------------------------------------
https://raw.githubusercontent.com/open-falcon/book/f5ac09ca0c92d3c3d77aee4767aaab80edad1bbf/zh_0_2/image/func_nodata_2.png
--------------------------------------------------------------------------------
/zh_0_2/image/func_nodata_3.png:
--------------------------------------------------------------------------------
https://raw.githubusercontent.com/open-falcon/book/f5ac09ca0c92d3c3d77aee4767aaab80edad1bbf/zh_0_2/image/func_nodata_3.png
--------------------------------------------------------------------------------
/zh_0_2/image/linkedsee_1.png:
--------------------------------------------------------------------------------
https://raw.githubusercontent.com/open-falcon/book/f5ac09ca0c92d3c3d77aee4767aaab80edad1bbf/zh_0_2/image/linkedsee_1.png
--------------------------------------------------------------------------------
/zh_0_2/image/linkedsee_2.png:
--------------------------------------------------------------------------------
https://raw.githubusercontent.com/open-falcon/book/f5ac09ca0c92d3c3d77aee4767aaab80edad1bbf/zh_0_2/image/linkedsee_2.png
--------------------------------------------------------------------------------
/zh_0_2/image/linkedsee_3.png:
--------------------------------------------------------------------------------
https://raw.githubusercontent.com/open-falcon/book/f5ac09ca0c92d3c3d77aee4767aaab80edad1bbf/zh_0_2/image/linkedsee_3.png
--------------------------------------------------------------------------------
/zh_0_2/image/linkedsee_4.png:
--------------------------------------------------------------------------------
https://raw.githubusercontent.com/open-falcon/book/f5ac09ca0c92d3c3d77aee4767aaab80edad1bbf/zh_0_2/image/linkedsee_4.png
--------------------------------------------------------------------------------
/zh_0_2/image/linkedsee_5.png:
--------------------------------------------------------------------------------
https://raw.githubusercontent.com/open-falcon/book/f5ac09ca0c92d3c3d77aee4767aaab80edad1bbf/zh_0_2/image/linkedsee_5.png
--------------------------------------------------------------------------------
/zh_0_2/image/practice_graph-scaling_io01.png:
--------------------------------------------------------------------------------
https://raw.githubusercontent.com/open-falcon/book/f5ac09ca0c92d3c3d77aee4767aaab80edad1bbf/zh_0_2/image/practice_graph-scaling_io01.png
--------------------------------------------------------------------------------
/zh_0_2/image/practice_graph-scaling_io02.png:
--------------------------------------------------------------------------------
https://raw.githubusercontent.com/open-falcon/book/f5ac09ca0c92d3c3d77aee4767aaab80edad1bbf/zh_0_2/image/practice_graph-scaling_io02.png
--------------------------------------------------------------------------------
/zh_0_2/image/practice_graph-scaling_io03.png:
--------------------------------------------------------------------------------
https://raw.githubusercontent.com/open-falcon/book/f5ac09ca0c92d3c3d77aee4767aaab80edad1bbf/zh_0_2/image/practice_graph-scaling_io03.png
--------------------------------------------------------------------------------
/zh_0_2/image/practice_graph-scaling_quantity.png:
--------------------------------------------------------------------------------
https://raw.githubusercontent.com/open-falcon/book/f5ac09ca0c92d3c3d77aee4767aaab80edad1bbf/zh_0_2/image/practice_graph-scaling_quantity.png
--------------------------------------------------------------------------------
/zh_0_2/image/practice_graph-scaling_rrd.png:
--------------------------------------------------------------------------------
https://raw.githubusercontent.com/open-falcon/book/f5ac09ca0c92d3c3d77aee4767aaab80edad1bbf/zh_0_2/image/practice_graph-scaling_rrd.png
--------------------------------------------------------------------------------
/zh_0_2/image/practice_graph-scaling_stats.png:
--------------------------------------------------------------------------------
https://raw.githubusercontent.com/open-falcon/book/f5ac09ca0c92d3c3d77aee4767aaab80edad1bbf/zh_0_2/image/practice_graph-scaling_stats.png
--------------------------------------------------------------------------------
/zh_0_2/philosophy/README.md:
--------------------------------------------------------------------------------
1 |
2 |
3 | # 设计理念
4 |
5 | 阐述open-falcon设计过程中的各种思考
6 |
--------------------------------------------------------------------------------
/zh_0_2/philosophy/data-collect.md:
--------------------------------------------------------------------------------
1 |
2 |
3 | 作为监控系统来讲,首先得有监控数据,然后才能做后面的分析处理、绘图报警等事情,那falcon是如何处理数据采集这个问题的呢?
4 |
5 | 我们先要考虑有哪些数据要采集,脑洞打开~
6 |
7 | - 机器负载信息,这个最常见,cpu.idle/load.1min/mem.memfree.percent/df.bytes.free.percent等等
8 | - 硬件信息,比如功耗、风扇转速、磁盘是否可写,系统组同学对这些比较关注
9 | - 服务监控数据,比如某个接口每分钟调用的次数,latency等等
10 | - 数据库、HBase、Redis、Openstack等开源软件的监控指标
11 |
12 | 要采集的数据还挺多哩,监控系统的开发人员不是神,没法搞定所有数据,比如MySQL,DBA最懂,他知道应该采集哪些指标,监控只要提供一个数据push的接口即可,大家共建。想知道push给Server的数据长啥样?可以参考[Tag与HostGroup设计理念](tags-and-hostgroup.md)中提到的两条json数据
13 |
14 | 上面四个方面比较有代表性,咱们挨个阐述。
15 |
16 | **机器负载信息**
17 |
18 | 这部分比较通用,我们提供了一个agent部署在所有机器上去采集。不像zabbix,要采集什么数据需要在服务端配置,falcon无需配置,只要agent部署到机器上,配置好heartbeat和Transfer地址,就自动开始采集了,省去了用户配置的麻烦。目前agent只支持64位Linux,Mac、Windows均不支持。
19 |
20 | **硬件信息**
21 |
22 | 硬件信息的采集脚本由系统组同学提供,作为plugin依托于agent运行,plugin机制介绍请看[这里](plugin.md)。
23 |
24 | **服务监控数据**
25 |
26 | 服务的监控指标采集脚本,通常都是跟着服务的code走的,服务上线或者扩容,这个脚本也跟着上线或者扩容,服务下线,这个采集脚本也要相应下线。公司里Java的项目有不少,研发那边就提供了一个通用jar包,只要引入这个jar包,就可以自动采集接口的调用次数、延迟时间等数据。然后将采集到的数据push给监控,一分钟push一次。目前falcon的agent提供了一个简单的http接口,这个jar包采集到数据之后是post给本机agent。向agent推送数据的一个简单例子,如下:
27 |
28 | ```bash
29 | curl -X POST -d '[{"metric": "qps", "endpoint": "open-falcon-graph01.bj", "timestamp": 1431347802, "step": 60,"value": 9,"counterType": "GAUGE","tags": "project=falcon,module=graph"}]' http://127.0.0.1:1988/v1/push
30 | ```
31 |
32 | **各种开源软件的监控指标**
33 |
34 | 这都是大用户,比如DBA自己写一些采集脚本,连到各个MySQL实例上去采集数据,完事直接调用server端的jsonrpc汇报数据,一分钟一次,每次甚至push几十万条数据,比较好的发送方式是500条数据做一个batch,别几十万数据一次性发送。
35 |
36 |
--------------------------------------------------------------------------------
/zh_0_2/philosophy/data-model.md:
--------------------------------------------------------------------------------
1 |
2 |
3 | # Data model
4 |
5 | Open-Falcon,采用和OpenTSDB相似的数据格式:metric、endpoint加多组key value tags,举两个例子:
6 |
7 | ```bash
8 | {
9 | metric: load.1min,
10 | endpoint: open-falcon-host,
11 | tags: srv=falcon,idc=aws-sgp,group=az1,
12 | value: 1.5,
13 | timestamp: `date +%s`,
14 | counterType: GAUGE,
15 | step: 60
16 | }
17 | {
18 | metric: net.port.listen,
19 | endpoint: open-falcon-host,
20 | tags: port=3306,
21 | value: 1,
22 | timestamp: `date +%s`,
23 | counterType: GAUGE,
24 | step: 60
25 | }
26 | ```
27 |
28 | 其中,metric是监控指标名称,endpoint是监控实体,tags是监控数据的属性标签,counterType是Open-Falcon定义的数据类型(取值为GAUGE、COUNTER),step为监控数据的上报周期,value和timestamp是有效的监控数据。
29 |
--------------------------------------------------------------------------------
/zh_0_2/philosophy/plugin.md:
--------------------------------------------------------------------------------
1 |
2 |
3 | 对于Plugin机制,叙述之前必须要强调一下:
4 |
5 | > Plugin可以看做是对agent功能的扩充。对于业务系统的监控指标采集,最好不要做成plugin,而是把采集脚本放到业务程序发布包中,随着业务代码上线而上线,随着业务代码升级而升级,这样会比较容易管理。
6 |
7 | 要使用Plugin,步骤如下:
8 |
9 | **1. 编写采集脚本**
10 |
11 | 用什么语言写没关系,只要目标机器上有运行环境就行,脚本本身要有可执行权限。采集到数据之后直接打印到stdout即可,agent会截获并push给server。数据格式是json,举个例子:
12 |
13 | ```bash
14 | [root@host01:/path/to/plugins/plugin/sys/ntp]#./600_ntp.py
15 | [{"endpoint": "host01", "tags": "", "timestamp": 1431349763, "metric": "sys.ntp.offset", "value": 0.73699999999999999, "counterType": "GAUGE", "step": 600}]
16 | ```
17 |
18 | 注意,这个json数据是个list哦
19 |
20 | **2. 上传脚本到git**
21 |
22 | 插件脚本也是code,所以最好也用git、svn管理,这里我们使用git管理,公司内部如果没有搭建gitlab,可以使用gitcafe、coding.net之类的,将写好的脚本push到git仓库,比如上例中的600_ntp.py,姑且放到git仓库的sys/ntp目录下。注意,这个脚本在push到git仓库之前要加上可执行权限。
23 |
24 | **3. 检查agent配置**
25 |
26 | 大家之前部署agent的时候应该注意到agent配置文件中有配置plugin吧,现在到了用的时候了,把git仓库地址配置上,enabled设置为true。注意,配置的git仓库地址需要是任何机器上都可以拉取的,即`git://`或者`https://`打头的。如果agent之前已经部署到公司所有机器上了,那现在手工改配置可能略麻烦,之前讲过的嘛,用[ops-updater](https://github.com/open-falcon/ops-updater)管理起来~
27 |
28 | **4. 拉取plugin脚本**
29 |
30 | agent开了一个http端口1988,我们可以挨个curl一下http://ip:1988/plugin/update 这个地址,这会让agent主动git pull这个插件仓库。为啥没做成定期拉取这个仓库呢?主要是怕给git服务器压力太大……大家悠着点用,别给人pull挂了……
31 |
32 | **5. 让plugin run起来**
33 |
34 | 上一步我们拉取了plugin脚本到所有机器上,不过plugin并没有执行。哪些机器执行哪些plugin脚本,是在portal上面配置的。其实我很想做成,只要插件拉取下来了就立马执行,不过实际实践中,有些插件还是不能在所有机器上跑,所以就在portal上通过配置控制了。在portal上找到要执行插件的HostGroup,点击对应的plugins超链接,对于上例sys/ntp目录下的600_ntp.py,直接把sys/ntp绑定上去即可。sys/ntp下的所有插件就都执行了。
35 |
36 | **6. 补充**
37 |
38 | portal上配置完成之后并不会立马生效,有个同步的过程,最终是agent通过调用hbs的接口获取的,需要一两分钟。上例我们绑定了sys/ntp,这实际是个目录,这个目录下的所有插件都会被执行,那什么样的文件会被看做插件呢?文件名是数字下划线打头的,这个数字代表的是step,即多长时间跑一次,单位是秒,比如60_a.py,就是在通过命名告诉agent,这个插件每60秒跑一次。sys/ntp目录下的子目录、其他命名方式的文件都会被忽略。
39 |
40 | **7. 插件如何传递参数**
41 |
42 | Open-Falcon 在 [PR #672](https://github.com/open-falcon/falcon-plus/pull/672) 中,对插件传递传递自定义参数进行了支持。在dashboard 中,配置 HostGroup 绑定插件时,可以支持针对单个脚本配置参数。
43 |
44 | 比如:`sys/ntp/30_xx.sh(a, "33 4", 'test.sh f\,d')`,表示对 hostgroup 绑定一个插件脚本`sys/ntp/30_xx.sh`, 并传递4个参数,多个参数之间用`,`分割,每个参数可以用双引号或者单引号括起来。如果参数中本身就包含逗号,可以使用 `\,` 来转义。
45 |
46 | * 参数,只在绑定单个插件脚本时有效。如果绑定的是一个插件目录,传递的参数会忽略掉。
47 | * 如果某个目录下的某个插件脚本,被单独绑定到某个hostgroup,同时该目录也被绑定到了这个hostgroup,这个插件脚本不会重复被执行,绑定目录时这个插件脚本会被忽略(也就是说,单个脚本的绑定会覆盖目录绑定方式下的同一个脚本)。
48 |
--------------------------------------------------------------------------------
/zh_0_2/practice/README.md:
--------------------------------------------------------------------------------
1 |
2 |
3 | Open-Falcon实践经验整理
4 |
--------------------------------------------------------------------------------
/zh_0_2/quick_install/README.md:
--------------------------------------------------------------------------------
1 |
2 |
3 | Open-Falcon,为前后端分离的架构,包含backend 和 frontend两部分:
4 |
5 | - [安装后端](./backend.md)
6 | - [安装前端](./frontend.md)
7 |
--------------------------------------------------------------------------------
/zh_0_2/quick_install/backend.md:
--------------------------------------------------------------------------------
1 |
2 |
3 | ## 环境准备
4 |
5 | 请参考[环境准备](./prepare.md)
6 |
7 | ### 创建工作目录
8 | ```bash
9 | export FALCON_HOME=/home/work
10 | export WORKSPACE=$FALCON_HOME/open-falcon
11 | mkdir -p $WORKSPACE
12 | ```
13 |
14 | ### 解压二进制包
15 | ```bash
16 | tar -xzvf open-falcon-v0.2.1.tar.gz -C $WORKSPACE
17 | ```
18 |
19 | ### 在一台机器上启动所有的后端组件
20 | # 首先确认配置文件中数据库账号密码与实际相同,否则需要修改配置文件。
21 | ```
22 | cd $WORKSPACE
23 | grep -Ilr 3306 ./ | xargs -n1 -- sed -i 's/root:/real_user:real_password/g'
24 | ```
25 | # 启动
26 | ```bash
27 | cd $WORKSPACE
28 | ./open-falcon start
29 |
30 | # 检查所有模块的启动状况
31 | ./open-falcon check
32 |
33 | ```
34 |
35 | ### 更多的命令行工具用法
36 | ```bash
37 | # ./open-falcon [start|stop|restart|check|monitor|reload] module
38 | ./open-falcon start agent
39 |
40 | ./open-falcon check
41 | falcon-graph UP 53007
42 | falcon-hbs UP 53014
43 | falcon-judge UP 53020
44 | falcon-transfer UP 53026
45 | falcon-nodata UP 53032
46 | falcon-aggregator UP 53038
47 | falcon-agent UP 53044
48 | falcon-gateway UP 53050
49 | falcon-api UP 53056
50 | falcon-alarm UP 53063
51 |
52 | For debugging , You can check $WorkDir/$moduleName/log/logs/xxx.log
53 | ```
54 |
--------------------------------------------------------------------------------
/zh_0_2/quick_install/frontend.md:
--------------------------------------------------------------------------------
1 |
2 | ----
3 |
4 | ## 环境准备
5 |
6 | 请参考[环境准备](./prepare.md)
7 |
8 | ### 创建工作目录
9 | ```
10 | export HOME=/home/work
11 | export WORKSPACE=$HOME/open-falcon
12 | mkdir -p $WORKSPACE
13 | cd $WORKSPACE
14 | ```
15 |
16 | ### 克隆前端组件代码
17 | ```
18 | cd $WORKSPACE
19 | git clone https://github.com/open-falcon/dashboard.git
20 | ```
21 |
22 | ### 安装依赖包
23 | ```
24 | yum install -y python-virtualenv
25 | yum install -y python-devel
26 | yum install -y openldap-devel
27 | yum install -y mysql-devel
28 | yum groupinstall "Development tools"
29 |
30 |
31 | cd $WORKSPACE/dashboard/
32 | virtualenv ./env
33 |
34 | ./env/bin/pip install -r pip_requirements.txt -i https://pypi.douban.com/simple
35 | ```
36 |
37 | ### 初始化数据库
38 | 请参考[环境准备](./prepare.md)
39 |
40 |
41 | ### 修改配置
42 | ```
43 | dashboard的配置文件为: 'rrd/config.py',请根据实际情况修改
44 |
45 | ## API_ADDR 表示后端api组件的地址
46 | API_ADDR = "http://127.0.0.1:8080/api/v1"
47 |
48 | ## 根据实际情况,修改PORTAL_DB_*, 默认用户名为root,默认密码为""
49 | ## 根据实际情况,修改ALARM_DB_*, 默认用户名为root,默认密码为""
50 | ```
51 |
52 | ### 以开发者模式启动
53 | ```
54 | ./env/bin/python wsgi.py
55 |
56 | open http://127.0.0.1:8081 in your browser.
57 | ```
58 |
59 | ### 在生产环境启动
60 | ```
61 | bash control start
62 |
63 | open http://127.0.0.1:8081 in your browser.
64 | ```
65 |
66 | ### 停止dashboard运行
67 | ```
68 | bash control stop
69 | ```
70 |
71 | ### 查看日志
72 | ```
73 | bash control tail
74 | ```
75 |
76 | ### dashbord用户管理
77 | ```
78 | dashbord没有默认创建任何账号包括管理账号,需要你通过页面进行注册账号。
79 | 想拥有管理全局的超级管理员账号,需要手动注册用户名为root的账号(第一个帐号名称为root的用户会被自动设置为超级管理员)。
80 | 超级管理员可以给普通用户分配权限管理。
81 |
82 | 小提示:注册账号能够被任何打开dashboard页面的人注册,所以当给相关的人注册完账号后,需要去关闭注册账号功能。只需要去修改api组件的配置文件cfg.json,将signup_disable配置项修改为true,重启api即可。当需要给人开账号的时候,再将配置选项改回去,用完再关掉即可。
83 | ```
84 |
--------------------------------------------------------------------------------
/zh_0_2/quick_install/prepare.md:
--------------------------------------------------------------------------------
1 |
2 |
3 | # 环境准备
4 |
5 | ### 安装redis
6 | yum install -y redis
7 |
8 | ### 安装mysql
9 | yum install -y mysql-server
10 |
11 | **注意,请确保redis和MySQL已启动。**
12 |
13 | ### 初始化MySQL表结构
14 |
15 | ```
16 | cd /tmp/ && git clone https://github.com/open-falcon/falcon-plus.git
17 | cd /tmp/falcon-plus/scripts/mysql/db_schema/
18 | mysql -h 127.0.0.1 -u root -p < 1_uic-db-schema.sql
19 | mysql -h 127.0.0.1 -u root -p < 2_portal-db-schema.sql
20 | mysql -h 127.0.0.1 -u root -p < 3_dashboard-db-schema.sql
21 | mysql -h 127.0.0.1 -u root -p < 4_graph-db-schema.sql
22 | mysql -h 127.0.0.1 -u root -p < 5_alarms-db-schema.sql
23 | rm -rf /tmp/falcon-plus/
24 | ```
25 |
26 | **如果你是从v0.1.0升级到当前版本v0.2.0,那么只需要执行如下命令:**
27 |
28 | ```
29 | mysql -h 127.0.0.1 -u root -p < 5_alarms-db-schema.sql
30 | ```
31 |
32 | # 从源码编译
33 |
34 | 首先,请确保你已经安装好了golang环境,如果没有安装,请参考 https://golang.org/doc/install
35 |
36 | ```
37 | cd $GOPATH/src/github.com/open-falcon/falcon-plus/
38 |
39 | # make all modules
40 | make all
41 |
42 | # pack all modules
43 | make pack
44 |
45 | ```
46 |
47 | 这时候,你会在当前目录下面,得到open-falcon-v0.2.0.tar.gz的压缩包,就表示已经编译和打包成功了。
48 |
49 | # 下载编译好的二进制版本
50 |
51 | 如果你不想自己编译的话,那么可以下载官方编译好的[二进制版本(x86 64位平台)](https://github.com/open-falcon/falcon-plus/releases)。
52 |
53 |
54 | 到这一步,准备工作就完成了。 open-falcon-v0.2.0.tar.gz 这个二进制包,请大家解压到合适的位置,暂时保存,后续步骤需要使用。
55 |
--------------------------------------------------------------------------------
/zh_0_2/styles/website.css:
--------------------------------------------------------------------------------
1 | /* CSS for website */
2 | h1 , h2{
3 | border-bottom: 1px solid #EFEAEA;
4 | padding-bottom: 3px;
5 | }
6 | .markdown-section>:first-child {
7 | margin-top: 0!important;
8 | }
9 | .markdown-section blockquote:last-child {
10 | margin-bottom: 0.85em!important;
11 | }
12 | .page-wrapper {
13 | margin-top: -1.275em;
14 | }
15 | .book .book-body .page-wrapper .page-inner section.normal {
16 | min-height:350px;
17 | margin-bottom: 30px;
18 | }
19 |
20 | .book .book-body .page-wrapper .page-inner section.normal hr {
21 | height: 0px;
22 | padding: 0;
23 | margin: 1.7em 0;
24 | overflow: hidden;
25 | background-color: #e7e7e7;
26 | border-bottom: 1px dotted #e7e7e7;
27 | }
28 |
29 | .video-js {
30 | width:100%;
31 | height: 100%;
32 | }
33 |
34 | pre[class*="language-"] {
35 | border: none;
36 | background-color: #f7f7f7;
37 | font-size: 1em;
38 | line-height: 1.2em;
39 | }
40 |
41 | .book .book-body .page-wrapper .page-inner section.normal {
42 | font-size: 14px;
43 | font-family: "ubuntu", "Tahoma", "Microsoft YaHei", arial, sans-serif;
44 | }
45 |
46 | .aceCode {
47 | font-size: 14px !important;
48 | }
49 |
50 | input[type=checkbox]{
51 | margin-left: -2em;
52 | }
53 |
54 | .page-footer span{
55 | font-size: 12px;
56 | }
57 |
58 | .page-footer .copyright {
59 | float: left;
60 | }
61 |
62 | .body, html {
63 | overflow-y: hidden;
64 | }
65 |
66 | .versions-select select {
67 | height: 2em;
68 | line-height: 2em;
69 | border-radius: 4px;
70 | background: #efefef;
71 | }
72 |
73 |
--------------------------------------------------------------------------------
/zh_0_2/usage/README.md:
--------------------------------------------------------------------------------
1 |
2 |
3 | open-falcon使用手册
4 |
5 |
--------------------------------------------------------------------------------
/zh_0_2/usage/data-push.md:
--------------------------------------------------------------------------------
1 |
2 |
3 | # 自定义push数据到open-falcon
4 |
5 | 不仅仅是falcon-agent采集的数据可以push到监控系统,一些场景下,我们自定义的一些数据指标,也可以push到open-falcon中,比如:
6 |
7 | 1. 线上某服务的qps
8 | 2. 某业务的在线人数
9 | 3. 某个接⼝的响应时间
10 | 4. 某个⻚面的状态码(500、200)
11 | 5. 某个接⼝的请求出错次数
12 | 6. 某个业务的每分钟的收⼊统计
13 | 7. ......
14 |
15 | ## 一个shell脚本编写的,自定义push数据到open-falcon的例子
16 |
17 | ```
18 | # 注意,http request body是个json,这个json是个列表
19 |
20 | ts=`date +%s`;
21 |
22 | curl -X POST -d "[{\"metric\": \"test-metric\", \"endpoint\": \"test-endpoint\", \"timestamp\": $ts,\"step\": 60,\"value\": 1,\"counterType\": \"GAUGE\",\"tags\": \"idc=lg,project=xx\"}]" http://127.0.0.1:1988/v1/push
23 |
24 | ```
25 |
26 | ## 一个python的、自定义push数据到open-falcon的例子
27 |
28 | ```
29 | #!-*- coding:utf8 -*-
30 |
31 | import requests
32 | import time
33 | import json
34 |
35 | ts = int(time.time())
36 | payload = [
37 | {
38 | "endpoint": "test-endpoint",
39 | "metric": "test-metric",
40 | "timestamp": ts,
41 | "step": 60,
42 | "value": 1,
43 | "counterType": "GAUGE",
44 | "tags": "idc=lg,loc=beijing",
45 | },
46 |
47 | {
48 | "endpoint": "test-endpoint",
49 | "metric": "test-metric2",
50 | "timestamp": ts,
51 | "step": 60,
52 | "value": 2,
53 | "counterType": "GAUGE",
54 | "tags": "idc=lg,loc=beijing",
55 | },
56 | ]
57 |
58 | r = requests.post("http://127.0.0.1:1988/v1/push", data=json.dumps(payload))
59 |
60 | print r.text
61 | ```
62 |
63 | ## API详解
64 |
65 | - metric: 最核心的字段,代表这个采集项具体度量的是什么, 比如是cpu_idle呢,还是memory_free, 还是qps
66 | - endpoint: 标明Metric的主体(属主),比如metric是cpu_idle,那么Endpoint就表示这是哪台机器的cpu_idle
67 | - timestamp: 表示汇报该数据时的unix时间戳,注意是整数,代表的是秒
68 | - value: 代表该metric在当前时间点的值,float64
69 | - step: 表示该数据采集项的汇报周期,这对于后续的配置监控策略很重要,必须明确指定。
70 | - counterType: 只能是COUNTER或者GAUGE二选一,前者表示该数据采集项为计时器类型,后者表示其为原值 (注意大小写)
71 | - GAUGE:即用户上传什么样的值,就原封不动的存储
72 | - COUNTER:指标在存储和展现的时候,会被计算为speed,即(当前值 - 上次值)/ 时间间隔
73 | - tags: 一组逗号分割的键值对, 对metric进一步描述和细化, 可以是空字符串. 比如idc=lg,比如service=xbox等,多个tag之间用逗号分割
74 |
75 | 说明:这7个字段都是必须指定
76 |
--------------------------------------------------------------------------------
/zh_0_2/usage/docker.md:
--------------------------------------------------------------------------------
1 |
2 |
3 |
4 | # Docker容器监控实践
5 |
6 | 在[数据采集](../philosophy/data-collect.md)一节中我们介绍了常见的监控数据源。open-falcon作为一个监控框架,可以去采集任何系统的监控指标数据,只要将监控数据组织为open-falcon规范的格式就OK了。
7 |
8 | docker container的数据采集可以通过[micadvisor_open](https://github.com/open-falcon/micadvisor_open)来做。
9 |
10 | ## 工作原理
11 |
12 | micadvisor-open是基于open-falcon的docker容器资源监控插件,监控容器的cpu、内存、diskio以及网络io等,数据采集后上报到open-falcon
13 |
14 | ## 采集的指标
15 |
16 | | Counters | Notes|
17 | |-----|------|
18 | |cpu.busy|cpu使用情况百分比|
19 | |cpu.user|用户态使用的CPU百分比|
20 | |cpu.system|内核态使用的CPU百分比|
21 | |cpu.core.busy|每个cpu的使用情况|
22 | |mem.memused.percent|内存使用百分比|
23 | |mem.memused|内存使用原值|
24 | |mem.memtotal|内存总量|
25 | |mem.memused.hot|内存热使用情况|
26 | |disk.io.read_bytes|磁盘io读字节数|
27 | |disk.io.write_bytes|磁盘io写字节数|
28 | |net.if.in.bytes|网络io流入字节数|
29 | |net.if.in.packets|网络io流入包数|
30 | |net.if.in.errors|网络io流入出错数|
31 | |net.if.in.dropped|网络io流入丢弃数|
32 | |net.if.out.bytes|网络io流出字节数|
33 | |net.if.out.packets|网络io流出包数|
34 | |net.if.out.errors|网络io流出出错数|
35 | |net.if.out.dropped|网络io流出丢弃数|
36 |
37 | ## Contributors
38 | - mengzhuo: QQ:296142139; MAIL:mengzhuo@xiaomi.com
39 |
40 | ## 补充
41 | - 另外一个docker metric采集的lib库:https://github.com/projecteru/eru-metric
42 |
43 |
--------------------------------------------------------------------------------
/zh_0_2/usage/du-proc.md:
--------------------------------------------------------------------------------
1 |
2 |
3 |
4 | # 目录监控和进程详情监控实践
5 |
6 | 目录大小和进程详情的数据采集可用脚本[falcon-scripts](https://github.com/ZoneTong/falcon-scripts)来做。
7 |
8 | 收集的指标如下:
9 |
10 | | 指标名 | 注释 |
11 | |--------|------|
12 | |du.bytes.used|目录大小,单位byte|
13 | |proc.cpu|进程所占cpu,百分比|
14 | |proc.mem|进程所占内存,单位byte|
15 | |proc.io.in|进程io输入,单位byte|
16 | |proc.io.out|进程io输出,单位byte|
17 |
18 | ## 工作原理
19 |
20 | du.sh脚本借助du命令采集数据
21 |
22 | proc.sh脚本分析/proc/$PID/status /proc/$PID/io等数据
23 |
--------------------------------------------------------------------------------
/zh_0_2/usage/esxi.md:
--------------------------------------------------------------------------------
1 |
2 |
3 | # ESXi监控
4 |
5 | VMware的主体机器(host machine)是运行ESXi作业系统。没有办法安装Open-Falcon agent来监控,所以不能用普通的方式来做监控。
6 |
7 | ESXi作业系统设备的运行指标的采集,可以透过写脚本,通过SNMP协议来采集交换机的各项运行指标,包括内存占用、CPU使用、流量、磁盘用量等。[esxicollector](https://github.com/humorless/esxicollector)就是這樣子的腳本。
8 |
9 | ## 工作原理
10 |
11 | esxicollector是一系列整理过的脚本。由[humorless](https://github.com/humorless/)设计开发。
12 |
13 | esxicollector需要透过cronjob来配置。在一台可以跑cronjob的机器上,配置好cronjob。并且在esxi_collector.sh这个脚本中,写清楚要监控的设备、用来接受监控结果的Open-Falcon agent的位址。esxicollector就会照cronjob的时间间隔,预设是每分钟一次,定期地去采集ESXi作业系统设备的监控项,并透过上报到Open-Falcon的agent。
14 |
15 | 采集的metric列表:
16 |
17 | * CPU利用率
18 |
19 | `esxi.cpu.core`
20 |
21 | * 内存總量/利用率
22 |
23 | `esxi.cpu.memory.kliobytes.size`
24 | `esxi.cpu.memory.kliobytes.used`
25 | `esxi.cpu.memory.kliobytes.avail`
26 |
27 | * 运行的进程数
28 |
29 | `esxi.current.process`
30 |
31 | * 登入的使用者数
32 |
33 | `esxi.current.user`
34 |
35 | * 虚拟机器数
36 |
37 | `esxi.current.vhost`
38 |
39 | * 磁盤總量/利用率
40 |
41 | `esxi.df.size.kilobytes`
42 | `esxi.df.used.percentage`
43 |
44 | * 磁盤錯誤
45 |
46 | `esxi.disk.allocationfailure`
47 |
48 | * 網卡的輸出入流量/封包數
49 |
50 | `esxi.net.in.octets`
51 | `esxi.net.in.ucast.pkts`
52 | `esxi.net.in.multicast.pkts`
53 | `esxi.net.in.broadcast.pkts`
54 | `esxi.net.out.octets`
55 | `esxi.net.out.ucast.pkts`
56 | `esxi.net.out.multicast.pkts`
57 | `esxi.net.out.broadcast.pkts`
58 |
59 |
60 | ## 安装
61 |
62 | 从[这里](https://github.com/humorless/esxicollector)下载。
63 |
64 | 1. 安装SNMP指令
65 |
66 | `yum -y install net-snmp net-snmp-utils`
67 |
68 | 2. 下载VMware ESXi MIB档案,并且复制它们到资料夹`/usr/share/snmp/mibs`
69 |
70 | 3. 设置SNMP的环境
71 |
72 | `mkdir ~/.snmp`
73 | `echo "mibs +ALL" > ~/.snmp/snmp.conf`
74 |
75 | 4. 在`esxi_collector.sh`填入合适的参数
76 |
77 | 5. 设置cronjobs
78 |
79 | ` * * * * * esxi_collector.sh `
80 |
81 |
82 | ## 延伸开发新的监控项
83 |
84 | 脚本 ```snmp_queries.sh``` 会呼叫基本的snmp指令,并且输出snmp执行完的结果。可以透过比较执行 ```60_esxi_*.sh```的结果,来设计新的脚本。
85 |
--------------------------------------------------------------------------------
/zh_0_2/usage/fault-recovery.md:
--------------------------------------------------------------------------------
1 |
2 |
3 | # 对接蓝鲸-故障自愈平台
4 |
5 | 蓝鲸故障自愈,是腾讯蓝鲸推出的一款SaaS服务,目前可以支持和open-falcon无缝对接了,通过接入蓝鲸故障自愈系统,可以帮助使用open-falcon的用户,做到告警无人值守。
6 |
7 | - 具体的配置非常简单: [open-falcon接入蓝鲸](https://docs.bk.tencent.com/product_white_paper/fta/Getting_Started/Integrated_Openfalcon.html)
8 | - 腾讯蓝鲸故障自愈的使用案例参考:[蓝鲸故障自愈案例](https://docs.bk.tencent.com/product_white_paper/fta/Community_users_cases/Community_users_share_cases.html)
9 | - [那些年我们想做的无人值守](https://mp.weixin.qq.com/s/MX74-vDEOkFA0Om6WDrwYQ)
10 |
--------------------------------------------------------------------------------
/zh_0_2/usage/flume.md:
--------------------------------------------------------------------------------
1 |
2 |
3 | # Flume监控
4 |
5 | 在[数据采集](../philosophy/data-collect.md)一节中我们介绍了常见的监控数据源。open-falcon作为一个监控框架,可以去采集任何系统的监控指标数据,只要将监控数据组织为open-falcon规范的格式就OK了。
6 |
7 | Flume的数据采集可以通过脚本[flume-monitor](https://github.com/mdh67899/openfalcon-monitor-scripts/tree/master/flume)来做。
8 |
9 | ## 工作原理
10 | ```flume-monitor.py```是一个采集脚本,只需要放到falcon-agent的plugin目录,在portal中将对应的plugin绑定到主机组,falcon-agent会主动执行```flume-monitor.py```脚本,```flume-monitor.py```脚本执行结束后会输出json格式数据,由falcon-agent读取和解析数据
11 |
12 | Flume运行时需要在配置文件中加入java环境变量,启动成功之后flume进程会监听一个端口,可以通过http请求的方式来抓取flume提供的metrics,```flume-monitor.py```脚本中配置了需要抓取的Flume组件metric,通过http的方式从flume端口中抓取需要的组件信息,输出json格式数据
13 |
14 | 比如我们在单台机器上部署了3个flume实例,可以在将脚本复制三份,改一下脚本中的```http url```地址,与flume监听的http端口一一对应,在portal中绑定好插件即可
15 |
--------------------------------------------------------------------------------
/zh_0_2/usage/func.md:
--------------------------------------------------------------------------------
1 |
2 |
3 | # 报警函数说明
4 |
5 | 配置报警策略的时候open-falcon支持多种报警触发函数,比如`all(#3)` `diff(#10)`等等。
6 | 这些#后面的数字表示的是最新的历史点,比如`#3`代表的是最新的三个点。该数字默认不能大于`10`,大于`10`将当作`10`处理,即只计算最新`10`个点的值。
7 |
8 | 说明:`#`后面的数字的最大值,即在 judge 内存中保留最近几个点,是支持自定义的,具体参考 book 中[描述](http://book.open-falcon.com/zh_0_2/distributed_install/judge.html) ; 源码位置 => [cfg.example.json](https://github.com/open-falcon/falcon-plus/blob/master/modules/judge/cfg.example.json#L4:6)
9 |
10 | ```bash
11 | all(#3): 最新的3个点都满足阈值条件则报警
12 | max(#3): 对于最新的3个点,其最大值满足阈值条件则报警
13 | min(#3): 对于最新的3个点,其最小值满足阈值条件则报警
14 | sum(#3): 对于最新的3个点,其和满足阈值条件则报警
15 | avg(#3): 对于最新的3个点,其平均值满足阈值条件则报警
16 | diff(#3): 拿最新push上来的点(被减数),与历史最新的3个点(3个减数)相减,得到3个差,只要有一个差满足阈值条件则报警
17 | pdiff(#3): 拿最新push上来的点,与历史最新的3个点相减,得到3个差,再将3个差值分别除以减数,得到3个商值,只要有一个商值满足阈值则报警
18 | lookup(#2,3): 最新的3个点中有2个满足条件则报警;
19 | stddev(#7) = 3:离群点检测函数,取最新 **7** 个点的数据分别计算得到他们的标准差和均值,分别计为 σ 和 μ,其中当前值计为 X,那么当 X 落在区间 [μ-3σ, μ+3σ] 之外时,则认为当前值波动过大,触发报警;更多请参考3-sigma算法:https://en.wikipedia.org/wiki/68%E2%80%9395%E2%80%9399.7_rule。
20 |
21 | ```
22 |
23 | 最常用的就是`all`函数了,比如cpu.idle `all(#3) < 5`,表示cpu.idle的值连续3次小于5%则报警。
24 |
25 | `lookup`为非连续性报警函数,适用于在一定范围内容忍监控指标抖动的场景,比如某个主机的cpu.busy忽高忽低,使用`all(#1)>80`明显过于严格,会产生大量报警干扰视线,使用`all(#3)>80`则连续三次偏高的概率很小,可能永远不会触发报警,不能帮助我们发现系统的不稳定,那么如果使用`lookup(#3,5)`,我们就可以知道cpu.busy最近抖动频繁,超过了我们容忍的界线。
26 |
27 | 新增 `stddev` 函数,基于高斯分布的离群点检测方式,比如cpu.idle `stddev(#5) = 3` ,表示获取cpu.idle的历史5个点数据,计算得到他们的标准差和均值,分别计为 σ 和 μ,看其是否分布在`(μ-3σ,μ+3σ)`范围之内,如果不在范围之内则报警。具体参考wiki中[描述](https://zh.wikipedia.org/wiki/%E6%AD%A3%E6%80%81%E5%88%86%E5%B8%83)
28 |
29 | diff和pdiff理解起来没那么容易,设计diff和pdiff是为了解决流量突增突降报警。实在看不懂,那只能去读代码了:https://github.com/open-falcon/judge/blob/master/store/func.go
30 |
31 |
32 |
33 |
34 |
--------------------------------------------------------------------------------
/zh_0_2/usage/haproxy.md:
--------------------------------------------------------------------------------
1 |
2 |
3 | #HAProxy 监控
4 |
5 | 在[数据采集](../philosophy/data-collect.md)一节中我们介绍了常见的监控数据源。open-falcon作为一个监控框架,可以去采集任何系统的监控指标数据,只要将监控数据组织为open-falcon规范的格式就OK了。
6 |
7 | HAProxy的数据采集可以通过[haproxymon](https://github.com/iask/haproxymon)来做。
8 |
9 | ## 工作原理
10 |
11 | haproxymon是一个cron,每分钟跑一次采集脚本```haproxymon.py```,haproxymon通过Haproxy的stats socket接口来采集Haproxy基础状态信息,比如qcur、scur、rate等,然后组装为open-falcon规定的格式的数据,post给本机的falcon-agent。falcon-agent提供了一个http接口,使用方法可以参考[数据采集](../philosophy/data-collect.md)中的例子。
--------------------------------------------------------------------------------
/zh_0_2/usage/jmx.md:
--------------------------------------------------------------------------------
1 |
2 |
3 | # jmxmon 简介
4 | jmxmon是一个基于open-falcon的jmx监控插件,通过这个插件,结合open-falcon agent,可以采集任何开启了JMX服务端口的java进程的服务状态,并将采集信息自动上报给open-falcon服务端
5 |
6 | ## 主要功能
7 |
8 | 通过jmx采集java进程的jvm信息,包括gc耗时、gc次数、gc吞吐、老年代使用率、新生代晋升大小、活跃线程数等信息。
9 |
10 | 对应用程序代码无侵入,几乎不占用系统资源。
11 |
12 |
13 | ## 采集指标
14 | | Counters | Type | Notes|
15 | |-----|------|------|
16 | | parnew.gc.avg.time | GAUGE | 一分钟内,每次YoungGC(parnew)的平均耗时 |
17 | | concurrentmarksweep.gc.avg.time | GAUGE | 一分钟内,每次CMSGC的平均耗时 |
18 | | parnew.gc.count | GAUGE | 一分钟内,YoungGC(parnew)的总次数 |
19 | | concurrentmarksweep.gc.count | GAUGE | 一分钟内,CMSGC的总次数 |
20 | | gc.throughput | GAUGE | GC的总吞吐率(应用运行时间/进程总运行时间) |
21 | | new.gen.promotion | GAUGE | 一分钟内,新生代的内存晋升总大小 |
22 | | new.gen.avg.promotion | GAUGE | 一分钟内,平均每次YoungGC的新生代内存晋升大小 |
23 | | old.gen.mem.used | GAUGE | 老年代的内存使用量 |
24 | | old.gen.mem.ratio | GAUGE | 老年代的内存使用率 |
25 | | thread.active.count | GAUGE | 当前活跃线程数 |
26 | | thread.peak.count | GAUGE | 峰值线程数 |
27 |
28 | ## 建议设置监控告警项
29 |
30 | 不同应用根据其特点,可以灵活调整触发条件及触发阈值
31 |
32 | | 告警项 | 触发条件 | 备注|
33 | |-----|------|------|
34 | | gc.throughput | all(#3)<98 | gc吞吐率低于98%,影响性能 |
35 | | old.gen.mem.ratio | all(#3)>90 | 老年代内存使用率高于90%,需要调优 |
36 | | thread.active.count | all(#3)>500 | 线程数过多,影响性能 |
37 |
38 |
39 | # 使用帮助
40 | 详细的使用方法常见:[jmxmon](https://github.com/toomanyopenfiles/jmxmon)
41 |
42 |
--------------------------------------------------------------------------------
/zh_0_2/usage/lvs.md:
--------------------------------------------------------------------------------
1 |
2 |
3 | # lvs-metrics 简介
4 | lvs-metrics是一个基于open-falcon的LVS监控插件,通过这个插件,结合open-falcon agent/transfer,可以采集LVS服务状态,并将采集信息自动上报给open-falcon服务端
5 |
6 | ## 主要功能
7 |
8 | 通过google开源的ipvs/netlink库及proc下文件采集lvs的监控信息,包括所有VIP的连接数(活跃/非活跃)/LVS主机的连接数(活跃/非活跃).进出数据包数/字节数.
9 |
10 | 对应用程序代码无侵入,几乎不占用系统资源。
11 |
12 |
13 | ## 采集指标
14 |
15 | | Counters | Type | Notes |
16 | |-----|-----|-----|
17 | | lvs.in.bytes | GUAGE | network in bytes per host |
18 | | lvs.out.bytes | GUAGE | network out bytes per host |
19 | | lvs.in.packets | GUAGE | network in packets per host |
20 | | lvs.out.packets | GUAGE | network out packets per host |
21 | | lvs.total.conns | GUAGE | lvs total connections per vip now |
22 | | lvs.active.conn | GUAGE | lvs active connections per vip now |
23 | | lvs.inact.conn | GUAGE | lvs inactive connections per vip now |
24 | | lvs.realserver.num | GUAGE | lvs live realserver num per vip now |
25 | | lvs.vip.conns | COUNTER | lvs conns counter from service start per vip |
26 | | lvs.vip.inbytes | COUNTER | lvs inbytes counter from service start per vip |
27 | | lvs.vip.outbytes | COUNTER | lvs outpkts counter from service start per vip |
28 | | lvs.vip.inpkts | COUNTER | lvs inpkts counter from service start per vip |
29 | | lvs.vip.outpkts | COUNTER | lvs outpkts counter from service start per vip |
30 |
31 |
32 | # 使用帮助
33 | 详细的使用方法常见:[lvs-metrics](https://github.com/mesos-utility/lvs-metrics)
34 |
35 |
--------------------------------------------------------------------------------
/zh_0_2/usage/memcache.md:
--------------------------------------------------------------------------------
1 |
2 |
3 | # Memcache监控
4 |
5 | 在[数据采集](../philosophy/data-collect.md)一节中我们介绍了常见的监控数据源。open-falcon作为一个监控框架,可以去采集任何系统的监控指标数据,只要将监控数据组织为open-falcon规范的格式就OK了。
6 |
7 | Memcache的数据采集可以通过采集脚本[memcached-monitor](https://github.com/iambocai/falcon-monit-scripts/tree/master/memcached)来做。
8 |
9 | ## 工作原理
10 |
11 | memcached-monitor是一个cron,每分钟跑一次采集脚本```memcached-monitor.py```,脚本可以自动检测Memcached的端口,并连到Memcached实例,采集一些监控指标,比如get_hit_ratio、usage等等,然后组装为open-falcon规定的格式的数据,post给本机的falcon-agent。falcon-agent提供了一个http接口,使用方法可以参考[数据采集](../philosophy/data-collect.md)中的例子。
12 |
13 | 比如,我们有1000台机器都部署了Memcached实例,可以在这1000台机器上分别部署1000个cron,即:与Memcached实例一一对应。
14 |
15 | 需要说明的是,脚本```memcached-monitor.py```通过```ps -ef |grep memcached|grep -v grep |sed -n 's/.* *-p *\([0-9]\{1,5\}\).*/\1/p```来自动发现Memcached端口的。如果Memcached启动时 没有通过 ```-p```参数来指定端口,端口的自动发现将失败,这时需要手动修改脚本、指定端口。
--------------------------------------------------------------------------------
/zh_0_2/usage/mesos.md:
--------------------------------------------------------------------------------
1 |
2 |
3 | # mesos监控
4 |
5 | mesos.py是leancloud开发的open-falcon插件脚本,通过这个插件,结合open-falcon agent/transfer,可以采集mesos相关数据,并将采集信息自动上报给open-falcon服务端
6 |
7 | [https://github.com/leancloud/satori/tree/master/satori-rules/plugin/mesos](https://github.com/leancloud/satori/tree/master/satori-rules/plugin/mesos)
8 |
--------------------------------------------------------------------------------
/zh_0_2/usage/mymon.md:
--------------------------------------------------------------------------------
1 |
2 |
3 | # MySQL监控实践
4 |
5 | 在[数据采集](../philosophy/data-collect.md)一节中我们介绍了常见的监控数据源。open-falcon作为一个监控框架,可以去采集任何系统的监控指标数据,只要将监控数据组织为open-falcon规范的格式就OK了。
6 |
7 | MySQL的数据采集可以通过[mymon](https://github.com/open-falcon/mymon)来做。
8 |
9 | ## 工作原理
10 |
11 | mymon是一个cron,每分钟跑一次,配置文件中配置了数据库连接地址,mymon连到该数据库,采集一些监控指标,比如global status, global variables, slave status等等,然后组装为open-falcon规定的格式的数据,post给本机的falcon-agent。falcon-agent提供了一个http接口,使用方法可以参考[数据采集](../philosophy/data-collect.md)中的例子。
12 |
13 | 比如我们有1000台机器都部署了MySQL实例,可以在这1000台机器上分别部署1000个cron,即:与数据库实例一一对应。
14 |
15 | ## 补充
16 | ***远程监控mysql实例***
17 | 如果希望通过hostA上的mymon、采集hostB上的mysql实例指标,你可以这样做:将hostA上mymon的配置文件中的"endpoint设置为hostB的机器名、同时将[mysql]配置项设置为hostB的mysql实例"。查看mysql指标、对mysql指标加策略时,需要找hostB机器名对应的指标。
18 |
--------------------------------------------------------------------------------
/zh_0_2/usage/ngx_metric.md:
--------------------------------------------------------------------------------
1 |
2 |
3 | # Nginx 监控
4 |
5 | 在[数据采集](../philosophy/data-collect.md)一节中我们介绍了常见的监控数据源。open-falcon作为一个监控框架,可以去采集任何系统的监控指标数据,只要将监控数据组织为open-falcon规范的格式就OK了。
6 |
7 | Nginx的数据采集可以通过[ngx_metric](https://github.com/GuyCheung/falcon-ngx_metric)来做。
8 |
9 | # 工作原理
10 |
11 | ngx_metric是借助lua-nginx-module的`log_by_lua`功能实现nginx请求的实时分析,然后借助`ngx.shared.DICT`存储中间结果。最后通过外部python脚本取出中间结果加以计算、格式化并输出。按falcon格式输出的结果可直接push到falcon agent。
12 |
13 | # 使用帮助
14 |
15 | 详细的使用方法常见:[ngx_metric](https://github.com/GuyCheung/falcon-ngx_metric)
16 |
--------------------------------------------------------------------------------
/zh_0_2/usage/nodata.md:
--------------------------------------------------------------------------------
1 |
2 |
3 | # Nodata配置
4 | 使用Nodata,需要进行两个配置: Nodata配置 和 策略配置。下面,我们以一个例子,讲述如何使用Nodata提供的服务。
5 |
6 | ### 用户需求
7 | 当机器分组`cop.xiaomi_owt.inf_pdl.falcon`下的所有机器,其采集指标 `agent.alive` 上报中断时,通知用户。
8 |
9 | ### Nodata配置
10 | 进入Nodata配置主页,可以看到Nodata配置列表
11 | 
12 |
13 | 点击右上角的添加按钮,添加nodata配置。
14 | 
15 |
16 | 进行完上述配置后,分组`cop.xiaomi_owt.inf_pdl.falcon`下的所有机器,其采集项 `agent.alive`上报中断后,nodata服务就会补发一个取值为 `-1.0`、agent.alive的监控数据给监控系统。
17 |
18 | ### 策略配置
19 | 配置了Nodata后,如果有数据上报中断的情况,Nodata配置中的默认值就会被上报。我们可以针对这个默认值,设置报警;只要收到了默认值,就认为发生了数据上报的中断(如果你设置的默认值,可能与正常上报的数据相等,那么请修改你的Nodata配置、使默认值有别于正常值)。将此策略,绑定到分组`cop.xiaomi_owt.inf_pdl.falcon`即可。
20 |
21 | 
22 |
23 | ### 注意事项
24 | 1. 配置名称name,要全局唯一。这是为了方便Nodata配置的管理。
25 | 2. 监控实例endpoint, 可以是机器分组、机器名或者其他 这三种类型,只能选择其中的一种。同一类型,支持多个记录,但建议不超过5个,多条记录换行分割、每行一条记录。选择机器分组时,系统会帮忙展开成具体机器名,支持动态生效。监控实体不是机器名时,只能选择“其他”类型。
26 | 3. 监控指标metric。
27 | 4. 数据标签tags,多个tag要用逗号隔开。必须填写完整的tags串,因为nodata会按照此tags串,去完全匹配、筛选监控数指标项。
28 | 5. 数据类型type,只支持原始值类型GAUGE。因为,nodata只应该监控 "特征指标"(如agent.alive),"特征指标"都是GAUGE类型的。
29 | 6. 采集周期step,单位是秒。必须填写 完整&真实step。该字段不完整 或者 不真实,将会导致nodata监控的误报、漏报。
30 | 7. 补发值default,必须有别于上报的真实数据。比如,`cpu.idle`的取值范围是[0,100],那么它的nodata默认取值 只能取小于0或者大于100的值。否则,会发生误报、漏报。
31 |
--------------------------------------------------------------------------------
/zh_0_2/usage/prometheus-exporter.md:
--------------------------------------------------------------------------------
1 |
2 |
3 | prometheus作为优秀的开源监控产品,本身不仅完整的指标体系,还拥有丰富的指标采集解决方案。通过各种exporter可以覆盖中间件,操作系统,开发语言等等方面的监控指标采集
4 |
5 | **对于在使用 [open-falcon](https://github.com/open-falcon/falcon-plus) 的用户,你也可以通过 [prometheus-exporter-collector](https://github.com/n9e/prometheus-exporter-collector) 将收集到的数据发送给 open-falcon。**
6 |
7 | ```
8 | ./prometheus-exporter-collector -h
9 | Usage: ./prometheus-exporter-collector [-h] [-b backend] [-s step]
10 |
11 | Options:
12 | -b string
13 | send metrics to backend: n9e, falcon (default "n9e")
14 | -h help
15 | -s int
16 | set default step of falcon metrics (default 60)
17 | ```
18 | - `-b falcon`: 以 open-falcon 作为数据接收方
19 | - `-s 60`: metric 的 step 设置为60s
20 |
21 | **下面是一个具体的例子**:通过 prometheus-exporter-collector, 获取 redis-exporter 的metrics,并发送给 open-falcon。
22 |
23 | ### 1. 下载和编译 redis_exporter
24 |
25 | ```
26 | git clone https://github.com/oliver006/redis_exporter.git
27 | cd redis_exporter
28 | go build .
29 | ./redis_exporter --version
30 | ./redis_exporter -redis.addr redis://127.0.0.1:6379
31 |
32 | //注意,请先确保 redis 已成功运行在127.0.0.1:6379 上。
33 | ```
34 |
35 | 这样,就可以看到 redis_exporter 已经成功运行,并监听在 `:9121/metrics` 。
36 |
37 | ### 2. 运行 prometheus-exporter-collector 并发送数据给 open-falcon
38 | - 检查prometheus-exporter-collector的配置文件,确保 `exporter_urls` 设置为 `http://127.0.0.1:9121/metrics`
39 |
40 | ```
41 | $ cat plugin.test.json
42 |
43 | {
44 | "exporter_urls": [
45 | "http://127.0.0.1:9121/metrics"
46 | ],
47 | "append_tags": ["region=bj", "dept=cloud"],
48 | "endpoint": "127.0.0.100",
49 | "ignore_metrics_prefix": ["go_"],
50 | "metric_prefix": "",
51 | "metric_type": {},
52 | "default_mapping_metric_type": "COUNTER",
53 | "timeout": 500
54 | }
55 | ```
56 |
57 | - 运行prometheus-exporter-collector,将输出发送给本机的 falcon-agent
58 |
59 | ```
60 | cat plugin.test.json | ./prometheus-exporter-collector -b falcon -s 60 | curl -X POST -d @- http://127.0.0.1:1988/v1/push
61 | ```
62 |
--------------------------------------------------------------------------------
/zh_0_2/usage/query.md:
--------------------------------------------------------------------------------
1 |
2 |
3 | # 历史数据查询
4 |
5 | 任何push到open-falcon中的数据,事后都可以通过api组件提供的restAPI,来查询得到。
6 |
7 | 具体请参考[API文档](http://open-falcon.com/falcon-plus/#/graph_histroy)
8 |
--------------------------------------------------------------------------------
/zh_0_2/usage/rabbitmq.md:
--------------------------------------------------------------------------------
1 |
2 |
3 | # RMQ监控
4 |
5 | 在[数据采集](../philosophy/data-collect.md)一节中我们介绍了常见的监控数据源。open-falcon作为一个监控框架,可以去采集任何系统的监控指标数据,只要将监控数据组织为open-falcon规范的格式就OK了。
6 |
7 | RMQ的数据采集可以通过脚本[rabbitmq-monitor](https://github.com/iambocai/falcon-monit-scripts/tree/master/rabbitmq)来做。
8 |
9 | ## 工作原理
10 |
11 | rabbitmq-monitor是一个cron,每分钟跑一次脚本```rabbitmq-monitor.py```,其中配置了RMQ的用户名&密码等,脚本连到该RMQ实例,采集一些监控指标,比如messages_ready、messages_total、deliver_rate、publish_rate等等,然后组装为open-falcon规定的格式的数据,post给本机的falcon-agent。falcon-agent提供了一个http接口,使用方法可以参考[数据采集](../philosophy/data-collect.md)中的例子。
12 |
13 | 比如我们部署了5个RMQ实例,可以在 每个RMQ实例机器上运行一个cron,即:与RMQ实例一一对应。
14 |
15 |
16 | # 可选方案
17 |
18 | 这是另外一个rabbitmq的监控插件,请参考 [rmqmonitor](https://github.com/barryz/rmqmonitor), [issue](https://github.com/open-falcon/falcon-plus/issues/443)
19 |
--------------------------------------------------------------------------------
/zh_0_2/usage/redis.md:
--------------------------------------------------------------------------------
1 |
2 |
3 | # Redis监控
4 |
5 | 在[数据采集](../philosophy/data-collect.md)一节中我们介绍了常见的监控数据源。open-falcon作为一个监控框架,可以去采集任何系统的监控指标数据,只要将监控数据组织为open-falcon规范的格式就OK了。
6 |
7 | Redis的数据采集可以通过采集脚本[redis-monitor](https://github.com/iambocai/falcon-monit-scripts/tree/master/redis) 或者 [redismon](https://github.com/ZhuoRoger/redismon)来做。
8 |
9 | ## 工作原理
10 |
11 | redis-monitor是一个cron,每分钟跑一次采集脚本```redis-monitor.py```,其中配置了redis服务的地址,redis-monitor连到redis实例,采集一些监控指标,比如connected_clients、used_memory等等,然后组装为open-falcon规定的格式的数据,post给本机的falcon-agent。falcon-agent提供了一个http接口,使用方法可以参考[数据采集](../philosophy/data-collect.md)中的例子。
12 |
13 | 比如,我们有1000台机器都部署了Redis实例,可以在这1000台机器上分别部署1000个cron,即:与Redis实例一一对应。
14 |
--------------------------------------------------------------------------------
/zh_0_2/usage/solr.md:
--------------------------------------------------------------------------------
1 |
2 |
3 | # Solr监控
4 |
5 | 在[数据采集](../philosophy/data-collect.md)一节中我们介绍了常见的监控数据源。open-falcon作为一个监控框架,可以去采集任何系统的监控指标数据,只要将监控数据组织为open-falcon规范的格式就OK了。
6 |
7 | Solr的数据采集可以通过脚本[solr_monitor](https://github.com/shanshouchen/falcon-scripts/tree/master/solr-monitor)来做。
8 |
9 | ## 工作原理
10 |
11 | solr_monitor是一个cron,每分钟跑一次脚本```solr_monitor.py```,主要采集一些solr实例内存信息和缓存命中信息等等,然后组装为open-falcon规定的格式的数据,post给本机的falcon-agent。
12 |
13 | 脚本可以部署到Solr的各个实例,每个实例上运行一个cron,定时执行数据收集,即:与Solr实例一一对应
14 |
15 | 如果一台服务器存在多个Solr实例,可以通过修改```solr_monitor.py```中的```servers```属性,增加Solr实例的地址完成本地一对多的数据收集
16 |
--------------------------------------------------------------------------------
/zh_0_2/usage/urlooker.md:
--------------------------------------------------------------------------------
1 | ## [urlooker](https://github.com/710leo/urlooker)
2 | 监控web服务可用性及访问质量,采用go语言编写,易于安装和二次开发
3 |
4 | ## Feature
5 | - 返回状态码检测
6 | - 页面响应时间检测
7 | - 页面关键词匹配检测
8 | - 自定义Header
9 | - GET、POST、PUT访问
10 | - 自定义POST BODY
11 | - 检测结果支持推送 open-falcon
12 |
13 | ## Architecture
14 | 
15 |
16 | ## ScreenShot
17 |
18 | 
19 | 
20 |
21 |
22 | ## 常见问题
23 | - [wiki手册](https://github.com/710leo/urlooker/wiki)
24 | - [常见问题](https://github.com/710leo/urlooker/wiki/FAQ)
25 | - 初始用户名密码:admin/password
26 |
27 | ## Install
28 | #### docker 安装
29 |
30 | ```bash
31 | git clone https://github.com/710leo/urlooker.git
32 | cd urlooker
33 | docker build .
34 | docker volume create urlooker-vol
35 | # [CONTAINER ID] 在实际操作中需要替换为实际的镜像的ID
36 | docker run -p 1984:1984 -d --name urlooker --mount source=urlooker-vol,target=/var/lib/mysql --restart=always [CONTAINER ID]
37 | ```
38 |
39 | #### 源码安装
40 |
41 | ```bash
42 | # 安装mysql
43 | yum install -y mysql-server
44 | wget https://raw.githubusercontent.com/710leo/urlooker/master/sql/schema.sql
45 | mysql -h 127.0.0.1 -u root -p < schema.sql
46 |
47 | # 安装组件
48 | curl https://raw.githubusercontent.com/710leo/urlooker/master/install.sh|bash
49 | cd $GOPATH/src/github.com/710leo/urlooker
50 |
51 | # 将[mysql root password]替换为mysql root 数据库密码
52 | sed -i 's/urlooker.pass/[mysql root password]/g' configs/web.yml
53 |
54 | ./control start all
55 | ```
56 |
57 | 打开浏览器访问 http://127.0.0.1:1984 即可
58 |
59 | ## 答疑
60 | QQ群:556988374
--------------------------------------------------------------------------------
/zh_0_2/usage/win.md:
--------------------------------------------------------------------------------
1 |
2 |
3 | # 监控Windows平台
4 |
5 | 在[数据采集](../philosophy/data-collect.md)一节中我们介绍了常见的监控数据源。open-falcon作为一个监控框架,可以去采集任何系统的监控指标数据,只要将监控数据组织为open-falcon规范的格式就OK了。
6 |
7 | Windows主机的运行指标的采集,可以写Python脚本,通过windows的计划任务来每分钟执行采集各项运行指标,包括内存占用、CPU使用、磁盘使用量、网卡流量等。
8 |
9 | 可以直接使用以下 window 监控程序进行 windows 主机的监控指标采集。
10 |
11 | - [windows_collect](https://github.com/freedomkk-qfeng/falcon-scripts/tree/master/windows_collect):python脚本
12 | - [windows-agent](https://github.com/LeonZYang/agent): go 语言实现的 agent
13 | - [Windows-Agent](https://github.com/AutohomeRadar/Windows-Agent):汽车之家开源的作为Windows Service运行的Agent,python实现。
14 | - [windows-agent](https://github.com/freedomkk-qfeng/windows-agent):另一个 go 语言实现的 windows-agent。支持端口,进程监控,支持后台服务运行。
15 |
16 |
--------------------------------------------------------------------------------
21 |
22 | ## 常见问题
23 | - [wiki手册](https://github.com/710leo/urlooker/wiki)
24 | - [常见问题](https://github.com/710leo/urlooker/wiki/FAQ)
25 | - 初始用户名密码:admin/password
26 |
27 | ## Install
28 | #### docker 安装
29 |
30 | ```bash
31 | git clone https://github.com/710leo/urlooker.git
32 | cd urlooker
33 | docker build .
34 | docker volume create urlooker-vol
35 | # [CONTAINER ID] 在实际操作中需要替换为实际的镜像的ID
36 | docker run -p 1984:1984 -d --name urlooker --mount source=urlooker-vol,target=/var/lib/mysql --restart=always [CONTAINER ID]
37 | ```
38 |
39 | #### 源码安装
40 |
41 | ```bash
42 | # 安装mysql
43 | yum install -y mysql-server
44 | wget https://raw.githubusercontent.com/710leo/urlooker/master/sql/schema.sql
45 | mysql -h 127.0.0.1 -u root -p < schema.sql
46 |
47 | # 安装组件
48 | curl https://raw.githubusercontent.com/710leo/urlooker/master/install.sh|bash
49 | cd $GOPATH/src/github.com/710leo/urlooker
50 |
51 | # 将[mysql root password]替换为mysql root 数据库密码
52 | sed -i 's/urlooker.pass/[mysql root password]/g' configs/web.yml
53 |
54 | ./control start all
55 | ```
56 |
57 | 打开浏览器访问 http://127.0.0.1:1984 即可
58 |
59 | ## 答疑
60 | QQ群:556988374
--------------------------------------------------------------------------------
/zh/usage/win.md:
--------------------------------------------------------------------------------
1 | # 监控Windows平台
2 |
3 | 在[数据采集](../philosophy/data-collect.md)一节中我们介绍了常见的监控数据源。open-falcon作为一个监控框架,可以去采集任何系统的监控指标数据,只要将监控数据组织为open-falcon规范的格式就OK了。
4 |
5 | Windows主机的运行指标的采集,可以写Python脚本,通过windows的计划任务来每分钟执行采集各项运行指标,包括内存占用、CPU使用、磁盘使用量、网卡流量等。
6 |
7 | 可以直接使用以下 window 监控程序进行 windows 主机的监控指标采集。
8 |
9 | - [windows_collect](https://github.com/freedomkk-qfeng/falcon-scripts/tree/master/windows_collect):python脚本
10 | - [windows-agent](https://github.com/LeonZYang/agent): go 语言实现的 agent
11 | - [Windows-Agent](https://github.com/AutohomeRadar/Windows-Agent):汽车之家开源的作为Windows Service运行的Agent,python实现。
12 | - [windows-agent](https://github.com/freedomkk-qfeng/windows-agent):另一个 go 语言实现的 windows-agent。支持端口,进程监控,支持后台服务运行。
13 |
14 |
--------------------------------------------------------------------------------
/zh_0_2/GLOSSARY.md:
--------------------------------------------------------------------------------
1 |
2 |
3 |
--------------------------------------------------------------------------------
/zh_0_2/README.md:
--------------------------------------------------------------------------------
1 |
2 |
3 | [OpenFalcon](http://open-falcon.com)是一款企业级、高可用、可扩展的开源监控解决方案。
4 |
5 | 在大家的热心支持和帮助下,OpenFalcon 已经成为国内最流行的监控系统之一。
6 |
7 | 目前:
8 | - 在 [github](https://github.com/open-falcon/falcon-plus) 上取得了数千个star,数百次fork,上百个pull-request;
9 | - 社区用户6000+;
10 | - 超过200家公司都在不同程度使用open-falcon,包括大陆、新加坡、台湾等地;
11 | - 社区贡献了包括MySQL、redis、windows、交换机、LVS、Mongodb、Memcache、docker、mesos、URL监控等多种插件支持;
12 |
13 | -----
14 | **Acknowledgements**
15 |
16 | - OpenFalcon was initially started by Xiaomi and we would also like to acknowledge contributions by engineers from [these companies](./contributing.html) and [these individual developers](./contributing.html).
17 | - The OpenFalcon logo and website were contributed by Cepave Design Team.
18 | - [Wei Lai](https://github.com/laiwei) is the founder of OpenFalcon software and community.
19 | - The [english doc](http://book.open-falcon.com/en/index.html) is translated by [宋立岭](https://github.com/songliling).
20 |
21 | -----
22 |
23 | NOTICE:
24 |
25 | 1. QQ群已全部满员,请添加我的微信 `laiweivic` ,注明个人介绍和来源自open-falcon,我会拉你进入交流群组;
26 | 2. 我们更推荐您升级到[夜莺监控](https://github.com/ccfos/nightingale): 关于open-falcon和夜莺的对比介绍,请参考阅读[云原生监控的十个特点和趋势](https://mp.weixin.qq.com/s?__biz=MzkzNjI5OTM5Nw==&mid=2247483738&idx=1&sn=e8bdbb974a2cd003c1abcc2b5405dd18&chksm=c2a19fb0f5d616a63185cd79277a79a6b80118ef2185890d0683d2bb20451bd9303c78d083c5#rd);
27 |
28 |
29 | 请大家优先在 github 上提交 [issue](https://github.com/open-falcon/falcon-plus/issues), 方便问题沉淀,github issue 会最高优先级解决。
30 | - QQ五群:42607978 (已满员)
31 | - QQ四群:697503992 (已满员)
32 | - QQ一群:373249123 (已满员)
33 | - QQ二群:516088946 (已满员)
34 | - QQ三群:469342415 (已满员)
35 |
36 |
37 |
38 |
--------------------------------------------------------------------------------
/zh_0_2/api/README.md:
--------------------------------------------------------------------------------
1 | # open-falcon api
2 | - [api v0.2](http://open-falcon.com/falcon-plus/)
3 |
--------------------------------------------------------------------------------
/zh_0_2/authors.md:
--------------------------------------------------------------------------------
1 | ../zh/authors.md
--------------------------------------------------------------------------------
/zh_0_2/contributing.md:
--------------------------------------------------------------------------------
1 | ../zh/contributing.md
--------------------------------------------------------------------------------
/zh_0_2/dev/README.md:
--------------------------------------------------------------------------------
1 |
2 |
3 | # 环境准备
4 |
5 | 请参考[环境准备](quick_install/prepare.md)
6 | # 自定义修改归档策略
7 | 修改open-falcon/graph/rrdtool/rrdtool.go
8 |
9 | 
10 | 
11 |
12 | 重新编译graph组件,并替换原有的二进制
13 |
14 | 清理掉原来的所有rrd文件(默认在/home/work/data/6070/下面)
15 |
16 | # 插件机制
17 | 1. 找一个git存放公司的所有插件
18 | 2. 通过调用agent的/plugin/update接口拉取插件repo到本地
19 | 3. 在portal中配置哪些机器可以执行哪些插件
20 | 4. 插件命名方式:$step_xx.yy,需要有可执行权限,分门别类存放到repo的各个目录
21 | 5. 把采集到的数据打印到stdout
22 | 6. 如果觉得git方式不方便,可以改造agent,定期从某个http地址下载打包好的plugin.tar.gz
23 |
24 |
--------------------------------------------------------------------------------
/zh_0_2/dev/change_graph_rra.md:
--------------------------------------------------------------------------------
1 |
2 |
3 | ## 修改绘图曲线精度
4 |
5 | 默认的,Open-Falcon只保存最近12小时的原始监控数据,12小时之后的数据被降低精度、采样存储。
6 |
7 | 如果默认的精度不能满足你的需求,可以按照如下步骤,修改绘图曲线的存储精度。
8 |
9 | #### 第一步,修改graph组件的RRA,并重新编译graph组件
10 | graph组件的RRA,定义在文件 graph/rrdtool/[rrdtool.go](https://github.com/open-falcon/graph/blob/master/rrdtool/rrdtool.go#L57)中,默认如下:
11 |
12 | ```golang
13 | // RRA.Point.Size
14 | const (
15 | RRA1PointCnt = 720 // 1m一个点存12h
16 | RRA5PointCnt = 576 // 5m一个点存2d
17 | // ...
18 | )
19 |
20 | func create(filename string, item *cmodel.GraphItem) error {
21 | now := time.Now()
22 | start := now.Add(time.Duration(-24) * time.Hour)
23 | step := uint(item.Step)
24 |
25 | c := rrdlite.NewCreator(filename, start, step)
26 | c.DS("metric", item.DsType, item.Heartbeat, item.Min, item.Max)
27 |
28 | // 设置各种归档策略
29 | // 1分钟一个点存 12小时
30 | c.RRA("AVERAGE", 0.5, 1, RRA1PointCnt)
31 |
32 | // 5m一个点存2d
33 | c.RRA("AVERAGE", 0.5, 5, RRA5PointCnt)
34 | c.RRA("MAX", 0.5, 5, RRA5PointCnt)
35 | c.RRA("MIN", 0.5, 5, RRA5PointCnt)
36 |
37 | // ...
38 |
39 | return c.Create(true)
40 | }
41 |
42 | ```
43 |
44 | 比如,你只想保存90天的原始数据,可以将代码修改为:
45 |
46 | ```golang
47 | // RRA.Point.Size
48 | const (
49 | RRA1PointCnt = 129600 // 1m一个点存90d,取值 90*24*3600/60
50 | )
51 |
52 | func create(filename string, item *cmodel.GraphItem) error {
53 | now := time.Now()
54 | start := now.Add(time.Duration(-24) * time.Hour)
55 | step := uint(item.Step)
56 |
57 | c := rrdlite.NewCreator(filename, start, step)
58 | c.DS("metric", item.DsType, item.Heartbeat, item.Min, item.Max)
59 |
60 | // 设置各种归档策略
61 | // 1分钟一个点存 90d
62 | c.RRA("AVERAGE", 0.5, 1, RRA1PointCnt)
63 |
64 | return c.Create(true)
65 | }
66 | ```
67 |
68 | #### 第二步,清除graph的历史数据
69 | 清除已上报的所有指标的历史数据,即删除所有的rrdfile。不删除历史数据,已上报指标的精度更改将不能生效。
70 |
71 | #### 第三步,重新部署graph服务
72 | 编译修改后的graph源码,关停原有的graph老服务、发布修改后的graph。
73 |
74 | 只需要修改graph组件、不需要修改Open-Falcon的其他组件,新的精度就能生效。你可以通过Dashboard、Screen来查看新的精度的绘图曲线。
75 |
76 |
77 |
78 | ### 注意事项:
79 |
80 | 修改监控绘图曲线精度时,需要:
81 |
82 | + 修改graph源代码,更新RRA
83 | + 清除graph的历史数据。不删除历史数据,已上报指标的精度更改将不能生效
84 | + 除了graph之外,Open-Falcon的其他任何组件 不需要被修改
85 | + 修改RRA后,可能会出现"绘图曲线点数过多、浏览器被卡死"的问题。请合理规划RRA存储的点数,或者调整绘图曲线查询时的时间段选择。
86 |
87 |
88 |
--------------------------------------------------------------------------------
/zh_0_2/dev/support_grafana.md:
--------------------------------------------------------------------------------
1 |
2 |
3 | ## 支持 Grafana 视图展现
4 |
5 | 相较于 Open-Falcon 内建的 Dashboard,Grafana 可以很有弹性的自定义图表,并且可以针对 Dashboard 做权限控管、上标签以及查询,图表的展示选项也更多样化。本篇教学帮助您
6 | 做好 Open-Falcon 的面子工程!
7 |
8 | ### 安装和使用步骤
9 |
10 | 请参考 [grafana open-falcon](https://github.com/open-falcon/grafana-openfalcon-datasource)
11 |
12 |
13 | ### 致谢
14 | - 感谢fastweb @kordan @masato25 等朋友的贡献;
15 |
--------------------------------------------------------------------------------
/zh_0_2/distributed_install/README.md:
--------------------------------------------------------------------------------
1 |
2 |
3 | # 概述
4 |
5 | Open-Falcon是一个比较大的分布式系统,有十几个组件。按照功能,这十几个组件可以划分为 基础组件、作图链路组件和报警链路组件,其安装部署的架构如下图所示,
6 |
7 | 
8 |
9 | ## 在单台机器上快速安装
10 |
11 | 请直接参考[quick_install](../quick_install/README.md)
12 |
13 | ## Docker化的Open-Falcon安装
14 |
15 | 参考:
16 | - https://github.com/open-falcon/falcon-plus/blob/master/docker/README.md
17 | - https://github.com/open-falcon/dashboard/blob/master/README.md
18 |
19 | ## 在多台机器上分布式安装
20 |
21 | 在多台机器上,分布式安装open-falcon,就是本章的内容,请按照本章节的顺序,安装每个组件。
22 |
23 | ## 视频教程教你安装
24 |
25 | 《[Open-Falcon部署与架构解析](http://www.jikexueyuan.com/course/1651.html)》
26 |
27 |
--------------------------------------------------------------------------------
/zh_0_2/distributed_install/agent-updater.md:
--------------------------------------------------------------------------------
1 |
2 |
3 | # Agent-updater
4 |
5 | 每台机器都要部署falcon-agent,如果公司机器量比较少,用pssh、ansible、fabric之类的工具手工安装问题也不大。但是公司机器量多了之后,手工安装、升级、回滚falcon-agent将成为噩梦。
6 |
7 | 个人开发了agent-updater这个工具,用于管理falcon-agent,agent-updater也有一个agent:ops-updater,可以看做是一个超级agent,用于管理其他agent的agent,呵呵,ops-updater推荐在装机的时候一起安装上。ops-updater通常是不会升级的。
8 |
9 | 具体参看:https://github.com/open-falcon/ops-updater
10 |
11 | 如果你想学习如何使用Go语言编写一个完整的项目,也可以研究一下agent-updater,我甚至录制了一个视频教程来演示一步一步如何开发出来的。课程链接:
12 |
13 | - http://www.jikexueyuan.com/course/1336.html
14 | - http://www.jikexueyuan.com/course/1357.html
15 | - http://www.jikexueyuan.com/course/1462.html
16 | - http://www.jikexueyuan.com/course/1490.html
17 |
18 |
--------------------------------------------------------------------------------
/zh_0_2/distributed_install/aggregator.md:
--------------------------------------------------------------------------------
1 |
2 |
3 | # Aggregator
4 |
5 | 集群聚合模块。聚合某集群下的所有机器的某个指标的值,提供一种集群视角的监控体验。
6 |
7 |
8 | ## 服务部署
9 | 服务部署,包括配置修改、启动服务、检验服务、停止服务等。这之前,需要将安装包解压到服务的部署目录下。
10 |
11 | ```
12 | # 修改配置, 配置项含义见下文
13 | mv cfg.example.json cfg.json
14 | vim cfg.json
15 |
16 | # 启动服务
17 | ./open-falcon start aggregator
18 |
19 | # 检查log
20 | ./open-falcon monitor aggregator
21 |
22 | # 停止服务
23 | ./open-falcon stop aggregator
24 |
25 | ```
26 |
27 |
28 | ## 配置说明
29 | 配置文件默认为./cfg.json。默认情况下,安装包会有一个cfg.example.json的配置文件示例。各配置项的含义,如下
30 |
31 | ```
32 | {
33 | "debug": true,
34 | "http": {
35 | "enabled": true,
36 | "listen": "0.0.0.0:6055"
37 | },
38 | "database": {
39 | "addr": "root:@tcp(127.0.0.1:3306)/falcon_portal?loc=Local&parseTime=true",
40 | "idle": 10,
41 | "ids": [1, -1],
42 | "interval": 55
43 | },
44 | "api": {
45 | "connect_timeout": 500,
46 | "request_timeout": 2000,
47 | "plus_api": "http://127.0.0.1:8080", #falcon-plus api模块的运行地址
48 | "plus_api_token": "default-token-used-in-server-side", #和falcon-plus api 模块交互的认证token
49 | "push_api": "http://127.0.0.1:1988/v1/push" #push数据的http接口,这是agent提供的接口
50 | }
51 | }
52 |
53 |
54 | ```
55 |
--------------------------------------------------------------------------------
/zh_0_2/distributed_install/api.md:
--------------------------------------------------------------------------------
1 |
2 |
3 | # API
4 | api组件,提供统一的restAPI操作接口。比如:api组件接收查询请求,根据一致性哈希算法去相应的graph实例查询不同metric的数据,然后汇总拿到的数据,最后统一返回给用户。
5 |
6 | ## 服务部署
7 | 服务部署,包括配置修改、启动服务、检验服务、停止服务等。这之前,需要将安装包解压到服务的部署目录下。
8 |
9 | ```
10 | # 修改配置, 配置项含义见下文, 注意graph集群的配置
11 | mv cfg.example.json cfg.json
12 | vim cfg.json
13 |
14 | # 启动服务
15 | ./open-falcon start api
16 |
17 | # 停止服务
18 | ./open-falcon stop api
19 |
20 | # 查看日志
21 | ./open-falcon monitor api
22 |
23 | ```
24 |
25 | ## 配置说明
26 |
27 | 注意: 请确保 `graphs`的内容与transfer的配置**完全一致**
28 |
29 | ```
30 | {
31 | "log_level": "debug",
32 | "db": { //数据库相关的连接配置信息
33 | "faclon_portal": "root:@tcp(127.0.0.1:3306)/falcon_portal?charset=utf8&parseTime=True&loc=Local",
34 | "graph": "root:@tcp(127.0.0.1:3306)/graph?charset=utf8&parseTime=True&loc=Local",
35 | "uic": "root:@tcp(127.0.0.1:3306)/uic?charset=utf8&parseTime=True&loc=Local",
36 | "dashboard": "root:@tcp(127.0.0.1:3306)/dashboard?charset=utf8&parseTime=True&loc=Local",
37 | "alarms": "root:@tcp(127.0.0.1:3306)/alarms?charset=utf8&parseTime=True&loc=Local",
38 | "db_bug": true
39 | },
40 | "graphs": { // graph模块的部署列表信息
41 | "cluster": {
42 | "graph-00": "127.0.0.1:6070"
43 | },
44 | "max_conns": 100,
45 | "max_idle": 100,
46 | "conn_timeout": 1000,
47 | "call_timeout": 5000,
48 | "numberOfReplicas": 500
49 | },
50 | "metric_list_file": "./api/data/metric",
51 | "web_port": ":8080", // http监听端口
52 | "access_control": true, // 如果设置为false,那么任何用户都可以具备管理员权限
53 | "salt": "pleaseinputwhichyouareusingnow", //数据库加密密码的时候的salt
54 | "skip_auth": false, //如果设置为true,那么访问api就不需要经过认证
55 | "default_token": "default-token-used-in-server-side", //用于服务端各模块间的访问授权
56 | "gen_doc": false,
57 | "gen_doc_path": "doc/module.html"
58 | }
59 |
60 |
61 |
62 | ```
63 |
64 | ## 补充说明
65 | - 部署完成api组件后,请修改dashboard组件的配置、使其能够正确寻址到api组件。
66 | - 请确保api组件的graph列表 与 transfer的配置 一致。
67 |
--------------------------------------------------------------------------------
/zh_0_2/distributed_install/gateway.md:
--------------------------------------------------------------------------------
1 |
2 |
3 | # Gateway
4 |
5 | **如果您没有遇到机房分区问题,请直接忽略此组件**。
6 |
7 | 如果您已经遇到机房分区问题、并急需解决机房分区时监控数据回传的问题,请使用该组件。更多的资料在[这里](https://github.com/open-falcon/falcon-plus/blob/master/modules/gateway/README.md)。
8 |
--------------------------------------------------------------------------------
/zh_0_2/distributed_install/graph.md:
--------------------------------------------------------------------------------
1 |
2 |
3 | # Graph
4 |
5 | graph是存储绘图数据的组件。graph组件 接收transfer组件推送上来的监控数据,同时处理api组件的查询请求、返回绘图数据。
6 |
7 | ## 服务部署
8 | 服务部署,包括配置修改、启动服务、检验服务、停止服务等。这之前,需要将安装包解压到服务的部署目录下。
9 |
10 | ```
11 | # 修改配置, 配置项含义见下文
12 | mv cfg.example.json cfg.json
13 | vim cfg.json
14 |
15 | # 启动服务
16 | ./open-falcon start graph
17 |
18 | # 停止服务
19 | ./open-falcon stop graph
20 |
21 | # 查看日志
22 | ./open-falcon monitor graph
23 |
24 | ```
25 |
26 | ## 配置说明
27 | 配置文件默认为./cfg.json。默认情况下,安装包会有一个cfg.example.json的配置文件示例。各配置项的含义,如下
28 |
29 | ```
30 | {
31 | "debug": false, //true or false, 是否开启debug日志
32 | "http": {
33 | "enabled": true, //true or false, 表示是否开启该http端口,该端口为控制端口,主要用来对graph发送控制命令、统计命令、debug命令
34 | "listen": "0.0.0.0:6071" //表示监听的http端口
35 | },
36 | "rpc": {
37 | "enabled": true, //true or false, 表示是否开启该rpc端口,该端口为数据接收端口
38 | "listen": "0.0.0.0:6070" //表示监听的rpc端口
39 | },
40 | "rrd": {
41 | "storage": "./data/6070" // 历史数据的文件存储路径(如有必要,请修改为合适的路)
42 | },
43 | "db": {
44 | "dsn": "root:@tcp(127.0.0.1:3306)/graph?loc=Local&parseTime=true", //MySQL的连接信息,默认用户名是root,密码为空,host为127.0.0.1,database为graph(如有必要,请修改)
45 | "maxIdle": 4 //MySQL连接池配置,连接池允许的最大连接数,保持默认即可
46 | },
47 | "callTimeout": 5000, //RPC调用超时时间,单位ms
48 | "ioWorkerNum": 64, //底层io.Worker的数量, 注意: 这个功能是v0.2.1版本之后引入的,v0.2.1版本之前的配置文件不需要该参数
49 | "migrate": { //扩容graph时历史数据自动迁移
50 | "enabled": false, //true or false, 表示graph是否处于数据迁移状态
51 | "concurrency": 2, //数据迁移时的并发连接数,建议保持默认
52 | "replicas": 500, //这是一致性hash算法需要的节点副本数量,建议不要变更,保持默认即可(必须和transfer的配置中保持一致)
53 | "cluster": { //未扩容前老的graph实例列表
54 | "graph-00" : "127.0.0.1:6070"
55 | }
56 | }
57 | }
58 |
59 | ```
60 |
61 | ## 补充说明
62 | 部署完graph组件后,请修改transfer和api的配置,使这两个组件可以寻址到graph。
63 |
--------------------------------------------------------------------------------
/zh_0_2/distributed_install/hbs.md:
--------------------------------------------------------------------------------
1 |
2 |
3 | # HBS(Heartbeat Server)
4 |
5 | 心跳服务器,公司所有agent都会连到HBS,每分钟发一次心跳请求。
6 |
7 | ## 设计初衷
8 |
9 | Portal的数据库中有一个host表,维护了公司所有机器的信息,比如hostname、ip等等。这个表中的数据通常是从公司CMDB中同步过来的。但是有些规模小一些的公司是没有CMDB的,那此时就需要手工往host表中录入数据,这很麻烦。于是我们赋予了HBS第一个功能:agent发送心跳信息给HBS的时候,会把hostname、ip、agent version、plugin version等信息告诉HBS,HBS负责更新host表。
10 |
11 | falcon-agent有一个很大的特点,就是自发现,不用配置它应该采集什么数据,就自动去采集了。比如cpu、内存、磁盘、网卡流量等等都会自动采集。我们除了要采集这些基础信息之外,还需要做端口存活监控和进程数监控。那我们是否也要自动采集监听的端口和各个进程数目呢?我们没有这么做,因为这个数据量比较大,汇报上去之后用户大部分都是不关心的,太浪费。于是我们换了一个方式,只采集用户配置的。比如用户配置了对某个机器80端口的监控,我们才会去采集这个机器80端口的存活性。那agent如何知道自己应该采集哪些端口和进程呢?向HBS要,HBS去读取Portal的数据库,返回给agent。
12 |
13 | 之后我们会介绍一个用于判断报警的组件:Judge,Judge需要获取所有的报警策略,让Judge去读取Portal的DB么?不太好。因为Judge的实例数目比较多,如果公司有几十万机器,Judge实例数目可能会是几百个,几百个Judge实例去访问Portal数据库,也是一个比较大的压力。既然HBS无论如何都要访问Portal的数据库了,那就让HBS去获取所有的报警策略缓存在内存里,然后Judge去向HBS请求。这样一来,对Portal DB的压力就会大大减小。
14 |
15 |
16 | ## 部署说明
17 |
18 | hbs是可以水平扩展的,至少部署两个实例以保证可用性。一般一个实例可以搞定5000台机器,所以说,如果公司有10万台机器,可以部署20个hbs实例,前面架设lvs,agent中就配置上lvs vip即可。
19 |
20 | ## 配置说明
21 |
22 | 配置文件必须叫cfg.json,可以基于cfg.example.json修改
23 |
24 | ```
25 | {
26 | "debug": true,
27 | "database": "root:password@tcp(127.0.0.1:3306)/falcon_portal?loc=Local&parseTime=true", # Portal的数据库地址
28 | "hosts": "", # portal数据库中有个host表,如果表中数据是从其他系统同步过来的,此处配置为sync,否则就维持默认,留空即可
29 | "maxIdle": 100,
30 | "listen": ":6030", # hbs监听的rpc地址
31 | "trustable": [""],
32 | "http": {
33 | "enabled": true,
34 | "listen": "0.0.0.0:6031" # hbs监听的http地址
35 | }
36 | }
37 | ```
38 |
39 | ## 进程管理
40 |
41 | ```
42 | # 启动
43 | ./open-falcon start hbs
44 |
45 | # 停止
46 | ./open-falcon stop hbs
47 |
48 | # 查看日志
49 | ./open-falcon monitor hbs
50 |
51 | ```
52 |
53 | ## 补充
54 |
55 | 如果你先部署了agent,后部署的hbs,那咱们部署完hbs之后需要回去修改agent的配置,把agent配置中的heartbeat部分enabled设置为true,addr设置为hbs的rpc地址。如果hbs的配置文件维持默认,rpc端口就是6030,http端口是6031,agent中应该配置为hbs的rpc端口,小心别弄错了。
56 |
57 |
58 | ## 视频教程
59 |
60 | 为hbs模块录制了一个视频,做了源码级解读:http://www.jikexueyuan.com/course/1873.html
61 |
62 |
--------------------------------------------------------------------------------
/zh_0_2/distributed_install/judge.md:
--------------------------------------------------------------------------------
1 |
2 |
3 | # Judge
4 |
5 | Judge用于告警判断,agent将数据push给Transfer,Transfer不但会转发给Graph组件来绘图,还会转发给Judge用于判断是否触发告警。
6 |
7 | ## 设计初衷
8 |
9 | 因为监控系统数据量比较大,一台机器显然是搞不定的,所以必须要有个数据分片方案。Transfer通过一致性哈希来分片,每个Judge就只需要处理一小部分数据就可以了。所以判断告警的功能不能放在直接的数据接收端:Transfer,而应该放到Transfer后面的组件里。
10 |
11 |
12 | ## 部署说明
13 |
14 | Judge监听了一个http端口,提供了一个http接口:/count,访问之,可以得悉当前Judge实例处理了多少数据量。推荐的做法是一个Judge实例处理50万~100万数据,用个5G~10G内存,如果所用物理机内存比较大,比如有128G,可以在一个物理机上部署多个Judge实例。
15 |
16 | ## 配置说明
17 |
18 | 配置文件必须叫cfg.json,可以基于cfg.example.json修改
19 |
20 | ```
21 | {
22 | "debug": true,
23 | "debugHost": "nil",
24 | "remain": 11,
25 | "http": {
26 | "enabled": true,
27 | "listen": "0.0.0.0:6081"
28 | },
29 | "rpc": {
30 | "enabled": true,
31 | "listen": "0.0.0.0:6080"
32 | },
33 | "hbs": {
34 | "servers": ["127.0.0.1:6030"], # hbs最好放到lvs vip后面,所以此处最好配置为vip:port
35 | "timeout": 300,
36 | "interval": 60
37 | },
38 | "alarm": {
39 | "enabled": true,
40 | "minInterval": 300, # 连续两个报警之间至少相隔的秒数,维持默认即可
41 | "queuePattern": "event:p%v",
42 | "redis": {
43 | "dsn": "127.0.0.1:6379", # 与alarm、sender使用一个redis
44 | "maxIdle": 5,
45 | "connTimeout": 5000,
46 | "readTimeout": 5000,
47 | "writeTimeout": 5000
48 | }
49 | }
50 | }
51 | ```
52 |
53 | remain这个配置详细解释一下:
54 | remain指定了judge内存中针对某个数据存多少个点,比如host01这个机器的cpu.idle的值在内存中最多存多少个,配置报警的时候比如all(#3),这个#后面的数字不能超过remain-1,一般维持默认就够用了
55 |
56 | ## 进程管理
57 |
58 | 我们提供了一个control脚本来完成常用操作
59 |
60 | ```
61 | # 启动
62 | ./open-falcon start judge
63 |
64 | # 停止
65 | ./open-falcon stop judge
66 |
67 | # 查看日志
68 | ./open-falcon monitor judge
69 | ```
70 |
71 | ## 视频教程
72 |
73 | 为judge模块录制了一个视频,做了源码级解读:http://www.jikexueyuan.com/course/1850.html
74 |
75 |
--------------------------------------------------------------------------------
/zh_0_2/distributed_install/nodata.md:
--------------------------------------------------------------------------------
1 |
2 |
3 | # Nodata
4 |
5 | nodata用于检测监控数据的上报异常。nodata和实时报警judge模块协同工作,过程为: 配置了nodata的采集项超时未上报数据,nodata生成一条默认的模拟数据;用户配置相应的报警策略,收到mock数据就产生报警。采集项上报异常检测,作为judge模块的一个必要补充,能够使judge的实时报警功能更加可靠、完善。
6 |
7 | ## 服务部署
8 | 服务部署,包括配置修改、启动服务、检验服务、停止服务等。这之前,需要将安装包解压到服务的部署目录下。
9 |
10 | ```
11 | # 修改配置, 配置项含义见下文
12 | mv cfg.example.json cfg.json
13 | vim cfg.json
14 |
15 | # 启动服务
16 | ./open-falcon start nodata
17 |
18 | # 停止服务
19 | ./open-falcon stop nodata
20 |
21 | # 检查日志
22 | ./open-falcon monitor nodata
23 |
24 | ```
25 |
26 | ## 配置说明
27 | 配置文件默认为./cfg.json。默认情况下,安装包会有一个cfg.example.json的配置文件示例。各配置项的含义,如下
28 |
29 | ```
30 | {
31 | "debug": true,
32 | "http": {
33 | "enabled": true,
34 | "listen": "0.0.0.0:6090"
35 | },
36 | "plus_api":{
37 | "connectTimeout": 500,
38 | "requestTimeout": 2000,
39 | "addr": "http://127.0.0.1:8080", #falcon-plus api模块的运行地址
40 | "token": "default-token-used-in-server-side" #用于和falcon-plus api模块的交互认证token
41 | },
42 | "config": {
43 | "enabled": true,
44 | "dsn": "root:@tcp(127.0.0.1:3306)/falcon_portal?loc=Local&parseTime=true&wait_timeout=604800",
45 | "maxIdle": 4
46 | },
47 | "collector":{
48 | "enabled": true,
49 | "batch": 200,
50 | "concurrent": 10
51 | },
52 | "sender":{
53 | "enabled": true,
54 | "connectTimeout": 500,
55 | "requestTimeout": 2000,
56 | "transferAddr": "127.0.0.1:6060", #transfer的http监听地址,一般形如"domain.transfer.service:6060"
57 | "batch": 500
58 | }
59 | }
60 |
61 | ```
62 |
--------------------------------------------------------------------------------
/zh_0_2/distributed_install/prepare.md:
--------------------------------------------------------------------------------
1 |
2 |
3 | ## 环境准备
4 | 请参考[环境准备](../quick_install/prepare.md)
5 |
--------------------------------------------------------------------------------
/zh_0_2/donate.md:
--------------------------------------------------------------------------------
1 | ../zh/donate.md
--------------------------------------------------------------------------------
/zh_0_2/faq/alarm.md:
--------------------------------------------------------------------------------
1 |
2 |
3 | # 报警相关常见问题
4 |
5 | #### 配置了策略,一直没有报警,如何排查?
6 |
7 | 1. 排查sender、alarm、judge、hbs、agent、transfer的log
8 | 2. 浏览器访问alarm的http页面,看是否有未恢复的告警,如果有就是生成报警了,后面没发出去,很可能是邮件、短信发送接口出问题了,检查sender中配置的api
9 | 3. 打开agent的debug,看是否在正常push数据
10 | 4. 看agent配置,是否正确配置了heartbeat(hbs)和transfer的地址,并enabled
11 | 5. 看transfer配置,是否正确配置了judge地址
12 | 6. jduge提供了一个http接口用于debug,可以检查某个数据是否正确push上来了,比如qd-open-falcon-judge01.hd这个机器的cpu.idle数据,可以这么查看
13 | ```bash
14 | curl http://127.0.0.1:6081/history/qd-open-falcon-judge01.hd/cpu.idle
15 | ```
16 | 7. 检查服务器的时间是否已经同步,可以用 [ntp](https://access.redhat.com/documentation/en-US/Red_Hat_Enterprise_Linux/7/html/System_Administrators_Guide/sect-Understanding_chrony_and-its_configuration.html) 或 chrony 来实现
17 |
18 | 上面的127.0.0.1:6081指的是judge的http端口
19 | 7. 检查judge配置的hbs地址是否正确
20 | 8. 检查hbs配置的数据库地址是否正确
21 | 9. 检查portal中配置的策略模板是否配置了报警接收人
22 | 10. 检查portal中配置的策略模板是否绑定到某个HostGroup了,并且目标机器恰好在这个HostGroup中
23 | 11. 去UIC检查报警接收组中是否把自己加进去了
24 | 12. 去UIC检查自己的联系信息是否正确
25 |
26 | #### 在Portal页面创建了一个HostGroup,往HostGroup中增加机器的时候报错
27 |
28 | 1. 检查agent是否正确配置了heartbeat地址,并enabled了
29 | 2. 检查hbs log
30 | 3. 检查hbs配置的数据库地址是否正确
31 | 4. 检查hbs的配置hosts是否配置为sync了,只有留空的时候hbs才会去写host表,host表中有数据才能在页面上添加机器
32 |
33 |
34 | #### 在alarm这边配置了短信、邮件、微信通知,在alarm 日志中看到告警写入 redis 队列都有,但实际发送有时候只有1种,有时2种,有时3种都有。
35 | 1. 检查是否有多个alarm进程同时读取一个redis队列,引起相互干扰,如urlooker的alarm。
36 | 2. 修改redis队列名称,如修改urlooker的redis队列名称,使2个alarm读取不同的队列,避免造成干扰。
37 |
38 |
39 |
40 |
--------------------------------------------------------------------------------
/zh_0_2/faq/collect.md:
--------------------------------------------------------------------------------
1 |
2 |
3 | # 数据收集相关问题
4 | Open-Falcon数据收集,分为[绘图数据]收集和[报警数据]收集。下面介绍,如何验证两个链路的数据收集是否正常。
5 |
6 |
7 | ### 如何验证[绘图数据]收集是否正常
8 | 数据链路是:`agent->transfer->graph->query->dashboard`。graph有一个http接口可以验证`agent->transfer->graph`这条链路,比如graph的http端口是6071,可以这么访问验证:
9 |
10 | ```bash
11 | # $endpoint和$counter是变量
12 | curl http://127.0.0.1:6071/history/$endpoint/$counter
13 |
14 | # 如果上报的数据不带tags,访问方式是这样的:
15 | curl http://127.0.0.1:6071/history/host01/agent.alive
16 |
17 | # 如果上报的数据带有tags,访问方式如下,其中tags为module=graph,project=falcon
18 | curl http://127.0.0.1:6071/history/host01/qps/module=graph,project=falcon
19 | ```
20 | 如果调用上述接口返回空值,则说明agent没有上报数据、或者transfer服务异常。
21 |
22 |
23 | ### 如何验证[报警数据]收集是否正常
24 |
25 | 数据链路是:`agent->transfer->judge`,judge有一个http接口可以验证`agent->transfer->judge`这条链路,比如judge的http端口是6081,可以这么访问验证:
26 |
27 | ```bash
28 | curl http://127.0.0.1:6081/history/$endpoint/$counter
29 |
30 | # $endpoint和$counter是变量,举个例子:
31 | curl http://127.0.0.1:6081/history/host01/cpu.idle
32 |
33 | # counter=$metric/sorted($tags)
34 | # 如果上报的数据带有tag,访问方式是这样的,比如:
35 | curl http://127.0.0.1:6081/history/host01/qps/module=judge,project=falcon
36 | ```
37 | 如果调用上述接口返回空值,则说明agent没有上报数据、或者transfer服务异常。
38 |
39 | **注意**: v0.2.1版本之后judge新增了优化内存使用的功能,如果metric没有对应的strategy或者expression,judge内存中不会存储该metirc的历史数据,所以判断报警数据收集这条链路是否正常时需要先确定metric是否有对应的报警条件
40 |
41 | ```bash
42 | # 检查metric是否有对应的strategy
43 | curl http://127.0.0.1:6081/strategy/$endpoint/$counter
44 |
45 | # 检查metric是否有对应的expression
46 | curl http://127.0.0.1:6081/expression/$counter
47 |
48 |
49 | # $endpoint和$counter是变量
50 | # expression报警条件必须包含tag,当metric上报数据没有携带tag时只检测是否有对应的strategy即可
51 | # 举个例子:
52 | curl http://127.0.0.1:6081/strategy/host01/cpu.idle
53 |
54 | # counter=$metric/sorted($tags)
55 | # 如果上报的数据带有tag,需要检测streategy和expression是否存在
56 | # 举个例子: 当上报的metric为qps, tag为module=judge,project=falcon时, 访问方式是这样的:
57 | curl http://127.0.0.1:6081/strategy/host01/qps
58 |
59 | curl http://127.0.0.1:6081/expression/qps/module=judge
60 |
61 | curl http://127.0.0.1:6081/expression/qps/project=falcon
62 | ```
63 |
--------------------------------------------------------------------------------
/zh_0_2/image/OpenFalcon_wechat.jpg:
--------------------------------------------------------------------------------
https://raw.githubusercontent.com/open-falcon/book/f5ac09ca0c92d3c3d77aee4767aaab80edad1bbf/zh_0_2/image/OpenFalcon_wechat.jpg
--------------------------------------------------------------------------------
/zh_0_2/image/func_aggregator_1.png:
--------------------------------------------------------------------------------
https://raw.githubusercontent.com/open-falcon/book/f5ac09ca0c92d3c3d77aee4767aaab80edad1bbf/zh_0_2/image/func_aggregator_1.png
--------------------------------------------------------------------------------
/zh_0_2/image/func_aggregator_2.png:
--------------------------------------------------------------------------------
https://raw.githubusercontent.com/open-falcon/book/f5ac09ca0c92d3c3d77aee4767aaab80edad1bbf/zh_0_2/image/func_aggregator_2.png
--------------------------------------------------------------------------------
/zh_0_2/image/func_aggregator_3.png:
--------------------------------------------------------------------------------
https://raw.githubusercontent.com/open-falcon/book/f5ac09ca0c92d3c3d77aee4767aaab80edad1bbf/zh_0_2/image/func_aggregator_3.png
--------------------------------------------------------------------------------
/zh_0_2/image/func_aggregator_4.png:
--------------------------------------------------------------------------------
https://raw.githubusercontent.com/open-falcon/book/f5ac09ca0c92d3c3d77aee4767aaab80edad1bbf/zh_0_2/image/func_aggregator_4.png
--------------------------------------------------------------------------------
/zh_0_2/image/func_aggregator_5.png:
--------------------------------------------------------------------------------
https://raw.githubusercontent.com/open-falcon/book/f5ac09ca0c92d3c3d77aee4767aaab80edad1bbf/zh_0_2/image/func_aggregator_5.png
--------------------------------------------------------------------------------
/zh_0_2/image/func_getting_started_1.png:
--------------------------------------------------------------------------------
https://raw.githubusercontent.com/open-falcon/book/f5ac09ca0c92d3c3d77aee4767aaab80edad1bbf/zh_0_2/image/func_getting_started_1.png
--------------------------------------------------------------------------------
/zh_0_2/image/func_getting_started_10.png:
--------------------------------------------------------------------------------
https://raw.githubusercontent.com/open-falcon/book/f5ac09ca0c92d3c3d77aee4767aaab80edad1bbf/zh_0_2/image/func_getting_started_10.png
--------------------------------------------------------------------------------
/zh_0_2/image/func_getting_started_11.png:
--------------------------------------------------------------------------------
https://raw.githubusercontent.com/open-falcon/book/f5ac09ca0c92d3c3d77aee4767aaab80edad1bbf/zh_0_2/image/func_getting_started_11.png
--------------------------------------------------------------------------------
/zh_0_2/image/func_getting_started_12.png:
--------------------------------------------------------------------------------
https://raw.githubusercontent.com/open-falcon/book/f5ac09ca0c92d3c3d77aee4767aaab80edad1bbf/zh_0_2/image/func_getting_started_12.png
--------------------------------------------------------------------------------
/zh_0_2/image/func_getting_started_2.png:
--------------------------------------------------------------------------------
https://raw.githubusercontent.com/open-falcon/book/f5ac09ca0c92d3c3d77aee4767aaab80edad1bbf/zh_0_2/image/func_getting_started_2.png
--------------------------------------------------------------------------------
/zh_0_2/image/func_getting_started_3.png:
--------------------------------------------------------------------------------
https://raw.githubusercontent.com/open-falcon/book/f5ac09ca0c92d3c3d77aee4767aaab80edad1bbf/zh_0_2/image/func_getting_started_3.png
--------------------------------------------------------------------------------
/zh_0_2/image/func_getting_started_4.png:
--------------------------------------------------------------------------------
https://raw.githubusercontent.com/open-falcon/book/f5ac09ca0c92d3c3d77aee4767aaab80edad1bbf/zh_0_2/image/func_getting_started_4.png
--------------------------------------------------------------------------------
/zh_0_2/image/func_getting_started_5.png:
--------------------------------------------------------------------------------
https://raw.githubusercontent.com/open-falcon/book/f5ac09ca0c92d3c3d77aee4767aaab80edad1bbf/zh_0_2/image/func_getting_started_5.png
--------------------------------------------------------------------------------
/zh_0_2/image/func_getting_started_6.png:
--------------------------------------------------------------------------------
https://raw.githubusercontent.com/open-falcon/book/f5ac09ca0c92d3c3d77aee4767aaab80edad1bbf/zh_0_2/image/func_getting_started_6.png
--------------------------------------------------------------------------------
/zh_0_2/image/func_getting_started_7.png:
--------------------------------------------------------------------------------
https://raw.githubusercontent.com/open-falcon/book/f5ac09ca0c92d3c3d77aee4767aaab80edad1bbf/zh_0_2/image/func_getting_started_7.png
--------------------------------------------------------------------------------
/zh_0_2/image/func_getting_started_8.png:
--------------------------------------------------------------------------------
https://raw.githubusercontent.com/open-falcon/book/f5ac09ca0c92d3c3d77aee4767aaab80edad1bbf/zh_0_2/image/func_getting_started_8.png
--------------------------------------------------------------------------------
/zh_0_2/image/func_getting_started_9.png:
--------------------------------------------------------------------------------
https://raw.githubusercontent.com/open-falcon/book/f5ac09ca0c92d3c3d77aee4767aaab80edad1bbf/zh_0_2/image/func_getting_started_9.png
--------------------------------------------------------------------------------
/zh_0_2/image/func_intro_1.png:
--------------------------------------------------------------------------------
https://raw.githubusercontent.com/open-falcon/book/f5ac09ca0c92d3c3d77aee4767aaab80edad1bbf/zh_0_2/image/func_intro_1.png
--------------------------------------------------------------------------------
/zh_0_2/image/func_intro_2.png:
--------------------------------------------------------------------------------
https://raw.githubusercontent.com/open-falcon/book/f5ac09ca0c92d3c3d77aee4767aaab80edad1bbf/zh_0_2/image/func_intro_2.png
--------------------------------------------------------------------------------
/zh_0_2/image/func_intro_3.png:
--------------------------------------------------------------------------------
https://raw.githubusercontent.com/open-falcon/book/f5ac09ca0c92d3c3d77aee4767aaab80edad1bbf/zh_0_2/image/func_intro_3.png
--------------------------------------------------------------------------------
/zh_0_2/image/func_intro_4.png:
--------------------------------------------------------------------------------
https://raw.githubusercontent.com/open-falcon/book/f5ac09ca0c92d3c3d77aee4767aaab80edad1bbf/zh_0_2/image/func_intro_4.png
--------------------------------------------------------------------------------
/zh_0_2/image/func_intro_5.png:
--------------------------------------------------------------------------------
https://raw.githubusercontent.com/open-falcon/book/f5ac09ca0c92d3c3d77aee4767aaab80edad1bbf/zh_0_2/image/func_intro_5.png
--------------------------------------------------------------------------------
/zh_0_2/image/func_intro_6.png:
--------------------------------------------------------------------------------
https://raw.githubusercontent.com/open-falcon/book/f5ac09ca0c92d3c3d77aee4767aaab80edad1bbf/zh_0_2/image/func_intro_6.png
--------------------------------------------------------------------------------
/zh_0_2/image/func_intro_7.png:
--------------------------------------------------------------------------------
https://raw.githubusercontent.com/open-falcon/book/f5ac09ca0c92d3c3d77aee4767aaab80edad1bbf/zh_0_2/image/func_intro_7.png
--------------------------------------------------------------------------------
/zh_0_2/image/func_intro_8.png:
--------------------------------------------------------------------------------
https://raw.githubusercontent.com/open-falcon/book/f5ac09ca0c92d3c3d77aee4767aaab80edad1bbf/zh_0_2/image/func_intro_8.png
--------------------------------------------------------------------------------
/zh_0_2/image/func_nodata_1.png:
--------------------------------------------------------------------------------
https://raw.githubusercontent.com/open-falcon/book/f5ac09ca0c92d3c3d77aee4767aaab80edad1bbf/zh_0_2/image/func_nodata_1.png
--------------------------------------------------------------------------------
/zh_0_2/image/func_nodata_2.png:
--------------------------------------------------------------------------------
https://raw.githubusercontent.com/open-falcon/book/f5ac09ca0c92d3c3d77aee4767aaab80edad1bbf/zh_0_2/image/func_nodata_2.png
--------------------------------------------------------------------------------
/zh_0_2/image/func_nodata_3.png:
--------------------------------------------------------------------------------
https://raw.githubusercontent.com/open-falcon/book/f5ac09ca0c92d3c3d77aee4767aaab80edad1bbf/zh_0_2/image/func_nodata_3.png
--------------------------------------------------------------------------------
/zh_0_2/image/linkedsee_1.png:
--------------------------------------------------------------------------------
https://raw.githubusercontent.com/open-falcon/book/f5ac09ca0c92d3c3d77aee4767aaab80edad1bbf/zh_0_2/image/linkedsee_1.png
--------------------------------------------------------------------------------
/zh_0_2/image/linkedsee_2.png:
--------------------------------------------------------------------------------
https://raw.githubusercontent.com/open-falcon/book/f5ac09ca0c92d3c3d77aee4767aaab80edad1bbf/zh_0_2/image/linkedsee_2.png
--------------------------------------------------------------------------------
/zh_0_2/image/linkedsee_3.png:
--------------------------------------------------------------------------------
https://raw.githubusercontent.com/open-falcon/book/f5ac09ca0c92d3c3d77aee4767aaab80edad1bbf/zh_0_2/image/linkedsee_3.png
--------------------------------------------------------------------------------
/zh_0_2/image/linkedsee_4.png:
--------------------------------------------------------------------------------
https://raw.githubusercontent.com/open-falcon/book/f5ac09ca0c92d3c3d77aee4767aaab80edad1bbf/zh_0_2/image/linkedsee_4.png
--------------------------------------------------------------------------------
/zh_0_2/image/linkedsee_5.png:
--------------------------------------------------------------------------------
https://raw.githubusercontent.com/open-falcon/book/f5ac09ca0c92d3c3d77aee4767aaab80edad1bbf/zh_0_2/image/linkedsee_5.png
--------------------------------------------------------------------------------
/zh_0_2/image/practice_graph-scaling_io01.png:
--------------------------------------------------------------------------------
https://raw.githubusercontent.com/open-falcon/book/f5ac09ca0c92d3c3d77aee4767aaab80edad1bbf/zh_0_2/image/practice_graph-scaling_io01.png
--------------------------------------------------------------------------------
/zh_0_2/image/practice_graph-scaling_io02.png:
--------------------------------------------------------------------------------
https://raw.githubusercontent.com/open-falcon/book/f5ac09ca0c92d3c3d77aee4767aaab80edad1bbf/zh_0_2/image/practice_graph-scaling_io02.png
--------------------------------------------------------------------------------
/zh_0_2/image/practice_graph-scaling_io03.png:
--------------------------------------------------------------------------------
https://raw.githubusercontent.com/open-falcon/book/f5ac09ca0c92d3c3d77aee4767aaab80edad1bbf/zh_0_2/image/practice_graph-scaling_io03.png
--------------------------------------------------------------------------------
/zh_0_2/image/practice_graph-scaling_quantity.png:
--------------------------------------------------------------------------------
https://raw.githubusercontent.com/open-falcon/book/f5ac09ca0c92d3c3d77aee4767aaab80edad1bbf/zh_0_2/image/practice_graph-scaling_quantity.png
--------------------------------------------------------------------------------
/zh_0_2/image/practice_graph-scaling_rrd.png:
--------------------------------------------------------------------------------
https://raw.githubusercontent.com/open-falcon/book/f5ac09ca0c92d3c3d77aee4767aaab80edad1bbf/zh_0_2/image/practice_graph-scaling_rrd.png
--------------------------------------------------------------------------------
/zh_0_2/image/practice_graph-scaling_stats.png:
--------------------------------------------------------------------------------
https://raw.githubusercontent.com/open-falcon/book/f5ac09ca0c92d3c3d77aee4767aaab80edad1bbf/zh_0_2/image/practice_graph-scaling_stats.png
--------------------------------------------------------------------------------
/zh_0_2/philosophy/README.md:
--------------------------------------------------------------------------------
1 |
2 |
3 | # 设计理念
4 |
5 | 阐述open-falcon设计过程中的各种思考
6 |
--------------------------------------------------------------------------------
/zh_0_2/philosophy/data-collect.md:
--------------------------------------------------------------------------------
1 |
2 |
3 | 作为监控系统来讲,首先得有监控数据,然后才能做后面的分析处理、绘图报警等事情,那falcon是如何处理数据采集这个问题的呢?
4 |
5 | 我们先要考虑有哪些数据要采集,脑洞打开~
6 |
7 | - 机器负载信息,这个最常见,cpu.idle/load.1min/mem.memfree.percent/df.bytes.free.percent等等
8 | - 硬件信息,比如功耗、风扇转速、磁盘是否可写,系统组同学对这些比较关注
9 | - 服务监控数据,比如某个接口每分钟调用的次数,latency等等
10 | - 数据库、HBase、Redis、Openstack等开源软件的监控指标
11 |
12 | 要采集的数据还挺多哩,监控系统的开发人员不是神,没法搞定所有数据,比如MySQL,DBA最懂,他知道应该采集哪些指标,监控只要提供一个数据push的接口即可,大家共建。想知道push给Server的数据长啥样?可以参考[Tag与HostGroup设计理念](tags-and-hostgroup.md)中提到的两条json数据
13 |
14 | 上面四个方面比较有代表性,咱们挨个阐述。
15 |
16 | **机器负载信息**
17 |
18 | 这部分比较通用,我们提供了一个agent部署在所有机器上去采集。不像zabbix,要采集什么数据需要在服务端配置,falcon无需配置,只要agent部署到机器上,配置好heartbeat和Transfer地址,就自动开始采集了,省去了用户配置的麻烦。目前agent只支持64位Linux,Mac、Windows均不支持。
19 |
20 | **硬件信息**
21 |
22 | 硬件信息的采集脚本由系统组同学提供,作为plugin依托于agent运行,plugin机制介绍请看[这里](plugin.md)。
23 |
24 | **服务监控数据**
25 |
26 | 服务的监控指标采集脚本,通常都是跟着服务的code走的,服务上线或者扩容,这个脚本也跟着上线或者扩容,服务下线,这个采集脚本也要相应下线。公司里Java的项目有不少,研发那边就提供了一个通用jar包,只要引入这个jar包,就可以自动采集接口的调用次数、延迟时间等数据。然后将采集到的数据push给监控,一分钟push一次。目前falcon的agent提供了一个简单的http接口,这个jar包采集到数据之后是post给本机agent。向agent推送数据的一个简单例子,如下:
27 |
28 | ```bash
29 | curl -X POST -d '[{"metric": "qps", "endpoint": "open-falcon-graph01.bj", "timestamp": 1431347802, "step": 60,"value": 9,"counterType": "GAUGE","tags": "project=falcon,module=graph"}]' http://127.0.0.1:1988/v1/push
30 | ```
31 |
32 | **各种开源软件的监控指标**
33 |
34 | 这都是大用户,比如DBA自己写一些采集脚本,连到各个MySQL实例上去采集数据,完事直接调用server端的jsonrpc汇报数据,一分钟一次,每次甚至push几十万条数据,比较好的发送方式是500条数据做一个batch,别几十万数据一次性发送。
35 |
36 |
--------------------------------------------------------------------------------
/zh_0_2/philosophy/data-model.md:
--------------------------------------------------------------------------------
1 |
2 |
3 | # Data model
4 |
5 | Open-Falcon,采用和OpenTSDB相似的数据格式:metric、endpoint加多组key value tags,举两个例子:
6 |
7 | ```bash
8 | {
9 | metric: load.1min,
10 | endpoint: open-falcon-host,
11 | tags: srv=falcon,idc=aws-sgp,group=az1,
12 | value: 1.5,
13 | timestamp: `date +%s`,
14 | counterType: GAUGE,
15 | step: 60
16 | }
17 | {
18 | metric: net.port.listen,
19 | endpoint: open-falcon-host,
20 | tags: port=3306,
21 | value: 1,
22 | timestamp: `date +%s`,
23 | counterType: GAUGE,
24 | step: 60
25 | }
26 | ```
27 |
28 | 其中,metric是监控指标名称,endpoint是监控实体,tags是监控数据的属性标签,counterType是Open-Falcon定义的数据类型(取值为GAUGE、COUNTER),step为监控数据的上报周期,value和timestamp是有效的监控数据。
29 |
--------------------------------------------------------------------------------
/zh_0_2/philosophy/plugin.md:
--------------------------------------------------------------------------------
1 |
2 |
3 | 对于Plugin机制,叙述之前必须要强调一下:
4 |
5 | > Plugin可以看做是对agent功能的扩充。对于业务系统的监控指标采集,最好不要做成plugin,而是把采集脚本放到业务程序发布包中,随着业务代码上线而上线,随着业务代码升级而升级,这样会比较容易管理。
6 |
7 | 要使用Plugin,步骤如下:
8 |
9 | **1. 编写采集脚本**
10 |
11 | 用什么语言写没关系,只要目标机器上有运行环境就行,脚本本身要有可执行权限。采集到数据之后直接打印到stdout即可,agent会截获并push给server。数据格式是json,举个例子:
12 |
13 | ```bash
14 | [root@host01:/path/to/plugins/plugin/sys/ntp]#./600_ntp.py
15 | [{"endpoint": "host01", "tags": "", "timestamp": 1431349763, "metric": "sys.ntp.offset", "value": 0.73699999999999999, "counterType": "GAUGE", "step": 600}]
16 | ```
17 |
18 | 注意,这个json数据是个list哦
19 |
20 | **2. 上传脚本到git**
21 |
22 | 插件脚本也是code,所以最好也用git、svn管理,这里我们使用git管理,公司内部如果没有搭建gitlab,可以使用gitcafe、coding.net之类的,将写好的脚本push到git仓库,比如上例中的600_ntp.py,姑且放到git仓库的sys/ntp目录下。注意,这个脚本在push到git仓库之前要加上可执行权限。
23 |
24 | **3. 检查agent配置**
25 |
26 | 大家之前部署agent的时候应该注意到agent配置文件中有配置plugin吧,现在到了用的时候了,把git仓库地址配置上,enabled设置为true。注意,配置的git仓库地址需要是任何机器上都可以拉取的,即`git://`或者`https://`打头的。如果agent之前已经部署到公司所有机器上了,那现在手工改配置可能略麻烦,之前讲过的嘛,用[ops-updater](https://github.com/open-falcon/ops-updater)管理起来~
27 |
28 | **4. 拉取plugin脚本**
29 |
30 | agent开了一个http端口1988,我们可以挨个curl一下http://ip:1988/plugin/update 这个地址,这会让agent主动git pull这个插件仓库。为啥没做成定期拉取这个仓库呢?主要是怕给git服务器压力太大……大家悠着点用,别给人pull挂了……
31 |
32 | **5. 让plugin run起来**
33 |
34 | 上一步我们拉取了plugin脚本到所有机器上,不过plugin并没有执行。哪些机器执行哪些plugin脚本,是在portal上面配置的。其实我很想做成,只要插件拉取下来了就立马执行,不过实际实践中,有些插件还是不能在所有机器上跑,所以就在portal上通过配置控制了。在portal上找到要执行插件的HostGroup,点击对应的plugins超链接,对于上例sys/ntp目录下的600_ntp.py,直接把sys/ntp绑定上去即可。sys/ntp下的所有插件就都执行了。
35 |
36 | **6. 补充**
37 |
38 | portal上配置完成之后并不会立马生效,有个同步的过程,最终是agent通过调用hbs的接口获取的,需要一两分钟。上例我们绑定了sys/ntp,这实际是个目录,这个目录下的所有插件都会被执行,那什么样的文件会被看做插件呢?文件名是数字下划线打头的,这个数字代表的是step,即多长时间跑一次,单位是秒,比如60_a.py,就是在通过命名告诉agent,这个插件每60秒跑一次。sys/ntp目录下的子目录、其他命名方式的文件都会被忽略。
39 |
40 | **7. 插件如何传递参数**
41 |
42 | Open-Falcon 在 [PR #672](https://github.com/open-falcon/falcon-plus/pull/672) 中,对插件传递传递自定义参数进行了支持。在dashboard 中,配置 HostGroup 绑定插件时,可以支持针对单个脚本配置参数。
43 |
44 | 比如:`sys/ntp/30_xx.sh(a, "33 4", 'test.sh f\,d')`,表示对 hostgroup 绑定一个插件脚本`sys/ntp/30_xx.sh`, 并传递4个参数,多个参数之间用`,`分割,每个参数可以用双引号或者单引号括起来。如果参数中本身就包含逗号,可以使用 `\,` 来转义。
45 |
46 | * 参数,只在绑定单个插件脚本时有效。如果绑定的是一个插件目录,传递的参数会忽略掉。
47 | * 如果某个目录下的某个插件脚本,被单独绑定到某个hostgroup,同时该目录也被绑定到了这个hostgroup,这个插件脚本不会重复被执行,绑定目录时这个插件脚本会被忽略(也就是说,单个脚本的绑定会覆盖目录绑定方式下的同一个脚本)。
48 |
--------------------------------------------------------------------------------
/zh_0_2/practice/README.md:
--------------------------------------------------------------------------------
1 |
2 |
3 | Open-Falcon实践经验整理
4 |
--------------------------------------------------------------------------------
/zh_0_2/quick_install/README.md:
--------------------------------------------------------------------------------
1 |
2 |
3 | Open-Falcon,为前后端分离的架构,包含backend 和 frontend两部分:
4 |
5 | - [安装后端](./backend.md)
6 | - [安装前端](./frontend.md)
7 |
--------------------------------------------------------------------------------
/zh_0_2/quick_install/backend.md:
--------------------------------------------------------------------------------
1 |
2 |
3 | ## 环境准备
4 |
5 | 请参考[环境准备](./prepare.md)
6 |
7 | ### 创建工作目录
8 | ```bash
9 | export FALCON_HOME=/home/work
10 | export WORKSPACE=$FALCON_HOME/open-falcon
11 | mkdir -p $WORKSPACE
12 | ```
13 |
14 | ### 解压二进制包
15 | ```bash
16 | tar -xzvf open-falcon-v0.2.1.tar.gz -C $WORKSPACE
17 | ```
18 |
19 | ### 在一台机器上启动所有的后端组件
20 | # 首先确认配置文件中数据库账号密码与实际相同,否则需要修改配置文件。
21 | ```
22 | cd $WORKSPACE
23 | grep -Ilr 3306 ./ | xargs -n1 -- sed -i 's/root:/real_user:real_password/g'
24 | ```
25 | # 启动
26 | ```bash
27 | cd $WORKSPACE
28 | ./open-falcon start
29 |
30 | # 检查所有模块的启动状况
31 | ./open-falcon check
32 |
33 | ```
34 |
35 | ### 更多的命令行工具用法
36 | ```bash
37 | # ./open-falcon [start|stop|restart|check|monitor|reload] module
38 | ./open-falcon start agent
39 |
40 | ./open-falcon check
41 | falcon-graph UP 53007
42 | falcon-hbs UP 53014
43 | falcon-judge UP 53020
44 | falcon-transfer UP 53026
45 | falcon-nodata UP 53032
46 | falcon-aggregator UP 53038
47 | falcon-agent UP 53044
48 | falcon-gateway UP 53050
49 | falcon-api UP 53056
50 | falcon-alarm UP 53063
51 |
52 | For debugging , You can check $WorkDir/$moduleName/log/logs/xxx.log
53 | ```
54 |
--------------------------------------------------------------------------------
/zh_0_2/quick_install/frontend.md:
--------------------------------------------------------------------------------
1 |
2 | ----
3 |
4 | ## 环境准备
5 |
6 | 请参考[环境准备](./prepare.md)
7 |
8 | ### 创建工作目录
9 | ```
10 | export HOME=/home/work
11 | export WORKSPACE=$HOME/open-falcon
12 | mkdir -p $WORKSPACE
13 | cd $WORKSPACE
14 | ```
15 |
16 | ### 克隆前端组件代码
17 | ```
18 | cd $WORKSPACE
19 | git clone https://github.com/open-falcon/dashboard.git
20 | ```
21 |
22 | ### 安装依赖包
23 | ```
24 | yum install -y python-virtualenv
25 | yum install -y python-devel
26 | yum install -y openldap-devel
27 | yum install -y mysql-devel
28 | yum groupinstall "Development tools"
29 |
30 |
31 | cd $WORKSPACE/dashboard/
32 | virtualenv ./env
33 |
34 | ./env/bin/pip install -r pip_requirements.txt -i https://pypi.douban.com/simple
35 | ```
36 |
37 | ### 初始化数据库
38 | 请参考[环境准备](./prepare.md)
39 |
40 |
41 | ### 修改配置
42 | ```
43 | dashboard的配置文件为: 'rrd/config.py',请根据实际情况修改
44 |
45 | ## API_ADDR 表示后端api组件的地址
46 | API_ADDR = "http://127.0.0.1:8080/api/v1"
47 |
48 | ## 根据实际情况,修改PORTAL_DB_*, 默认用户名为root,默认密码为""
49 | ## 根据实际情况,修改ALARM_DB_*, 默认用户名为root,默认密码为""
50 | ```
51 |
52 | ### 以开发者模式启动
53 | ```
54 | ./env/bin/python wsgi.py
55 |
56 | open http://127.0.0.1:8081 in your browser.
57 | ```
58 |
59 | ### 在生产环境启动
60 | ```
61 | bash control start
62 |
63 | open http://127.0.0.1:8081 in your browser.
64 | ```
65 |
66 | ### 停止dashboard运行
67 | ```
68 | bash control stop
69 | ```
70 |
71 | ### 查看日志
72 | ```
73 | bash control tail
74 | ```
75 |
76 | ### dashbord用户管理
77 | ```
78 | dashbord没有默认创建任何账号包括管理账号,需要你通过页面进行注册账号。
79 | 想拥有管理全局的超级管理员账号,需要手动注册用户名为root的账号(第一个帐号名称为root的用户会被自动设置为超级管理员)。
80 | 超级管理员可以给普通用户分配权限管理。
81 |
82 | 小提示:注册账号能够被任何打开dashboard页面的人注册,所以当给相关的人注册完账号后,需要去关闭注册账号功能。只需要去修改api组件的配置文件cfg.json,将signup_disable配置项修改为true,重启api即可。当需要给人开账号的时候,再将配置选项改回去,用完再关掉即可。
83 | ```
84 |
--------------------------------------------------------------------------------
/zh_0_2/quick_install/prepare.md:
--------------------------------------------------------------------------------
1 |
2 |
3 | # 环境准备
4 |
5 | ### 安装redis
6 | yum install -y redis
7 |
8 | ### 安装mysql
9 | yum install -y mysql-server
10 |
11 | **注意,请确保redis和MySQL已启动。**
12 |
13 | ### 初始化MySQL表结构
14 |
15 | ```
16 | cd /tmp/ && git clone https://github.com/open-falcon/falcon-plus.git
17 | cd /tmp/falcon-plus/scripts/mysql/db_schema/
18 | mysql -h 127.0.0.1 -u root -p < 1_uic-db-schema.sql
19 | mysql -h 127.0.0.1 -u root -p < 2_portal-db-schema.sql
20 | mysql -h 127.0.0.1 -u root -p < 3_dashboard-db-schema.sql
21 | mysql -h 127.0.0.1 -u root -p < 4_graph-db-schema.sql
22 | mysql -h 127.0.0.1 -u root -p < 5_alarms-db-schema.sql
23 | rm -rf /tmp/falcon-plus/
24 | ```
25 |
26 | **如果你是从v0.1.0升级到当前版本v0.2.0,那么只需要执行如下命令:**
27 |
28 | ```
29 | mysql -h 127.0.0.1 -u root -p < 5_alarms-db-schema.sql
30 | ```
31 |
32 | # 从源码编译
33 |
34 | 首先,请确保你已经安装好了golang环境,如果没有安装,请参考 https://golang.org/doc/install
35 |
36 | ```
37 | cd $GOPATH/src/github.com/open-falcon/falcon-plus/
38 |
39 | # make all modules
40 | make all
41 |
42 | # pack all modules
43 | make pack
44 |
45 | ```
46 |
47 | 这时候,你会在当前目录下面,得到open-falcon-v0.2.0.tar.gz的压缩包,就表示已经编译和打包成功了。
48 |
49 | # 下载编译好的二进制版本
50 |
51 | 如果你不想自己编译的话,那么可以下载官方编译好的[二进制版本(x86 64位平台)](https://github.com/open-falcon/falcon-plus/releases)。
52 |
53 |
54 | 到这一步,准备工作就完成了。 open-falcon-v0.2.0.tar.gz 这个二进制包,请大家解压到合适的位置,暂时保存,后续步骤需要使用。
55 |
--------------------------------------------------------------------------------
/zh_0_2/styles/website.css:
--------------------------------------------------------------------------------
1 | /* CSS for website */
2 | h1 , h2{
3 | border-bottom: 1px solid #EFEAEA;
4 | padding-bottom: 3px;
5 | }
6 | .markdown-section>:first-child {
7 | margin-top: 0!important;
8 | }
9 | .markdown-section blockquote:last-child {
10 | margin-bottom: 0.85em!important;
11 | }
12 | .page-wrapper {
13 | margin-top: -1.275em;
14 | }
15 | .book .book-body .page-wrapper .page-inner section.normal {
16 | min-height:350px;
17 | margin-bottom: 30px;
18 | }
19 |
20 | .book .book-body .page-wrapper .page-inner section.normal hr {
21 | height: 0px;
22 | padding: 0;
23 | margin: 1.7em 0;
24 | overflow: hidden;
25 | background-color: #e7e7e7;
26 | border-bottom: 1px dotted #e7e7e7;
27 | }
28 |
29 | .video-js {
30 | width:100%;
31 | height: 100%;
32 | }
33 |
34 | pre[class*="language-"] {
35 | border: none;
36 | background-color: #f7f7f7;
37 | font-size: 1em;
38 | line-height: 1.2em;
39 | }
40 |
41 | .book .book-body .page-wrapper .page-inner section.normal {
42 | font-size: 14px;
43 | font-family: "ubuntu", "Tahoma", "Microsoft YaHei", arial, sans-serif;
44 | }
45 |
46 | .aceCode {
47 | font-size: 14px !important;
48 | }
49 |
50 | input[type=checkbox]{
51 | margin-left: -2em;
52 | }
53 |
54 | .page-footer span{
55 | font-size: 12px;
56 | }
57 |
58 | .page-footer .copyright {
59 | float: left;
60 | }
61 |
62 | .body, html {
63 | overflow-y: hidden;
64 | }
65 |
66 | .versions-select select {
67 | height: 2em;
68 | line-height: 2em;
69 | border-radius: 4px;
70 | background: #efefef;
71 | }
72 |
73 |
--------------------------------------------------------------------------------
/zh_0_2/usage/README.md:
--------------------------------------------------------------------------------
1 |
2 |
3 | open-falcon使用手册
4 |
5 |
--------------------------------------------------------------------------------
/zh_0_2/usage/data-push.md:
--------------------------------------------------------------------------------
1 |
2 |
3 | # 自定义push数据到open-falcon
4 |
5 | 不仅仅是falcon-agent采集的数据可以push到监控系统,一些场景下,我们自定义的一些数据指标,也可以push到open-falcon中,比如:
6 |
7 | 1. 线上某服务的qps
8 | 2. 某业务的在线人数
9 | 3. 某个接⼝的响应时间
10 | 4. 某个⻚面的状态码(500、200)
11 | 5. 某个接⼝的请求出错次数
12 | 6. 某个业务的每分钟的收⼊统计
13 | 7. ......
14 |
15 | ## 一个shell脚本编写的,自定义push数据到open-falcon的例子
16 |
17 | ```
18 | # 注意,http request body是个json,这个json是个列表
19 |
20 | ts=`date +%s`;
21 |
22 | curl -X POST -d "[{\"metric\": \"test-metric\", \"endpoint\": \"test-endpoint\", \"timestamp\": $ts,\"step\": 60,\"value\": 1,\"counterType\": \"GAUGE\",\"tags\": \"idc=lg,project=xx\"}]" http://127.0.0.1:1988/v1/push
23 |
24 | ```
25 |
26 | ## 一个python的、自定义push数据到open-falcon的例子
27 |
28 | ```
29 | #!-*- coding:utf8 -*-
30 |
31 | import requests
32 | import time
33 | import json
34 |
35 | ts = int(time.time())
36 | payload = [
37 | {
38 | "endpoint": "test-endpoint",
39 | "metric": "test-metric",
40 | "timestamp": ts,
41 | "step": 60,
42 | "value": 1,
43 | "counterType": "GAUGE",
44 | "tags": "idc=lg,loc=beijing",
45 | },
46 |
47 | {
48 | "endpoint": "test-endpoint",
49 | "metric": "test-metric2",
50 | "timestamp": ts,
51 | "step": 60,
52 | "value": 2,
53 | "counterType": "GAUGE",
54 | "tags": "idc=lg,loc=beijing",
55 | },
56 | ]
57 |
58 | r = requests.post("http://127.0.0.1:1988/v1/push", data=json.dumps(payload))
59 |
60 | print r.text
61 | ```
62 |
63 | ## API详解
64 |
65 | - metric: 最核心的字段,代表这个采集项具体度量的是什么, 比如是cpu_idle呢,还是memory_free, 还是qps
66 | - endpoint: 标明Metric的主体(属主),比如metric是cpu_idle,那么Endpoint就表示这是哪台机器的cpu_idle
67 | - timestamp: 表示汇报该数据时的unix时间戳,注意是整数,代表的是秒
68 | - value: 代表该metric在当前时间点的值,float64
69 | - step: 表示该数据采集项的汇报周期,这对于后续的配置监控策略很重要,必须明确指定。
70 | - counterType: 只能是COUNTER或者GAUGE二选一,前者表示该数据采集项为计时器类型,后者表示其为原值 (注意大小写)
71 | - GAUGE:即用户上传什么样的值,就原封不动的存储
72 | - COUNTER:指标在存储和展现的时候,会被计算为speed,即(当前值 - 上次值)/ 时间间隔
73 | - tags: 一组逗号分割的键值对, 对metric进一步描述和细化, 可以是空字符串. 比如idc=lg,比如service=xbox等,多个tag之间用逗号分割
74 |
75 | 说明:这7个字段都是必须指定
76 |
--------------------------------------------------------------------------------
/zh_0_2/usage/docker.md:
--------------------------------------------------------------------------------
1 |
2 |
3 |
4 | # Docker容器监控实践
5 |
6 | 在[数据采集](../philosophy/data-collect.md)一节中我们介绍了常见的监控数据源。open-falcon作为一个监控框架,可以去采集任何系统的监控指标数据,只要将监控数据组织为open-falcon规范的格式就OK了。
7 |
8 | docker container的数据采集可以通过[micadvisor_open](https://github.com/open-falcon/micadvisor_open)来做。
9 |
10 | ## 工作原理
11 |
12 | micadvisor-open是基于open-falcon的docker容器资源监控插件,监控容器的cpu、内存、diskio以及网络io等,数据采集后上报到open-falcon
13 |
14 | ## 采集的指标
15 |
16 | | Counters | Notes|
17 | |-----|------|
18 | |cpu.busy|cpu使用情况百分比|
19 | |cpu.user|用户态使用的CPU百分比|
20 | |cpu.system|内核态使用的CPU百分比|
21 | |cpu.core.busy|每个cpu的使用情况|
22 | |mem.memused.percent|内存使用百分比|
23 | |mem.memused|内存使用原值|
24 | |mem.memtotal|内存总量|
25 | |mem.memused.hot|内存热使用情况|
26 | |disk.io.read_bytes|磁盘io读字节数|
27 | |disk.io.write_bytes|磁盘io写字节数|
28 | |net.if.in.bytes|网络io流入字节数|
29 | |net.if.in.packets|网络io流入包数|
30 | |net.if.in.errors|网络io流入出错数|
31 | |net.if.in.dropped|网络io流入丢弃数|
32 | |net.if.out.bytes|网络io流出字节数|
33 | |net.if.out.packets|网络io流出包数|
34 | |net.if.out.errors|网络io流出出错数|
35 | |net.if.out.dropped|网络io流出丢弃数|
36 |
37 | ## Contributors
38 | - mengzhuo: QQ:296142139; MAIL:mengzhuo@xiaomi.com
39 |
40 | ## 补充
41 | - 另外一个docker metric采集的lib库:https://github.com/projecteru/eru-metric
42 |
43 |
--------------------------------------------------------------------------------
/zh_0_2/usage/du-proc.md:
--------------------------------------------------------------------------------
1 |
2 |
3 |
4 | # 目录监控和进程详情监控实践
5 |
6 | 目录大小和进程详情的数据采集可用脚本[falcon-scripts](https://github.com/ZoneTong/falcon-scripts)来做。
7 |
8 | 收集的指标如下:
9 |
10 | | 指标名 | 注释 |
11 | |--------|------|
12 | |du.bytes.used|目录大小,单位byte|
13 | |proc.cpu|进程所占cpu,百分比|
14 | |proc.mem|进程所占内存,单位byte|
15 | |proc.io.in|进程io输入,单位byte|
16 | |proc.io.out|进程io输出,单位byte|
17 |
18 | ## 工作原理
19 |
20 | du.sh脚本借助du命令采集数据
21 |
22 | proc.sh脚本分析/proc/$PID/status /proc/$PID/io等数据
23 |
--------------------------------------------------------------------------------
/zh_0_2/usage/esxi.md:
--------------------------------------------------------------------------------
1 |
2 |
3 | # ESXi监控
4 |
5 | VMware的主体机器(host machine)是运行ESXi作业系统。没有办法安装Open-Falcon agent来监控,所以不能用普通的方式来做监控。
6 |
7 | ESXi作业系统设备的运行指标的采集,可以透过写脚本,通过SNMP协议来采集交换机的各项运行指标,包括内存占用、CPU使用、流量、磁盘用量等。[esxicollector](https://github.com/humorless/esxicollector)就是這樣子的腳本。
8 |
9 | ## 工作原理
10 |
11 | esxicollector是一系列整理过的脚本。由[humorless](https://github.com/humorless/)设计开发。
12 |
13 | esxicollector需要透过cronjob来配置。在一台可以跑cronjob的机器上,配置好cronjob。并且在esxi_collector.sh这个脚本中,写清楚要监控的设备、用来接受监控结果的Open-Falcon agent的位址。esxicollector就会照cronjob的时间间隔,预设是每分钟一次,定期地去采集ESXi作业系统设备的监控项,并透过上报到Open-Falcon的agent。
14 |
15 | 采集的metric列表:
16 |
17 | * CPU利用率
18 |
19 | `esxi.cpu.core`
20 |
21 | * 内存總量/利用率
22 |
23 | `esxi.cpu.memory.kliobytes.size`
24 | `esxi.cpu.memory.kliobytes.used`
25 | `esxi.cpu.memory.kliobytes.avail`
26 |
27 | * 运行的进程数
28 |
29 | `esxi.current.process`
30 |
31 | * 登入的使用者数
32 |
33 | `esxi.current.user`
34 |
35 | * 虚拟机器数
36 |
37 | `esxi.current.vhost`
38 |
39 | * 磁盤總量/利用率
40 |
41 | `esxi.df.size.kilobytes`
42 | `esxi.df.used.percentage`
43 |
44 | * 磁盤錯誤
45 |
46 | `esxi.disk.allocationfailure`
47 |
48 | * 網卡的輸出入流量/封包數
49 |
50 | `esxi.net.in.octets`
51 | `esxi.net.in.ucast.pkts`
52 | `esxi.net.in.multicast.pkts`
53 | `esxi.net.in.broadcast.pkts`
54 | `esxi.net.out.octets`
55 | `esxi.net.out.ucast.pkts`
56 | `esxi.net.out.multicast.pkts`
57 | `esxi.net.out.broadcast.pkts`
58 |
59 |
60 | ## 安装
61 |
62 | 从[这里](https://github.com/humorless/esxicollector)下载。
63 |
64 | 1. 安装SNMP指令
65 |
66 | `yum -y install net-snmp net-snmp-utils`
67 |
68 | 2. 下载VMware ESXi MIB档案,并且复制它们到资料夹`/usr/share/snmp/mibs`
69 |
70 | 3. 设置SNMP的环境
71 |
72 | `mkdir ~/.snmp`
73 | `echo "mibs +ALL" > ~/.snmp/snmp.conf`
74 |
75 | 4. 在`esxi_collector.sh`填入合适的参数
76 |
77 | 5. 设置cronjobs
78 |
79 | ` * * * * * esxi_collector.sh `
80 |
81 |
82 | ## 延伸开发新的监控项
83 |
84 | 脚本 ```snmp_queries.sh``` 会呼叫基本的snmp指令,并且输出snmp执行完的结果。可以透过比较执行 ```60_esxi_*.sh```的结果,来设计新的脚本。
85 |
--------------------------------------------------------------------------------
/zh_0_2/usage/fault-recovery.md:
--------------------------------------------------------------------------------
1 |
2 |
3 | # 对接蓝鲸-故障自愈平台
4 |
5 | 蓝鲸故障自愈,是腾讯蓝鲸推出的一款SaaS服务,目前可以支持和open-falcon无缝对接了,通过接入蓝鲸故障自愈系统,可以帮助使用open-falcon的用户,做到告警无人值守。
6 |
7 | - 具体的配置非常简单: [open-falcon接入蓝鲸](https://docs.bk.tencent.com/product_white_paper/fta/Getting_Started/Integrated_Openfalcon.html)
8 | - 腾讯蓝鲸故障自愈的使用案例参考:[蓝鲸故障自愈案例](https://docs.bk.tencent.com/product_white_paper/fta/Community_users_cases/Community_users_share_cases.html)
9 | - [那些年我们想做的无人值守](https://mp.weixin.qq.com/s/MX74-vDEOkFA0Om6WDrwYQ)
10 |
--------------------------------------------------------------------------------
/zh_0_2/usage/flume.md:
--------------------------------------------------------------------------------
1 |
2 |
3 | # Flume监控
4 |
5 | 在[数据采集](../philosophy/data-collect.md)一节中我们介绍了常见的监控数据源。open-falcon作为一个监控框架,可以去采集任何系统的监控指标数据,只要将监控数据组织为open-falcon规范的格式就OK了。
6 |
7 | Flume的数据采集可以通过脚本[flume-monitor](https://github.com/mdh67899/openfalcon-monitor-scripts/tree/master/flume)来做。
8 |
9 | ## 工作原理
10 | ```flume-monitor.py```是一个采集脚本,只需要放到falcon-agent的plugin目录,在portal中将对应的plugin绑定到主机组,falcon-agent会主动执行```flume-monitor.py```脚本,```flume-monitor.py```脚本执行结束后会输出json格式数据,由falcon-agent读取和解析数据
11 |
12 | Flume运行时需要在配置文件中加入java环境变量,启动成功之后flume进程会监听一个端口,可以通过http请求的方式来抓取flume提供的metrics,```flume-monitor.py```脚本中配置了需要抓取的Flume组件metric,通过http的方式从flume端口中抓取需要的组件信息,输出json格式数据
13 |
14 | 比如我们在单台机器上部署了3个flume实例,可以在将脚本复制三份,改一下脚本中的```http url```地址,与flume监听的http端口一一对应,在portal中绑定好插件即可
15 |
--------------------------------------------------------------------------------
/zh_0_2/usage/func.md:
--------------------------------------------------------------------------------
1 |
2 |
3 | # 报警函数说明
4 |
5 | 配置报警策略的时候open-falcon支持多种报警触发函数,比如`all(#3)` `diff(#10)`等等。
6 | 这些#后面的数字表示的是最新的历史点,比如`#3`代表的是最新的三个点。该数字默认不能大于`10`,大于`10`将当作`10`处理,即只计算最新`10`个点的值。
7 |
8 | 说明:`#`后面的数字的最大值,即在 judge 内存中保留最近几个点,是支持自定义的,具体参考 book 中[描述](http://book.open-falcon.com/zh_0_2/distributed_install/judge.html) ; 源码位置 => [cfg.example.json](https://github.com/open-falcon/falcon-plus/blob/master/modules/judge/cfg.example.json#L4:6)
9 |
10 | ```bash
11 | all(#3): 最新的3个点都满足阈值条件则报警
12 | max(#3): 对于最新的3个点,其最大值满足阈值条件则报警
13 | min(#3): 对于最新的3个点,其最小值满足阈值条件则报警
14 | sum(#3): 对于最新的3个点,其和满足阈值条件则报警
15 | avg(#3): 对于最新的3个点,其平均值满足阈值条件则报警
16 | diff(#3): 拿最新push上来的点(被减数),与历史最新的3个点(3个减数)相减,得到3个差,只要有一个差满足阈值条件则报警
17 | pdiff(#3): 拿最新push上来的点,与历史最新的3个点相减,得到3个差,再将3个差值分别除以减数,得到3个商值,只要有一个商值满足阈值则报警
18 | lookup(#2,3): 最新的3个点中有2个满足条件则报警;
19 | stddev(#7) = 3:离群点检测函数,取最新 **7** 个点的数据分别计算得到他们的标准差和均值,分别计为 σ 和 μ,其中当前值计为 X,那么当 X 落在区间 [μ-3σ, μ+3σ] 之外时,则认为当前值波动过大,触发报警;更多请参考3-sigma算法:https://en.wikipedia.org/wiki/68%E2%80%9395%E2%80%9399.7_rule。
20 |
21 | ```
22 |
23 | 最常用的就是`all`函数了,比如cpu.idle `all(#3) < 5`,表示cpu.idle的值连续3次小于5%则报警。
24 |
25 | `lookup`为非连续性报警函数,适用于在一定范围内容忍监控指标抖动的场景,比如某个主机的cpu.busy忽高忽低,使用`all(#1)>80`明显过于严格,会产生大量报警干扰视线,使用`all(#3)>80`则连续三次偏高的概率很小,可能永远不会触发报警,不能帮助我们发现系统的不稳定,那么如果使用`lookup(#3,5)`,我们就可以知道cpu.busy最近抖动频繁,超过了我们容忍的界线。
26 |
27 | 新增 `stddev` 函数,基于高斯分布的离群点检测方式,比如cpu.idle `stddev(#5) = 3` ,表示获取cpu.idle的历史5个点数据,计算得到他们的标准差和均值,分别计为 σ 和 μ,看其是否分布在`(μ-3σ,μ+3σ)`范围之内,如果不在范围之内则报警。具体参考wiki中[描述](https://zh.wikipedia.org/wiki/%E6%AD%A3%E6%80%81%E5%88%86%E5%B8%83)
28 |
29 | diff和pdiff理解起来没那么容易,设计diff和pdiff是为了解决流量突增突降报警。实在看不懂,那只能去读代码了:https://github.com/open-falcon/judge/blob/master/store/func.go
30 |
31 |
32 |
33 |
34 |
--------------------------------------------------------------------------------
/zh_0_2/usage/haproxy.md:
--------------------------------------------------------------------------------
1 |
2 |
3 | #HAProxy 监控
4 |
5 | 在[数据采集](../philosophy/data-collect.md)一节中我们介绍了常见的监控数据源。open-falcon作为一个监控框架,可以去采集任何系统的监控指标数据,只要将监控数据组织为open-falcon规范的格式就OK了。
6 |
7 | HAProxy的数据采集可以通过[haproxymon](https://github.com/iask/haproxymon)来做。
8 |
9 | ## 工作原理
10 |
11 | haproxymon是一个cron,每分钟跑一次采集脚本```haproxymon.py```,haproxymon通过Haproxy的stats socket接口来采集Haproxy基础状态信息,比如qcur、scur、rate等,然后组装为open-falcon规定的格式的数据,post给本机的falcon-agent。falcon-agent提供了一个http接口,使用方法可以参考[数据采集](../philosophy/data-collect.md)中的例子。
--------------------------------------------------------------------------------
/zh_0_2/usage/jmx.md:
--------------------------------------------------------------------------------
1 |
2 |
3 | # jmxmon 简介
4 | jmxmon是一个基于open-falcon的jmx监控插件,通过这个插件,结合open-falcon agent,可以采集任何开启了JMX服务端口的java进程的服务状态,并将采集信息自动上报给open-falcon服务端
5 |
6 | ## 主要功能
7 |
8 | 通过jmx采集java进程的jvm信息,包括gc耗时、gc次数、gc吞吐、老年代使用率、新生代晋升大小、活跃线程数等信息。
9 |
10 | 对应用程序代码无侵入,几乎不占用系统资源。
11 |
12 |
13 | ## 采集指标
14 | | Counters | Type | Notes|
15 | |-----|------|------|
16 | | parnew.gc.avg.time | GAUGE | 一分钟内,每次YoungGC(parnew)的平均耗时 |
17 | | concurrentmarksweep.gc.avg.time | GAUGE | 一分钟内,每次CMSGC的平均耗时 |
18 | | parnew.gc.count | GAUGE | 一分钟内,YoungGC(parnew)的总次数 |
19 | | concurrentmarksweep.gc.count | GAUGE | 一分钟内,CMSGC的总次数 |
20 | | gc.throughput | GAUGE | GC的总吞吐率(应用运行时间/进程总运行时间) |
21 | | new.gen.promotion | GAUGE | 一分钟内,新生代的内存晋升总大小 |
22 | | new.gen.avg.promotion | GAUGE | 一分钟内,平均每次YoungGC的新生代内存晋升大小 |
23 | | old.gen.mem.used | GAUGE | 老年代的内存使用量 |
24 | | old.gen.mem.ratio | GAUGE | 老年代的内存使用率 |
25 | | thread.active.count | GAUGE | 当前活跃线程数 |
26 | | thread.peak.count | GAUGE | 峰值线程数 |
27 |
28 | ## 建议设置监控告警项
29 |
30 | 不同应用根据其特点,可以灵活调整触发条件及触发阈值
31 |
32 | | 告警项 | 触发条件 | 备注|
33 | |-----|------|------|
34 | | gc.throughput | all(#3)<98 | gc吞吐率低于98%,影响性能 |
35 | | old.gen.mem.ratio | all(#3)>90 | 老年代内存使用率高于90%,需要调优 |
36 | | thread.active.count | all(#3)>500 | 线程数过多,影响性能 |
37 |
38 |
39 | # 使用帮助
40 | 详细的使用方法常见:[jmxmon](https://github.com/toomanyopenfiles/jmxmon)
41 |
42 |
--------------------------------------------------------------------------------
/zh_0_2/usage/lvs.md:
--------------------------------------------------------------------------------
1 |
2 |
3 | # lvs-metrics 简介
4 | lvs-metrics是一个基于open-falcon的LVS监控插件,通过这个插件,结合open-falcon agent/transfer,可以采集LVS服务状态,并将采集信息自动上报给open-falcon服务端
5 |
6 | ## 主要功能
7 |
8 | 通过google开源的ipvs/netlink库及proc下文件采集lvs的监控信息,包括所有VIP的连接数(活跃/非活跃)/LVS主机的连接数(活跃/非活跃).进出数据包数/字节数.
9 |
10 | 对应用程序代码无侵入,几乎不占用系统资源。
11 |
12 |
13 | ## 采集指标
14 |
15 | | Counters | Type | Notes |
16 | |-----|-----|-----|
17 | | lvs.in.bytes | GUAGE | network in bytes per host |
18 | | lvs.out.bytes | GUAGE | network out bytes per host |
19 | | lvs.in.packets | GUAGE | network in packets per host |
20 | | lvs.out.packets | GUAGE | network out packets per host |
21 | | lvs.total.conns | GUAGE | lvs total connections per vip now |
22 | | lvs.active.conn | GUAGE | lvs active connections per vip now |
23 | | lvs.inact.conn | GUAGE | lvs inactive connections per vip now |
24 | | lvs.realserver.num | GUAGE | lvs live realserver num per vip now |
25 | | lvs.vip.conns | COUNTER | lvs conns counter from service start per vip |
26 | | lvs.vip.inbytes | COUNTER | lvs inbytes counter from service start per vip |
27 | | lvs.vip.outbytes | COUNTER | lvs outpkts counter from service start per vip |
28 | | lvs.vip.inpkts | COUNTER | lvs inpkts counter from service start per vip |
29 | | lvs.vip.outpkts | COUNTER | lvs outpkts counter from service start per vip |
30 |
31 |
32 | # 使用帮助
33 | 详细的使用方法常见:[lvs-metrics](https://github.com/mesos-utility/lvs-metrics)
34 |
35 |
--------------------------------------------------------------------------------
/zh_0_2/usage/memcache.md:
--------------------------------------------------------------------------------
1 |
2 |
3 | # Memcache监控
4 |
5 | 在[数据采集](../philosophy/data-collect.md)一节中我们介绍了常见的监控数据源。open-falcon作为一个监控框架,可以去采集任何系统的监控指标数据,只要将监控数据组织为open-falcon规范的格式就OK了。
6 |
7 | Memcache的数据采集可以通过采集脚本[memcached-monitor](https://github.com/iambocai/falcon-monit-scripts/tree/master/memcached)来做。
8 |
9 | ## 工作原理
10 |
11 | memcached-monitor是一个cron,每分钟跑一次采集脚本```memcached-monitor.py```,脚本可以自动检测Memcached的端口,并连到Memcached实例,采集一些监控指标,比如get_hit_ratio、usage等等,然后组装为open-falcon规定的格式的数据,post给本机的falcon-agent。falcon-agent提供了一个http接口,使用方法可以参考[数据采集](../philosophy/data-collect.md)中的例子。
12 |
13 | 比如,我们有1000台机器都部署了Memcached实例,可以在这1000台机器上分别部署1000个cron,即:与Memcached实例一一对应。
14 |
15 | 需要说明的是,脚本```memcached-monitor.py```通过```ps -ef |grep memcached|grep -v grep |sed -n 's/.* *-p *\([0-9]\{1,5\}\).*/\1/p```来自动发现Memcached端口的。如果Memcached启动时 没有通过 ```-p```参数来指定端口,端口的自动发现将失败,这时需要手动修改脚本、指定端口。
--------------------------------------------------------------------------------
/zh_0_2/usage/mesos.md:
--------------------------------------------------------------------------------
1 |
2 |
3 | # mesos监控
4 |
5 | mesos.py是leancloud开发的open-falcon插件脚本,通过这个插件,结合open-falcon agent/transfer,可以采集mesos相关数据,并将采集信息自动上报给open-falcon服务端
6 |
7 | [https://github.com/leancloud/satori/tree/master/satori-rules/plugin/mesos](https://github.com/leancloud/satori/tree/master/satori-rules/plugin/mesos)
8 |
--------------------------------------------------------------------------------
/zh_0_2/usage/mymon.md:
--------------------------------------------------------------------------------
1 |
2 |
3 | # MySQL监控实践
4 |
5 | 在[数据采集](../philosophy/data-collect.md)一节中我们介绍了常见的监控数据源。open-falcon作为一个监控框架,可以去采集任何系统的监控指标数据,只要将监控数据组织为open-falcon规范的格式就OK了。
6 |
7 | MySQL的数据采集可以通过[mymon](https://github.com/open-falcon/mymon)来做。
8 |
9 | ## 工作原理
10 |
11 | mymon是一个cron,每分钟跑一次,配置文件中配置了数据库连接地址,mymon连到该数据库,采集一些监控指标,比如global status, global variables, slave status等等,然后组装为open-falcon规定的格式的数据,post给本机的falcon-agent。falcon-agent提供了一个http接口,使用方法可以参考[数据采集](../philosophy/data-collect.md)中的例子。
12 |
13 | 比如我们有1000台机器都部署了MySQL实例,可以在这1000台机器上分别部署1000个cron,即:与数据库实例一一对应。
14 |
15 | ## 补充
16 | ***远程监控mysql实例***
17 | 如果希望通过hostA上的mymon、采集hostB上的mysql实例指标,你可以这样做:将hostA上mymon的配置文件中的"endpoint设置为hostB的机器名、同时将[mysql]配置项设置为hostB的mysql实例"。查看mysql指标、对mysql指标加策略时,需要找hostB机器名对应的指标。
18 |
--------------------------------------------------------------------------------
/zh_0_2/usage/ngx_metric.md:
--------------------------------------------------------------------------------
1 |
2 |
3 | # Nginx 监控
4 |
5 | 在[数据采集](../philosophy/data-collect.md)一节中我们介绍了常见的监控数据源。open-falcon作为一个监控框架,可以去采集任何系统的监控指标数据,只要将监控数据组织为open-falcon规范的格式就OK了。
6 |
7 | Nginx的数据采集可以通过[ngx_metric](https://github.com/GuyCheung/falcon-ngx_metric)来做。
8 |
9 | # 工作原理
10 |
11 | ngx_metric是借助lua-nginx-module的`log_by_lua`功能实现nginx请求的实时分析,然后借助`ngx.shared.DICT`存储中间结果。最后通过外部python脚本取出中间结果加以计算、格式化并输出。按falcon格式输出的结果可直接push到falcon agent。
12 |
13 | # 使用帮助
14 |
15 | 详细的使用方法常见:[ngx_metric](https://github.com/GuyCheung/falcon-ngx_metric)
16 |
--------------------------------------------------------------------------------
/zh_0_2/usage/nodata.md:
--------------------------------------------------------------------------------
1 |
2 |
3 | # Nodata配置
4 | 使用Nodata,需要进行两个配置: Nodata配置 和 策略配置。下面,我们以一个例子,讲述如何使用Nodata提供的服务。
5 |
6 | ### 用户需求
7 | 当机器分组`cop.xiaomi_owt.inf_pdl.falcon`下的所有机器,其采集指标 `agent.alive` 上报中断时,通知用户。
8 |
9 | ### Nodata配置
10 | 进入Nodata配置主页,可以看到Nodata配置列表
11 | 
12 |
13 | 点击右上角的添加按钮,添加nodata配置。
14 | 
15 |
16 | 进行完上述配置后,分组`cop.xiaomi_owt.inf_pdl.falcon`下的所有机器,其采集项 `agent.alive`上报中断后,nodata服务就会补发一个取值为 `-1.0`、agent.alive的监控数据给监控系统。
17 |
18 | ### 策略配置
19 | 配置了Nodata后,如果有数据上报中断的情况,Nodata配置中的默认值就会被上报。我们可以针对这个默认值,设置报警;只要收到了默认值,就认为发生了数据上报的中断(如果你设置的默认值,可能与正常上报的数据相等,那么请修改你的Nodata配置、使默认值有别于正常值)。将此策略,绑定到分组`cop.xiaomi_owt.inf_pdl.falcon`即可。
20 |
21 | 
22 |
23 | ### 注意事项
24 | 1. 配置名称name,要全局唯一。这是为了方便Nodata配置的管理。
25 | 2. 监控实例endpoint, 可以是机器分组、机器名或者其他 这三种类型,只能选择其中的一种。同一类型,支持多个记录,但建议不超过5个,多条记录换行分割、每行一条记录。选择机器分组时,系统会帮忙展开成具体机器名,支持动态生效。监控实体不是机器名时,只能选择“其他”类型。
26 | 3. 监控指标metric。
27 | 4. 数据标签tags,多个tag要用逗号隔开。必须填写完整的tags串,因为nodata会按照此tags串,去完全匹配、筛选监控数指标项。
28 | 5. 数据类型type,只支持原始值类型GAUGE。因为,nodata只应该监控 "特征指标"(如agent.alive),"特征指标"都是GAUGE类型的。
29 | 6. 采集周期step,单位是秒。必须填写 完整&真实step。该字段不完整 或者 不真实,将会导致nodata监控的误报、漏报。
30 | 7. 补发值default,必须有别于上报的真实数据。比如,`cpu.idle`的取值范围是[0,100],那么它的nodata默认取值 只能取小于0或者大于100的值。否则,会发生误报、漏报。
31 |
--------------------------------------------------------------------------------
/zh_0_2/usage/prometheus-exporter.md:
--------------------------------------------------------------------------------
1 |
2 |
3 | prometheus作为优秀的开源监控产品,本身不仅完整的指标体系,还拥有丰富的指标采集解决方案。通过各种exporter可以覆盖中间件,操作系统,开发语言等等方面的监控指标采集
4 |
5 | **对于在使用 [open-falcon](https://github.com/open-falcon/falcon-plus) 的用户,你也可以通过 [prometheus-exporter-collector](https://github.com/n9e/prometheus-exporter-collector) 将收集到的数据发送给 open-falcon。**
6 |
7 | ```
8 | ./prometheus-exporter-collector -h
9 | Usage: ./prometheus-exporter-collector [-h] [-b backend] [-s step]
10 |
11 | Options:
12 | -b string
13 | send metrics to backend: n9e, falcon (default "n9e")
14 | -h help
15 | -s int
16 | set default step of falcon metrics (default 60)
17 | ```
18 | - `-b falcon`: 以 open-falcon 作为数据接收方
19 | - `-s 60`: metric 的 step 设置为60s
20 |
21 | **下面是一个具体的例子**:通过 prometheus-exporter-collector, 获取 redis-exporter 的metrics,并发送给 open-falcon。
22 |
23 | ### 1. 下载和编译 redis_exporter
24 |
25 | ```
26 | git clone https://github.com/oliver006/redis_exporter.git
27 | cd redis_exporter
28 | go build .
29 | ./redis_exporter --version
30 | ./redis_exporter -redis.addr redis://127.0.0.1:6379
31 |
32 | //注意,请先确保 redis 已成功运行在127.0.0.1:6379 上。
33 | ```
34 |
35 | 这样,就可以看到 redis_exporter 已经成功运行,并监听在 `:9121/metrics` 。
36 |
37 | ### 2. 运行 prometheus-exporter-collector 并发送数据给 open-falcon
38 | - 检查prometheus-exporter-collector的配置文件,确保 `exporter_urls` 设置为 `http://127.0.0.1:9121/metrics`
39 |
40 | ```
41 | $ cat plugin.test.json
42 |
43 | {
44 | "exporter_urls": [
45 | "http://127.0.0.1:9121/metrics"
46 | ],
47 | "append_tags": ["region=bj", "dept=cloud"],
48 | "endpoint": "127.0.0.100",
49 | "ignore_metrics_prefix": ["go_"],
50 | "metric_prefix": "",
51 | "metric_type": {},
52 | "default_mapping_metric_type": "COUNTER",
53 | "timeout": 500
54 | }
55 | ```
56 |
57 | - 运行prometheus-exporter-collector,将输出发送给本机的 falcon-agent
58 |
59 | ```
60 | cat plugin.test.json | ./prometheus-exporter-collector -b falcon -s 60 | curl -X POST -d @- http://127.0.0.1:1988/v1/push
61 | ```
62 |
--------------------------------------------------------------------------------
/zh_0_2/usage/query.md:
--------------------------------------------------------------------------------
1 |
2 |
3 | # 历史数据查询
4 |
5 | 任何push到open-falcon中的数据,事后都可以通过api组件提供的restAPI,来查询得到。
6 |
7 | 具体请参考[API文档](http://open-falcon.com/falcon-plus/#/graph_histroy)
8 |
--------------------------------------------------------------------------------
/zh_0_2/usage/rabbitmq.md:
--------------------------------------------------------------------------------
1 |
2 |
3 | # RMQ监控
4 |
5 | 在[数据采集](../philosophy/data-collect.md)一节中我们介绍了常见的监控数据源。open-falcon作为一个监控框架,可以去采集任何系统的监控指标数据,只要将监控数据组织为open-falcon规范的格式就OK了。
6 |
7 | RMQ的数据采集可以通过脚本[rabbitmq-monitor](https://github.com/iambocai/falcon-monit-scripts/tree/master/rabbitmq)来做。
8 |
9 | ## 工作原理
10 |
11 | rabbitmq-monitor是一个cron,每分钟跑一次脚本```rabbitmq-monitor.py```,其中配置了RMQ的用户名&密码等,脚本连到该RMQ实例,采集一些监控指标,比如messages_ready、messages_total、deliver_rate、publish_rate等等,然后组装为open-falcon规定的格式的数据,post给本机的falcon-agent。falcon-agent提供了一个http接口,使用方法可以参考[数据采集](../philosophy/data-collect.md)中的例子。
12 |
13 | 比如我们部署了5个RMQ实例,可以在 每个RMQ实例机器上运行一个cron,即:与RMQ实例一一对应。
14 |
15 |
16 | # 可选方案
17 |
18 | 这是另外一个rabbitmq的监控插件,请参考 [rmqmonitor](https://github.com/barryz/rmqmonitor), [issue](https://github.com/open-falcon/falcon-plus/issues/443)
19 |
--------------------------------------------------------------------------------
/zh_0_2/usage/redis.md:
--------------------------------------------------------------------------------
1 |
2 |
3 | # Redis监控
4 |
5 | 在[数据采集](../philosophy/data-collect.md)一节中我们介绍了常见的监控数据源。open-falcon作为一个监控框架,可以去采集任何系统的监控指标数据,只要将监控数据组织为open-falcon规范的格式就OK了。
6 |
7 | Redis的数据采集可以通过采集脚本[redis-monitor](https://github.com/iambocai/falcon-monit-scripts/tree/master/redis) 或者 [redismon](https://github.com/ZhuoRoger/redismon)来做。
8 |
9 | ## 工作原理
10 |
11 | redis-monitor是一个cron,每分钟跑一次采集脚本```redis-monitor.py```,其中配置了redis服务的地址,redis-monitor连到redis实例,采集一些监控指标,比如connected_clients、used_memory等等,然后组装为open-falcon规定的格式的数据,post给本机的falcon-agent。falcon-agent提供了一个http接口,使用方法可以参考[数据采集](../philosophy/data-collect.md)中的例子。
12 |
13 | 比如,我们有1000台机器都部署了Redis实例,可以在这1000台机器上分别部署1000个cron,即:与Redis实例一一对应。
14 |
--------------------------------------------------------------------------------
/zh_0_2/usage/solr.md:
--------------------------------------------------------------------------------
1 |
2 |
3 | # Solr监控
4 |
5 | 在[数据采集](../philosophy/data-collect.md)一节中我们介绍了常见的监控数据源。open-falcon作为一个监控框架,可以去采集任何系统的监控指标数据,只要将监控数据组织为open-falcon规范的格式就OK了。
6 |
7 | Solr的数据采集可以通过脚本[solr_monitor](https://github.com/shanshouchen/falcon-scripts/tree/master/solr-monitor)来做。
8 |
9 | ## 工作原理
10 |
11 | solr_monitor是一个cron,每分钟跑一次脚本```solr_monitor.py```,主要采集一些solr实例内存信息和缓存命中信息等等,然后组装为open-falcon规定的格式的数据,post给本机的falcon-agent。
12 |
13 | 脚本可以部署到Solr的各个实例,每个实例上运行一个cron,定时执行数据收集,即:与Solr实例一一对应
14 |
15 | 如果一台服务器存在多个Solr实例,可以通过修改```solr_monitor.py```中的```servers```属性,增加Solr实例的地址完成本地一对多的数据收集
16 |
--------------------------------------------------------------------------------
/zh_0_2/usage/urlooker.md:
--------------------------------------------------------------------------------
1 | ## [urlooker](https://github.com/710leo/urlooker)
2 | 监控web服务可用性及访问质量,采用go语言编写,易于安装和二次开发
3 |
4 | ## Feature
5 | - 返回状态码检测
6 | - 页面响应时间检测
7 | - 页面关键词匹配检测
8 | - 自定义Header
9 | - GET、POST、PUT访问
10 | - 自定义POST BODY
11 | - 检测结果支持推送 open-falcon
12 |
13 | ## Architecture
14 | 
15 |
16 | ## ScreenShot
17 |
18 | 
19 | 
20 |
21 |
22 | ## 常见问题
23 | - [wiki手册](https://github.com/710leo/urlooker/wiki)
24 | - [常见问题](https://github.com/710leo/urlooker/wiki/FAQ)
25 | - 初始用户名密码:admin/password
26 |
27 | ## Install
28 | #### docker 安装
29 |
30 | ```bash
31 | git clone https://github.com/710leo/urlooker.git
32 | cd urlooker
33 | docker build .
34 | docker volume create urlooker-vol
35 | # [CONTAINER ID] 在实际操作中需要替换为实际的镜像的ID
36 | docker run -p 1984:1984 -d --name urlooker --mount source=urlooker-vol,target=/var/lib/mysql --restart=always [CONTAINER ID]
37 | ```
38 |
39 | #### 源码安装
40 |
41 | ```bash
42 | # 安装mysql
43 | yum install -y mysql-server
44 | wget https://raw.githubusercontent.com/710leo/urlooker/master/sql/schema.sql
45 | mysql -h 127.0.0.1 -u root -p < schema.sql
46 |
47 | # 安装组件
48 | curl https://raw.githubusercontent.com/710leo/urlooker/master/install.sh|bash
49 | cd $GOPATH/src/github.com/710leo/urlooker
50 |
51 | # 将[mysql root password]替换为mysql root 数据库密码
52 | sed -i 's/urlooker.pass/[mysql root password]/g' configs/web.yml
53 |
54 | ./control start all
55 | ```
56 |
57 | 打开浏览器访问 http://127.0.0.1:1984 即可
58 |
59 | ## 答疑
60 | QQ群:556988374
--------------------------------------------------------------------------------
/zh_0_2/usage/win.md:
--------------------------------------------------------------------------------
1 |
2 |
3 | # 监控Windows平台
4 |
5 | 在[数据采集](../philosophy/data-collect.md)一节中我们介绍了常见的监控数据源。open-falcon作为一个监控框架,可以去采集任何系统的监控指标数据,只要将监控数据组织为open-falcon规范的格式就OK了。
6 |
7 | Windows主机的运行指标的采集,可以写Python脚本,通过windows的计划任务来每分钟执行采集各项运行指标,包括内存占用、CPU使用、磁盘使用量、网卡流量等。
8 |
9 | 可以直接使用以下 window 监控程序进行 windows 主机的监控指标采集。
10 |
11 | - [windows_collect](https://github.com/freedomkk-qfeng/falcon-scripts/tree/master/windows_collect):python脚本
12 | - [windows-agent](https://github.com/LeonZYang/agent): go 语言实现的 agent
13 | - [Windows-Agent](https://github.com/AutohomeRadar/Windows-Agent):汽车之家开源的作为Windows Service运行的Agent,python实现。
14 | - [windows-agent](https://github.com/freedomkk-qfeng/windows-agent):另一个 go 语言实现的 windows-agent。支持端口,进程监控,支持后台服务运行。
15 |
16 |
--------------------------------------------------------------------------------