\n\n" 140 | html = "
\n \n\n"
141 | for r in range(self.rows - 1, -1, -1):
142 | for c in range(self.cols):
143 | marker = self.get_marker(c, r)
144 | color, style, background = self.get_colors(c, r)
145 | marker = " " if marker == ut.space else marker
146 | marker = '' + marker + '' if style == 'bold' else marker
147 | marker = '' + marker + '' if style == 'italic' else marker
148 | color = 'black' if color == ut.no_color else color
149 | background = 'white' if background == ut.no_color else background
150 | color = ut.to_rgb(color)
151 | background = ut.to_rgb(background)
152 | color = code(color)
153 | background = code(background)
154 | html += "" + marker + ""
155 | html += "
\n\n"
156 | html += " \n "
157 | return html
158 |
159 | def join_matrices(matrices): # from a matrix of matrix_class() objects to a single matrix
160 | cols, rows = ut.matrix_size(matrices)
161 | M = matrix_class()
162 | for r in range(rows):
163 | m_rows = matrices[r][0].rows
164 | m = matrix_class()
165 | m.set_size(0, m_rows)
166 | m.set_matrices()
167 | for c in range(cols):
168 | m.hstack(matrices[r][c])
169 | M.vstack(m)
170 | return M
171 |
172 |
--------------------------------------------------------------------------------
/plotext/_shtab.py:
--------------------------------------------------------------------------------
1 | # added by user @Freed-Wu as a replacement for package shtab if not present and in particular its method add_argument_to
2 |
3 | FILE = None
4 | DIRECTORY = DIR = None
5 |
6 | def add_argument_to(parser, *args, **kwargs):
7 | from argparse import Action
8 | Action.complete = None
9 | return parser
10 |
--------------------------------------------------------------------------------
/plotext/plotext_cli.py:
--------------------------------------------------------------------------------
1 | #!/usr/bin/env python
2 | from plotext._utility import all_markers, colors
3 | import argparse, sys, os
4 | import plotext as plt
5 | try:
6 | import shtab
7 | except ImportError:
8 | from . import _shtab as shtab
9 |
10 | # For Possible Colors and Markers Completion
11 | def dict_to_complete(d={}):
12 | return {'zsh': '((' + ' '.join(map(lambda x: str(x[0]) + '\\:' + x[1], d.items())) + '))'}
13 |
14 | def list_to_complete(data):
15 | return {'zsh': '((' + ' '.join([el + '\\:' for el in data]) + '))'}
16 |
17 |
18 | def build_parser():
19 |
20 | examples = """Access each function documentation for further guidance, eg: plotext scatter -h"""
21 |
22 | parser = argparse.ArgumentParser(
23 | prog = "plotext",
24 | description = "plotting directly on terminal",
25 | epilog = examples,
26 | formatter_class = argparse.RawDescriptionHelpFormatter)
27 | shtab.add_argument_to(parser, ["-s", "--print-completion"])
28 |
29 | parser.set_defaults(type = "scatter")
30 |
31 | path_parser = argparse.ArgumentParser(add_help = False)
32 |
33 | path_parser.add_argument("-p", "--path",
34 | action = 'store',
35 | #dest = 'path',
36 | type = str,
37 | metavar = "FILE",
38 | help = "file path of the data table; if not used it will read from stdin. Use 'test' to automatically download, in your user folder, some test data/image/gif or video, depending on the function used; the file will be removed after the plot",
39 | ).complete = shtab.FILE
40 | path_parser.add_argument("-r", "--first-row",
41 | action = "store",
42 | type = int,
43 | default = 0,
44 | metavar = "FIRST-ROW",
45 | help = "The first line to consider in the data file (counting from 0).")
46 |
47 | common_parser = argparse.ArgumentParser(add_help = False)
48 |
49 | common_parser.add_argument("-clt", "--clear_terminal",
50 | nargs = 1,
51 | type = str,
52 | default = ["False"],
53 | choices = ["True", "False"],
54 | metavar = "BOOL",
55 | help = "it clears the terminal before plotting, if True (as by default)")
56 |
57 | common_parser.add_argument("-s", "--sleep",
58 | nargs = 1,
59 | type = float,
60 | default = [0],
61 | help = "it adds a sleeping time after plotting, to reduce flickering when multiple plots are required; 0 by default")
62 |
63 | data_parser = argparse.ArgumentParser(add_help = False)
64 |
65 | data_parser.add_argument("-xcol", "--xcolumn",
66 | nargs = "+", # 1 or more
67 | type = str,
68 | default = ["none"],
69 | help = "the column number (starting from 1), in the data table, that will be used as x data; by default 'none'")
70 |
71 | data_parser.add_argument("-ycols", "--ycolumns",
72 | nargs = "+", # 1 or more
73 | type = str,
74 | default = ["all"],
75 | help = "the column numbers (starting from 1), in the data table, that will be used as y data; by default 'all'")
76 |
77 | data_parser.add_argument("-d", "--delimiter",
78 | type = str,
79 | default = [' '],
80 | nargs = 1,
81 | help = "character to be used to separate columns in the data table (eg: ;); by default the white space ' '")
82 |
83 | data_parser.add_argument("-l", "--lines",
84 | nargs = "+", # 1 or more
85 | type = int,
86 | default = [1000],
87 | help = "number of lines, from data table, to be plotted at each iteration; 1000 by default; data shorter then this will be plotted in a single iteration")
88 |
89 | options_parser = argparse.ArgumentParser(add_help = False)
90 |
91 | options_parser.add_argument("-m", "--marker",
92 | type = str,
93 | default = ['hd'],
94 | nargs = 1,
95 | choices = all_markers.keys(),
96 | metavar = "marker",
97 | help = "character or marker code identifying the data points in the plot, eg: x, braille, sd, heart, fhd; by default hd",
98 | ).complete = dict_to_complete(all_markers)
99 |
100 | options_parser.add_argument("-c", "--color",
101 | type = str,
102 | default = [None],
103 | nargs = 1,
104 | choices = colors,
105 | metavar = "COLOR",
106 | help = "color of the data points in the plot, between: " + ",".join(colors) + "; add + at the end of the color (except black and white) for clearer colors, eg: red+"
107 | ).complete = list_to_complete(colors)
108 |
109 | options_parser.add_argument("-t", "--title",
110 | nargs = 1,
111 | type = str,
112 | default = [None],
113 | help = "the plot title")
114 |
115 | options_parser.add_argument("-xl", "--xlabel",
116 | nargs = 1,
117 | type = str,
118 | default = [None],
119 | help = "the label of the x axis")
120 |
121 | options_parser.add_argument("-yl", "--ylabel",
122 | nargs = 1,
123 | type = str,
124 | default = [None],
125 | help = "the label of the y axis")
126 |
127 | options_parser.add_argument("-g", "--grid",
128 | nargs = 1,
129 | type = str,
130 | default = ["False"],
131 | choices = ["True", "False"],
132 | metavar = "BOOL",
133 | help = "it add grid lines if True, or removed them if False (as by default)")
134 |
135 | barhist_parser = argparse.ArgumentParser(add_help = False)
136 |
137 | barhist_parser.add_argument("-o", "--orientation",
138 | nargs = 1,
139 | type = str,
140 | default = ['v'],
141 | choices = ['v', 'h'],
142 | metavar = "ORIENTATION",
143 | help = "bar orientation, v for vertical (as by default), h for horizontal")
144 |
145 | barhist_parser.add_argument("-f", "--fill",
146 | nargs = 1,
147 | type = str,
148 | default = ["True"],
149 | choices = ["True", "False"],
150 | metavar = "BOOL",
151 | help = "it fills the bars with colored markers if True (as by default), otherwise only the bars skeleton is shown")
152 |
153 | subparser = parser.add_subparsers(dest = 'type',
154 | help = 'the user defined plot type')
155 |
156 | scatter = subparser.add_parser('scatter',
157 | description = "plots a series of data points",
158 | parents = [path_parser, data_parser, common_parser, options_parser],
159 | help = 'plots a series of data points',
160 | epilog = "eg: plotext scatter --path test --xcolumn 1 --ycolumns 2 --lines 5000 --title 'Scatter Plot Test' --marker braille")
161 |
162 |
163 | plot = subparser.add_parser('plot',
164 | parents = [path_parser, data_parser, common_parser, options_parser],
165 | description = "plots lines between consecutive data points",
166 | help = 'plots lines between consecutive data points',
167 | epilog = "eg: plotext plot --path test --xcolumn 1 --ycolumns 2 --sleep 0.1 --lines 2500 --clear_terminal True --color magenta+ --title 'Plot Test'")
168 |
169 | plotter = subparser.add_parser('plotter',
170 | parents = [path_parser, data_parser, common_parser, options_parser],
171 | description = 'plots a series of data points and the lines between consecutive ones',
172 | help = 'scatter + plot',
173 | epilog = "eg:plotext plotter --path test --xcolumn 1 --ycolumns 2 --sleep 0.1 --lines 120 --clear_terminal True --marker hd --title 'Plotter Test'")
174 |
175 | bar = subparser.add_parser('bar',
176 | parents = [path_parser, data_parser, common_parser, options_parser, barhist_parser],
177 | description = 'builds a bar plot',
178 | help = 'bar plot',
179 | epilog = "eg: plotext bar --path test --xcolumn 1 --title 'Bar Plot Test' --xlabel Animals --ylabel Count")
180 |
181 | bar.add_argument("-w", "--width",
182 | nargs = 1,
183 | type = float,
184 | default = [None],
185 | help = "bars width as a float between 0 and 1")
186 |
187 | hist = subparser.add_parser('hist',
188 | parents = [path_parser, data_parser, common_parser, options_parser, barhist_parser],
189 | description = 'builds a histogram plot',
190 | help = 'histogram plot',
191 | epilog = "eg: plotext hist --path test --xcolumn 1 --ycolumns 2 --lines 5000 --title 'Histogram Test'")
192 |
193 | hist.add_argument("-b", "--bins",
194 | nargs = 1,
195 | type = int,
196 | default = [10],
197 | help = "histogram bins (10 by default)")
198 |
199 | image = subparser.add_parser('image',
200 | parents = [path_parser, common_parser],
201 | description = 'plots an image from path',
202 | help = 'plots an image from file path',
203 | epilog = "eg: plotext image --path test")
204 |
205 | gif = subparser.add_parser('gif',
206 | parents = [path_parser, common_parser],
207 | description = 'plays a gif image from path',
208 | help = 'plays a gif image from path',
209 | epilog = "eg: plotext gif --path test")
210 |
211 | video = subparser.add_parser('video',
212 | parents = [path_parser, common_parser],
213 | description = 'plays a video from path',
214 | help = 'plays a video from path',
215 | epilog = "eg: plotext video --path test --from_youtube True")
216 |
217 | video.add_argument("-fy", "--from_youtube",
218 | nargs = 1,
219 | type = str,
220 | default = ["False"],
221 | choices = ["True", "False"],
222 | metavar = "BOOL",
223 | help = "set it to True to render the colors correctly for videos downloaded from youtube; default is False")
224 |
225 | youtube = subparser.add_parser('youtube',
226 | description = 'plays a youtube video from url',
227 | help = 'plays a youtube video from url',
228 | epilog = "eg: plotext youtube --url test")
229 |
230 | youtube.add_argument("-u", "--url",
231 | action = 'store',
232 | dest = 'url',
233 | nargs = 1,
234 | type = str,
235 | metavar = "URL",
236 | help = "the url of a youtube video; use 'test' for a test video")
237 |
238 | return parser
239 |
240 |
241 | def main(argv = None):
242 | parser = build_parser()
243 | args = parser.parse_args(argv)
244 |
245 | type = args.type
246 | first_row = 0
247 | if type != "youtube":
248 | path = args.path
249 | first_row = args.first_row
250 | clt = True if args.clear_terminal[-1] == 'True' else False
251 | sleep = args.sleep[0]
252 |
253 | def get_xY(data):
254 | l = len(data)
255 | xcol = args.xcolumn[0]
256 | ycols = args.ycolumns
257 | xcol = "none" if xcol == "none" else int(xcol) if int(xcol) - 1 in range(l) else "none"
258 | all_ycols = [el for el in range(l) if el != xcol]
259 | ycols = all_ycols if ycols == ["all"] else [int(el) for el in ycols if int(el) - 1 in range(l)]
260 | x = list(range(1, len(data[0]) + 1)) if xcol == "none" else data[xcol - 1]
261 | Y = [data[i - 1] for i in ycols]
262 | return x, Y
263 |
264 | def plot(x, Y):
265 | for y in Y:
266 | plt.plot(x, y, marker = marker, color = color) if type in ['plot', 'plotter'] else None
267 | plt.scatter(x, y, marker = marker, color = None if type == 'plotter' else color) if type in ['scatter', 'plotter'] else None
268 | plt.bar(x, y, marker = marker, color = color, width = width, orientation = orientation, fill = fill) if type == 'bar' else None
269 | plt.hist(y, marker = marker, color = color, orientation = orientation, fill = fill, bins = bins) if type == 'hist' else None
270 | plt.clt() if clt else None
271 | plt.show()
272 | plt.cld()
273 | plt.sleep(sleep)
274 |
275 | data_plot = ['scatter', 'plot', 'plotter', 'bar', 'hist']
276 | test_path = 'test'
277 |
278 | if type in data_plot:
279 | lines = args.lines[0]
280 | delimiter = args.delimiter[0]
281 | title = args.title[0]
282 | xlabel = args.xlabel[0]
283 | ylabel = args.ylabel[0]
284 | grid = True if args.grid[-1] == 'True' else False
285 |
286 | orientation = args.orientation[0] if type in ['bar', 'hist'] else 'v'
287 | fill = args.fill[0] == 'True' if type in ['bar', 'hist'] else False
288 | width = args.width[0] if type == 'bar' else 0
289 | bins = args.bins[0] if type in 'hist' else None
290 |
291 | marker = args.marker[0]
292 | color = args.color[0]
293 |
294 | plt.title(title);
295 | plt.xlabel(xlabel)
296 | plt.ylabel(ylabel)
297 | plt.grid(grid)
298 |
299 | if path == test_path:
300 | plt.plotsize(None, plt.th() - 3)
301 | if type != "bar":
302 | plt.download(plt.test_data_url, test_path, log = True)
303 | else:
304 | plt.download(plt.test_bar_data_url, test_path, log = True)
305 | path = test_path
306 |
307 | if path is None:
308 | def plot_text(text):
309 | data = plt._utility.read_lines(text, delimiter = delimiter)
310 | data = plt.transpose(data)
311 | x, Y = get_xY(data)
312 | plot(x, Y)
313 |
314 | for _ in range(first_row):
315 | sys.stdin.readline()
316 | text = []
317 | i = 0
318 | for line in iter(sys.stdin.readline, ''):
319 | text.append(line)
320 | i+=1;
321 | if len(text) == lines:
322 | plot_text(text)
323 | text = []
324 | if len(text) > 0: # this is when there is some residual data to be plotted, not lines long
325 | plot_text(text)
326 | text = []
327 |
328 | else:
329 | data = plt.read_data(path, delimiter = delimiter, first_row = first_row)
330 | data = plt.transpose(data)
331 | x, Y = get_xY(data)
332 | chunks = len(x) // lines + (1 if len(x) % lines else 0)
333 | for c in range(chunks):
334 | xc = x[c * lines: (c + 1) * lines]
335 | Yc = [y[c * lines: (c + 1) * lines] for y in Y]
336 | plot(xc, Yc)
337 |
338 | elif type == 'image':
339 | if path == test_path:
340 | plt.plotsize(None, plt.th() - 3)
341 | plt.download(plt.test_image_url, test_path, log = True)
342 | path = test_path
343 | plt.image_plot(path, fast = True)
344 | plt.clt() if clt else None
345 | plt.show()
346 |
347 | elif type == 'gif':
348 | if path == test_path:
349 | plt.plotsize(None, plt.th() - 3)
350 | plt.download(plt.test_gif_url, test_path, log = True)
351 | path = test_path
352 | plt.play_gif(path)
353 |
354 | elif type == 'video':
355 | if path == test_path:
356 | plt.plotsize(None, plt.th() - 3)
357 | plt.download(plt.test_video_url, test_path, log = True)
358 | path = test_path
359 | from_youtube = True if args.from_youtube[-1] == 'True' else False
360 | plt.play_video(path, from_youtube)
361 |
362 | elif type == 'youtube':
363 | url = args.url[-1]
364 | url = plt.test_youtube_url if url == test_path else url
365 | plt.play_youtube(url)
366 |
367 | if os.path.isfile(test_path):
368 | plt.delete_file(test_path, True)
369 |
370 |
371 | if __name__ == "__main__":
372 | sys.exit(main())
373 |
374 |
375 |
376 |
--------------------------------------------------------------------------------
/readme/aspect.md:
--------------------------------------------------------------------------------
1 | # Plot Aspect
2 |
3 | - [Plot Labels](https://github.com/piccolomo/plotext/blob/master/readme/aspect.md#plot-labels)
4 | - [Plot Lines](https://github.com/piccolomo/plotext/blob/master/readme/aspect.md#plot-lines)
5 | - [Markers](https://github.com/piccolomo/plotext/blob/master/readme/aspect.md#markers)
6 | - [Colors](https://github.com/piccolomo/plotext/blob/master/readme/aspect.md#colors)
7 | - [Styles](https://github.com/piccolomo/plotext/blob/master/readme/aspect.md#styles)
8 | - [Themes](https://github.com/piccolomo/plotext/blob/master/readme/aspect.md#themes)
9 |
10 | [Main Guide](https://github.com/piccolomo/plotext#guide)
11 |
12 | ## Plot Labels
13 |
14 | To add text labels to the plot, use the `label` parameter of the following methods:
15 |
16 | - `title()` to add a **title** on the top of the active plot.
17 |
18 | - `xlabel()` to add the **x axes labels**: its parameter `xside` is used to address a specific `x` axis, `lower` or `upper`, in short `1` or `2`.
19 |
20 | - Analogously `ylabel()` to add the **y axes labels**: its `yside` parameter is used to address a specific `y` axis , `left` or `right`, in short `1` or `2`.
21 |
22 | - The axes labels will all appear at the bottom of the plot, with the exception of the upper `x` axis label, which will appear on the top center of the plot, moving the plot title to the top left, if present.
23 |
24 | - To change the labels colors and styles, use the functions `ticks_colors()` and `ticks_style()`, as explained in [this](https://github.com/piccolomo/plotext/blob/master/readme/aspect.md#colors) and [this section](https://github.com/piccolomo/plotext/blob/master/readme/aspect.md#styles) respectively.
25 |
26 | [Main Guide](https://github.com/piccolomo/plotext#guide), [Plot Aspect](https://github.com/piccolomo/plotext/blob/master/readme/aspect.md#plot-aspect)
27 |
28 | ## Plot Lines
29 |
30 | Here are the main functions used to alter the plot lines:
31 |
32 | - `xaxes(lower, upper)` to set whatever or not to show the x axes; it accepts two Boolean inputs, one for each `x` axis.
33 |
34 | - `yaxes(left, right)` to set whatever or not to show the y axes; it accepts two Boolean inputs, one for each `y` axis.
35 |
36 | - To control all axes simultaneously, use the function `frame()` instead, which will show or remove the **plot frame** (composed of all 4 axes) with a single Boolean.
37 |
38 | - The `grid()` method is used to add or remove the `horizontal` and `vertical` grid lines and requires two Boolean inputs. These lines are anchored to the axes numerical ticks.
39 |
40 | - To add extra lines at some specific coordinates use the functions `vertical_line()` and `horizontal_line()`, as explained in [this section](https://github.com/piccolomo/plotext/blob/master/readme/decorator.md#line-plot).
41 |
42 | [Main Guide](https://github.com/piccolomo/plotext#guide), [Plot Aspect](https://github.com/piccolomo/plotext/blob/master/readme/aspect.md#plot-aspect)
43 |
44 | ## Markers
45 |
46 | To specify which marker to use to plot the data points, use the parameter `marker`, available for most plotting functions; for example: `scatter(data, marker = "x")`.
47 | This parameter accepts the following:
48 |
49 | - A **single character**; if the space character, the plot will be invisible.
50 |
51 | - A **list of specific markers**, one for each data point: its length will automatically adapt to the data set.
52 |
53 | - One of the following **marker codes** which will translate in the marker specified (some may not be available in Windows):
54 | 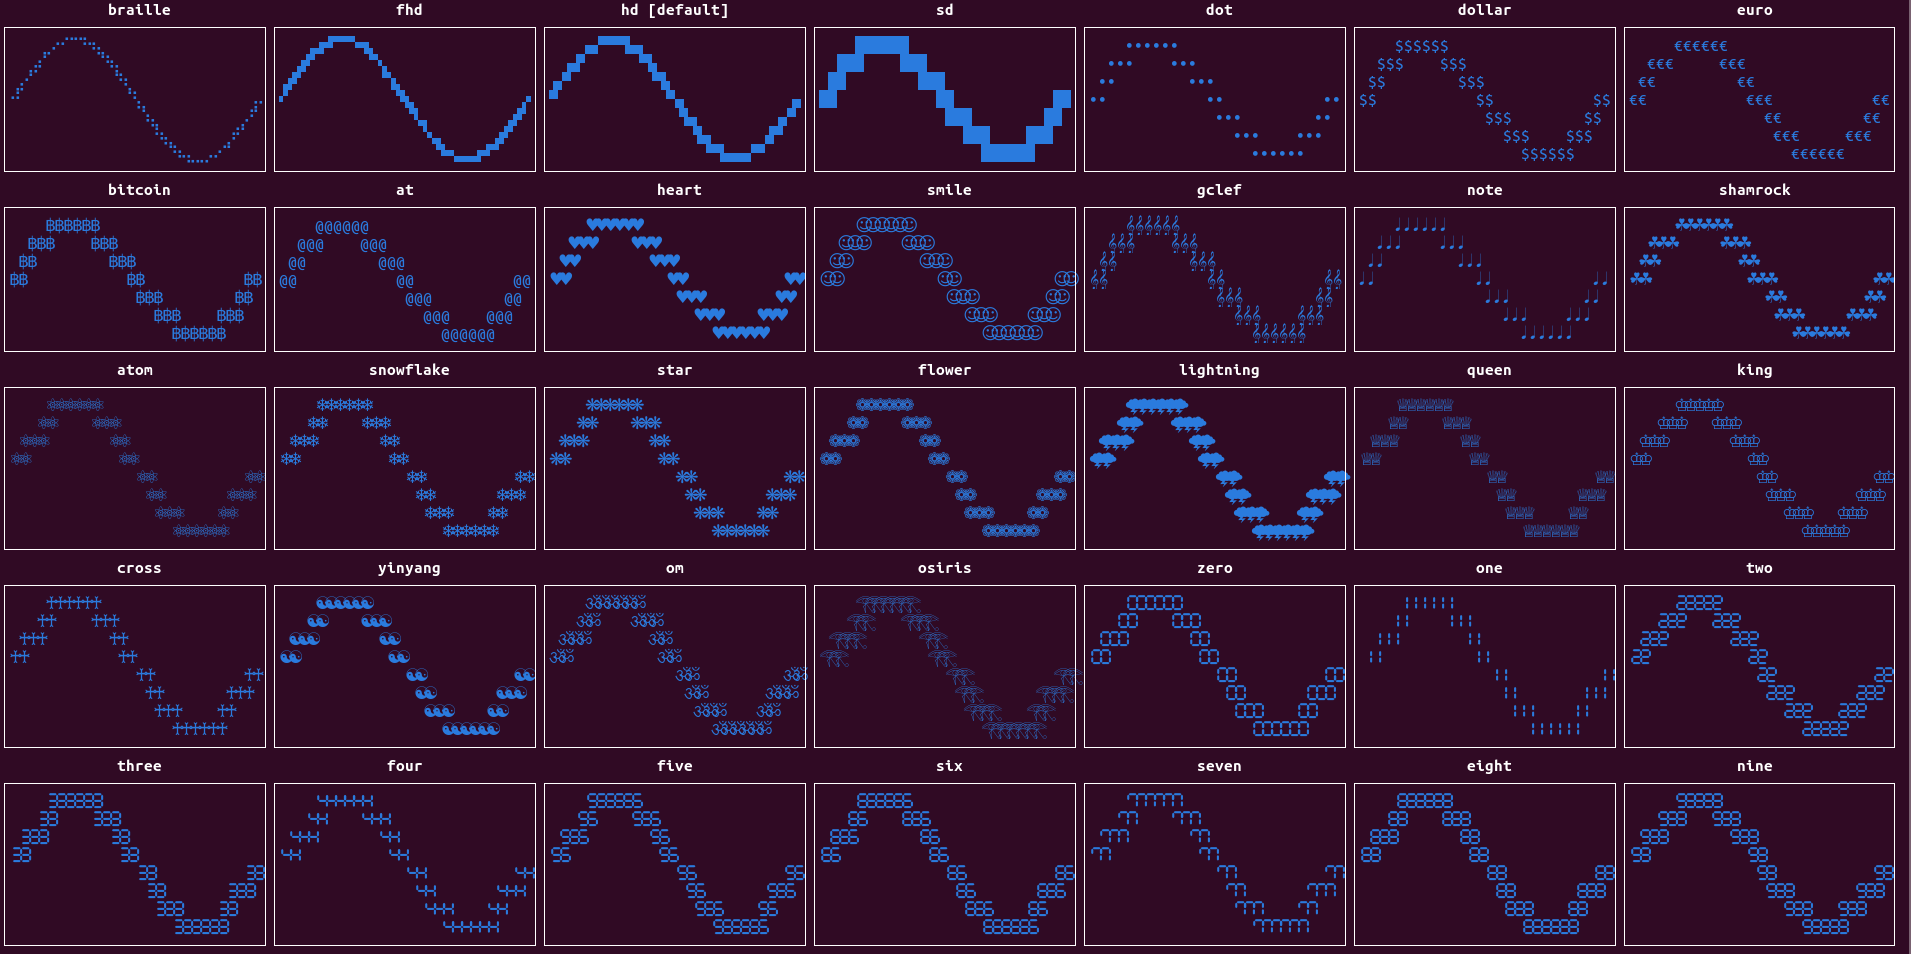
55 |
56 | - `sd` stands for *standard definition*.
57 |
58 | - **`hd`** stands for *high definition* and uses the 2 x 2 Unicode block characters (such as ▞).
59 |
60 | - **`fhd`** stands for *full high definition* and uses the 3 x 2 Unicode block characters (such as 🬗). This marker works only in Unix systems and only in some terminals.
61 |
62 | - **`braille`** uses the 4 x 2 Unicode braille characters (such as ⢕). This marker should works in Unix systems (tested only in few terminals).
63 |
64 | - It is possible to have markers of different resolutions in the same canvas, but it is recommended not to mix them when in the same signal using line plots, while it is safe to mix them with a normal scatter plot.
65 |
66 | - Access the `markers()` method for the available marker codes.
67 |
68 | [Main Guide](https://github.com/piccolomo/plotext#guide), [Plot Aspect](https://github.com/piccolomo/plotext/blob/master/readme/aspect.md#plot-aspect)
69 |
70 | ## Colors
71 |
72 | Colors could be applied to the data markers using the `color` parameter, available to most plotting functions.
73 |
74 | Colors could easily be applied to the rest of the plot, using the `color` parameter of the following methods:
75 |
76 | - `canvas_color()` to set the background color of the plot canvas alone (the area where the data is plotted).
77 |
78 | - `axes_color()` to sets the background color of the axes, axes numerical ticks, axes labels and plot title.
79 |
80 | - `ticks_color()` sets the (full-ground) color of the axes ticks, the grid lines, title, and legend labels, if present.
81 |
82 | Here are the types of color codes that could be provided to the `color` parameter, as well as the `fullground` or `background` parameters of the `colorize()` method, described [here](https://github.com/piccolomo/plotext/blob/master/readme/utilities.md#colored-text):
83 |
84 | - the following **color string codes**, where `default` will use the default terminal color:
85 |
86 | 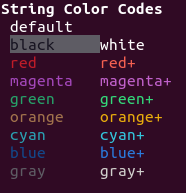
87 |
88 | - An **integer between 0 and 255**, where the first 16 integer color codes produce the same results as the previous string color codes:
89 | 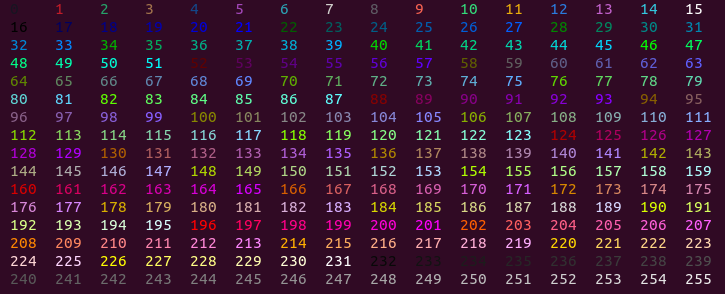
90 |
91 | - An **RGB color** consisting of a tuple of three values (red, green, blue), each between 0 and 255, to obtain the most realistic color rendering.
92 |
93 | - A **list of color codes** to give a different color to each data point marker: each color could be of a different kind (string, integer or rgb) and, if of lower length, the list of colors will adapt to the data set, by repetition.
94 |
95 | - Access the function `colors()` for the available string and integer color codes.
96 |
97 | [Main Guide](https://github.com/piccolomo/plotext#guide), [Plot Aspect](https://github.com/piccolomo/plotext/blob/master/readme/aspect.md#plot-aspect)
98 |
99 | ## Styles
100 |
101 | Styles could be applied to the data markers using the `style` parameter, available to most plotting function, including `colorize()`, described [here](https://github.com/piccolomo/plotext/blob/master/readme/utilities.md#colored-text).
102 |
103 | Styles could easily applied to the rest of the plot, using the `style` parameter of the `ticks_style()` method, which is used to set the style of the axes ticks, title, and legend labels, if present.
104 |
105 | These are the available **style codes** that could be provided to the `style` parameter.
106 |
107 | 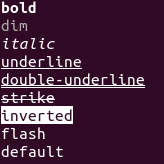
108 |
109 | - Any combination of styles could be used at the same time, provided they are separated by a space.
110 |
111 | - Using `flash` will result in an actual white flashing marker.
112 |
113 | - Access the function `styles()` for the available style codes.
114 |
115 | [Main Guide](https://github.com/piccolomo/plotext#guide), [Plot Aspect](https://github.com/piccolomo/plotext/blob/master/readme/aspect.md#plot-aspect)
116 |
117 | ## Themes
118 |
119 | To quickly chose a favorite color and style combination, for the entire figure or one of its subplots, use the `theme()` method.
120 | The available themes could be displayed with the function `themes()`; here is its output:
121 | 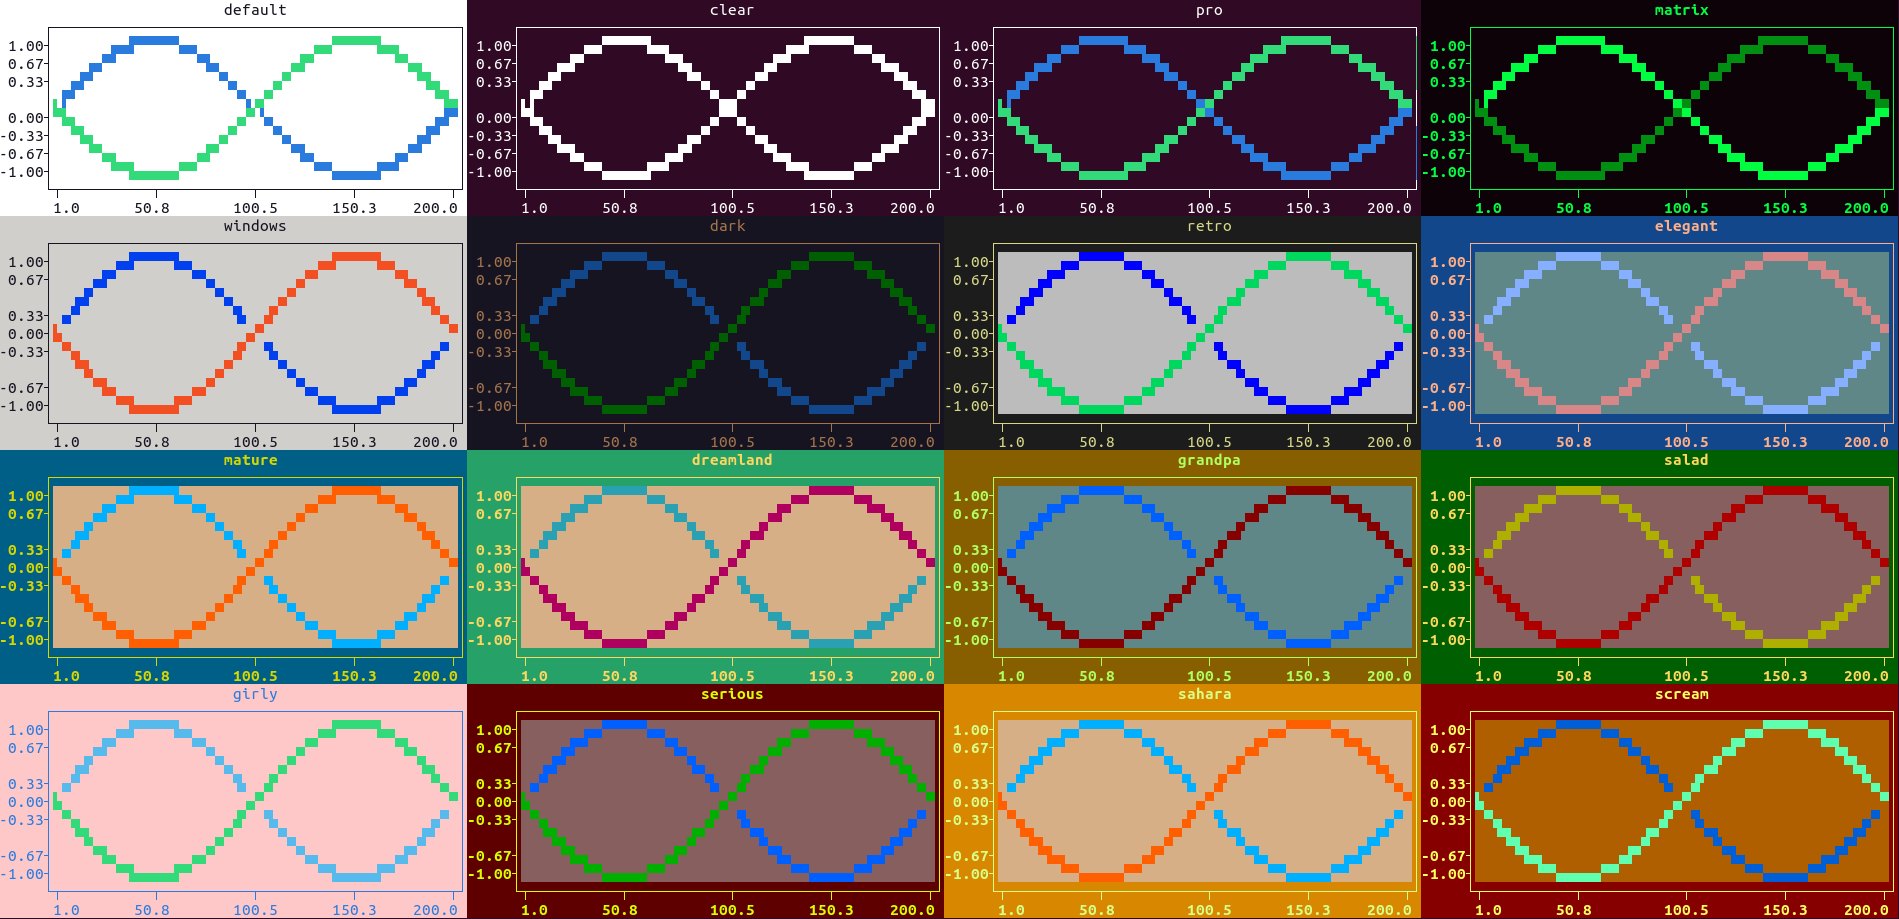
122 |
123 | - To remove all plot colors and styles from the current subplot, use the function `clear_color()`, in short `clc()`, which is equivalent to `theme('clear')`.
124 |
125 | - To add, tweak, rename any theme presented, please feel free to open an issue, dropping your favorite combination (canvas, axes, ticks color and style, and 3 signals in sequence).
126 |
127 | [Main Guide](https://github.com/piccolomo/plotext#guide), [Plot Aspect](https://github.com/piccolomo/plotext/blob/master/readme/aspect.md#plot-aspect)
128 |
--------------------------------------------------------------------------------
/readme/bar.md:
--------------------------------------------------------------------------------
1 | # Bar Plots
2 |
3 | - [Vertical Bar Plot](https://github.com/piccolomo/plotext/blob/master/readme/bar.md#vertical-bar-plot)
4 | - [Horizontal Bar Plot](https://github.com/piccolomo/plotext/blob/master/readme/bar.md#horizontal-bar-plot)
5 | - [Multiple Bar Plot](https://github.com/piccolomo/plotext/blob/master/readme/bar.md#multiple-bar-plot)
6 | - [Stacked Bar Plot](https://github.com/piccolomo/plotext/blob/master/readme/bar.md#stacked-bar-plot)
7 | - [Box Plot](https://github.com/piccolomo/plotext/blob/master/readme/bar.md#box-plot)
8 | - [Histogram Plot](https://github.com/piccolomo/plotext/blob/master/readme/bar.md#histogram-plot)
9 |
10 | [Main Guide](https://github.com/piccolomo/plotext#guide)
11 |
12 | ## Vertical Bar Plot
13 |
14 | Simply use the `bar()` function:
15 |
16 | - the `marker`, `color`, and `fill` properties of the bar plot could be changed using their respective parameters: [markers](https://github.com/piccolomo/plotext/blob/master/readme/aspect.md#markers) and [colors](https://github.com/piccolomo/plotext/blob/master/readme/aspect.md#colors) are described in their linked sections.
17 | - the `orientation` (vertical by default) and relative bar `width` (`4/5` by default) could also be changed using their respective parameters.
18 |
19 | Here is an example:
20 |
21 | ```python
22 | import plotext as plt
23 |
24 | pizzas = ["Sausage", "Pepperoni", "Mushrooms", "Cheese", "Chicken", "Beef"]
25 | percentages = [14, 36, 11, 8, 7, 4]
26 |
27 | plt.bar(pizzas, percentages)
28 | plt.title("Most Favored Pizzas in the World")
29 | plt.show()
30 | ```
31 |
32 | or directly on terminal:
33 |
34 | ```console
35 | python3 -c "import plotext as plt; pizzas = ['Sausage', 'Pepperoni', 'Mushrooms', 'Cheese', 'Chicken', 'Beef']; percentages = [14, 36, 11, 8, 7, 4]; plt.bar(pizzas, percentages); plt.title('Most Favored Pizzas in the World'); plt.show()"
36 | ```
37 |
38 | 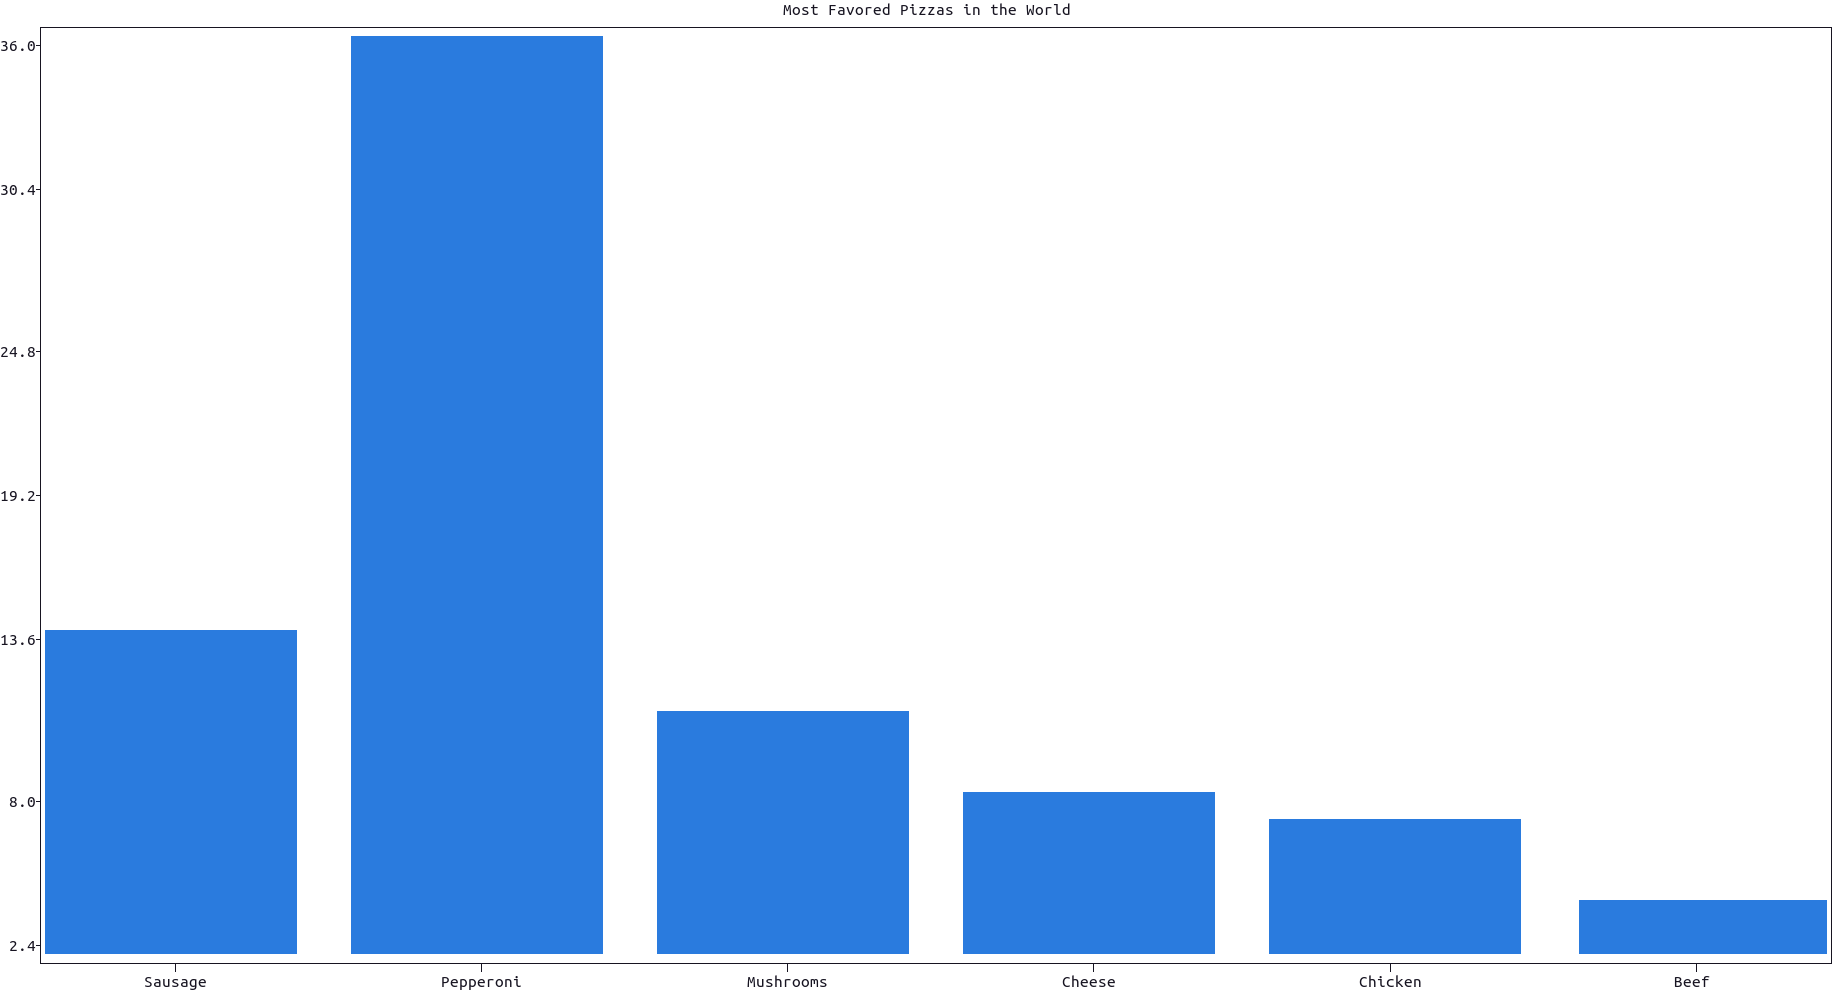
39 |
40 | More documentation can be accessed with `doc.bar()`.
41 |
42 | [Main Guide](https://github.com/piccolomo/plotext#guide), [Bar Plots](https://github.com/piccolomo/plotext/blob/master/readme/bar.md#bar-plots)
43 |
44 | ## Horizontal Bar Plot
45 |
46 | Simply set `orientation = "horizontal"` in the `bar()` function. Here is an example:
47 |
48 | ```python
49 | import plotext as plt
50 |
51 | pizzas = ["Sausage", "Pepperoni", "Mushrooms", "Cheese", "Chicken", "Beef"]
52 | percentages = [14, 36, 11, 8, 7, 4]
53 |
54 | plt.bar(pizzas, percentages, orientation = "horizontal", width = 3 / 5) # or in short orientation = 'h'
55 | plt.title("Most Favoured Pizzas in the World")
56 | plt.show()
57 | ```
58 |
59 | or directly on terminal:
60 |
61 | ```console
62 | python3 -c "import plotext as plt; pizzas = ['Sausage', 'Pepperoni', 'Mushrooms', 'Cheese', 'Chicken', 'Beef']; percentages = [14, 36, 11, 8, 7, 4]; plt.bar(pizzas, percentages, orientation = 'h', width = 3 / 5); plt.title('Most Favored Pizzas in the World'); plt.show()"
63 | ```
64 |
65 | 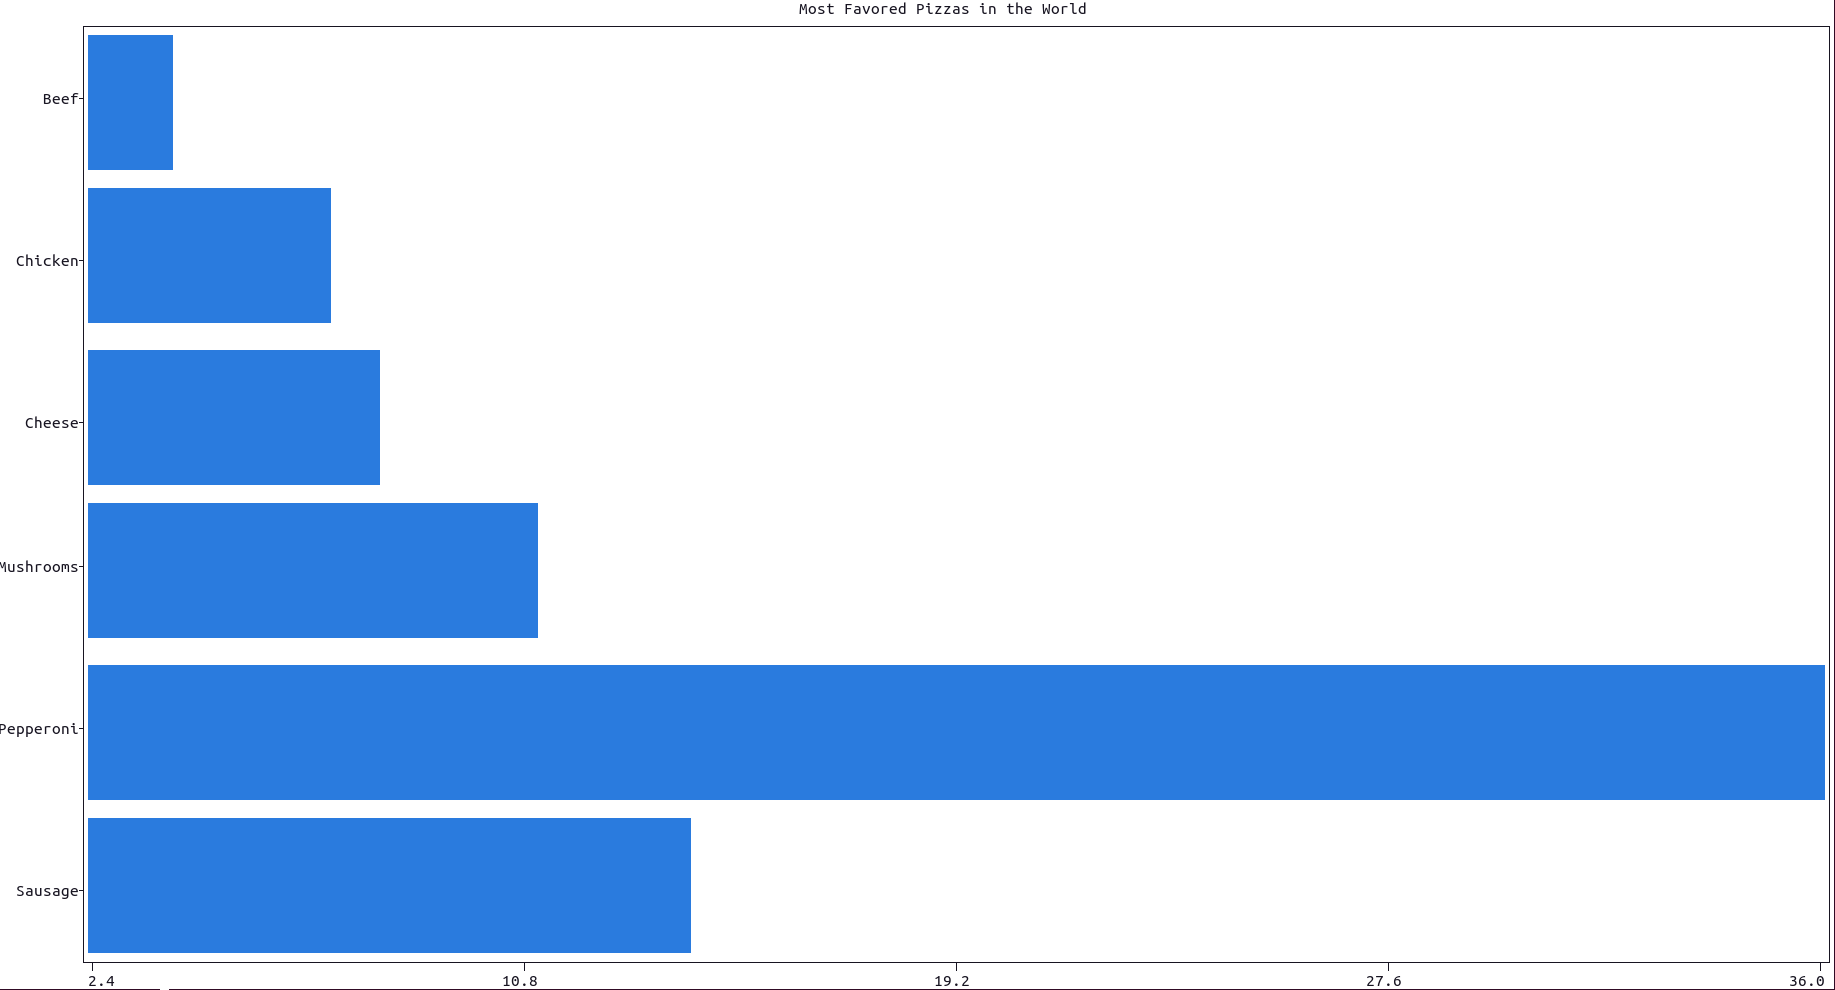
66 |
67 | More documentation can be accessed with `doc.bar()`.
68 |
69 | To create a **simpler and sketchier version** of the same bar plot, use the function `simple_bar()` instead:
70 |
71 | - the advantage of this bar plot is that it produces a very predictable output in terms of bar width (a single character),
72 | - the disadvantages are that its only orientation is horizontal, it cannot be used inside a [matrix of subplots](https://github.com/piccolomo/plotext/blob/master/readme/subplots.md#subplots) and any setting method which follows will not have any effect (like `xlabel()`, `plotsize()` and so on),
73 |
74 | Here is an example:The default value for quintuples is False
75 |
76 | ```python
77 | import plotext as plt
78 |
79 | pizzas = ["Sausage", "Pepperoni", "Mushrooms", "Cheese", "Chicken", "Beef"]
80 | percentages = [14, 36, 11, 8, 7, 4]
81 |
82 | plt.simple_bar(pizzas, percentages, width = 100, title = 'Most Favored Pizzas in the World')
83 | plt.show()
84 | ```
85 |
86 | or directly on terminal:
87 |
88 | ```console
89 | python3 -c "import plotext as plt; pizzas = ['Sausage', 'Pepperoni', 'Mushrooms', 'Cheese', 'Chicken', 'Beef']; percentages = [14, 36, 11, 8, 7, 4]; plt.simple_bar(pizzas, percentages, width = 100, title = 'Most Favored Pizzas in the World'); plt.show()"
90 | ```
91 |
92 | 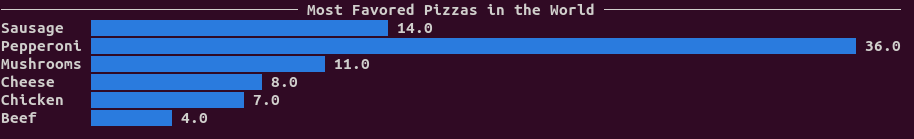
93 |
94 | More documentation can be accessed with `doc.simple_bar()`.
95 |
96 | [Main Guide](https://github.com/piccolomo/plotext#guide), [Bar Plots](https://github.com/piccolomo/plotext/blob/master/readme/bar.md#bar-plots)
97 |
98 | ## Multiple Bar Plot
99 |
100 | To plot multiple offsetted bars, each group with the same label, use the function `plt.multiple_bar()`, as in this example:
101 |
102 | ```python
103 | import plotext as plt
104 |
105 | pizzas = ["Sausage", "Pepperoni", "Mushrooms", "Cheese", "Chicken", "Beef"]
106 | male_percentages = [14, 36, 11, 8, 7, 4]
107 | female_percentages = [12, 20, 35, 15, 2, 1]
108 |
109 | plt.multiple_bar(pizzas, [male_percentages, female_percentages], labels = ["men", "women"])
110 | plt.title("Most Favored Pizzas in the World by Gender")
111 | plt.show()
112 | ```
113 |
114 | or directly on terminal:
115 |
116 | ```console
117 | python3 -c "import plotext as plt; pizzas = ['Sausage', 'Pepperoni', 'Mushrooms', 'Cheese', 'Chicken', 'Beef']; male_percentages = [14, 36, 11, 8, 7, 4]; female_percentages = [12, 20, 35, 15, 2, 1]; plt.multiple_bar(pizzas, [male_percentages, female_percentages], labels = ['men', 'women']); plt.title('Most Favored Pizzas in the World by Gender'); plt.show()"
118 | ```
119 |
120 | 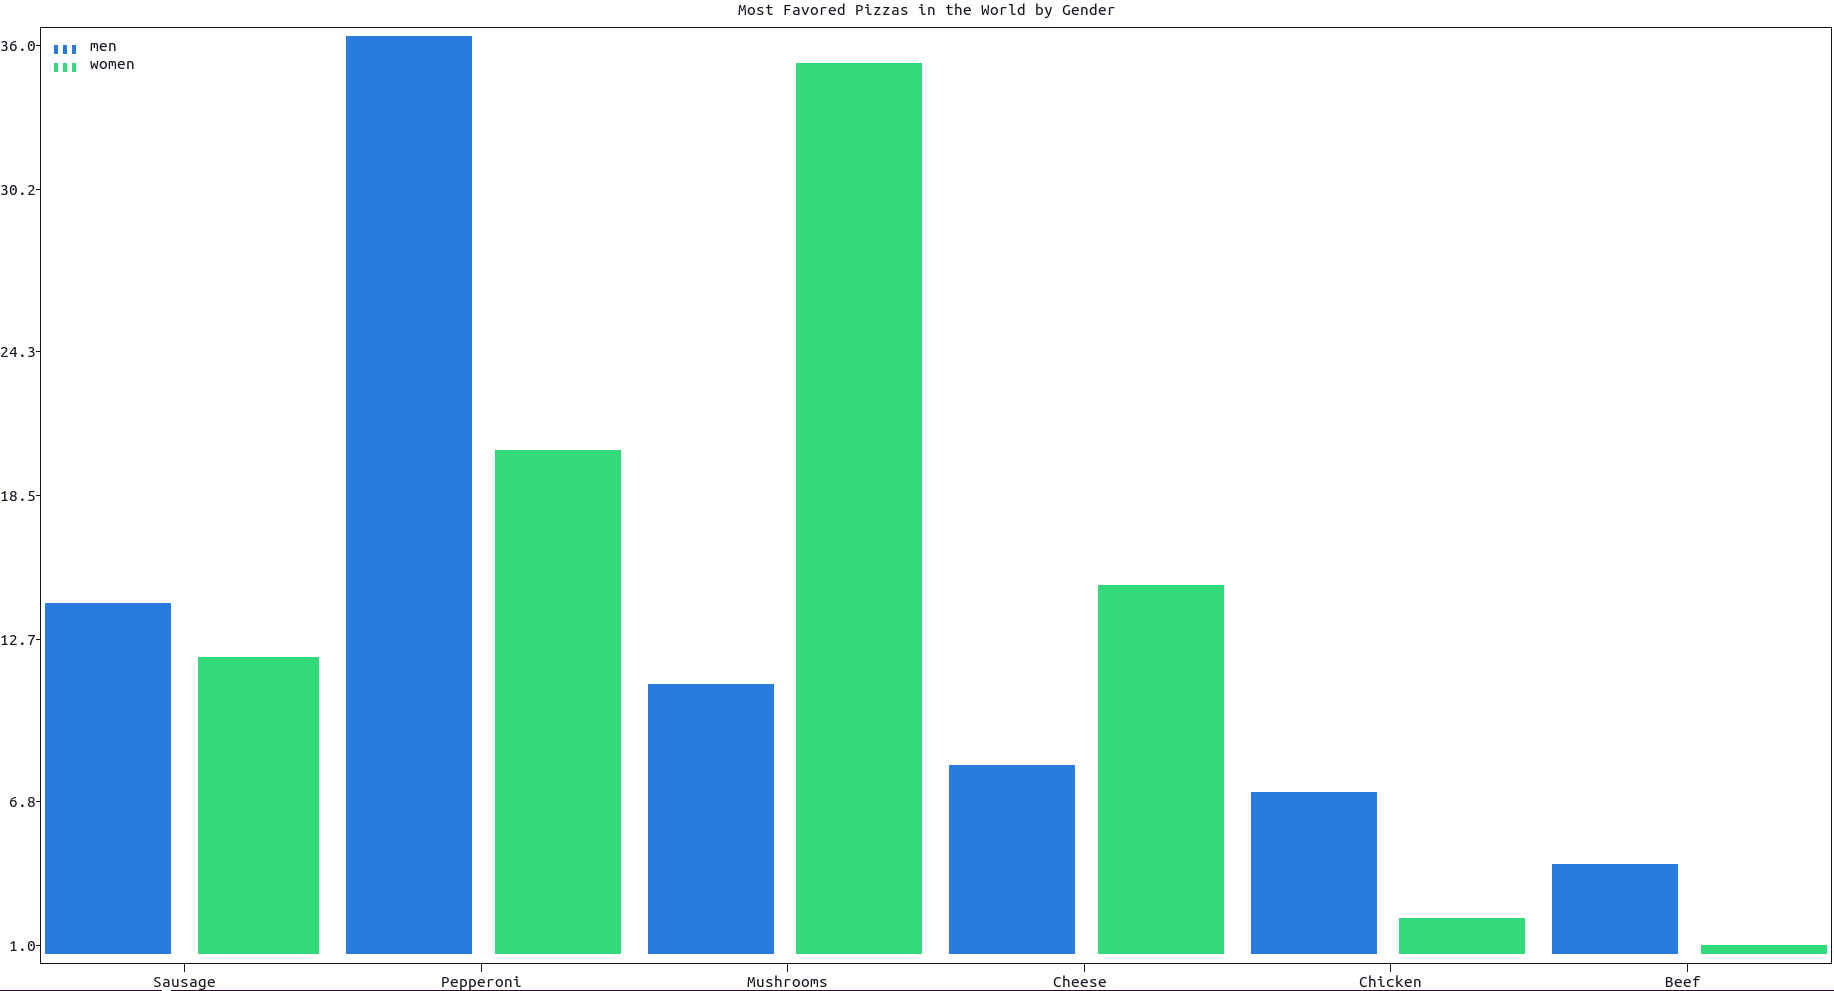
121 |
122 | More documentation can be accessed with `doc.multiple_bar()`.
123 |
124 | To produce a **simpler and sketchier version** of the same bar plot, use the function `simple_multiple_bar()` instead, as in this example:
125 |
126 | ```python
127 | import plotext as plt
128 | pizzas = ['Sausage', 'Pepperoni', 'Mushrooms', 'Cheese', 'Chicken', 'Beef']
129 | male_percentages = [14, 36, 11, 8, 7, 4]
130 | female_percentages = [12, 20, 35, 15, 2, 1]
131 | plt.simple_multiple_bar(pizzas, [male_percentages, female_percentages], width = 100, labels = ['men', 'women'], title = 'Most Favored Pizzas in the World by Gender')
132 | plt.show()
133 | ```
134 |
135 | or directly on terminal:
136 |
137 | ```console
138 | python3 -c "import plotext as plt; pizzas = ['Sausage', 'Pepperoni', 'Mushrooms', 'Cheese', 'Chicken', 'Beef']; male_percentages = [14, 36, 11, 8, 7, 4]; female_percentages = [12, 20, 35, 15, 2, 1]; plt.simple_multiple_bar(pizzas, [male_percentages, female_percentages], width = 100, labels = ['men', 'women'], title = 'Most Favored Pizzas in the World by Gender'); plt.show()"
139 | ```
140 |
141 | 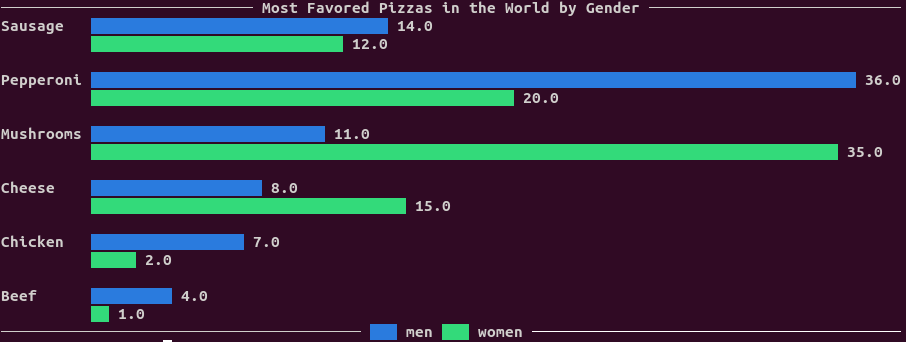
142 |
143 | Note that this kind of plot has the same disadvantages as `simple_bar()`, as discussed [in this section](https://github.com/piccolomo/plotext/blob/master/readme/bar.md#horizontal-bar-plot). More documentation can be accessed with `doc.simple_multiple_bar()`.
144 |
145 | [Main Guide](https://github.com/piccolomo/plotext#guide), [Bar Plots](https://github.com/piccolomo/plotext/blob/master/readme/bar.md#bar-plots)
146 |
147 | ## Stacked Bar Plot
148 |
149 | To plot multiple bars on top of each other, each group with the same label, use the function `plt.stacked_bar()` as in this example:
150 |
151 | ```python
152 | import plotext as plt
153 |
154 | pizzas = ["Sausage", "Pepperoni", "Mushrooms", "Cheese", "Chicken", "Beef"]
155 | male_percentages = [14, 36, 11, 8, 7, 4]
156 | female_percentages = [12, 20, 35, 15, 2, 1]
157 |
158 | plt.stacked_bar(pizzas, [male_percentages, female_percentages], labels = ["men", "women"])
159 | plt.title("Most Favored Pizzas in the World by Gender")
160 | plt.show()
161 | ```
162 |
163 | or directly on terminal:
164 |
165 | ```console
166 | python3 -c "import plotext as plt; pizzas = ['Sausage', 'Pepperoni', 'Mushrooms', 'Cheese', 'Chicken', 'Beef']; male_percentages = [14, 36, 11, 8, 7, 4]; female_percentages = [12, 20, 35, 15, 2, 1]; plt.stacked_bar(pizzas, [male_percentages, female_percentages], labels = ['men', 'women']); plt.title('Most Favored Pizzas in the World by Gender'); plt.show()"
167 | ```
168 |
169 | 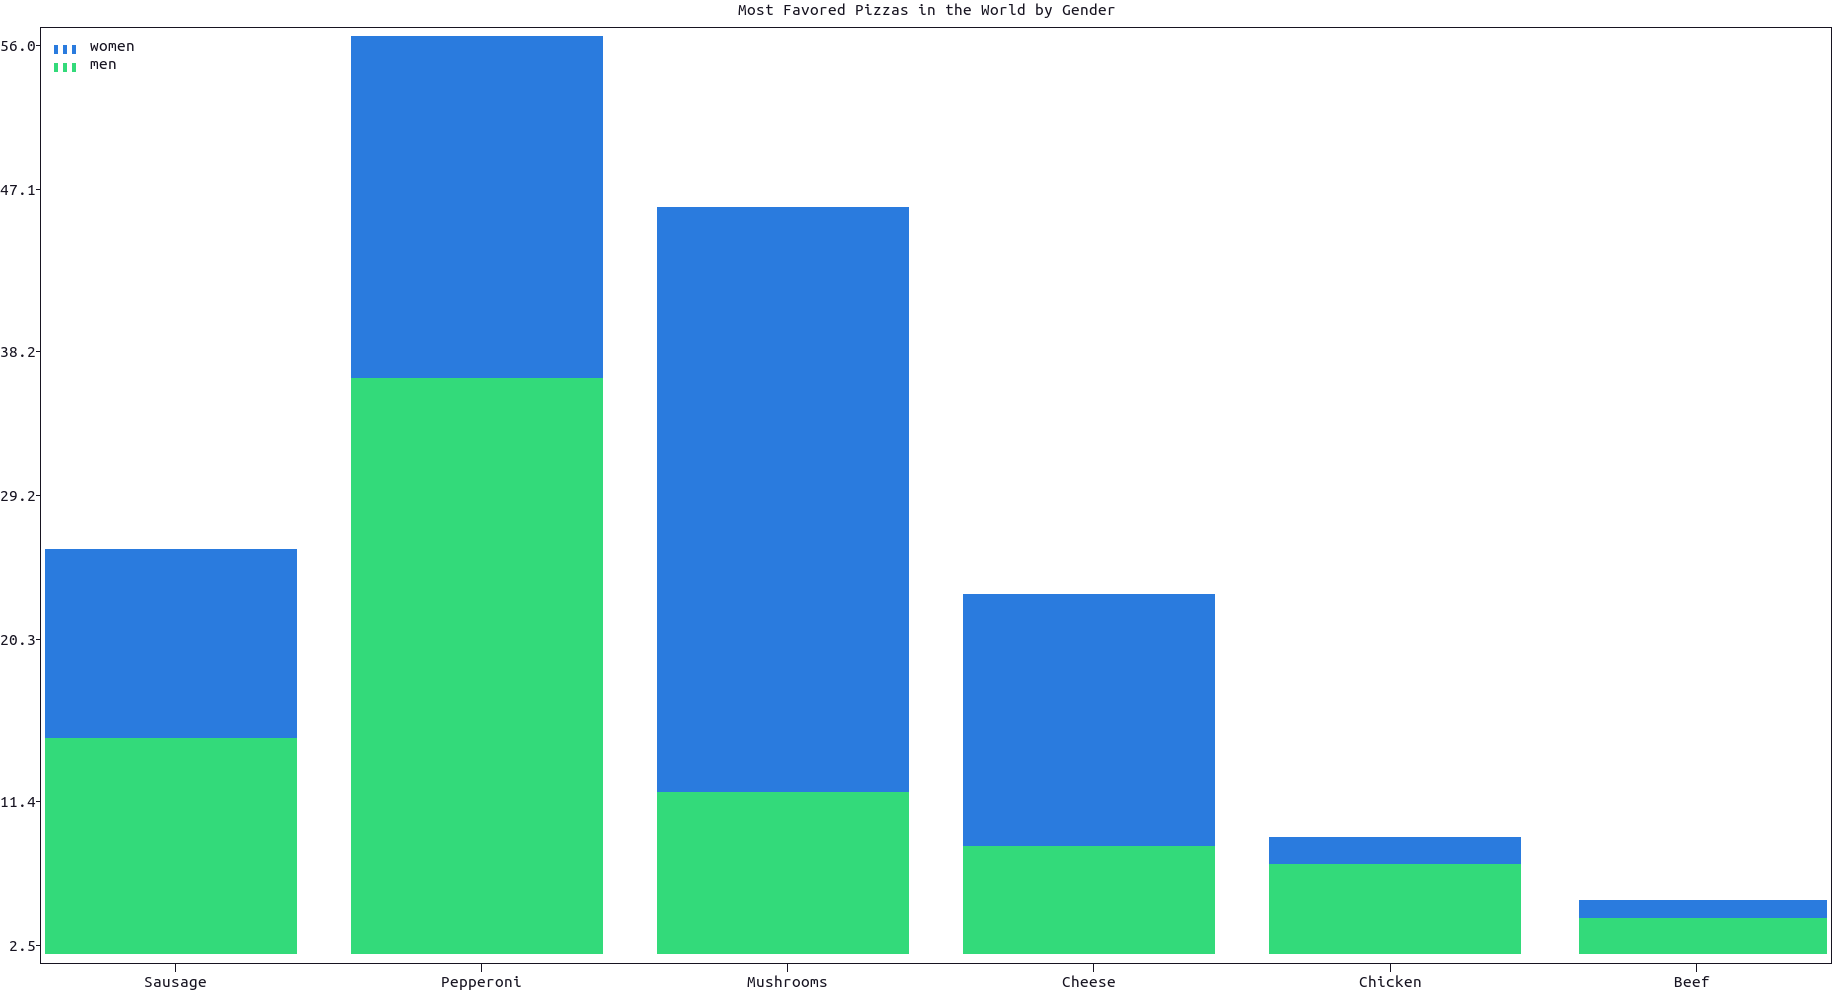
170 |
171 | The full documentation of the `stacked_bar()` function can be accessed with `doc.stacked_bar()`.
172 |
173 | To produce a **simpler and sketchier version** of the same bar plot, use the function `simple_stacked_bar()` instead, as in this example:
174 |
175 | ```python
176 | import plotext as plt
177 | pizzas = ['Sausage', 'Pepperoni', 'Mushrooms', 'Cheese', 'Chicken', 'Beef']
178 | male_percentages = [14, 36, 11, 8, 7, 4]
179 | female_percentages = [12, 20, 35, 15, 2, 1]
180 | plt.simple_stacked_bar(pizzas, [male_percentages, female_percentages], width = 100, labels = ['men', 'women'], title = 'Most Favored Pizzas in the World by Gender')
181 | plt.show()
182 | ```
183 |
184 | or directly on terminal:
185 |
186 | ```console
187 | python3 -c "import plotext as plt; pizzas = ['Sausage', 'Pepperoni', 'Mushrooms', 'Cheese', 'Chicken', 'Beef']; male_percentages = [14, 36, 11, 8, 7, 4]; female_percentages = [12, 20, 35, 15, 2, 1]; plt.simple_stacked_bar(pizzas, [male_percentages, female_percentages], width = 100, labels = ['men', 'women'], title = 'Most Favored Pizzas in the World by Gender'); plt.show()"
188 | ```
189 |
190 | 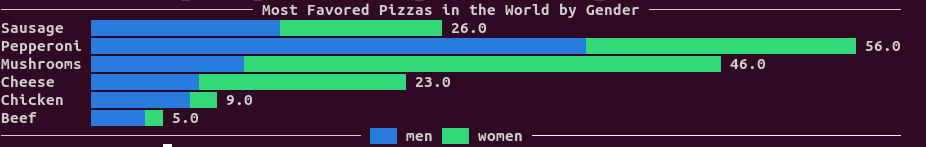
191 |
192 | Note that this kind of plot has the same disadvantages as `simple_bar()`, as discussed [in this section](https://github.com/piccolomo/plotext/blob/master/readme/bar.md#horizontal-bar-plot). More documentation can be accessed with `doc.simple_stacked_bar()`.
193 |
194 | [Main Guide](https://github.com/piccolomo/plotext#guide), [Bar Plots](https://github.com/piccolomo/plotext/blob/master/readme/bar.md#bar-plots)
195 |
196 | ## Box Plot
197 | Box plot is common and useful in statistics plot.
198 | `plot.box` function supports two types of input data. The first form involves providing the raw data to calculate the distribution(`quintuples=False`, default). Alternatively, one can directly provide the pre-calculated metrics, namely the minimum, first quartile, median, third quartile, and maximum(`quintuples=True`).
199 |
200 | the first form:
201 | ```python
202 | import plotext as plt
203 |
204 | labels = ["apple", "orange", "pear", "banana"]
205 | data = [
206 | [1,2,3,5,10,8],
207 | [4,9,6,12,20,13],
208 | [1,2,3,4,5,6],
209 | [3,9,12,16,9,8,3,7,2]]
210 |
211 | plt.box(labels, data, width=0.3)
212 | plt.title("The weight of the fruit")
213 | plt.show()
214 | ```
215 |
216 | or directly on terminal:
217 |
218 | ```shell
219 | python3 -c 'import plotext as plt;labels = ["apple", "orange", "pear", "banana"];data = [[1,2,3,5,10,8],[4,9,6,12,20,13],[1,2,3,4,5,6],[3,9,12,16,9,8,3,7,2]];plt.box(labels, data, width=0.3);plt.title("The weight of the fruit");plt.show()'
220 | ```
221 | 
222 |
223 | the second form:
224 | ```python
225 | import plotext as plt
226 |
227 | labels = ["apple", "orange", "pear", "banana"]
228 | data = [
229 | # max, q75, q50, q25, min
230 | [10, 7, 5, 3, 1.5],
231 | [19, 12.3, 9, 7, 4],
232 | [15, 14, 11, 9, 8],
233 | [13, 12, 11, 10, 6]]
234 |
235 | plt.box(labels, data, width=0.3, quintuples=True)
236 | plt.title("The weight of the fruit")
237 | plt.show()
238 | ```
239 |
240 | or directly on terminal:
241 |
242 | ```shell
243 | python3 -c 'import plotext as plt;labels = ["apple", "orange", "pear", "banana"];data = [[10, 7, 5, 3, 1.5],[19, 12.3, 9, 7, 4],[15, 14, 11, 9, 8],[13, 12, 11, 10, 6]];plt.box(labels, data, width=0.3, quintuples=True);plt.title("The weight of the fruit");plt.show()'
244 | ```
245 | 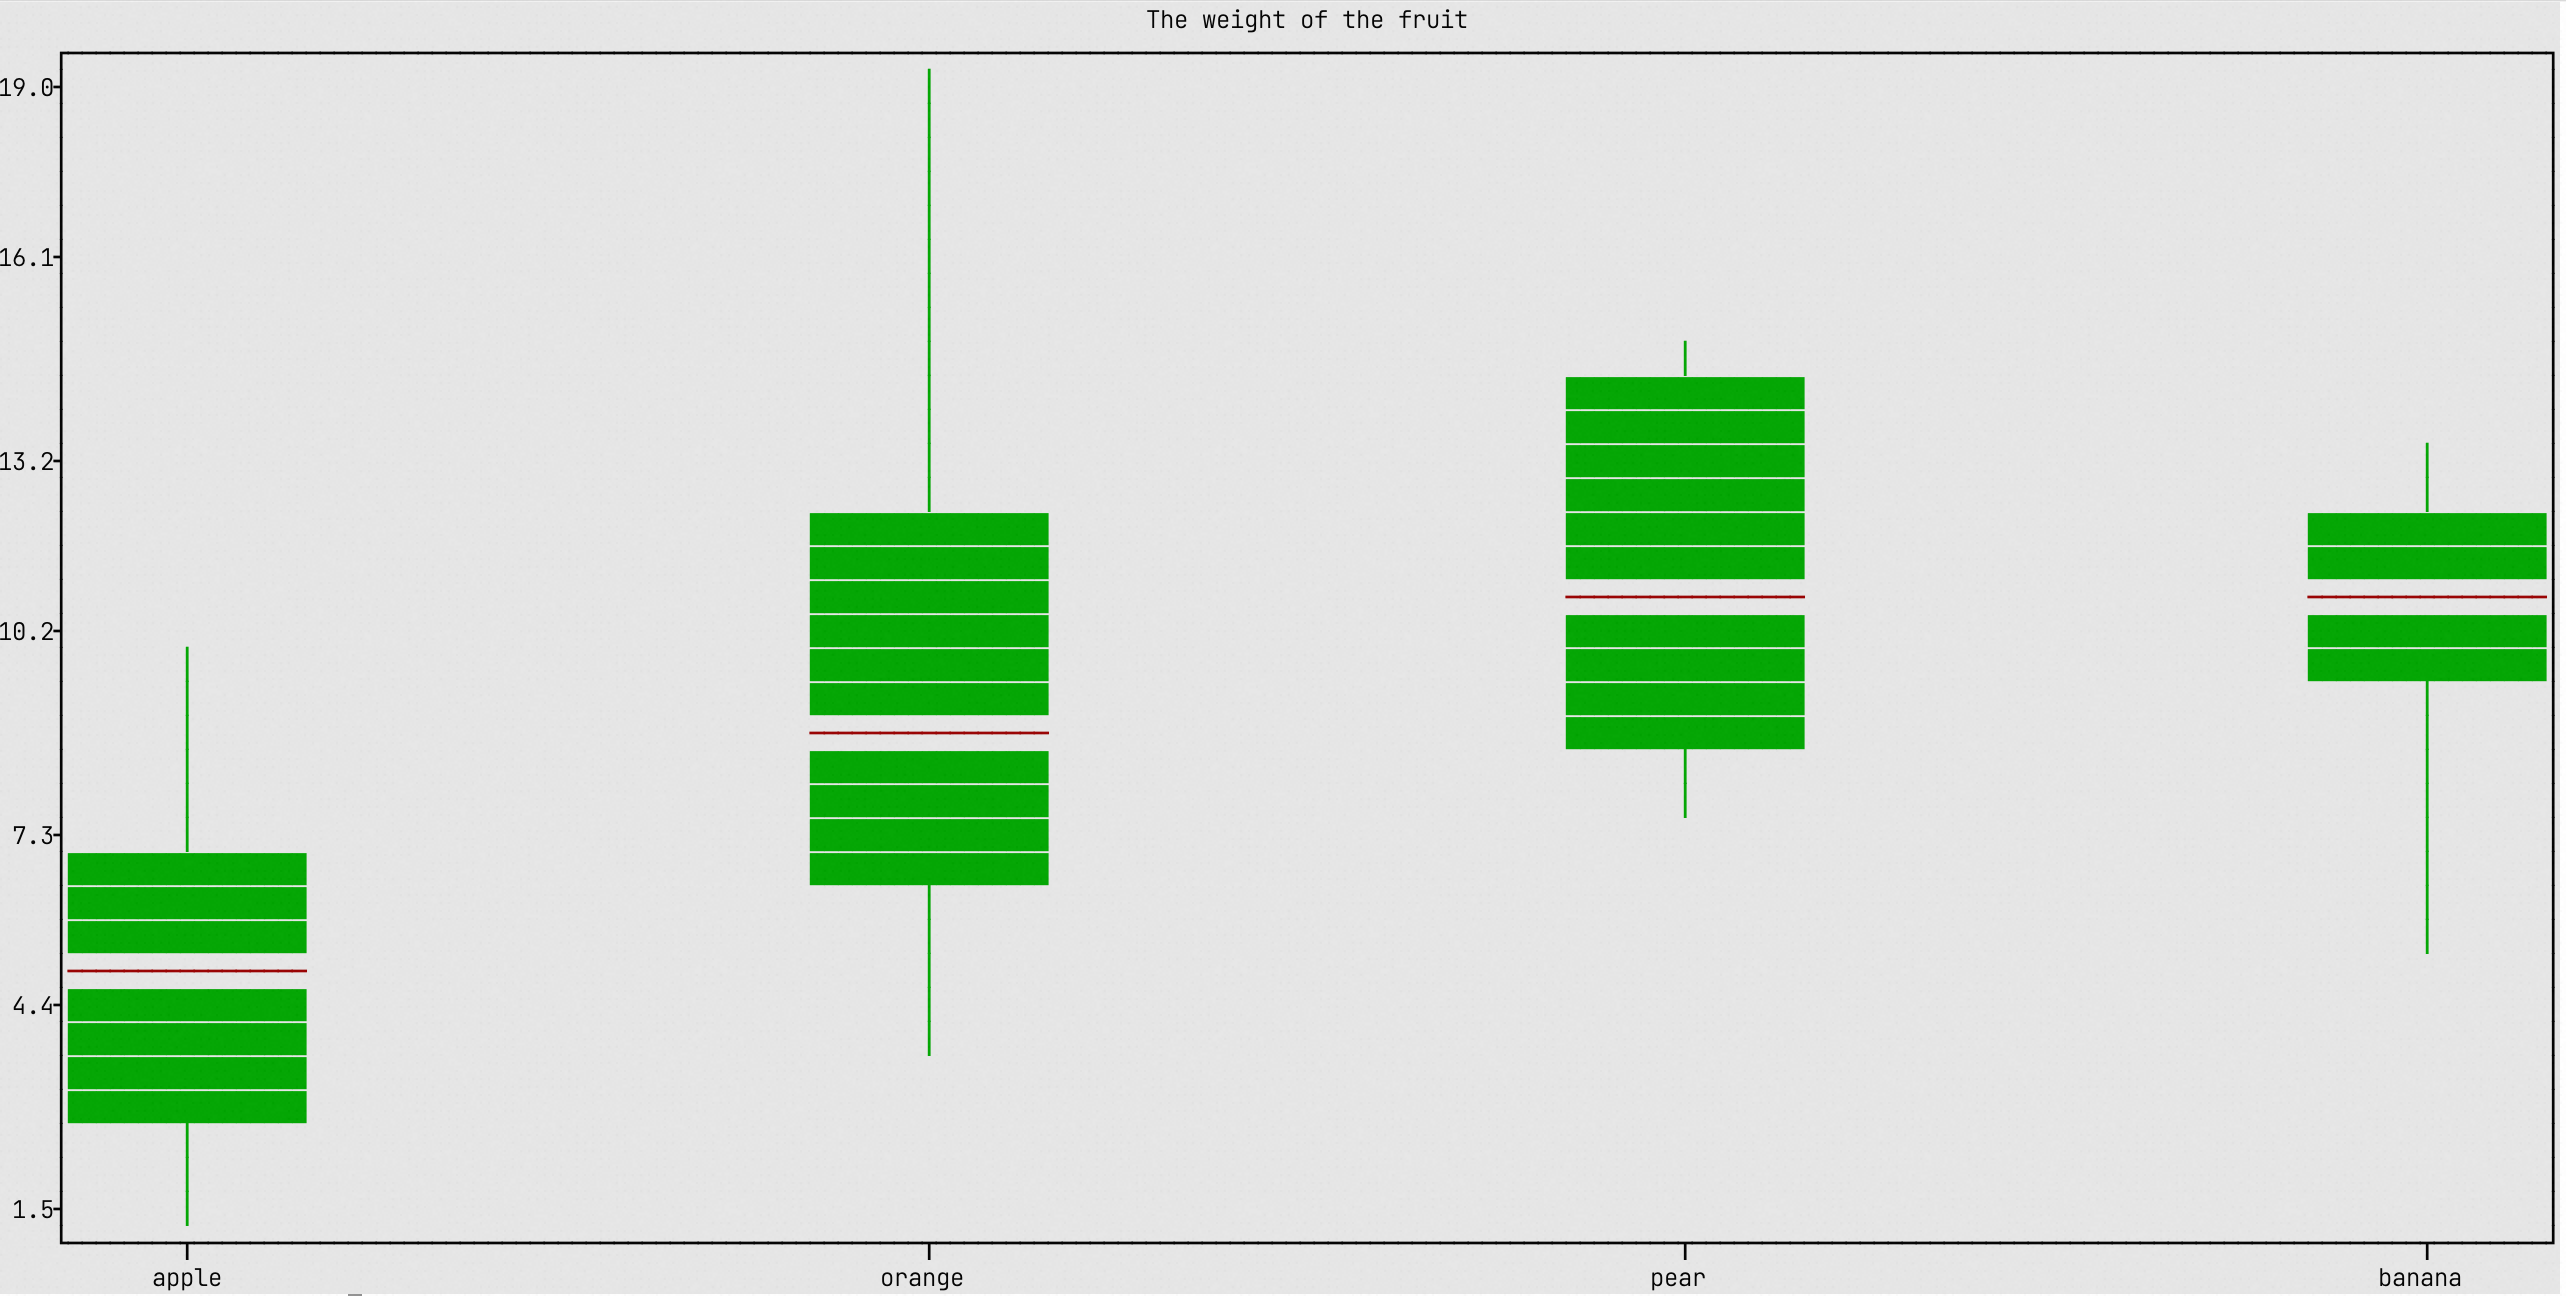
246 | This feature may require further development.
247 | [Main Guide](https://github.com/piccolomo/plotext#guide), [Bar Plots](https://github.com/piccolomo/plotext/blob/master/readme/bar.md#bar-plots)
248 |
249 | ## Histogram Plot
250 |
251 | For a histogram plot use the function `plt.hist()`. Here is an example:
252 |
253 | ```python
254 | import plotext as plt
255 | import random
256 |
257 | l = 7 * 10 ** 4
258 | data1 = [random.gauss(0, 1) for el in range(10 * l)]
259 | data2 = [random.gauss(3, 1) for el in range(6 * l)]
260 | data3 = [random.gauss(6, 1) for el in range(4 * l)]
261 |
262 | bins = 60
263 | plt.hist(data1, bins, label = "mean 0")
264 | plt.hist(data2, bins, label = "mean 3")
265 | plt.hist(data3, bins, label = "mean 6")
266 |
267 | plt.title("Histogram Plot")
268 | plt.show()
269 | ```
270 |
271 | or directly on terminal:
272 |
273 | ```console
274 | python3 -c "import plotext as plt; import random; l = 7 * 10 ** 4; data1 = [random.gauss(0, 1) for el in range(10 * l)]; data2 = [random.gauss(3, 1) for el in range(6 * l)]; data3 = [random.gauss(6, 1) for el in range(4 * l)]; bins = 60; plt.hist(data1, bins, label = 'mean 0'); plt.hist(data2, bins, label = 'mean 3'); plt.hist(data3, bins, label = 'mean 6'); plt.title('Histogram Plot'); plt.show()"
275 | ```
276 |
277 | 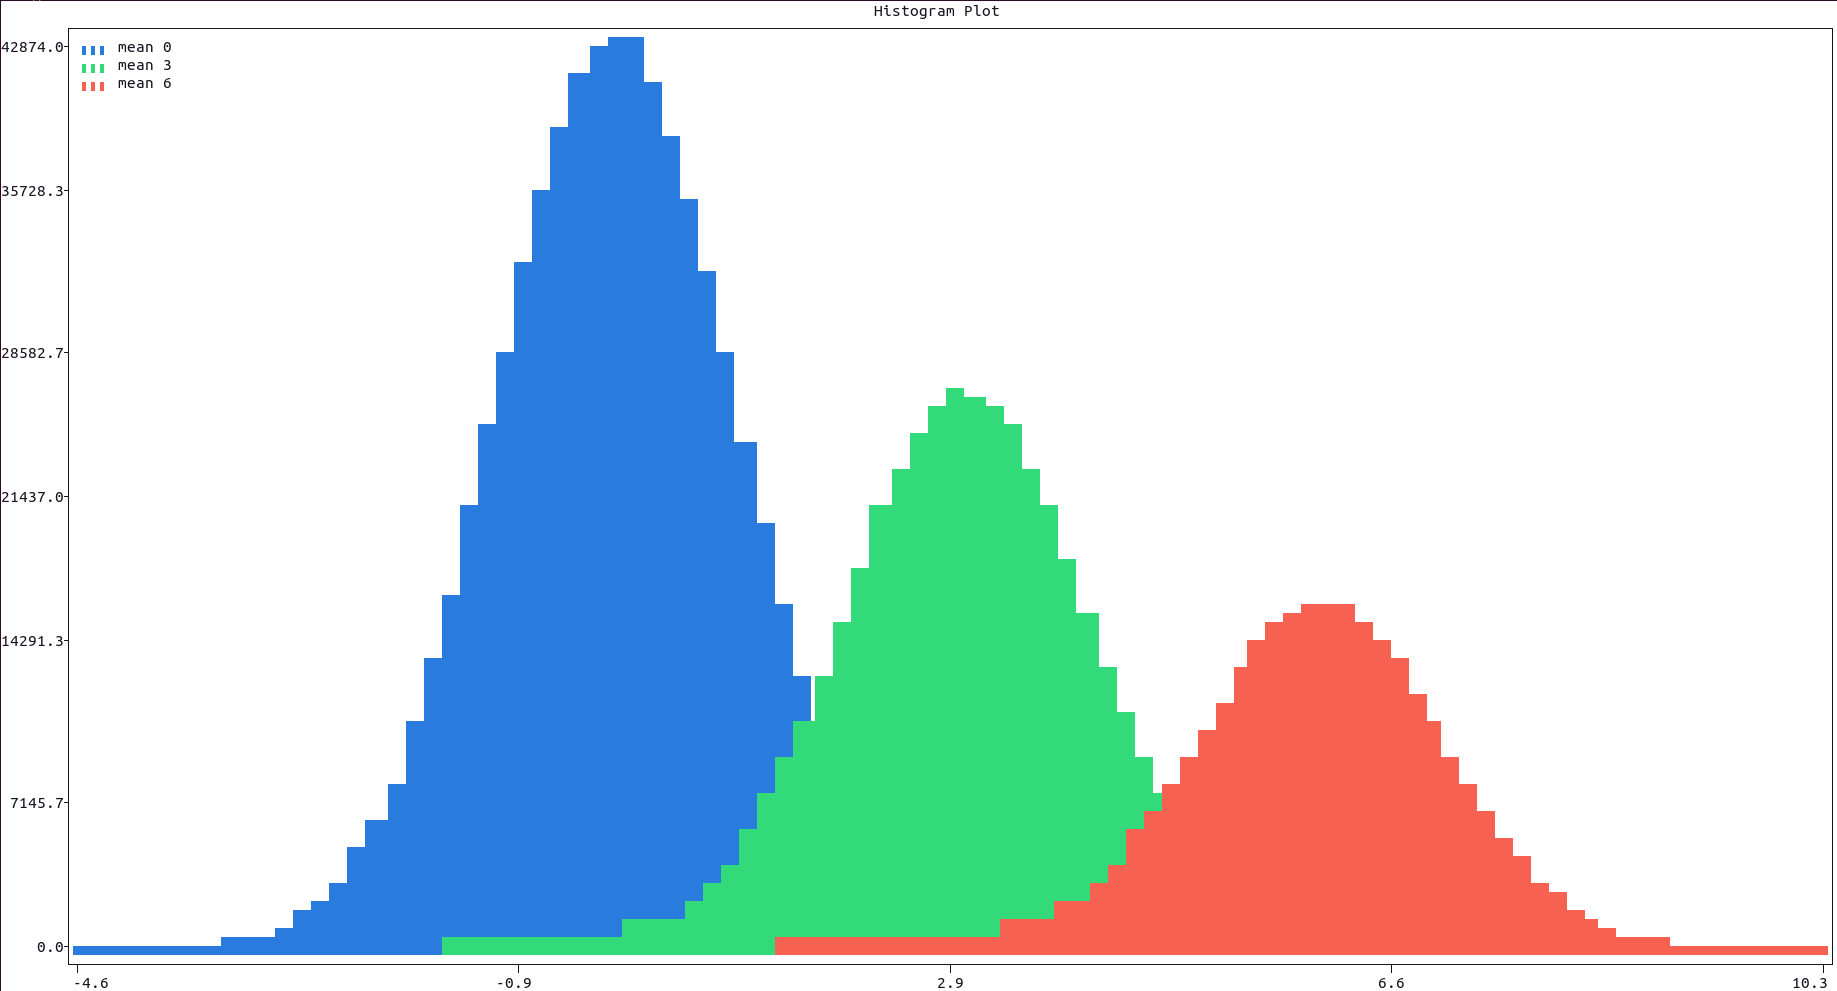
278 |
279 | More documentation can be accessed with `doc.hist()`.
280 |
281 | [Main Guide](https://github.com/piccolomo/plotext#guide), [Bar Plots](https://github.com/piccolomo/plotext/blob/master/readme/bar.md#bar-plots)
282 |
--------------------------------------------------------------------------------
/readme/basic.md:
--------------------------------------------------------------------------------
1 | # Basic Plots
2 |
3 | - [Introduction](https://github.com/piccolomo/plotext/blob/master/readme/basic.md#introduction)
4 | - [Scatter Plot](https://github.com/piccolomo/plotext/blob/master/readme/basic.md#scatter-plot)
5 | - [Line Plot](https://github.com/piccolomo/plotext/blob/master/readme/basic.md#line-plot)
6 | - [Log Plot](https://github.com/piccolomo/plotext/blob/master/readme/basic.md#log-plot)
7 | - [Stem Plot](https://github.com/piccolomo/plotext/blob/master/readme/basic.md#stem-plot)
8 | - [Multiple Data Sets](https://github.com/piccolomo/plotext/blob/master/readme/basic.md#multiple-data-sets)
9 | - [Multiple Axes Plot](https://github.com/piccolomo/plotext/blob/master/readme/basic.md#multiple-axes-plot)
10 |
11 | [Main Guide](https://github.com/piccolomo/plotext#guide)
12 |
13 | ## Introduction
14 |
15 | **First Things to Know**:
16 |
17 | - The **plot dimensions** by default adapt to the terminal size but can be changed using the `plotsize()` method described [here](https://github.com/piccolomo/plotext/blob/master/readme/settings.md#plot-size).
18 |
19 | - To plot a matrix of subplots, use the `subplots()` and `subplot()` methods, described in [this section](https://github.com/piccolomo/plotext/blob/master/readme/subplots.md#subplots).
20 |
21 | - The `marker` parameter of most plotting functions can be used to change the **marker** character used to plot the data, as described in [this section](https://github.com/piccolomo/plotext/blob/master/readme/aspect.md#markers). High definition `"hd"` and `"fhd"` markers are available, including `"braille"`.
22 |
23 | - Similarly the `color` parameter is used to define the **color** of the data points, as described in [this section](https://github.com/piccolomo/plotext/blob/master/readme/aspect.md#colors).
24 |
25 | - To rapidly generate some test **sinusoidal** or a **square wave** data, use respectively the `sin()` or `square()` methods, described [here](https://github.com/piccolomo/plotext/blob/master/readme/utilities.md#useful-functions).
26 |
27 | - To add **labels** to the plot use the `title()`, `xlabel()`, and `ylabel()` methods, described [here](https://github.com/piccolomo/plotext/blob/master/readme/aspect.md#plot-labels), as well as the `label` parameter of most plotting functions to add an entry to the [plot legend](https://github.com/piccolomo/plotext/blob/master/readme/basic.md#multiple-data-sets).
28 |
29 | - To change the **plot colors** and ticks style, use the `axes_color()`, `canvas_color()`, `ticks_color()`, `ticks_style()` methods, described [here](https://github.com/piccolomo/plotext/blob/master/readme/aspect.md#colors), or more directly using the `theme()` method, described [here](https://github.com/piccolomo/plotext/blob/master/readme/aspect.md#themes).
30 |
31 | - To **add lines** to the plot, use the `grid()`, `horizontal_line()` or `vertical_line()` methods, described [here](https://github.com/piccolomo/plotext/blob/master/readme/aspect.md#plot-lines).
32 |
33 | - To add or remove the **axes** use the methods `xaxes()`, `yaxes()` or directly `frame()`, described [here](https://github.com/piccolomo/plotext/blob/master/readme/aspect.md#plot-lines).
34 |
35 | - To change the **axes numerical ticks** use the functions `xfrequency()`, `xticks()`, `yfrequency()` and `yticks()`, described [here](https://github.com/piccolomo/plotext/blob/master/readme/settings.md#axes-ticks).
36 |
37 | - As with `matplotlib`, the plot is only displayed when the `show()` method is finally called.
38 |
39 | - To **display the plot dynamically** - without using `show()` - use the `interactive(True)` method, as described [here](https://github.com/piccolomo/plotext/blob/master/readme/utilities.md#canvas-utilities).
40 |
41 | - To finally **save the plot** use the function `savefig(path)` described [here](https://github.com/piccolomo/plotext/blob/master/readme/utilities.md#canvas-utilities).
42 |
43 | - To **clear the figure, data or color** settings, use the `clear_figure()`, `clear_data()` or `clear_color()` methods respectively, described [here](https://github.com/piccolomo/plotext/blob/master/readme/utilities.md#clearing-functions).
44 |
45 | - To **clear the screen**, before or after plotting, use the `clear_terminal()` method, described [here](https://github.com/piccolomo/plotext/blob/master/readme/utilities.md#clearing-functions).
46 |
47 | - The **documentation** of all `plotext` methods and plotting functions is available in its `doc` container, as described [here](https://github.com/piccolomo/plotext/blob/master/readme/utilities.md#docstrings).
48 |
49 | - The package is under development, so any **bug report** or **feature request** is very welcomed, just by [opening an issue](https://github.com/piccolomo/plotext/issues/new).
50 |
51 | [Main Guide](https://github.com/piccolomo/plotext#guide), [Basic Plots](https://github.com/piccolomo/plotext/blob/master/readme/basic.md#basic-plots)
52 |
53 | ## Scatter Plot
54 |
55 | Here is a simple scatter plot:
56 |
57 | ```python
58 | import plotext as plt
59 | y = plt.sin() # sinusoidal test signal
60 | plt.scatter(y)
61 | plt.title("Scatter Plot") # to apply a title
62 | plt.show() # to finally plot
63 | ```
64 |
65 | or directly on terminal:
66 |
67 | ```console
68 | python3 -c "import plotext as plt; y = plt.sin(); plt.scatter(y); plt.title('Scatter Plot'); plt.show()"
69 | ```
70 |
71 | 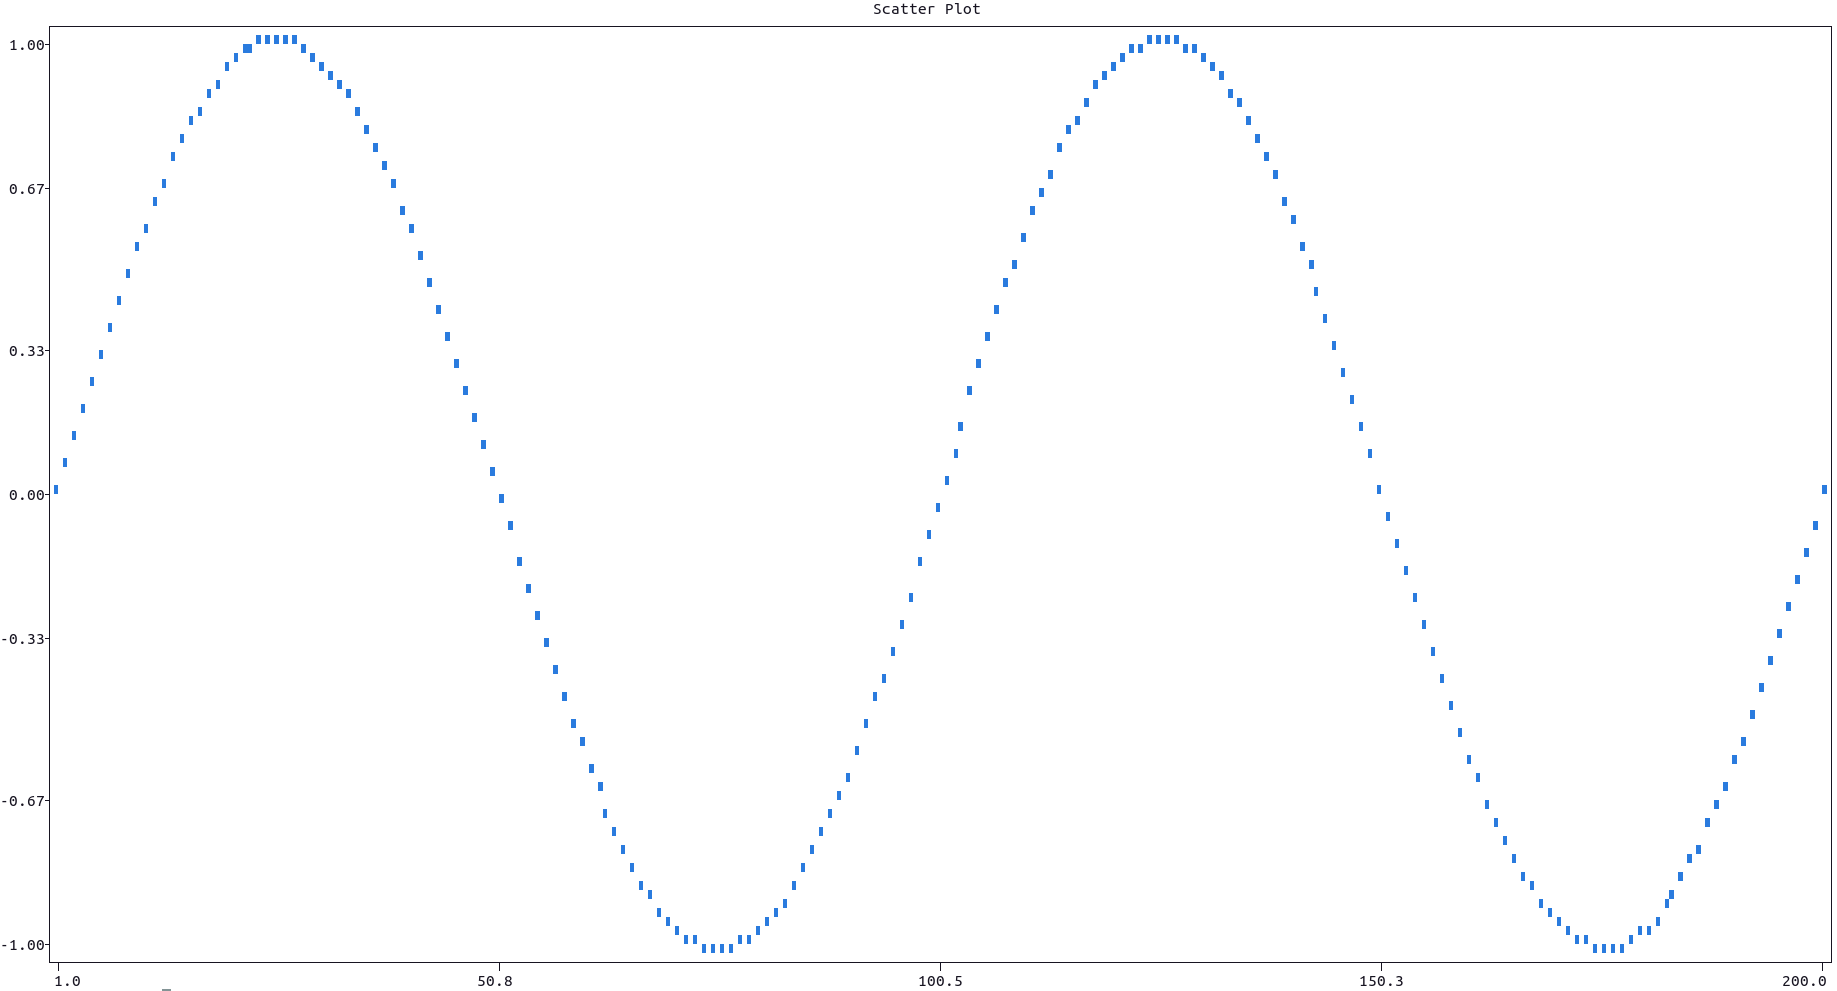
72 |
73 | More documentation can be accessed with `doc.scatter()`.
74 |
75 | [Main Guide](https://github.com/piccolomo/plotext#guide), [Basic Plots](https://github.com/piccolomo/plotext/blob/master/readme/basic.md#basic-plots)
76 |
77 | ## Line Plot
78 |
79 | For a line plot use the `plot()` function instead:
80 |
81 | ```python
82 | import plotext as plt
83 | y = plt.sin()
84 | plt.plot(y)
85 | plt.title("Line Plot")
86 | plt.show()
87 | ```
88 |
89 | or directly on terminal:
90 |
91 | ```console
92 | python3 -c "import plotext as plt; y = plt.sin(); plt.plot(y); plt.title('Line Plot'); plt.show()"
93 | ```
94 |
95 | 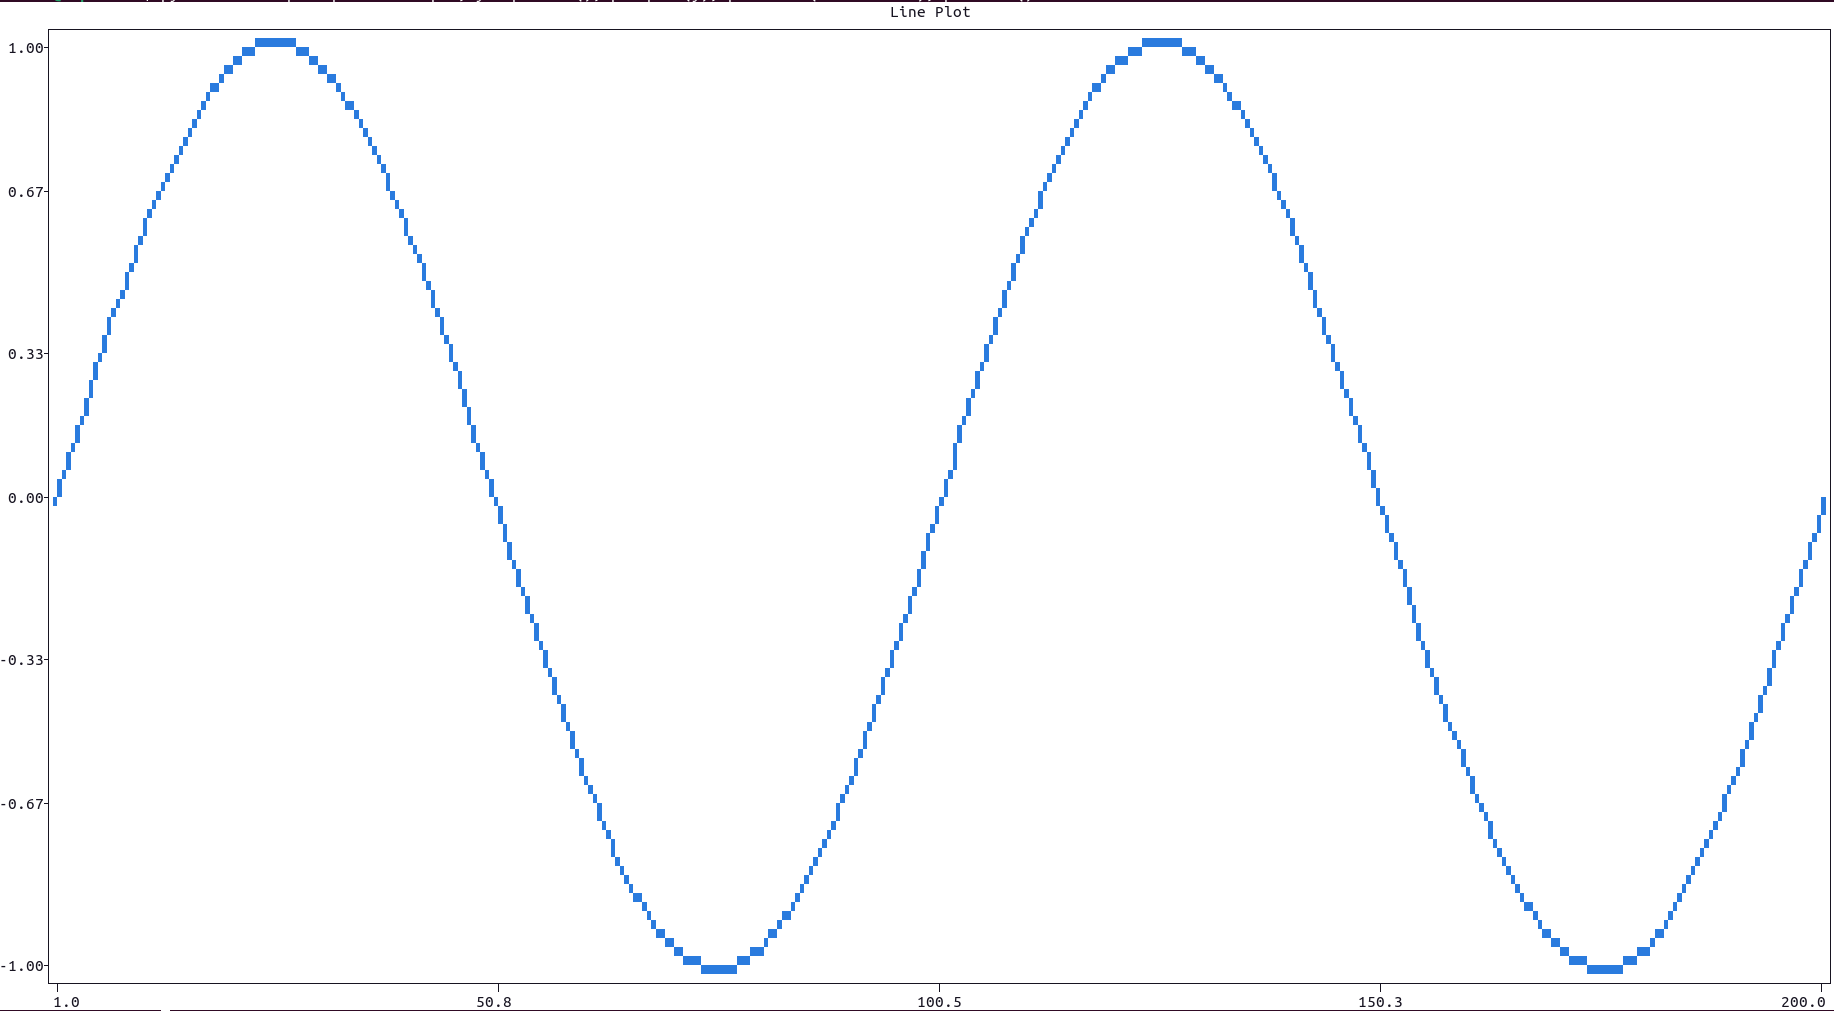
96 |
97 | More documentation can be accessed with `doc.plot()`.
98 |
99 | [Main Guide](https://github.com/piccolomo/plotext#guide), [Basic Plots](https://github.com/piccolomo/plotext/blob/master/readme/basic.md#basic-plots)
100 |
101 | ## Log Plot
102 |
103 | For a logarithmic plot use the the `xscale("log")` or `yscale("log")` methods:
104 |
105 | - `xscale()` accepts the parameter `xside` to independently set the scale on each `x` axis , `"lower"` or `"upper"` (in short `1` or `2`).
106 | - Analogously `yscale()` accepts the parameter `yside` to independently set the scale on each `y` axis , `"left"` or `"right"` (in short `1` or `2`).
107 | - The log function used is `math.log10`.
108 |
109 | Here is an example:
110 |
111 | ```python
112 | import plotext as plt
113 |
114 | l = 10 ** 4
115 | y = plt.sin(periods = 2, length = l)
116 |
117 | plt.plot(y)
118 |
119 | plt.xscale("log") # for logarithmic x scale
120 | plt.yscale("linear") # for linear y scale
121 | plt.grid(0, 1) # to add vertical grid lines
122 |
123 | plt.title("Logarithmic Plot")
124 | plt.xlabel("logarithmic scale")
125 | plt.ylabel("linear scale")
126 |
127 | plt.show()
128 | ```
129 |
130 | or directly on terminal:
131 |
132 | ```console
133 | python3 -c "import plotext as plt; l = 10 ** 4; y = plt.sin(periods = 2, length = l); plt.plot(y); plt.xscale('log'); plt.yscale('linear'); plt.grid(0, 1); plt.title('Logarithmic Plot'); plt.xlabel('logarithmic scale'); plt.ylabel('linear scale'); plt.show();"
134 | ```
135 |
136 | 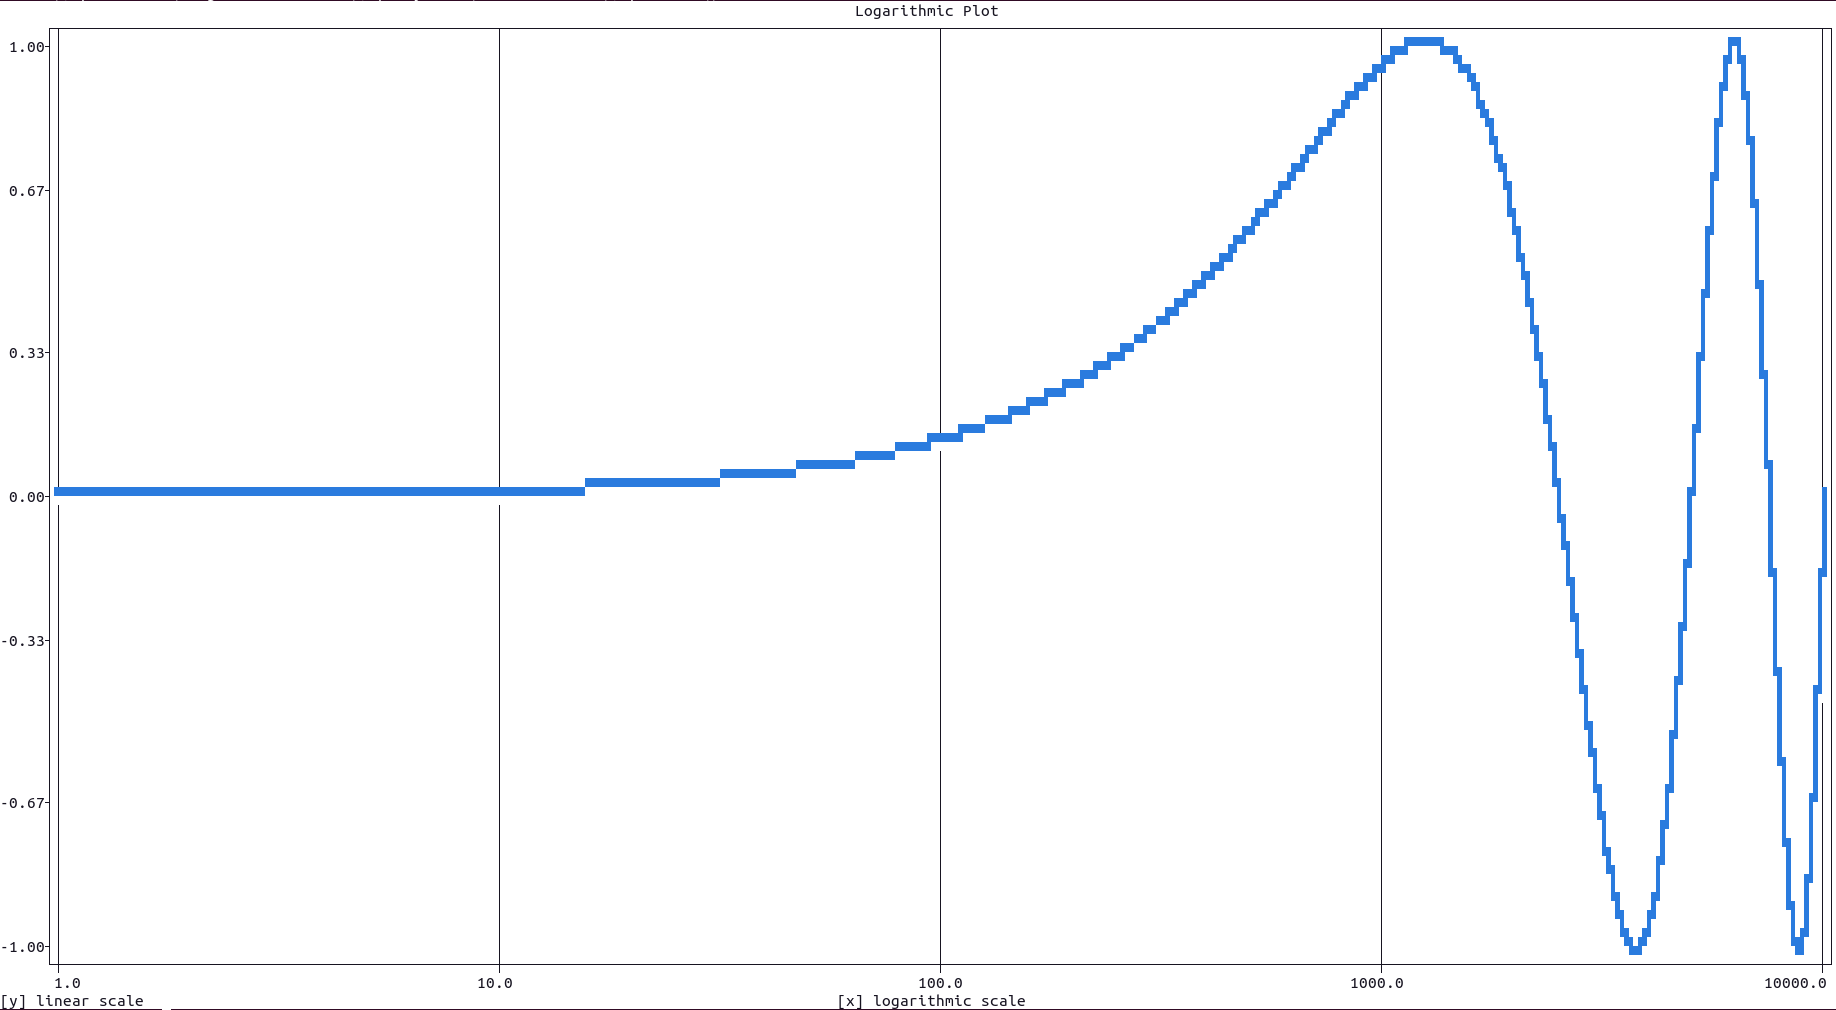
137 |
138 | More documentation is available with `doc.xscale()` or `doc.yscale()` .
139 |
140 | [Main Guide](https://github.com/piccolomo/plotext#guide), [Basic Plots](https://github.com/piccolomo/plotext/blob/master/readme/basic.md#basic-plots)
141 |
142 | ## Stem Plot
143 |
144 | For a [stem plot](https://matplotlib.org/stable/gallery/lines_bars_and_markers/stem_plot.html) use either the `fillx` or `filly` parameters (available for most plotting functions), in order to fill the canvas with data points till the `y = 0` or `x = 0` level, respectively.
145 |
146 | If a numerical value is passed to the `fillx` or `filly` parameters, it is intended as the `y` or `x` level respectively, where the filling should stop. If the string value `"internal"` is passed instead, the filling will stop when another data point is reached respectively vertically or horizontally (if it exists).
147 |
148 | Here is an example:
149 |
150 | ```python
151 | import plotext as plt
152 | y = plt.sin()
153 | plt.plot(y, fillx = True)
154 | plt.title("Stem Plot")
155 | plt.show()
156 | ```
157 |
158 | or directly on terminal:
159 |
160 | ```console
161 | python3 -c "import plotext as plt; y = plt.sin(); plt.plot(y, fillx = True); plt.title('Stem Plot'); plt.show()"
162 | ```
163 |
164 | 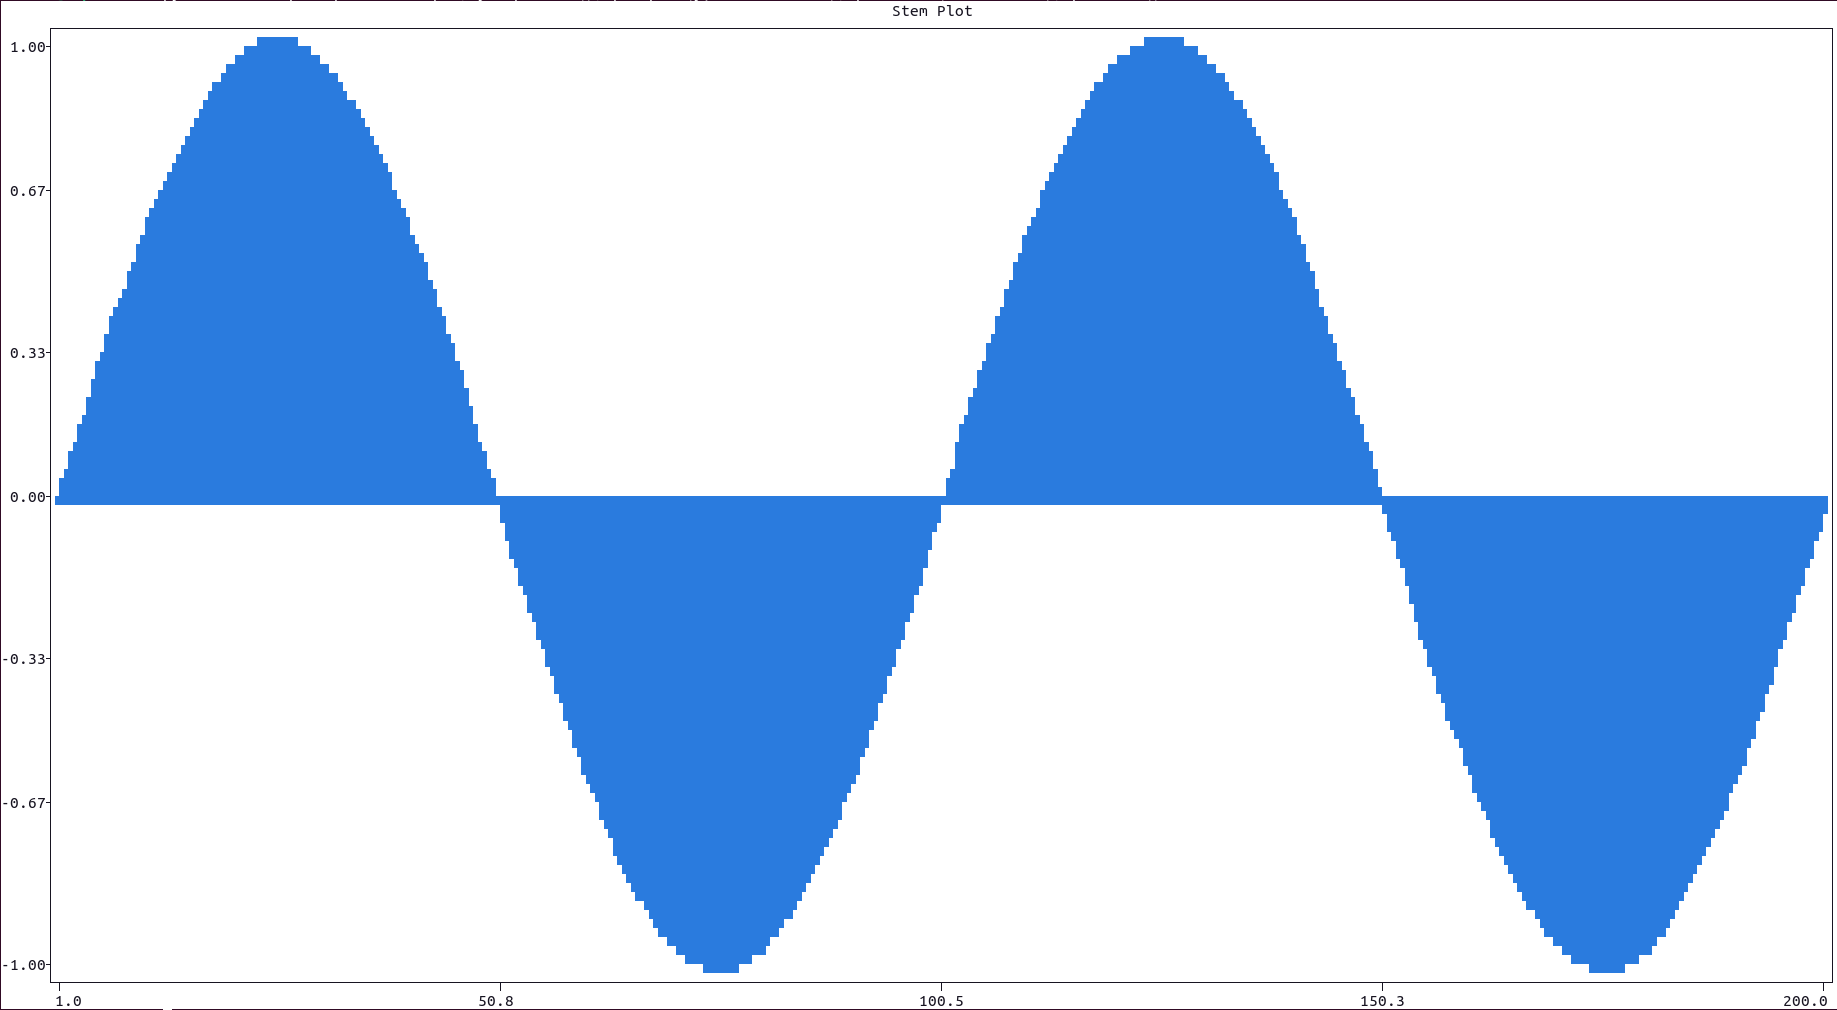
165 | [Main Guide](https://github.com/piccolomo/plotext#guide), [Basic Plots](https://github.com/piccolomo/plotext/blob/master/readme/basic.md#basic-plots)
166 |
167 | ## Multiple Data Sets
168 |
169 | Multiple data sets can be plotted using consecutive plotting functions. The `label` parameter, available in most plotting function, is used to add an entry in the **plot legend**, shown in the upper left corner of the plot canvas.
170 |
171 | Here is an example:
172 |
173 | ```python
174 | import plotext as plt
175 |
176 | y1 = plt.sin()
177 | y2 = plt.sin(phase = -1)
178 |
179 | plt.plot(y1, label = "plot")
180 | plt.scatter(y2, label = "scatter")
181 |
182 | plt.title("Multiple Data Set")
183 | plt.show()
184 | ```
185 |
186 | or directly on terminal:
187 |
188 | ```console
189 | python3 -c "import plotext as plt; y1 = plt.sin(); y2 = plt.sin(phase = -1); plt.plot(y1, label = 'plot'); plt.scatter(y2, label = 'scatter'); plt.title('Multiple Data Set'); plt.show()"
190 | ```
191 |
192 | 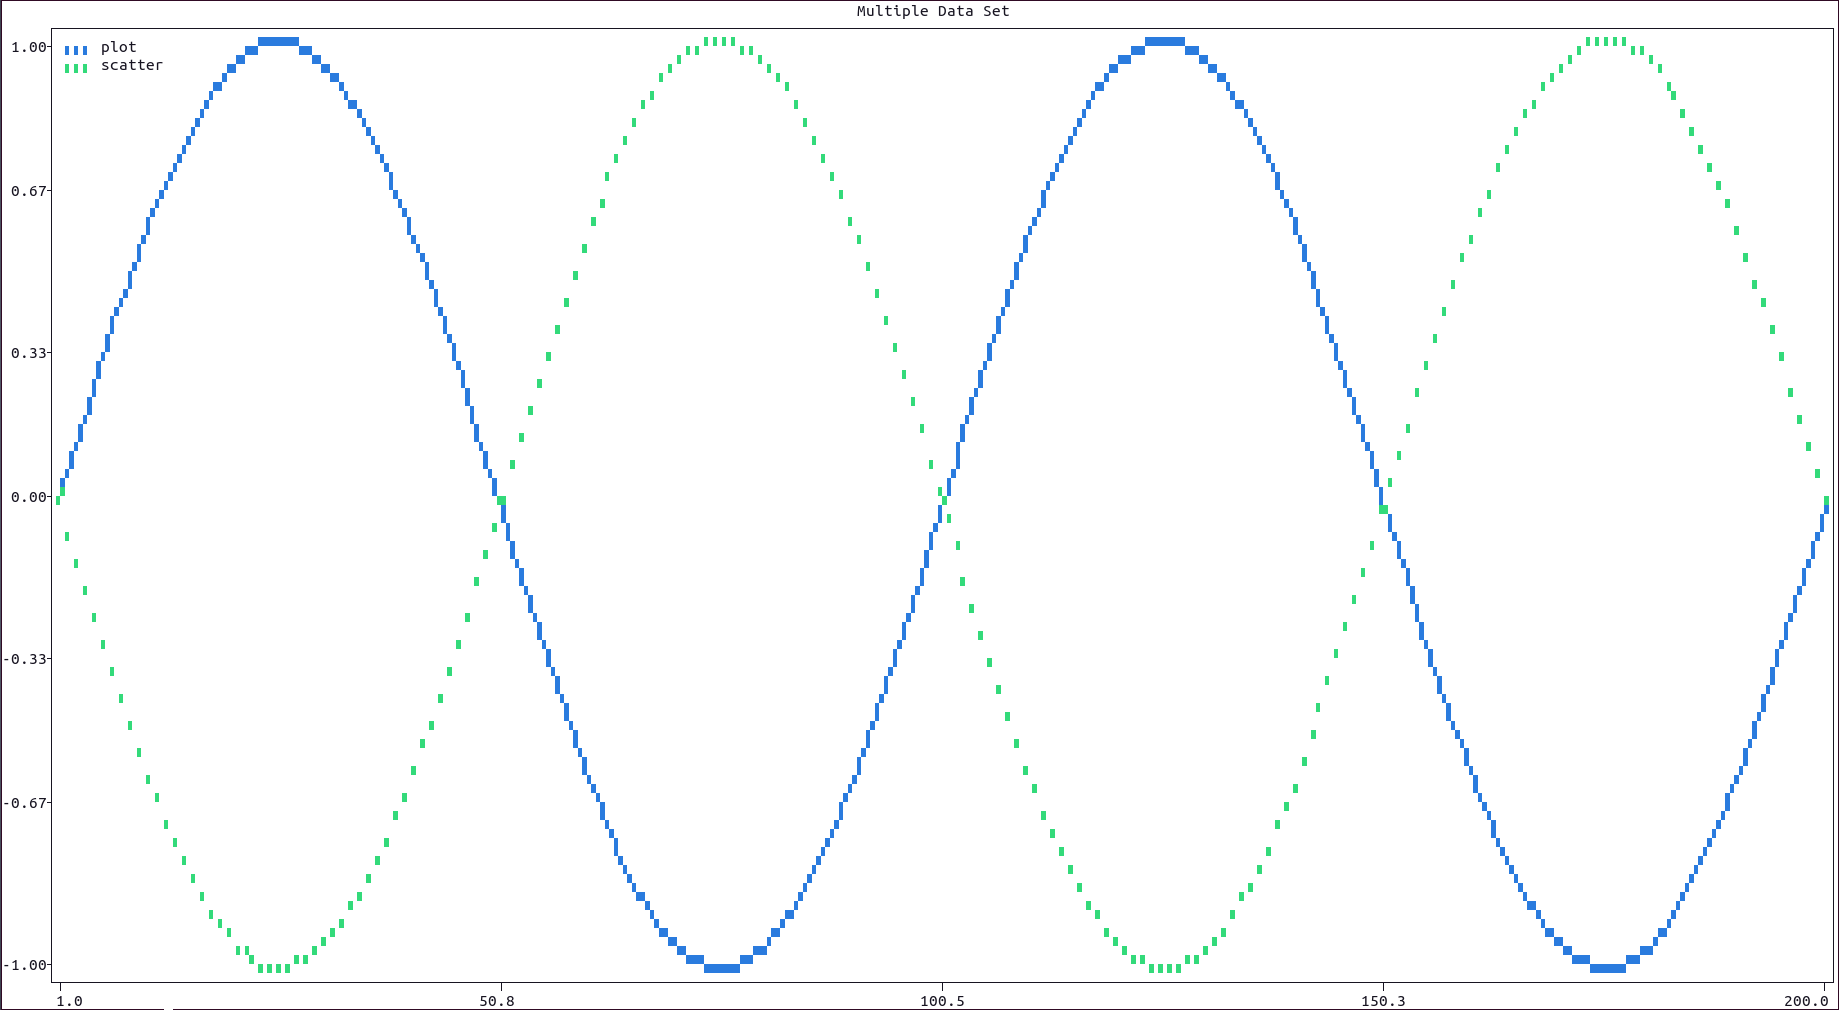
193 |
194 | [Main Guide](https://github.com/piccolomo/plotext#guide), [Basic Plots](https://github.com/piccolomo/plotext/blob/master/readme/basic.md#basic-plots)
195 |
196 | ## Multiple Axes Plot
197 |
198 | Data could be plotted on the lower or upper `x` axis, as well as on the left or right `y` axis, using respectively the `xside` and `yside` parameters of most plotting functions.
199 |
200 | On the left side of each legend entry, a symbol is introduce to easily identify on which couple of axes the data has been plotted to: its interpretation should be intuitive.
201 |
202 | Here is an example:
203 |
204 | ```python
205 | import plotext as plt
206 |
207 | y1 = plt.sin()
208 | y2 = plt.sin(2, phase = -1)
209 |
210 | plt.plot(y1, xside = "lower", yside = "left", label = "lower left")
211 | plt.plot(y2, xside = "upper", yside = "right", label = "upper right")
212 |
213 | plt.title("Multiple Axes Plot")
214 | plt.show()
215 | ```
216 |
217 | or directly on terminal:
218 |
219 | ```console
220 | python3 -c "import plotext as plt; y1 = plt.sin(); y2 = plt.sin(2, phase = -1); plt.plot(y1, xside = 'lower', yside = 'left', label = 'lower left'); plt.plot(y2, xside = 'upper', yside = 'right', label = 'upper right'); plt.title('Multiple Axes Plot'); plt.show()"
221 | ```
222 |
223 | 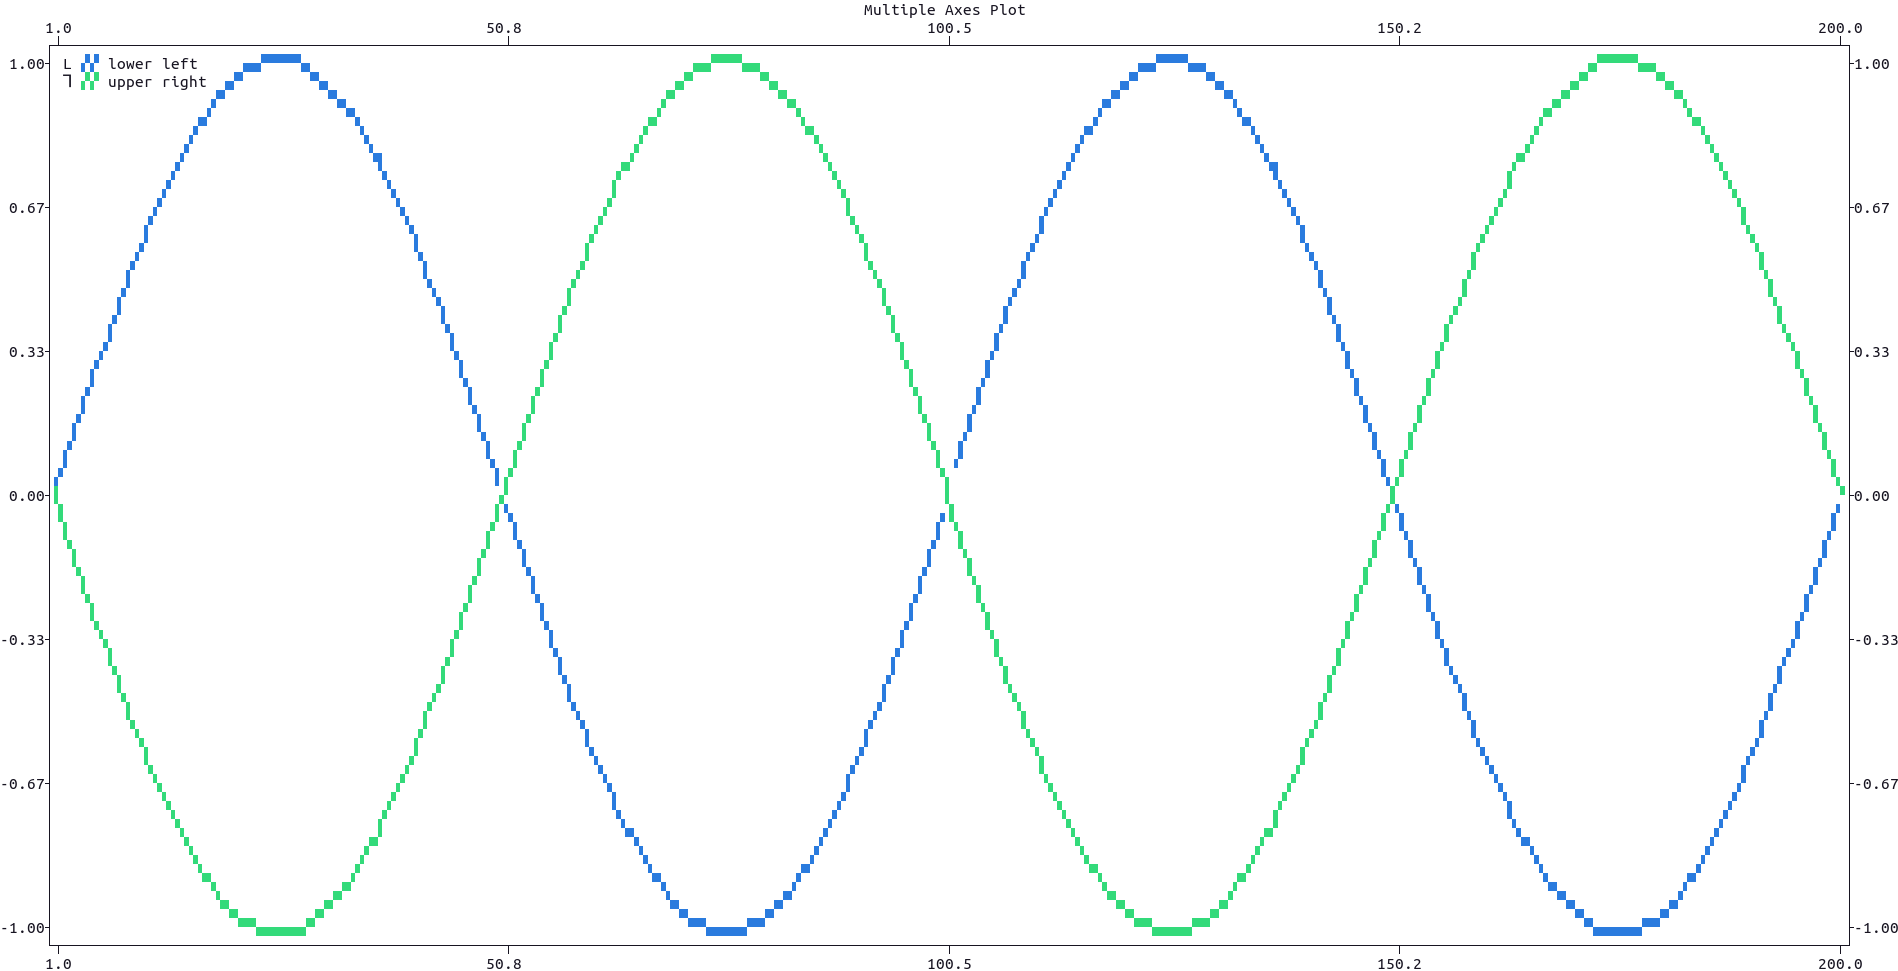
224 |
225 | [Main Guide](https://github.com/piccolomo/plotext#guide), [Basic Plots](https://github.com/piccolomo/plotext/blob/master/readme/basic.md#basic-plots)
--------------------------------------------------------------------------------
/readme/datetime.md:
--------------------------------------------------------------------------------
1 | # Datetime Plots
2 |
3 | - [Introduction](https://github.com/piccolomo/plotext/blob/master/readme/datetime.md#introduction)
4 | - [Datetime Plot](https://github.com/piccolomo/plotext/blob/master/readme/datetime.md#datetime-plot)
5 | - [Candlestick Plot](https://github.com/piccolomo/plotext/blob/master/readme/datetime.md#candlestick-plot)
6 |
7 | [Main Guide](https://github.com/piccolomo/plotext#guide)
8 |
9 | ## Introduction
10 |
11 | * Plotting dates or times simply requires passing a list of date-time string objects (such as `"01/01/2000"`, `"12:30:32"` or `"01/01/2000 12:30:32"`) to the plotting functions.
12 |
13 | * To control how `plotext` interprets string as date-time objects use the `date_form()` method, where you can change its:
14 |
15 | * `input_form` parameter to control the form of date-time strings inputted by the user,
16 |
17 | * `output_form` parameter to control the form of date-time strings outputted by `plotext` (by default equal to `input_form`), including outputted axes date-time ticks.
18 |
19 | * The date-time string forms are [the standard ones](https://docs.python.org/3/library/datetime.html#strftime-and-strptime-format-codes), with the `%` symbol removed for simplicity; eg: `d/m/Y` (by default), or `d/m/Y H:M:S`.
20 |
21 | * If needed, most of the functions that follow allow to optionally set their input and output forms independently, with their correspondent parameters, overwriting the `date_form()` settings.
22 | - To get today in `datetime` or string form use `today_datetime()` and `today_string()` respectively.
23 |
24 | - To turn a `datetime` object into a string use `datetime_to_string()` or `datetimes_to_strings()` for a list instead.
25 |
26 | - To turn a string into a `datetime` object use `string_to_datetime()`.
27 |
28 | - To turn a string to a numerical time-stamp use `string_to_time()` and `strings_to_time()` for a list of strings.
29 |
30 | - The method `set_time0()` sets the origin of time to the string provided; this function is useful in `log` scale, in order to avoid *hitting* the 0 time-stamp.
31 |
32 | [Main Guide](https://github.com/piccolomo/plotext#guide), [Datetime Menu](https://github.com/piccolomo/plotext/blob/master/readme/datetime.md#datetime-plots)
33 |
34 | ## Datetime Plot
35 |
36 | To plot dates and/or times use either `plt.scatter()` or `plt.plot()` functions directly.
37 |
38 | Here is an example, which requires the package `yfinance`:
39 |
40 | ```python
41 | import yfinance as yf
42 | import plotext as plt
43 |
44 | plt.date_form('d/m/Y')
45 |
46 | start = plt.string_to_datetime('11/04/2022')
47 | end = plt.today_datetime()
48 | data = yf.download('goog', start, end)
49 |
50 | prices = list(data["Close"])
51 | dates = plt.datetimes_to_string(data.index)
52 |
53 | plt.plot(dates, prices)
54 |
55 | plt.title("Google Stock Price")
56 | plt.xlabel("Date")
57 | plt.ylabel("Stock Price $")
58 | plt.show()
59 | ```
60 |
61 | or directly on terminal:
62 |
63 | ```console
64 | python3 -c "import yfinance as yf; import plotext as plt; plt.date_form('d/m/Y'); start = plt.string_to_datetime('11/04/2022'); end = plt.today_datetime(); data = yf.download('goog', start, end); prices = list(data['Close']); dates = plt.datetimes_to_string(data.index); plt.plot(dates, prices); plt.title('Google Stock Price'); plt.xlabel('Date'); plt.ylabel('Stock Price $'); plt.show()"
65 | ```
66 |
67 | 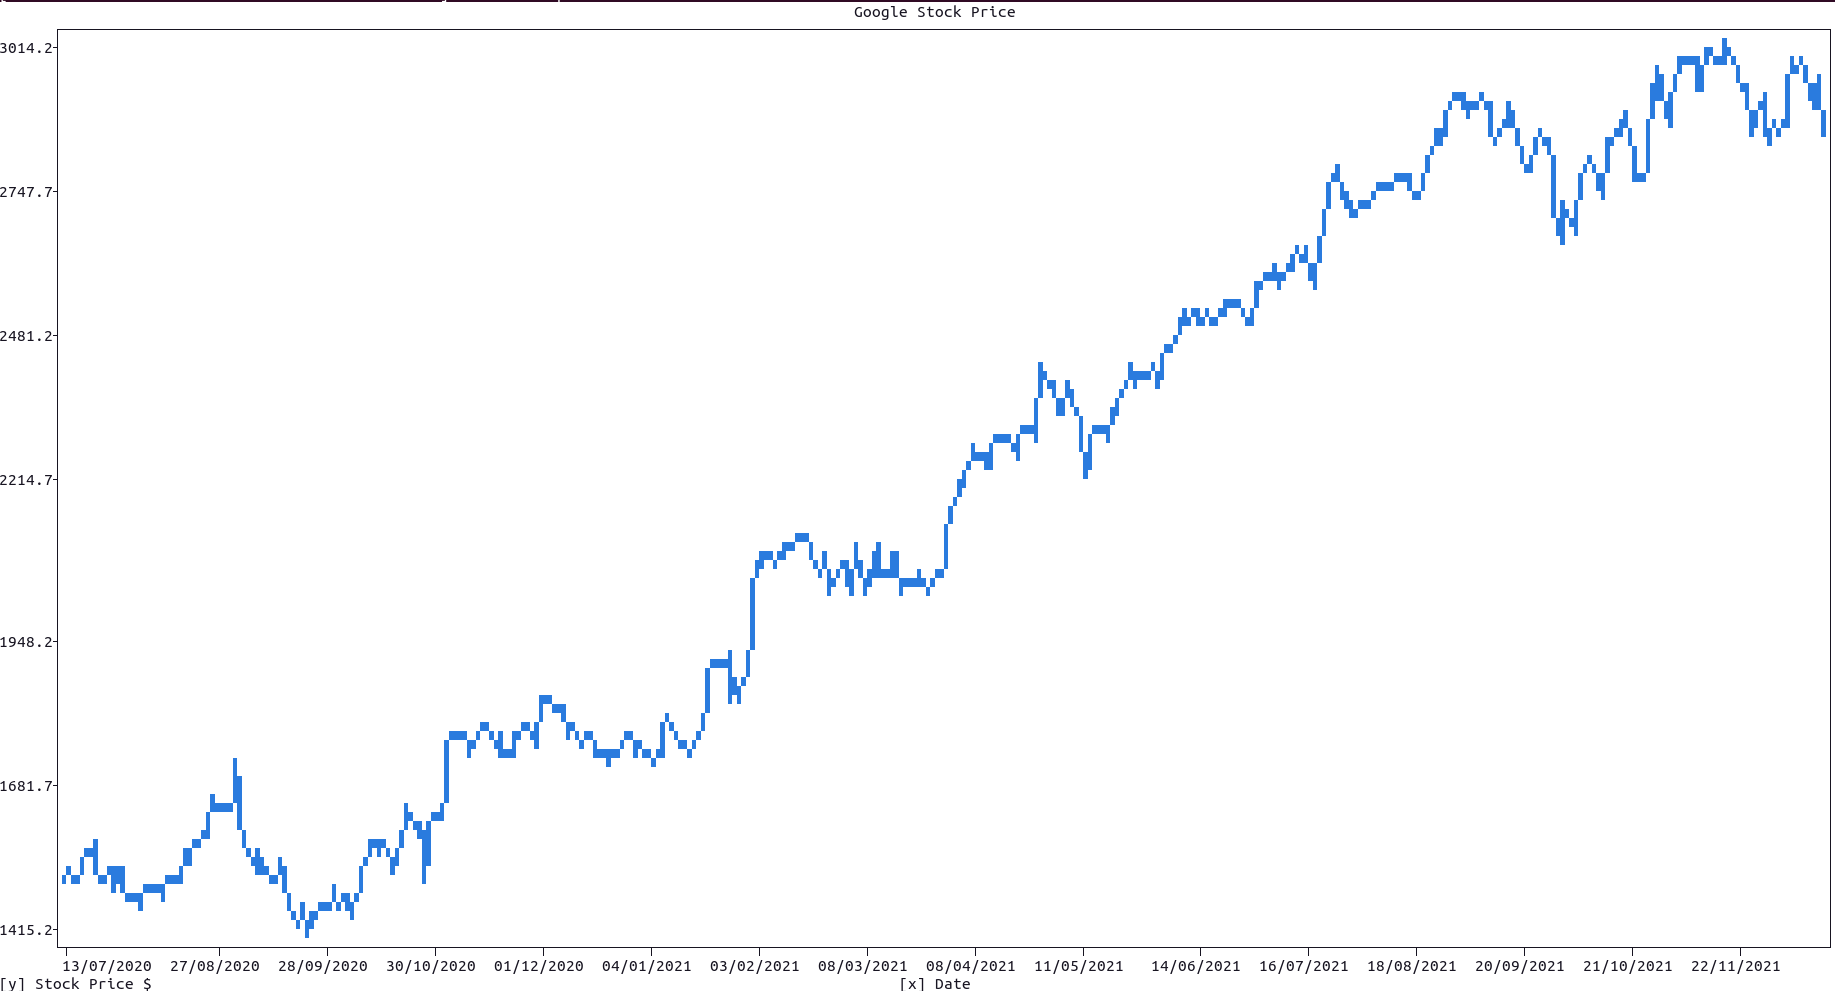
68 |
69 | Note that you could easily add [text](https://github.com/piccolomo/plotext/blob/master/readme/decorator.md#text-plot) and [lines](https://github.com/piccolomo/plotext/blob/master/readme/decorator.md#plot-lines) to the plot, as date-time string coordinates are allowed in most plotting functions.
70 |
71 | [Main Guide](https://github.com/piccolomo/plotext#guide), [Datetime Menu](https://github.com/piccolomo/plotext/blob/master/readme/datetime.md#datetime-plots)
72 |
73 | ## Candlestick Plot
74 |
75 | For this kind of plot, use the function `candlestick()`, which requires a list of date-time strings and a dictionary with the following `'Open'`, `'Close'`, `'High'`, and `'Low'` mandatory keys, and where each correspondent value is a list of prices.
76 |
77 | Here is an example, which requires the package `yfinance`:
78 |
79 | ```python
80 | import yfinance as yf
81 | import plotext as plt
82 |
83 | plt.date_form('d/m/Y')
84 |
85 | start = plt.string_to_datetime('11/04/2022')
86 | end = plt.today_datetime()
87 | data = yf.download('goog', start, end)
88 |
89 | dates = plt.datetimes_to_string(data.index)
90 |
91 | plt.candlestick(dates, data)
92 |
93 | plt.title("Google Stock Price CandleSticks")
94 | plt.xlabel("Date")
95 | plt.ylabel("Stock Price $")
96 | plt.show()
97 | ```
98 |
99 | or directly on terminal:
100 |
101 | ```console
102 | python3 -c "import yfinance as yf; import plotext as plt; plt.date_form('d/m/Y'); start = plt.string_to_datetime('11/04/2022'); end = plt.today_datetime(); data = yf.download('goog', start, end); dates = plt.datetimes_to_string(data.index); plt.candlestick(dates, data); plt.title('Google Stock Price Candlesticks'); plt.xlabel('Date'); plt.ylabel('Stock Price $'); plt.show()"
103 | ```
104 |
105 | 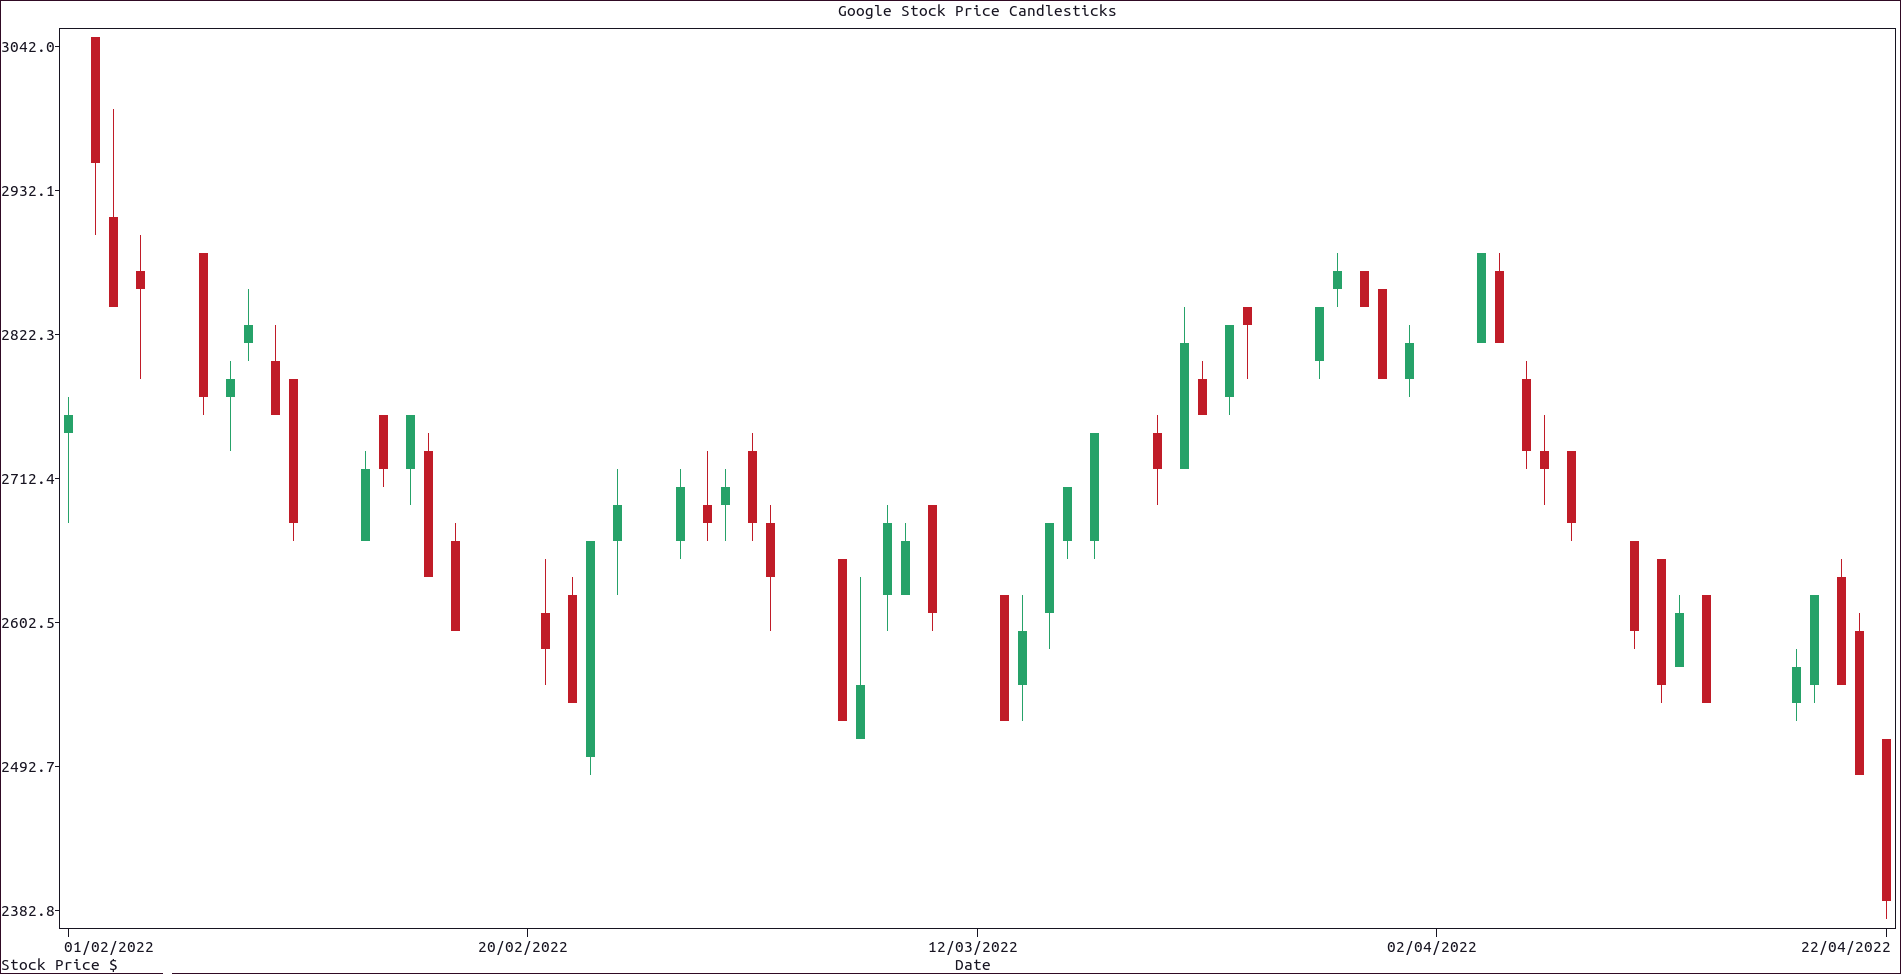
106 |
107 | More documentation can be accessed with `doc.candlestick()`.
108 |
109 | [Main Guide](https://github.com/piccolomo/plotext#guide), [Datetime Menu](https://github.com/piccolomo/plotext/blob/master/readme/datetime.md#datetime-plots)
110 |
--------------------------------------------------------------------------------
/readme/decorator.md:
--------------------------------------------------------------------------------
1 | # Decorator Plots
2 |
3 | - [Line Plot](https://github.com/piccolomo/plotext/blob/master/readme/decorator.md#line-plot)
4 | - [Text Plot](https://github.com/piccolomo/plotext/blob/master/readme/decorator.md#text-plot)
5 | - [Indicator](https://github.com/piccolomo/plotext/blob/master/readme/decorator.md#indicator)
6 | - [Shape Plot](https://github.com/piccolomo/plotext/blob/master/readme/decorator.md#shape-plot)
7 |
8 | [Main Guide](https://github.com/piccolomo/plotext#guide)
9 |
10 | ## Line Plot
11 |
12 | To plot extra vertical or horizontal lines use the `horizontal_line()` or `vertical_line()` methods (in short `hline()` and `vline()` respectively). Note that both methods accept as coordinates date-time strings, if the plot allows it.
13 |
14 | ```python
15 | import plotext as plt
16 | y = plt.sin()
17 | plt.scatter(y)
18 | plt.title("Extra Lines")
19 | plt.vline(100, "magenta")
20 | plt.hline(0.5, "blue+")
21 | plt.plotsize(100, 30)
22 | plt.show()
23 | ```
24 |
25 | or directly on terminal:
26 |
27 | ```console
28 | python3 -c "import plotext as plt; y = plt.sin(); plt.scatter(y); plt.title('Extra Lines'); plt.vline(100, 'magenta'); plt.hline(0.5, 'blue+'); plt.plotsize(100, 30); plt.show()"
29 | ```
30 |
31 | 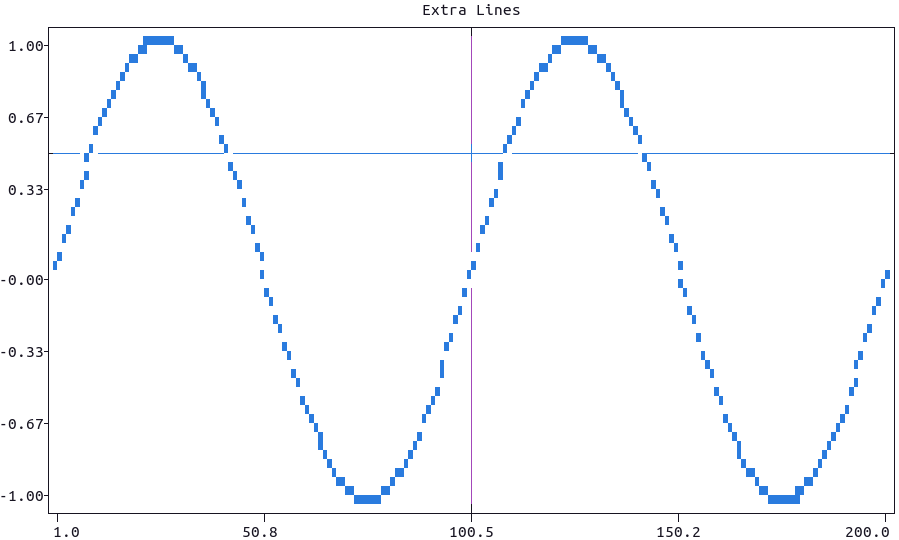
32 |
33 | More documentation can be accessed with `doc.vertical_line()` and `doc.horizontal_line()`.
34 |
35 | [Main Guide](https://github.com/piccolomo/plotext#guide), [Decorator Plots](https://github.com/piccolomo/plotext/blob/master/readme/decorator.md)
36 |
37 | ## Text Plot
38 |
39 | To add text to the plot at certain `x` and `y` coordinates use the `text()` function which, if needed, accepts date-time strings as coordinates.
40 |
41 | Here is how to use it for a labelled bar plot:
42 |
43 | ```python
44 | import plotext as plt
45 |
46 | pizzas = ["Sausage", "Pepperoni", "Mushrooms", "Cheese", "Chicken", "Beef"]
47 | percentages = [14, 36, 11, 8, 7, 4]
48 |
49 | plt.bar(pizzas, percentages)
50 | plt.title("Labelled Bar Plot using Text()")
51 |
52 | [plt.text(pizzas[i], x = i + 1, y = percentages[i] + 1.5, alignment = 'center', color = 'red') for i in range(len(pizzas))]
53 | plt.ylim(0, 38)
54 | plt.plotsize(100, 30)
55 | plt.show()
56 | ```
57 |
58 | or directly on terminal:
59 |
60 | ```console
61 | python3 -c "import plotext as plt; pizzas = ['Sausage', 'Pepperoni', 'Mushrooms', 'Cheese', 'Chicken', 'Beef']; percentages = [14, 36, 11, 8, 7, 4]; plt.bar(pizzas, percentages); plt.title('Labelled Bar Plot using Text()'); [plt.text(pizzas[i], x = i + 1, y = percentages[i] + 1.5, alignment = 'center', color = 'red') for i in range(len(pizzas))]; plt.ylim(0, 38); plt.plotsize(100, 30); plt.show()"
62 | ```
63 |
64 | 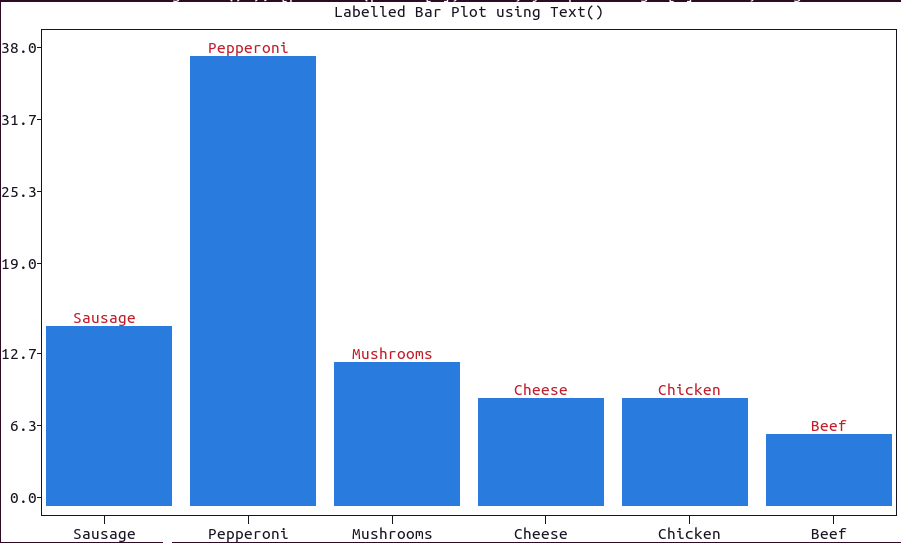
65 |
66 | More documentation can be accessed with `doc.text()`.
67 |
68 | [Main Guide](https://github.com/piccolomo/plotext#guide), [Decorator Plots](https://github.com/piccolomo/plotext/blob/master/readme/decorator.md)
69 |
70 | ## Indicator
71 |
72 | To add a simple label + value indicator to, for example, a matrix of plots, use the function `indicator(value, label)`.
73 |
74 | - Note that both `label` and `value` could be numerical or in string form.
75 | - The `color` and `style` of the plot could be changed using the correspondent parameters.
76 |
77 | Here is a basic example:
78 |
79 | ```python
80 | import plotext as plt
81 | plt.indicator(45.3, 'Price')
82 | plt.plotsize(30, 10)
83 | plt.show()
84 | ```
85 |
86 | or directly on terminal:
87 |
88 | ```console
89 | python3 -c "import plotext as plt; plt.indicator(45.3, 'Price'); plt.plotsize(30, 10); plt.show()"
90 | ```
91 |
92 | 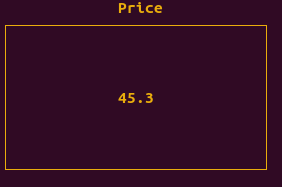
93 |
94 | More documentation can be accessed with `doc.indicator()`.
95 |
96 | [Main Guide](https://github.com/piccolomo/plotext#guide), [Decorator Plots](https://github.com/piccolomo/plotext/blob/master/readme/decorator.md)
97 |
98 | ## Shape Plot
99 |
100 | To add shapes to a plot use the `rectangle()` or `polygon()` functions.
101 |
102 | - The dimensions and position of each shape could be changed using its `x` and `y` parameters (for both rectangles and polygons), `sides` and `radius` (for polygons only).
103 | - A circle could be simulated by a polygon with high `sides`.
104 | - The `radius` parameter is the distance of the polygon vertices to its center: for a simulated circle this corresponds to its actual radius, hence the name.
105 | - The aspect of the shapes could be changed with the `lines` and `fill` parameters, to plot lines between the vertices (as by default) and fill the shape with colored markers (`False` by default),
106 |
107 | Here is an example:
108 |
109 | ```python
110 | import plotext as plt
111 | plt.title('Shapes')
112 | plt.polygon()
113 | plt.rectangle()
114 | plt.polygon(sides = 100) # to simulate a circle
115 | plt.show()
116 | ```
117 |
118 | or directly on terminal:
119 |
120 | ```console
121 | python3 -c "import plotext as plt; plt.clf(); plt.title('Shapes'); plt.polygon(); plt.rectangle(); plt.polygon(sides = 100); plt.show()"
122 | ```
123 |
124 | 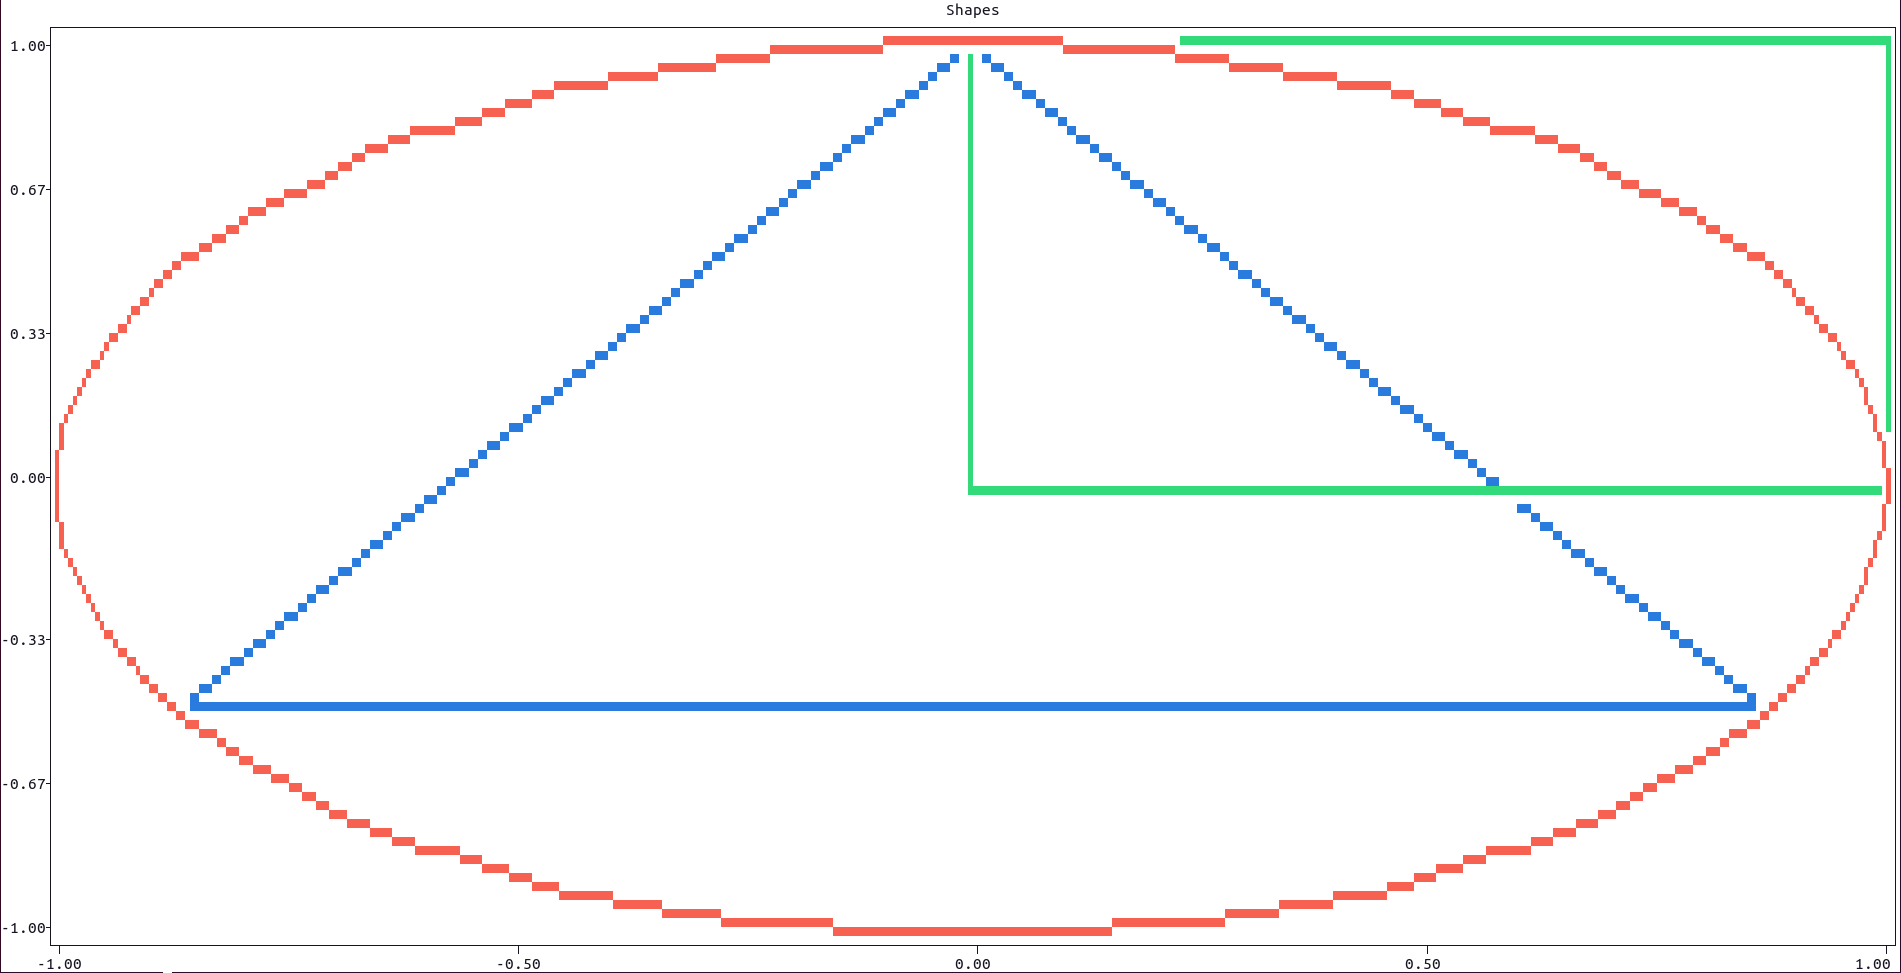
125 |
126 | More documentation can be accessed with `doc.rectangle()` and `doc.polygon()`.
127 |
128 | [Main Guide](https://github.com/piccolomo/plotext#guide), [Decorator Plots](https://github.com/piccolomo/plotext/blob/master/readme/decorator.md)
129 |
--------------------------------------------------------------------------------
/readme/environments.md:
--------------------------------------------------------------------------------
1 | # Environments
2 |
3 | - [Matplotlib](https://github.com/piccolomo/plotext/blob/master/readme/environments.md#matplotlib)
4 | - [Rich](https://github.com/piccolomo/plotext/blob/master/readme/environments.md#rich)
5 | - [Tkinter](https://github.com/piccolomo/plotext/blob/master/readme/environments.md#tkinter)
6 |
7 | [Main Guide](https://github.com/piccolomo/plotext#guide)
8 |
9 | ## Matplotlib
10 |
11 | To automatically transform a `matplotlib` plot into a `plotext` one use the function `from_matplotlib()`. Here is an example:
12 |
13 | ```python
14 | import matplotlib.pyplot as plt
15 | import plotext as plx
16 |
17 | y = plx.sin(); ym = [-el for el in y]
18 | x = range(len(y))
19 |
20 | plt.clf()
21 | plt.subplot(211)
22 | plt.plot(x, y, color = 'red')
23 | plt.title('Some Smart Title')
24 | plt.xlabel('here is a label')
25 |
26 |
27 | plt.subplot(212)
28 | plt.plot(x, ym, color = 'green')
29 | plt.ylabel('the y axis')
30 |
31 | plt.show(block = 0)
32 |
33 | fig = plt.gcf()
34 |
35 | plx.from_matplotlib(fig)
36 | plx.show()
37 | ```
38 |
39 | 
40 |
41 | These feature is under development: please report any bug or development idea.
42 |
43 | [Main Guide](https://github.com/piccolomo/plotext#guide), [Environments](https://github.com/piccolomo/plotext/blob/master/readme/environments.md)
44 |
45 | ## Rich
46 |
47 | The integration with the package `rich` has been discussed in [issue 26](https://github.com/piccolomo/plotext/issues/26) and [issue 27](https://github.com/piccolomo/plotext/issues/27). Thanks to the kind help of its creator `@willmcgugan`, as well as the user `@whisller`, it seems that the following code could be a good working template:
48 |
49 | ```python
50 | from rich.layout import Layout
51 | from rich.live import Live
52 | from rich.ansi import AnsiDecoder
53 | from rich.console import Group
54 | from rich.jupyter import JupyterMixin
55 | from rich.panel import Panel
56 | from rich.text import Text
57 |
58 | from time import sleep
59 | import plotext as plt
60 |
61 | def make_plot(width, height, phase = 0, title = ""):
62 | plt.clf()
63 | l, frames = 1000, 30
64 | x = range(1, l + 1)
65 | y = plt.sin(periods = 2, length = l, phase = 2 * phase / frames)
66 | plt.scatter(x, y, marker = "fhd")
67 | plt.plotsize(width, height)
68 | plt.xaxes(1, 0)
69 | plt.yaxes(1, 0)
70 | plt.title(title)
71 | plt.theme('dark')
72 | plt.ylim(-1, 1)
73 | #plt.cls()
74 | return plt.build()
75 |
76 | class plotextMixin(JupyterMixin):
77 | def __init__(self, phase = 0, title = ""):
78 | self.decoder = AnsiDecoder()
79 | self.phase = phase
80 | self.title = title
81 |
82 | def __rich_console__(self, console, options):
83 | self.width = options.max_width or console.width
84 | self.height = options.height or console.height
85 | canvas = make_plot(self.width, self.height, self.phase, self.title)
86 | self.rich_canvas = Group(*self.decoder.decode(canvas))
87 | yield self.rich_canvas
88 |
89 | def make_layout():
90 | layout = Layout(name="root")
91 | layout.split(
92 | Layout(name="header", size=1),
93 | Layout(name="main", ratio=1),
94 | )
95 | layout["main"].split_column(
96 | Layout(name="static", ratio = 1),
97 | Layout(name="dynamic"),
98 | )
99 | return layout
100 |
101 | layout = make_layout()
102 |
103 | header = layout['header']
104 | title = plt.colorize("Pl✺ text ", "cyan+", "bold") + "integration with " + plt.colorize("rich_", style = "dim")
105 | header.update(Text(title, justify = "left"))
106 |
107 | static = layout["static"]
108 | phase = 0
109 | mixin_static = Panel(plotextMixin(title = "Static Plot"))
110 | static.update(mixin_static)
111 |
112 | dynamic = layout["dynamic"]
113 |
114 | with Live(layout, refresh_per_second=0.0001) as live:
115 | while True:
116 | phase += 1
117 | mixin_dynamic = Panel(plotextMixin(phase, "Dynamic Plot"))
118 | dynamic.update(mixin_dynamic)
119 | #sleep(0.001)
120 | live.refresh()
121 | ```
122 |
123 | 
124 |
125 | [Main Guide](https://github.com/piccolomo/plotext#guide), [Environments](https://github.com/piccolomo/plotext/blob/master/readme/environments.md)
126 |
127 | ## Tkinter
128 |
129 | The integration with the package `tkinter` has been discussed in [Issue 33](https://github.com/piccolomo/plotext/issues/33). Thanks to the great inputs from user `@gregwa1953`, here is an initial take on it, where a test image is downloaded in the home folder, visualized and finally removed:
130 |
131 | ```python
132 | import tkinter as tk
133 | import plotext as plt
134 | from plotext._utility import to_rgb, uncolorize
135 | import tkinter.font as tkfont
136 |
137 | image_path = 'cat.jpg'
138 |
139 | #font_name = "SourceCodePro" # this results in wrong plot dimensioms
140 | #font_name = "MonoSpace"
141 | font_name = "UbuntuMono"
142 | font_size = 13 # font size of application labels
143 | font_size_plot = 25 # font size of plot
144 |
145 | font = font_name + " " + str(font_size)
146 | stick_horizontal = tk.W + tk.E
147 | stick_all = tk.E + tk.W + tk.N + tk.S
148 | padx, pady = 2, 2
149 | frame_color = "gray85"
150 | nocommand = lambda: int
151 |
152 | def frame(parent, row = 0, col = 0, stick = stick_horizontal):
153 | frame = tk.Frame(parent, background = frame_color, relief = 'groove', bd = 0)
154 | frame.config(highlightthickness = 0, highlightbackground = frame_color)
155 | frame.grid(row = row, column = col, sticky = stick, padx = padx, pady = pady)
156 | return frame
157 |
158 | def button(parent, label = "button", row = 0, col = 0, command = nocommand):
159 | button = tk.Button(parent, text = label, font = font, command = command, relief = "raised", state = "normal", background = frame_color)
160 | button.grid(row = row, column = col, padx = padx, pady = pady)
161 | return button
162 |
163 | def text(parent, width, height, font = None):
164 | text = tk.Text(parent, font = font, width = width, height = height, wrap = tk.NONE)
165 | text.grid(row = 0, column = 0, stick = stick_all)
166 | return text
167 |
168 | def scale(parent, row = 0 , col = 0):
169 | scale = tk.Scale(parent, from_= 2, to = 30, orient = tk.HORIZONTAL, font = font, length = 300)
170 | scale.set(font_size_plot)
171 | scale.grid(row = row, column = col, padx = padx, pady = pady)
172 | return scale
173 |
174 | def from_rgb(rgb): # translates an rgb tuple of int to a tkinter friendly color code
175 | return "#%02x%02x%02x" % rgb
176 | #r, g, b = rgb
177 | #return f'#{r:02x}{g:02x}{b:02x}'
178 |
179 | class window():
180 | def __init__(self):
181 | self.root = tk.Tk()
182 | self.root.resizable(True, True)
183 | self.root.title("Plotext in Tkinter")
184 | self.root.option_add('*Font', font)
185 | self.root.geometry('%dx%d+0+0' % (self.root.winfo_screenwidth(), self.root.winfo_screenheight()))
186 | #self.root.geometry('%dx%d+0+0' % (300, 300))
187 | self.root.columnconfigure(0, weight = 1)
188 | self.root.rowconfigure(1, weight = 1)
189 |
190 | self.upper_frame = frame(self.root, row = 0)
191 | self.lower_frame = frame(self.root, row = 1, stick = stick_all)
192 |
193 | self.plot_button = button(self.upper_frame, label = "Plot ", command = self.plot_command, col = 0)
194 | self.scale = scale(self.upper_frame, col = 1)
195 | self.save_button = button(self.upper_frame, label = "Save", command = self.save_command, col = 2)
196 | self.close_button = button(self.upper_frame, label = "Close", command = self.close_command, col = 3)
197 |
198 | self.clear_command()
199 | self.root.mainloop()
200 |
201 | def clear_command(self):
202 | for widgets in self.lower_frame.winfo_children():
203 | widgets.destroy()
204 |
205 | def save_command(self):
206 | plt.savefig("plot.html")
207 |
208 | def close_command(self):
209 | self.root.destroy()
210 |
211 | def plot_command(self):
212 | self.plot_button.config(state = "disabled", relief = "sunken")
213 | self.scale.config(state = "disabled")
214 | self.clear_command()
215 | self.get_plot_size()
216 |
217 | self.plotext_command()
218 | self.add_plot()
219 | self.add_colors()
220 |
221 | self.plot_button.config(state = "normal", relief = "raised")
222 | self.scale.config(state = "normal")
223 |
224 | def get_plot_size(self):
225 | self.root.update()
226 | size = self.lower_frame.winfo_width(), self.lower_frame.winfo_height()
227 | font_size = self.scale.get()
228 | self.font_plot = tkfont.Font(family = font_name, size = font_size)
229 | font_size = self.font_plot.measure('m'), self.font_plot.metrics('linespace') # in pixels
230 | size = [size[i] / font_size[i] for i in range(2)]
231 | size = list(map(int, size))
232 | self.cols, self.rows = self.size = size
233 |
234 | def plotext_command(self):
235 | plt.clf()
236 | plt.limitsize(False, False)
237 | plt.plotsize(*self.size)
238 | plt.image_plot(image_path, fast = False)
239 | plt.frame(False)
240 | plt.build()
241 | #plt.show()
242 |
243 | def add_plot(self):
244 | # Add Colorless Plot
245 | #self.rows, self.cols = plt.figure.monitor.matrix.size
246 | #plt.figure.monitor.matrix.update_size()
247 | self.plot_text = text(self.lower_frame, self.cols, self.rows, font = self.font_plot)
248 | self.canvas = plt._global.figure.monitor.matrix.canvas
249 | self.canvas = uncolorize(self.canvas)
250 | self.plot_text.insert("end", self.canvas)
251 | self.plot_text.update()
252 |
253 | def add_colors(self): # Add Colors to Plot
254 | self.color = plt._global.figure.monitor.matrix.fullground[::-1]
255 | self.background = plt._global.figure.monitor.matrix.background[::-1]
256 | tag = lambda r, c: str(r) + "*" + str(c)
257 | coord = lambda r, c: str(r + 1) + "." + str(c)
258 | for r in range(self.rows):
259 | for c in range(self.cols):
260 | fg = from_rgb(to_rgb(self.color[r][c]))
261 | bg = from_rgb(to_rgb(self.background[r][c]))
262 | self.plot_text.tag_add(tag(r, c), coord(r, c))
263 | self.plot_text.tag_config(tag(r, c), foreground = fg, background = bg)
264 | self.plot_text.update()
265 | self.plot_text.update()
266 |
267 | if __name__ == '__main__':
268 | plt.download(plt.test_image_url, image_path)
269 | gui = window()
270 | plt.delete_file(image_path)
271 | ```
272 |
273 | which outputs:
274 |
275 | 
276 |
277 | - Using the `scale` slider one can change the font size; lower font size makes the final plot bigger, which requires more computational time.
278 |
279 | - The `Save` button saves the plots as an `html` file in the user home folder.
280 |
281 | [Main Guide](https://github.com/piccolomo/plotext#guide), [Environments](https://github.com/piccolomo/plotext/blob/master/readme/environments.md)
--------------------------------------------------------------------------------
/readme/image.md:
--------------------------------------------------------------------------------
1 | # Image Plots
2 |
3 | - [Image Plot](https://github.com/piccolomo/plotext/blob/master/readme/image.md#image-plot)
4 | - [GIF Plot](https://github.com/piccolomo/plotext/blob/master/readme/image.md#gif-plot)
5 |
6 | [Main Guide](https://github.com/piccolomo/plotext#guide)
7 |
8 | ## Image Plot
9 |
10 | To plot an image use the `image_plot(path)` function.
11 |
12 | - It is recommended to use the `plotsize()` method before `image_plot()`, especially for larger images, to initially reduce the image size and so the computational load.
13 |
14 | - To plot much faster set the `fast` parameter to `True`. In this case, the plot dimensions will be locked to the whatever size was previously chosen, and won't adapt to the terminal or subplot size; also any setting method which follows will not have any effect (like `xlabel()`, `frame()` and so on).
15 |
16 | - A curious visual effect is obtained using for example `marker = list("CuteCat")` with `style = 'inverted'`: try it out! :-)
17 |
18 | - Use the parameter `grayscale` to plot in gray-scale.
19 |
20 | - To easily manipulate file paths, use the tools described in [this section](https://github.com/piccolomo/plotext/blob/master/readme/utilities.md#file-utilities).
21 |
22 | - To plot images **beyond the terminal size** use the function `plt.limit_size()`, described [here](https://github.com/piccolomo/plotext/blob/master/readme/settings.md#plot-size), or the app developed [here](https://github.com/piccolomo/plotext/blob/master/readme/environments.md#tkinter), using `tkinter`.
23 |
24 | - To save the result **in colors**, as an `html` page, use the function `plt.savefig()`, described [here](https://github.com/piccolomo/plotext/blob/master/readme/utilities.md#useful-functions).
25 |
26 | In this example, a [test image](https://raw.githubusercontent.com/piccolomo/plotext/master/data/cat.jpg) is downloaded in the home folder, visualized and finally removed:
27 |
28 | ```python
29 | import plotext as plt
30 | path = 'cat.jpg'
31 | plt.download(plt.test_image_url, path)
32 | plt.image_plot(path)
33 | plt.title("A very Cute Cat")
34 | plt.show()
35 | plt.delete_file(path)
36 | ```
37 |
38 | or directly on terminal:
39 |
40 | ```console
41 | python3 -c "import plotext as plt; path = 'cat.jpg'; plt.download(plt.test_image_url, path); plt.image_plot(path); plt.title('A very Cute Cat'); plt.show(); plt.delete_file(path)"
42 | ```
43 |
44 | 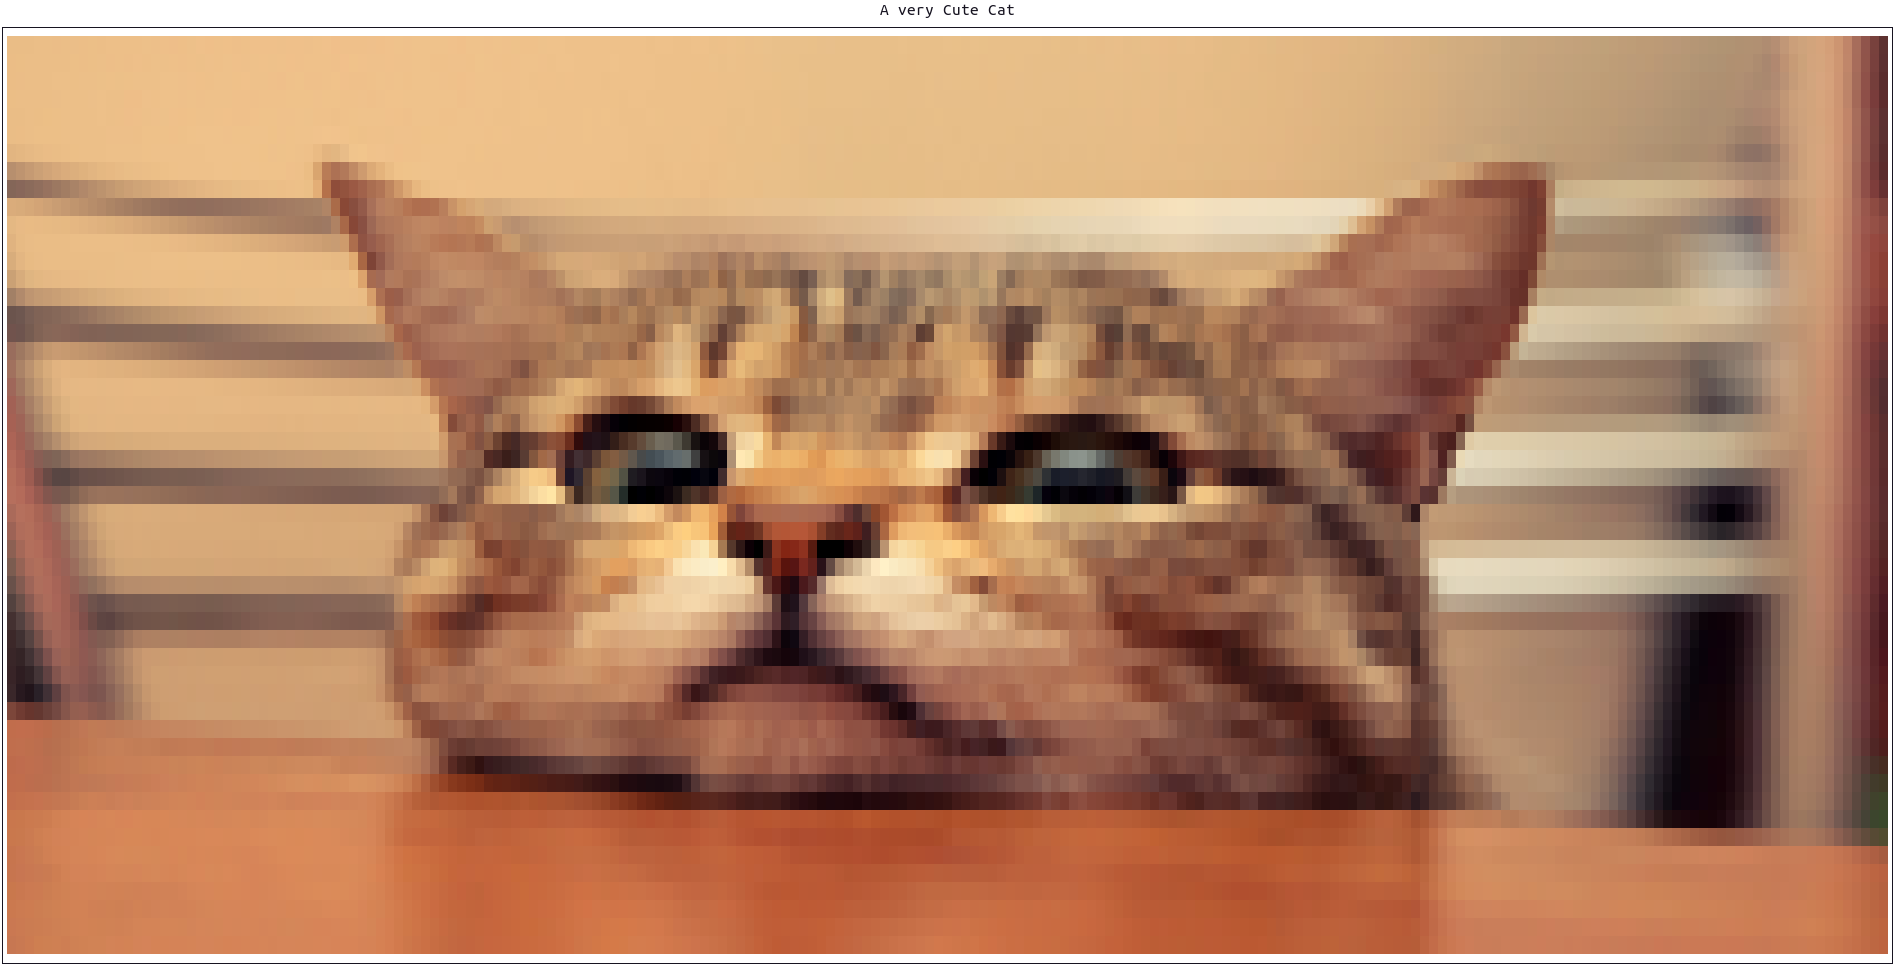
45 |
46 | More documentation can be accessed with `doc.image_plot()`.
47 |
48 | [Main Guide](https://github.com/piccolomo/plotext#guide), [Image Plots](https://github.com/piccolomo/plotext/blob/master/readme/image.md#image-plots)
49 |
50 | ## GIF Plot
51 |
52 | To render a GIF image use the function `play_gif(path)`. Note that the function `show()` is not necessary in this case, as it is called internally.
53 |
54 | In this example, a [test GIF](https://raw.githubusercontent.com/piccolomo/plotext/master/data/homer.gif) is downloaded in the home folder, visualized and finally removed:
55 |
56 | ```python
57 | import plotext as plt
58 | path = 'homer.gif'
59 | plt.download(plt.test_gif_url, path)
60 | plt.play_gif(path)
61 | plt.delete_file(path)
62 | ```
63 |
64 | or directly on terminal:
65 |
66 | ```console
67 | python3 -c "import plotext as plt; path = 'homer.gif'; plt.download(plt.test_gif_url, path); plt.play_gif(path); plt.show(); plt.delete_file(path)"
68 | ```
69 |
70 | which will play the following GIF on terminal:
71 |
72 | 
73 |
74 | More documentation can be accessed with `doc.play_gif()`.
75 |
76 | [Main Guide](https://github.com/piccolomo/plotext#guide), [Image Plots](https://github.com/piccolomo/plotext/blob/master/readme/image.md#image-plots)
--------------------------------------------------------------------------------
/readme/settings.md:
--------------------------------------------------------------------------------
1 | # Plot Settings
2 |
3 | - [Plot Size](https://github.com/piccolomo/plotext/blob/master/readme/settings.md#plot-size)
4 | - [Plot Limits](https://github.com/piccolomo/plotext/blob/master/readme/settings.md#plot-limits)
5 | - [Axes Ticks](https://github.com/piccolomo/plotext/blob/master/readme/settings.md#axes-ticks)
6 |
7 | [Main Guide](https://github.com/piccolomo/plotext#guide)
8 |
9 | ## Plot Size
10 |
11 | By default the plot size adapts to the dimensions of the terminal. To change this behavior, use the following methods:
12 |
13 | - `plot_size()` to set the **plot size** to the desired `width` and `height`, in units of character dimensions.
14 |
15 | - `limit_size()` to set, whatever or not, to **limit the plot size to the terminal dimensions**. It requires to Boolean (one for each dimension) and it is only available for the main figure and not for its subplots, if present, and should be used before `plot_size()`. The plot size are limited by the terminal dimensions, by default.
16 |
17 | - In a matrix of subplot, the final widths / heights will be the same for each column / row and, by default, their *maximum* is taken. If `take_min()` is called, the *minimum* is considered instead. This method is available to any subplot, including the main figure.
18 |
19 | Here are some other useful functions:
20 |
21 | - `terminal_size()`, in short `ts()`, returns the width and height of the terminal.
22 |
23 | - `terminal_width()`, in short `tw()`, returns the width of the terminal.
24 |
25 | - `terminal_height()`, in short `th()`, returns the height of the terminal.
26 |
27 | [Main Guide](https://github.com/piccolomo/plotext#guide), [Plot Settings](https://github.com/piccolomo/plotext/blob/master/readme/settings.md)
28 |
29 | ## Plot Limits
30 |
31 | The plot limits, on each axes, are set automatically; to set them manually you can use the following functions:
32 |
33 | - `xlim()` to set the `left` and `right` limits on the x axis; use the `xside` parameter, to address a specific x axis, `lower` or `upper`, `1` or `2` in short.
34 |
35 | - `ylim()` to set the `lower` and `upper` limits on the y axis; use the `yside` parameter, to address a specific y axis, `left` or `right`, `1` or `2` in short.
36 |
37 | [Main Guide](https://github.com/piccolomo/plotext#guide), [Plot Settings](https://github.com/piccolomo/plotext/blob/master/readme/settings.md)
38 |
39 | ## Axes Ticks
40 |
41 | To change the numerical ticks on the x axis, you could use one of the following functions:
42 |
43 | - `xfrequency()` to set the numerical ticks frequency on the x axis: the actual ticks will be evaluated automatically.
44 |
45 | - `xticks()` to manually sets to x `ticks` provided; if two lists are provided, the second is intended as the list of string `labels` to be placed at the coordinates provided by the first.
46 |
47 | - To change the direction of the x axes use the `xreverse()` function.
48 |
49 | - In all cases, the parameter `xside` is used to address a specific x axis, `lower` or `upper`, `1`or`2` in short.
50 |
51 | - Naturally, the functions used to specify the ticks on the y axis, are `yfrequency()`, `yticks()` and `yreverse()` and they behave similarly. In all cases, to address a specific y axis, set the parameter `yside` to `left` or `right`, `1` or `2` in short.
52 |
53 | Here is a coded example:
54 |
55 | ```python
56 | import plotext as plt
57 | l, p = 300, 2
58 | plt.plot(plt.sin(length = l, periods = p), label = "My Signal")
59 | plt.plotsize(100, 30)
60 | plt.title('Some Smart Title')
61 | plt.xlabel('Time')
62 | plt.ylabel('Movement')
63 | plt.ticks_color('red')
64 | plt.ticks_style('bold')
65 | plt.xlim(-l//10, l + l//10)
66 | plt.ylim(-1.5, 1.5)
67 | xticks = [l * i / (2 * p) for i in range(2 * p + 1)]
68 | xlabels = [str(i) + "π" for i in range(2 * p + 1)]
69 | plt.xticks(xticks, xlabels)
70 | plt.yfrequency(5)
71 | plt.show()
72 | ```
73 |
74 | or directly on terminal:
75 |
76 | ```console
77 | python3 -c "import plotext as plt; l, p = 300, 2; plt.plot(plt.sin(length = l, periods = p), label = 'My Signal'); plt.plotsize(100, 30); plt.title('Some Smart Title'); plt.xlabel('Time'); plt.ylabel('Movement'); plt.ticks_color('red'); plt.ticks_style('bold'); plt.xlim(-l//10, l + l//10); plt.ylim(-1.5, 1.5); xticks = [l * i / (2 * p) for i in range(2 * p + 1)]; xlabels = [str(i) + 'π' for i in range(2 * p + 1)]; plt.xticks(xticks, xlabels); plt.yfrequency(5); plt.show()"
78 | ```
79 |
80 | 
81 |
82 | More documentation is available in the correspondent doc-strings.
83 |
84 | [Main Guide](https://github.com/piccolomo/plotext#guide), [Plot Settings](https://github.com/piccolomo/plotext/blob/master/readme/settings.md)
--------------------------------------------------------------------------------
/readme/special.md:
--------------------------------------------------------------------------------
1 | # Special Plots
2 |
3 | - [Error Plot](https://github.com/piccolomo/plotext/blob/master/readme/special.md#error-plot)
4 | - [Event Plot](https://github.com/piccolomo/plotext/blob/master/readme/special.md#event-plot)
5 | - [Streaming Data](https://github.com/piccolomo/plotext/blob/master/readme/special.md#streaming-data)
6 | - [Confusion Matrix](https://github.com/piccolomo/plotext/blob/master/readme/special.md#confusion-matrix)
7 | - [Matrix Plot](https://github.com/piccolomo/plotext/blob/master/readme/special.md#matrix-plot)
8 | - [Heatmap](https://github.com/piccolomo/plotext/blob/master/readme/special.md#heatmap-plot)
9 |
10 | [Main Guide](https://github.com/piccolomo/plotext#guide)
11 |
12 | ## Error Plot
13 |
14 | To plot data with error bars, along either or both the `x` and `y` axes use the `error()` function as in this example:
15 |
16 | ```python
17 | import plotext as plt
18 | from random import random
19 | l = 20
20 | n = 1
21 | ye = [random() * n for i in range(l)]; xe = [random() * n for i in range(l)]
22 | y = plt.sin(length = l);
23 | plt.error(y, xerr = xe, yerr = ye)
24 | plt.title('Error Plot')
25 | plt.show()
26 | ```
27 |
28 | or directly on terminal:
29 |
30 | ```console
31 | python3 -c "import plotext as plt; plt.clf(); from random import random; l = 20; n = 1; ye = [random() * n for i in range(l)]; xe = [random() * n for i in range(l)]; y = plt.sin(length = l); plt.error(y, xerr = xe, yerr = ye); plt.title('Error Plot'); plt.show();"
32 | ```
33 |
34 | 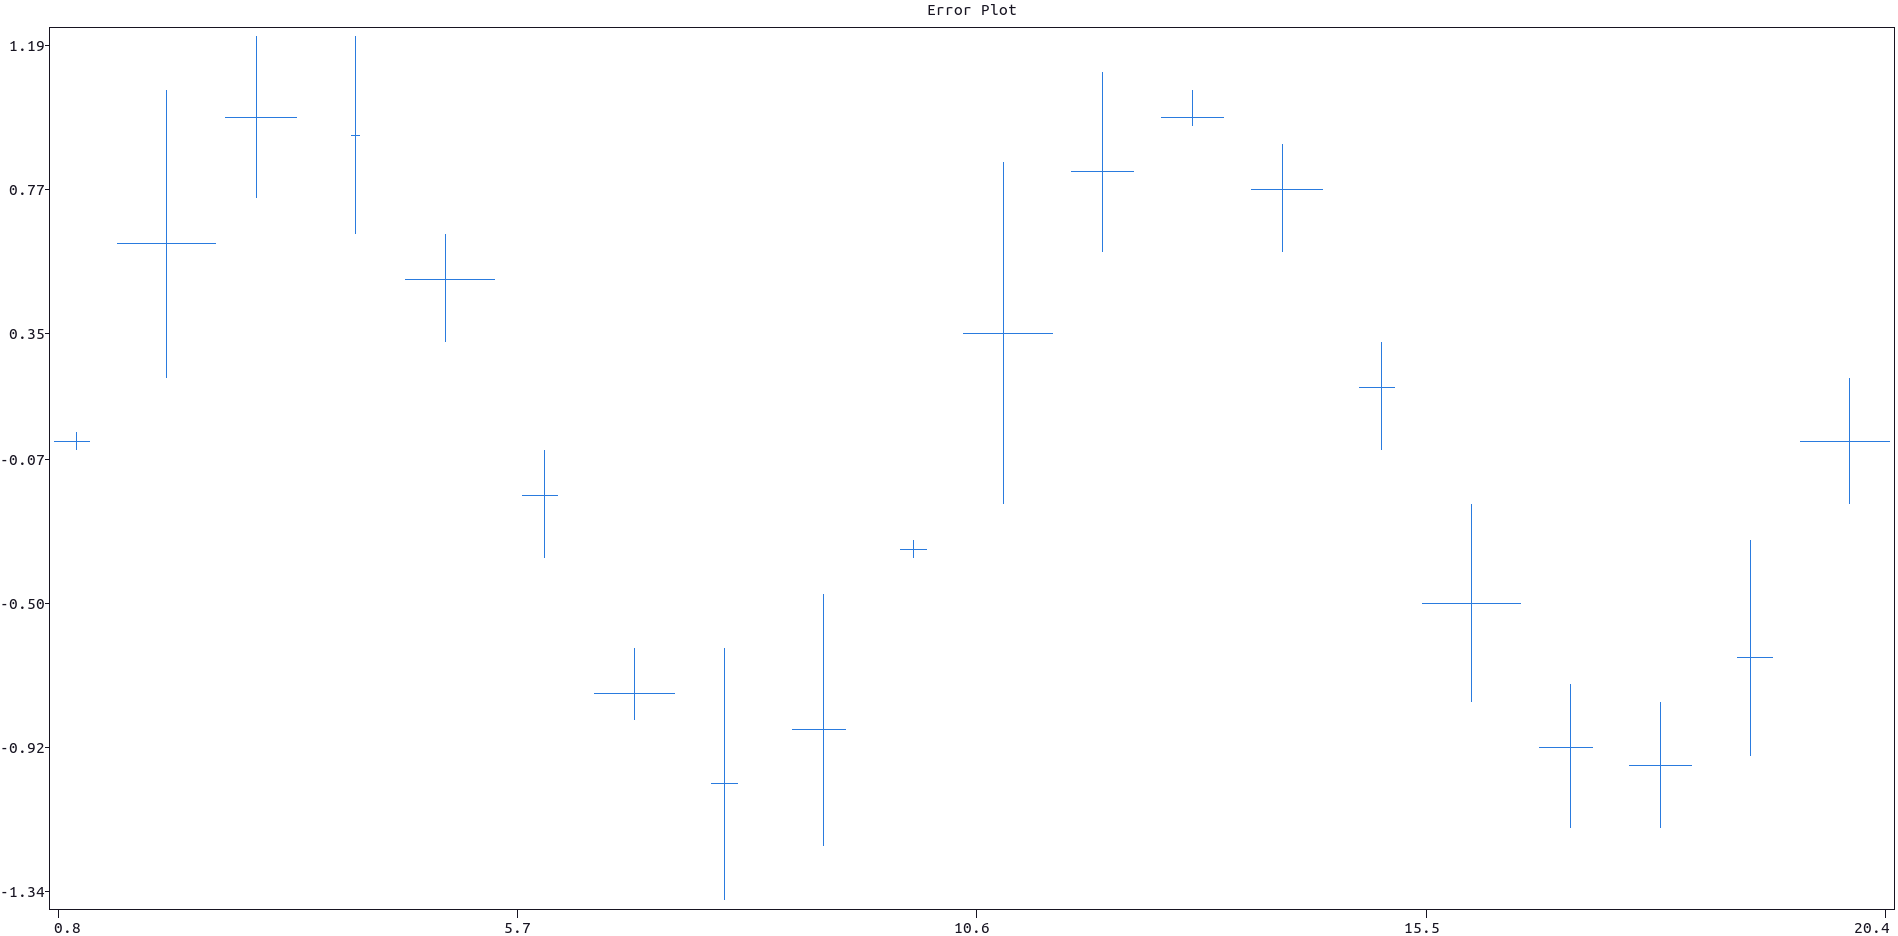
35 |
36 | More documentation can be accessed with `doc.error()`.
37 |
38 | [Main Guide](https://github.com/piccolomo/plotext#guide), [Special Plots](https://github.com/piccolomo/plotext/blob/master/readme/special.md)
39 |
40 | ## Event Plot
41 |
42 | To signal the timing of certain events the `event_plot()` function could be of use. Here is an example:
43 |
44 | ```python
45 | import plotext as plt
46 | from random import randint
47 | from datetime import datetime, timedelta
48 |
49 | plt.date_form("H:M") # also just "H" looks ok
50 |
51 | times = [datetime(2022, 3, 27, randint(0, 23), randint(0, 59), randint(0, 59)) for i in range(100)] # A random list of times during the day
52 | times = plt.datetimes_to_string(times)
53 |
54 | plt.plotsize(None, 20) # Set the preferred height or comment for maximum size
55 |
56 | plt.event_plot(times)
57 |
58 | plt.show()
59 | ```
60 |
61 | or directly on terminal:
62 |
63 | ```console
64 | python3 -c "import plotext as plt; from random import randint; from datetime import datetime, timedelta; plt.date_form('H:M'); times = [datetime(2022, 3, 27, randint(0, 23), randint(0, 59), randint(0, 59)) for i in range(100)]; times = plt.datetimes_to_string(times); plt.plotsize(None, 20); plt.event_plot(times); plt.show()"
65 | ```
66 |
67 | 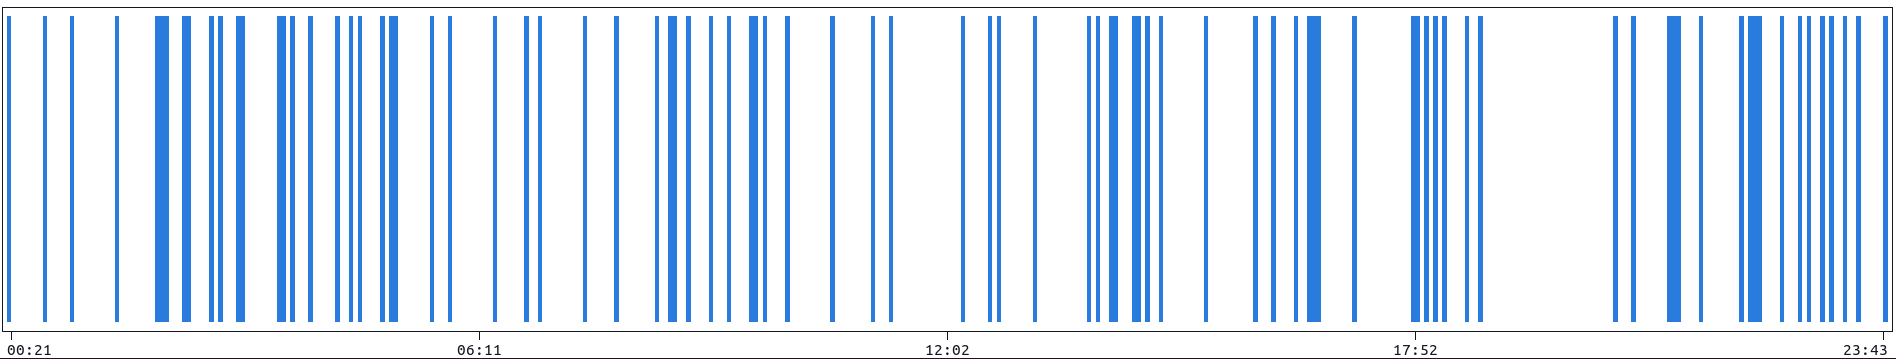
68 |
69 | More documentation can be accessed with `doc.event_plot()`.
70 |
71 | [Main Guide](https://github.com/piccolomo/plotext#guide), [Special Plots](https://github.com/piccolomo/plotext/blob/master/readme/special.md)
72 |
73 | ## Streaming Data
74 |
75 | When streaming a continuous flow of data, consider using the `sleep()` method, to reduce a possible screen flickering, and the clearing methods described [here](https://github.com/piccolomo/plotext/blob/master/readme/utilities.md#clearing-functions).
76 |
77 | Here is a coded example:
78 |
79 | ```python
80 | import plotext as plt
81 |
82 | l = 1000
83 | frames = 200
84 |
85 | plt.title("Streaming Data")
86 | # plt.clc()
87 |
88 | for i in range(frames):
89 | plt.clt() # to clear the terminal
90 | plt.cld() # to clear the data only
91 |
92 | y = plt.sin(periods = 2, length = l, phase = 2 * i / frames)
93 | plt.scatter(y)
94 |
95 | #plt.sleep(0.001) # to add
96 | plt.show()
97 | ```
98 |
99 | or directly on terminal:
100 |
101 | ```console
102 | python3 -c "import plotext as plt; l = 1000; frames = 200; plt.title('Streaming Data'); [(plt.cld(), plt.clt(), plt.plot(plt.sin(periods = 2, length = l, phase = 2 * i / frames)), plt.sleep(0), plt.show()) for i in range(frames)]"
103 | ```
104 |
105 | 
106 |
107 | [Main Guide](https://github.com/piccolomo/plotext#guide), [Special Plots](https://github.com/piccolomo/plotext/blob/master/readme/special.md)
108 |
109 | ## Matrix Plot
110 |
111 | To plot a 2D representation of a matrix, use the function `matrix_plot()`.
112 |
113 | - The intensity of the pixel (how light it is) is proportional to the correspondent element in the matrix.
114 |
115 | - The parameter `fast`, if set to True, allows to plot much faster, but the plot final dimensions will be locked to the whatever size was previously chosen, and won't adapt to the terminal or subplot size; also any setting function which follows will not have any effect (like `xlabel()`, `frame()` and so on).
116 |
117 | - The same function can **plot in colors**, if each pixel is an RGB tuple of three integers, between 0 and 255.
118 |
119 | Here is a coded example:
120 |
121 | ```python
122 | import plotext as plt
123 |
124 | cols, rows = 200, 45
125 | p = 1
126 | matrix = [[(abs(r - rows / 2) + abs(c - cols / 2)) ** p for c in range(cols)] for r in range(rows)]
127 |
128 | plt.matrix_plot(matrix)
129 | plt.plotsize(cols, rows)
130 | plt.title("Matrix Plot")
131 | plt.show()
132 | ```
133 |
134 | or directly on terminal:
135 |
136 | ```console
137 | python3 -c "import plotext as plt; cols, rows = 200, 45; p = 1; matrix = [[(abs(r - rows / 2) + abs(c - cols / 2)) ** p for c in range(cols)] for r in range(rows)]; plt.matrix_plot(matrix); plt.plotsize(cols, rows); plt.title('Matrix Plot'); plt.show()"
138 | ```
139 |
140 | 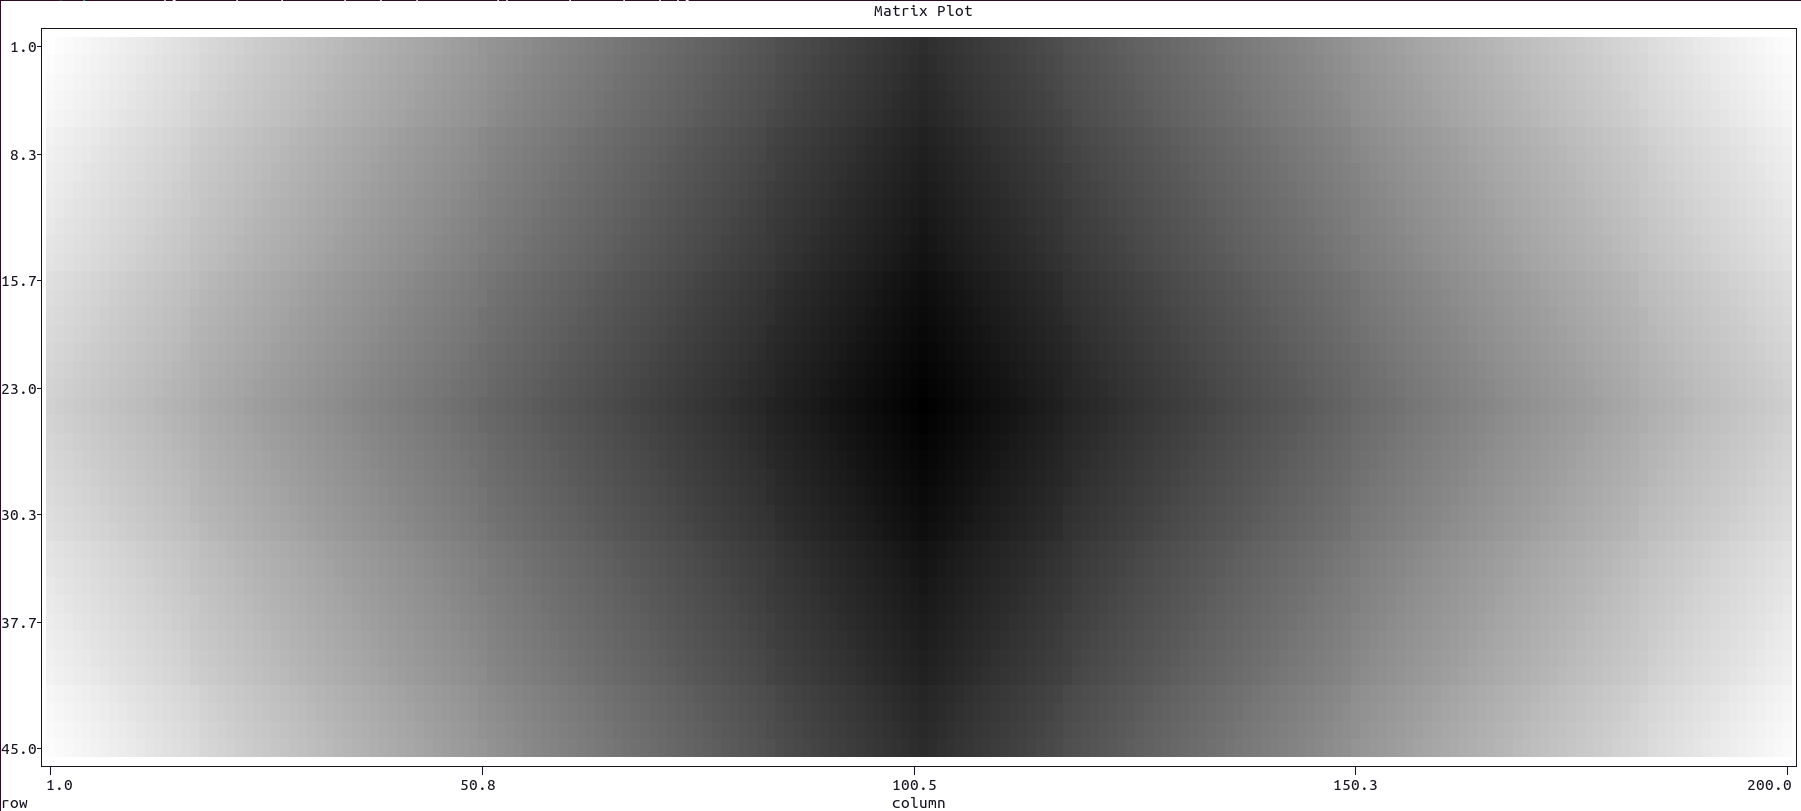
141 |
142 | More documentation can be accessed with `doc.matrix_plot()`.
143 |
144 | [Main Guide](https://github.com/piccolomo/plotext#guide), [Special Plots](https://github.com/piccolomo/plotext/blob/master/readme/special.md)
145 |
146 | ## Confusion Matrix
147 |
148 | To plot the [confusion matrix](https://en.wikipedia.org/wiki/Confusion_matrix) correspondent to certain actual and predicted observations, use the `confusion_matrix()` function - in short `cmatrix()` - as in this example:
149 |
150 | ```python
151 | import plotext as plt; plt.clf()
152 | from random import randrange
153 | l = 300
154 | actual = [randrange(0, 4) for i in range(l)]
155 | predicted = [randrange(0,4) for i in range(l)]
156 | labels = ['Autumn', 'Spring', 'Summer', 'Winter']
157 |
158 | plt.cmatrix(actual, predicted, labels)
159 | plt.show()
160 | ```
161 |
162 | or directly on terminal:
163 |
164 | ```console
165 | python3 -c "import plotext as plt; from random import randrange; l = 300; actual = [randrange(0, 4) for i in range(l)]; predicted = [randrange(0,4) for i in range(l)]; labels = ['Autumn', 'Spring', 'Summer', 'Winter']; plt.cmatrix(actual, predicted, labels); plt.show()"
166 | ```
167 |
168 | 
169 |
170 | More documentation can be accessed with `doc.confusion_matrix()`.
171 |
172 | [Main Guide](https://github.com/piccolomo/plotext#guide), [Special Plots](https://github.com/piccolomo/plotext/blob/master/readme/special.md)
173 |
174 | ## Heatmap Plot
175 |
176 | A heatmap is a graphical representation of data where values within a dataframe are represented as colors. It is a useful tool for visualizing and analyzing data, particularly when you want to show patterns or relationships in a large dataset.
177 |
178 | Color Mapping: In a heatmap, each cell in a matrix is assigned a color based on its value. Typically, a color gradient is used. The color intensity represents the magnitude of the values.
179 |
180 | To plot the [Heatmap](https://en.wikipedia.org/wiki/Heat_map) use the `heatmap()` function.
181 |
182 | Here is a coded example:
183 |
184 | ```python
185 | import plotext as plt
186 | import numpy as np
187 | import pandas as pd
188 | np.random.seed(0)
189 | students = ['Student 1', 'Student 2', 'Student 3', 'Student 4', 'Student 5', 'Student 6', 'Student 7', 'Student 8', 'Student 9', 'Student 10']
190 | subjects = ['Math', 'Science', 'History', 'English', 'Art', 'Physics', 'Chemistry', 'Biology']
191 | data = {'Student 1': [94, 97, 50, 53, 53, 89, 59, 69], 'Student 2': [71, 86, 73, 56, 74, 74, 62, 51], 'Student 3': [88, 89, 73, 96, 74, 67, 87, 75], 'Student 4': [63, 58, 59, 70, 66, 55, 65, 97], 'Student 5': [50,68, 85, 74, 99, 79, 69, 69], 'Student 6': [64, 89, 82, 51, 59, 82, 81, 60], 'Student 7': [73, 85, 61, 78, 84, 50, 50, 86], 'Student 8': [55, 88, 90, 67, 65, 54, 91, 92], 'Student 9': [81, 51, 51, 89, 91, 85, 88, 61], 'Student 10': [96, 68, 77, 50, 64, 85, 62, 92]}
192 | dataframe = pd.DataFrame(data, index=subjects)
193 |
194 | plt.heatmap(dataframe)
195 | plt.show()
196 | ```
197 |
198 | or directly on terminal:
199 |
200 | ```console
201 | python -c "import plotext as plt; import numpy as np; import pandas as pd; np.random.seed(0); students = ['Student 1', 'Student 2', 'Student 3', 'Student 4', 'Student 5', 'Student 6', 'Student 7', 'Student 8', 'Student 9', 'Student 10']; subjects = ['Math', 'Science', 'History', 'English', 'Art', 'Physics', 'Chemistry', 'Biology']; data = {'Student 1': [94, 97, 50, 53, 53, 89, 59, 69], 'Student 2': [71, 86, 73, 56, 74, 74, 62, 51], 'Student 3': [88, 89, 73, 96, 74, 67, 87, 75], 'Student 4': [63, 58, 59, 70, 66, 55, 65, 97], 'Student 5': [50,68, 85, 74, 99, 79, 69, 69], 'Student 6': [64, 89, 82, 51, 59, 82, 81, 60], 'Student 7': [73, 85, 61, 78, 84, 50, 50, 86], 'Student 8': [55, 88, 90, 67, 65, 54, 91, 92], 'Student 9': [81, 51, 51, 89, 91, 85, 88, 61], 'Student 10': [96, 68, 77, 50, 64, 85, 62, 92]}; dataframe = pd.DataFrame(data, index=subjects); plt.heatmap(dataframe); plt.show();"
202 | ```
203 |
204 | 
205 |
206 | More documentation can be accessed with `doc.heatmap()`.
207 |
208 | [Main Guide](https://github.com/piccolomo/plotext#guide), [Special Plots](https://github.com/piccolomo/plotext/blob/master/readme/special.md)
209 |
210 |
--------------------------------------------------------------------------------
/readme/subplots.md:
--------------------------------------------------------------------------------
1 | # Subplots
2 |
3 | - Building a grid of subplots is mainly intuitive and requires simply the use of the `subplots()` method, to construct a grid of `rows` x `cols` subplots, and the `subplot()` method to access a specific subplot at the given `row` and `col` (counting from the upper left corner of the matrix of plots and starting from 1) and define what and how to plot data in it.
4 |
5 | - The `main()` method returns the main figure at the uppermost level, and sets the active figure to it (as by default); any further commands will refer to the entire figure and to any of its subplots, if present.
6 |
7 | - The `active()` method returns the active subplot.
8 |
9 | - The `plot_size()` method sets the plot size of the active subplot (in units of character size), as explained [here](https://github.com/piccolomo/plotext/blob/master/readme/settings.md#plot-size).
10 |
11 | - The final widths/heights of a matrix of subplots will be the same for each column/row. By default, the maximum is taken, use `take_min()` to take the minimum instead.
12 |
13 | - Most of the commands referring to the active subplot, could be also passed directly to the `subplot()` method; for example `subplot(1, 3); plotsize(100, 30)` becomes `subplot(1, 3).plotsize(300, 30)`.
14 |
15 | - Subplots can be nested such that any subplot could creates its own matrix of subplots. For example, to create a 2 by 2 matrix where the first subplot is itself a 3 by 4 matrix, use `subplots(2, 2); subplot(1, 1); subplots(3, 4)` or directly `subplots(2, 2).subplot(1, 1).subplots(3, 4)`.
16 |
17 | - Any method referring to a subplot, which itself is a matrix of subplots, will apply to all of them simultaneously. This is useful to avoid rewriting the same code for each element of the matrix.
18 |
19 | Here is a coded example, which requires the package `yfinance` and where a [test image](https://raw.githubusercontent.com/piccolomo/plotext/master/data/cat.jpg) is downloaded in the home folder, visualized and finally removed:
20 |
21 | ```python
22 | import plotext as plt
23 | import random
24 | import yfinance as yf
25 |
26 | plt.date_form('d/m/Y')
27 | start = plt.string_to_datetime("11/07/2020")
28 | end = plt.today_datetime()
29 | data = yf.download('goog', start, end)
30 | dates = plt.datetimes_to_strings(data.index)
31 | p = ["Sausage", "Pepperoni", "Mushrooms", "Cheese", "Chicken", "Beef"]
32 | mp = [14, 36, 11, 8, 7, 4]
33 | fp = [12, 20, 35, 15, 2, 1]
34 | hd = [random.gauss(1, 1) for el in range(3 * 10 ** 5)]
35 |
36 | path = 'cat.jpg'
37 | plt.download(plt.test_image_url, path)
38 |
39 | plt.clf()
40 | plt.subplots(1, 2)
41 | plt.subplot(1, 1).plotsize(plt.tw() // 2, None)
42 | plt.subplot(1, 1).subplots(3, 1)
43 | plt.subplot(1, 2).subplots(2, 1)
44 | plt.subplot(1, 1).ticks_style('bold')
45 |
46 | plt.subplot(1, 1).subplot(1, 1)
47 | plt.theme('windows')
48 | plt.candlestick(dates, data)
49 | plt.title("Google Stock Price CandleSticks")
50 |
51 | plt.subplot(1, 1).subplot(2, 1)
52 | plt.theme('dreamland')
53 | plt.stacked_bar(p, [mp, fp], labels = ["men", "women"])
54 | plt.title("Most Favored Pizzas in the World by Gender")
55 |
56 | plt.subplot(1, 1).subplot(3, 1)
57 | plt.theme('matrix')
58 | bins = 18
59 | plt.hist(hd, bins, label = "Gaussian Noise Distribution", marker = 'fhd')
60 | plt.yfrequency(0)
61 | plt.title('Histogram Plot')
62 |
63 | plt.subplot(1, 2).subplot(1, 1).title('Default Theme')
64 | plt.plot(plt.sin(periods = 3), marker = "fhd", label = "3 periods")
65 | plt.plot(plt.sin(periods = 2), marker = "fhd", label = "2 periods")
66 | plt.plot(plt.sin(periods = 1), marker = "fhd", label = "1 period")
67 |
68 | plt.subplot(1, 2).subplot(2, 1)
69 | plt.plotsize(2 * plt.tw() // 3, plt.th() // 2)
70 | plt.image_plot(path)
71 | plt.title("A very Cute Cat")
72 |
73 | plt.show()
74 | plt.delete_file(path)
75 | ```
76 |
77 | or directly on terminal:
78 |
79 | ```console
80 | python3 -c "import plotext as plt; import random; import yfinance as yf; plt.date_form('d/m/Y'); start = plt.string_to_datetime('11/07/2020'); end = plt.today_datetime(); data = yf.download('goog', start, end); dates = plt.datetimes_to_strings(data.index); p = ['Sausage', 'Pepperoni', 'Mushrooms', 'Cheese', 'Chicken', 'Beef']; mp = [14, 36, 11, 8, 7, 4]; fp = [12, 20, 35, 15, 2, 1]; hd = [random.gauss(1, 1) for el in range(3 * 10 ** 5)]; path = 'cat.jpg'; plt.download(plt.test_image_url, path); plt.clf(); plt.subplots(1, 2); plt.subplot(1, 1).plotsize(plt.tw() // 2, None); plt.subplot(1, 1).subplots(3, 1); plt.subplot(1, 2).subplots(2, 1); plt.subplot(1, 1).ticks_style('bold'); plt.subplot(1, 1).subplot(1, 1); plt.theme('windows'); plt.candlestick(dates, data); plt.title('Google Stock Price CandleSticks'); plt.subplot(1, 1).subplot(2, 1); plt.theme('dreamland'); plt.stacked_bar(p, [mp, fp], labels = ['men', 'women']); plt.title('Most Favored Pizzas in the World by Gender'); plt.subplot(1, 1).subplot(3, 1); plt.theme('matrix'); bins = 18; plt.hist(hd, bins, label = 'Gaussian Noise Distribution', marker = 'fhd'); plt.yfrequency(0); plt.title('Histogram Plot'); plt.subplot(1, 2).subplot(1, 1).title('Default Theme'); plt.plot(plt.sin(periods = 3), marker = 'fhd', label = '3 periods'); plt.plot(plt.sin(periods = 2), marker = 'fhd', label = '2 periods'); plt.plot(plt.sin(periods = 1), marker = 'fhd', label = '1 period'); plt.subplot(1, 2).subplot(2, 1); plt.plotsize(2 * plt.tw() // 3, plt.th() // 2); plt.image_plot(path); plt.title('A very Cute Cat'); plt.show(); plt.delete_file(path);"
81 | ```
82 |
83 | 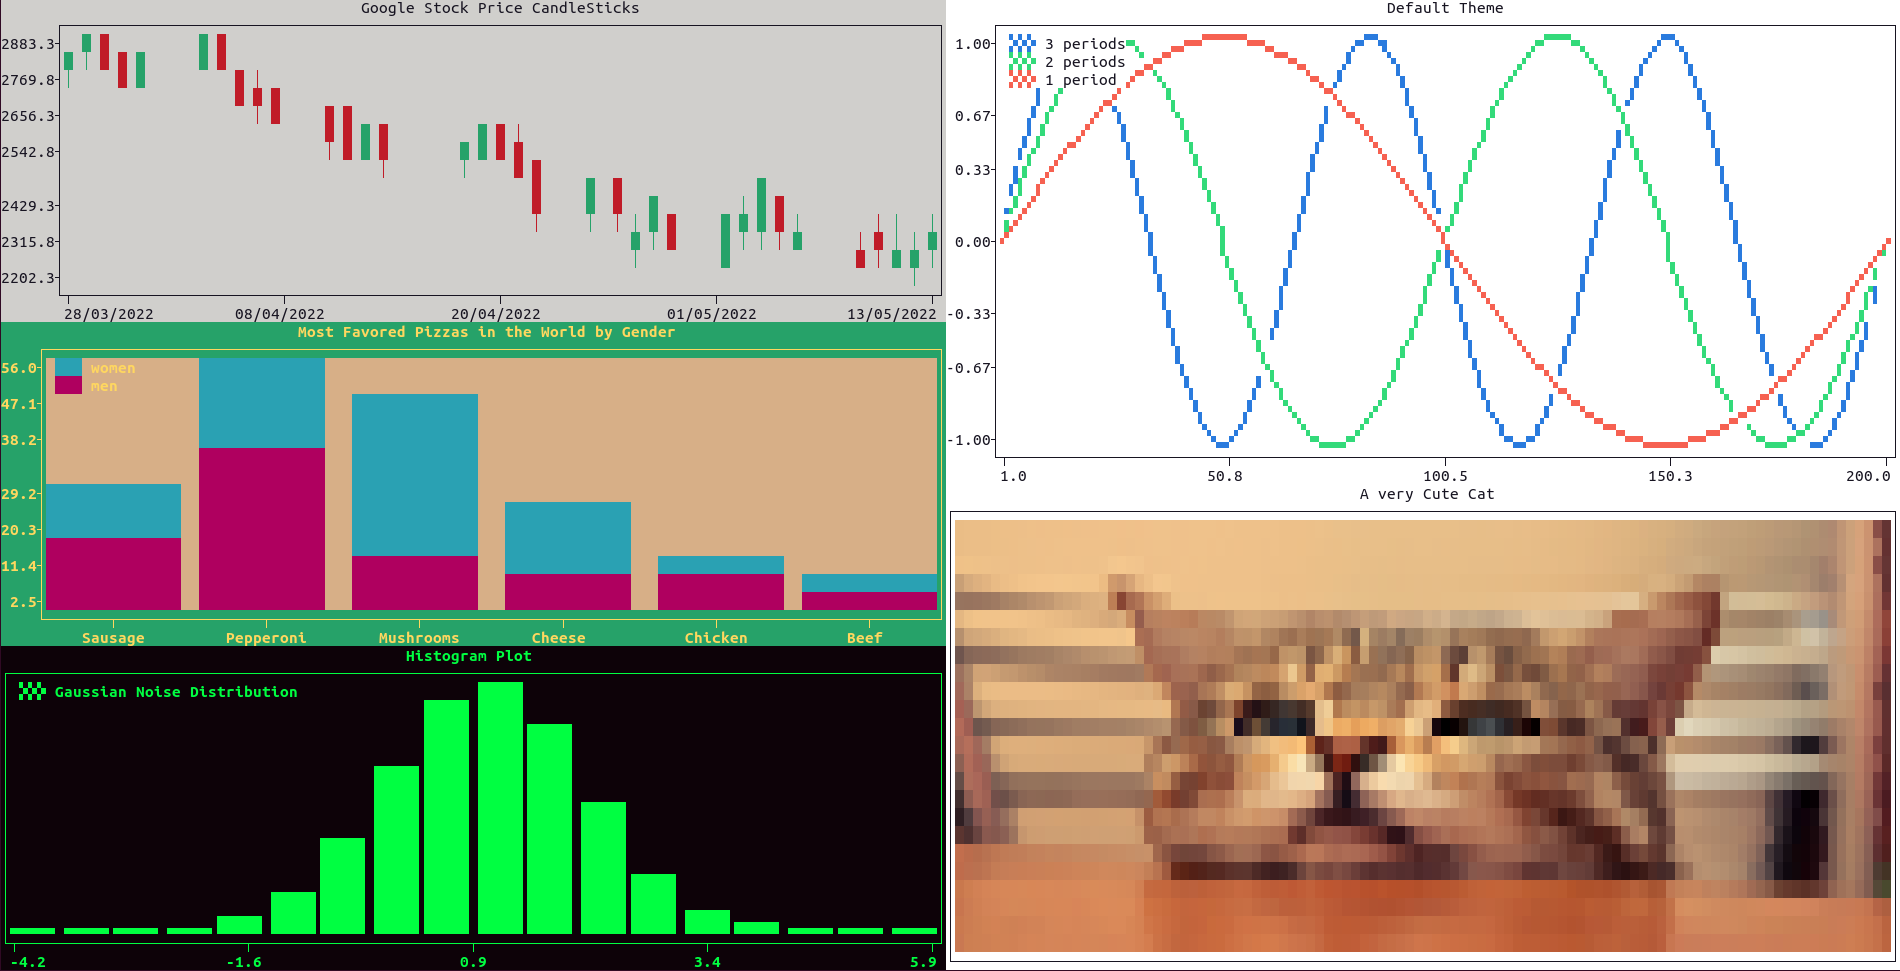
84 |
85 | More documentation is available accessing the doc-strings of the relevant methods; for example: `doc.subplots()` or `doc.subplot()`.
86 |
87 | [Main Guide](https://github.com/piccolomo/plotext#guide)
--------------------------------------------------------------------------------
/readme/utilities.md:
--------------------------------------------------------------------------------
1 | # Utilities
2 |
3 | - [Clearing Functions](https://github.com/piccolomo/plotext/blob/master/readme/utilities.md#clearing-functions)
4 | - [Canvas Utilities](https://github.com/piccolomo/plotext/blob/master/readme/utilities.md#canvas-utilities)
5 | - [File Utilities](https://github.com/piccolomo/plotext/blob/master/readme/utilities.md#file-utilities)
6 | - [Testing Tools](https://github.com/piccolomo/plotext/blob/master/readme/utilities.md#testing-tools)
7 | - [Command Line Tool](https://github.com/piccolomo/plotext/blob/master/readme/utilities.md#command-line-tool)
8 | - [Colored Text](https://github.com/piccolomo/plotext/blob/master/readme/utilities.md#colored-text)
9 | - [Docstrings](https://github.com/piccolomo/plotext/blob/master/readme/utilities.md#docstrings)
10 |
11 | [Main Guide](https://github.com/piccolomo/plotext#guide)
12 |
13 | ## Clearing Functions
14 |
15 | Here are all the available clearing functions:
16 |
17 | - `clear_figure()`, in short `clf()`, clears **all internal definitions** of the subplot it refers to, including its subplots, if present; If it refers to the entire figure, it will clear everything.
18 |
19 | - `clear_data()`, in short `cld()`, clears only the **data information** relative to the active subplot, without clearing all the other plot settings.
20 |
21 | - `clear_color()`, in short `clc()`, clears only the **color settings** relative to the active subplot, without clearing all other plot settings. The final rendering of this subplot will be colorless. This function is equivalent to `theme('clear')`.
22 |
23 | - `clear_terminal()`, in short `clt()`, clears the **terminal screen** and it is generally useful when plotting a continuous stream. If its `lines` parameter is set to an integer, only the specified number of lines will be cleared: note that, depending on the shell used, few extra lines may be printed after the plot.
24 |
25 | [Main Guide](https://github.com/piccolomo/plotext#guide), [Utilities](https://github.com/piccolomo/plotext/blob/master/readme/utilities.md#utilities)
26 |
27 | ## Canvas Utilities
28 |
29 | These functions are useful to save or change how the final result is outputted.
30 |
31 | - `interactive(True)` allows to **plot dynamically** without using the `show()` method. A new plot is shown automatically when a change is made.
32 |
33 | - `build()` is equivalent to `show()` except that the final **figure is returned as a string** and not printed.
34 |
35 | - `save_fig(path)` **saves** the colorless version of **the plot**, as a text file, at the `path` specified:
36 |
37 | - if the path extension is `.html` the colors will be preserved,
38 | - if `append = True` (`False` by default), the final result will be appended to the file, instead of replacing it,
39 | - if `keep_colors = True` (`False` by default), the `txt` version will keep the ansi color codes and in Linux systems, the command `less -R path.txt` can be used to render the colored plot on terminal.
40 |
41 | [Main Guide](https://github.com/piccolomo/plotext#guide), [Utilities](https://github.com/piccolomo/plotext/blob/master/readme/utilities.md#utilities)
42 |
43 | ## File Utilities
44 |
45 | `plotext` includes the following set of tools to easily manipulate files and file paths:
46 |
47 | - `script_folder()` returns the folder containing the script where it is run.
48 |
49 | - `parent_folder()` returns the parent folder of the `path` provided, at the `level` above specified.
50 |
51 | - `join_paths()` joins as many strings into a proper file path. The `~` character will be interpreted as the user home folder. If no folder is provided, the home folder is considered by default.
52 |
53 | - `save_text()` saves some `text` to the `path` specified.
54 |
55 | - `read_data()` reads numerical data from the `path` specified, using the given `delimiter` between columns (by default the space character), selecting the specified list of `columns` (starting from 1) and including or not the first data row with the `header` parameter.
56 |
57 | - `write_data()` write a matrix of data at the `path` specified, with given `delimiter` and considering the specified `columns`.
58 |
59 | - `transpose()` simply transposes a matrix.
60 |
61 | - `download()` downloads the content from the given `url` to the `path` selected.
62 |
63 | - `delete_file()` deletes the file at the `path` specified, if it exists.
64 |
65 | [Main Guide](https://github.com/piccolomo/plotext#guide), [Utilities](https://github.com/piccolomo/plotext/blob/master/readme/utilities.md#utilities)
66 |
67 | ## Testing Tools
68 |
69 | Here are some tools useful to test the `plotext` package:
70 |
71 | - `sin()` outputs a **sinusoidal signal** with the given `periods`, `length`, `amplitude`, `phase` and `decay` rate. More documentation is available using `doc.sin()`.
72 |
73 | - `square()` outputs a **square wave signal** with the given n `periods`, `length` and `amplitude`. More documentation is available using `doc.square()`.
74 |
75 | - `test()` to perform a **quick plotting test** (up to image rendering): it will download and finally remove a test image.
76 |
77 | - `time()` returns the **computation time** of the latest `show()` or `build()` function.
78 |
79 | - A series of **test files** can be downloaded using the following url paths in conjunction with the `download()`method:
80 |
81 | - `test_data_url` is the url of some 3 columns test data,
82 | - `test_bar_data_url` is the url of a simple 2 columns data used to test the `bar()` plot,
83 | - `test_image_url` is the url of a test image,
84 | - `test_gif_url` is the url of a test GIF image,
85 | - `test_video_url` is the url of a test video,
86 | - `test_youtube_url` is the url to a test YouTube video.
87 |
88 | [Main Guide](https://github.com/piccolomo/plotext#guide), [Utilities](https://github.com/piccolomo/plotext/blob/master/readme/utilities.md#utilities)
89 |
90 | ## Command Line Tool
91 |
92 | There are two ways one could use `plotext` directly on terminal. The first is by using its dedicated command line tool, to print a simple scatter, line, bar or histogram plot, as well as for image plotting, GIFs, video and YouTube rendering. For further documentation run, on terminal:
93 |
94 | ```console
95 | plotext --help
96 | ```
97 |
98 | 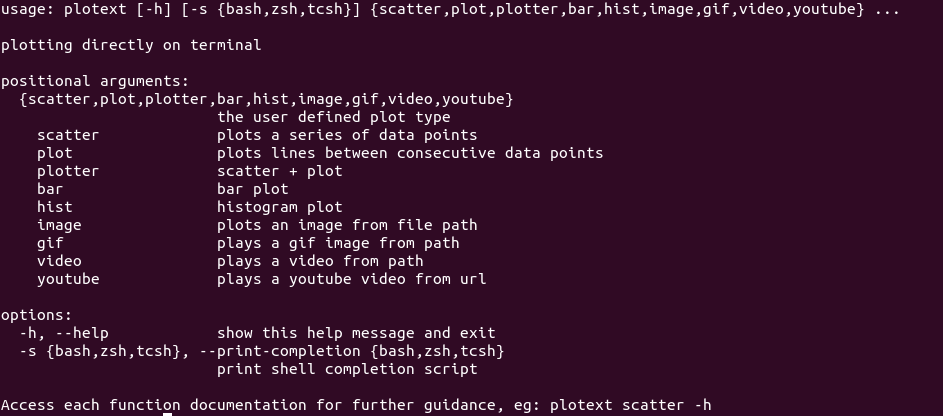
99 |
100 | The documentation of each function is also available. For example with:
101 |
102 | ```console
103 | plotext scatter --help
104 | ```
105 |
106 | 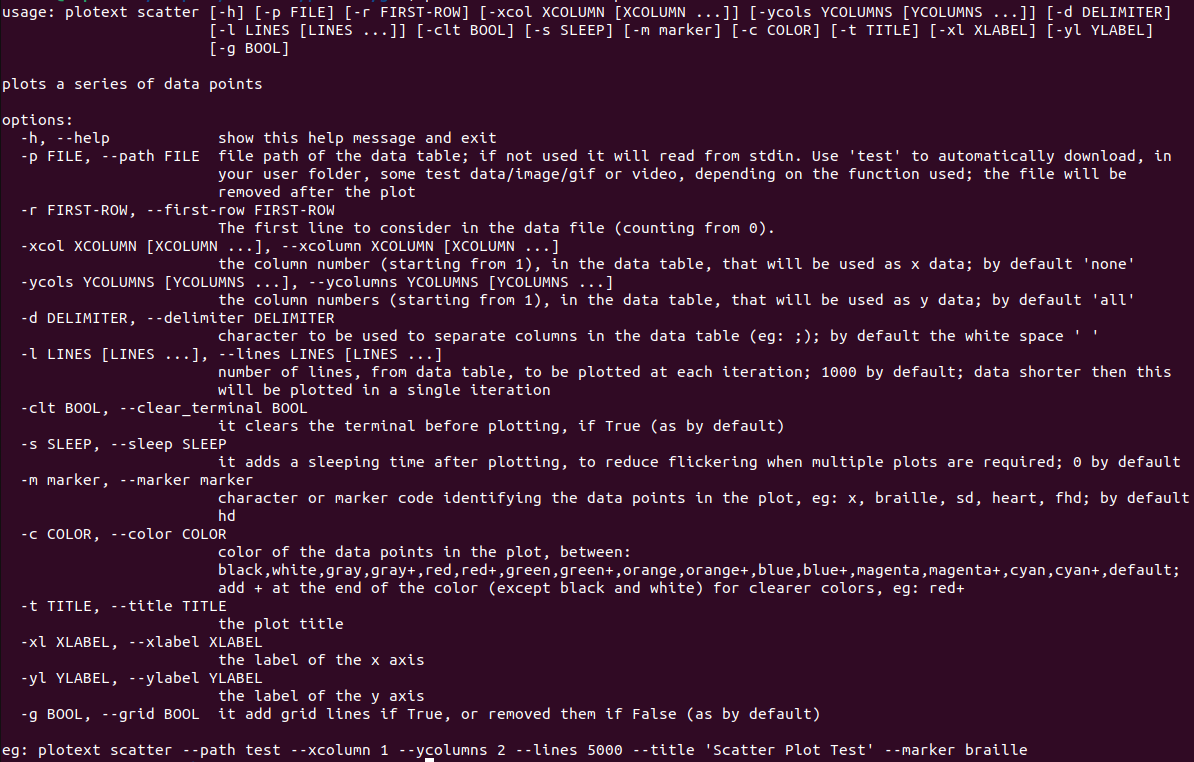
107 |
108 | - The `--path` option is used to read from the specified path.
109 |
110 | - The `--lines` option is used to plot a long data table at chunks of given `LINES` (1000 by default).
111 |
112 | - The tool recognizes the keyword `test` as path, to internally downloads and finally remove some test file. Here are some example:
113 |
114 | ```console
115 | plotext scatter --path test --xcolumn 1 --ycolumns 2 --lines 5000 --title 'Scatter Plot Test' --marker braille
116 | plotext plot --path test --xcolumn 1 --ycolumns 2 --sleep 0.1 --lines 2500 --clear_terminal True --color magenta+ --title 'Plot Test'
117 | plotext plotter --path test --xcolumn 1 --ycolumns 2 --sleep 0.1 --lines 120 --clear_terminal True --marker hd --title 'Plotter Test'
118 | plotext bar --path test --xcolumn 1 --title 'Bar Plot Test' --xlabel Animals --ylabel Count
119 | plotext hist --path test --xcolumn 1 --ycolumns 2 --lines 5000 --title 'Histogram Test'
120 | plotext image --path test
121 | plotext gif --path test
122 | plotext video --path test --from_youtube True
123 | plotext youtube --url test
124 | ```
125 |
126 | - you can type `python3 -m plotext` (or `python -m plotext` depending on your system) instead of `plotext` on your terminal, if the command tool is not directly available.
127 |
128 | - to allow TAB completion, install `plotext` with flag `[completion]`, as explained [here](https://github.com/piccolomo/plotext/blob/master/readme/notes.md#install). For issues on this feature, please report [here](https://github.com/piccolomo/plotext/pull/118).
129 |
130 | The second way to use `plotext` directly on terminal requires the translation of a script into a single string and passing it to the `python3 -c` tool. For example:
131 |
132 | ```python
133 | import plotext as plt
134 | plt.scatter(plt.sin())
135 | plt.title('Scatter Plot')
136 | plt.show()
137 | ```
138 |
139 | translates into:
140 |
141 | ```console
142 | python3 -c "import plotext as plt; plt.scatter(plt.sin()); plt.title('Scatter Plot'); plt.show();"
143 | ```
144 |
145 | - Each `python` line has to terminate with a semi-colon `;` and not a new line.
146 |
147 | - Strings should be surrounded by the single quote `'` , while the double quote `"` should be avoided.
148 |
149 | Each coded example in this [guide](https://github.com/piccolomo/plotext#guide) is followed by the correspondent direct terminal command line (of the second type).
150 |
151 | [Main Guide](https://github.com/piccolomo/plotext#guide), [Utilities](https://github.com/piccolomo/plotext/blob/master/readme/utilities.md#utilities)
152 |
153 | ## Colored Text
154 |
155 | To obtained colored strings use the `colorize()` method, which paints a string with the given `color`, `style` and `background` color. If `show = True` the string is directly printed and not returned. Here are a few examples:
156 |
157 | ```python
158 | import plotext as plt
159 | #Fullground #Style #Background #Show
160 | plt.colorize("black on white, bold", "black", "bold", "white", True)
161 | plt.colorize("red on green, italic", "red", "italic", "green", True)
162 | plt.colorize("yellow on blue, flash", "yellow", "flash", "blue", True)
163 | plt.colorize("magenta on cyan, underlined", "magenta", "underline", "cyan", True)
164 | plt.colorize("integer color codes", 201, "default", 158, True)
165 | plt.colorize("RGB color codes", (16, 100, 200), "default", (200, 100, 100), True)
166 | ```
167 |
168 | 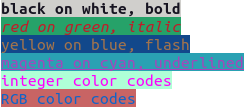
169 |
170 | - The available color codes are presented [here](https://github.com/piccolomo/plotext/blob/master/readme/aspect.md#colors), while the available styles [here](https://github.com/piccolomo/plotext/blob/master/readme/aspect.md#styles).
171 |
172 | - Using the `flash` style will result in an actual flashing string.
173 |
174 | - To remove any coloring use the `uncolorize()` method.
175 |
176 | [Main Guide](https://github.com/piccolomo/plotext#guide), [Utilities](https://github.com/piccolomo/plotext/blob/master/readme/utilities.md#utilities)
177 |
178 | ## Docstrings
179 |
180 | All main `plotext` methods have a doc-string that can be accessed in three ways. For example the doc-string of the `scatter()` function can be accessed:
181 |
182 | - as usual, using `print(scatter.__doc__)`, for its uncolorized version,
183 |
184 | - more easily through the `doc` container, using `doc.scatter()`, for its colorized version,
185 |
186 | - similarly with its internal .doc() method with `scatter.doc()`, for its colorized version,
187 |
188 | - with `doc.all()` which prints all `plotext` colorized doc-strings.
189 |
190 | Here are some methods that directly output some useful `plotext` guides:
191 |
192 | - the `markers()` method displays the available **marker codes**, also discussed [here](https://github.com/piccolomo/plotext/blob/master/readme/aspect.md#markers),
193 |
194 | - the `colors()` method displays the available **color codes**, also discussed [here](https://github.com/piccolomo/plotext/blob/master/readme/aspect.md#colors),
195 |
196 | - the `styles()` method displays the available **style codes**, also discussed [here](https://github.com/piccolomo/plotext/blob/master/readme/aspect.md#styles),
197 |
198 | - the `themes()` method displays the available **themes**, also discussed [here](https://github.com/piccolomo/plotext/blob/master/readme/aspect.md#themes).
199 |
200 | Finally the `platform` string will return your OS (Unix or Windows) and `version`, the `plotext` version installed.
201 |
202 | [Main Guide](https://github.com/piccolomo/plotext#guide), [Utilities](https://github.com/piccolomo/plotext/blob/master/readme/utilities.md#utilities)
203 |
--------------------------------------------------------------------------------
/readme/video.md:
--------------------------------------------------------------------------------
1 | # Play Videos
2 |
3 | - [Introduction](https://github.com/piccolomo/plotext/blob/master/readme/video.md#introduction)
4 | - [Video Plot](https://github.com/piccolomo/plotext/blob/master/readme/video.md#video-plot)
5 | - [Play YouTube](https://github.com/piccolomo/plotext/blob/master/readme/video.md#play-youtube)
6 |
7 | [Main Guide](https://github.com/piccolomo/plotext#guide)
8 |
9 | ## Introduction
10 |
11 | - You can **stream videos** directly on terminal with the functions `play_video()` and `play_youtube()`.
12 |
13 | - The function `show()` is not necessary in both cases, as it is called internally.
14 |
15 | - The **frames size** will adapt to the screen size, unless `plot_size()` is used before the steaming functions.
16 |
17 | - To **download videos** from the given YouTube `url` to the specified `path`, use the `get_youtube()` method.
18 |
19 | - Both streaming functions may require further development. Any [bug report](https://github.com/piccolomo/plotext/issues/new) or development idea is welcomed.
20 |
21 | [Main Guide](https://github.com/piccolomo/plotext#guide), [Play Videos](https://github.com/piccolomo/plotext/blob/master/readme/video.md)
22 |
23 | ## Video Plot
24 |
25 | To play a video with audio, use the the `play_video()` function. Set the parameter `from_youtube` to `True` to make sure that the color rendering is correct for videos downloaded from YouTube.
26 |
27 | In this example, a test video is downloaded in the home folder, streamed and finally removed:
28 |
29 | ```python
30 | import plotext as plt
31 | path = 'moonwalk.mp4'
32 | plt.download(plt.test_video_url, path)
33 | plt.play_video(path, from_youtube = True)
34 | plt.delete_file(path)
35 | ```
36 |
37 | or directly on terminal:
38 |
39 | ```console
40 | python3 -c "import plotext as plt; path = 'moonwalk.mp4'; plt.download(plt.test_video_url, path); plt.play_video(path, from_youtube = True); plt.delete_file(path)"
41 | ```
42 |
43 | which will render [this video](https://raw.githubusercontent.com/piccolomo/plotext/master/data/moonwalk.mp4) on terminal. Yes! I am a Michael Jackson fan: he is number one (also [innocent](https://www.youtube.com/watch?v=O42IJ7opJFQ)), not my fault!
44 |
45 | More documentation can be accessed with `doc.play_video()`.
46 |
47 | [Main Guide](https://github.com/piccolomo/plotext#guide), [Play Videos](https://github.com/piccolomo/plotext/blob/master/readme/video.md)
48 |
49 | ## Play YouTube
50 |
51 | To play a YouTube video from `url` use the function `play_youtube()`, as in this example:
52 |
53 | ```python
54 | import plotext as plt
55 | plt.play_youtube(plt.test_youtube_url)
56 | ```
57 |
58 | or directly on terminal:
59 |
60 | ```console
61 | python3 -c "import plotext as plt; plt.play_youtube(plt.test_youtube_url)"
62 | ```
63 |
64 | which will render [this youtube video](https://www.youtube.com/watch?v=ZNAvVVc4b3E&t=75s) on terminal.
65 |
66 | [Main Guide](https://github.com/piccolomo/plotext#guide), [Play Videos](https://github.com/piccolomo/plotext/blob/master/readme/video.md)
--------------------------------------------------------------------------------
/setup.cfg:
--------------------------------------------------------------------------------
1 | # Inside of setup.cfg
2 | [metadata]
3 | description-file = README.md
4 |
5 | [options.extras_require]
6 | image = pillow>=8.4
7 | video = pillow>=8.4; pafy>=0.5.5; opencv-python>=4.5.5; ffpyplayer>=4.3.5; youtube-dl==2020.12.2
8 | completion = shtab
9 |
10 | [options.entry_points]
11 | console_scripts =
12 | plotext = plotext.plotext_cli:main
13 |
--------------------------------------------------------------------------------
/setup.py:
--------------------------------------------------------------------------------
1 | # /usr/bin/env python3
2 | import pathlib
3 | from setuptools import setup, find_packages
4 |
5 | # The directory containing this file
6 | HERE = pathlib.Path(__file__).parent
7 |
8 | # The text of the README file
9 | README = (HERE / "README.md").read_text()
10 |
11 | setup(
12 | author = "Savino Piccolomo",
13 | author_email = "piccolomo@gmail.com",
14 | name = 'plotext',
15 | version='5.3.2',
16 | description = 'plotext plots directly on terminal',
17 | long_description = README,
18 | long_description_content_type = "text/markdown",
19 | license = "MIT",
20 | url = 'https://github.com/piccolomo/plotext',
21 | packages = find_packages(),
22 | python_requires = ">=3.5",
23 | include_package_data = True,
24 | install_requires = [],
25 | extras_require = {"image": ["pillow>=8.4"], "video": ["pillow>=8.4", "pafy>=0.5.5", "opencv-python>=4.5.5", "ffpyplayer>=4.3.5", "youtube-dl==2020.12.2"], "completion": ["shtab"]},
26 | classifiers = []
27 | )
28 |
--------------------------------------------------------------------------------
/tests.sh:
--------------------------------------------------------------------------------
1 | #!/bin/bash
2 | #choice of yes or no
3 | fork(){
4 | while true;
5 | do
6 | #read -n 1 -r -p "y/n? " response
7 | read -n 1 -r -p "? " response
8 | echo -e ""
9 | if [[ $response =~ ^([yY])$ ]]
10 | then
11 | out=1
12 | break
13 | elif [[ $response =~ ^([nN][oO]|[nN])$ ]]
14 | then
15 | out=0
16 | break
17 | fi
18 | done
19 | }
20 |
21 | echo -en "Command Line Tool: Scatter Plot"
22 | fork
23 | if test $out -eq 1
24 | then
25 | plotext scatter --path test --xcolumn 1 --ycolumns 2 --lines 5000 --title "Scatter Plot Test" --marker braille
26 | fi
27 |
28 |
29 | echo -en "Command line: Line Plot"
30 | fork
31 | if test $out -eq 1
32 | then
33 | plotext plot --path test --xcolumn 1 --ycolumns 2 --sleep 0.1 --lines 2500 --color magenta+ --title "Line Plot Test"
34 | fi
35 |
36 | echo -en "Command Line Tool: Plotter"
37 | fork
38 | if test $out -eq 1
39 | then
40 | plotext plotter --path test --xcolumn 1 --ycolumns 2 --sleep 0.1 --lines 120 --marker hd --title "Plotter Test"
41 | fi
42 |
43 | echo -en "Command Line Tool: Bar Plot"
44 | fork
45 | if test $out -eq 1
46 | then
47 | plotext bar --path test --xcolumn 1 --title "Bar Plot Test" --xlabel Animals --ylabel Count
48 | fi
49 |
50 | echo -en "Command Line Tool: Histogram Plot"
51 | fork
52 | if test $out -eq 1
53 | then
54 | plotext hist --path test --xcolumn 1 --ycolumns 2 --lines 5000 --title "Histogram Test"
55 | fi
56 |
57 | echo -en "Command Line Tool: Image Plot"
58 | fork
59 | if test $out -eq 1
60 | then
61 | plotext image --path test
62 | fi
63 |
64 | echo -en "Command Line Tool: GIF Plot"
65 | fork
66 | if test $out -eq 1
67 | then
68 | plotext gif --path test
69 | fi
70 |
71 | echo -en "Command Line Tool: Video Plot"
72 | fork
73 | if test $out -eq 1
74 | then
75 | plotext video --path test --from_youtube True
76 | fi
77 |
78 | echo -en "Command Line Tool: YouTube Plot"
79 | fork
80 | if test $out -eq 1
81 | then
82 | plotext youtube --url test
83 | fi
84 |
85 | echo -en "Scatter"
86 | fork
87 | if test $out -eq 1
88 | then
89 | python3 -c "import plotext as plt; y = plt.sin(); plt.scatter(y); plt.title('Scatter Plot'); plt.show()"
90 | fi
91 |
92 | echo -en "Plot"
93 | fork
94 | if test $out -eq 1
95 | then
96 | python3 -c "import plotext as plt; y = plt.sin(); plt.plot(y); plt.title('Line Plot'); plt.show()"
97 | fi
98 |
99 | echo -en "Stem Plot"
100 | fork
101 | if test $out -eq 1
102 | then
103 | python3 -c "import plotext as plt; y = plt.sin(length = 100); plt.plot(y, fillx = True); plt.title('Stem Plot'); plt.show()"
104 | fi
105 |
106 | echo -en "Multiple Data Set"
107 | fork
108 | if test $out -eq 1
109 | then
110 | python3 -c "import plotext as plt; y1 = plt.sin(); y2 = plt.sin(phase = -1); plt.plot(y1, label = 'plot'); plt.scatter(y2, label = 'scatter'); plt.title('Multiple Data Set'); plt.show()"
111 | fi
112 |
113 | echo -en "Multiple Axes Plot"
114 | fork
115 | if test $out -eq 1
116 | then
117 | python3 -c "import plotext as plt; y1 = plt.sin(); y2 = plt.sin(2, phase = -1); plt.plot(y1, xside= 'lower', yside = 'left', label = 'lower left'); plt.plot(y2, xside= 'upper', yside = 'right', label = 'upper right'); plt.title('Multiple Axes Plot'); plt.show()"
118 | fi
119 |
120 | echo -en "Logarithmic Plot"
121 | fork
122 | if test $out -eq 1
123 | then
124 | python3 -c "import plotext as plt; l = 10 ** 4; y = plt.sin(periods = 2, length = l); plt.plot(y); plt.xscale('log'); plt.yscale('linear'); plt.grid(0, 1); plt.title('Logarithmic Plot'); plt.xlabel('logarithmic scale'); plt.ylabel('linear scale'); plt.show();"
125 | fi
126 |
127 | echo -en "Streaming Data"
128 | fork
129 | if test $out -eq 1
130 | then
131 | python3 -c "import plotext as plt; l = 1000; frames = 200; plt.title('Streaming Data'); [(plt.cld(), plt.clt(), plt.plot(plt.sin(periods = 2, length = l, phase = 2 * i / frames)), plt.sleep(0.00), plt.show()) for i in range(frames)]"
132 | fi
133 |
134 | echo -en "Bar Plot"
135 | fork
136 | if test $out -eq 1
137 | then
138 | python3 -c "import plotext as plt; pizzas = ['Sausage', 'Pepperoni', 'Mushrooms', 'Cheese', 'Chicken', 'Beef']; percentages = [14, 36, 11, 8, 7, 4]; plt.bar(pizzas, percentages); plt.title('Most Favored Pizzas in the World'); plt.show()"
139 | fi
140 |
141 | echo -en "Horizontal Bar Plot"
142 | fork
143 | if test $out -eq 1
144 | then
145 | python3 -c "import plotext as plt; pizzas = ['Sausage', 'Pepperoni', 'Mushrooms', 'Cheese', 'Chicken', 'Beef']; percentages = [14, 36, 11, 8, 7, 4]; plt.bar(pizzas, percentages, orientation = 'h', width = 3 / 5); plt.title('Most Favored Pizzas in the World'); plt.show()"
146 | fi
147 |
148 | echo -en "Simple Bar Plot"
149 | fork
150 | if test $out -eq 1
151 | then
152 | python3 -c "import plotext as plt; pizzas = ['Sausage', 'Pepperoni', 'Mushrooms', 'Cheese', 'Chicken', 'Beef']; percentages = [14, 36, 11, 8, 7, 4]; plt.simple_bar(pizzas, percentages, width = 100, title = 'Most Favored Pizzas in the World'); plt.show()"
153 | fi
154 |
155 | echo -en "Multiple Bar Plot"
156 | fork
157 | if test $out -eq 1
158 | then
159 | python3 -c "import plotext as plt; pizzas = ['Sausage', 'Pepperoni', 'Mushrooms', 'Cheese', 'Chicken', 'Beef']; male_percentages = [14, 36, 11, 8, 7, 4]; female_percentages = [12, 20, 35, 15, 2, 1]; plt.multiple_bar(pizzas, [male_percentages, female_percentages], labels = ['men', 'women']); plt.title('Most Favored Pizzas in the World by Gender'); plt.show()"
160 | fi
161 |
162 | echo -en "Simple Multiple Bar Plot"
163 | fork
164 | if test $out -eq 1
165 | then
166 | python3 -c "import plotext as plt; pizzas = ['Sausage', 'Pepperoni', 'Mushrooms', 'Cheese', 'Chicken', 'Beef']; male_percentages = [14, 36, 11, 8, 7, 4]; female_percentages = [12, 20, 35, 15, 2, 1]; plt.simple_multiple_bar(pizzas, [male_percentages, female_percentages], width = 100, labels = ['men', 'women'], title = 'Most Favored Pizzas in the World by Gender'); plt.show()"
167 | fi
168 |
169 | echo -en "Stacked Bar Plot"
170 | fork
171 | if test $out -eq 1
172 | then
173 | python3 -c "import plotext as plt; pizzas = ['Sausage', 'Pepperoni', 'Mushrooms', 'Cheese', 'Chicken', 'Beef']; male_percentages = [14, 36, 11, 8, 7, 4]; female_percentages = [12, 20, 35, 15, 2, 1]; plt.stacked_bar(pizzas, [male_percentages, female_percentages], labels = ['men', 'women']); plt.title('Most Favored Pizzas in the World by Gender'); plt.show()"
174 | fi
175 |
176 | echo -en "Simple Stacked Bar Plot"
177 | fork
178 | if test $out -eq 1
179 | then
180 | python3 -c "import plotext as plt; pizzas = ['Sausage', 'Pepperoni', 'Mushrooms', 'Cheese', 'Chicken', 'Beef']; male_percentages = [14, 36, 11, 8, 7, 4]; female_percentages = [12, 20, 35, 15, 2, 1]; plt.simple_stacked_bar(pizzas, [male_percentages, female_percentages], width = 100, labels = ['men', 'women'], title = 'Most Favored Pizzas in the World by Gender'); plt.show()"
181 | fi
182 |
183 | echo -en "Histogram Plot"
184 | fork
185 | if test $out -eq 1
186 | then
187 | python3 -c "import plotext as plt; import random; l = 7 * 10 ** 4; data1 = [random.gauss(0, 1) for el in range(10 * l)]; data2 = [random.gauss(3, 1) for el in range(6 * l)]; data3 = [random.gauss(6, 1) for el in range(4 * l)]; bins = 60; plt.hist(data1, bins, label='mean 0'); plt.hist(data2, bins, label='mean 3'); plt.hist(data3, bins, label='mean 6'); plt.title('Histogram Plot'); plt.show()"
188 | fi
189 |
190 | echo -en "Datetime Plot"
191 | fork
192 | if test $out -eq 1
193 | then
194 | python3 -c "import yfinance as yf; import plotext as plt; plt.date_form('d/m/Y'); start = plt.string_to_datetime('11/04/2022'); end = plt.today_datetime(); data = yf.download('goog', start, end); prices = list(data['Close']); dates = plt.datetimes_to_strings(data.index); plt.plot(dates, prices); plt.title('Google Stock Price'); plt.xlabel('Date'); plt.ylabel('Stock Price $'); plt.show()"
195 | fi
196 |
197 | echo -en "Candlestick Plot"
198 | fork
199 | if test $out -eq 1
200 | then
201 | python3 -c "import yfinance as yf; import plotext as plt; plt.date_form('d/m/Y'); start = plt.string_to_datetime('11/04/2022'); end = plt.today_datetime(); data = yf.download('goog', start, end); dates = plt.datetimes_to_strings(data.index); plt.candlestick(dates, data); plt.title('Google Stock Price Candlesticks'); plt.xlabel('Date'); plt.ylabel('Stock Price $'); plt.show()"
202 | fi
203 |
204 |
205 | echo -en "Box Plot"
206 | fork
207 | if test $out -eq 1
208 | then
209 | python3 -c "import plotext as plt; labels = ['apple', 'orange', 'banana', 'pear']; weights = [[1,2,3,5,10,8], [4,9,6,12,20,13], [1,2,3,4,5,6], [3,9,12,16,9,8,3,7,2]]; plt.box(labels, weights, width = 0.3); plt.title('The Weight of the Fruits'); plt.show();"
210 | fi
211 |
212 | echo -en "Error Plot"
213 | fork
214 | if test $out -eq 1
215 | then
216 | python3 -c "import plotext as plt; plt.clf(); from random import random; l = 20; n = 1; ye = [random() * n for i in range(l)]; xe = [random() * n for i in range(l)]; y = plt.sin(length = l); plt.error(y, xerr = xe, yerr = ye); plt.title('Error Plot'); plt.show();"
217 | fi
218 |
219 | echo -en "Event Plot"
220 | fork
221 | if test $out -eq 1
222 | then
223 | python3 -c "import plotext as plt; from random import randint; from datetime import datetime, timedelta; plt.date_form('H:M'); times = [datetime(2022, 3, 27, randint(0, 23), randint(0, 59), randint(0, 59)) for i in range(100)]; times = plt.datetimes_to_strings(times); plt.plotsize(None, 20); plt.eventplot(times); plt.show()"
224 | fi
225 |
226 | echo -en "Extra Lines"
227 | fork
228 | if test $out -eq 1
229 | then
230 | python3 -c "import plotext as plt; y = plt.sin(); plt.scatter(y); plt.title('Extra Lines'); plt.vline(100, 'magenta'); plt.hline(0.5, 'blue+'); plt.plotsize(100, 30); plt.show()"
231 | fi
232 |
233 | echo -en "Text Plot"
234 | fork
235 | if test $out -eq 1
236 | then
237 | python3 -c "import plotext as plt; pizzas = ['Sausage', 'Pepperoni', 'Mushrooms', 'Cheese', 'Chicken', 'Beef']; percentages = [14, 36, 11, 8, 7, 4]; plt.bar(pizzas, percentages); plt.title('Labelled Bar Plot using Text()'); [plt.text(pizzas[i], i + 1, y = percentages[i] + 1.5, alignment = 'center', color = 'red') for i in range(len(pizzas))]; plt.ylim(0, 38); plt.plotsize(100, 30); plt.show()"
238 | fi
239 |
240 | echo -en "Shapes"
241 | fork
242 | if test $out -eq 1
243 | then
244 | python3 -c "import plotext as plt; plt.clf(); plt.title('Shapes'); plt.polygon(); plt.rectangle(); plt.polygon(sides = 100); plt.show()"
245 | fi
246 |
247 | echo -en "Indicator"
248 | fork
249 | if test $out -eq 1
250 | then
251 | python3 -c "import plotext as plt; plt.indicator(45.3, 'Price'); plt.plotsize(30, 10); plt.show()"
252 | fi
253 |
254 |
255 | echo -en "Settings Plot"
256 | fork
257 | if test $out -eq 1
258 | then
259 | python3 -c "import plotext as plt; l, p = 300, 2; plt.plot(plt.sin(length = l, periods = p), label = 'My Signal'); plt.plotsize(100, 30); plt.title('Some Smart Title'); plt.xlabel('Time'); plt.ylabel('Movement'); plt.ticks_color('red'); plt.ticks_style('bold'); plt.xlim(-l//10, l + l//10); plt.ylim(-1.5, 1.5); xticks = [l * i / (2 * p) for i in range(2 * p + 1)]; xlabels = [str(i) + 'π' for i in range(2 * p + 1)]; plt.xticks(xticks, xlabels); plt.yfrequency(5); plt.show()"
260 | fi
261 |
262 |
263 | echo -en "Matrix Plot"
264 | fork
265 | if test $out -eq 1
266 | then
267 | python3 -c "import plotext as plt; cols, rows = 200, 45; p = 1; matrix = [[(abs(r - rows / 2) + abs(c - cols / 2)) ** p for c in range(cols)] for r in range(rows)]; plt.matrix_plot(matrix); plt.plotsize(cols, rows); plt.title('Matrix Plot'); plt.show()"
268 | fi
269 |
270 | echo -en "Confusion Matrix"
271 | fork
272 | if test $out -eq 1
273 | then
274 | python3 -c "import plotext as plt; from random import randrange; l = 300; actual = [randrange(0, 4) for i in range(l)]; predicted = [randrange(0,4) for i in range(l)]; labels = ['Autumn', 'Spring', 'Summer', 'Winter']; plt.cmatrix(actual, predicted, labels); plt.show()"
275 | fi
276 |
277 | echo -en "Image Plot"
278 | fork
279 | if test $out -eq 1
280 | then
281 | python3 -c "import plotext as plt; path = 'cat.jpg'; plt.download(plt.test_image_url, path); plt.image_plot(path); plt.title('A very Cute Cat'); plt.show(); plt.delete_file(path)"
282 | fi
283 |
284 | echo -en "GIF plot"
285 | fork
286 | if test $out -eq 1
287 | then
288 | python3 -c "import plotext as plt; path = 'homer.gif'; plt.download(plt.test_gif_url, path); plt.play_gif(path); plt.show(); plt.delete_file(path)"
289 | fi
290 |
291 | echo -en "Video Plot"
292 | fork
293 | if test $out -eq 1
294 | then
295 | python3 -c "import plotext as plt; path = 'moonwalk.mp4'; plt.download(plt.test_video_url, path); plt.play_video(path, from_youtube = True); plt.delete_file(path)"
296 | fi
297 |
298 | echo -en "YouTube Plot"
299 | fork
300 | if test $out -eq 1
301 | then
302 | python3 -c "import plotext as plt; plt.play_youtube(plt.test_youtube_url)"
303 | fi
304 |
305 | echo -en "Subplots"
306 | fork
307 | if test $out -eq 1
308 | then
309 | python3 -c "import plotext as plt; import random; import yfinance as yf; plt.date_form('d/m/Y'); start = plt.string_to_datetime('28/03/2022'); end = plt.today_datetime(); data = yf.download('goog', start, end); dates = plt.datetimes_to_strings(data.index); p = ['Sausage', 'Pepperoni', 'Mushrooms', 'Cheese', 'Chicken', 'Beef']; mp = [14, 36, 11, 8, 7, 4]; fp = [12, 20, 35, 15, 2, 1]; hd = [random.gauss(1, 1) for el in range(3 * 10 ** 5)]; path = 'cat.jpg'; plt.download(plt.test_image_url, path); plt.clf(); plt.subplots(1, 2); plt.subplot(1, 1).plotsize(plt.tw() // 2, None); plt.subplot(1, 1).subplots(3, 1); plt.subplot(1, 2).subplots(2, 1); plt.subplot(1, 1).ticks_style('bold'); plt.subplot(1, 1).subplot(1, 1); plt.theme('windows'); plt.candlestick(dates, data); plt.title('Google Stock Price CandleSticks'); plt.subplot(1, 1).subplot(2, 1); plt.theme('dreamland'); plt.stacked_bar(p, [mp, fp], labels = ['men', 'women']); plt.title('Most Favored Pizzas in the World by Gender'); plt.subplot(1, 1).subplot(3, 1); plt.theme('matrix'); bins = 18; plt.hist(hd, bins, label = 'Gaussian Noise Distribution', marker = 'fhd'); plt.yfrequency(0); plt.title('Histogram Plot'); plt.subplot(1, 2).subplot(1, 1).title('Default Theme'); plt.plot(plt.sin(periods = 3), marker = 'fhd', label = '3 periods'); plt.plot(plt.sin(periods = 2), marker = 'fhd', label = '2 periods'); plt.plot(plt.sin(periods = 1), marker = 'fhd', label = '1 period'); plt.subplot(1, 2).subplot(2, 1); plt.plotsize(2 * plt.tw() // 3, plt.th() // 2); plt.image_plot(path); plt.title('A very Cute Cat'); plt.show(); plt.delete_file(path);"
310 | fi
311 |
312 | echo -en "Test Plot"
313 | fork
314 | if test $out -eq 1
315 | then
316 | python3 -c "import plotext as plt; plt.test()"
317 | fi
318 |
319 | echo -en "Markers"
320 | fork
321 | if test $out -eq 1
322 | then
323 | python3 -c "import plotext as plt; plt.markers()"
324 | fi
325 |
326 | echo -en "Colors"
327 | fork
328 | if test $out -eq 1
329 | then
330 | python3 -c "import plotext as plt; plt.colors()"
331 | fi
332 |
333 | echo -en "Styles"
334 | fork
335 | if test $out -eq 1
336 | then
337 | python3 -c "import plotext as plt; plt.styles()"
338 | fi
339 |
340 | echo -en "Themes"
341 | fork
342 | if test $out -eq 1
343 | then
344 | python3 -c "import plotext as plt; plt.themes()"
345 | fi
346 |
347 |
348 | echo -en "Extreme Cases"
349 | fork
350 | if test $out -eq 1
351 | then
352 | python3 -c "import plotext as plt; plt.clf(); plt.subplots(5, 5); plt.subplot(1,1); plt.scatter(); plt.title('scatter()'); plt.subplot(1, 2); plt.scatter([]); plt.title('scatter([])'); plt.subplot(1, 3); plt.plot(); plt.title('plot()'); plt.subplot(1,4); plt.scatter([]); plt.title('scatter([])'); plt.subplot(1, 5); plt.candlestick([], []); plt.title('candlestick([], [])');
353 | plt.subplot(2, 1); plt.bar(); plt.title('bar()'); plt.subplot(2, 2); plt.bar([]); plt.title('bar([])'); plt.subplot(2, 3); plt.bar([],[]); plt.title('bar([],[])'); plt.subplot(2, 4); plt.bar([0, 1]); plt.title('bar([0, 1])'); plt.subplot(2, 5); plt.bar([0,0]); plt.title('bar([0,0])'); plt.subplot(3, 1); plt.multiple_bar(); plt.title('multiple_bar()'); plt.subplot(3, 2); plt.multiple_bar([]); plt.title('multiple_bar([])'); plt.subplot(3, 3); plt.multiple_bar([], []); plt.title('multiple_bar([], [])');
354 | plt.subplot(3, 4); plt.multiple_bar([[0,1],[0,1]]); plt.title('multiple_bar([[0,1],[0,1]])'); plt.subplot(3, 5); plt.multiple_bar([[0,0],[0,0]]); plt.title('multiple_bar([[0,0],[0,0]])'); plt.subplot(4, 1); plt.hist([]); plt.title('hist([])'); plt.subplot(4, 2); plt.error(); plt.title('error()'); plt.subplot(4, 3); plt.error([]); plt.title('error([])'); plt.subplot(4, 4); plt.event_plot([]); plt.title('event_plot([])'); plt.subplot(4, 5); plt.vline(0); plt.title('vline(0)'); plt.subplot(5, 1); plt.text('ciao bello!', 0, 0); plt.title('text(..., 0, 0)'); plt.subplot(5, 2); plt.rectangle(); plt.title('rectangle()'); plt.subplot(5, 3); plt.rectangle([], []); plt.title('rectangle([], [])'); plt.subplot(5, 4); plt.polygon(); plt.title('polygon()'); plt.subplot(5, 5); plt.matrix_plot([[]]); plt.title('matrix_plot([[]])'); plt.show()"
355 | fi
356 |
357 |
--------------------------------------------------------------------------------