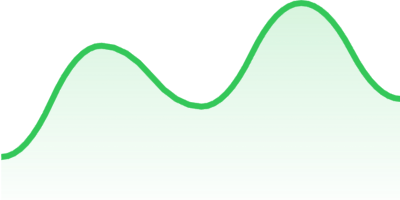
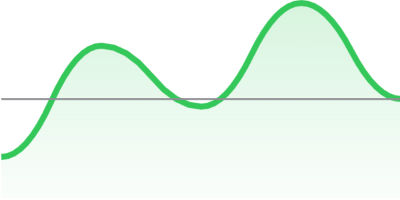
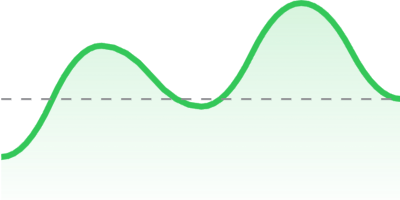
├── .gitignore ├── LICENSE ├── Package.swift ├── README.md ├── Sources └── LightChart │ ├── ChartType.swift │ ├── Charts │ ├── CurvedChart.swift │ └── LineChart.swift │ ├── DataRepresentable.swift │ ├── LightChart.swift │ └── Math.swift └── Tests ├── LightChartTests ├── LightChartTests.swift └── XCTestManifests.swift └── LinuxMain.swift /.gitignore: -------------------------------------------------------------------------------- 1 | .DS_Store 2 | /.build 3 | /Packages 4 | /*.xcodeproj 5 | xcuserdata/ 6 | .swiftpm 7 | .swift-version 8 | xcuserdata 9 | Package.resolved -------------------------------------------------------------------------------- /LICENSE: -------------------------------------------------------------------------------- 1 | MIT License 2 | 3 | Copyright (c) 2020 Alexey Pichukov 4 | 5 | Permission is hereby granted, free of charge, to any person obtaining a copy 6 | of this software and associated documentation files (the "Software"), to deal 7 | in the Software without restriction, including without limitation the rights 8 | to use, copy, modify, merge, publish, distribute, sublicense, and/or sell 9 | copies of the Software, and to permit persons to whom the Software is 10 | furnished to do so, subject to the following conditions: 11 | 12 | The above copyright notice and this permission notice shall be included in all 13 | copies or substantial portions of the Software. 14 | 15 | THE SOFTWARE IS PROVIDED "AS IS", WITHOUT WARRANTY OF ANY KIND, EXPRESS OR 16 | IMPLIED, INCLUDING BUT NOT LIMITED TO THE WARRANTIES OF MERCHANTABILITY, 17 | FITNESS FOR A PARTICULAR PURPOSE AND NONINFRINGEMENT. IN NO EVENT SHALL THE 18 | AUTHORS OR COPYRIGHT HOLDERS BE LIABLE FOR ANY CLAIM, DAMAGES OR OTHER 19 | LIABILITY, WHETHER IN AN ACTION OF CONTRACT, TORT OR OTHERWISE, ARISING FROM, 20 | OUT OF OR IN CONNECTION WITH THE SOFTWARE OR THE USE OR OTHER DEALINGS IN THE 21 | SOFTWARE. 22 | -------------------------------------------------------------------------------- /Package.swift: -------------------------------------------------------------------------------- 1 | // swift-tools-version:5.3 2 | // The swift-tools-version declares the minimum version of Swift required to build this package. 3 | 4 | import PackageDescription 5 | 6 | let package = Package( 7 | name: "LightChart", 8 | platforms: [ 9 | .iOS(.v13), 10 | .watchOS(.v6), 11 | .macOS(.v10_15) 12 | ], 13 | products: [ 14 | .library( 15 | name: "LightChart", 16 | targets: ["LightChart"]), 17 | ], 18 | dependencies: [], 19 | targets: [ 20 | .target( 21 | name: "LightChart", 22 | dependencies: []), 23 | .testTarget( 24 | name: "LightChartTests", 25 | dependencies: ["LightChart"]), 26 | ] 27 | ) 28 | -------------------------------------------------------------------------------- /README.md: -------------------------------------------------------------------------------- 1 | 2 |
3 | 4 |
5 | 6 | 7 | 8 | **LightChart** is a lightweight **SwiftUI** package with line charts implementation. You can use it when you need only a chart that will perfectly fit into your View. It doesn't have any interaction, titles, different types of diagram or anything else, just a representation of your data set. 9 | 10 | Currently `LightChart` have only `line` type of chart with sharp corners or a curved one. That's how it looks in the real application on currency exchange rates example: 11 | 12 |
13 | 14 |
15 | 16 | ## Installation 17 | 18 | It's a Swift Package, so you need to do the following: 19 | 20 | - Open `File` in Xcode menu 21 | - Open `Swift Packages` 22 | - Choose `Add Package Dependency...` option 23 | - In the `Enter package repository URL` field paste this URL: `https://github.com/pichukov/LightChart` 24 | - Choose any existing version or a `master` branch option 25 | 26 | ## Usage 27 | 28 | Add `import LightChart` 29 | Add `LightChartView` into your SwiftUI code 30 | ```swift 31 | LightChartView(data: [4, 8, 12, 10, 25]) 32 | ``` 33 | By default it will draw a red line chart: 34 | 35 |
36 | 37 |
38 | 39 | To customize it you can use several properties: 40 | 41 | #### type 42 | The type of chart, it's an `enum` with two cases: 43 | - `.line` is a default type that will draw a chart presented above 44 | - `.curved` will draw a curved chart, for example: 45 | ```swift 46 | LightChartView(data: [2, 17, 9, 23, 10], type: .curved) 47 | ``` 48 |
49 | 50 |
51 | 52 | #### visualType 53 | The visual part of the chart. An `enum` with three cases: 54 | - `.outline(color: Color, lineWidth: CGFloat)` to specify a `color` and `lineWidth` for `stroke` 55 | ```swift 56 | LightChartView(data: [2, 17, 9, 23, 10], 57 | type: .curved, 58 | visualType: .outline(color: .green, lineWidth: 5)) 59 | ``` 60 |
61 | 62 |
63 | 64 | - `.filled(color: Color, lineWidth: CGFloat)` use stroke color to fill the chart with a gradient 65 | ```swift 66 | LightChartView(data: [2, 17, 9, 23, 10], 67 | type: .curved, 68 | visualType: .filled(color: .green, lineWidth: 5)) 69 | ``` 70 |
71 | 72 |
73 | 74 | - `.customFilled(color: Color, lineWidth: CGFloat, fillGradient: LinearGradient)` also provides an option to change the fill gradient 75 | ```swift 76 | LightChartView(data: [2, 17, 9, 23, 10], 77 | type: .curved, 78 | visualType: .customFilled(color: .red, 79 | lineWidth: 3, 80 | fillGradient: LinearGradient( 81 | gradient: .init(colors: [Color.orange.opacity(0.7), Color.orange.opacity(0.1)]), 82 | startPoint: .init(x: 0.5, y: 1), 83 | endPoint: .init(x: 0.5, y: 0) 84 | ))) 85 | ``` 86 |
87 | 88 |
89 | 90 | #### offset 91 | By default the `offset` is `0` and it means that the chart takes up the entire area of the parent view. You can move the chart line up with changing the `offset` value. For example if you will use the `offset: 0.2` you chart line will move up and take only 80% of the parent view 92 | ```swift 93 | LightChartView(data: [2, 17, 9, 23, 10], 94 | type: .curved, 95 | visualType: .filled(color: .green, lineWidth: 3), 96 | offset: 0.2) 97 | ``` 98 |
99 | 100 |
101 | As you can see on picture above the offset effects only the chart line but not the fill gradient 102 | 103 | #### currentValueLineType 104 | There is an option to add a horizontal line that will point the last value of the data set. A `currentValueLineType` is an `enum` that has three cases: 105 | - `.none` is a default value that doesn't show any line 106 | - `.line(color: Color, lineWidth: CGFloat)` adds a line with `color` and `lineWidth` for a `stroke` 107 | ```swift 108 | LightChartView(data: [2, 17, 9, 23, 10], 109 | type: .curved, 110 | visualType: .filled(color: .green, lineWidth: 3), 111 | offset: 0.2, 112 | currentValueLineType: .line(color: .gray, lineWidth: 1)) 113 | ``` 114 |
115 | 116 |
117 | 118 | - `.dash(color: Color, lineWidth: CGFloat, dash: [CGFloat])` adds a dashed line 119 | ```swift 120 | LightChartView(data: [2, 17, 9, 23, 10], 121 | type: .curved, 122 | visualType: .filled(color: .green, lineWidth: 3), 123 | offset: 0.2, 124 | currentValueLineType: .dash(color: .gray, lineWidth: 1, dash: [5])) 125 | ``` 126 |
127 | 128 |
129 | -------------------------------------------------------------------------------- /Sources/LightChart/ChartType.swift: -------------------------------------------------------------------------------- 1 | // 2 | // ChartType.swift 3 | // 4 | // 5 | // Created by Alexey Pichukov on 19.08.2020. 6 | // 7 | 8 | import SwiftUI 9 | 10 | public enum ChartType { 11 | case line 12 | case curved 13 | } 14 | 15 | public enum ChartVisualType { 16 | case outline(color: Color, lineWidth: CGFloat) 17 | case filled(color: Color, lineWidth: CGFloat) 18 | case customFilled(color: Color, lineWidth: CGFloat, fillGradient: LinearGradient) 19 | } 20 | 21 | public enum CurrentValueLineType { 22 | case none 23 | case line(color: Color, lineWidth: CGFloat) 24 | case dash(color: Color, lineWidth: CGFloat, dash: [CGFloat]) 25 | } 26 | -------------------------------------------------------------------------------- /Sources/LightChart/Charts/CurvedChart.swift: -------------------------------------------------------------------------------- 1 | // 2 | // File.swift 3 | // 4 | // 5 | // Created by Alexey Pichukov on 20.08.2020. 6 | // 7 | 8 | import SwiftUI 9 | 10 | public struct CurvedChart: View { 11 | 12 | private let data: [Double] 13 | private let frame: CGRect 14 | private let offset: Double 15 | private let type: ChartVisualType 16 | private let currentValueLineType: CurrentValueLineType 17 | private var points: [CGPoint] = [] 18 | 19 | /// Creates a new `CurvedChart` 20 | /// 21 | /// - Parameters: 22 | /// - data: A data set that should be presented on the chart 23 | /// - frame: A frame from the parent view 24 | /// - visualType: A type of chart, `.outline` by default 25 | /// - offset: An offset for the chart, a space below the chart in percentage (0 - 1) 26 | /// For example `offset: 0.2` means that the chart will occupy 80% of the upper 27 | /// part of the view 28 | /// - currentValueLineType: A type of current value line (`none` for no line on chart) 29 | public init(data: [Double], 30 | frame: CGRect, 31 | visualType: ChartVisualType = .outline(color: .red, lineWidth: 2), 32 | offset: Double = 0, 33 | currentValueLineType: CurrentValueLineType = .none) { 34 | self.data = data 35 | self.frame = frame 36 | self.type = visualType 37 | self.offset = offset 38 | self.currentValueLineType = currentValueLineType 39 | self.points = points(forData: data, 40 | frame: frame, 41 | offset: offset, 42 | lineWidth: lineWidth(visualType: visualType)) 43 | } 44 | 45 | public var body: some View { 46 | ZStack { 47 | chart 48 | .rotationEffect(.degrees(180), anchor: .center) 49 | .rotation3DEffect(.degrees(180), axis: (x: 0, y: 1, z: 0)) 50 | .drawingGroup() 51 | line 52 | .rotationEffect(.degrees(180), anchor: .center) 53 | .rotation3DEffect(.degrees(180), axis: (x: 0, y: 1, z: 0)) 54 | .drawingGroup() 55 | } 56 | } 57 | 58 | private var chart: some View { 59 | switch type { 60 | case .outline(let color, let lineWidth): 61 | return AnyView(curvedPath(points: points) 62 | .stroke(color, style: StrokeStyle(lineWidth: lineWidth, lineJoin: .round))) 63 | case .filled(let color, let lineWidth): 64 | return AnyView(ZStack { 65 | curvedPathGradient(points: points) 66 | .fill(LinearGradient( 67 | gradient: .init(colors: [color.opacity(0.2), color.opacity(0.02)]), 68 | startPoint: .init(x: 0.5, y: 1), 69 | endPoint: .init(x: 0.5, y: 0) 70 | )) 71 | curvedPath(points: points) 72 | .stroke(color, style: StrokeStyle(lineWidth: lineWidth, lineJoin: .round)) 73 | }) 74 | case .customFilled(let color, let lineWidth, let fillGradient): 75 | return AnyView(ZStack { 76 | curvedPathGradient(points: points) 77 | .fill(fillGradient) 78 | curvedPath(points: points) 79 | .stroke(color, style: StrokeStyle(lineWidth: lineWidth, lineJoin: .round)) 80 | }) 81 | } 82 | } 83 | 84 | private var line: some View { 85 | switch currentValueLineType { 86 | case .none: 87 | return AnyView(EmptyView()) 88 | case .line(let color, let lineWidth): 89 | return AnyView( 90 | currentValueLinePath(points: points) 91 | .stroke(color, style: StrokeStyle(lineWidth: lineWidth)) 92 | ) 93 | case .dash(let color, let lineWidth, let dash): 94 | return AnyView( 95 | currentValueLinePath(points: points) 96 | .stroke(color, style: StrokeStyle(lineWidth: lineWidth, dash: dash)) 97 | ) 98 | } 99 | } 100 | 101 | // MARK: private functions 102 | 103 | private func curvedPath(points: [CGPoint]) -> Path { 104 | func mid(_ point1: CGPoint, _ point2: CGPoint) -> CGPoint { 105 | return CGPoint(x: (point1.x + point2.x) / 2, y:(point1.y + point2.y) / 2) 106 | } 107 | 108 | func control(_ point1: CGPoint, _ point2: CGPoint) -> CGPoint { 109 | var controlPoint = mid(point1, point2) 110 | let delta = abs(point2.y - controlPoint.y) 111 | 112 | if point1.y < point2.y { 113 | controlPoint.y += delta 114 | } else if point1.y > point2.y { 115 | controlPoint.y -= delta 116 | } 117 | 118 | return controlPoint 119 | } 120 | 121 | var path = Path() 122 | guard points.count > 1 else { 123 | return path 124 | } 125 | 126 | var startPoint = points[0] 127 | path.move(to: startPoint) 128 | 129 | guard points.count > 2 else { 130 | path.addLine(to: points[1]) 131 | return path 132 | } 133 | 134 | for i in 1.. Path { 148 | var path = curvedPath(points: points) 149 | guard let lastPoint = points.last else { 150 | return path 151 | } 152 | path.addLine(to: CGPoint(x: lastPoint.x, y: 0)) 153 | path.addLine(to: CGPoint(x: 0, y: 0)) 154 | path.addLine(to: CGPoint(x: 0, y: points[0].y)) 155 | 156 | return path 157 | } 158 | 159 | private func currentValueLinePath(points: [CGPoint]) -> Path { 160 | var path = Path() 161 | guard let lastPoint = points.last else { 162 | return path 163 | } 164 | path.move(to: CGPoint(x: 0, y: lastPoint.y)) 165 | path.addLine(to: lastPoint) 166 | return path 167 | } 168 | } 169 | 170 | extension CurvedChart: DataRepresentable { } 171 | -------------------------------------------------------------------------------- /Sources/LightChart/Charts/LineChart.swift: -------------------------------------------------------------------------------- 1 | // 2 | // LineChart.swift 3 | // 4 | // 5 | // Created by Alexey Pichukov on 19.08.2020. 6 | // 7 | 8 | import SwiftUI 9 | 10 | public struct LineChart: View { 11 | 12 | private let data: [Double] 13 | private let frame: CGRect 14 | private let offset: Double 15 | private let type: ChartVisualType 16 | private let currentValueLineType: CurrentValueLineType 17 | private var points: [CGPoint] = [] 18 | 19 | /// Creates a new `LineChart` 20 | /// 21 | /// - Parameters: 22 | /// - data: A data set that should be presented on the chart 23 | /// - frame: A frame from the parent view 24 | /// - visualType: A type of chart, `.outline` by default 25 | /// - offset: An offset for the chart, a space below the chart in percentage (0 - 1) 26 | /// For example `offset: 0.2` means that the chart will occupy 80% of the upper 27 | /// part of the view 28 | /// - currentValueLineType: A type of current value line (`none` for no line on chart) 29 | public init(data: [Double], 30 | frame: CGRect, 31 | visualType: ChartVisualType = .outline(color: .red, lineWidth: 2), 32 | offset: Double = 0, 33 | currentValueLineType: CurrentValueLineType = .none) { 34 | self.data = data 35 | self.frame = frame 36 | self.type = visualType 37 | self.offset = offset 38 | self.currentValueLineType = currentValueLineType 39 | self.points = points(forData: data, 40 | frame: frame, 41 | offset: offset, 42 | lineWidth: lineWidth(visualType: visualType)) 43 | } 44 | 45 | public var body: some View { 46 | ZStack { 47 | chart 48 | .rotationEffect(.degrees(180), anchor: .center) 49 | .rotation3DEffect(.degrees(180), axis: (x: 0, y: 1, z: 0)) 50 | .drawingGroup() 51 | line 52 | .rotationEffect(.degrees(180), anchor: .center) 53 | .rotation3DEffect(.degrees(180), axis: (x: 0, y: 1, z: 0)) 54 | .drawingGroup() 55 | } 56 | } 57 | 58 | private var chart: some View { 59 | switch type { 60 | case .outline(let color, let lineWidth): 61 | return AnyView(linePath(points: points) 62 | .stroke(color, style: StrokeStyle(lineWidth: lineWidth, lineJoin: .round))) 63 | case .filled(let color, let lineWidth): 64 | return AnyView(ZStack { 65 | linePathGradient(points: points) 66 | .fill(LinearGradient( 67 | gradient: .init(colors: [color.opacity(0.2), color.opacity(0.02)]), 68 | startPoint: .init(x: 0.5, y: 1), 69 | endPoint: .init(x: 0.5, y: 0) 70 | )) 71 | linePath(points: points) 72 | .stroke(color, style: StrokeStyle(lineWidth: lineWidth, lineJoin: .round)) 73 | }) 74 | case .customFilled(let color, let lineWidth, let fillGradient): 75 | return AnyView(ZStack { 76 | linePathGradient(points: points) 77 | .fill(fillGradient) 78 | linePath(points: points) 79 | .stroke(color, style: StrokeStyle(lineWidth: lineWidth, lineJoin: .round)) 80 | }) 81 | } 82 | } 83 | 84 | private var line: some View { 85 | switch currentValueLineType { 86 | case .none: 87 | return AnyView(EmptyView()) 88 | case .line(let color, let lineWidth): 89 | return AnyView( 90 | currentValueLinePath(points: points) 91 | .stroke(color, style: StrokeStyle(lineWidth: lineWidth)) 92 | ) 93 | case .dash(let color, let lineWidth, let dash): 94 | return AnyView( 95 | currentValueLinePath(points: points) 96 | .stroke(color, style: StrokeStyle(lineWidth: lineWidth, dash: dash)) 97 | ) 98 | } 99 | } 100 | 101 | // MARK: private functions 102 | 103 | private func linePath(points: [CGPoint]) -> Path { 104 | var path = Path() 105 | guard points.count > 1 else { 106 | return path 107 | } 108 | path.move(to: points[0]) 109 | for i in 1.. Path { 116 | var path = linePath(points: points) 117 | guard let lastPoint = points.last else { 118 | return path 119 | } 120 | path.addLine(to: CGPoint(x: lastPoint.x, y: 0)) 121 | path.addLine(to: CGPoint(x: 0, y: 0)) 122 | path.addLine(to: CGPoint(x: 0, y: points[0].y)) 123 | 124 | return path 125 | } 126 | 127 | private func currentValueLinePath(points: [CGPoint]) -> Path { 128 | var path = Path() 129 | guard let lastPoint = points.last else { 130 | return path 131 | } 132 | path.move(to: CGPoint(x: 0, y: lastPoint.y)) 133 | path.addLine(to: lastPoint) 134 | return path 135 | } 136 | } 137 | 138 | extension LineChart: DataRepresentable { } 139 | -------------------------------------------------------------------------------- /Sources/LightChart/DataRepresentable.swift: -------------------------------------------------------------------------------- 1 | // 2 | // DataRepresentable.swift 3 | // 4 | // 5 | // Created by Alexey Pichukov on 19.08.2020. 6 | // 7 | 8 | import Foundation 9 | import CoreGraphics 10 | 11 | protocol DataRepresentable { 12 | func points(forData data: [Double], frame: CGRect, offset: Double, lineWidth: CGFloat) -> [CGPoint] 13 | func lineWidth(visualType: ChartVisualType) -> CGFloat 14 | } 15 | 16 | extension DataRepresentable { 17 | 18 | func points(forData data: [Double], frame: CGRect, offset: Double, lineWidth: CGFloat) -> [CGPoint] { 19 | var vector = Math.stretchOut(Math.norm(data)) 20 | if offset != 0 { 21 | vector = Math.stretchIn(vector, offset: offset) 22 | } 23 | var points: [CGPoint] = [] 24 | let isSame = sameValues(in: vector) 25 | for i in 0.. CGFloat { 34 | switch visualType { 35 | case .outline(_, let lineWidth): 36 | return lineWidth 37 | case .filled(_, let lineWidth): 38 | return lineWidth 39 | case .customFilled(_, let lineWidth, _): 40 | return lineWidth 41 | } 42 | } 43 | 44 | private func sameValues(in vector: [Double]) -> Bool { 45 | guard let prev = vector.first else { 46 | return true 47 | } 48 | for value in vector { 49 | if value != prev { 50 | return false 51 | } 52 | } 53 | return true 54 | } 55 | } 56 | -------------------------------------------------------------------------------- /Sources/LightChart/LightChart.swift: -------------------------------------------------------------------------------- 1 | import SwiftUI 2 | 3 | public struct LightChartView: View { 4 | 5 | private let data: [Double] 6 | private let type: ChartType 7 | private let visualType: ChartVisualType 8 | private let offset: Double 9 | private let currentValueLineType: CurrentValueLineType 10 | 11 | public init(data: [Double], 12 | type: ChartType = .line, 13 | visualType: ChartVisualType = .outline(color: .red, lineWidth: 2), 14 | offset: Double = 0, 15 | currentValueLineType: CurrentValueLineType = .none) { 16 | self.data = data 17 | self.type = type 18 | self.visualType = visualType 19 | self.offset = offset 20 | self.currentValueLineType = currentValueLineType 21 | } 22 | 23 | public var body: some View { 24 | GeometryReader { reader in 25 | chart(withFrame: CGRect(x: 0, 26 | y: 0, 27 | width: reader.frame(in: .local).width , 28 | height: reader.frame(in: .local).height)) 29 | } 30 | } 31 | 32 | private func chart(withFrame frame: CGRect) -> AnyView { 33 | switch type { 34 | case .line: 35 | return AnyView( 36 | LineChart(data: data, 37 | frame: frame, 38 | visualType: visualType, 39 | offset: offset, 40 | currentValueLineType: currentValueLineType) 41 | ) 42 | case .curved: 43 | return AnyView( 44 | CurvedChart(data: data, 45 | frame: frame, 46 | visualType: visualType, 47 | offset: offset, 48 | currentValueLineType: currentValueLineType) 49 | ) 50 | } 51 | } 52 | } 53 | -------------------------------------------------------------------------------- /Sources/LightChart/Math.swift: -------------------------------------------------------------------------------- 1 | // 2 | // Math.swift 3 | // 4 | // 5 | // Created by Alexey Pichukov on 19.08.2020. 6 | // 7 | 8 | import Foundation 9 | import CoreGraphics 10 | 11 | struct Math { 12 | 13 | static func norm(_ vector: [Double]) -> [Double] { 14 | let norm = sqrt(Double(vector.reduce(0) { $0 + $1 * $1 })) 15 | return norm == 0 ? vector : vector.map { $0 / norm } 16 | } 17 | 18 | static func stretchOut(_ vector: [Double]) -> [Double] { 19 | guard let min = vector.min(), 20 | let rawMax = vector.max() else { 21 | return vector 22 | } 23 | let max = rawMax - min 24 | return vector.map { ($0 - min) / (max != 0 ? max : 1) } 25 | } 26 | 27 | static func stretchIn(_ vector: [Double], offset: Double) -> [Double] { 28 | guard let max = vector.max() else { 29 | return vector 30 | } 31 | let newMax = max - offset 32 | return vector.map { $0 * newMax + offset } 33 | } 34 | } 35 | -------------------------------------------------------------------------------- /Tests/LightChartTests/LightChartTests.swift: -------------------------------------------------------------------------------- 1 | import XCTest 2 | @testable import LightChart 3 | 4 | final class LightChartTests: XCTestCase { 5 | func testExample() { } 6 | 7 | static var allTests = [ 8 | ("testExample", testExample), 9 | ] 10 | } 11 | -------------------------------------------------------------------------------- /Tests/LightChartTests/XCTestManifests.swift: -------------------------------------------------------------------------------- 1 | import XCTest 2 | 3 | #if !canImport(ObjectiveC) 4 | public func allTests() -> [XCTestCaseEntry] { 5 | return [ 6 | testCase(LightChartTests.allTests), 7 | ] 8 | } 9 | #endif 10 | -------------------------------------------------------------------------------- /Tests/LinuxMain.swift: -------------------------------------------------------------------------------- 1 | import XCTest 2 | 3 | import LightChartTests 4 | 5 | var tests = [XCTestCaseEntry]() 6 | tests += LightChartTests.allTests() 7 | XCTMain(tests) 8 | --------------------------------------------------------------------------------