├── .coderabbit.yaml
├── .codespellignore
├── .github
└── workflows
│ ├── test_examples.yml
│ └── test_gis_examples.yml
├── .gitignore
├── .pre-commit-config.yaml
├── CONTRIBUTING.rst
├── LICENSE
├── README.md
├── codecov.yaml
├── examples
├── __init__.py
├── aco_tsp
│ ├── README.md
│ ├── aco_tsp
│ │ ├── __init__.py
│ │ ├── data
│ │ │ └── kroA100.tsp
│ │ └── model.py
│ ├── app.py
│ └── run_tsp.py
├── bank_reserves
│ ├── Readme.md
│ ├── app.py
│ ├── bank_reserves
│ │ ├── agents.py
│ │ └── model.py
│ ├── batch_run.py
│ └── requirements.txt
├── boltzmann_wealth_model_network
│ ├── README.md
│ ├── app.py
│ └── boltzmann_wealth_model_network
│ │ ├── __init__.py
│ │ ├── agents.py
│ │ └── model.py
├── caching_and_replay
│ ├── README.md
│ ├── cacheablemodel.py
│ ├── model.py
│ ├── requirements.txt
│ ├── run.py
│ └── server.py
├── charts
│ ├── Readme.md
│ ├── charts
│ │ ├── agents.py
│ │ ├── model.py
│ │ └── server.py
│ ├── requirements.txt
│ └── run.py
├── color_patches
│ ├── Readme.md
│ ├── app.py
│ ├── color_patches
│ │ ├── __init__.py
│ │ └── model.py
│ └── requirements.txt
├── conways_game_of_life_fast
│ ├── GoL_fast_screenshot.png
│ ├── Readme.md
│ ├── app.py
│ └── model.py
├── el_farol
│ ├── README.md
│ ├── el_farol.ipynb
│ ├── el_farol
│ │ ├── __init__.py
│ │ ├── agents.py
│ │ └── model.py
│ ├── requirements.txt
│ └── tests.py
├── forest_fire
│ ├── Forest Fire Model.ipynb
│ ├── app.py
│ ├── forest_fire
│ │ ├── __init__.py
│ │ ├── agent.py
│ │ └── model.py
│ ├── readme.md
│ └── requirements.txt
├── hex_snowflake
│ ├── Readme.md
│ ├── hex_snowflake
│ │ ├── cell.py
│ │ ├── model.py
│ │ ├── portrayal.py
│ │ └── server.py
│ ├── requirements.txt
│ └── run.py
├── hotelling_law
│ ├── Readme.md
│ ├── __init__.py
│ ├── app.py
│ ├── hotelling_law
│ │ ├── __init__.py
│ │ ├── agents.py
│ │ └── model.py
│ ├── hotelling_law_sim.png
│ ├── requirements.txt
│ └── tests.py
├── shape_example
│ ├── Readme.md
│ ├── requirements.txt
│ ├── run.py
│ └── shape_example
│ │ ├── model.py
│ │ └── server.py
├── termites
│ ├── README.md
│ ├── app.py
│ └── termites
│ │ ├── __init__.py
│ │ ├── agents.py
│ │ └── model.py
└── warehouse
│ ├── Readme.md
│ ├── app.py
│ ├── requirements.txt
│ └── warehouse
│ ├── __init__.py
│ ├── agents.py
│ ├── make_warehouse.py
│ └── model.py
├── gis
├── agents_and_networks
│ ├── .gitignore
│ ├── README.md
│ ├── app.py
│ ├── data
│ │ ├── gmu
│ │ │ ├── Mason_Rds.zip
│ │ │ ├── Mason_bld.zip
│ │ │ ├── Mason_walkway_line.zip
│ │ │ ├── hydrol.zip
│ │ │ └── hydrop.zip
│ │ └── ub
│ │ │ ├── UB_Rds.zip
│ │ │ ├── UB_bld.zip
│ │ │ ├── UB_walkway_line.zip
│ │ │ ├── hydrol.zip
│ │ │ └── hydrop.zip
│ ├── outputs
│ │ └── .gitkeep
│ ├── references
│ │ └── GMU-Social.nlogo
│ ├── requirements.txt
│ ├── setup.py
│ └── src
│ │ ├── __init__.py
│ │ ├── agent
│ │ ├── __init__.py
│ │ ├── building.py
│ │ ├── commuter.py
│ │ └── geo_agents.py
│ │ ├── logger.py
│ │ ├── model
│ │ ├── __init__.py
│ │ └── model.py
│ │ ├── space
│ │ ├── __init__.py
│ │ ├── campus.py
│ │ ├── road_network.py
│ │ └── utils.py
│ │ └── visualization
│ │ ├── __init__.py
│ │ └── utils.py
├── geo_schelling
│ ├── README.md
│ ├── app.py
│ ├── data
│ │ └── nuts_rg_60M_2013_lvl_2.geojson
│ ├── model.py
│ └── requirements.txt
├── geo_schelling_points
│ ├── README.md
│ ├── app.py
│ ├── data
│ │ └── nuts_rg_60M_2013_lvl_2.geojson
│ ├── geo_schelling_points
│ │ ├── __init__.py
│ │ ├── agents.py
│ │ ├── model.py
│ │ └── space.py
│ └── requirements.txt
├── geo_sir
│ ├── README.md
│ ├── app.py
│ ├── data
│ │ └── TorontoNeighbourhoods.geojson
│ ├── geo_sir
│ │ ├── __init__.py
│ │ ├── agents.py
│ │ └── model.py
│ └── requirements.txt
├── population
│ ├── README.md
│ ├── app.py
│ ├── data
│ │ ├── clip.zip
│ │ ├── lake.zip
│ │ └── popu.asc.gz
│ ├── population
│ │ ├── __init__.py
│ │ ├── model.py
│ │ └── space.py
│ └── requirements.txt
├── rainfall
│ ├── README.md
│ ├── app.py
│ ├── data
│ │ └── elevation.asc.gz
│ ├── rainfall
│ │ ├── __init__.py
│ │ ├── model.py
│ │ └── space.py
│ └── requirements.txt
└── urban_growth
│ ├── README.md
│ ├── app.py
│ ├── data
│ ├── excluded_santafe.asc.gz
│ ├── landuse_santafe.asc.gz
│ ├── road1_santafe.asc.gz
│ ├── slope_santafe.asc.gz
│ └── urban_santafe.asc.gz
│ ├── requirements.txt
│ └── urban_growth
│ ├── __init__.py
│ ├── model.py
│ └── space.py
├── pyproject.toml
├── rl
├── .gitignore
├── README.md
├── Tutorials.ipynb
├── boltzmann_money
│ ├── README.md
│ ├── model.py
│ ├── ppo_agent.gif
│ ├── server.py
│ └── train.py
├── epstein_civil_violence
│ ├── README.md
│ ├── agent.py
│ ├── model.py
│ ├── resources
│ │ └── epstein.gif
│ ├── server.py
│ ├── train_config.py
│ └── utility.py
├── example.py
├── requirements.txt
├── train.py
└── wolf_sheep
│ ├── README.md
│ ├── agents.py
│ ├── app.py
│ ├── model.py
│ ├── resources
│ ├── sheep.png
│ ├── wolf.png
│ └── wolf_sheep.gif
│ ├── train_config.py
│ └── utility.py
├── setup.cfg
├── test_examples.py
└── test_gis_examples.py
/.coderabbit.yaml:
--------------------------------------------------------------------------------
1 | language: en-US
2 | tone_instructions: ''
3 | early_access: false
4 | enable_free_tier: true
5 | reviews:
6 | profile: chill
7 | request_changes_workflow: false
8 | high_level_summary: true
9 | high_level_summary_placeholder: '@coderabbitai summary'
10 | high_level_summary_in_walkthrough: false
11 | auto_title_placeholder: '@coderabbitai'
12 | auto_title_instructions: ''
13 | review_status: false
14 | commit_status: true
15 | fail_commit_status: false
16 | collapse_walkthrough: false
17 | changed_files_summary: true
18 | sequence_diagrams: true
19 | assess_linked_issues: true
20 | related_issues: true
21 | related_prs: true
22 | suggested_labels: true
23 | auto_apply_labels: false
24 | suggested_reviewers: true
25 | auto_assign_reviewers: false
26 | poem: true
27 | labeling_instructions: []
28 | path_filters: []
29 | path_instructions: []
30 | abort_on_close: true
31 | disable_cache: false
32 | auto_review:
33 | enabled: false
34 | auto_incremental_review: false
35 | ignore_title_keywords: []
36 | labels: []
37 | drafts: false
38 | base_branches: []
39 | finishing_touches:
40 | docstrings:
41 | enabled: true
42 | tools:
43 | ast-grep:
44 | rule_dirs: []
45 | util_dirs: []
46 | essential_rules: true
47 | packages: []
48 | shellcheck:
49 | enabled: true
50 | ruff:
51 | enabled: true
52 | markdownlint:
53 | enabled: true
54 | github-checks:
55 | enabled: true
56 | timeout_ms: 180000
57 | languagetool:
58 | enabled: true
59 | enabled_rules: []
60 | disabled_rules: []
61 | enabled_categories: []
62 | disabled_categories: []
63 | enabled_only: false
64 | level: default
65 | biome:
66 | enabled: true
67 | hadolint:
68 | enabled: true
69 | swiftlint:
70 | enabled: true
71 | phpstan:
72 | enabled: true
73 | level: default
74 | golangci-lint:
75 | enabled: true
76 | yamllint:
77 | enabled: true
78 | gitleaks:
79 | enabled: true
80 | checkov:
81 | enabled: true
82 | detekt:
83 | enabled: true
84 | eslint:
85 | enabled: true
86 | rubocop:
87 | enabled: true
88 | buf:
89 | enabled: true
90 | regal:
91 | enabled: true
92 | actionlint:
93 | enabled: true
94 | pmd:
95 | enabled: true
96 | cppcheck:
97 | enabled: true
98 | semgrep:
99 | enabled: true
100 | circleci:
101 | enabled: true
102 | sqlfluff:
103 | enabled: true
104 | prismaLint:
105 | enabled: true
106 | oxc:
107 | enabled: true
108 | shopifyThemeCheck:
109 | enabled: true
110 | chat:
111 | auto_reply: true
112 | create_issues: true
113 | integrations:
114 | jira:
115 | usage: auto
116 | linear:
117 | usage: auto
118 | knowledge_base:
119 | opt_out: false
120 | web_search:
121 | enabled: true
122 | learnings:
123 | scope: auto
124 | issues:
125 | scope: auto
126 | jira:
127 | usage: auto
128 | project_keys: []
129 | linear:
130 | usage: auto
131 | team_keys: []
132 | pull_requests:
133 | scope: auto
134 | code_generation:
135 | docstrings:
136 | language: en-US
137 | path_instructions: []
138 |
--------------------------------------------------------------------------------
/.codespellignore:
--------------------------------------------------------------------------------
1 | hist
2 | hart
3 | mutch
4 | ist
5 | inactivate
6 | ue
7 | fpr
8 | falsy
9 | assertIn
10 | nD
--------------------------------------------------------------------------------
/.github/workflows/test_examples.yml:
--------------------------------------------------------------------------------
1 | name: Test example models
2 |
3 | on:
4 | push:
5 | paths:
6 | - 'examples/**/*.py' # If an example model is modified
7 | - 'test_examples.py' # If the test script is modified
8 | - '.github/workflows/test_examples.yml' # If this workflow is modified
9 | pull_request:
10 | paths:
11 | - 'examples/**/*.py'
12 | - 'test_examples.py'
13 | - '.github/workflows/test_examples.yml'
14 | workflow_dispatch:
15 | schedule:
16 | - cron: '0 6 * * 1' # Monday at 6:00 UTC
17 |
18 | jobs:
19 | # build-stable:
20 | # runs-on: ubuntu-latest
21 | # steps:
22 | # - uses: actions/checkout@v4
23 | # - name: Set up Python
24 | # uses: actions/setup-python@v5
25 | # with:
26 | # python-version: "3.12"
27 | # - name: Install dependencies
28 | # run: pip install mesa[network] pytest
29 | # - name: Test with pytest
30 | # run: pytest -rA -Werror test_examples.py
31 |
32 | build-pre:
33 | runs-on: ubuntu-latest
34 | steps:
35 | - uses: actions/checkout@v4
36 | - name: Set up Python
37 | uses: actions/setup-python@v5
38 | with:
39 | python-version: "3.12"
40 | - name: Install dependencies
41 | run: |
42 | pip install mesa[network] --pre
43 | pip install .[test]
44 | - name: Test with pytest
45 | run: pytest -rA -Werror -Wdefault::FutureWarning test_examples.py
46 |
47 | build-main:
48 | runs-on: ubuntu-latest
49 | steps:
50 | - uses: actions/checkout@v4
51 | - name: Set up Python
52 | uses: actions/setup-python@v5
53 | with:
54 | python-version: "3.12"
55 | - name: Install dependencies
56 | run: |
57 | pip install .[test]
58 | pip install -U git+https://github.com/projectmesa/mesa@main#egg=mesa[network]
59 | - name: Test with pytest
60 | run: pytest -rA -Werror -Wdefault::FutureWarning test_examples.py
61 |
--------------------------------------------------------------------------------
/.github/workflows/test_gis_examples.yml:
--------------------------------------------------------------------------------
1 | name: Test GIS models
2 |
3 | on:
4 | push:
5 | paths:
6 | - 'gis/**/*.py' # If a gis model is modified
7 | - 'test_gis_examples.py' # If the gis test script is modified
8 | - '.github/workflows/test_gis_examples.yml' # If this workflow is modified
9 | pull_request:
10 | paths:
11 | - 'gis/**/*.py'
12 | - 'test_gis_examples.py'
13 | - '.github/workflows/test_gis_examples.yml'
14 | workflow_dispatch:
15 | schedule:
16 | - cron: '0 6 * * 1' # Monday at 6:00 UTC
17 |
18 | jobs:
19 | # build-stable:
20 | # runs-on: ubuntu-latest
21 | # steps:
22 | # - uses: actions/checkout@v4
23 | # - name: Set up Python
24 | # uses: actions/setup-python@v5
25 | # with:
26 | # python-version: "3.12"
27 | # - name: Install dependencies
28 | # run: pip install mesa pytest
29 | # - name: Test with pytest
30 | # run: pytest -rA -Werror test_examples.py
31 |
32 | build-pre:
33 | runs-on: ubuntu-latest
34 | steps:
35 | - uses: actions/checkout@v4
36 | - name: Set up Python
37 | uses: actions/setup-python@v5
38 | with:
39 | python-version: "3.12"
40 | - name: Install dependencies
41 | run: |
42 | pip install mesa-geo --pre
43 | pip install .[test_gis]
44 | - name: Test with pytest
45 | run: pytest -rA -Werror test_gis_examples.py
46 |
47 | build-main:
48 | runs-on: ubuntu-latest
49 | steps:
50 | - uses: actions/checkout@v4
51 | - name: Set up Python
52 | uses: actions/setup-python@v5
53 | with:
54 | python-version: "3.12"
55 | - name: Install dependencies
56 | run: |
57 | pip install -U git+https://github.com/projectmesa/mesa-geo@main#egg=mesa-geo
58 | pip install .[test_gis]
59 | - name: Test with pytest
60 | run: pytest -rA -Werror test_gis_examples.py --cov-report=xml
61 | - name: Codecov
62 | uses: codecov/codecov-action@v5
63 | with:
64 | fail_ci_if_error: true
65 | token: ${{ secrets.CODECOV_TOKEN }}
66 |
--------------------------------------------------------------------------------
/.gitignore:
--------------------------------------------------------------------------------
1 | # Byte-compiled / optimized / DLL files
2 | __pycache__/
3 | *.py[cod]
4 |
5 | # C extensions
6 | *.so
7 |
8 | # Distribution / packaging
9 | .Python
10 | env/
11 | build/
12 | develop-eggs/
13 | dist/
14 | downloads/
15 | eggs/
16 | .eggs/
17 | lib/
18 | lib64/
19 | parts/
20 | sdist/
21 | var/
22 | *.egg-info/
23 | .installed.cfg
24 | *.egg
25 |
26 | # ignore RL file - users download model on own
27 | rl
28 |
29 | # PyInstaller
30 | # Usually these files are written by a python script from a template
31 | # before PyInstaller builds the exe, so as to inject date/other infos into it.
32 | *.manifest
33 | *.spec
34 |
35 | # Installer logs
36 | pip-log.txt
37 | pip-delete-this-directory.txt
38 |
39 | # Unit test / coverage reports
40 | htmlcov/
41 | .tox/
42 | .coverage
43 | .coverage.*
44 | .cache
45 | nosetests.xml
46 | coverage.xml
47 | *,cover
48 |
49 | # Translations
50 | *.mo
51 | *.pot
52 |
53 | # Django stuff:
54 | *.log
55 |
56 | # Sphinx documentation
57 | docs/_build/
58 |
59 | # PyBuilder
60 | target/
61 |
62 | # Jupyter and iPython notebook checkpoints
63 | *.ipynb_checkpoints
64 | *.virtual_documents
65 |
66 | # Spyder app workspace config file
67 | .spyderworkspace
68 |
69 | # PyCharm environment files
70 | .idea/
71 |
72 | # VSCode environment files
73 | .vscode/
74 | *.code-workspace
75 |
76 | # Apple OSX
77 | *.DS_Store
78 |
79 | # mypy
80 | .mypy_cache/
81 | .dmypy.json
82 | dmypy.json
83 |
84 | # Virtual environment
85 | venv/
86 |
87 | examples/caching_and_replay/my_cache_file_path.cache
88 |
--------------------------------------------------------------------------------
/.pre-commit-config.yaml:
--------------------------------------------------------------------------------
1 | ci:
2 | autoupdate_schedule: 'monthly'
3 |
4 | repos:
5 | - repo: https://github.com/astral-sh/ruff-pre-commit
6 | # Ruff version.
7 | rev: v0.11.8
8 | hooks:
9 | # Run the linter.
10 | - id: ruff
11 | types_or: [ python, pyi, jupyter ]
12 | args: [ --fix ]
13 | # Run the formatter.
14 | - id: ruff-format
15 | types_or: [ python, pyi, jupyter ]
16 | - repo: https://github.com/asottile/pyupgrade
17 | rev: v3.19.1
18 | hooks:
19 | - id: pyupgrade
20 | args: [--py311-plus]
21 | - repo: https://github.com/pre-commit/pre-commit-hooks
22 | rev: v5.0.0 # Use the ref you want to point at
23 | hooks:
24 | - id: trailing-whitespace
25 | - id: check-toml
26 | - id: check-yaml
27 | - repo: https://github.com/codespell-project/codespell
28 | rev: v2.4.1
29 | hooks:
30 | - id: codespell
31 | args: [
32 | "--ignore-words",
33 | ".codespellignore",
34 | ]
35 |
--------------------------------------------------------------------------------
/LICENSE:
--------------------------------------------------------------------------------
1 | Copyright 2022 Core Mesa Team and contributors
2 |
3 | Licensed under the Apache License, Version 2.0 (the "License");
4 | you may not use this file except in compliance with the License.
5 | You may obtain a copy of the License at
6 |
7 | http://www.apache.org/licenses/LICENSE-2.0
8 |
9 | Unless required by applicable law or agreed to in writing, software
10 | distributed under the License is distributed on an "AS IS" BASIS,
11 | WITHOUT WARRANTIES OR CONDITIONS OF ANY KIND, either express or implied.
12 | See the License for the specific language governing permissions and
13 | limitations under the License.
--------------------------------------------------------------------------------
/codecov.yaml:
--------------------------------------------------------------------------------
1 | coverage:
2 | status:
3 | project:
4 | default:
5 | target: 80%
6 | threshold: 1%
7 |
8 | ignore: []
9 |
10 | comment: off
11 |
--------------------------------------------------------------------------------
/examples/__init__.py:
--------------------------------------------------------------------------------
https://raw.githubusercontent.com/projectmesa/mesa-examples/6ba22dc41ebc37c3ef9f69bd2a6a22bfa08cd128/examples/__init__.py
--------------------------------------------------------------------------------
/examples/aco_tsp/aco_tsp/__init__.py:
--------------------------------------------------------------------------------
https://raw.githubusercontent.com/projectmesa/mesa-examples/6ba22dc41ebc37c3ef9f69bd2a6a22bfa08cd128/examples/aco_tsp/aco_tsp/__init__.py
--------------------------------------------------------------------------------
/examples/aco_tsp/aco_tsp/data/kroA100.tsp:
--------------------------------------------------------------------------------
1 | NAME: kroA100
2 | TYPE: TSP
3 | COMMENT: 100-city problem A (Krolak/Felts/Nelson)
4 | DIMENSION: 100
5 | EDGE_WEIGHT_TYPE : EUC_2D
6 | NODE_COORD_SECTION
7 | 1 1380 939
8 | 2 2848 96
9 | 3 3510 1671
10 | 4 457 334
11 | 5 3888 666
12 | 6 984 965
13 | 7 2721 1482
14 | 8 1286 525
15 | 9 2716 1432
16 | 10 738 1325
17 | 11 1251 1832
18 | 12 2728 1698
19 | 13 3815 169
20 | 14 3683 1533
21 | 15 1247 1945
22 | 16 123 862
23 | 17 1234 1946
24 | 18 252 1240
25 | 19 611 673
26 | 20 2576 1676
27 | 21 928 1700
28 | 22 53 857
29 | 23 1807 1711
30 | 24 274 1420
31 | 25 2574 946
32 | 26 178 24
33 | 27 2678 1825
34 | 28 1795 962
35 | 29 3384 1498
36 | 30 3520 1079
37 | 31 1256 61
38 | 32 1424 1728
39 | 33 3913 192
40 | 34 3085 1528
41 | 35 2573 1969
42 | 36 463 1670
43 | 37 3875 598
44 | 38 298 1513
45 | 39 3479 821
46 | 40 2542 236
47 | 41 3955 1743
48 | 42 1323 280
49 | 43 3447 1830
50 | 44 2936 337
51 | 45 1621 1830
52 | 46 3373 1646
53 | 47 1393 1368
54 | 48 3874 1318
55 | 49 938 955
56 | 50 3022 474
57 | 51 2482 1183
58 | 52 3854 923
59 | 53 376 825
60 | 54 2519 135
61 | 55 2945 1622
62 | 56 953 268
63 | 57 2628 1479
64 | 58 2097 981
65 | 59 890 1846
66 | 60 2139 1806
67 | 61 2421 1007
68 | 62 2290 1810
69 | 63 1115 1052
70 | 64 2588 302
71 | 65 327 265
72 | 66 241 341
73 | 67 1917 687
74 | 68 2991 792
75 | 69 2573 599
76 | 70 19 674
77 | 71 3911 1673
78 | 72 872 1559
79 | 73 2863 558
80 | 74 929 1766
81 | 75 839 620
82 | 76 3893 102
83 | 77 2178 1619
84 | 78 3822 899
85 | 79 378 1048
86 | 80 1178 100
87 | 81 2599 901
88 | 82 3416 143
89 | 83 2961 1605
90 | 84 611 1384
91 | 85 3113 885
92 | 86 2597 1830
93 | 87 2586 1286
94 | 88 161 906
95 | 89 1429 134
96 | 90 742 1025
97 | 91 1625 1651
98 | 92 1187 706
99 | 93 1787 1009
100 | 94 22 987
101 | 95 3640 43
102 | 96 3756 882
103 | 97 776 392
104 | 98 1724 1642
105 | 99 198 1810
106 | 100 3950 1558
107 | EOF
--------------------------------------------------------------------------------
/examples/aco_tsp/app.py:
--------------------------------------------------------------------------------
1 | """Configure visualization elements and instantiate a server"""
2 |
3 | import networkx as nx
4 | import solara
5 | from aco_tsp.model import AcoTspModel, TSPGraph
6 | from matplotlib.figure import Figure
7 | from mesa.visualization import SolaraViz, make_plot_component
8 |
9 |
10 | def circle_portrayal_example(agent):
11 | return {"node_size": 20, "width": 0.1}
12 |
13 |
14 | tsp_graph = TSPGraph.from_tsp_file("aco_tsp/data/kroA100.tsp")
15 | model_params = {
16 | "num_agents": tsp_graph.num_cities,
17 | "tsp_graph": tsp_graph,
18 | "ant_alpha": {
19 | "type": "SliderFloat",
20 | "value": 1.0,
21 | "label": "Alpha: pheromone exponent",
22 | "min": 0.0,
23 | "max": 10.0,
24 | "step": 0.1,
25 | },
26 | "ant_beta": {
27 | "type": "SliderFloat",
28 | "value": 5.0,
29 | "label": "Beta: heuristic exponent",
30 | "min": 0.0,
31 | "max": 10.0,
32 | "step": 0.1,
33 | },
34 | }
35 |
36 | model = AcoTspModel()
37 |
38 |
39 | def make_graph(model):
40 | fig = Figure()
41 | ax = fig.subplots()
42 | ax.set_title("Cities and pheromone trails")
43 | graph = model.grid.G
44 | pos = model.tsp_graph.pos
45 | weights = [graph[u][v]["pheromone"] for u, v in graph.edges()]
46 | # normalize the weights
47 | weights = [w / max(weights) for w in weights]
48 |
49 | nx.draw(
50 | graph,
51 | ax=ax,
52 | pos=pos,
53 | node_size=10,
54 | width=weights,
55 | edge_color="gray",
56 | )
57 |
58 | return solara.FigureMatplotlib(fig)
59 |
60 |
61 | def ant_level_distances(model):
62 | # ant_distances = model.datacollector.get_agent_vars_dataframe()
63 | # Plot so that the step index is the x-axis, there's a line for each agent,
64 | # and the y-axis is the distance traveled
65 | # ant_distances['tsp_distance'].unstack(level=1).plot(ax=ax)
66 | pass
67 |
68 |
69 | page = SolaraViz(
70 | model,
71 | components=[
72 | make_plot_component(["best_distance_iter", "best_distance"]),
73 | make_graph,
74 | ],
75 | model_params=model_params,
76 | play_interval=1,
77 | )
78 |
--------------------------------------------------------------------------------
/examples/aco_tsp/run_tsp.py:
--------------------------------------------------------------------------------
1 | from collections import defaultdict
2 |
3 | import matplotlib.pyplot as plt
4 | from aco_tsp.model import AcoTspModel, TSPGraph
5 |
6 |
7 | def main():
8 | # tsp_graph = TSPGraph.from_random(num_cities=20, seed=1)
9 | tsp_graph = TSPGraph.from_tsp_file("aco_tsp/data/kroA100.tsp")
10 | model_params = {
11 | "num_agents": tsp_graph.num_cities,
12 | "tsp_graph": tsp_graph,
13 | }
14 | number_of_episodes = 50
15 |
16 | results = defaultdict(list)
17 |
18 | best_path = None
19 | best_distance = float("inf")
20 |
21 | model = AcoTspModel(**model_params)
22 |
23 | for e in range(number_of_episodes):
24 | # model = AcoTspModel(**model_params)
25 | model.step()
26 | results["best_distance"].append(model.best_distance)
27 | results["best_path"].append(model.best_path)
28 | print(
29 | f"Episode={e + 1}; Min. distance={model.best_distance:.2f}; pheromone_1_8={model.grid.G[17][15]['pheromone']:.4f}"
30 | )
31 | if model.best_distance < best_distance:
32 | best_distance = model.best_distance
33 | best_path = model.best_path
34 | print(f"New best distance: distance={best_distance:.2f}")
35 |
36 | print(f"Best distance: {best_distance:.2f}")
37 | print(f"Best path: {best_path}")
38 | # print(model.datacollector.get_model_vars_dataframe())
39 |
40 | _, ax = plt.subplots()
41 | ax.plot(results["best_distance"])
42 | ax.set(xlabel="Episode", ylabel="Best distance", title="Best distance per episode")
43 | plt.show()
44 |
45 |
46 | if __name__ == "__main__":
47 | main()
48 |
--------------------------------------------------------------------------------
/examples/bank_reserves/Readme.md:
--------------------------------------------------------------------------------
1 | # Bank Reserves Model
2 |
3 | ## Summary
4 |
5 | A highly abstracted, simplified model of an economy, with only one type of agent and a single bank representing all banks in an economy. People (represented by circles) move randomly within the grid. If two or more people are on the same grid location, there is a 50% chance that they will trade with each other. If they trade, there is an equal chance of giving the other agent $5 or $2. A positive trade balance will be deposited in the bank as savings. If trading results in a negative balance, the agent will try to withdraw from its savings to cover the balance. If it does not have enough savings to cover the negative balance, it will take out a loan from the bank to cover the difference. The bank is required to keep a certain percentage of deposits as reserves. If run.py is used to run the model, then the percent of deposits the bank is required to retain is a user settable parameter. The amount the bank is able to loan at any given time is a function of the amount of deposits, its reserves, and its current total outstanding loan amount.
6 |
7 | The model demonstrates the following Mesa features:
8 | - MultiGrid for creating shareable space for agents
9 | - DataCollector for collecting data on individual model runs
10 | - Slider for adjusting initial model parameters
11 | - ModularServer for visualization of agent interaction
12 | - Agent object inheritance
13 | - Using a BatchRunner to collect data on multiple combinations of model parameters
14 |
15 | ## Installation
16 |
17 | To install the dependencies use pip and the requirements.txt in this directory. e.g.
18 |
19 | ```
20 | $ pip install -r requirements.txt
21 | ```
22 |
23 | ## Interactive Model Run
24 |
25 | To run the model interactively, use `solara run app.py` in this directory:
26 |
27 | ```
28 | $ solara run app.py
29 | ```
30 |
31 | Then open your browser to [http://localhost:8765/](http://localhost:8765/), select the model parameters, press Reset, then Start.
32 |
33 | ## Batch Run
34 |
35 | To run the model as a batch run to collect data on multiple combinations of model parameters, run "batch_run.py" in this directory.
36 |
37 | ```
38 | $ python batch_run.py
39 | ```
40 | A progress status bar will display.
41 |
42 | To update the parameters to test other parameter sweeps, edit the list of parameters in the dictionary named "br_params" in "batch_run.py".
43 |
44 | ## Files
45 |
46 | * ``app.py``: Launches visualization on Solara. Customize the visualization here.
47 | * ``bank_reserves/random_walker.py``: This defines a class that inherits from the Mesa Agent class. The main purpose is to provide a method for agents to move randomly one cell at a time.
48 | * ``bank_reserves/agents.py``: Defines the People and Bank classes.
49 | * ``bank_reserves/model.py``: Defines the Bank Reserves model and the DataCollector functions.
50 | * ``batch_run.py``: Basically the same as model.py, but includes a Mesa BatchRunner. The result of the batch run will be a .csv file with the data from every step of every run.
51 |
52 | ## Further Reading
53 |
54 | This model is a Mesa implementation of the Bank Reserves model from NetLogo:
55 |
56 | Wilensky, U. (1998). NetLogo Bank Reserves model. http://ccl.northwestern.edu/netlogo/models/BankReserves. Center for Connected Learning and Computer-Based Modeling, Northwestern University, Evanston, IL.
57 |
58 |
--------------------------------------------------------------------------------
/examples/bank_reserves/app.py:
--------------------------------------------------------------------------------
1 | from bank_reserves.agents import Person
2 | from bank_reserves.model import BankReservesModel
3 | from mesa.visualization import (
4 | SolaraViz,
5 | make_plot_component,
6 | make_space_component,
7 | )
8 | from mesa.visualization.user_param import (
9 | Slider,
10 | )
11 |
12 | # The colors here are taken from Matplotlib's tab10 palette
13 | # Green
14 | RICH_COLOR = "#2ca02c"
15 | # Red
16 | POOR_COLOR = "#d62728"
17 | # Blue
18 | MID_COLOR = "#1f77b4"
19 |
20 |
21 | def person_portrayal(agent):
22 | if agent is None:
23 | return
24 |
25 | portrayal = {}
26 |
27 | # update portrayal characteristics for each Person object
28 | if isinstance(agent, Person):
29 | portrayal["Shape"] = "circle"
30 | portrayal["r"] = 0.5
31 | portrayal["Layer"] = 0
32 | portrayal["Filled"] = "true"
33 |
34 | color = MID_COLOR
35 |
36 | # set agent color based on savings and loans
37 | if agent.savings > agent.model.rich_threshold:
38 | color = RICH_COLOR
39 | if agent.savings < 10 and agent.loans < 10:
40 | color = MID_COLOR
41 | if agent.loans > 10:
42 | color = POOR_COLOR
43 |
44 | portrayal["color"] = color
45 |
46 | return portrayal
47 |
48 |
49 | def post_process_space(ax):
50 | ax.set_aspect("equal")
51 | ax.set_xticks([])
52 | ax.set_yticks([])
53 |
54 |
55 | def post_process_lines(ax):
56 | ax.legend(loc="center left", bbox_to_anchor=(1, 0.9))
57 |
58 |
59 | # dictionary of user settable parameters - these map to the model __init__ parameters
60 | model_params = {
61 | "init_people": Slider(
62 | "People",
63 | 25,
64 | 1,
65 | 200,
66 | # description="Initial Number of People"
67 | ),
68 | "rich_threshold": Slider(
69 | "Rich Threshold",
70 | 10,
71 | 1,
72 | 20,
73 | # description="Upper End of Random Initial Wallet Amount",
74 | ),
75 | "reserve_percent": Slider(
76 | "Reserves",
77 | 50,
78 | 1,
79 | 100,
80 | # description="Percent of deposits the bank has to hold in reserve",
81 | ),
82 | }
83 |
84 | space_component = make_space_component(
85 | person_portrayal,
86 | draw_grid=False,
87 | post_process=post_process_space,
88 | )
89 | lineplot_component = make_plot_component(
90 | {"Rich": RICH_COLOR, "Poor": POOR_COLOR, "Middle Class": MID_COLOR},
91 | post_process=post_process_lines,
92 | )
93 | model = BankReservesModel()
94 |
95 | page = SolaraViz(
96 | model,
97 | components=[space_component, lineplot_component],
98 | model_params=model_params,
99 | name="Bank Reserves Model",
100 | )
101 | page # noqa
102 |
--------------------------------------------------------------------------------
/examples/bank_reserves/batch_run.py:
--------------------------------------------------------------------------------
1 | """The following code was adapted from the Bank Reserves model included in Netlogo
2 | Model information can be found at:
3 | http://ccl.northwestern.edu/netlogo/models/BankReserves
4 | Accessed on: November 2, 2017
5 | Author of NetLogo code:
6 | Wilensky, U. (1998). NetLogo Bank Reserves model.
7 | http://ccl.northwestern.edu/netlogo/models/BankReserves.
8 | Center for Connected Learning and Computer-Based Modeling,
9 | Northwestern University, Evanston, IL.
10 |
11 | This version of the model has a BatchRunner at the bottom. This
12 | is for collecting data on parameter sweeps. It is not meant to
13 | be run with run.py, since run.py starts up a server for visualization, which
14 | isn't necessary for the BatchRunner. To run a parameter sweep, call
15 | batch_run.py in the command line.
16 |
17 | The BatchRunner is set up to collect step by step data of the model. It does
18 | this by collecting the DataCollector object in a model_reporter (i.e. the
19 | DataCollector is collecting itself every step).
20 |
21 | The end result of the batch run will be a CSV file created in the same
22 | directory from which Python was run. The CSV file will contain the data from
23 | every step of every run.
24 | """
25 |
26 | import mesa
27 | import pandas as pd
28 | from bank_reserves.model import BankReservesModel
29 |
30 |
31 | def main():
32 | # parameter lists for each parameter to be tested in batch run
33 | br_params = {
34 | "init_people": [25, 100],
35 | "rich_threshold": [5, 10],
36 | "reserve_percent": 5,
37 | }
38 |
39 | # The existing batch run logic here
40 | data = mesa.batch_run(
41 | BankReservesModel,
42 | br_params,
43 | )
44 | br_df = pd.DataFrame(data)
45 | br_df.to_csv("BankReservesModel_Data.csv")
46 |
47 |
48 | if __name__ == "__main__":
49 | main()
50 |
--------------------------------------------------------------------------------
/examples/bank_reserves/requirements.txt:
--------------------------------------------------------------------------------
1 | mesa[viz]>=3.1.4
2 | networkx
3 | numpy
4 | pandas
5 |
--------------------------------------------------------------------------------
/examples/boltzmann_wealth_model_network/README.md:
--------------------------------------------------------------------------------
1 | # Boltzmann Wealth Model with Network
2 |
3 | ## Summary
4 |
5 | This is the same Boltzmann Wealth Model, but with a network grid implementation.
6 |
7 | A simple model of agents exchanging wealth. All agents start with the same amount of money. Every step, each agent with one unit of money or more gives one unit of wealth to another random agent. This is the model described in the [Intro Tutorial](https://mesa.readthedocs.io/en/latest/tutorials/intro_tutorial.html).
8 |
9 | In this network implementation, agents must be located on a node, with a limit of one agent per node. In order to give or receive the unit of money, the agent must be directly connected to the other agent (there must be a direct link between the nodes).
10 |
11 | As the model runs, the distribution of wealth among agents goes from being perfectly uniform (all agents have the same starting wealth), to highly skewed -- a small number have high wealth, more have none at all.
12 |
13 | ## Installation
14 |
15 | To install the dependencies use `pip` to install `mesa[rec]`
16 |
17 | ```bash
18 | $ pip install mesa[rec]
19 | ```
20 |
21 | ## How to Run
22 |
23 | To run the model interactively, run ``solara run`` in this directory. e.g.
24 |
25 | ```bash
26 | $ solara run app.py
27 | ```
28 |
29 | Then open your browser to [http://localhost:8765/](http://localhost:8765/) and press Reset, then Run.
30 |
31 | ## Files
32 |
33 | * ``model.py``: Contains creation of agents, the network, and management of agent execution.
34 | * ``agents.py``: Contains logic for giving money, and moving on the network.
35 | * ``app.py``: Contains the code for the interactive Solara visualization.
36 |
37 | ## Further Reading
38 |
39 | The full tutorial describing how the model is built can be found at:
40 | https://mesa.readthedocs.io/en/latest/tutorials/intro_tutorial.html
41 |
42 | This model is drawn from econophysics and presents a statistical mechanics approach to wealth distribution. Some examples of further reading on the topic can be found at:
43 |
44 | [Milakovic, M. A Statistical Equilibrium Model of Wealth Distribution. February, 2001.](https://editorialexpress.com/cgi-bin/conference/download.cgi?db_name=SCE2001&paper_id=214)
45 |
46 | [Dragulescu, A and Yakovenko, V. Statistical Mechanics of Money, Income, and Wealth: A Short Survey. November, 2002](http://arxiv.org/pdf/cond-mat/0211175v1.pdf)
47 |
--------------------------------------------------------------------------------
/examples/boltzmann_wealth_model_network/app.py:
--------------------------------------------------------------------------------
1 | from boltzmann_wealth_model_network.model import BoltzmannWealthModelNetwork
2 | from mesa.mesa_logging import INFO, log_to_stderr
3 | from mesa.visualization import (
4 | SolaraViz,
5 | make_plot_component,
6 | make_space_component,
7 | )
8 |
9 | log_to_stderr(INFO)
10 |
11 |
12 | # Tells Solara how to draw each agent.
13 | def agent_portrayal(agent):
14 | return {
15 | "color": agent.wealth, # using a colormap to convert wealth to color
16 | "size": 50,
17 | }
18 |
19 |
20 | model_params = {
21 | "seed": {
22 | "type": "InputText",
23 | "value": 42,
24 | "label": "Random seed",
25 | },
26 | "n": {
27 | "type": "SliderInt",
28 | "value": 7,
29 | "label": "Number of agents",
30 | "min": 2,
31 | "max": 10,
32 | "step": 1,
33 | # "description": "Choose how many agents to include in the model",
34 | },
35 | "num_nodes": {
36 | "type": "SliderInt",
37 | "value": 10,
38 | "label": "Number of nodes",
39 | "min": 3,
40 | "max": 12,
41 | "step": 1,
42 | # "description": "Choose how many nodes to include in the model, with at least the same number of agents",
43 | },
44 | }
45 |
46 |
47 | def post_process(ax):
48 | ax.get_figure().colorbar(ax.collections[0], label="wealth", ax=ax)
49 |
50 |
51 | # Create initial model instance
52 | money_model = BoltzmannWealthModelNetwork(n=7, num_nodes=10, seed=42)
53 |
54 | # Create visualization elements. The visualization elements are Solara
55 | # components that receive the model instance as a "prop" and display it in a
56 | # certain way. Under the hood these are just classes that receive the model
57 | # instance. You can also author your own visualization elements, which can also
58 | # be functions that receive the model instance and return a valid Solara
59 | # component.
60 |
61 | SpaceGraph = make_space_component(
62 | agent_portrayal, cmap="viridis", vmin=0, vmax=10, post_process=post_process
63 | )
64 | GiniPlot = make_plot_component("Gini")
65 |
66 | # Create the SolaraViz page. This will automatically create a server and display
67 | # the visualization elements in a web browser.
68 | #
69 | # Display it using the following command in the example directory:
70 | # solara run app.py
71 | # It will automatically update and display any changes made to this file.
72 |
73 | page = SolaraViz(
74 | money_model,
75 | components=[SpaceGraph, GiniPlot],
76 | model_params=model_params,
77 | name="Boltzmann Wealth Model: Network",
78 | )
79 | page # noqa
80 |
81 |
82 | # In a notebook environment, we can also display the visualization elements
83 | # directly.
84 | #
85 | # SpaceGraph(model1)
86 | # GiniPlot(model1)
87 |
88 | # The plots will be static. If you want to pick up model steps,
89 | # you have to make the model reactive first
90 | #
91 | # reactive_model = solara.reactive(model1)
92 | # SpaceGraph(reactive_model)
93 |
94 | # In a different notebook block:
95 | #
96 | # reactive_model.value.step()
97 |
--------------------------------------------------------------------------------
/examples/boltzmann_wealth_model_network/boltzmann_wealth_model_network/__init__.py:
--------------------------------------------------------------------------------
https://raw.githubusercontent.com/projectmesa/mesa-examples/6ba22dc41ebc37c3ef9f69bd2a6a22bfa08cd128/examples/boltzmann_wealth_model_network/boltzmann_wealth_model_network/__init__.py
--------------------------------------------------------------------------------
/examples/boltzmann_wealth_model_network/boltzmann_wealth_model_network/agents.py:
--------------------------------------------------------------------------------
1 | from mesa.discrete_space import CellAgent
2 |
3 |
4 | class MoneyAgent(CellAgent):
5 | """An agent with fixed initial wealth.
6 |
7 | Each agent starts with 1 unit of wealth and can give 1 unit to other agents
8 | if they occupy the same cell.
9 |
10 | Attributes:
11 | wealth (int): The agent's current wealth (starts at 1)
12 | """
13 |
14 | def __init__(self, model):
15 | """Create a new agent.
16 |
17 | Args:
18 | model (Model): The model instance that contains the agent
19 | """
20 | super().__init__(model)
21 | self.wealth = 1
22 |
23 | def give_money(self):
24 | neighbors = [agent for agent in self.cell.neighborhood.agents if agent != self]
25 | if len(neighbors) > 0:
26 | other = self.random.choice(neighbors)
27 | other.wealth += 1
28 | self.wealth -= 1
29 |
30 | def step(self):
31 | empty_neighbors = [cell for cell in self.cell.neighborhood if cell.is_empty]
32 | if empty_neighbors:
33 | self.cell = self.random.choice(empty_neighbors)
34 |
35 | if self.wealth > 0:
36 | self.give_money()
37 |
--------------------------------------------------------------------------------
/examples/boltzmann_wealth_model_network/boltzmann_wealth_model_network/model.py:
--------------------------------------------------------------------------------
1 | import networkx as nx
2 | from mesa import Model
3 | from mesa.datacollection import DataCollector
4 | from mesa.discrete_space import Network
5 |
6 | from .agents import MoneyAgent
7 |
8 |
9 | class BoltzmannWealthModelNetwork(Model):
10 | """A model with some number of agents."""
11 |
12 | def __init__(self, n=7, num_nodes=10, seed=None):
13 | super().__init__(seed=seed)
14 |
15 | self.num_agents = n
16 | self.num_nodes = num_nodes if num_nodes >= self.num_agents else self.num_agents
17 | self.G = nx.erdos_renyi_graph(n=self.num_nodes, p=0.5)
18 | self.grid = Network(self.G, capacity=1, random=self.random)
19 |
20 | # Set up data collection
21 | self.datacollector = DataCollector(
22 | model_reporters={"Gini": self.compute_gini},
23 | agent_reporters={"Wealth": "wealth"},
24 | )
25 |
26 | # Create agents; add the agent to a random node
27 | # TODO: change to MoneyAgent.create_agents(...)
28 | list_of_random_nodes = self.random.sample(list(self.G), self.num_agents)
29 | for position in list_of_random_nodes:
30 | agent = MoneyAgent(self)
31 | agent.move_to(self.grid[position])
32 |
33 | self.running = True
34 | self.datacollector.collect(self)
35 |
36 | def step(self):
37 | self.agents.shuffle_do("step") # Activate all agents in random order
38 | self.datacollector.collect(self) # collect data
39 |
40 | def compute_gini(self):
41 | agent_wealths = [agent.wealth for agent in self.agents]
42 | x = sorted(agent_wealths)
43 | num_agents = self.num_agents
44 | B = sum(xi * (num_agents - i) for i, xi in enumerate(x)) / (num_agents * sum(x)) # noqa: N806
45 | return 1 + (1 / num_agents) - 2 * B
46 |
--------------------------------------------------------------------------------
/examples/caching_and_replay/README.md:
--------------------------------------------------------------------------------
1 | # Schelling Model with Caching and Replay
2 |
3 | ## Summary
4 |
5 | This example applies caching on the Mesa [Schelling example](https://github.com/projectmesa/mesa-examples/tree/main/examples/schelling).
6 | It enables a simulation run to be "cached" or in other words recorded. The recorded simulation run is persisted on the local file system and can be replayed at any later point.
7 |
8 | It uses the [Mesa-Replay](https://github.com/Logende/mesa-replay) library and puts the Schelling model inside a so-called `CacheableModel` wrapper that we name `CacheableSchelling`.
9 | From the user's perspective, the new model behaves the same way as the original Schelling model, but additionally supports caching.
10 |
11 | Note that the main purpose of this example is to demonstrate that caching and replaying simulation runs is possible.
12 | The example is designed to be accessible.
13 | In practice, someone who wants to replay their simulation might not necessarily embed a replay button into the web view, but instead have a dedicated script to run a simulation that is being cached, separate from a script to replay a simulation run from a given cache file.
14 | More examples of caching and replay can be found in the [Mesa-Replay Repository](https://github.com/Logende/mesa-replay/tree/main/examples).
15 |
16 | ## Installation
17 |
18 | To install the dependencies use pip and the requirements.txt in this directory. e.g.
19 |
20 | ```
21 | $ pip install -r requirements.txt
22 | ```
23 |
24 | ## How to Run
25 |
26 | To run the model interactively, run ``mesa runserver`` in this directory. e.g.
27 |
28 | ```
29 | $ mesa runserver
30 | ```
31 |
32 | or
33 |
34 | Directly run the file ``run.py`` in the terminal. e.g.
35 |
36 | ```
37 | $ python run.py
38 | ```
39 |
40 | Then open your browser to [http://127.0.0.1:8521/](http://127.0.0.1:8521/) and press Reset, then Run.
41 |
42 | First, run the **simulation** with the 'Replay' switch disabled.
43 | When the simulation run is finished (e.g. all agents are happy, no more new steps are simulated), the run will automatically be stored in a cache file.
44 |
45 | Next, **replay** your latest cached simulation run by enabling the Replay switch and then pressing Reset.
46 |
47 | ## Files
48 |
49 | * ``run.py``: Launches a model visualization server and uses `CacheableModelSchelling` as simulation model
50 | * ``cacheablemodel.py``: Implements `CacheableModelSchelling` to make the original Schelling model cacheable
51 | * ``model.py``: Taken from the original Mesa Schelling example
52 | * ``server.py``: Taken from the original Mesa Schelling example
53 |
54 | ## Further Reading
55 |
56 | * [Mesa-Replay library](https://github.com/Logende/mesa-replay)
57 | * [More caching and replay examples](https://github.com/Logende/mesa-replay/tree/main/examples)
58 |
--------------------------------------------------------------------------------
/examples/caching_and_replay/cacheablemodel.py:
--------------------------------------------------------------------------------
1 | from mesa_replay import CacheableModel, CacheState
2 | from model import Schelling
3 |
4 |
5 | class CacheableSchelling(CacheableModel):
6 | """A wrapper around the original Schelling model to make the simulation cacheable
7 | and replay-able. Uses CacheableModel from the Mesa-Replay library,
8 | which is a wrapper that can be put around any regular mesa model to make it
9 | "cacheable".
10 | From outside, a CacheableSchelling instance can be treated like any
11 | regular Mesa model.
12 | The only difference is that the model will write the state of every simulation step
13 | to a cache file or when in replay mode use a given cache file to replay that cached
14 | simulation run.
15 | """
16 |
17 | def __init__(
18 | self,
19 | width=20,
20 | height=20,
21 | density=0.8,
22 | minority_pc=0.2,
23 | homophily=3,
24 | radius=1,
25 | cache_file_path="./my_cache_file_path.cache",
26 | # Note that this is an additional parameter we add to our model,
27 | # which decides whether to simulate or replay
28 | replay=False,
29 | ):
30 | actual_model = Schelling(
31 | width=width,
32 | height=height,
33 | density=density,
34 | minority_pc=minority_pc,
35 | homophily=homophily,
36 | radius=radius,
37 | )
38 | cache_state = CacheState.REPLAY if replay else CacheState.RECORD
39 | super().__init__(
40 | model=actual_model,
41 | cache_file_path=cache_file_path,
42 | cache_state=cache_state,
43 | )
44 |
--------------------------------------------------------------------------------
/examples/caching_and_replay/model.py:
--------------------------------------------------------------------------------
1 | """This file was copied over from the original Schelling mesa example."""
2 |
3 | import mesa
4 | from mesa.experimental.cell_space import CellAgent, OrthogonalMooreGrid
5 |
6 |
7 | class SchellingAgent(CellAgent):
8 | """Schelling segregation agent"""
9 |
10 | def __init__(self, model, agent_type):
11 | """Create a new Schelling agent.
12 |
13 | Args:
14 | x, y: Agent initial location.
15 | agent_type: Indicator for the agent's type (minority=1, majority=0)
16 | """
17 | super().__init__(model)
18 | self.type = agent_type
19 |
20 | def step(self):
21 | similar = 0
22 | for agent in self.cell.get_neighborhood(radius=self.model.radius).agents:
23 | if agent.type == self.type:
24 | similar += 1
25 |
26 | # If unhappy, move:
27 | if similar < self.model.homophily:
28 | self.cell = self.model.grid.select_random_empty_cell()
29 | else:
30 | self.model.happy += 1
31 |
32 |
33 | class Schelling(mesa.Model):
34 | """Model class for the Schelling segregation model."""
35 |
36 | def __init__(
37 | self,
38 | height=20,
39 | width=20,
40 | homophily=3,
41 | radius=1,
42 | density=0.8,
43 | minority_pc=0.3,
44 | seed=None,
45 | ):
46 | """Create a new Schelling model.
47 |
48 | Args:
49 | width, height: Size of the space.
50 | density: Initial Chance for a cell to populated
51 | minority_pc: Chances for an agent to be in minority class
52 | homophily: Minimum number of agents of same class needed to be happy
53 | radius: Search radius for checking similarity
54 | seed: Seed for Reproducibility
55 | """
56 | super().__init__(seed=seed)
57 | self.height = height
58 | self.width = width
59 | self.density = density
60 | self.minority_pc = minority_pc
61 | self.homophily = homophily
62 | self.radius = radius
63 |
64 | self.grid = OrthogonalMooreGrid((width, height), torus=True, random=self.random)
65 |
66 | self.happy = 0
67 | self.datacollector = mesa.DataCollector(
68 | model_reporters={"happy": "happy"}, # Model-level count of happy agents
69 | )
70 |
71 | # Set up agents
72 | # We use a grid iterator that returns
73 | # the coordinates of a cell as well as
74 | # its contents. (coord_iter)
75 | for cell in self.grid.all_cells:
76 | if self.random.random() < self.density:
77 | agent_type = 1 if self.random.random() < self.minority_pc else 0
78 | agent = SchellingAgent(self, agent_type)
79 | agent.cell = cell
80 |
81 | self.datacollector.collect(self)
82 |
83 | def step(self):
84 | """Run one step of the model."""
85 | self.happy = 0 # Reset counter of happy agents
86 | self.agents.shuffle_do("step")
87 |
88 | self.datacollector.collect(self)
89 |
90 | if self.happy == len(self.agents):
91 | self.running = False
92 |
--------------------------------------------------------------------------------
/examples/caching_and_replay/requirements.txt:
--------------------------------------------------------------------------------
1 | mesa
2 | git+https://github.com/Logende/mesa-replay@main#egg=Mesa-Replay
--------------------------------------------------------------------------------
/examples/caching_and_replay/run.py:
--------------------------------------------------------------------------------
1 | from pathlib import Path
2 |
3 | import mesa
4 | from cacheablemodel import CacheableSchelling
5 | from server import canvas_element, get_happy_agents, happy_chart, model_params
6 |
7 | # As 'replay' is a simulation model parameter in this example, we need to make it available as such
8 | model_params["replay"] = mesa.visualization.Checkbox("Replay cached run?", False)
9 | model_params["cache_file_path"] = "./my_cache_file_path.cache"
10 |
11 |
12 | def get_cache_file_status(_):
13 | """Display an informational text about caching and the status of the cache file (existing versus not existing)"""
14 | cache_file = Path(model_params["cache_file_path"])
15 | return (
16 | f"Only activate the 'Replay cached run?' switch when a cache file already exists, otherwise it will fail. "
17 | f"Cache file existing: '{cache_file.exists()}'."
18 | )
19 |
20 |
21 | server = mesa.visualization.ModularServer(
22 | model_cls=CacheableSchelling, # Note that Schelling was replaced by CacheableSchelling here
23 | visualization_elements=[
24 | get_cache_file_status,
25 | canvas_element,
26 | get_happy_agents,
27 | happy_chart,
28 | ],
29 | name="Schelling Segregation Model",
30 | model_params=model_params,
31 | )
32 |
33 | server.launch()
34 |
--------------------------------------------------------------------------------
/examples/caching_and_replay/server.py:
--------------------------------------------------------------------------------
1 | """This file was copied over from the original Schelling mesa example."""
2 |
3 | import mesa
4 | from model import Schelling
5 |
6 |
7 | def get_happy_agents(model):
8 | """Display a text count of how many happy agents there are."""
9 | return f"Happy agents: {model.happy}"
10 |
11 |
12 | def schelling_draw(agent):
13 | """Portrayal Method for canvas"""
14 | if agent is None:
15 | return
16 | portrayal = {"Shape": "circle", "r": 0.5, "Filled": "true", "Layer": 0}
17 |
18 | if agent.type == 0:
19 | portrayal["Color"] = ["#FF0000", "#FF9999"]
20 | portrayal["stroke_color"] = "#00FF00"
21 | else:
22 | portrayal["Color"] = ["#0000FF", "#9999FF"]
23 | portrayal["stroke_color"] = "#000000"
24 | return portrayal
25 |
26 |
27 | canvas_element = mesa.visualization.CanvasGrid(
28 | portrayal_method=schelling_draw,
29 | grid_width=20,
30 | grid_height=20,
31 | canvas_width=500,
32 | canvas_height=500,
33 | )
34 | happy_chart = mesa.visualization.ChartModule([{"Label": "happy", "Color": "Black"}])
35 |
36 | model_params = {
37 | "height": 20,
38 | "width": 20,
39 | "density": mesa.visualization.Slider(
40 | name="Agent density", value=0.8, min_value=0.1, max_value=1.0, step=0.1
41 | ),
42 | "minority_pc": mesa.visualization.Slider(
43 | name="Fraction minority", value=0.2, min_value=0.00, max_value=1.0, step=0.05
44 | ),
45 | "homophily": mesa.visualization.Slider(
46 | name="Homophily", value=3, min_value=0, max_value=8, step=1
47 | ),
48 | "radius": mesa.visualization.Slider(
49 | name="Search Radius", value=1, min_value=1, max_value=5, step=1
50 | ),
51 | }
52 |
53 | server = mesa.visualization.ModularServer(
54 | model_cls=Schelling,
55 | visualization_elements=[canvas_element, get_happy_agents, happy_chart],
56 | name="Schelling Segregation Model",
57 | model_params=model_params,
58 | )
59 |
--------------------------------------------------------------------------------
/examples/charts/Readme.md:
--------------------------------------------------------------------------------
1 | # Mesa Charts Example
2 |
3 | ## Summary
4 |
5 | A modified version of the "bank_reserves" example made to provide examples of mesa's charting tools.
6 |
7 | The chart types included in this example are:
8 | - Line Charts for time-series data of multiple model parameters
9 | - Pie Charts for model parameters
10 | - Bar charts for both model and agent-level parameters
11 |
12 | ## Installation
13 |
14 | To install the dependencies use pip and the requirements.txt in this directory. e.g.
15 |
16 | ```
17 | $ pip install -r requirements.txt
18 | ```
19 |
20 | ## Interactive Model Run
21 |
22 | To run the model interactively, use `mesa runserver` in this directory:
23 |
24 | ```
25 | $ mesa runserver
26 | ```
27 |
28 | Then open your browser to [http://127.0.0.1:8521/](http://127.0.0.1:8521/), select the model parameters, press Reset, then Start.
29 |
30 | ## Files
31 |
32 | * ``bank_reserves/random_walker.py``: This defines a class that inherits from the Mesa Agent class. The main purpose is to provide a method for agents to move randomly one cell at a time.
33 | * ``bank_reserves/agents.py``: Defines the People and Bank classes.
34 | * ``bank_reserves/model.py``: Defines the Bank Reserves model and the DataCollector functions.
35 | * ``bank_reserves/server.py``: Sets up the interactive visualization server.
36 | * ``run.py``: Launches a model visualization server.
37 |
38 | ## Further Reading
39 |
40 | See the "bank_reserves" model for more information.
41 |
--------------------------------------------------------------------------------
/examples/charts/charts/server.py:
--------------------------------------------------------------------------------
1 | import mesa
2 | from charts.agents import Person
3 | from charts.model import Charts
4 |
5 | """
6 | Citation:
7 | The following code was adapted from server.py at
8 | https://github.com/projectmesa/mesa/blob/main/examples/wolf_sheep/wolf_sheep/server.py
9 | Accessed on: November 2, 2017
10 | Author of original code: Taylor Mutch
11 | """
12 |
13 | # The colors here are taken from Matplotlib's tab10 palette
14 | # Green
15 | RICH_COLOR = "#2ca02c"
16 | # Red
17 | POOR_COLOR = "#d62728"
18 | # Blue
19 | MID_COLOR = "#1f77b4"
20 |
21 |
22 | def person_portrayal(agent):
23 | if agent is None:
24 | return
25 |
26 | portrayal = {}
27 |
28 | # update portrayal characteristics for each Person object
29 | if isinstance(agent, Person):
30 | portrayal["Shape"] = "circle"
31 | portrayal["r"] = 0.5
32 | portrayal["Layer"] = 0
33 | portrayal["Filled"] = "true"
34 |
35 | color = MID_COLOR
36 |
37 | # set agent color based on savings and loans
38 | if agent.savings > agent.model.rich_threshold:
39 | color = RICH_COLOR
40 | if agent.savings < 10 and agent.loans < 10:
41 | color = MID_COLOR
42 | if agent.loans > 10:
43 | color = POOR_COLOR
44 |
45 | portrayal["Color"] = color
46 |
47 | return portrayal
48 |
49 |
50 | # dictionary of user settable parameters - these map to the model __init__ parameters
51 | model_params = {
52 | "init_people": mesa.visualization.Slider(
53 | "People", 25, 1, 200, description="Initial Number of People"
54 | ),
55 | "rich_threshold": mesa.visualization.Slider(
56 | "Rich Threshold",
57 | 10,
58 | 1,
59 | 20,
60 | description="Upper End of Random Initial Wallet Amount",
61 | ),
62 | "reserve_percent": mesa.visualization.Slider(
63 | "Reserves",
64 | 50,
65 | 1,
66 | 100,
67 | description="Percent of deposits the bank has to hold in reserve",
68 | ),
69 | }
70 |
71 | # set the portrayal function and size of the canvas for visualization
72 | canvas_element = mesa.visualization.CanvasGrid(person_portrayal, 20, 20, 500, 500)
73 |
74 | # map data to chart in the ChartModule
75 | line_chart = mesa.visualization.ChartModule(
76 | [
77 | {"Label": "Rich", "Color": RICH_COLOR},
78 | {"Label": "Poor", "Color": POOR_COLOR},
79 | {"Label": "Middle Class", "Color": MID_COLOR},
80 | ]
81 | )
82 |
83 | model_bar = mesa.visualization.BarChartModule(
84 | [
85 | {"Label": "Rich", "Color": RICH_COLOR},
86 | {"Label": "Poor", "Color": POOR_COLOR},
87 | {"Label": "Middle Class", "Color": MID_COLOR},
88 | ]
89 | )
90 |
91 | agent_bar = mesa.visualization.BarChartModule(
92 | [{"Label": "Wealth", "Color": MID_COLOR}],
93 | scope="agent",
94 | sorting="ascending",
95 | sort_by="Wealth",
96 | )
97 |
98 | pie_chart = mesa.visualization.PieChartModule(
99 | [
100 | {"Label": "Rich", "Color": RICH_COLOR},
101 | {"Label": "Middle Class", "Color": MID_COLOR},
102 | {"Label": "Poor", "Color": POOR_COLOR},
103 | ]
104 | )
105 |
106 | # create instance of Mesa ModularServer
107 | server = mesa.visualization.ModularServer(
108 | Charts,
109 | [canvas_element, line_chart, model_bar, agent_bar, pie_chart],
110 | "Mesa Charts",
111 | model_params=model_params,
112 | )
113 |
--------------------------------------------------------------------------------
/examples/charts/requirements.txt:
--------------------------------------------------------------------------------
1 | itertools
2 | mesa~=2.0
3 | numpy
4 | pandas
5 |
--------------------------------------------------------------------------------
/examples/charts/run.py:
--------------------------------------------------------------------------------
1 | from charts.server import server
2 |
3 | server.launch(open_browser=True)
4 |
--------------------------------------------------------------------------------
/examples/color_patches/Readme.md:
--------------------------------------------------------------------------------
1 | # Color Patches
2 |
3 |
4 | This is a cellular automaton model where each agent lives in a cell on a 2D grid, and never moves.
5 |
6 | An agent's state represents its "opinion" and is shown by the color of the cell the agent lives in. Each color represents an opinion - there are 16 of them. At each time step, an agent's opinion is influenced by that of its neighbors, and changes to the most common one found; ties are randomly arbitrated. As an agent adapts its thinking to that of its neighbors, the cell color changes.
7 |
8 | ### Parameters you can play with:
9 | (you must change the code to alter the parameters at this stage)
10 | * Vary the number of opinions.
11 | * Vary the size of the grid
12 | * Change the grid from fixed borders to a torus continuum
13 |
14 | ### Observe
15 | * how groups of like minded agents form and evolve
16 | * how sometimes a single opinion prevails
17 | * how some minority or fragmented opinions rapidly disappear
18 |
19 | ## How to Run
20 |
21 | To run the model interactively, run ``mesa runserver` in this directory. e.g.
22 |
23 | ```
24 | $ mesa runserver
25 | ```
26 |
27 | Then open your browser to [http://127.0.0.1:8521/](http://127.0.0.1:8521/) and press Reset, then Run.
28 |
29 | ## Files
30 |
31 | * ``color_patches/model.py``: Defines the cell and model classes. The cell class governs each cell's behavior. The model class itself controls the lattice on which the cells live and interact.
32 | * ``color_patches/server.py``: Defines an interactive visualization.
33 | * ``run.py``: Launches an interactive visualization
34 |
35 | ## Further Reading
36 |
37 | Inspired from [this model](http://www.cs.sjsu.edu/~pearce/modules/lectures/abs/as/ca.htm) from San Jose University
38 | Other similar models: [Schelling Segregation Model](https://github.com/projectmesa/mesa/tree/main/examples/schelling)
39 |
--------------------------------------------------------------------------------
/examples/color_patches/app.py:
--------------------------------------------------------------------------------
1 | """handles the definition of the canvas parameters and
2 | the drawing of the model representation on the canvas
3 | """
4 |
5 | # import webbrowser
6 | from color_patches.model import ColorPatches
7 | from mesa.visualization import (
8 | SolaraViz,
9 | make_space_component,
10 | )
11 |
12 | _COLORS = [
13 | "Aqua",
14 | "Blue",
15 | "Fuchsia",
16 | "Gray",
17 | "Green",
18 | "Lime",
19 | "Maroon",
20 | "Navy",
21 | "Olive",
22 | "Orange",
23 | "Purple",
24 | "Red",
25 | "Silver",
26 | "Teal",
27 | "White",
28 | "Yellow",
29 | ]
30 |
31 |
32 | grid_rows = 50
33 | grid_cols = 25
34 | cell_size = 10
35 | canvas_width = grid_rows * cell_size
36 | canvas_height = grid_cols * cell_size
37 |
38 |
39 | def color_patch_draw(cell):
40 | """This function is registered with the visualization server to be called
41 | each tick to indicate how to draw the cell in its current state.
42 |
43 | :param cell: the cell in the simulation
44 |
45 | :return: the portrayal dictionary.
46 | """
47 | if cell is None:
48 | raise AssertionError
49 | portrayal = {"Shape": "rect", "w": 1, "h": 1, "Filled": "true", "Layer": 0}
50 | portrayal["x"] = cell.get_row()
51 | portrayal["y"] = cell.get_col()
52 | portrayal["color"] = _COLORS[cell.state]
53 | return portrayal
54 |
55 |
56 | space_component = make_space_component(
57 | color_patch_draw,
58 | draw_grid=False,
59 | )
60 | model = ColorPatches()
61 | page = SolaraViz(
62 | model,
63 | components=[space_component],
64 | model_params={"width": grid_rows, "height": grid_cols},
65 | name="Color Patches",
66 | )
67 | # webbrowser.open('http://127.0.0.1:8521') # TODO: make this configurable
68 |
--------------------------------------------------------------------------------
/examples/color_patches/color_patches/__init__.py:
--------------------------------------------------------------------------------
https://raw.githubusercontent.com/projectmesa/mesa-examples/6ba22dc41ebc37c3ef9f69bd2a6a22bfa08cd128/examples/color_patches/color_patches/__init__.py
--------------------------------------------------------------------------------
/examples/color_patches/requirements.txt:
--------------------------------------------------------------------------------
1 | mesa[viz]>=3.0
2 | networkx
3 |
--------------------------------------------------------------------------------
/examples/conways_game_of_life_fast/GoL_fast_screenshot.png:
--------------------------------------------------------------------------------
https://raw.githubusercontent.com/projectmesa/mesa-examples/6ba22dc41ebc37c3ef9f69bd2a6a22bfa08cd128/examples/conways_game_of_life_fast/GoL_fast_screenshot.png
--------------------------------------------------------------------------------
/examples/conways_game_of_life_fast/Readme.md:
--------------------------------------------------------------------------------
1 | ## Conway's Game of Life (Fast)
2 | This example demonstrates a fast and efficient implementation of Conway's Game of Life using the [`PropertyLayer`](https://github.com/projectmesa/mesa/pull/1898) from the Mesa framework.
3 |
4 | 
5 |
6 | ### Overview
7 | Conway's [Game of Life](https://en.wikipedia.org/wiki/Conway%27s_Game_of_Life) is a classic cellular automaton where each cell on a grid can either be alive or dead. The state of each cell changes over time based on a set of simple rules that depend on the number of alive neighbors.
8 |
9 | #### Key features:
10 | - **No grid or agents:** This implementation uses the `PropertyLayer` to manage the state of cells, eliminating the need for traditional grids or agents.
11 | - **Fast:** By using 2D convolution to count neighbors, the model efficiently applies the rules of the Game of Life across the entire grid.
12 | - **Toroidal:** The grid wraps around at the edges, creating a seamless, continuous surface.
13 |
14 | #### Performance
15 | The model is benchmarked in https://github.com/projectmesa/mesa/pull/1898#issuecomment-1849000346 to be about 100x faster over a traditional implementation.
16 |
17 | 
18 |
19 | - Benchmark code: [benchmark_gol.zip](https://github.com/projectmesa/mesa/files/13628343/benchmark_gol.zip)
20 |
21 | ### Getting Started
22 | #### Prerequisites
23 | - Python 3.10 or higher
24 | - Mesa 2.3 or higher (3.0.0b0 or higher for the visualisation)
25 | - NumPy and SciPy
26 |
27 | #### Running the Model
28 | To run the model, open a new file or notebook and add:
29 |
30 | ```Python
31 | from model import GameOfLifeModel
32 | model = GameOfLifeModel(width=10, height=10, alive_fraction=0.2)
33 | for i in range(10):
34 | model.step()
35 | ```
36 | Or to run visualized with Solara, run in your terminal:
37 |
38 | ```bash
39 | solara run app.py
40 | ```
41 |
42 | ### Understanding the Code
43 | - **Model initialization:** The grid is represented by a `PropertyLayer` where each cell is randomly initialized as alive or dead based on a given probability.
44 | - **`PropertyLayer`:** In the `cell_layer` (which is a `PropertyLayer`), each cell has either a value of 1 (alive) or 0 (dead).
45 | - **Step function:** Each simulation step calculates the number of alive neighbors for each cell and applies the Game of Life rules.
46 | - **Data collection:** The model tracks and reports the number of alive cells and the fraction of the grid that is alive.
47 |
48 | ### Customization
49 | You can easily modify the model parameters such as grid size and initial alive fraction to explore different scenarios. You can also add more metrics or visualisations.
50 |
51 | ### Summary
52 | This example provides a fast approach to modeling cellular automata using Mesa's `PropertyLayer`.
53 |
54 | ### Future work
55 | Add visualisation of the `PropertyLayer` in SolaraViz. See:
56 | - https://github.com/projectmesa/mesa/issues/2138
57 |
--------------------------------------------------------------------------------
/examples/conways_game_of_life_fast/app.py:
--------------------------------------------------------------------------------
1 | from mesa.visualization import SolaraViz, make_plot_component, make_space_component
2 | from model import GameOfLifeModel
3 |
4 | propertylayer_portrayal = {
5 | "cell_layer": {
6 | "color": "Black",
7 | "alpha": 1,
8 | "colorbar": False,
9 | },
10 | }
11 |
12 | model_params = {
13 | "width": {
14 | "type": "SliderInt",
15 | "value": 30,
16 | "label": "Width",
17 | "min": 5,
18 | "max": 60,
19 | "step": 1,
20 | },
21 | "height": {
22 | "type": "SliderInt",
23 | "value": 30,
24 | "label": "Height",
25 | "min": 5,
26 | "max": 60,
27 | "step": 1,
28 | },
29 | "alive_fraction": {
30 | "type": "SliderFloat",
31 | "value": 0.2,
32 | "label": "Cells alive",
33 | "min": 0,
34 | "max": 1,
35 | "step": 0.01,
36 | },
37 | }
38 |
39 | gol = GameOfLifeModel()
40 |
41 | layer_viz = make_space_component(propertylayer_portrayal=propertylayer_portrayal)
42 | TotalAlivePlot = make_plot_component("Cells alive")
43 |
44 | page = SolaraViz(
45 | gol,
46 | components=[layer_viz, TotalAlivePlot],
47 | model_params=model_params,
48 | name="Game of Life Model",
49 | )
50 |
--------------------------------------------------------------------------------
/examples/conways_game_of_life_fast/model.py:
--------------------------------------------------------------------------------
1 | import numpy as np
2 | from mesa import Model
3 | from mesa.datacollection import DataCollector
4 | from mesa.space import PropertyLayer
5 | from scipy.signal import convolve2d
6 |
7 |
8 | # fmt: off
9 | class GameOfLifeModel(Model):
10 | def __init__(self, width=10, height=10, alive_fraction=0.2):
11 | super().__init__()
12 | # Initialize the property layer for cell states
13 | self.cell_layer = PropertyLayer("cells", width, height, False, dtype=bool)
14 | # Randomly set cells to alive
15 | self.cell_layer.data = np.random.choice([True, False], size=(width, height), p=[alive_fraction, 1 - alive_fraction])
16 |
17 | # Metrics and datacollector
18 | self.cells = width * height
19 | self.alive_count = 0
20 | self.alive_fraction = 0
21 | self.datacollector = DataCollector(
22 | model_reporters={"Cells alive": "alive_count",
23 | "Fraction alive": "alive_fraction"}
24 | )
25 | self.datacollector.collect(self)
26 |
27 | def step(self):
28 | # Define a kernel for counting neighbors. The kernel has 1s around the center cell (which is 0).
29 | # This setup allows us to count the live neighbors of each cell when we apply convolution.
30 | kernel = np.array([[1, 1, 1],
31 | [1, 0, 1],
32 | [1, 1, 1]])
33 |
34 | # Count neighbors using convolution.
35 | # convolve2d applies the kernel to each cell of the grid, summing up the values of neighbors.
36 | # boundary="wrap" ensures that the grid wraps around, simulating a toroidal surface.
37 | neighbor_count = convolve2d(self.cell_layer.data, kernel, mode="same", boundary="wrap")
38 |
39 | # Apply Game of Life rules:
40 | # 1. A live cell with 2 or 3 live neighbors survives, otherwise it dies.
41 | # 2. A dead cell with exactly 3 live neighbors becomes alive.
42 | # These rules are implemented using logical operations on the grid.
43 | self.cell_layer.data = np.logical_or(
44 | np.logical_and(self.cell_layer.data, np.logical_or(neighbor_count == 2, neighbor_count == 3)),
45 | # Rule for live cells
46 | np.logical_and(~self.cell_layer.data, neighbor_count == 3) # Rule for dead cells
47 | )
48 |
49 | # Metrics
50 | self.alive_count = np.sum(self.cell_layer.data)
51 | self.alive_fraction = self.alive_count / self.cells
52 | self.datacollector.collect(self)
53 |
--------------------------------------------------------------------------------
/examples/el_farol/README.md:
--------------------------------------------------------------------------------
1 | # El Farol
2 |
3 | This folder contains an implementation of El Farol restaurant model. Agents (restaurant customers) decide whether to go to the restaurant or not based on their memory and reward from previous trials. Implications from the model have been used to explain how individual decision-making affects overall performance and fluctuation.
4 |
5 | The implementation is based on Fogel 1999 (in particular the calculation of the prediction), which is a refinement over Arthur 1994.
6 |
7 | ## How to Run
8 |
9 | Launch the model: You can run the model and perform analysis in el_farol.ipynb.
10 | You can test the model itself by running `pytest tests.py`.
11 |
12 | ## Files
13 | * [el_farol.ipynb](el_farol.ipynb): Run the model and visualization in a Jupyter notebook
14 | * [el_farol/model.py](el_farol/model.py): Core model file.
15 | * [el_farol/agents.py](el_farol/agents.py): The agent class.
16 | * [tests.py](tests.py): Tests to ensure the model is consistent with Arthur 1994, Fogel 1996.
17 |
18 | ## Further Reading
19 |
20 | 1. W. Brian Arthur Inductive Reasoning and Bounded Rationality (1994) https://www.jstor.org/stable/2117868
21 | 1. D.B. Fogel, K. Chellapilla, P.J. Angeline Inductive reasoning and bounded rationality reconsidered (1999)
22 | 1. NetLogo implementation of the El Farol bar problem https://ccl.northwestern.edu/netlogo/models/ElFarol
23 |
--------------------------------------------------------------------------------
/examples/el_farol/el_farol/__init__.py:
--------------------------------------------------------------------------------
https://raw.githubusercontent.com/projectmesa/mesa-examples/6ba22dc41ebc37c3ef9f69bd2a6a22bfa08cd128/examples/el_farol/el_farol/__init__.py
--------------------------------------------------------------------------------
/examples/el_farol/el_farol/agents.py:
--------------------------------------------------------------------------------
1 | import mesa
2 | import numpy as np
3 |
4 |
5 | class BarCustomer(mesa.Agent):
6 | def __init__(self, model, memory_size, crowd_threshold, num_strategies):
7 | super().__init__(model)
8 | # Random values from -1.0 to 1.0
9 | self.strategies = np.random.rand(num_strategies, memory_size + 1) * 2 - 1
10 | self.best_strategy = self.strategies[0]
11 | self.attend = False
12 | self.memory_size = memory_size
13 | self.crowd_threshold = crowd_threshold
14 | self.utility = 0
15 | self.update_strategies()
16 |
17 | def update_attendance(self):
18 | prediction = self.predict_attendance(
19 | self.best_strategy, self.model.history[-self.memory_size :]
20 | )
21 | if prediction <= self.crowd_threshold:
22 | self.attend = True
23 | self.model.attendance += 1
24 | else:
25 | self.attend = False
26 |
27 | def update_strategies(self):
28 | # Pick the best strategy based on new history window
29 | best_score = float("inf")
30 | for strategy in self.strategies:
31 | score = 0
32 | for week in range(self.memory_size):
33 | last = week + self.memory_size
34 | prediction = self.predict_attendance(
35 | strategy, self.model.history[week:last]
36 | )
37 | score += abs(self.model.history[last] - prediction)
38 | if score <= best_score:
39 | best_score = score
40 | self.best_strategy = strategy
41 | should_attend = self.model.history[-1] <= self.crowd_threshold
42 | if should_attend != self.attend:
43 | self.utility -= 1
44 | else:
45 | self.utility += 1
46 |
47 | def predict_attendance(self, strategy, subhistory):
48 | # This is extracted from the source code of the model in
49 | # https://ccl.northwestern.edu/netlogo/models/ElFarol.
50 | # This reports an agent's prediction of the current attendance
51 | # using a particular strategy and portion of the attendance history.
52 | # More specifically, the strategy is then described by the formula
53 | # p(t) = x(t - 1) * a(t - 1) + x(t - 2) * a(t - 2) +..
54 | # ... + x(t - memory_size) * a(t - memory_size) + c * 100,
55 | # where p(t) is the prediction at time t, x(t) is the attendance of the
56 | # bar at time t, a(t) is the weight for time t, c is a constant, and
57 | # MEMORY-SIZE is an external parameter.
58 |
59 | # The first element of the strategy is the constant, c, in the
60 | # prediction formula. one can think of it as the the agent's prediction
61 | # of the bar's attendance in the absence of any other data then we
62 | # multiply each week in the history by its respective weight.
63 | return strategy[0] * 100 + np.dot(strategy[1:], subhistory)
64 |
--------------------------------------------------------------------------------
/examples/el_farol/el_farol/model.py:
--------------------------------------------------------------------------------
1 | import mesa
2 | import numpy as np
3 |
4 | from .agents import BarCustomer
5 |
6 |
7 | class ElFarolBar(mesa.Model):
8 | def __init__(
9 | self,
10 | crowd_threshold=60,
11 | num_strategies=10,
12 | memory_size=10,
13 | num_agents=100,
14 | ):
15 | super().__init__()
16 | self.running = True
17 | self.num_agents = num_agents
18 |
19 | # Initialize the previous attendance randomly so the agents have a history
20 | # to work with from the start.
21 | # The history is twice the memory, because we need at least a memory
22 | # worth of history for each point in memory to test how well the
23 | # strategies would have worked.
24 | self.history = np.random.randint(0, 100, size=memory_size * 2).tolist()
25 | self.attendance = self.history[-1]
26 | for _ in range(self.num_agents):
27 | BarCustomer(self, memory_size, crowd_threshold, num_strategies)
28 |
29 | self.datacollector = mesa.DataCollector(
30 | model_reporters={"Customers": "attendance"},
31 | agent_reporters={"Utility": "utility", "Attendance": "attend"},
32 | )
33 |
34 | def step(self):
35 | self.datacollector.collect(self)
36 | self.attendance = 0
37 | self.agents.shuffle_do("update_attendance")
38 | # We ensure that the length of history is constant
39 | # after each step.
40 | self.history.pop(0)
41 | self.history.append(self.attendance)
42 | self.agents.shuffle_do("update_strategies")
43 |
--------------------------------------------------------------------------------
/examples/el_farol/requirements.txt:
--------------------------------------------------------------------------------
1 | jupyter
2 | matplotlib
3 | mesa
4 | numpy
5 | seaborn
6 |
--------------------------------------------------------------------------------
/examples/el_farol/tests.py:
--------------------------------------------------------------------------------
1 | import numpy as np
2 | from el_farol.model import ElFarolBar
3 |
4 | np.random.seed(1)
5 | crowd_threshold = 60
6 |
7 |
8 | def test_convergence():
9 | # Testing that the attendance converges to crowd_threshold
10 | attendances = []
11 | for _ in range(10):
12 | model = ElFarolBar(N=100, crowd_threshold=crowd_threshold, memory_size=10)
13 | for _ in range(100):
14 | model.step()
15 | attendances.append(model.attendance)
16 | mean = np.mean(attendances)
17 | standard_deviation = np.std(attendances)
18 | deviation = abs(mean - crowd_threshold)
19 | assert deviation < standard_deviation
20 |
--------------------------------------------------------------------------------
/examples/forest_fire/app.py:
--------------------------------------------------------------------------------
1 | from forest_fire.model import ForestFire
2 | from mesa.visualization import (
3 | SolaraViz,
4 | make_plot_component,
5 | make_space_component,
6 | )
7 | from mesa.visualization.user_param import (
8 | Slider,
9 | )
10 |
11 | COLORS = {"Fine": "#00AA00", "On Fire": "#880000", "Burned Out": "#000000"}
12 |
13 |
14 | def forest_fire_portrayal(tree):
15 | if tree is None:
16 | return
17 | portrayal = {"Shape": "rect", "w": 1, "h": 1, "Filled": "true", "Layer": 0}
18 | (x, y) = (tree.cell.coordinate[i] for i in (0, 1))
19 | portrayal["x"] = x
20 | portrayal["y"] = y
21 | portrayal["color"] = COLORS[tree.condition]
22 | return portrayal
23 |
24 |
25 | def post_process_space(ax):
26 | ax.set_aspect("equal")
27 | ax.set_xticks([])
28 | ax.set_yticks([])
29 |
30 |
31 | def post_process_lines(ax):
32 | ax.legend(loc="center left", bbox_to_anchor=(1, 0.9))
33 |
34 |
35 | space_component = make_space_component(
36 | forest_fire_portrayal,
37 | draw_grid=False,
38 | post_process=post_process_space,
39 | )
40 | lineplot_component = make_plot_component(
41 | COLORS,
42 | post_process=post_process_lines,
43 | )
44 | # TODO: add back in pie chart component
45 | # # no current pie chart equivalent in mesa>=3.0
46 | # pie_chart = mesa.visualization.PieChartModule(
47 | # [{"Label": label, "Color": color} for (label, color) in COLORS.items()]
48 | # )
49 | model = ForestFire()
50 | model_params = {
51 | "height": 100,
52 | "width": 100,
53 | "density": Slider("Tree density", 0.65, 0.01, 1.0, 0.01),
54 | }
55 | page = SolaraViz(
56 | model,
57 | components=[space_component, lineplot_component],
58 | model_params=model_params,
59 | name="Forest Fire",
60 | )
61 |
--------------------------------------------------------------------------------
/examples/forest_fire/forest_fire/__init__.py:
--------------------------------------------------------------------------------
https://raw.githubusercontent.com/projectmesa/mesa-examples/6ba22dc41ebc37c3ef9f69bd2a6a22bfa08cd128/examples/forest_fire/forest_fire/__init__.py
--------------------------------------------------------------------------------
/examples/forest_fire/forest_fire/agent.py:
--------------------------------------------------------------------------------
1 | from mesa.experimental.cell_space import FixedAgent
2 |
3 |
4 | class TreeCell(FixedAgent):
5 | """A tree cell.
6 |
7 | Attributes:
8 | condition: Can be "Fine", "On Fire", or "Burned Out"
9 |
10 | """
11 |
12 | def __init__(self, model, cell):
13 | """Create a new tree.
14 |
15 | Args:
16 | model: standard model reference for agent.
17 | """
18 | super().__init__(model)
19 | self.condition = "Fine"
20 | self.cell = cell
21 |
22 | def step(self):
23 | """If the tree is on fire, spread it to fine trees nearby."""
24 | if self.condition == "On Fire":
25 | for neighbor in self.cell.neighborhood.agents:
26 | if neighbor.condition == "Fine":
27 | neighbor.condition = "On Fire"
28 | self.condition = "Burned Out"
29 |
--------------------------------------------------------------------------------
/examples/forest_fire/forest_fire/model.py:
--------------------------------------------------------------------------------
1 | import mesa
2 | from mesa.experimental.cell_space import OrthogonalMooreGrid
3 |
4 | from .agent import TreeCell
5 |
6 |
7 | class ForestFire(mesa.Model):
8 | """Simple Forest Fire model."""
9 |
10 | def __init__(self, width=100, height=100, density=0.65, seed=None):
11 | """Create a new forest fire model.
12 |
13 | Args:
14 | width, height: The size of the grid to model
15 | density: What fraction of grid cells have a tree in them.
16 | """
17 | super().__init__(seed=seed)
18 |
19 | # Set up model objects
20 |
21 | self.grid = OrthogonalMooreGrid((width, height), capacity=1, random=self.random)
22 | self.datacollector = mesa.DataCollector(
23 | {
24 | "Fine": lambda m: self.count_type(m, "Fine"),
25 | "On Fire": lambda m: self.count_type(m, "On Fire"),
26 | "Burned Out": lambda m: self.count_type(m, "Burned Out"),
27 | }
28 | )
29 |
30 | # Place a tree in each cell with Prob = density
31 | for cell in self.grid.all_cells:
32 | if self.random.random() < density:
33 | # Create a tree
34 | new_tree = TreeCell(self, cell)
35 | # Set all trees in the first column on fire.
36 | if cell.coordinate[0] == 0:
37 | new_tree.condition = "On Fire"
38 |
39 | self.running = True
40 | self.datacollector.collect(self)
41 |
42 | def step(self):
43 | """Advance the model by one step."""
44 | self.agents.shuffle_do("step")
45 | # collect data
46 | self.datacollector.collect(self)
47 |
48 | # Halt if no more fire
49 | if self.count_type(self, "On Fire") == 0:
50 | self.running = False
51 |
52 | @staticmethod
53 | def count_type(model, tree_condition):
54 | """Helper method to count trees in a given condition in a given model."""
55 | return len(model.agents.select(lambda x: x.condition == tree_condition))
56 |
--------------------------------------------------------------------------------
/examples/forest_fire/readme.md:
--------------------------------------------------------------------------------
1 | # Forest Fire Model
2 |
3 | ## Summary
4 |
5 | The [forest fire model](http://en.wikipedia.org/wiki/Forest-fire_model) is a simple, cellular automaton simulation of a fire spreading through a forest. The forest is a grid of cells, each of which can either be empty or contain a tree. Trees can be unburned, on fire, or burned. The fire spreads from every on-fire tree to unburned neighbors; the on-fire tree then becomes burned. This continues until the fire dies out.
6 |
7 | ## How to Run
8 |
9 | To run the model interactively, run ``mesa runserver`` in this directory. e.g.
10 |
11 | ```
12 | $ mesa runserver
13 | ```
14 |
15 | Then open your browser to [http://127.0.0.1:8521/](http://127.0.0.1:8521/) and press Reset, then Run.
16 |
17 | To view and run the model analyses, use the ``Forest Fire Model`` Notebook.
18 |
19 | ## Files
20 |
21 | ### ``forest_fire/model.py``
22 |
23 | This defines the model. There is one agent class, **TreeCell**. Each TreeCell object which has (x, y) coordinates on the grid, and its condition is *Fine* by default. Every step, if the tree's condition is *On Fire*, it spreads the fire to any *Fine* trees in its [Von Neumann neighborhood](http://en.wikipedia.org/wiki/Von_Neumann_neighborhood) before changing its own condition to *Burned Out*.
24 |
25 | The **ForestFire** class is the model container. It is instantiated with width and height parameters which define the grid size, and density, which is the probability of any given cell having a tree in it. When a new model is instantiated, cells are randomly filled with trees with probability equal to density. All the trees in the left-hand column (x=0) are set to *On Fire*.
26 |
27 | Each step of the model, trees are activated in random order, spreading the fire and burning out. This continues until there are no more trees on fire -- the fire has completely burned out.
28 |
29 |
30 | ### ``forest_fire/server.py``
31 |
32 | This code defines and launches the in-browser visualization for the ForestFire model. It includes the **forest_fire_draw** method, which takes a TreeCell object as an argument and turns it into a portrayal to be drawn in the browser. Each tree is drawn as a rectangle filling the entire cell, with a color based on its condition. *Fine* trees are green, *On Fire* trees red, and *Burned Out* trees are black.
33 |
34 | ## Further Reading
35 |
36 | Read about the Forest Fire model on Wikipedia: http://en.wikipedia.org/wiki/Forest-fire_model
37 |
38 | This is directly based on the comparable NetLogo model:
39 |
40 | Wilensky, U. (1997). NetLogo Fire model. http://ccl.northwestern.edu/netlogo/models/Fire. Center for Connected Learning and Computer-Based Modeling, Northwestern University, Evanston, IL.
41 |
42 |
--------------------------------------------------------------------------------
/examples/forest_fire/requirements.txt:
--------------------------------------------------------------------------------
1 | jupyter
2 | mesa[viz]>=3.0
3 |
--------------------------------------------------------------------------------
/examples/hex_snowflake/Readme.md:
--------------------------------------------------------------------------------
1 | # Conway's Game Of "Life" on a hexagonal grid
2 |
3 | ## Summary
4 |
5 | In this model, each dead cell will become alive if it has exactly one neighbor. Alive cells stay alive forever.
6 |
7 |
8 | ## How to Run
9 |
10 | To run the model interactively, run ``mesa runserver`` in this directory. e.g.
11 |
12 | ```
13 | $ mesa runserver
14 | ```
15 |
16 | Then open your browser to [http://127.0.0.1:8521/](http://127.0.0.1:8521/) and press ``run``.
17 |
18 | ## Files
19 |
20 | * ``hex_snowflake/cell.py``: Defines the behavior of an individual cell, which can be in two states: DEAD or ALIVE.
21 | * ``hex_snowflake/model.py``: Defines the model itself, initialized with one alive cell at the center.
22 | * ``hex_snowflake/portrayal.py``: Describes for the front end how to render a cell.
23 | * ``hex_snowflake/server.py``: Defines an interactive visualization.
24 | * ``run.py``: Launches the visualization
25 |
26 | ## Further Reading
27 | [Explanation of how hexagon neighbors are calculated. (The method is slightly different for Cartesian coordinates)](http://www.redblobgames.com/grids/hexagons/#neighbors-offset)
28 |
--------------------------------------------------------------------------------
/examples/hex_snowflake/hex_snowflake/cell.py:
--------------------------------------------------------------------------------
1 | from mesa.experimental.cell_space import FixedAgent
2 |
3 |
4 | class Cell(FixedAgent):
5 | """Represents a single ALIVE or DEAD cell in the simulation."""
6 |
7 | DEAD = 0
8 | ALIVE = 1
9 |
10 | def __init__(self, cell, model, init_state=DEAD):
11 | """Create a cell, in the given state, at the given x, y position."""
12 | super().__init__(model)
13 | self.cell = cell
14 | self.state = init_state
15 | self._next_state = None
16 | self.is_considered = False
17 |
18 | @property
19 | def is_alive(self):
20 | return self.state == self.ALIVE
21 |
22 | @property
23 | def considered(self):
24 | return self.is_considered is True
25 |
26 | def determine_state(self):
27 | """Compute if the cell will be dead or alive at the next tick. A dead
28 | cell will become alive if it has only one neighbor. The state is not
29 | changed here, but is just computed and stored in self._next_state,
30 | because our current state may still be necessary for our neighbors
31 | to calculate their next state.
32 | When a cell is made alive, its neighbors are able to be considered
33 | in the next step. Only cells that are considered check their neighbors
34 | for performance reasons.
35 | """
36 | # assume no state change
37 | self._next_state = self.state
38 |
39 | if not self.is_alive and self.is_considered:
40 | # Get the neighbors and apply the rules on whether to be alive or dead
41 | # at the next tick.
42 | live_neighbors = sum(
43 | neighbor.is_alive for neighbor in self.cell.neighborhood.agents
44 | )
45 |
46 | if live_neighbors == 1:
47 | self._next_state = self.ALIVE
48 | for a in self.cell.neighborhood.agents:
49 | a.is_considered = True
50 |
51 | def assume_state(self):
52 | """Set the state to the new computed state"""
53 | self.state = self._next_state
54 |
--------------------------------------------------------------------------------
/examples/hex_snowflake/hex_snowflake/model.py:
--------------------------------------------------------------------------------
1 | import mesa
2 | from mesa.experimental.cell_space import HexGrid
3 |
4 | from .cell import Cell
5 |
6 |
7 | class HexSnowflake(mesa.Model):
8 | """Represents the hex grid of cells. The grid is represented by a 2-dimensional array
9 | of cells with adjacency rules specific to hexagons.
10 | """
11 |
12 | def __init__(self, width=50, height=50, seed=None):
13 | """Create a new playing area of (width, height) cells."""
14 | super().__init__(seed=seed)
15 | # Use a hexagonal grid, where edges wrap around.
16 | self.grid = HexGrid((width, height), capacity=1, torus=True, random=self.random)
17 |
18 | # Place a dead cell at each location.
19 | for entry in self.grid.all_cells:
20 | Cell(entry, self)
21 |
22 | # activate the center(ish) cell.
23 | centerish_cell = self.grid[(width // 2, height // 2)]
24 | centerish_cell.agents[0].state = 1
25 | for a in centerish_cell.neighborhood.agents:
26 | a.is_considered = True
27 |
28 | self.running = True
29 |
30 | def step(self):
31 | """Perform the model step in two stages:
32 | - First, all cells assume their next state (whether they will be dead or alive)
33 | - Then, all cells change state to their next state
34 | """
35 | self.agents.do("determine_state")
36 | self.agents.do("assume_state")
37 |
--------------------------------------------------------------------------------
/examples/hex_snowflake/hex_snowflake/portrayal.py:
--------------------------------------------------------------------------------
1 | def portrayCell(cell):
2 | """This function is registered with the visualization server to be called
3 | each tick to indicate how to draw the cell in its current state.
4 | :param cell: the cell in the simulation
5 | :return: the portrayal dictionary.
6 | """
7 | if cell is None:
8 | raise AssertionError
9 | return {
10 | "Shape": "hex",
11 | "r": 1,
12 | "Filled": "true",
13 | "Layer": 0,
14 | "x": cell.x,
15 | "y": cell.y,
16 | "Color": "black" if cell.isAlive else "white",
17 | }
18 |
--------------------------------------------------------------------------------
/examples/hex_snowflake/hex_snowflake/server.py:
--------------------------------------------------------------------------------
1 | import mesa
2 | from hex_snowflake.model import HexSnowflake
3 | from hex_snowflake.portrayal import portrayCell
4 |
5 | width, height = 50, 50
6 |
7 | # Make a world that is 50x50, on a 500x500 display.
8 | canvas_element = mesa.visualization.CanvasHexGrid(portrayCell, width, height, 500, 500)
9 |
10 | server = mesa.visualization.ModularServer(
11 | HexSnowflake, [canvas_element], "Hex Snowflake", {"height": height, "width": width}
12 | )
13 |
--------------------------------------------------------------------------------
/examples/hex_snowflake/requirements.txt:
--------------------------------------------------------------------------------
1 | mesa~=2.0
--------------------------------------------------------------------------------
/examples/hex_snowflake/run.py:
--------------------------------------------------------------------------------
1 | from hex_snowflake.server import server
2 |
3 | server.launch(open_browser=True)
4 |
--------------------------------------------------------------------------------
/examples/hotelling_law/Readme.md:
--------------------------------------------------------------------------------
1 | # Hotelling's Law Mesa Simulation
2 |
3 | ## Overview
4 |
5 | This project is an agent-based model implemented using the Mesa framework in Python. It simulates market dynamics based on Hotelling's Law, exploring the behavior of stores in a competitive market environment. Stores adjust their prices and locations if it's increases market share to maximize revenue, providing insights into the effects of competition and customer behavior on market outcomes.
6 |
7 | ## Hotelling's Law
8 |
9 | Hotelling's Law is an economic theory that predicts competitors in a market will end up in a state of minimum differentiation, often referred to as the "principle of minimum differentiation" or "Hotelling's linear city model". This model explores how businesses choose their location in relation to competitors and how this affects pricing and consumer choice.
10 |
11 | ## Installation
12 |
13 | To run this simulation, you will need Python 3.x and the following Python libraries:
14 |
15 | - mesa
16 | - scipy
17 |
18 | You can install all required libraries by running:
19 |
20 | ```bash
21 | pip install -r requirements.txt
22 | ```
23 |
24 | ## Project Structure
25 |
26 | ```plaintext
27 | mesa-examples/
28 | └── examples/
29 | └── hotelling_law/
30 | ├── hotelling_law/
31 | │ ├── __init__.py
32 | │ ├── model.py
33 | │ └── agents.py
34 | ├── __init__.py
35 | ├── app.py
36 | ├── Readme.md
37 | ├── requirements.txt
38 | └── tests.py
39 | ```
40 |
41 | ## Running the Simulation
42 |
43 | To start the simulation, navigate to the project directory and execute the following command:
44 |
45 | ```bash
46 | solara run app.py
47 | ```
48 |
49 | # Project Details
50 |
51 | ### Professor: [Vipin P. Veetil](https://www.vipinveetil.com/)
52 | ### Indian Institute of Management, Kozhikode
53 |
54 | ### Project by
55 |
56 | | Group 8 | | |
57 | |-|---------------------------|---------------|
58 | | Name | Email Id | Roll No |
59 | | Amrita Tripathy | amrita15d@iimk.edu.in | EPGP-15D-010 |
60 | | Anirban Mondal | anirban15e@iimk.edu.in | EPGP-15E-006 |
61 | | Namita Das | namita15d@iimk.edu.in | EPGP-15D-046 |
62 | | Sandeep Shenoy | sandeep15c@iimk.edu.in | EPGP-15C-076 |
63 | | Sanjeeb Kumar Dhinda | sanjeeb15d@iimk.edu.in | EPGP-15D-074 |
64 | | Umashankar Ankuri | umashankar15d@iimk.edu.in | EPGP-15D-096 |
65 | | Vinayak Nair | vinayak15d@iimk.edu.in | EPGP-15D-102 |
66 | | Wayne Joseph Unger | wayne15d@iimk.edu.in | EPGP-15D-104 |
67 |
68 |
69 | ### Hotelling Law Simulation - Visualization
70 | 
--------------------------------------------------------------------------------
/examples/hotelling_law/__init__.py:
--------------------------------------------------------------------------------
https://raw.githubusercontent.com/projectmesa/mesa-examples/6ba22dc41ebc37c3ef9f69bd2a6a22bfa08cd128/examples/hotelling_law/__init__.py
--------------------------------------------------------------------------------
/examples/hotelling_law/hotelling_law/__init__.py:
--------------------------------------------------------------------------------
https://raw.githubusercontent.com/projectmesa/mesa-examples/6ba22dc41ebc37c3ef9f69bd2a6a22bfa08cd128/examples/hotelling_law/hotelling_law/__init__.py
--------------------------------------------------------------------------------
/examples/hotelling_law/hotelling_law_sim.png:
--------------------------------------------------------------------------------
https://raw.githubusercontent.com/projectmesa/mesa-examples/6ba22dc41ebc37c3ef9f69bd2a6a22bfa08cd128/examples/hotelling_law/hotelling_law_sim.png
--------------------------------------------------------------------------------
/examples/hotelling_law/requirements.txt:
--------------------------------------------------------------------------------
1 | mesa
2 | scipy
--------------------------------------------------------------------------------
/examples/hotelling_law/tests.py:
--------------------------------------------------------------------------------
1 | from scipy.stats import linregress
2 |
3 | from .hotelling_law.model import HotellingModel
4 |
5 |
6 | def check_slope(data, increasing=True):
7 | """Checks the slope of a dataset to determine
8 | if it's increasing or decreasing.
9 | """
10 | slope = get_slope(data)
11 | return (slope > 0) if increasing else (slope < 0)
12 |
13 |
14 | def get_slope(data):
15 | slope, _, _, _, _ = linregress(range(len(data)), data)
16 | print(slope)
17 | return slope
18 |
19 |
20 | def test_decreasing_price_variance():
21 | """Test to ensure the price variance decreases over time,
22 | in line with Hotelling's law.
23 | """
24 | model = HotellingModel(
25 | N_stores=5,
26 | width=20,
27 | height=20,
28 | mode="default",
29 | consumer_preferences="default",
30 | environment_type="grid",
31 | mobility_rate=80,
32 | )
33 | model.run_model(step_count=50)
34 |
35 | df_model = model.datacollector.get_model_vars_dataframe()
36 |
37 | assert check_slope(df_model["Price Variance"], increasing=False), (
38 | "The price variance should decrease over time."
39 | )
40 |
41 |
42 | def test_constant_price_variance():
43 | """Test to ensure the price variance constant over time,
44 | with Rules location_only without changing price
45 | """
46 | model = HotellingModel(
47 | N_stores=5,
48 | width=20,
49 | height=20,
50 | mode="location_only",
51 | consumer_preferences="default",
52 | environment_type="grid",
53 | mobility_rate=80,
54 | )
55 | model.run_model(step_count=50)
56 |
57 | df_model = model.datacollector.get_model_vars_dataframe()
58 |
59 | assert get_slope(df_model["Price Variance"]) == 0, (
60 | "The price variance constant over time."
61 | )
62 |
--------------------------------------------------------------------------------
/examples/shape_example/Readme.md:
--------------------------------------------------------------------------------
1 | # Shape Model -- Basic Grid with two agents
2 |
3 | ## Summary
4 |
5 | A very basic example model to showcase the visualization on web browser.
6 |
7 | A simple grid is displayed on browser with two agents. The example does not
8 | have any agent motion involved. This example does not have any movement of
9 | agents so as to keep it to the simplest of level possible.
10 |
11 | This model showcases following features:
12 |
13 | * A rectangular grid
14 | * Text Overlay on the agent's shape on CanvasGrid
15 | * ArrowHead shaped agent for displaying heading of the agent on CanvasGrid
16 |
17 | ## Installation
18 |
19 | To install the dependencies use pip and the requirements.txt in this directory.
20 | e.g.
21 |
22 | ```
23 | $ pip install -r requirements.txt
24 | ```
25 |
26 | ## How to Run
27 |
28 | To run the model interactively, run ``mesa runserver`` in this directory. e.g.
29 |
30 | ```
31 | $ mesa runserver
32 | ```
33 |
34 | Then open your browser to [http://127.0.0.1:8521/](http://127.0.0.1:8521/) and
35 | press Reset, then Run.
36 |
37 | ## Files
38 |
39 | * ``shape_model/model.py``: Defines the basic shape model and agents.
40 | * ``shape_model/server.py``: Sets up the interactive visualization server.
41 | * ``run.py``: Launches a model visualization server.
42 |
--------------------------------------------------------------------------------
/examples/shape_example/requirements.txt:
--------------------------------------------------------------------------------
1 | mesa~=2.0
2 |
--------------------------------------------------------------------------------
/examples/shape_example/run.py:
--------------------------------------------------------------------------------
1 | from shape_example.server import server
2 |
3 | server.launch(open_browser=True)
4 |
--------------------------------------------------------------------------------
/examples/shape_example/shape_example/model.py:
--------------------------------------------------------------------------------
1 | import mesa
2 | from mesa.experimental.cell_space import OrthogonalMooreGrid
3 |
4 |
5 | class Walker(mesa.Agent):
6 | def __init__(self, model, heading=(1, 0)):
7 | super().__init__(model)
8 | self.heading = heading
9 | self.headings = {(1, 0), (0, 1), (-1, 0), (0, -1)}
10 |
11 |
12 | class ShapeExample(mesa.Model):
13 | def __init__(self, num_agents=2, width=20, height=10):
14 | super().__init__()
15 | self.num_agents = num_agents # num of agents
16 | self.headings = ((1, 0), (0, 1), (-1, 0), (0, -1)) # tuples are fast
17 | self.grid = OrthogonalMooreGrid((width, height), torus=True, random=self.random)
18 |
19 | self.make_walker_agents()
20 | self.running = True
21 |
22 | def make_walker_agents(self):
23 | for _ in range(self.num_agents):
24 | x = self.random.randrange(self.grid.dimensions[0])
25 | y = self.random.randrange(self.grid.dimensions[1])
26 | cell = self.grid[(x, y)]
27 | heading = self.random.choice(self.headings)
28 | # heading = (1, 0)
29 | if cell.is_empty:
30 | a = Walker(self, heading)
31 | a.cell = cell
32 |
33 | def step(self):
34 | self.agents.shuffle_do("step")
35 |
--------------------------------------------------------------------------------
/examples/shape_example/shape_example/server.py:
--------------------------------------------------------------------------------
1 | import mesa
2 |
3 | from .model import ShapeExample, Walker
4 |
5 |
6 | def agent_draw(agent):
7 | portrayal = None
8 | if agent is None:
9 | # Actually this if part is unnecessary, but still keeping it for
10 | # aesthetics
11 | pass
12 | elif isinstance(agent, Walker):
13 | print(f"Uid: {agent.unique_id}, Heading: {agent.heading}")
14 | portrayal = {
15 | "Shape": "arrowHead",
16 | "Filled": "true",
17 | "Layer": 2,
18 | "Color": ["#00FF00", "#99FF99"],
19 | "stroke_color": "#666666",
20 | "heading_x": agent.heading[0],
21 | "heading_y": agent.heading[1],
22 | "text": agent.unique_id,
23 | "text_color": "white",
24 | "scale": 0.8,
25 | }
26 | return portrayal
27 |
28 |
29 | width = 15
30 | height = 10
31 | num_agents = 2
32 | pixel_ratio = 50
33 | grid = mesa.visualization.CanvasGrid(
34 | agent_draw, width, height, width * pixel_ratio, height * pixel_ratio
35 | )
36 | server = mesa.visualization.ModularServer(
37 | ShapeExample,
38 | [grid],
39 | "Shape Model Example",
40 | {"N": num_agents, "width": width, "height": height},
41 | )
42 | server.max_steps = 0
43 | server.port = 8521
44 |
--------------------------------------------------------------------------------
/examples/termites/README.md:
--------------------------------------------------------------------------------
1 | # Termite WoodChip Behaviour
2 |
3 | This model simulates termites interacting with wood chips, inspired by the [NetLogo Termites model](https://ccl.northwestern.edu/netlogo/models/Termites). It explores emergent behavior in decentralized systems, demonstrating how simple agents (termites) collectively organize wood chips into piles without centralized coordination.
4 |
5 | ## Summary
6 |
7 | In this simulation, multiple termite agents move randomly on a grid containing scattered wood chips. Each termite follows simple rules:
8 |
9 | 1. Search for a wood chip. If found, pick it up and move away.
10 | 2. When carrying a wood chip, search for a pile (another wood chip).
11 | 3. When a pile is found, find a nearby empty space to place the carried chip.
12 | 4. After dropping a chip, move away from the pile.
13 |
14 | Over time, these simple interactions lead to the formation of wood chip piles, illustrating decentralized organization without a central coordinator.
15 |
16 | ## Installation
17 |
18 | Make sure that you have installed the `latest` version of mesa.
19 |
20 | ## Usage
21 |
22 | To run the simulation:
23 | ```bash
24 | solara run app.py
25 | ```
26 |
27 | ## Model Details
28 |
29 | ### Agents
30 |
31 | - **Termite:** An agent that moves within the grid environment, capable of carrying a single wood chip at a time. The termite follows the precise logic of the original NetLogo model, with each behavior (searching, finding piles, dropping chips) continuing until successful.
32 |
33 | ### Environment
34 |
35 | - **Grid:** A two-dimensional toroidal grid where termites interact with the wood chips. The toroidal nature means agents exiting one edge re-enter from the opposite edge.
36 | - **PropertyLayer:** A data structure overlaying the grid, storing the presence of wood chips at each cell.
37 |
38 | ### Agent Behaviors
39 |
40 | - **wiggle():** Simulates random movement by selecting a random neighboring cell.
41 | - **search_for_chip():** Looks for a wood chip. If found, picks it up and moves forward significantly.
42 | - **find_new_pile():** When carrying a chip, searches for a cell that already has a wood chip.
43 | - **put_down_chip():** Attempts to place the carried wood chip in an empty cell near a pile.
44 | - **get_away():** After dropping a chip, moves away from the pile to prevent clustering.
45 |
46 | ## References
47 |
48 | - Wilensky, U. (1997). NetLogo Termites model. Center for Connected Learning and Computer-Based Modeling, Northwestern University, Evanston, IL. Available at: [NetLogo Termites Model](https://ccl.northwestern.edu/netlogo/models/Termites)
--------------------------------------------------------------------------------
/examples/termites/app.py:
--------------------------------------------------------------------------------
1 | from mesa.visualization import SolaraViz
2 | from mesa.visualization.components.matplotlib_components import make_mpl_space_component
3 | from termites.model import TermiteModel
4 |
5 | wood_chip_portrayal = {
6 | "woodcell": {
7 | "color": "blue",
8 | "alpha": 0.6,
9 | "colorbar": False,
10 | "vmin": 0,
11 | "vmax": 2,
12 | },
13 | }
14 |
15 |
16 | def agent_portrayal(agent):
17 | return {
18 | "marker": ">",
19 | "color": "red" if agent.has_woodchip else "black",
20 | "size": 10,
21 | }
22 |
23 |
24 | model_params = {
25 | "seed": {
26 | "type": "InputText",
27 | "value": 42,
28 | "label": "Seed",
29 | },
30 | "num_termites": {
31 | "type": "SliderInt",
32 | "value": 100,
33 | "label": "No. of Termites",
34 | "min": 10,
35 | "max": 1000,
36 | "step": 1,
37 | },
38 | "wood_chip_density": {
39 | "type": "SliderFloat",
40 | "value": 0.1,
41 | "label": "Wood Chip Density",
42 | "min": 0.01,
43 | "max": 1,
44 | "step": 0.1,
45 | },
46 | "width": {
47 | "type": "SliderInt",
48 | "value": 100,
49 | "label": "Width",
50 | "min": 10,
51 | "max": 500,
52 | "step": 1,
53 | },
54 | "height": {
55 | "type": "SliderInt",
56 | "value": 100,
57 | "label": "Height",
58 | "min": 10,
59 | "max": 500,
60 | "step": 1,
61 | },
62 | }
63 |
64 | model = TermiteModel()
65 |
66 |
67 | def post_process(ax):
68 | ax.set_aspect("equal")
69 | ax.set_xticks([])
70 | ax.set_yticks([])
71 |
72 |
73 | woodchips_space = make_mpl_space_component(
74 | agent_portrayal=agent_portrayal,
75 | propertylayer_portrayal=wood_chip_portrayal,
76 | post_process=post_process,
77 | draw_grid=False,
78 | )
79 |
80 | page = SolaraViz(
81 | model,
82 | components=[woodchips_space],
83 | model_params=model_params,
84 | name="Termites Model",
85 | )
86 |
--------------------------------------------------------------------------------
/examples/termites/termites/__init__.py:
--------------------------------------------------------------------------------
https://raw.githubusercontent.com/projectmesa/mesa-examples/6ba22dc41ebc37c3ef9f69bd2a6a22bfa08cd128/examples/termites/termites/__init__.py
--------------------------------------------------------------------------------
/examples/termites/termites/agents.py:
--------------------------------------------------------------------------------
1 | from mesa.experimental.cell_space import CellAgent
2 |
3 |
4 | class Termite(CellAgent):
5 | """A Termite agent that has ability to carry woodchip.
6 |
7 | Attributes:
8 | has_woodchip(bool): True if the agent is carrying a wood chip.
9 | """
10 |
11 | def __init__(self, model, cell):
12 | """Args:
13 | model: The model instance.
14 | cell: The starting cell (position) of the agent.
15 | """
16 | super().__init__(model)
17 | self.cell = cell
18 | self.has_woodchip = False
19 |
20 | def wiggle(self):
21 | self.cell = self.model.random.choice(self.model.grid.all_cells.cells)
22 |
23 | def search_for_chip(self):
24 | if self.cell.woodcell:
25 | self.cell.woodcell = False
26 | self.has_woodchip = True
27 |
28 | for _ in range(10):
29 | new_cell = self.cell.neighborhood.select_random_cell()
30 | if new_cell.is_empty:
31 | self.cell = new_cell
32 | break
33 | return True
34 | else:
35 | # No chip found, wiggle and return False to continue searching
36 | self.wiggle()
37 | return False
38 |
39 | def find_new_pile(self):
40 | # Continue wiggling until finding a cell with a wood chip.
41 | if not self.cell.woodcell:
42 | self.wiggle()
43 | return False
44 | return True
45 |
46 | def put_down_chip(self):
47 | if not self.has_woodchip:
48 | return True
49 |
50 | if not self.cell.woodcell:
51 | self.cell.woodcell = True
52 | self.has_woodchip = False
53 |
54 | self.get_away()
55 | return True
56 | else:
57 | empty_neighbors = [c for c in self.cell.neighborhood if c.is_empty]
58 | if empty_neighbors:
59 | self.cell = self.model.random.choice(empty_neighbors)
60 | return False
61 |
62 | def get_away(self):
63 | for _ in range(10):
64 | new_cell = self.cell.neighborhood.select_random_cell()
65 | if new_cell.is_empty:
66 | self.cell = new_cell
67 | if self.cell.woodcell:
68 | return self.get_away()
69 | break
70 |
71 | def step(self):
72 | """Protocol which termite agent follows:
73 | 1. Search for a wood chip if not carrying one.
74 | 2. Find a new pile (a cell with a wood chip) if carrying a chip.
75 | 3. Put down the chip if a suitable location is found.
76 | """
77 | if not self.has_woodchip:
78 | while not self.search_for_chip():
79 | pass
80 |
81 | while not self.find_new_pile():
82 | pass
83 |
84 | while not self.put_down_chip():
85 | pass
86 |
--------------------------------------------------------------------------------
/examples/termites/termites/model.py:
--------------------------------------------------------------------------------
1 | from mesa import Model
2 | from mesa.experimental.cell_space import OrthogonalMooreGrid, PropertyLayer
3 |
4 | from .agents import Termite
5 |
6 |
7 | class TermiteModel(Model):
8 | """A simulation that shows behavior of termite agents gathering wood chips into piles."""
9 |
10 | def __init__(
11 | self, num_termites=100, width=100, height=100, wood_chip_density=0.1, seed=42
12 | ):
13 | """Initialize the model.
14 |
15 | Args:
16 | num_termites: Number of Termite Agents,
17 | width: Grid width.
18 | height: Grid heights.
19 | wood_chip_density: Density of wood chips in the grid.
20 | seed : Random seed for reproducibility.
21 | """
22 | super().__init__(seed=seed)
23 | self.num_termites = num_termites
24 | self.wood_chip_density = wood_chip_density
25 |
26 | self.grid = OrthogonalMooreGrid((width, height), torus=True, random=self.random)
27 |
28 | self.wood_chips_layer = PropertyLayer(
29 | "woodcell", (width, height), default_value=False, dtype=bool
30 | )
31 |
32 | # Randomly distribute wood chips, by directly modifying the layer's underlying ndarray
33 | self.wood_chips_layer.data = self.rng.choice(
34 | [True, False],
35 | size=(width, height),
36 | p=[self.wood_chip_density, 1 - self.wood_chip_density],
37 | )
38 |
39 | self.grid.add_property_layer(self.wood_chips_layer)
40 |
41 | # Create agents and randomly distribute them over the grid
42 | Termite.create_agents(
43 | model=self,
44 | n=self.num_termites,
45 | cell=self.random.sample(self.grid.all_cells.cells, k=self.num_termites),
46 | )
47 |
48 | def step(self):
49 | self.agents.shuffle_do("step")
50 |
--------------------------------------------------------------------------------
/examples/warehouse/Readme.md:
--------------------------------------------------------------------------------
1 | # Pseudo-Warehouse Model (Meta-Agent Example)
2 |
3 | ## Summary
4 |
5 | The purpose of this model is to demonstrate Mesa's meta-agent capability and some of its implementation approaches, not to be an accurate warehouse simulation.
6 |
7 | **Overview of meta agent:** Complex systems often have multiple levels of components. A city is not a single entity, but it is made of districts,neighborhoods, buildings, and people. A forest comprises an ecosystem of trees, plants, animals, and microorganisms. An organization is not one entity, but is made of departments, sub-departments, and people. A person is not a single entity, but it is made of micro biomes, organs and cells.
8 |
9 | This reality is the motivation for meta-agents. It allows users to represent these multiple levels, where each level can have agents with sub-agents.
10 |
11 | In this simulation, robots are given tasks to take retrieve inventory items and then take those items to the loading docks.
12 |
13 | Each `RobotAgent` is made up of sub-components that are treated as separate agents. For this simulation, each robot as a `SensorAgent`, `RouterAgent`, and `WorkerAgent`.
14 |
15 | This model demonstrates deliberate meta-agent creation. It shows the basics of meta-agent creation and different ways to use and reference sub-agent and meta-agent functions and attributes. (The alliance formation demonstrates emergent meta-agent creation.)
16 |
17 | In its current configuration, agents being part of multiple meta-agents is not supported
18 |
19 | An additional item of note is that to reference the RobotAgent created in model you will see `type(self.RobotAgent)` or `type(model.RobotAgent)` in various places. If you have any ideas for how to make this more user friendly please let us know or do a pull request.
20 |
21 | ## Installation
22 |
23 | This model requires Mesa's recommended install
24 |
25 | ```
26 | $ pip install 'mesa[rec]>=3'
27 | ```
28 |
29 | ## How to Run
30 |
31 | To run the model interactively, in this directory, run the following command
32 |
33 | ```
34 | $ solara run app.py
35 | ```
36 |
37 | ## Files
38 |
39 | - `model.py`: Contains creation of agents, the network and management of agent execution.
40 | - `agents.py`: Contains logic for forming alliances and creation of new agents
41 | - `app.py`: Contains the code for the interactive Solara visualization.
42 | - `make_warehouse`: Generates a warehouse numpy array with loading docks, inventory, and charging stations.
--------------------------------------------------------------------------------
/examples/warehouse/app.py:
--------------------------------------------------------------------------------
1 | import matplotlib.pyplot as plt
2 | import pandas as pd
3 | import solara
4 | from mesa.visualization import SolaraViz
5 | from mesa.visualization.utils import update_counter
6 | from warehouse.agents import InventoryAgent
7 | from warehouse.model import WarehouseModel
8 |
9 | # Constants
10 | LOADING_DOCKS = [(0, 0, 0), (0, 2, 0), (0, 4, 0), (0, 6, 0), (0, 8, 0)]
11 | AXIS_LIMITS = {"x": (0, 22), "y": (0, 20), "z": (0, 5)}
12 |
13 | model_params = {
14 | "seed": {
15 | "type": "InputText",
16 | "value": 42,
17 | "label": "Random Seed",
18 | },
19 | }
20 |
21 |
22 | def prepare_agent_data(model, agent_type, agent_label):
23 | """Prepare data for agents of a specific type.
24 |
25 | Args:
26 | model: The WarehouseModel instance.
27 | agent_type: The type of agent (e.g., "InventoryAgent", "RobotAgent").
28 | agent_label: The label for the agent type.
29 |
30 | Returns:
31 | A list of dictionaries containing agent coordinates and type.
32 | """
33 | return [
34 | {
35 | "x": agent.cell.coordinate[0],
36 | "y": agent.cell.coordinate[1],
37 | "z": agent.cell.coordinate[2],
38 | "type": agent_label,
39 | }
40 | for agent in model.agents_by_type[agent_type]
41 | ]
42 |
43 |
44 | @solara.component
45 | def plot_warehouse(model):
46 | """Visualize the warehouse model in a 3D scatter plot.
47 |
48 | Args:
49 | model: The WarehouseModel instance.
50 | """
51 | update_counter.get()
52 |
53 | # Prepare data for inventory and robot agents
54 | inventory_data = prepare_agent_data(model, InventoryAgent, "Inventory")
55 | robot_data = prepare_agent_data(model, type(model.RobotAgent), "Robot")
56 |
57 | # Combine data into a single DataFrame
58 | data = pd.DataFrame(inventory_data + robot_data)
59 |
60 | # Create Matplotlib 3D scatter plot
61 | fig = plt.figure(figsize=(8, 6))
62 | ax = fig.add_subplot(111, projection="3d")
63 |
64 | # Highlight loading dock cells
65 | for i, dock in enumerate(LOADING_DOCKS):
66 | ax.scatter(
67 | dock[0],
68 | dock[1],
69 | dock[2],
70 | c="yellow",
71 | label="Loading Dock"
72 | if i == 0
73 | else None, # Add label only to the first dock
74 | s=300,
75 | marker="o",
76 | )
77 |
78 | # Plot inventory agents
79 | inventory = data[data["type"] == "Inventory"]
80 | ax.scatter(
81 | inventory["x"],
82 | inventory["y"],
83 | inventory["z"],
84 | c="blue",
85 | label="Inventory",
86 | s=100,
87 | marker="s",
88 | )
89 |
90 | # Plot robot agents
91 | robots = data[data["type"] == "Robot"]
92 | ax.scatter(robots["x"], robots["y"], robots["z"], c="red", label="Robot", s=200)
93 |
94 | # Set labels, title, and legend
95 | ax.set_xlabel("X")
96 | ax.set_ylabel("Y")
97 | ax.set_zlabel("Z")
98 | ax.set_title("Warehouse Visualization")
99 | ax.legend()
100 |
101 | # Configure plot appearance
102 | ax.grid(False)
103 | ax.set_xlim(*AXIS_LIMITS["x"])
104 | ax.set_ylim(*AXIS_LIMITS["y"])
105 | ax.set_zlim(*AXIS_LIMITS["z"])
106 | ax.axis("off")
107 |
108 | # Render the plot in Solara
109 | solara.FigureMatplotlib(fig)
110 |
111 |
112 | # Create initial model instance
113 | model = WarehouseModel()
114 |
115 | # Create the SolaraViz page
116 | page = SolaraViz(
117 | model,
118 | components=[plot_warehouse],
119 | model_params=model_params,
120 | name="Pseudo-Warehouse Model",
121 | )
122 |
123 | page # noqa
124 |
--------------------------------------------------------------------------------
/examples/warehouse/requirements.txt:
--------------------------------------------------------------------------------
1 | mesa[rec]>=3
2 |
--------------------------------------------------------------------------------
/examples/warehouse/warehouse/__init__.py:
--------------------------------------------------------------------------------
https://raw.githubusercontent.com/projectmesa/mesa-examples/6ba22dc41ebc37c3ef9f69bd2a6a22bfa08cd128/examples/warehouse/warehouse/__init__.py
--------------------------------------------------------------------------------
/examples/warehouse/warehouse/make_warehouse.py:
--------------------------------------------------------------------------------
1 | import random
2 | import string
3 |
4 | import numpy as np
5 |
6 | # Constants
7 | DEFAULT_ROWS = 22
8 | DEFAULT_COLS = 20
9 | DEFAULT_HEIGHT = 4
10 | LOADING_DOCK_COORDS = [(0, i, 0) for i in range(0, 10, 2)]
11 | CHARGING_STATION_COORDS = [(21, i, 0) for i in range(19, 10, -2)]
12 |
13 |
14 | def generate_item_code() -> str:
15 | """Generate a random item code (1 letter + 2 numbers)."""
16 | letter = random.choice(string.ascii_uppercase)
17 | number = random.randint(10, 99)
18 | return f"{letter}{number}"
19 |
20 |
21 | def make_warehouse(
22 | rows: int = DEFAULT_ROWS, cols: int = DEFAULT_COLS, height: int = DEFAULT_HEIGHT
23 | ) -> np.ndarray:
24 | """Generate a warehouse layout with designated LD, CS, and storage rows as a NumPy array.
25 |
26 | Args:
27 | rows (int): Number of rows in the warehouse.
28 | cols (int): Number of columns in the warehouse.
29 | height (int): Number of levels in the warehouse.
30 |
31 | Returns:
32 | np.ndarray: A 3D NumPy array representing the warehouse layout.
33 | """
34 | # Initialize empty warehouse layout
35 | warehouse = np.full((rows, cols, height), " ", dtype=object)
36 |
37 | # Place Loading Docks (LD)
38 | for r, c, h in LOADING_DOCK_COORDS:
39 | warehouse[r, c, h] = "LD"
40 |
41 | # Place Charging Stations (CS)
42 | for r, c, h in CHARGING_STATION_COORDS:
43 | warehouse[r, c, h] = "CS"
44 |
45 | # Fill storage rows with item codes
46 | for r in range(3, rows - 2, 3): # Skip row 0,1,2 (LD) and row 17,18,19 (CS)
47 | for c in range(2, cols, 3): # Leave 2 spaces between each item row
48 | for h in range(height):
49 | warehouse[r, c, h] = generate_item_code()
50 |
51 | return warehouse
52 |
--------------------------------------------------------------------------------
/examples/warehouse/warehouse/model.py:
--------------------------------------------------------------------------------
1 | import mesa
2 | from mesa.discrete_space import OrthogonalMooreGrid
3 | from mesa.discrete_space.cell_agent import CellAgent
4 | from mesa.experimental.meta_agents.meta_agent import create_meta_agent
5 |
6 | from .agents import (
7 | InventoryAgent,
8 | RouteAgent,
9 | SensorAgent,
10 | WorkerAgent,
11 | )
12 | from .make_warehouse import make_warehouse
13 |
14 | # Constants for configuration
15 | LOADING_DOCKS = [(0, 0, 0), (0, 2, 0), (0, 4, 0), (0, 6, 0), (0, 8, 0)]
16 | CHARGING_STATIONS = [
17 | (21, 19, 0),
18 | (21, 17, 0),
19 | (21, 15, 0),
20 | (21, 13, 0),
21 | (21, 11, 0),
22 | ]
23 | INVENTORY_START_ROW_OFFSET = 3
24 |
25 |
26 | class WarehouseModel(mesa.Model):
27 | """Model for simulating warehouse management with autonomous systems where
28 | each autonomous system (e.g., robot) is made of numerous smaller agents
29 | (e.g., routing, sensors, etc.).
30 | """
31 |
32 | def __init__(self, seed=42):
33 | """Initialize the model.
34 |
35 | Args:
36 | seed (int): Random seed.
37 | """
38 | super().__init__(seed=seed)
39 | self.inventory = {}
40 | self.loading_docks = LOADING_DOCKS
41 | self.charging_stations = CHARGING_STATIONS
42 |
43 | # Create warehouse and instantiate grid
44 | layout = make_warehouse()
45 | self.warehouse = OrthogonalMooreGrid(
46 | (layout.shape[0], layout.shape[1], layout.shape[2]),
47 | torus=False,
48 | capacity=1,
49 | random=self.random,
50 | )
51 |
52 | # Create Inventory Agents
53 | for row in range(
54 | INVENTORY_START_ROW_OFFSET, layout.shape[0] - INVENTORY_START_ROW_OFFSET
55 | ):
56 | for col in range(layout.shape[1]):
57 | for height in range(layout.shape[2]):
58 | if layout[row][col][height].strip():
59 | item = layout[row][col][height]
60 | InventoryAgent(self, self.warehouse[row, col, height], item)
61 |
62 | # Create Robot Agents
63 | for idx in range(len(self.loading_docks)):
64 | # Create constituting_agents
65 | router = RouteAgent(self)
66 | sensor = SensorAgent(self)
67 | worker = WorkerAgent(
68 | self,
69 | self.warehouse[self.loading_docks[idx]],
70 | self.warehouse[self.charging_stations[idx]],
71 | )
72 |
73 | # Create meta-agent and place in warehouse
74 | self.RobotAgent = create_meta_agent(
75 | self,
76 | "RobotAgent",
77 | [router, sensor, worker],
78 | CellAgent,
79 | meta_attributes={
80 | "cell": self.warehouse[self.charging_stations[idx]],
81 | "status": "open",
82 | },
83 | assume_constituting_agent_attributes=True,
84 | assume_constituting_agent_methods=True,
85 | )
86 |
87 | def central_move(self, robot):
88 | """Consolidates meta-agent behavior in the model class.
89 |
90 | Args:
91 | robot: The robot meta-agent to move.
92 | """
93 | robot.move(robot.cell.coordinate, robot.path)
94 |
95 | def step(self):
96 | """Advance the model by one step."""
97 | for robot in self.agents_by_type[type(self.RobotAgent)]:
98 | if robot.status == "open": # Assign a task to the robot
99 | item = self.random.choice(self.agents_by_type[InventoryAgent])
100 | if item.quantity > 0:
101 | robot.initiate_task(item)
102 | robot.status = "inventory"
103 | self.central_move(robot)
104 | else:
105 | robot.continue_task()
106 |
--------------------------------------------------------------------------------
/gis/agents_and_networks/.gitignore:
--------------------------------------------------------------------------------
1 | # Byte-compiled / optimized / DLL files
2 | __pycache__/
3 | *.py[cod]
4 |
5 | # C extensions
6 | *.so
7 |
8 | # Distribution / packaging
9 | .Python
10 | env/
11 | venv/
12 | build/
13 | develop-eggs/
14 | dist/
15 | downloads/
16 | eggs/
17 | .eggs/
18 | lib/
19 | lib64/
20 | parts/
21 | sdist/
22 | var/
23 | *.egg-info/
24 | .installed.cfg
25 | *.egg
26 |
27 | # PyInstaller
28 | # Usually these files are written by a python script from a template
29 | # before PyInstaller builds the exe, so as to inject date/other infos into it.
30 | *.manifest
31 | *.spec
32 |
33 | # Installer logs
34 | pip-log.txt
35 | pip-delete-this-directory.txt
36 |
37 | # Unit test / coverage reports
38 | htmlcov/
39 | .tox/
40 | .coverage
41 | .coverage.*
42 | .cache
43 | nosetests.xml
44 | coverage.xml
45 | *.cover
46 |
47 | # Translations
48 | *.mo
49 | *.pot
50 |
51 | # Django stuff:
52 | *.log
53 |
54 | # Sphinx documentation
55 | docs/_build/
56 |
57 | # PyBuilder
58 | target/
59 |
60 | # DotEnv configuration
61 | .env
62 |
63 | # Database
64 | *.db
65 | *.rdb
66 |
67 | # Pycharm
68 | .idea
69 |
70 | # VS Code
71 | .vscode/
72 |
73 | # Spyder
74 | .spyproject/
75 |
76 | # Jupyter NB Checkpoints
77 | .ipynb_checkpoints/
78 |
79 | # exclude data from source control by default
80 | # /data/
81 |
82 | # Mac OS-specific storage files
83 | .DS_Store
84 |
85 | # vim
86 | *.swp
87 | *.swo
88 |
89 | # Mypy cache
90 | .mypy_cache/
91 |
92 | **/*.pkl
93 |
--------------------------------------------------------------------------------
/gis/agents_and_networks/README.md:
--------------------------------------------------------------------------------
1 | Agents and Networks Model
2 | =========================
3 |
4 | [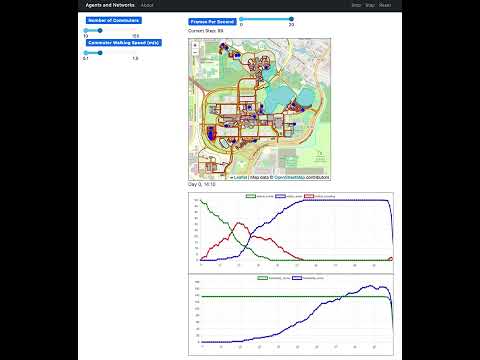](https://www.youtube.com/watch?v=zIRMNPTBESc)
5 |
6 | ## Summary
7 |
8 | This is an implementation of the [GMU-Social Model](https://github.com/abmgis/abmgis/blob/master/Chapter08-Networks/Models/GMU-Social/README.md) in Python, using [Mesa](https://github.com/projectmesa/mesa) and [Mesa-Geo](https://github.com/projectmesa/mesa-geo).
9 |
10 | In this model, buildings are randomly assigned to agents as their home and work places, and the buildings' nearest road vertices are used as their entrances. Agents' commute routes can be found as the shortest path between entrances of their home and work places. These commute routes are segmented according to agents' walking speed. In this way, the movements of agents are constrained on the road network.
11 |
12 | ### GeoSpace
13 |
14 | The GeoSpace contains multiple vector layers, including buildings, lakes, and a road network. More specifically, the road network is constructed from the polyline data and implemented by two underlying data structures: a topological network and a k-d tree. First, by treating road vertices as nodes and line segments as links, a topological network is created using the NetworkX and momepy libraries. NetworkX also provides several methods for shortest path computations (e.g., Dijkstra, A-star). Second, a k-d tree is built for all road vertices through the Scikit-learn library for the purpose of nearest vertex searches.
15 |
16 | ### GeoAgent
17 |
18 | The commuters are the GeoAgents.
19 |
20 | ## How to run
21 |
22 | First install the dependencies:
23 |
24 | ```bash
25 | python3 -m pip install -r requirements.txt
26 | ```
27 |
28 | Then run the model:
29 |
30 | ```bash
31 | solara run app.py -- --campus ub
32 | ```
33 |
34 | Change `ub` to `gmu` for a different campus map.
35 |
36 | Then open your browser to [http://127.0.0.1:8765/](http://127.0.0.1:8765/) and press the play button `▶`.
37 |
38 | ## License
39 |
40 | The data is from the [GMU-Social Model](https://github.com/abmgis/abmgis/blob/master/Chapter08-Networks/Models/GMU-Social/README.md) and is licensed under the [Creative Commons Attribution-ShareAlike 4.0 International License](https://creativecommons.org/licenses/by-sa/4.0/).
41 |
--------------------------------------------------------------------------------
/gis/agents_and_networks/app.py:
--------------------------------------------------------------------------------
1 | import sys
2 |
3 | from mesa.visualization import Slider, SolaraViz, make_plot_component
4 | from mesa_geo.visualization import make_geospace_component
5 | from src.model.model import AgentsAndNetworks
6 | from src.visualization.utils import agent_draw, make_plot_clock
7 |
8 |
9 | def parse_args():
10 | campus = "ub"
11 | if "--campus" in sys.argv:
12 | campus = sys.argv[sys.argv.index("--campus") + 1]
13 | return campus
14 |
15 |
16 | if __name__ == "__main__":
17 | campus = parse_args()
18 |
19 | if campus == "ub":
20 | data_file_prefix = "UB"
21 | elif campus == "gmu":
22 | data_file_prefix = "Mason"
23 | else:
24 | raise ValueError("Invalid campus name. Choose from ub or gmu.")
25 |
26 | campus_params = {
27 | "ub": {"data_crs": "epsg:4326", "commuter_speed": 0.5, "zoom": 14},
28 | "gmu": {"data_crs": "epsg:2283", "commuter_speed": 0.4, "zoom": 16},
29 | }
30 | model_params = {
31 | "campus": campus,
32 | "data_crs": campus_params[campus]["data_crs"],
33 | "buildings_file": f"data/{campus}/{data_file_prefix}_bld.zip",
34 | "walkway_file": f"data/{campus}/{data_file_prefix}_walkway_line.zip",
35 | "lakes_file": f"data/{campus}/hydrop.zip",
36 | "rivers_file": f"data/{campus}/hydrol.zip",
37 | "driveway_file": f"data/{campus}/{data_file_prefix}_Rds.zip",
38 | "output_dir": "outputs",
39 | "show_walkway": True,
40 | "show_lakes_and_rivers": True,
41 | "show_driveway": True,
42 | "num_commuters": Slider(
43 | "Number of Commuters", value=50, min=10, max=150, step=10
44 | ),
45 | "commuter_speed": Slider(
46 | "Commuter Walking Speed (m/s)",
47 | value=campus_params[campus]["commuter_speed"],
48 | min=0.1,
49 | max=1.5,
50 | step=0.1,
51 | ),
52 | }
53 | model = AgentsAndNetworks()
54 | page = SolaraViz(
55 | model,
56 | [
57 | make_geospace_component(agent_draw, zoom=campus_params[campus]["zoom"]),
58 | make_plot_clock,
59 | make_plot_component(["status_home", "status_work", "status_traveling"]),
60 | make_plot_component(["friendship_home", "friendship_work"]),
61 | ],
62 | name="Agents and Networks",
63 | model_params=model_params,
64 | )
65 |
66 | page # noqa
67 |
--------------------------------------------------------------------------------
/gis/agents_and_networks/data/gmu/Mason_Rds.zip:
--------------------------------------------------------------------------------
https://raw.githubusercontent.com/projectmesa/mesa-examples/6ba22dc41ebc37c3ef9f69bd2a6a22bfa08cd128/gis/agents_and_networks/data/gmu/Mason_Rds.zip
--------------------------------------------------------------------------------
/gis/agents_and_networks/data/gmu/Mason_bld.zip:
--------------------------------------------------------------------------------
https://raw.githubusercontent.com/projectmesa/mesa-examples/6ba22dc41ebc37c3ef9f69bd2a6a22bfa08cd128/gis/agents_and_networks/data/gmu/Mason_bld.zip
--------------------------------------------------------------------------------
/gis/agents_and_networks/data/gmu/Mason_walkway_line.zip:
--------------------------------------------------------------------------------
https://raw.githubusercontent.com/projectmesa/mesa-examples/6ba22dc41ebc37c3ef9f69bd2a6a22bfa08cd128/gis/agents_and_networks/data/gmu/Mason_walkway_line.zip
--------------------------------------------------------------------------------
/gis/agents_and_networks/data/gmu/hydrol.zip:
--------------------------------------------------------------------------------
https://raw.githubusercontent.com/projectmesa/mesa-examples/6ba22dc41ebc37c3ef9f69bd2a6a22bfa08cd128/gis/agents_and_networks/data/gmu/hydrol.zip
--------------------------------------------------------------------------------
/gis/agents_and_networks/data/gmu/hydrop.zip:
--------------------------------------------------------------------------------
https://raw.githubusercontent.com/projectmesa/mesa-examples/6ba22dc41ebc37c3ef9f69bd2a6a22bfa08cd128/gis/agents_and_networks/data/gmu/hydrop.zip
--------------------------------------------------------------------------------
/gis/agents_and_networks/data/ub/UB_Rds.zip:
--------------------------------------------------------------------------------
https://raw.githubusercontent.com/projectmesa/mesa-examples/6ba22dc41ebc37c3ef9f69bd2a6a22bfa08cd128/gis/agents_and_networks/data/ub/UB_Rds.zip
--------------------------------------------------------------------------------
/gis/agents_and_networks/data/ub/UB_bld.zip:
--------------------------------------------------------------------------------
https://raw.githubusercontent.com/projectmesa/mesa-examples/6ba22dc41ebc37c3ef9f69bd2a6a22bfa08cd128/gis/agents_and_networks/data/ub/UB_bld.zip
--------------------------------------------------------------------------------
/gis/agents_and_networks/data/ub/UB_walkway_line.zip:
--------------------------------------------------------------------------------
https://raw.githubusercontent.com/projectmesa/mesa-examples/6ba22dc41ebc37c3ef9f69bd2a6a22bfa08cd128/gis/agents_and_networks/data/ub/UB_walkway_line.zip
--------------------------------------------------------------------------------
/gis/agents_and_networks/data/ub/hydrol.zip:
--------------------------------------------------------------------------------
https://raw.githubusercontent.com/projectmesa/mesa-examples/6ba22dc41ebc37c3ef9f69bd2a6a22bfa08cd128/gis/agents_and_networks/data/ub/hydrol.zip
--------------------------------------------------------------------------------
/gis/agents_and_networks/data/ub/hydrop.zip:
--------------------------------------------------------------------------------
https://raw.githubusercontent.com/projectmesa/mesa-examples/6ba22dc41ebc37c3ef9f69bd2a6a22bfa08cd128/gis/agents_and_networks/data/ub/hydrop.zip
--------------------------------------------------------------------------------
/gis/agents_and_networks/outputs/.gitkeep:
--------------------------------------------------------------------------------
https://raw.githubusercontent.com/projectmesa/mesa-examples/6ba22dc41ebc37c3ef9f69bd2a6a22bfa08cd128/gis/agents_and_networks/outputs/.gitkeep
--------------------------------------------------------------------------------
/gis/agents_and_networks/requirements.txt:
--------------------------------------------------------------------------------
1 | # local package
2 | -e .
3 |
4 | # external requirements
5 | mesa-geo~=0.9.0
6 | geopandas
7 | numpy
8 | pandas
9 | matplotlib
10 | seaborn
11 | scikit-learn
12 | jupyter
13 | notebook
14 | jupyter_contrib_nbextensions
15 | jupyter_nbextensions_configurator
16 | autopep8
17 | tqdm
18 | momepy
19 | networkx
20 | black[jupyter]
21 |
--------------------------------------------------------------------------------
/gis/agents_and_networks/setup.py:
--------------------------------------------------------------------------------
1 | from setuptools import find_packages, setup
2 |
3 | setup(
4 | name="src",
5 | packages=find_packages(),
6 | version="0.1.0",
7 | description="GMU-Social Model in Python",
8 | author="Wang Boyu",
9 | license="",
10 | )
11 |
--------------------------------------------------------------------------------
/gis/agents_and_networks/src/__init__.py:
--------------------------------------------------------------------------------
https://raw.githubusercontent.com/projectmesa/mesa-examples/6ba22dc41ebc37c3ef9f69bd2a6a22bfa08cd128/gis/agents_and_networks/src/__init__.py
--------------------------------------------------------------------------------
/gis/agents_and_networks/src/agent/__init__.py:
--------------------------------------------------------------------------------
https://raw.githubusercontent.com/projectmesa/mesa-examples/6ba22dc41ebc37c3ef9f69bd2a6a22bfa08cd128/gis/agents_and_networks/src/agent/__init__.py
--------------------------------------------------------------------------------
/gis/agents_and_networks/src/agent/building.py:
--------------------------------------------------------------------------------
1 | from __future__ import annotations
2 |
3 | import uuid
4 | from random import randrange
5 |
6 | import mesa
7 | import mesa_geo as mg
8 | import pyproj
9 | from shapely.geometry import Polygon
10 |
11 |
12 | class Building(mg.GeoAgent):
13 | unique_id: int # an ID that represents the building
14 | model: mesa.Model
15 | geometry: Polygon
16 | crs: pyproj.CRS
17 | centroid: mesa.space.FloatCoordinate
18 | name: str
19 | function: float # 1.0 for work, 2.0 for home, 0.0 for neither
20 | entrance_pos: mesa.space.FloatCoordinate # nearest vertex on road
21 |
22 | def __init__(self, model, geometry, crs) -> None:
23 | super().__init__(model=model, geometry=geometry, crs=crs)
24 | self.entrance = None
25 | self.name = str(uuid.uuid4())
26 | self.function = randrange(3)
27 |
28 | def __repr__(self) -> str:
29 | return (
30 | f"{self.__class__.__name__}(unique_id={self.unique_id}, name={self.name}, "
31 | f"function={self.function}, centroid={self.centroid})"
32 | )
33 |
34 | def __eq__(self, other):
35 | if isinstance(other, Building):
36 | return self.unique_id == other.unique_id
37 | return False
38 |
39 | def __hash__(self) -> int:
40 | return hash(self.unique_id)
41 |
--------------------------------------------------------------------------------
/gis/agents_and_networks/src/agent/geo_agents.py:
--------------------------------------------------------------------------------
1 | import mesa
2 | import mesa_geo as mg
3 | import pyproj
4 | from shapely.geometry import Point
5 |
6 |
7 | class Driveway(mg.GeoAgent):
8 | unique_id: int
9 | model: mesa.Model
10 | geometry: Point
11 | crs: pyproj.CRS
12 |
13 | def __init__(self, model, geometry, crs) -> None:
14 | super().__init__(model, geometry, crs)
15 |
16 |
17 | class LakeAndRiver(mg.GeoAgent):
18 | unique_id: int
19 | model: mesa.Model
20 | geometry: Point
21 | crs: pyproj.CRS
22 |
23 | def __init__(self, model, geometry, crs) -> None:
24 | super().__init__(model, geometry, crs)
25 |
26 |
27 | class Walkway(mg.GeoAgent):
28 | unique_id: int
29 | model: mesa.Model
30 | geometry: Point
31 | crs: pyproj.CRS
32 |
33 | def __init__(self, model, geometry, crs) -> None:
34 | super().__init__(model, geometry, crs)
35 |
--------------------------------------------------------------------------------
/gis/agents_and_networks/src/logger.py:
--------------------------------------------------------------------------------
1 | import logging
2 |
3 |
4 | def logger(func):
5 | from functools import wraps
6 |
7 | @wraps(func)
8 | def wrapper(*args, **kwargs):
9 | logger = logging.getLogger(func.__name__)
10 | logger.info(f"About to run {func.__name__}")
11 | out = func(*args, **kwargs)
12 | logger.info(f"Done running {func.__name__}")
13 | return out
14 |
15 | return wrapper
16 |
--------------------------------------------------------------------------------
/gis/agents_and_networks/src/model/__init__.py:
--------------------------------------------------------------------------------
https://raw.githubusercontent.com/projectmesa/mesa-examples/6ba22dc41ebc37c3ef9f69bd2a6a22bfa08cd128/gis/agents_and_networks/src/model/__init__.py
--------------------------------------------------------------------------------
/gis/agents_and_networks/src/space/__init__.py:
--------------------------------------------------------------------------------
https://raw.githubusercontent.com/projectmesa/mesa-examples/6ba22dc41ebc37c3ef9f69bd2a6a22bfa08cd128/gis/agents_and_networks/src/space/__init__.py
--------------------------------------------------------------------------------
/gis/agents_and_networks/src/space/campus.py:
--------------------------------------------------------------------------------
1 | import random
2 | from collections import defaultdict
3 | from typing import DefaultDict
4 |
5 | import mesa
6 | import mesa_geo as mg
7 | from shapely.geometry import Point
8 |
9 | from ..agent.building import Building
10 | from ..agent.commuter import Commuter
11 |
12 |
13 | class Campus(mg.GeoSpace):
14 | homes: tuple[Building]
15 | works: tuple[Building]
16 | other_buildings: tuple[Building]
17 | home_counter: DefaultDict[mesa.space.FloatCoordinate, int]
18 | _buildings: dict[int, Building]
19 | _commuters_pos_map: DefaultDict[mesa.space.FloatCoordinate, set[Commuter]]
20 | _commuter_id_map: dict[int, Commuter]
21 |
22 | def __init__(self, crs: str) -> None:
23 | super().__init__(crs=crs)
24 | self.homes = ()
25 | self.works = ()
26 | self.other_buildings = ()
27 | self.home_counter = defaultdict(int)
28 | self._buildings = {}
29 | self._commuters_pos_map = defaultdict(set)
30 | self._commuter_id_map = {}
31 |
32 | def get_random_home(self) -> Building:
33 | return random.choice(self.homes)
34 |
35 | def get_random_work(self) -> Building:
36 | return random.choice(self.works)
37 |
38 | def get_building_by_id(self, unique_id: int) -> Building:
39 | return self._buildings[unique_id]
40 |
41 | def add_buildings(self, agents) -> None:
42 | super().add_agents(agents)
43 | homes, works, other_buildings = [], [], []
44 | for agent in agents:
45 | if isinstance(agent, Building):
46 | self._buildings[agent.unique_id] = agent
47 | if agent.function == 0.0:
48 | other_buildings.append(agent)
49 | elif agent.function == 1.0:
50 | works.append(agent)
51 | elif agent.function == 2.0:
52 | homes.append(agent)
53 | self.other_buildings = self.other_buildings + tuple(other_buildings)
54 | self.works = self.works + tuple(works)
55 | self.homes = self.homes + tuple(homes)
56 |
57 | def get_commuters_by_pos(
58 | self, float_pos: mesa.space.FloatCoordinate
59 | ) -> set[Commuter]:
60 | return self._commuters_pos_map[float_pos]
61 |
62 | def get_commuter_by_id(self, commuter_id: int) -> Commuter:
63 | return self._commuter_id_map[commuter_id]
64 |
65 | def add_commuter(self, agent: Commuter) -> None:
66 | super().add_agents([agent])
67 | self._commuters_pos_map[(agent.geometry.x, agent.geometry.y)].add(agent)
68 | self._commuter_id_map[agent.unique_id] = agent
69 |
70 | def update_home_counter(
71 | self,
72 | old_home_pos: mesa.space.FloatCoordinate | None,
73 | new_home_pos: mesa.space.FloatCoordinate,
74 | ) -> None:
75 | if old_home_pos is not None:
76 | self.home_counter[old_home_pos] -= 1
77 | self.home_counter[new_home_pos] += 1
78 |
79 | def move_commuter(
80 | self, commuter: Commuter, pos: mesa.space.FloatCoordinate
81 | ) -> None:
82 | self.__remove_commuter(commuter)
83 | commuter.geometry = Point(pos)
84 | self.add_commuter(commuter)
85 |
86 | def __remove_commuter(self, commuter: Commuter) -> None:
87 | super().remove_agent(commuter)
88 | del self._commuter_id_map[commuter.unique_id]
89 | self._commuters_pos_map[(commuter.geometry.x, commuter.geometry.y)].remove(
90 | commuter
91 | )
92 |
--------------------------------------------------------------------------------
/gis/agents_and_networks/src/space/road_network.py:
--------------------------------------------------------------------------------
1 | from __future__ import annotations
2 |
3 | import pickle
4 |
5 | import geopandas as gpd
6 | import mesa
7 | import momepy
8 | import networkx as nx
9 | import pyproj
10 | from sklearn.neighbors import KDTree
11 |
12 | from .utils import segmented
13 |
14 |
15 | class RoadNetwork:
16 | _nx_graph: nx.Graph
17 | _kd_tree: KDTree
18 | _crs: pyproj.CRS
19 |
20 | def __init__(self, lines: gpd.GeoSeries):
21 | segmented_lines = gpd.GeoDataFrame(geometry=segmented(lines))
22 | G = momepy.gdf_to_nx(segmented_lines, approach="primal", length="length") # noqa: N806
23 | self.nx_graph = G.subgraph(max(nx.connected_components(G), key=len))
24 | self.crs = lines.crs
25 |
26 | @property
27 | def nx_graph(self) -> nx.Graph:
28 | return self._nx_graph
29 |
30 | @nx_graph.setter
31 | def nx_graph(self, nx_graph) -> None:
32 | self._nx_graph = nx_graph
33 | self._kd_tree = KDTree(nx_graph.nodes)
34 |
35 | @property
36 | def crs(self) -> pyproj.CRS:
37 | return self._crs
38 |
39 | @crs.setter
40 | def crs(self, crs) -> None:
41 | self._crs = crs
42 |
43 | def get_nearest_node(
44 | self, float_pos: mesa.space.FloatCoordinate
45 | ) -> mesa.space.FloatCoordinate:
46 | node_index = self._kd_tree.query([float_pos], k=1, return_distance=False)
47 | node_pos = self._kd_tree.get_arrays()[0][node_index[0, 0]]
48 | return tuple(node_pos)
49 |
50 | def get_shortest_path(
51 | self, source: mesa.space.FloatCoordinate, target: mesa.space.FloatCoordinate
52 | ) -> list[mesa.space.FloatCoordinate]:
53 | from_node_pos = self.get_nearest_node(source)
54 | to_node_pos = self.get_nearest_node(target)
55 | # return nx.shortest_path(self.nx_graph, from_node_pos,
56 | # to_node_pos, method="dijkstra", weight="length")
57 | return nx.astar_path(self.nx_graph, from_node_pos, to_node_pos, weight="length")
58 |
59 |
60 | class CampusWalkway(RoadNetwork):
61 | campus: str
62 | _path_select_cache: dict[
63 | tuple[mesa.space.FloatCoordinate, mesa.space.FloatCoordinate],
64 | list[mesa.space.FloatCoordinate],
65 | ]
66 |
67 | def __init__(self, campus, lines, output_dir) -> None:
68 | super().__init__(lines)
69 | self.campus = campus
70 | self._path_cache_result = f"{output_dir}/{campus}_path_cache_result.pkl"
71 | try:
72 | with open(self._path_cache_result, "rb") as cached_result:
73 | self._path_select_cache = pickle.load(cached_result) # noqa: S301
74 | except FileNotFoundError:
75 | self._path_select_cache = {}
76 |
77 | def cache_path(
78 | self,
79 | source: mesa.space.FloatCoordinate,
80 | target: mesa.space.FloatCoordinate,
81 | path: list[mesa.space.FloatCoordinate],
82 | ) -> None:
83 | # print(f"caching path... current number of cached paths:
84 | # {len(self._path_select_cache)}")
85 | self._path_select_cache[(source, target)] = path
86 | self._path_select_cache[(target, source)] = list(reversed(path))
87 | with open(self._path_cache_result, "wb") as cached_result:
88 | pickle.dump(self._path_select_cache, cached_result)
89 |
90 | def get_cached_path(
91 | self, source: mesa.space.FloatCoordinate, target: mesa.space.FloatCoordinate
92 | ) -> list[mesa.space.FloatCoordinate] | None:
93 | return self._path_select_cache.get((source, target), None)
94 |
--------------------------------------------------------------------------------
/gis/agents_and_networks/src/space/utils.py:
--------------------------------------------------------------------------------
1 | import geopandas as gpd
2 | import mesa
3 | import numpy as np
4 | import pyproj
5 | from shapely.geometry import LineString, MultiLineString
6 | from shapely.ops import transform
7 |
8 |
9 | def get_coord_matrix(
10 | x_min: float, x_max: float, y_min: float, y_max: float
11 | ) -> np.ndarray:
12 | return np.array(
13 | [
14 | [x_min, y_min, 1.0],
15 | [x_min, y_max, 1.0],
16 | [x_max, y_min, 1.0],
17 | [x_max, y_max, 1.0],
18 | ]
19 | )
20 |
21 |
22 | def get_affine_transform(
23 | from_coord: np.ndarray, to_coord: np.ndarray
24 | ) -> tuple[float, float, float, float, float, float]:
25 | A, res, rank, s = np.linalg.lstsq(from_coord, to_coord, rcond=None) # noqa: N806
26 |
27 | np.testing.assert_array_almost_equal(res, np.zeros_like(res), decimal=15)
28 | np.testing.assert_array_almost_equal(A[:, 2], np.array([0.0, 0.0, 1.0]), decimal=15)
29 |
30 | # A.T = [[a, b, x_off],
31 | # [d, e, y_off],
32 | # [0, 0, 1 ]]
33 | # affine transform = [a, b, d, e, x_off, y_off]
34 | # For details, refer to https://geopandas.org/en/stable/docs/reference/api/geopandas.GeoSeries.affine_transform.html
35 | return A.T[0, 0], A.T[0, 1], A.T[1, 0], A.T[1, 1], A.T[0, 2], A.T[1, 2]
36 |
37 |
38 | def get_rounded_coordinate(
39 | float_coordinate: mesa.space.FloatCoordinate,
40 | ) -> mesa.space.Coordinate:
41 | return round(float_coordinate[0]), round(float_coordinate[1])
42 |
43 |
44 | def segmented(lines: gpd.GeoSeries) -> gpd.GeoSeries:
45 | def _segmented(linestring: LineString) -> list[LineString]:
46 | return [
47 | LineString((start_node, end_node))
48 | for start_node, end_node in zip(
49 | linestring.coords[:-1], linestring.coords[1:]
50 | )
51 | if start_node != end_node
52 | ]
53 |
54 | return gpd.GeoSeries([segment for line in lines for segment in _segmented(line)])
55 |
56 |
57 | # reference: https://gis.stackexchange.com/questions/367228/using-shapely-interpolate-to-evenly-re-sample-points-on-a-linestring-geodatafram
58 | def redistribute_vertices(geom, distance):
59 | if isinstance(geom, LineString):
60 | if (num_vert := round(geom.length / distance)) == 0:
61 | num_vert = 1
62 | return LineString(
63 | [
64 | geom.interpolate(float(n) / num_vert, normalized=True)
65 | for n in range(num_vert + 1)
66 | ]
67 | )
68 | elif isinstance(geom, MultiLineString):
69 | parts = [redistribute_vertices(part, distance) for part in geom]
70 | return type(geom)([p for p in parts if not p.is_empty])
71 | else:
72 | raise TypeError(
73 | f"Wrong type: {type(geom)}. Must be LineString or MultiLineString."
74 | )
75 |
76 |
77 | class UnitTransformer:
78 | _degree2meter: pyproj.Transformer
79 | _meter2degree: pyproj.Transformer
80 |
81 | def __init__(self, degree_crs: pyproj.CRS | None, meter_crs: pyproj.CRS | None):
82 | if degree_crs is None:
83 | degree_crs = pyproj.CRS("EPSG:4326")
84 |
85 | if meter_crs is None:
86 | meter_crs = pyproj.CRS("EPSG:3857")
87 |
88 | self._degree2meter = pyproj.Transformer.from_crs(
89 | degree_crs, meter_crs, always_xy=True
90 | )
91 | self._meter2degree = pyproj.Transformer.from_crs(
92 | meter_crs, degree_crs, always_xy=True
93 | )
94 |
95 | def degree2meter(self, geom):
96 | return transform(self._degree2meter.transform, geom)
97 |
98 | def meter2degree(self, geom):
99 | return transform(self._meter2degree.transform, geom)
100 |
--------------------------------------------------------------------------------
/gis/agents_and_networks/src/visualization/__init__.py:
--------------------------------------------------------------------------------
https://raw.githubusercontent.com/projectmesa/mesa-examples/6ba22dc41ebc37c3ef9f69bd2a6a22bfa08cd128/gis/agents_and_networks/src/visualization/__init__.py
--------------------------------------------------------------------------------
/gis/agents_and_networks/src/visualization/utils.py:
--------------------------------------------------------------------------------
1 | import datetime
2 |
3 | import matplotlib.pyplot as plt
4 | import pandas as pd
5 | import seaborn as sns
6 | import solara
7 |
8 | from ..agent.building import Building
9 | from ..agent.commuter import Commuter
10 | from ..agent.geo_agents import Driveway, LakeAndRiver, Walkway
11 |
12 |
13 | def make_plot_clock(model):
14 | return solara.Markdown(f"**Day {model.day}, {model.hour:02d}:{model.minute:02d}**")
15 |
16 |
17 | def agent_draw(agent):
18 | portrayal = {}
19 | portrayal["color"] = "White"
20 | if isinstance(agent, Driveway):
21 | portrayal["color"] = "#D08004"
22 | elif isinstance(agent, Walkway):
23 | portrayal["color"] = "Brown"
24 | elif isinstance(agent, LakeAndRiver):
25 | portrayal["color"] = "#04D0CD"
26 | elif isinstance(agent, Building):
27 | portrayal["color"] = "Grey"
28 | # if agent.function is None:
29 | # portrayal["color"] = "Grey"
30 | # elif agent.function == 1.0:
31 | # portrayal["color"] = "Blue"
32 | # elif agent.function == 2.0:
33 | # portrayal["color"] = "Green"
34 | # else:
35 | # portrayal["color"] = "Grey"
36 | elif isinstance(agent, Commuter):
37 | if agent.status == "home":
38 | portrayal["color"] = "Green"
39 | elif agent.status == "work":
40 | portrayal["color"] = "Blue"
41 | elif agent.status == "transport":
42 | portrayal["color"] = "Red"
43 | else:
44 | portrayal["color"] = "Grey"
45 | portrayal["radius"] = "5"
46 | portrayal["fillOpacity"] = 1
47 | return portrayal
48 |
49 |
50 | def plot_commuter_status_count(model_vars_df: pd.DataFrame) -> None:
51 | commuter_status_df = model_vars_df.rename(
52 | columns=lambda x: x.replace("status_", "")
53 | )
54 | commuter_status_df["time"] = commuter_status_df["time"] / pd.Timedelta(minutes=1)
55 | commuter_status_df = commuter_status_df.melt(
56 | id_vars=["time"],
57 | value_vars=["home", "traveling", "work"],
58 | var_name="status",
59 | value_name="count",
60 | )
61 | sns.relplot(
62 | x="time",
63 | y="count",
64 | data=commuter_status_df,
65 | kind="line",
66 | hue="status",
67 | aspect=1.5,
68 | )
69 | plt.gca().xaxis.set_major_formatter(
70 | lambda x, pos: ":".join(str(datetime.timedelta(minutes=x)).split(":")[:2])
71 | )
72 | plt.xticks(rotation=90)
73 | plt.title("Number of commuters by status")
74 |
75 |
76 | def plot_num_friendships(model_vars_df: pd.DataFrame) -> None:
77 | friendship_df = model_vars_df.rename(columns=lambda x: x.replace("friendship_", ""))
78 | friendship_df["time"] = friendship_df["time"] / pd.Timedelta(minutes=1)
79 | friendship_df = friendship_df.melt(
80 | id_vars=["time"],
81 | value_vars=["home", "work"],
82 | var_name="friendship",
83 | value_name="count",
84 | )
85 | sns.relplot(
86 | x="time",
87 | y="count",
88 | data=friendship_df,
89 | kind="line",
90 | hue="friendship",
91 | aspect=1.5,
92 | )
93 | plt.gca().xaxis.set_major_formatter(
94 | lambda x, pos: ":".join(str(datetime.timedelta(minutes=x)).split(":")[:2])
95 | )
96 | plt.xticks(rotation=90)
97 | plt.title("Number of friendships")
98 |
--------------------------------------------------------------------------------
/gis/geo_schelling/README.md:
--------------------------------------------------------------------------------
1 | # GeoSchelling Model (Polygons)
2 |
3 | [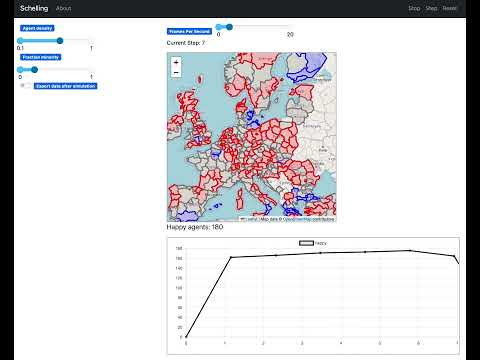](https://www.youtube.com/watch?v=ZnBk_eSw0_M)
4 |
5 | ## Summary
6 |
7 | This is a geoversion of a simplified Schelling example. For the original implementation details please see the Mesa Schelling examples.
8 |
9 | ### GeoSpace
10 |
11 | Instead of an abstract grid space, we represent the space using NUTS-2 regions to create the GeoSpace in the model.
12 |
13 | ### GeoAgent
14 |
15 | NUTS-2 regions are the GeoAgents. The neighbors of a polygon are considered those polygons that touch its border (i.e., edge neighbours). During the running of the model, a polygon queries the colors of the surrounding polygon and if the ratio falls below a certain threshold (e.g., 40% of the same color), the agent moves to an uncolored polygon.
16 |
17 | ## How to Run
18 |
19 | To run the model interactively, run `solara run app.py` in this directory. e.g.
20 |
21 | ```bash
22 | solara run app.py
23 | ```
24 |
25 | Then open your browser to [http://127.0.0.1:8765/](http://127.0.0.1:8765/) and press the play button `▶`.
26 |
--------------------------------------------------------------------------------
/gis/geo_schelling/app.py:
--------------------------------------------------------------------------------
1 | import solara
2 | from mesa.visualization import Slider, SolaraViz, make_plot_component
3 | from mesa_geo.visualization import make_geospace_component
4 | from model import GeoSchelling
5 |
6 |
7 | def make_plot_happiness(model):
8 | return solara.Markdown(f"**Happy agents: {model.happy}**")
9 |
10 |
11 | model_params = {
12 | "density": Slider("Agent density", 0.6, 0.1, 1.0, 0.1),
13 | "minority_pc": Slider("Fraction minority", 0.2, 0.00, 1.0, 0.05),
14 | "export_data": False,
15 | }
16 |
17 |
18 | def schelling_draw(agent):
19 | """Portrayal Method for canvas"""
20 | portrayal = {}
21 | if agent.atype is None:
22 | portrayal["color"] = "Grey"
23 | elif agent.atype == 0:
24 | portrayal["color"] = "Red"
25 | else:
26 | portrayal["color"] = "Blue"
27 | return portrayal
28 |
29 |
30 | model = GeoSchelling()
31 | page = SolaraViz(
32 | model,
33 | [
34 | make_geospace_component(schelling_draw, zoom=4),
35 | make_plot_component(["happy"]),
36 | make_plot_happiness,
37 | ],
38 | model_params=model_params,
39 | name="GeoSchelling",
40 | )
41 |
42 | page # noqa
43 |
--------------------------------------------------------------------------------
/gis/geo_schelling/requirements.txt:
--------------------------------------------------------------------------------
1 | mesa-geo~=0.9.0
2 |
--------------------------------------------------------------------------------
/gis/geo_schelling_points/README.md:
--------------------------------------------------------------------------------
1 | # GeoSchelling Model (Points & Polygons)
2 |
3 | [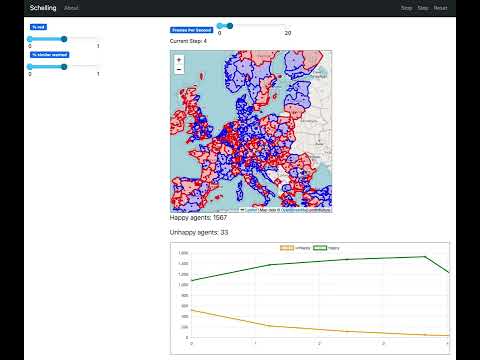](https://www.youtube.com/watch?v=iLMU6jfmir8)
4 |
5 | ## Summary
6 |
7 | This is a geoversion of a simplified Schelling example.
8 |
9 | ### GeoSpace
10 |
11 | The NUTS-2 regions are considered as a shared definition of neighborhood among all people agents, instead of a locally defined neighborhood such as Moore or von Neumann.
12 |
13 | ### GeoAgent
14 |
15 | There are two types of GeoAgents: people and regions. Each person resides in a randomly assigned region, and checks the color ratio of its region against a pre-defined "happiness" threshold at every time step. If the ratio falls below a certain threshold (e.g., 40%), the agent is found to be "unhappy", and randomly moves to another region. People are represented as points, with locations randomly chosen within their regions. The color of a region depends on the color of the majority population it contains (i.e., point in polygon calculations).
16 |
17 | ## How to Run
18 |
19 | To run the model interactively, run `solara run app.py` in this directory. e.g.
20 |
21 | ```bash
22 | solara run app.py
23 | ```
24 |
25 | Then open your browser to [http://127.0.0.1:8765/](http://127.0.0.1:8765/) and press the play button `▶`.
26 |
--------------------------------------------------------------------------------
/gis/geo_schelling_points/app.py:
--------------------------------------------------------------------------------
1 | import solara
2 | from geo_schelling_points.agents import PersonAgent, RegionAgent
3 | from geo_schelling_points.model import GeoSchellingPoints
4 | from mesa.visualization import Slider, SolaraViz, make_plot_component
5 | from mesa_geo.visualization import make_geospace_component
6 |
7 |
8 | def make_plot_happiness(model):
9 | return solara.Markdown(f"**Happy agents: {model.happy}**")
10 |
11 |
12 | model_params = {
13 | "red_percentage": Slider("% red", 0.5, 0.00, 1.0, 0.05),
14 | "similarity_threshold": Slider("% similar wanted", 0.5, 0.00, 1.0, 0.05),
15 | }
16 |
17 |
18 | def schelling_draw(agent):
19 | portrayal = {}
20 | if isinstance(agent, RegionAgent):
21 | if agent.red_cnt > agent.blue_cnt:
22 | portrayal["color"] = "Red"
23 | elif agent.red_cnt < agent.blue_cnt:
24 | portrayal["color"] = "Blue"
25 | else:
26 | portrayal["color"] = "Grey"
27 | elif isinstance(agent, PersonAgent):
28 | portrayal["radius"] = 1
29 | portrayal["shape"] = "circle"
30 | portrayal["color"] = "Red" if agent.is_red else "Blue"
31 | return portrayal
32 |
33 |
34 | model = GeoSchellingPoints()
35 | page = SolaraViz(
36 | model,
37 | [
38 | make_geospace_component(schelling_draw, zoom=4),
39 | make_plot_component(["happy", "unhappy"]),
40 | make_plot_happiness,
41 | ],
42 | model_params=model_params,
43 | name="GeoSchellingPoints",
44 | )
45 |
46 | page # noqa
47 |
--------------------------------------------------------------------------------
/gis/geo_schelling_points/geo_schelling_points/__init__.py:
--------------------------------------------------------------------------------
https://raw.githubusercontent.com/projectmesa/mesa-examples/6ba22dc41ebc37c3ef9f69bd2a6a22bfa08cd128/gis/geo_schelling_points/geo_schelling_points/__init__.py
--------------------------------------------------------------------------------
/gis/geo_schelling_points/geo_schelling_points/agents.py:
--------------------------------------------------------------------------------
1 | import random
2 |
3 | import mesa_geo as mg
4 | from shapely.geometry import Point
5 |
6 |
7 | class PersonAgent(mg.GeoAgent):
8 | SIMILARITY_THRESHOLD = 0.3
9 |
10 | def __init__(self, model, geometry, crs, is_red, region_id):
11 | super().__init__(model, geometry, crs)
12 | self.is_red = is_red
13 | self.region_id = region_id
14 |
15 | @property
16 | def is_unhappy(self):
17 | if self.is_red:
18 | return (
19 | self.model.space.get_region_by_id(self.region_id).red_pct
20 | < self.SIMILARITY_THRESHOLD
21 | )
22 | else:
23 | return (
24 | 1 - self.model.space.get_region_by_id(self.region_id).red_pct
25 | ) < self.SIMILARITY_THRESHOLD
26 |
27 | def step(self):
28 | if self.is_unhappy:
29 | random_region_id = self.model.space.get_random_region_id()
30 | self.model.space.remove_person_from_region(self)
31 | self.model.space.add_person_to_region(self, region_id=random_region_id)
32 |
33 |
34 | class RegionAgent(mg.GeoAgent):
35 | init_num_people: int
36 | red_cnt: int
37 | blue_cnt: int
38 |
39 | def __init__(self, model, geometry, crs, init_num_people=5):
40 | super().__init__(model, geometry, crs)
41 | self.init_num_people = init_num_people
42 | self.red_cnt = 0
43 | self.blue_cnt = 0
44 |
45 | @property
46 | def red_pct(self):
47 | if self.red_cnt == 0:
48 | return 0
49 | elif self.blue_cnt == 0:
50 | return 1
51 | else:
52 | return self.red_cnt / (self.red_cnt + self.blue_cnt)
53 |
54 | def random_point(self):
55 | min_x, min_y, max_x, max_y = self.geometry.bounds
56 | while not self.geometry.contains(
57 | random_point := Point(
58 | random.uniform(min_x, max_x), random.uniform(min_y, max_y)
59 | )
60 | ):
61 | continue
62 | return random_point
63 |
64 | def add_person(self, person):
65 | if person.is_red:
66 | self.red_cnt += 1
67 | else:
68 | self.blue_cnt += 1
69 |
70 | def remove_person(self, person):
71 | if person.is_red:
72 | self.red_cnt -= 1
73 | else:
74 | self.blue_cnt -= 1
75 |
--------------------------------------------------------------------------------
/gis/geo_schelling_points/geo_schelling_points/model.py:
--------------------------------------------------------------------------------
1 | import random
2 | from pathlib import Path
3 |
4 | import geopandas as gpd
5 | import libpysal
6 | import mesa
7 | import mesa_geo as mg
8 |
9 | from .agents import PersonAgent, RegionAgent
10 | from .space import Nuts2Eu
11 |
12 | script_directory = Path(__file__).resolve().parent
13 |
14 |
15 | def get_largest_connected_components(gdf):
16 | """Get the largest connected component of a GeoDataFrame."""
17 | # create spatial weights matrix
18 | w = libpysal.weights.Queen.from_dataframe(
19 | gdf, use_index=True, silence_warnings=True
20 | )
21 | # get component labels
22 | gdf["component"] = w.component_labels
23 | # get the largest component
24 | largest_component = gdf["component"].value_counts().idxmax()
25 | # subset the GeoDataFrame
26 | gdf = gdf[gdf["component"] == largest_component]
27 | return gdf
28 |
29 |
30 | class GeoSchellingPoints(mesa.Model):
31 | def __init__(self, red_percentage=0.5, similarity_threshold=0.5):
32 | super().__init__()
33 |
34 | self.red_percentage = red_percentage
35 | PersonAgent.SIMILARITY_THRESHOLD = similarity_threshold
36 |
37 | self.space = Nuts2Eu()
38 |
39 | self.datacollector = mesa.DataCollector(
40 | {"unhappy": "unhappy", "happy": "happy"}
41 | )
42 |
43 | # Set up the grid with patches for every NUTS region
44 | ac = mg.AgentCreator(RegionAgent, model=self)
45 | data_path = script_directory / "../data/nuts_rg_60M_2013_lvl_2.geojson"
46 | regions_gdf = gpd.read_file(data_path)
47 | regions_gdf = get_largest_connected_components(regions_gdf)
48 | regions = ac.from_GeoDataFrame(regions_gdf)
49 | self.space.add_regions(regions)
50 |
51 | for region in regions:
52 | for _ in range(region.init_num_people):
53 | person = PersonAgent(
54 | model=self,
55 | crs=self.space.crs,
56 | geometry=region.random_point(),
57 | is_red=random.random() < self.red_percentage,
58 | region_id=region.unique_id,
59 | )
60 | self.space.add_person_to_region(person, region_id=region.unique_id)
61 |
62 | self.datacollector.collect(self)
63 |
64 | @property
65 | def unhappy(self):
66 | num_unhappy = 0
67 | for agent in self.space.agents:
68 | if isinstance(agent, PersonAgent) and agent.is_unhappy:
69 | num_unhappy += 1
70 | return num_unhappy
71 |
72 | @property
73 | def happy(self):
74 | return self.space.num_people - self.unhappy
75 |
76 | def step(self):
77 | self.agents.shuffle_do("step")
78 | self.datacollector.collect(self)
79 |
80 | if not self.unhappy:
81 | self.running = False
82 |
--------------------------------------------------------------------------------
/gis/geo_schelling_points/geo_schelling_points/space.py:
--------------------------------------------------------------------------------
1 | import random
2 |
3 | import mesa_geo as mg
4 |
5 | from .agents import RegionAgent
6 |
7 |
8 | class Nuts2Eu(mg.GeoSpace):
9 | _id_region_map: dict[str, RegionAgent]
10 | num_people: int
11 |
12 | def __init__(self):
13 | super().__init__(warn_crs_conversion=False)
14 | self._id_region_map = {}
15 | self.num_people = 0
16 |
17 | def add_regions(self, agents):
18 | super().add_agents(agents)
19 | total_area = 0
20 | for agent in agents:
21 | self._id_region_map[agent.unique_id] = agent
22 | total_area += agent.SHAPE_AREA
23 | for _, agent in self._id_region_map.items():
24 | agent.SHAPE_AREA = agent.SHAPE_AREA / total_area * 100.0
25 |
26 | def add_person_to_region(self, person, region_id):
27 | person.region_id = region_id
28 | person.geometry = self._id_region_map[region_id].random_point()
29 | self._id_region_map[region_id].add_person(person)
30 | super().add_agents(person)
31 | self.num_people += 1
32 |
33 | def remove_person_from_region(self, person):
34 | self._id_region_map[person.region_id].remove_person(person)
35 | person.region_id = None
36 | super().remove_agent(person)
37 | self.num_people -= 1
38 |
39 | def get_random_region_id(self) -> str:
40 | return random.choice(list(self._id_region_map.keys()))
41 |
42 | def get_region_by_id(self, region_id) -> RegionAgent:
43 | return self._id_region_map.get(region_id)
44 |
--------------------------------------------------------------------------------
/gis/geo_schelling_points/requirements.txt:
--------------------------------------------------------------------------------
1 | mesa-geo~=0.9.0
2 |
--------------------------------------------------------------------------------
/gis/geo_sir/README.md:
--------------------------------------------------------------------------------
1 | # GeoSIR Epidemics Model
2 |
3 | [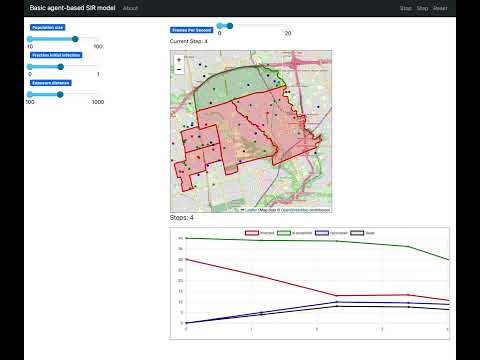](https://www.youtube.com/watch?v=oZShtptaIg4)
4 |
5 | ## Summary
6 |
7 | This is a geoversion of a simple agent-based pandemic SIR model, as an example to show the capabilities of mesa-geo.
8 |
9 | It uses geographical data of Toronto's regions on top of a an Leaflet map to show the location of agents (in a continuous space).
10 |
11 | Person agents are initially located in random positions in the city, then start moving around unless they die.
12 | A fraction of agents start with an infection and may recover or die in each step.
13 | Susceptible agents (those who have never been infected) who come in proximity with an infected agent may become infected.
14 |
15 | Neighbourhood agents represent neighbourhoods in the Toronto, and become hot-spots (colored red) if there are infected agents inside them.
16 | Data obtained from [this link](http://adamw523.com/toronto-geojson/).
17 |
18 | ## How to Run
19 |
20 | To run the model interactively, run `solara run app.py` in this directory. e.g.
21 |
22 | ```bash
23 | solara run app.py
24 | ```
25 |
26 | Then open your browser to [http://127.0.0.1:8765/](http://127.0.0.1:8765/) and press the play button `▶`.
27 |
--------------------------------------------------------------------------------
/gis/geo_sir/app.py:
--------------------------------------------------------------------------------
1 | from geo_sir.agents import PersonAgent
2 | from geo_sir.model import GeoSir
3 | from mesa.visualization import Slider, SolaraViz, make_plot_component
4 | from mesa_geo.visualization import make_geospace_component
5 |
6 | model_params = {
7 | "pop_size": Slider("Population size", 30, 10, 100, 10),
8 | "init_infected": Slider("Fraction initial infection", 0.2, 0.00, 1.0, 0.05),
9 | "exposure_distance": Slider("Exposure distance", 500, 100, 1000, 100),
10 | }
11 |
12 |
13 | def infected_draw(agent):
14 | """Portrayal Method for canvas"""
15 | portrayal = {}
16 | if isinstance(agent, PersonAgent):
17 | portrayal["radius"] = "2"
18 | if agent.atype in ["hotspot", "infected"]:
19 | portrayal["color"] = "Red"
20 | elif agent.atype in ["safe", "susceptible"]:
21 | portrayal["color"] = "Green"
22 | elif agent.atype in ["recovered"]:
23 | portrayal["color"] = "Blue"
24 | elif agent.atype in ["dead"]:
25 | portrayal["color"] = "Black"
26 | return portrayal
27 |
28 |
29 | model = GeoSir()
30 | page = SolaraViz(
31 | model,
32 | [
33 | make_geospace_component(infected_draw, zoom=12),
34 | make_plot_component(["infected", "susceptible", "recovered", "dead"]),
35 | ],
36 | name="Basic agent-based SIR model",
37 | model_params=model_params,
38 | )
39 |
40 | page # noqa
41 |
--------------------------------------------------------------------------------
/gis/geo_sir/geo_sir/__init__.py:
--------------------------------------------------------------------------------
https://raw.githubusercontent.com/projectmesa/mesa-examples/6ba22dc41ebc37c3ef9f69bd2a6a22bfa08cd128/gis/geo_sir/geo_sir/__init__.py
--------------------------------------------------------------------------------
/gis/geo_sir/requirements.txt:
--------------------------------------------------------------------------------
1 | mesa-geo~=0.9.0
2 |
--------------------------------------------------------------------------------
/gis/population/README.md:
--------------------------------------------------------------------------------
1 | # Population Model
2 |
3 | [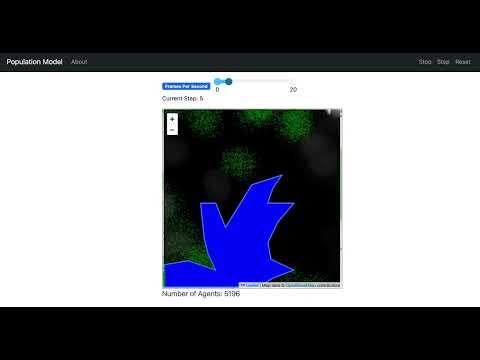](https://www.youtube.com/watch?v=0k8tsYPVwQs)
4 |
5 | ## Summary
6 |
7 | This is an implementation of the [Uganda Example](https://github.com/abmgis/abmgis/tree/master/Chapter05-GIS/Models/UgandaExample) in Python, using [Mesa](https://github.com/projectmesa/mesa) and [Mesa-Geo](https://github.com/projectmesa/mesa-geo).
8 |
9 | ### GeoSpace
10 |
11 | The GeoSpace consists of both a raster and a vector layer. The raster layer contains population data for each cell, and it is this data that is used for model initialisation, in the sense creating the agents. The vector layer shown in blue color represents a lake in Uganda. It overlays with the raster layer to mask out the cells that agents cannot move into.
12 |
13 | ### GeoAgent
14 |
15 | The GeoAgents are people, created based on the population data. As this is a simple example model, the agents only move randomly to neighboring cells at each time step. To make the simulation more realistic and visually appealing, the agents in the same cell have a randomized position within the cell, so that they don’t stand on top of each other at exactly the same coordinate.
16 |
17 | ## How to Run
18 |
19 | To run the model interactively, run `solara run app.py` in this directory. e.g.
20 |
21 | ```bash
22 | solara run app.py
23 | ```
24 |
25 | Then open your browser to [http://127.0.0.1:8765/](http://127.0.0.1:8765/) and press the play button `▶`.
26 |
27 | ## License
28 |
29 | The data is from the [Uganda Example](https://github.com/abmgis/abmgis/tree/master/Chapter05-GIS/Models/UgandaExample) and is licensed under the [Creative Commons Attribution-ShareAlike 4.0 International License](https://creativecommons.org/licenses/by-sa/4.0/).
30 |
--------------------------------------------------------------------------------
/gis/population/app.py:
--------------------------------------------------------------------------------
1 | import mesa_geo as mg
2 | import solara
3 | from mesa.visualization import SolaraViz
4 | from mesa_geo.visualization import make_geospace_component
5 | from population.model import Population
6 | from population.space import UgandaCell
7 | from shapely.geometry import Point, Polygon
8 |
9 |
10 | def make_plot_num_agents(model):
11 | return solara.Markdown(f"**Number of Agents: {len(model.space.agents)}**")
12 |
13 |
14 | def agent_portrayal(agent):
15 | if isinstance(agent, mg.GeoAgent):
16 | if isinstance(agent.geometry, Point):
17 | return {
18 | "stroke": False,
19 | "color": "Green",
20 | "radius": 2,
21 | "fillOpacity": 0.3,
22 | }
23 | elif isinstance(agent.geometry, Polygon):
24 | return {
25 | "fillColor": "Blue",
26 | "fillOpacity": 1.0,
27 | }
28 | elif isinstance(agent, UgandaCell):
29 | return (agent.population, agent.population, agent.population, 1)
30 |
31 |
32 | model = Population()
33 | page = SolaraViz(
34 | model,
35 | [
36 | make_geospace_component(agent_portrayal),
37 | make_plot_num_agents,
38 | ],
39 | name="Population Model",
40 | )
41 |
42 | page # noqa
43 |
--------------------------------------------------------------------------------
/gis/population/data/clip.zip:
--------------------------------------------------------------------------------
https://raw.githubusercontent.com/projectmesa/mesa-examples/6ba22dc41ebc37c3ef9f69bd2a6a22bfa08cd128/gis/population/data/clip.zip
--------------------------------------------------------------------------------
/gis/population/data/lake.zip:
--------------------------------------------------------------------------------
https://raw.githubusercontent.com/projectmesa/mesa-examples/6ba22dc41ebc37c3ef9f69bd2a6a22bfa08cd128/gis/population/data/lake.zip
--------------------------------------------------------------------------------
/gis/population/data/popu.asc.gz:
--------------------------------------------------------------------------------
https://raw.githubusercontent.com/projectmesa/mesa-examples/6ba22dc41ebc37c3ef9f69bd2a6a22bfa08cd128/gis/population/data/popu.asc.gz
--------------------------------------------------------------------------------
/gis/population/population/__init__.py:
--------------------------------------------------------------------------------
https://raw.githubusercontent.com/projectmesa/mesa-examples/6ba22dc41ebc37c3ef9f69bd2a6a22bfa08cd128/gis/population/population/__init__.py
--------------------------------------------------------------------------------
/gis/population/population/model.py:
--------------------------------------------------------------------------------
1 | import math
2 | import random
3 | from pathlib import Path
4 |
5 | import mesa
6 | import mesa_geo as mg
7 | import numpy as np
8 | from shapely.geometry import Point
9 |
10 | from .space import UgandaArea
11 |
12 | script_directory = Path(__file__).resolve().parent
13 |
14 |
15 | class Person(mg.GeoAgent):
16 | MOBILITY_RANGE_X = 0.0
17 | MOBILITY_RANGE_Y = 0.0
18 |
19 | def __init__(self, model, geometry, crs, img_coord):
20 | super().__init__(model, geometry, crs)
21 | self.img_coord = img_coord
22 |
23 | def set_random_world_coord(self):
24 | world_coord_point = Point(
25 | self.model.space.population_layer.transform * self.img_coord
26 | )
27 | random_world_coord_x = world_coord_point.x + np.random.uniform(
28 | -self.MOBILITY_RANGE_X, self.MOBILITY_RANGE_X
29 | )
30 | random_world_coord_y = world_coord_point.y + np.random.uniform(
31 | -self.MOBILITY_RANGE_Y, self.MOBILITY_RANGE_Y
32 | )
33 | self.geometry = Point(random_world_coord_x, random_world_coord_y)
34 |
35 | def step(self):
36 | neighborhood = self.model.space.population_layer.get_neighborhood(
37 | self.img_coord, moore=True
38 | )
39 | found = False
40 | while neighborhood and not found:
41 | next_img_coord = random.choice(neighborhood)
42 | world_coord_point = Point(
43 | self.model.space.population_layer.transform * next_img_coord
44 | )
45 | if world_coord_point.within(self.model.space.lake):
46 | neighborhood.remove(next_img_coord)
47 | continue
48 | else:
49 | found = True
50 | self.img_coord = next_img_coord
51 | self.set_random_world_coord()
52 |
53 |
54 | class Population(mesa.Model):
55 | def __init__(
56 | self,
57 | population_gzip_file="../data/popu.asc.gz",
58 | lake_zip_file="../data/lake.zip",
59 | world_zip_file="../data/clip.zip",
60 | ):
61 | super().__init__()
62 | self.space = UgandaArea(crs="epsg:4326")
63 | self.space.load_data(
64 | script_directory / population_gzip_file,
65 | script_directory / lake_zip_file,
66 | script_directory / world_zip_file,
67 | model=self,
68 | )
69 | pixel_size_x, pixel_size_y = self.space.population_layer.resolution
70 | Person.MOBILITY_RANGE_X = pixel_size_x / 2.0
71 | Person.MOBILITY_RANGE_Y = pixel_size_y / 2.0
72 |
73 | self._create_agents()
74 |
75 | def _create_agents(self):
76 | num_agents = 0
77 | for cell in self.space.population_layer:
78 | popu_round = math.ceil(cell.population)
79 | if popu_round > 0:
80 | for _ in range(popu_round):
81 | num_agents += 1
82 | point = Point(self.space.population_layer.transform * cell.indices)
83 | if not point.within(self.space.lake):
84 | person = Person(
85 | model=self,
86 | crs=self.space.crs,
87 | geometry=point,
88 | img_coord=cell.indices,
89 | )
90 | person.set_random_world_coord()
91 | self.space.add_agents(person)
92 |
93 | def step(self):
94 | self.agents.shuffle_do("step")
95 |
--------------------------------------------------------------------------------
/gis/population/population/space.py:
--------------------------------------------------------------------------------
1 | from __future__ import annotations
2 |
3 | import gzip
4 |
5 | import geopandas as gpd
6 | import mesa
7 | from mesa_geo.geoagent import GeoAgent
8 | from mesa_geo.geospace import GeoSpace
9 | from mesa_geo.raster_layers import Cell, RasterLayer
10 |
11 |
12 | class UgandaCell(Cell):
13 | population: float | None
14 |
15 | def __init__(
16 | self,
17 | model,
18 | pos: mesa.space.Coordinate | None = None,
19 | indices: mesa.space.Coordinate | None = None,
20 | ):
21 | super().__init__(model, pos, indices)
22 | self.population = None
23 |
24 | def step(self):
25 | pass
26 |
27 |
28 | class Lake(GeoAgent):
29 | pass
30 |
31 |
32 | class UgandaArea(GeoSpace):
33 | def __init__(self, crs):
34 | super().__init__(crs=crs)
35 |
36 | def load_data(self, population_gzip_file, lake_zip_file, world_zip_file, model):
37 | world_size = gpd.GeoDataFrame.from_file(world_zip_file)
38 | raster_layer = RasterLayer.from_file(
39 | population_gzip_file,
40 | model=model,
41 | cell_cls=UgandaCell,
42 | attr_name="population",
43 | rio_opener=gzip.open,
44 | )
45 | raster_layer.crs = world_size.crs
46 | raster_layer.total_bounds = world_size.total_bounds
47 | self.add_layer(raster_layer)
48 | self.lake = gpd.GeoDataFrame.from_file(lake_zip_file).geometry[0]
49 | self.add_agents(GeoAgent(model, self.lake, self.crs))
50 |
51 | @property
52 | def population_layer(self):
53 | return self.layers[0]
54 |
--------------------------------------------------------------------------------
/gis/population/requirements.txt:
--------------------------------------------------------------------------------
1 | mesa-geo~=0.9.0
2 |
--------------------------------------------------------------------------------
/gis/rainfall/README.md:
--------------------------------------------------------------------------------
1 | # Rainfall Model
2 |
3 | [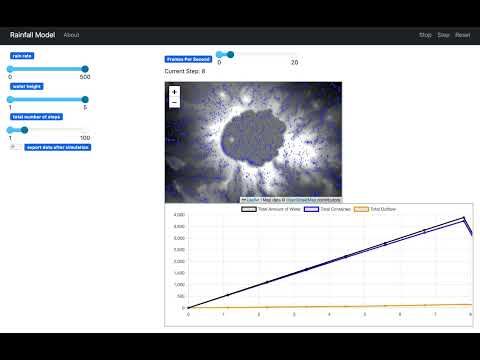](https://www.youtube.com/watch?v=T2FQwFnPDR8)
4 |
5 | ## Summary
6 |
7 | This is an implementation of the [Rainfall Model](https://github.com/abmgis/abmgis/tree/master/Chapter06-IntegratingABMandGIS/Models/Rainfall) in Python, using [Mesa](https://github.com/projectmesa/mesa) and [Mesa-Geo](https://github.com/projectmesa/mesa-geo). Inspired by the NetLogo [Grand Canyon model](http://ccl.northwestern.edu/netlogo/models/GrandCanyon), this is an example of how a digital elevation model (DEM) can be used to create an artificial world.
8 |
9 | ### GeoSpace
10 |
11 | The GeoSpace contains a raster layer representing elevations. It is this elevation value that impacts how the raindrops move over the terrain. Apart from `elevation`, each cell of the raster layer also has a `water_level` attribute that is used to track the amount of water it contains.
12 |
13 | ### GeoAgent
14 |
15 | In this example, the raindrops are the GeoAgents. At each time step, raindrops are randomly created across the landscape to simulate rainfall. The raindrops flow from cells of higher elevation to lower elevation based on their eight surrounding cells (i.e., Moore neighbourhood). The raindrop also has its own height, which allows them to accumulate, gain height and flow if they are trapped at places such as potholes, pools, or depressions. When they reach the boundary of the GeoSpace, they are removed from the model as outflow.
16 |
17 | ## How to Run
18 |
19 | To run the model interactively, run `solara run app.py` in this directory. e.g.
20 |
21 | ```bash
22 | solara run app.py
23 | ```
24 |
25 | Then open your browser to [http://127.0.0.1:8765/](http://127.0.0.1:8765/) and press the play button `▶`.
26 |
27 | ## License
28 |
29 | The data is from the [Rainfall Model](https://github.com/abmgis/abmgis/tree/master/Chapter06-IntegratingABMandGIS/Models/Rainfall) and is licensed under the [Creative Commons Attribution-ShareAlike 4.0 International License](https://creativecommons.org/licenses/by-sa/4.0/).
30 |
--------------------------------------------------------------------------------
/gis/rainfall/app.py:
--------------------------------------------------------------------------------
1 | from mesa.visualization import Slider, SolaraViz, make_plot_component
2 | from mesa_geo.visualization import make_geospace_component
3 | from rainfall.model import Rainfall
4 | from rainfall.space import LakeCell
5 |
6 | model_params = {
7 | "rain_rate": Slider("rain rate", 500, 0, 500, 5),
8 | "water_height": Slider("water height", 5, 1, 5, 1),
9 | "num_steps": Slider("total number of steps", 20, 1, 100, 1),
10 | "export_data": False,
11 | }
12 |
13 |
14 | def cell_portrayal(cell: LakeCell) -> tuple[float, float, float, float]:
15 | if cell.water_level == 0:
16 | return cell.elevation, cell.elevation, cell.elevation, 1
17 | else:
18 | # return a blue color gradient based on the normalized water level
19 | # from the lowest water level colored as RGBA: (74, 141, 255, 1)
20 | # to the highest water level colored as RGBA: (0, 0, 255, 1)
21 | return (
22 | (1 - cell.water_level_normalized) * 74,
23 | (1 - cell.water_level_normalized) * 141,
24 | 255,
25 | 1,
26 | )
27 |
28 |
29 | model = Rainfall()
30 | page = SolaraViz(
31 | model,
32 | [
33 | make_geospace_component(cell_portrayal, zoom=11),
34 | make_plot_component(
35 | ["Total Amount of Water", "Total Contained", "Total Outflow"]
36 | ),
37 | ],
38 | name="Rainfall Model",
39 | model_params=model_params,
40 | )
41 |
42 | page # noqa
43 |
--------------------------------------------------------------------------------
/gis/rainfall/data/elevation.asc.gz:
--------------------------------------------------------------------------------
https://raw.githubusercontent.com/projectmesa/mesa-examples/6ba22dc41ebc37c3ef9f69bd2a6a22bfa08cd128/gis/rainfall/data/elevation.asc.gz
--------------------------------------------------------------------------------
/gis/rainfall/rainfall/__init__.py:
--------------------------------------------------------------------------------
https://raw.githubusercontent.com/projectmesa/mesa-examples/6ba22dc41ebc37c3ef9f69bd2a6a22bfa08cd128/gis/rainfall/rainfall/__init__.py
--------------------------------------------------------------------------------
/gis/rainfall/rainfall/space.py:
--------------------------------------------------------------------------------
1 | from __future__ import annotations
2 |
3 | import gzip
4 |
5 | import mesa
6 | import mesa_geo as mg
7 | import numpy as np
8 |
9 |
10 | class LakeCell(mg.Cell):
11 | elevation: int | None
12 | water_level: int | None
13 | water_level_normalized: float | None
14 |
15 | def __init__(
16 | self,
17 | model,
18 | pos: mesa.space.Coordinate | None = None,
19 | indices: mesa.space.Coordinate | None = None,
20 | ):
21 | super().__init__(model, pos, indices)
22 | self.elevation = None
23 | self.water_level = None
24 | self.water_level_normalized = None
25 |
26 | def step(self):
27 | pass
28 |
29 |
30 | class CraterLake(mg.GeoSpace):
31 | def __init__(self, crs, water_height, model):
32 | super().__init__(crs=crs)
33 | self.model = model
34 | self.water_height = water_height
35 | self.outflow = 0
36 |
37 | def set_elevation_layer(self, elevation_gzip_file, crs):
38 | raster_layer = mg.RasterLayer.from_file(
39 | elevation_gzip_file,
40 | model=self.model,
41 | cell_cls=LakeCell,
42 | attr_name="elevation",
43 | rio_opener=gzip.open,
44 | )
45 | raster_layer.crs = crs
46 | raster_layer.apply_raster(
47 | data=np.zeros(shape=(1, raster_layer.height, raster_layer.width)),
48 | attr_name="water_level",
49 | )
50 | super().add_layer(raster_layer)
51 |
52 | @property
53 | def raster_layer(self):
54 | return self.layers[0]
55 |
56 | def is_at_boundary(self, row_idx, col_idx):
57 | return (
58 | row_idx == 0
59 | or row_idx == self.raster_layer.height
60 | or col_idx == 0
61 | or col_idx == self.raster_layer.width
62 | )
63 |
64 | def move_raindrop(self, raindrop, new_pos):
65 | self.remove_raindrop(raindrop)
66 | raindrop.pos = new_pos
67 | self.add_raindrop(raindrop)
68 |
69 | def add_raindrop(self, raindrop):
70 | x, y = raindrop.pos
71 | row_ind, col_ind = raindrop.indices
72 | if self.is_at_boundary(row_ind, col_ind):
73 | raindrop.is_at_boundary = True
74 | self.outflow += 1
75 | else:
76 | self.raster_layer.cells[x][y].water_level += self.water_height
77 |
78 | def remove_raindrop(self, raindrop):
79 | x, y = raindrop.pos
80 | self.raster_layer.cells[x][y].water_level -= self.water_height
81 |
--------------------------------------------------------------------------------
/gis/rainfall/requirements.txt:
--------------------------------------------------------------------------------
1 | mesa-geo~=0.9.0
2 |
--------------------------------------------------------------------------------
/gis/urban_growth/README.md:
--------------------------------------------------------------------------------
1 | # Urban Growth Model
2 |
3 | [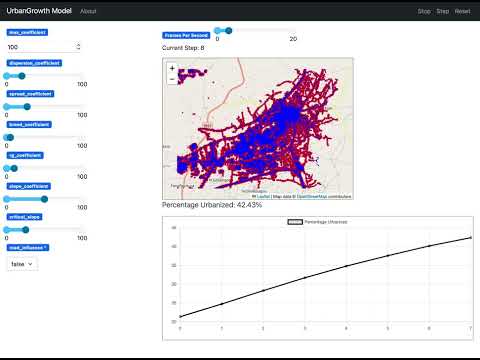](https://www.youtube.com/watch?v=UNtTJL5N83g)
4 |
5 | ## Summary
6 |
7 | This is an implementation of the [UrbanGrowth Model](https://github.com/abmgis/abmgis/tree/master/Chapter06-IntegratingABMandGIS/Models/UrbanGrowth) in Python, using [Mesa](https://github.com/projectmesa/mesa) and [Mesa-Geo](https://github.com/projectmesa/mesa-geo).
8 |
9 | ## How to Run
10 |
11 | To run the model interactively, run `solara run app.py` in this directory. e.g.
12 |
13 | ```bash
14 | solara run app.py
15 | ```
16 |
17 | Then open your browser to [http://127.0.0.1:8765/](http://127.0.0.1:8765/) and press the play button `▶`.
18 |
19 | ## License
20 |
21 | The data is from the [UrbanGrowth Model](https://github.com/abmgis/abmgis/tree/master/Chapter06-IntegratingABMandGIS/Models/UrbanGrowth) and is licensed under the [Creative Commons Attribution-ShareAlike 4.0 International License](https://creativecommons.org/licenses/by-sa/4.0/).
22 |
--------------------------------------------------------------------------------
/gis/urban_growth/app.py:
--------------------------------------------------------------------------------
1 | import solara
2 | from mesa.visualization import Slider, SolaraViz, make_plot_component
3 | from mesa_geo.visualization import make_geospace_component
4 | from urban_growth.model import UrbanGrowth
5 | from urban_growth.space import UrbanCell
6 |
7 |
8 | def cell_portrayal(cell: UrbanCell) -> tuple[float, float, float, float]:
9 | if cell.urban:
10 | if cell.old_urbanized:
11 | return 0, 0, 255, 1
12 | else:
13 | return 255, 0, 0, 1
14 | else:
15 | return 0, 0, 0, 0
16 |
17 |
18 | def make_plot_urbanized(model):
19 | return solara.Markdown(f"**Percentage Urbanized: {model.pct_urbanized:.2f}%**")
20 |
21 |
22 | model_params = {
23 | "max_coefficient": 100,
24 | "dispersion_coefficient": Slider("dispersion_coefficient", 20, 0, 100, 1),
25 | "spread_coefficient": Slider("spread_coefficient", 27, 0, 100, 1),
26 | "breed_coefficient": Slider("breed_coefficient", 5, 0, 100, 1),
27 | "rg_coefficient": Slider("rg_coefficient", 10, 0, 100, 1),
28 | "slope_coefficient": Slider("slope_coefficient", 50, 0, 100, 1),
29 | "critical_slope": Slider("critical_slope", 25, 0, 100, 1),
30 | "road_influence": False,
31 | }
32 |
33 | model = UrbanGrowth()
34 | page = SolaraViz(
35 | model,
36 | [
37 | make_geospace_component(cell_portrayal, zoom=12.1),
38 | make_plot_component(["Percentage Urbanized"]),
39 | make_plot_urbanized,
40 | ],
41 | name="Urban Growth Model",
42 | model_params=model_params,
43 | )
44 |
45 | page # noqa
46 |
--------------------------------------------------------------------------------
/gis/urban_growth/data/excluded_santafe.asc.gz:
--------------------------------------------------------------------------------
https://raw.githubusercontent.com/projectmesa/mesa-examples/6ba22dc41ebc37c3ef9f69bd2a6a22bfa08cd128/gis/urban_growth/data/excluded_santafe.asc.gz
--------------------------------------------------------------------------------
/gis/urban_growth/data/landuse_santafe.asc.gz:
--------------------------------------------------------------------------------
https://raw.githubusercontent.com/projectmesa/mesa-examples/6ba22dc41ebc37c3ef9f69bd2a6a22bfa08cd128/gis/urban_growth/data/landuse_santafe.asc.gz
--------------------------------------------------------------------------------
/gis/urban_growth/data/road1_santafe.asc.gz:
--------------------------------------------------------------------------------
https://raw.githubusercontent.com/projectmesa/mesa-examples/6ba22dc41ebc37c3ef9f69bd2a6a22bfa08cd128/gis/urban_growth/data/road1_santafe.asc.gz
--------------------------------------------------------------------------------
/gis/urban_growth/data/slope_santafe.asc.gz:
--------------------------------------------------------------------------------
https://raw.githubusercontent.com/projectmesa/mesa-examples/6ba22dc41ebc37c3ef9f69bd2a6a22bfa08cd128/gis/urban_growth/data/slope_santafe.asc.gz
--------------------------------------------------------------------------------
/gis/urban_growth/data/urban_santafe.asc.gz:
--------------------------------------------------------------------------------
https://raw.githubusercontent.com/projectmesa/mesa-examples/6ba22dc41ebc37c3ef9f69bd2a6a22bfa08cd128/gis/urban_growth/data/urban_santafe.asc.gz
--------------------------------------------------------------------------------
/gis/urban_growth/requirements.txt:
--------------------------------------------------------------------------------
1 | mesa-geo~=0.9.0
--------------------------------------------------------------------------------
/gis/urban_growth/urban_growth/__init__.py:
--------------------------------------------------------------------------------
https://raw.githubusercontent.com/projectmesa/mesa-examples/6ba22dc41ebc37c3ef9f69bd2a6a22bfa08cd128/gis/urban_growth/urban_growth/__init__.py
--------------------------------------------------------------------------------
/pyproject.toml:
--------------------------------------------------------------------------------
1 | [build-system]
2 | requires = ["hatchling"]
3 | build-backend = "hatchling.build"
4 |
5 | [tool.hatch.build.targets.wheel]
6 | packages = ["examples", "gis", "rl"]
7 |
8 | [project]
9 | name = "mesa-models"
10 | description = "Importable Mesa models."
11 | license = {file = "LICENSE"}
12 | requires-python = ">=3.8"
13 | authors = [
14 | {name = "Project Mesa Team", email = "maintainers@projectmesa.dev"}
15 | ]
16 | version = "0.1.0"
17 | readme = "README.md"
18 |
19 | [project.optional-dependencies]
20 | test = [
21 | "pytest",
22 | "scipy",
23 | "pytest-cov",
24 | ]
25 | test_gis = [
26 | "pytest",
27 | "momepy",
28 | "pytest-cov",
29 | ]
30 | rl_example = [
31 | "stable-baselines3",
32 | "seaborn",
33 | "mesa",
34 | "tensorboard"
35 | ]
36 |
37 | [tool.ruff]
38 | extend-include = ["*.ipynb"]
39 |
40 | [tool.ruff.lint]
41 | # See https://github.com/charliermarsh/ruff#rules for error code definitions.
42 | select = [
43 | # "ANN", # annotations TODO
44 | "B", # bugbear
45 | "C4", # comprehensions
46 | "DTZ", # naive datetime
47 | "E", # style errors
48 | "F", # flakes
49 | "I", # import sorting
50 | "ISC", # string concatenation
51 | "N", # naming
52 | "PGH", # pygrep-hooks
53 | "PIE", # miscellaneous
54 | "PLC", # pylint convention
55 | "PLE", # pylint error
56 | # "PLR", # pylint refactor TODO
57 | "PLW", # pylint warning
58 | "Q", # quotes
59 | "RUF", # Ruff
60 | "S", # security
61 | "SIM", # simplify
62 | "T10", # debugger
63 | "UP", # upgrade
64 | "W", # style warnings
65 | "YTT", # sys.version
66 | # "D", # docstring TODO
67 | ]
68 | # Ignore list taken from https://github.com/psf/black/blob/master/.flake8
69 | # E203 Whitespace before ':'
70 | # E266 Too many leading '#' for block comment
71 | # W503 Line break occurred before a binary operator
72 | # But we don't specify them because ruff's formatter
73 | # checks for it.
74 | # See https://github.com/charliermarsh/ruff/issues/1842#issuecomment-1381210185
75 | extend-ignore = [
76 | "E501",
77 | "S101", # Use of `assert` detected
78 | "B017", # `assertRaises(Exception)` should be considered evil TODO
79 | "PGH004", # Use specific rule codes when using `noqa` TODO
80 | "B905", # `zip()` without an explicit `strict=` parameter
81 | "N802", # Function name should be lowercase
82 | "N999", # Invalid module name. We should revisit this in the future, TODO
83 | "RUF012", # Mutable class attributes should be annotated with `typing.ClassVar` TODO
84 | "S310", # Audit URL open for permitted schemes. Allowing use of `file:` or custom schemes is often unexpected.
85 | "S603", # `subprocess` call: check for execution of untrusted input
86 | "ISC001", # ruff format asks to disable this feature
87 | "S311", # Standard pseudo-random generators are not suitable for cryptographic purposes
88 | ]
89 |
90 | [tool.ruff.lint.pydocstyle]
91 | convention = "google"
--------------------------------------------------------------------------------
/rl/.gitignore:
--------------------------------------------------------------------------------
1 | __pycache__/
--------------------------------------------------------------------------------
/rl/README.md:
--------------------------------------------------------------------------------
1 | # Reinforcement Learning Implementations with Mesa
2 |
3 | This repository demonstrates various applications of reinforcement learning (RL) using the Mesa agent-based modeling framework.
4 |
5 |
6 |  7 |
7 |
8 |
9 | ## Getting Started
10 |
11 | ### Installation
12 |
13 | *Given the number of dependencies required, we recommend starting by creating a Conda environment or a Python virtual environment.*
14 | 1. **Install Mesa Models**
15 | Begin by installing the Mesa models:
16 |
17 | #TODO: Update this -- do release?
18 |
19 | ```bash
20 | pip install -U -e git+https://github.com/projectmesa/mesa-examples@mesa-2.x#egg=mesa-models
21 | ```
22 |
23 | 3. **Install RLlib for Multi-Agent Training**
24 | Next, install RLlib along with TensorFlow and PyTorch to support multi-agent training algorithms:
25 |
26 | ```bash
27 | pip install "ray[rllib]" tensorflow torch
28 | ```
29 | #TODO Update requirements to mesa[rec] >3.0
30 |
31 | 4. **Install Additional Dependencies**
32 | Finally, install any remaining dependencies:
33 |
34 | ```bash
35 | pip install -r requirements.txt
36 | ```
37 |
38 | 5. **Download Pre-Trained Weights**
39 | Download pre-trained weights from hugging face:
40 |
41 | ```bash
42 | git clone https://huggingface.co/projectmesa/rl_models/
43 | ```
44 |
45 | ### Running the Examples
46 |
47 | To test the code, simply execute `example.py`:
48 |
49 | ```bash
50 | python example.py
51 | ```
52 |
53 | *Note: Pre-trained models might not work in some cases because of differnce in versions of libraries used to train and test.*
54 |
55 | To learn about individual implementations, please refer to the README files of specific environments.
56 |
57 |
58 | ## Tutorials
59 |
60 | For detailed tutorials on how to use these implementations and guidance on starting your own projects, please refer to [Tutorials.md](./Tutorials.md).
61 |
62 | Here's a refined version of your contribution guide:
63 |
64 |
65 | ## Contribution Guide
66 |
67 | We welcome contributions to our project! A great way to get started is by implementing the remaining examples listed in the [Mesa-Examples](https://github.com/projectmesa/mesa-examples) repository with reinforcement learning (RL).
68 |
69 | Additionally, if you have your own Mesa environments that you think would benefit from RL integration, we encourage you to share them with us. Simply start an issue on our GitHub repository with your suggestion, and we can collaborate on bringing it to life!
--------------------------------------------------------------------------------
/rl/boltzmann_money/README.md:
--------------------------------------------------------------------------------
1 | # Balancing Wealth Inequality
2 | This folder showcases how to solve the Boltzmann wealth model with Proximal Policy Optimization (PPO) from Stable Baselines.
3 |
4 | ## Key features:
5 |
6 | - Boltzmann Wealth Model: Agents with varying wealth navigate a grid, aiming to minimize inequality measured by the Gini coefficient.
7 | - PPO Training: A PPO agent is trained to achieve this goal, receiving sparse rewards based on Gini coefficient improvement and a large terminal reward for achieving low inequality.
8 | - Mesa Data Collection and Visualization: The Mesa data collector tool tracks Gini values during training, allowing for real-time visualization.
9 | - Visualization Script: Visualize the trained agent's behavior with Mesa's visualization tools, presenting agent movement and Gini values within the grid. You can run `server.py` file to test it with pre-trained model.
10 |
11 | ## Model Behaviour
12 | As stable baselines controls multiple agents with the same weight, this results in the agents learning to move towards a corner of the grid. These brings all the agents together allowing exchange of money between them resulting in reward maximization.
13 |
14 |  15 |
15 |
--------------------------------------------------------------------------------
/rl/boltzmann_money/ppo_agent.gif:
--------------------------------------------------------------------------------
https://raw.githubusercontent.com/projectmesa/mesa-examples/6ba22dc41ebc37c3ef9f69bd2a6a22bfa08cd128/rl/boltzmann_money/ppo_agent.gif
--------------------------------------------------------------------------------
/rl/boltzmann_money/server.py:
--------------------------------------------------------------------------------
1 | import os
2 |
3 | import mesa
4 | from mesa.visualization.ModularVisualization import ModularServer
5 | from mesa.visualization.modules import ChartModule
6 | from model import BoltzmannWealthModelRL
7 | from stable_baselines3 import PPO
8 |
9 |
10 | # Modify the MoneyModel class to take actions from the RL model
11 | class MoneyModelRL(BoltzmannWealthModelRL):
12 | def __init__(self, N, width, height):
13 | super().__init__(N, width, height)
14 | model_path = os.path.join(
15 | os.path.dirname(__file__), "..", "model", "boltzmann_money.zip"
16 | )
17 | self.rl_model = PPO.load(model_path)
18 | self.reset()
19 |
20 | def step(self):
21 | # Collect data
22 | self.datacollector.collect(self)
23 |
24 | # Get observations which is the wealth of each agent and their position
25 | obs = self._get_obs()
26 |
27 | action, _states = self.rl_model.predict(obs)
28 | self.action_dict = action
29 | self.schedule.step()
30 |
31 |
32 | # Define the agent portrayal with different colors for different wealth levels
33 | def agent_portrayal(agent):
34 | if agent.wealth > 10:
35 | color = "purple"
36 | elif agent.wealth > 7:
37 | color = "red"
38 | elif agent.wealth > 5:
39 | color = "orange"
40 | elif agent.wealth > 3:
41 | color = "yellow"
42 | else:
43 | color = "blue"
44 |
45 | portrayal = {
46 | "Shape": "circle",
47 | "Filled": "true",
48 | "Layer": 0,
49 | "Color": color,
50 | "r": 0.5,
51 | }
52 | return portrayal
53 |
54 |
55 | if __name__ == "__main__":
56 | # Define a grid visualization
57 | grid = mesa.visualization.CanvasGrid(agent_portrayal, 10, 10, 500, 500)
58 |
59 | # Define a chart visualization
60 | chart = ChartModule(
61 | [{"Label": "Gini", "Color": "Black"}], data_collector_name="datacollector"
62 | )
63 |
64 | # Create a modular server
65 | server = ModularServer(
66 | MoneyModelRL, [grid, chart], "Money Model", {"N": 10, "width": 10, "height": 10}
67 | )
68 | server.port = 8521 # The default
69 | server.launch()
70 |
--------------------------------------------------------------------------------
/rl/boltzmann_money/train.py:
--------------------------------------------------------------------------------
1 | import argparse
2 |
3 | from model import NUM_AGENTS, BoltzmannWealthModelRL
4 | from stable_baselines3 import PPO
5 | from stable_baselines3.common.callbacks import EvalCallback
6 |
7 |
8 | def rl_model(args):
9 | # Create the environment
10 | env = BoltzmannWealthModelRL(N=NUM_AGENTS, width=NUM_AGENTS, height=NUM_AGENTS)
11 | eval_env = BoltzmannWealthModelRL(N=NUM_AGENTS, width=NUM_AGENTS, height=NUM_AGENTS)
12 | eval_callback = EvalCallback(
13 | eval_env, best_model_save_path="./logs/", log_path="./logs/", eval_freq=5000
14 | )
15 | # Define the PPO model
16 | model = PPO("MlpPolicy", env, verbose=1, tensorboard_log="./logs/")
17 |
18 | # Train the model
19 | model.learn(total_timesteps=args.stop_timesteps, callback=[eval_callback])
20 |
21 | # Save the model
22 | model.save("ppo_money_model")
23 |
24 |
25 | if __name__ == "__main__":
26 | # Define the command line arguments
27 | parser = argparse.ArgumentParser()
28 | parser.add_argument(
29 | "--stop-timesteps",
30 | type=int,
31 | default=NUM_AGENTS * 100,
32 | help="Number of timesteps to train.",
33 | )
34 | args = parser.parse_args()
35 | rl_model(args)
36 |
--------------------------------------------------------------------------------
/rl/epstein_civil_violence/README.md:
--------------------------------------------------------------------------------
1 | # Modelling Violence: Epstein Civil Violence Model
2 |
3 | This project demonstrates the use of the RLlib library to implement Multi-Agent Reinforcement Learning (MARL) in the classic Epstein-Civil Violence problem. The environment details can be found on the Mesa project's GitHub repository [here](https://github.com/projectmesa/mesa-examples/tree/main/examples/epstein_civil_violence).
4 |
5 | ## Key Features
6 |
7 | **RLlib and Multi-Agent Learning**:
8 | - **Library Utilized**: The project leverages the RLlib library to concurrently train two independent PPO (Proximal Policy Optimization) agents.
9 | - **Agents**:
10 | - **Police**: Aims to control violence (Reduce active agent)
11 | - **Citizen**: Aims to show resistence (be active) without getting arrested
12 |
13 | **Input and Observation Space**:
14 | - **Observation Grid**: Each agent's policy receives a 4 radius grid centered on itself as input.
15 |
16 | **Action Space**:
17 | - **Action Space**: For citizen the action space is the ID of the neighboring tile to which the agent wants to move along with choice to be active. For cop the action space is ID of neighbourng tile it wants to move along with ID of active citizen in it's neigbhood that it wants to arrest.
18 | **Behavior and Training Outcomes**:
19 |
20 | **Optimal Behavior**:
21 | - **Cops**: Learns to move towards active agents and arrest them.
22 | - **Citizens**: Learns to run away from cops and be active only if a cop isn't around.
23 | - **Density Variations**: You can vary the densities of sheep and wolves to observe different results.
24 |
25 | By leveraging RLlib and Multi-Agent Learning, this project provides insights into the dynamics of violence in a society and various strategies in a simulated environment.
26 |
27 |
28 |
29 |  30 |
30 |
31 |
--------------------------------------------------------------------------------
/rl/epstein_civil_violence/agent.py:
--------------------------------------------------------------------------------
1 | from mesa.examples.advanced.epstein_civil_violence.agents import Citizen, Cop
2 | from utility import move
3 |
4 |
5 | class CitizenRL(Citizen):
6 | def step(self):
7 | # Get action from action_dict
8 | action_tuple = self.model.action_dict[self.unique_id]
9 | # If in jail decrease sentence, else update condition
10 | if self.jail_sentence > 0:
11 | self.jail_sentence -= 1
12 | else:
13 | # RL Logic
14 | # Update condition and postion based on action
15 | self.condition = "Active" if action_tuple[0] == 1 else "Quiescent"
16 | # Update neighbors for updated empty neighbors
17 | self.update_neighbors()
18 | if self.model.movement:
19 | move(
20 | self,
21 | action_tuple[1],
22 | self.empty_neighbors,
23 | )
24 |
25 | # Update the neighbors for observation space
26 | self.update_neighbors()
27 |
28 |
29 | class CopRL(Cop):
30 | def step(self):
31 | # RL Logics
32 | # Arrest if active citizen is indicated in action
33 | action_tuple = self.model.action_dict[self.unique_id]
34 | arrest_pos = self.neighborhood[action_tuple[0]]
35 | for agent in self.model.grid.get_cell_list_contents(self.neighborhood):
36 | if (
37 | isinstance(agent, CitizenRL)
38 | and agent.condition == "Active"
39 | and agent.jail_sentence == 0
40 | and agent.pos == arrest_pos
41 | ):
42 | agent.jail_sentence = self.random.randint(1, self.model.max_jail_term)
43 | agent.condition = "Quiescent"
44 | self.arrest_made = True
45 | break
46 | else:
47 | self.arrest_made = False
48 | # Update neighbors for updated empty neighbors
49 | self.update_neighbors()
50 | # Move based on action
51 | if self.model.movement:
52 | move(self, action_tuple[1], self.empty_neighbors)
53 | # Update the neighbors for observation space
54 | self.update_neighbors()
55 |
--------------------------------------------------------------------------------
/rl/epstein_civil_violence/resources/epstein.gif:
--------------------------------------------------------------------------------
https://raw.githubusercontent.com/projectmesa/mesa-examples/6ba22dc41ebc37c3ef9f69bd2a6a22bfa08cd128/rl/epstein_civil_violence/resources/epstein.gif
--------------------------------------------------------------------------------
/rl/epstein_civil_violence/train_config.py:
--------------------------------------------------------------------------------
1 | import os
2 |
3 | from model import EpsteinCivilViolenceRL
4 | from ray.rllib.algorithms.ppo import PPOConfig
5 | from ray.rllib.policy.policy import PolicySpec
6 |
7 |
8 | # Configuration for the PPO algorithm
9 | # You can change the configuration as per your requirements
10 | def env_creator(_):
11 | return EpsteinCivilViolenceRL(
12 | width=20,
13 | height=20,
14 | citizen_density=0.5,
15 | cop_density=0.1,
16 | citizen_vision=4,
17 | cop_vision=4,
18 | legitimacy=0.82,
19 | max_jail_term=10,
20 | )
21 |
22 |
23 | config = {
24 | "env_name": "WorldcopModel-v0",
25 | "env_creator": env_creator,
26 | "framework": "torch",
27 | "train_batch_size": 800,
28 | "policies": {
29 | "policy_cop": PolicySpec(config=PPOConfig.overrides(framework_str="torch")),
30 | "policy_citizen": PolicySpec(config=PPOConfig.overrides(framework_str="torch")),
31 | },
32 | "policy_mapping_fn": lambda agent_id, *args, **kwargs: "policy_cop"
33 | if agent_id[0:3] == "cop"
34 | else "policy_citizen",
35 | "policies_to_train": ["policy_cop", "policy_citizen"],
36 | "num_gpus": int(os.environ.get("RLLIB_NUM_GPUS", "1")),
37 | "num_learners": 50,
38 | "num_env_runners": 20,
39 | "num_envs_per_env_runner": 1,
40 | "batch_mode": "truncate_episodes",
41 | "rollout_fragment_length": 40,
42 | }
43 |
--------------------------------------------------------------------------------
/rl/epstein_civil_violence/utility.py:
--------------------------------------------------------------------------------
1 | def create_intial_agents(self, CitizenRL, CopRL):
2 | # Create agents
3 | unique_id = 0
4 | if self.cop_density + self.citizen_density > 1:
5 | raise ValueError("CopRL density + citizen density must be less than 1")
6 | cops = []
7 | citizens = []
8 | for contents, (x, y) in self.grid.coord_iter():
9 | if self.random.random() < self.cop_density:
10 | unique_id_str = f"cop_{unique_id}"
11 | cop = CopRL(unique_id_str, self, (x, y), vision=self.cop_vision)
12 | unique_id += 1
13 | self.grid[x][y] = cop
14 | cops.append(cop)
15 | elif self.random.random() < (self.cop_density + self.citizen_density):
16 | unique_id_str = f"citizen_{unique_id}"
17 | citizen = CitizenRL(
18 | unique_id_str,
19 | self,
20 | (x, y),
21 | hardship=self.random.random(),
22 | regime_legitimacy=self.legitimacy,
23 | risk_aversion=self.random.random(),
24 | threshold=0,
25 | vision=self.citizen_vision,
26 | )
27 | unique_id += 1
28 | self.grid[x][y] = citizen
29 | citizens.append(citizen)
30 | # Initializing cops then citizens
31 | # This ensures cops act out their step before citizens
32 | for cop in cops:
33 | self.add(cop)
34 | for citizen in citizens:
35 | self.add(citizen)
36 |
37 |
38 | def grid_to_observation(self, CitizenRL):
39 | # Convert neighborhood to observation grid
40 | self.obs_grid = []
41 | for i in self.grid._grid:
42 | row = []
43 | for j in i:
44 | if j is None:
45 | row.append(0) # Empty cell
46 | elif isinstance(j, CitizenRL):
47 | if j.condition == "Quiescent":
48 | row.append(
49 | 3 if j.jail_sentence > 0 else 1
50 | ) # Quiescent citizen (jailed or not)
51 | elif j.condition == "Active":
52 | row.append(2) # Active citizen
53 | else:
54 | row.append(4) # Cop
55 | self.obs_grid.append(row)
56 |
57 |
58 | def move(self, action, empty_neighbors):
59 | # Define the movement deltas
60 | moves = {
61 | 0: (1, 0), # Move right
62 | 1: (-1, 0), # Move left
63 | 2: (0, -1), # Move up
64 | 3: (0, 1), # Move down
65 | }
66 |
67 | # Get the delta for the action, defaulting to (0, 0) if the action is invalid
68 | dx, dy = moves.get(int(action), (0, 0))
69 |
70 | # Calculate the new position and wrap around the grid
71 | new_position = (
72 | (self.pos[0] + dx) % self.model.grid.width,
73 | (self.pos[1] + dy) % self.model.grid.height,
74 | )
75 |
76 | # Move the agent if the new position is in empty_neighbors
77 | if new_position in empty_neighbors:
78 | self.model.grid.move_agent(self, new_position)
79 |
--------------------------------------------------------------------------------
/rl/example.py:
--------------------------------------------------------------------------------
1 | from epstein_civil_violence.model import EpsteinCivilViolenceRL
2 | from epstein_civil_violence.server import run_model
3 | from epstein_civil_violence.train_config import config
4 | from train import train_model
5 |
6 | # Load the environment
7 | env = EpsteinCivilViolenceRL()
8 | observation, info = env.reset(seed=42)
9 | # Running the environment on some random actions
10 | for _ in range(10):
11 | action_dict = {}
12 | for agent in env.schedule.agents:
13 | action_dict[agent.unique_id] = env.action_space.sample()
14 | observation, reward, terminated, truncated, info = env.step(action_dict)
15 |
16 | if terminated or truncated:
17 | observation, info = env.reset()
18 |
19 | # Training a model
20 | train_model(
21 | config, num_iterations=1, result_path="results.txt", checkpoint_dir="checkpoints"
22 | )
23 |
24 | # Running the model and visualizing it
25 | server = run_model(path="checkpoints")
26 | # You can also try running pre-trained checkpoints present in model folder
27 | # server = run_model(path='rl_models/epstein_civil_violence')
28 | server.port = 6005
29 | server.launch(open_browser=True)
30 |
--------------------------------------------------------------------------------
/rl/requirements.txt:
--------------------------------------------------------------------------------
1 | stable-baselines3
2 | seaborn
3 | mesa
4 | tensorboard
--------------------------------------------------------------------------------
/rl/train.py:
--------------------------------------------------------------------------------
1 | from ray import tune
2 | from ray.rllib.algorithms.ppo import PPOConfig
3 | from ray.tune.logger import pretty_print
4 |
5 |
6 | # Custom function to get the configuration
7 | def get_config(custom_config):
8 | config = (
9 | PPOConfig()
10 | .environment(custom_config["env_name"])
11 | .framework(custom_config["framework"])
12 | .training(train_batch_size=custom_config["train_batch_size"])
13 | .multi_agent(
14 | policies=custom_config["policies"],
15 | policy_mapping_fn=custom_config["policy_mapping_fn"],
16 | policies_to_train=custom_config["policies_to_train"],
17 | )
18 | .resources(num_gpus=custom_config["num_gpus"])
19 | .learners(num_learners=custom_config["num_learners"])
20 | .env_runners(
21 | num_env_runners=custom_config["num_env_runners"],
22 | num_envs_per_env_runner=custom_config["num_envs_per_env_runner"],
23 | batch_mode=custom_config["batch_mode"],
24 | rollout_fragment_length=custom_config["rollout_fragment_length"],
25 | )
26 | )
27 | return config
28 |
29 |
30 | # Training the model
31 | def train_model(
32 | config, num_iterations=5, result_path="results.txt", checkpoint_dir="checkpoints"
33 | ):
34 | tune.register_env(config["env_name"], config["env_creator"])
35 |
36 | algo_config = get_config(config)
37 | algo = algo_config.build()
38 |
39 | for i in range(num_iterations):
40 | result = algo.train()
41 | print(pretty_print(result))
42 |
43 | with open(result_path, "w") as file:
44 | file.write(pretty_print(result))
45 |
46 | checkpoint_dir = algo.save(checkpoint_dir).checkpoint.path
47 | print(f"Checkpoint saved in directory {checkpoint_dir}")
48 |
--------------------------------------------------------------------------------
/rl/wolf_sheep/README.md:
--------------------------------------------------------------------------------
1 | # Collaborative Survival: Wolf-Sheep Predation Model
2 |
3 | This project demonstrates the use of the RLlib library to implement Multi-Agent Reinforcement Learning (MARL) in the classic Wolf-Sheep predation problem. The environment details can be found on the Mesa project's GitHub repository [here](https://github.com/projectmesa/mesa-examples/tree/main/examples/wolf_sheep).
4 |
5 | ## Key Features
6 |
7 | **RLlib and Multi-Agent Learning**:
8 | - **Library Utilized**: The project leverages the RLlib library to concurrently train two independent PPO (Proximal Policy Optimization) agents.
9 | - **Agents**:
10 | - **Wolf**: Predatory agent survives by eating sheeps
11 | - **Sheep**: Prey agent survives by eating grass
12 | - **Grass**: Grass is eaten by sheep and regrows with time
13 |
14 | **Input and Observation Space**:
15 | - **Observation Grid**: Each agent's policy receives a 10x10 grid centered on itself as input.
16 | - **Grid Details**: The grid incorporates information about the presence of other agents (wolves, sheep, and grass) within the grid.
17 | - **Agent's Energy Level**: The agent's current energy level is also included in the observations.
18 |
19 | **Action Space**:
20 | - **Action Space**: The action space is the ID of the neighboring tile to which the agent wants to move.
21 |
22 | **Behavior and Training Outcomes**:
23 | - **Optimal Behavior**:
24 | - **Wolf**: Learns to move towards the nearest sheep.
25 | - **Sheep**: Learns to run away from wolves and is attracted to grass.
26 | - **Density Variations**: You can vary the densities of sheep and wolves to observe different results.
27 |
28 | By leveraging RLlib and Multi-Agent Learning, this project provides insights into the dynamics of predator-prey relationships and optimal behavior strategies in a simulated environment.
29 |
30 |
31 |
32 |  33 |
33 |
--------------------------------------------------------------------------------
/rl/wolf_sheep/agents.py:
--------------------------------------------------------------------------------
1 | from mesa.examples.advanced.wolf_sheep.agents import GrassPatch, Sheep, Wolf
2 | from utility import move
3 |
4 |
5 | class SheepRL(Sheep):
6 | def step(self):
7 | """The code is exactly same as mesa-example with the only difference being the move function and new sheep creation class.
8 | Link : https://github.com/projectmesa/mesa-examples/blob/main/examples/wolf_sheep/wolf_sheep/agents.py
9 | """
10 | action = self.model.action_dict[self.unique_id]
11 | move(self, action)
12 |
13 | living = True
14 |
15 | if self.model.grass:
16 | # Reduce energy
17 | self.energy -= 1
18 |
19 | # If there is grass available, eat it
20 | this_cell = self.model.grid.get_cell_list_contents([self.pos])
21 | grass_patch = next(obj for obj in this_cell if isinstance(obj, GrassPatch))
22 | if grass_patch.fully_grown:
23 | self.energy += self.model.sheep_gain_from_food
24 | grass_patch.fully_grown = False
25 |
26 | # Death
27 | if self.energy < 0:
28 | self.model.grid.remove_agent(self)
29 | self.model.remove(self)
30 | living = False
31 |
32 | if living and self.random.random() < self.model.sheep_reproduce:
33 | # Create a new sheep:
34 | if self.model.grass:
35 | self.energy /= 2
36 | unique_id_str = f"sheep_{self.model.next_id()}"
37 | lamb = SheepRL(unique_id_str, self.pos, self.model, self.moore, self.energy)
38 | self.model.grid.place_agent(lamb, self.pos)
39 | self.model.add(lamb)
40 |
41 |
42 | class WolfRL(Wolf):
43 | def step(self):
44 | """The code is exactly same as mesa-example with the only difference being the move function and new wolf creation class.
45 | Link : https://github.com/projectmesa/mesa-examples/blob/main/examples/wolf_sheep/wolf_sheep/agents.py
46 | """
47 | action = self.model.action_dict[self.unique_id]
48 | move(self, action)
49 |
50 | self.energy -= 1
51 |
52 | # If there are sheep present, eat one
53 | x, y = self.pos
54 | this_cell = self.model.grid.get_cell_list_contents([self.pos])
55 | sheep = [obj for obj in this_cell if isinstance(obj, Sheep)]
56 | if len(sheep) > 0:
57 | sheep_to_eat = self.random.choice(sheep)
58 | self.energy += self.model.wolf_gain_from_food
59 |
60 | # Kill the sheep
61 | self.model.grid.remove_agent(sheep_to_eat)
62 | self.model.remove(sheep_to_eat)
63 |
64 | # Death or reproduction
65 | if self.energy < 0:
66 | self.model.grid.remove_agent(self)
67 | self.model.remove(self)
68 | else:
69 | if self.random.random() < self.model.wolf_reproduce:
70 | # Create a new wolf cub
71 | self.energy /= 2
72 | unique_id_str = f"wolf_{self.model.next_id()}"
73 | cub = WolfRL(
74 | unique_id_str, self.pos, self.model, self.moore, self.energy
75 | )
76 | self.model.grid.place_agent(cub, cub.pos)
77 | self.model.add(cub)
78 |
--------------------------------------------------------------------------------
/rl/wolf_sheep/resources/sheep.png:
--------------------------------------------------------------------------------
https://raw.githubusercontent.com/projectmesa/mesa-examples/6ba22dc41ebc37c3ef9f69bd2a6a22bfa08cd128/rl/wolf_sheep/resources/sheep.png
--------------------------------------------------------------------------------
/rl/wolf_sheep/resources/wolf.png:
--------------------------------------------------------------------------------
https://raw.githubusercontent.com/projectmesa/mesa-examples/6ba22dc41ebc37c3ef9f69bd2a6a22bfa08cd128/rl/wolf_sheep/resources/wolf.png
--------------------------------------------------------------------------------
/rl/wolf_sheep/resources/wolf_sheep.gif:
--------------------------------------------------------------------------------
https://raw.githubusercontent.com/projectmesa/mesa-examples/6ba22dc41ebc37c3ef9f69bd2a6a22bfa08cd128/rl/wolf_sheep/resources/wolf_sheep.gif
--------------------------------------------------------------------------------
/rl/wolf_sheep/train_config.py:
--------------------------------------------------------------------------------
1 | import os
2 |
3 | from model import WolfSheepRL
4 | from ray.rllib.algorithms.ppo import PPOConfig
5 | from ray.rllib.policy.policy import PolicySpec
6 |
7 |
8 | # Configuration to train the model
9 | # Feel free to adjust the configuration as necessary
10 | def env_creator(_):
11 | return WolfSheepRL(
12 | width=20,
13 | height=20,
14 | initial_sheep=100,
15 | initial_wolves=25,
16 | sheep_reproduce=0.04,
17 | wolf_reproduce=0.05,
18 | wolf_gain_from_food=20,
19 | grass=True,
20 | grass_regrowth_time=30,
21 | sheep_gain_from_food=4,
22 | )
23 |
24 |
25 | config = {
26 | "env_name": "WorldSheepModel-v0",
27 | "env_creator": env_creator,
28 | "framework": "torch", # Assuming you want to use PyTorch
29 | "train_batch_size": 150, # Assuming a default value, adjust as necessary
30 | "policies": {
31 | "policy_sheep": PolicySpec(config=PPOConfig.overrides(framework_str="torch")),
32 | "policy_wolf": PolicySpec(config=PPOConfig.overrides(framework_str="torch")),
33 | },
34 | "policy_mapping_fn": lambda agent_id, *args, **kwargs: "policy_sheep"
35 | if agent_id[0:5] == "sheep"
36 | else "policy_wolf",
37 | "policies_to_train": ["policy_sheep", "policy_wolf"],
38 | "num_gpus": int(os.environ.get("RLLIB_NUM_GPUS", "1")),
39 | "num_learners": 50, # Assuming a default value, adjust as necessary
40 | "num_env_runners": 20, # Assuming a default value, adjust as necessary
41 | "num_envs_per_env_runner": 1, # Assuming a default value, adjust as necessary
42 | "batch_mode": "truncate_episodes", # Assuming a default value, adjust as necessary
43 | "rollout_fragment_length": "auto", # Assuming a default value, adjust as necessary
44 | }
45 |
--------------------------------------------------------------------------------
/rl/wolf_sheep/utility.py:
--------------------------------------------------------------------------------
1 | def create_intial_agents(self, SheepRL, WolfRL, GrassPatch):
2 | # Create sheep:
3 | for i in range(self.initial_sheep):
4 | x = self.random.randrange(self.width)
5 | y = self.random.randrange(self.height)
6 | energy = self.random.randrange(2 * self.sheep_gain_from_food)
7 | unique_id_str = f"sheep_{self.next_id()}"
8 | sheep = SheepRL(unique_id_str, None, self, True, energy)
9 | self.grid.place_agent(sheep, (x, y))
10 | self.add(sheep)
11 |
12 | # Create wolves
13 | for i in range(self.initial_wolves):
14 | x = self.random.randrange(self.width)
15 | y = self.random.randrange(self.height)
16 | energy = self.random.randrange(2 * self.wolf_gain_from_food)
17 | unique_id_str = f"wolf_{self.next_id()}"
18 | wolf = WolfRL(unique_id_str, None, self, True, energy)
19 | self.grid.place_agent(wolf, (x, y))
20 | self.add(wolf)
21 |
22 | # Create grass patches
23 | if self.grass:
24 | for agent, (x, y) in self.grid.coord_iter():
25 | fully_grown = self.random.choice([True, False])
26 |
27 | if fully_grown:
28 | countdown = self.grass_regrowth_time
29 | else:
30 | countdown = self.random.randrange(self.grass_regrowth_time)
31 |
32 | unique_id_str = f"grass_{self.next_id()}"
33 | patch = GrassPatch(unique_id_str, None, self, fully_grown, countdown)
34 | self.grid.place_agent(patch, (x, y))
35 | self.add(patch)
36 |
37 |
38 | def move(self, action):
39 | empty_neighbors = self.model.grid.get_neighborhood(
40 | self.pos, moore=True, include_center=False
41 | )
42 |
43 | # Define the movement deltas
44 | moves = {
45 | 0: (1, 0), # Move right
46 | 1: (-1, 0), # Move left
47 | 2: (0, -1), # Move up
48 | 3: (0, 1), # Move down
49 | }
50 |
51 | # Get the delta for the action, defaulting to (0, 0) if the action is invalid
52 | dx, dy = moves.get(int(action), (0, 0))
53 |
54 | # Calculate the new position and wrap around the grid
55 | new_position = (
56 | (self.pos[0] + dx) % self.model.grid.width,
57 | (self.pos[1] + dy) % self.model.grid.height,
58 | )
59 |
60 | # Move the agent if the new position is in empty_neighbors
61 | if new_position in empty_neighbors:
62 | self.model.grid.move_agent(self, new_position)
63 |
64 |
65 | def grid_to_observation(self, SheepRL, WolfRL, GrassPatch):
66 | # Convert grid to matrix for better representation
67 | self.obs_grid = []
68 | for i in self.grid._grid:
69 | row = []
70 | for j in i:
71 | value = [0, 0, 0]
72 | for agent in j:
73 | if isinstance(agent, SheepRL):
74 | value[0] = 1
75 | elif isinstance(agent, WolfRL):
76 | value[1] = 1
77 | elif isinstance(agent, GrassPatch) and agent.fully_grown:
78 | value[2] = 1
79 | row.append(value)
80 | self.obs_grid.append(row)
81 |
--------------------------------------------------------------------------------
/setup.cfg:
--------------------------------------------------------------------------------
1 | [options]
2 | packages =
3 | examples
4 |
--------------------------------------------------------------------------------
/test_examples.py:
--------------------------------------------------------------------------------
1 | import importlib
2 | import os
3 |
4 | import pytest
5 | from mesa import Model
6 |
7 |
8 | def get_models(directory):
9 | models = []
10 | for root, _, files in os.walk(directory):
11 | for file in files:
12 | if file == "model.py":
13 | module_name = os.path.relpath(os.path.join(root, file[:-3])).replace(
14 | os.sep, "."
15 | )
16 |
17 | module = importlib.import_module(module_name)
18 | for item in dir(module):
19 | obj = getattr(module, item)
20 | if (
21 | isinstance(obj, type)
22 | and issubclass(obj, Model)
23 | and obj is not Model
24 | ):
25 | models.append(obj)
26 |
27 | return models
28 |
29 |
30 | @pytest.mark.parametrize("model_class", get_models("examples"))
31 | def test_model_steps(model_class):
32 | model = model_class() # Assume no arguments are needed
33 | for _ in range(10):
34 | model.step()
35 | assert model.steps == 10
36 |
--------------------------------------------------------------------------------
/test_gis_examples.py:
--------------------------------------------------------------------------------
1 | import importlib
2 | import os
3 |
4 | import pytest
5 | from mesa import Model
6 |
7 |
8 | def get_models(directory):
9 | models = []
10 | for root, _, files in os.walk(directory):
11 | for file in files:
12 | if file == "model.py":
13 | module_name = os.path.relpath(os.path.join(root, file[:-3])).replace(
14 | os.sep, "."
15 | )
16 |
17 | module = importlib.import_module(module_name)
18 | for item in dir(module):
19 | obj = getattr(module, item)
20 | if (
21 | isinstance(obj, type)
22 | and issubclass(obj, Model)
23 | and obj is not Model
24 | ):
25 | models.append(obj)
26 |
27 | return models
28 |
29 |
30 | @pytest.mark.parametrize("model_class", get_models("gis"))
31 | def test_model_steps(model_class):
32 | model = model_class() # Assume no arguments are needed
33 | for _ in range(10):
34 | model.step()
35 |
--------------------------------------------------------------------------------