├── website
├── views
│ ├── demo
│ │ ├── Gauge
│ │ │ ├── label.md
│ │ │ ├── default.md
│ │ │ ├── routes.js
│ │ │ ├── pointer.md
│ │ │ ├── tick.md
│ │ │ └── style.md
│ │ ├── VisualLink
│ │ │ ├── routes.js
│ │ │ └── basic.md
│ │ ├── Wave
│ │ │ ├── routes.js
│ │ │ ├── basic.md
│ │ │ ├── wave.md
│ │ │ ├── label.md
│ │ │ └── shape.md
│ │ ├── WordCloud
│ │ │ └── routes.js
│ │ ├── Funnel
│ │ │ ├── routes.js
│ │ │ ├── funnel-default.md
│ │ │ └── funnel-others.md
│ │ ├── radialBar
│ │ │ ├── routes.js
│ │ │ ├── compose.md
│ │ │ └── radialBar.md
│ │ ├── Area
│ │ │ ├── routes.js
│ │ │ ├── area-default.md
│ │ │ ├── area-nostack.md
│ │ │ ├── area-stack.md
│ │ │ ├── area-range.md
│ │ │ └── area-others.md
│ │ ├── Bar
│ │ │ ├── routes.js
│ │ │ ├── default-bar.md
│ │ │ ├── group-bar.md
│ │ │ ├── stack-bar.md
│ │ │ ├── update-bar.md
│ │ │ └── column-line.md
│ │ ├── scatter
│ │ │ ├── index.js
│ │ │ └── scatter_update.md
│ │ ├── Column
│ │ │ ├── routes.js
│ │ │ ├── default-column.md
│ │ │ ├── group-column.md
│ │ │ └── stack-column.md
│ │ ├── PolarBar
│ │ │ ├── routes.js
│ │ │ ├── default-polarBar.md
│ │ │ └── group-polarBar.md
│ │ ├── Map
│ │ │ ├── routes.js
│ │ │ └── component-label.md
│ │ ├── pie
│ │ │ ├── arcPie.md
│ │ │ ├── theme.md
│ │ │ ├── rose_layoutScale.md
│ │ │ ├── dounght.md
│ │ │ ├── routes.js
│ │ │ ├── nest.md
│ │ │ ├── calendar.md
│ │ │ ├── link.md
│ │ │ └── rose.md
│ │ ├── line
│ │ │ ├── line-default.md
│ │ │ ├── routes.js
│ │ │ ├── line-double.md
│ │ │ └── line-smooth.md
│ │ └── radar
│ │ │ ├── radar_point_style.md
│ │ │ ├── radar.md
│ │ │ ├── index.js
│ │ │ ├── radar_border_style.md
│ │ │ ├── radar_grid_style.md
│ │ │ ├── radar_label_y_style.md
│ │ │ ├── radar_area_style.md
│ │ │ ├── radar_axis_style.md
│ │ │ ├── radar_label_style.md
│ │ │ └── radar_update.md
│ ├── doc
│ │ ├── api
│ │ │ ├── theme.png
│ │ │ ├── wave.md
│ │ │ ├── RadialBar.md
│ │ │ ├── scatter.md
│ │ │ ├── Pie.md
│ │ │ ├── index.js
│ │ │ ├── polarBar.md
│ │ │ ├── radar.md
│ │ │ ├── funnel-api.md
│ │ │ ├── area-api.md
│ │ │ ├── Gauge.md
│ │ │ └── line-api.md
│ │ ├── plugins
│ │ │ ├── index.js
│ │ │ ├── Tooltip.md
│ │ │ ├── Axis.md
│ │ │ └── Legend.md
│ │ ├── plot.md
│ │ ├── theme.md
│ │ ├── routes.js
│ │ └── chart.md
│ ├── plugin
│ │ ├── axis
│ │ │ ├── routes.js
│ │ │ ├── axis-alone.md
│ │ │ ├── axis-style.md
│ │ │ └── axis-default.md
│ │ ├── legend
│ │ │ ├── layout-vertical.md
│ │ │ ├── position.md
│ │ │ ├── layout-horizontal.md
│ │ │ ├── routes.js
│ │ │ ├── basic.md
│ │ │ ├── layout.md
│ │ │ └── personalise.md
│ │ ├── tooltip
│ │ │ ├── routes.js
│ │ │ ├── basic.md
│ │ │ ├── position.md
│ │ │ └── title.md
│ │ └── routes.js
│ └── more
│ │ ├── index.vue
│ │ ├── routes.js
│ │ ├── pie
│ │ ├── normal.md
│ │ ├── line.md
│ │ └── donut.md
│ │ ├── radar
│ │ ├── easy.md
│ │ └── pointStyle.md
│ │ ├── test
│ │ ├── line.md
│ │ ├── style.md
│ │ ├── axis.md
│ │ └── dom.md
│ │ ├── list.vue
│ │ ├── line
│ │ ├── endPoint.md
│ │ └── axisLine.md
│ │ ├── scatter
│ │ └── safe.md
│ │ ├── bar
│ │ ├── noAxis.md
│ │ ├── cutBar.md
│ │ └── textureBar.md
│ │ └── polarBar
│ │ └── stackPolarBar.md
├── utils
│ ├── generateCommonPage.js
│ └── index.js
├── index.js
├── iframe.html
├── components
│ ├── code-copy.svg
│ ├── play.svg
│ ├── down.svg
│ ├── recovery.svg
│ ├── search.svg
│ └── full-screen.svg
├── router
│ └── index.js
├── styles
│ └── index.scss
└── App.vue
├── .gitignore
├── lib
├── utils
│ ├── ellipse2path.js
│ ├── scaleLinear.js
│ ├── getLinePoint.js
│ ├── color.js
│ └── getStyle.js
├── base
│ ├── platform.js
│ ├── mixin.js
│ ├── BasePlugin.js
│ └── BaseVisual.js
├── index.js
└── visuals
│ └── Area
│ └── index.js
├── src
├── utils
│ ├── ellipse2path.js
│ ├── getLinePoint.js
│ ├── scaleLinear.js
│ ├── color.js
│ ├── getStyle.js
│ └── Point.js
├── base
│ ├── platform.js
│ ├── BasePlugin.js
│ ├── BaseVisual.js
│ └── mixin.js
├── visuals
│ └── Area
│ │ └── index.js
└── index.js
├── .eslintrc.js
├── docs
├── 1.js
├── 56.js
├── 2.js
├── 63.js
├── 48.js
└── 61.js
├── babel.config.js
├── LICENSE
└── README.md
/website/views/demo/Gauge/label.md:
--------------------------------------------------------------------------------
1 | ## 文字
2 |
--------------------------------------------------------------------------------
/.gitignore:
--------------------------------------------------------------------------------
1 | node_modules
2 | */node_modules
3 |
4 | *.vscode
5 |
--------------------------------------------------------------------------------
/website/views/doc/api/theme.png:
--------------------------------------------------------------------------------
https://raw.githubusercontent.com/qcharts/core/HEAD/website/views/doc/api/theme.png
--------------------------------------------------------------------------------
/website/views/demo/VisualLink/routes.js:
--------------------------------------------------------------------------------
1 | export default [
2 | {
3 | title: '',
4 | path: '',
5 | redirect: 'default'
6 | },
7 | {
8 | title: 'visual 联动',
9 | path: 'default',
10 | component: () => import('./basic.md')
11 | }
12 | ]
13 |
--------------------------------------------------------------------------------
/lib/utils/ellipse2path.js:
--------------------------------------------------------------------------------
1 | //通过圆生成path
2 | function ellipse2path(cx, cy, rx, ry) {
3 | //非数值单位计算,如当宽度像100%则移除
4 | if (isNaN(cx - cy + rx - ry)) return;
5 | var path = 'M' + (cx - rx) + ' ' + cy + 'a' + rx + ' ' + ry + ' 0 1 0 ' + 2 * rx + ' 0' + 'a' + rx + ' ' + ry + ' 0 1 0 ' + -2 * rx + ' 0' + 'z';
6 | return path;
7 | }
8 |
9 | export default ellipse2path;
--------------------------------------------------------------------------------
/src/utils/ellipse2path.js:
--------------------------------------------------------------------------------
1 | //通过圆生成path
2 | function ellipse2path(cx, cy, rx, ry) {
3 | //非数值单位计算,如当宽度像100%则移除
4 | if (isNaN(cx - cy + rx - ry)) return
5 | var path = 'M' + (cx - rx) + ' ' + cy + 'a' + rx + ' ' + ry + ' 0 1 0 ' + 2 * rx + ' 0' + 'a' + rx + ' ' + ry + ' 0 1 0 ' + -2 * rx + ' 0' + 'z'
6 | return path
7 | }
8 | export default ellipse2path
9 |
--------------------------------------------------------------------------------
/website/views/demo/Wave/routes.js:
--------------------------------------------------------------------------------
1 | export default [
2 | {
3 | title: '',
4 | path: '',
5 | redirect: 'default'
6 | },
7 | {
8 | title: '基本使用',
9 | path: 'default',
10 | component: () => import('./basic.md')
11 | },
12 | {
13 | title: '自定义',
14 | path: 'shape',
15 | component: () => import('./shape.md')
16 | }
17 | ]
18 |
--------------------------------------------------------------------------------
/website/views/demo/WordCloud/routes.js:
--------------------------------------------------------------------------------
1 | export default [
2 | {
3 | title: '',
4 | path: '',
5 | redirect: 'default'
6 | },
7 | {
8 | title: '基本使用',
9 | path: 'default',
10 | component: () => import('./basic.md')
11 | },
12 | {
13 | title: '图片遮罩',
14 | path: 'imageMask',
15 | component: () => import('./imageMask.md')
16 | }
17 | ]
18 |
--------------------------------------------------------------------------------
/website/views/demo/Funnel/routes.js:
--------------------------------------------------------------------------------
1 | export default [
2 | {
3 | title: '',
4 | path: '',
5 | redirect: 'default'
6 | },
7 | {
8 | title: '基础图',
9 | path: 'default',
10 | component: () => import('./funnel-default.md')
11 | },
12 | {
13 | title: '其他',
14 | path: 'others',
15 | component: () => import('./funnel-others.md')
16 | }
17 | ]
18 |
--------------------------------------------------------------------------------
/website/utils/generateCommonPage.js:
--------------------------------------------------------------------------------
1 | import Vue from 'vue'
2 |
3 | export default function(prefix, routes) {
4 | return Vue.component(
5 | prefix.replace(/(\/)\w+/g, m => m.toUpperCase()).replace(/\//g, ''),
6 | {
7 | data() {
8 | return { prefix, routes }
9 | },
10 | render(h) {
11 | return h('router-view')
12 | }
13 | }
14 | )
15 | }
16 |
--------------------------------------------------------------------------------
/.eslintrc.js:
--------------------------------------------------------------------------------
1 | module.exports = {
2 | root: true,
3 | parser: 'babel-eslint',
4 | parserOptions: {
5 | //设置"script"(默认)或"module"如果你的代码是在ECMAScript中的模块。
6 | sourceType: 'module'
7 | },
8 | env: {
9 | browser: true
10 | },
11 | globals: {},
12 | // add your custom rules here
13 | rules: {
14 | 'newline-per-chained-call': 'off',
15 | camelcase: 'off'
16 | }
17 | }
18 |
--------------------------------------------------------------------------------
/website/index.js:
--------------------------------------------------------------------------------
1 | import Vue from 'vue'
2 | import router from './router'
3 | import App from './App.vue'
4 | import BlockDemo from './components/BlockDemo.vue'
5 | //import 'bootstrap/dist/css/bootstrap.css'
6 | import 'highlight.js/styles/xcode.css'
7 | Vue.config.productionTip = false
8 | Vue.component('block-demo', BlockDemo)
9 | new Vue({
10 | render: h => h(App),
11 | router
12 | }).$mount('#app')
13 |
--------------------------------------------------------------------------------
/src/base/platform.js:
--------------------------------------------------------------------------------
1 | export const isWeiXin = () => {
2 | return typeof wx !== 'undefined' && typeof wx.getSystemInfoSync === 'function'
3 | }
4 |
5 | export const getGlobal = () => {
6 | if (isWeiXin()) return getApp()
7 | if (typeof self !== 'undefined') return self
8 | if (typeof window !== 'undefined') return window
9 | if (typeof global !== 'undefined') return global
10 | throw new Error(`unable to locate global object`)
11 | }
12 |
13 | export const platform = getGlobal()
14 |
--------------------------------------------------------------------------------
/src/visuals/Area/index.js:
--------------------------------------------------------------------------------
1 | import Line from '../Line'
2 | import { deepObjectMerge } from '@qcharts/utils'
3 | class Area extends Line {
4 | constructor(attrs) {
5 | super(attrs)
6 | this.type = 'area'
7 | }
8 | defaultAttrs() {
9 | return deepObjectMerge({}, super.defaultAttrs(), {
10 | stack: true,
11 | animation: {
12 | duration: 700,
13 | easing: 'bounceOut'
14 | },
15 | layer: 'area'
16 | })
17 | }
18 | }
19 | export default Area
20 |
--------------------------------------------------------------------------------
/website/views/plugin/axis/routes.js:
--------------------------------------------------------------------------------
1 | export default [
2 | {
3 | title: '',
4 | path: '',
5 | redirect: 'default'
6 | },
7 | {
8 | title: '基础坐标轴',
9 | path: 'default',
10 | component: () => import('./axis-default.md')
11 | },
12 | {
13 | title: '坐标轴样式',
14 | path: 'style',
15 | component: () => import('./axis-style.md')
16 | },
17 | {
18 | title: '单独使用',
19 | path: 'alone',
20 | component: () => import('./axis-alone.md')
21 | },
22 | ]
23 |
--------------------------------------------------------------------------------
/lib/base/platform.js:
--------------------------------------------------------------------------------
1 | export var isWeiXin = function isWeiXin() {
2 | return typeof wx !== 'undefined' && typeof wx.getSystemInfoSync === 'function';
3 | };
4 | export var getGlobal = function getGlobal() {
5 | if (isWeiXin()) return getApp();
6 | if (typeof self !== 'undefined') return self;
7 | if (typeof window !== 'undefined') return window;
8 | if (typeof global !== 'undefined') return global;
9 | throw new Error("unable to locate global object");
10 | };
11 | export var platform = getGlobal();
--------------------------------------------------------------------------------
/website/views/demo/Gauge/default.md:
--------------------------------------------------------------------------------
1 | ## Basic Gauge 仪表盘
2 |
3 | :::demo
4 |
5 | ```javascript
6 |
7 | const { Chart, Gauge } = qcharts
8 |
9 | const chart = new Chart({ container: '#app' })
10 |
11 | const gauge = new Gauge({
12 | min: 0,
13 | max: 100,
14 | percent:60,
15 | lineWidth: 20,
16 | tickStep: 10
17 | })
18 |
19 | gauge.style('title', { fontSize: 36 })
20 |
21 | chart.append(gauge)
22 |
23 | setTimeout(() => {
24 | gauge.attr({percent:45})
25 | }, 3000)
26 | ```
27 |
28 | :::
29 |
--------------------------------------------------------------------------------
/website/views/demo/radialBar/routes.js:
--------------------------------------------------------------------------------
1 | export default [
2 | {
3 | title: '',
4 | path: '',
5 | redirect: 'default'
6 | },
7 | {
8 | title: '玉玦图',
9 | path: 'default',
10 | component: () => import('./radialBar.md')
11 | },
12 |
13 | // {
14 | // title: '更多例子',
15 | // path: 'more',
16 | // component: () => import('./example.md')
17 | // },
18 |
19 | // {
20 | // title: 'TODO',
21 | // path: 'todo',
22 | // component: () => import('./todo.md')
23 | // }
24 | ]
25 |
--------------------------------------------------------------------------------
/src/utils/getLinePoint.js:
--------------------------------------------------------------------------------
1 | /**
2 | * 获取直线上到point1距离为d的点坐标
3 | * @param {*} point1 直线开始坐标
4 | * @param {*} point2 直线结束坐标
5 | * @param {*} distance 直线上一点到point1点的距离
6 | */
7 | function getPointByDistance(point1, point2, distance) {
8 | const [x1, y1] = point1
9 | const [x2, y2] = point2
10 | const r = Math.sqrt((x1 - x2) * (x1 - x2) + (y1 - y2) * (y1 - y2))
11 | const x = (distance * (x2 - x1)) / r + x1
12 | const y = (distance * (y2 - y1)) / r + y1
13 | return [x, y]
14 | }
15 | export default getPointByDistance
16 |
--------------------------------------------------------------------------------
/website/views/more/index.vue:
--------------------------------------------------------------------------------
1 |
2 |
3 |
4 |
5 |
6 |
7 |
11 |
12 |
--------------------------------------------------------------------------------
/website/views/doc/plugins/index.js:
--------------------------------------------------------------------------------
1 | export default [
2 | {
3 | title: '',
4 | path: '',
5 | redirect: 'legend'
6 | },
7 |
8 | {
9 | title: 'Legend',
10 | path: 'legend',
11 | component: () => import('./Legend.md')
12 | },
13 | {
14 | title: 'Axis',
15 | path: 'axis',
16 | component: () => import('./Axis.md')
17 | },
18 | {
19 | title: 'Tooltip',
20 | path: 'tooltip',
21 | component: () => import('./Tooltip.md')
22 | },
23 | {
24 | title: 'Point',
25 | path: 'Point',
26 | component: () => import('./Point.md')
27 | }
28 | ]
29 |
--------------------------------------------------------------------------------
/website/views/demo/Area/routes.js:
--------------------------------------------------------------------------------
1 | export default [
2 | {
3 | title: '',
4 | path: '',
5 | redirect: 'default'
6 | },
7 | {
8 | title: '基础面积图',
9 | path: 'default',
10 | component: () => import('./area-default.md')
11 | },
12 | {
13 | title: '堆叠面积图',
14 | path: 'stack',
15 | component: () => import('./area-stack.md')
16 | },
17 | {
18 | title: '区间面积图',
19 | path: 'range',
20 | component: () => import('./area-range.md')
21 | },
22 | {
23 | title: '其它',
24 | path: 'others',
25 | component: () => import('./area-others.md')
26 | }
27 | ]
28 |
--------------------------------------------------------------------------------
/website/views/plugin/legend/layout-vertical.md:
--------------------------------------------------------------------------------
1 | :::demo
2 |
3 | ```javascript
4 | const data = Array.from({ length: 40 }, (_, i) => {
5 | return { value: 2000 + i }
6 | })
7 | const { Chart, Legend } = qcharts
8 |
9 | const chart = new Chart({ container: '#app' })
10 |
11 | chart.source(data, {
12 | text: 'value'
13 | })
14 |
15 | const l2 = new Legend({ orient: 'vertical', align: ['left', 'top'] })
16 | const l3 = new Legend({ orient: 'vertical', align: ['center', 'top'] })
17 | const l4 = new Legend({ orient: 'vertical', align: ['right', 'top'] })
18 |
19 | chart.append([l2, l3, l4])
20 | ```
21 |
22 | :::
23 |
--------------------------------------------------------------------------------
/website/views/demo/Bar/routes.js:
--------------------------------------------------------------------------------
1 | export default [
2 | {
3 | title: '',
4 | path: '',
5 | redirect: 'default'
6 | },
7 | {
8 | title: '基础条形图',
9 | path: 'default',
10 | component: () => import('./default-bar.md')
11 | },
12 | {
13 | title: '分组条形图',
14 | path: 'group',
15 | component: () => import('./group-bar.md')
16 | },
17 | {
18 | title: '堆叠条形图',
19 | path: 'stack',
20 | component: () => import('./stack-bar.md')
21 | }
22 | // {
23 | // title: '数据更新',
24 | // path: 'update',
25 | // component: () => import('./update-bar.md')
26 | // }
27 | ]
28 |
--------------------------------------------------------------------------------
/website/views/demo/scatter/index.js:
--------------------------------------------------------------------------------
1 | export default [
2 | {
3 | title: '',
4 | path: '',
5 | redirect: 'scatter'
6 | },
7 | {
8 | title: '基础散点图',
9 | path: 'scatter',
10 | component: () => import('./scatter.md')
11 | },
12 | {
13 | title: '散点图数据更新',
14 | path: 'scatter_update',
15 | component: () => import('./scatter_update.md')
16 | },
17 | {
18 | title: '气泡图',
19 | path: 'bubble',
20 | component: () => import('./bubble.md')
21 | },
22 | {
23 | title: '文本气泡图',
24 | path: 'bubble2',
25 | component: () => import('./bubble2.md')
26 | }
27 | ]
28 |
--------------------------------------------------------------------------------
/src/base/BasePlugin.js:
--------------------------------------------------------------------------------
1 | import Base from './Base'
2 | import theme from '../theme/default'
3 | import { deepObjectMerge } from '@qcharts/utils'
4 | import filterClone from 'filter-clone'
5 | export default class BasePlugin extends Base {
6 | constructor(attrs) {
7 | super(attrs)
8 | this.theme = theme.plugins[this.constructorName]
9 | //如果当前对象设置了theme,不继承theme
10 | this.theme.set = obj => {
11 | if (this.theme === theme.plugins[this.constructorName]) {
12 | this.theme = filterClone(this.theme)
13 | }
14 | this.theme = deepObjectMerge({}, this.theme, obj)
15 | }
16 | }
17 | }
18 |
--------------------------------------------------------------------------------
/src/base/BaseVisual.js:
--------------------------------------------------------------------------------
1 | import Base from './Base'
2 | import theme from '../theme/default'
3 | import { deepObjectMerge } from '@qcharts/utils'
4 | import filterClone from 'filter-clone'
5 | export default class BaseVisual extends Base {
6 | constructor(attrs) {
7 | super(attrs)
8 | this.theme = theme.visuals[this.constructorName]
9 | //如果当前对象设置了theme,不继承theme
10 | this.theme.set = obj => {
11 | if (this.theme === theme.visuals[this.constructorName]) {
12 | this.theme = filterClone(this.theme)
13 | }
14 | this.theme = deepObjectMerge({}, this.theme, obj)
15 | }
16 | }
17 | }
18 |
--------------------------------------------------------------------------------
/website/views/demo/Column/routes.js:
--------------------------------------------------------------------------------
1 | export default [
2 | {
3 | title: '',
4 | path: '',
5 | redirect: 'default'
6 | },
7 |
8 | {
9 | title: '基础柱状图',
10 | path: 'default',
11 | component: () => import('./default-column.md')
12 | },
13 | {
14 | title: '分组柱状图',
15 | path: 'group',
16 | component: () => import('./group-column.md')
17 | },
18 | {
19 | title: '堆叠柱状图',
20 | path: 'stack',
21 | component: () => import('./stack-column.md')
22 | },
23 | {
24 | title: '其他',
25 | path: 'others',
26 | component: () => import('./others-column.md')
27 | }
28 | ]
29 |
--------------------------------------------------------------------------------
/website/views/demo/Gauge/routes.js:
--------------------------------------------------------------------------------
1 | export default [
2 | {
3 | title: '',
4 | path: '',
5 | redirect: 'default'
6 | },
7 | {
8 | title: '仪表盘',
9 | path: 'default',
10 | component: () => import('./default.md')
11 | },
12 |
13 | {
14 | title: '刻度调整',
15 | path: 'tick',
16 | component: () => import('./tick.md')
17 | },
18 |
19 | // // {
20 | // // title: '文字调整',
21 | // // path: 'label',
22 | // // component: () => import('./label.md')
23 | // // },
24 |
25 | {
26 | title: '数据更新',
27 | path: 'other',
28 | component: () => import('./pointer.md')
29 | }
30 | ]
31 |
--------------------------------------------------------------------------------
/website/views/demo/PolarBar/routes.js:
--------------------------------------------------------------------------------
1 | export default [
2 | {
3 | title: "",
4 | path: "",
5 | redirect: "default",
6 | },
7 |
8 | {
9 | title: "基础图",
10 | path: "default",
11 | component: () => import("./default-polarBar.md"),
12 | },
13 | {
14 | title: "分组图",
15 | path: "group",
16 | component: () => import("./group-polarBar.md"),
17 | },
18 | {
19 | title: "堆叠图",
20 | path: "stack",
21 | component: () => import("./stack-polarBar.md"),
22 | },
23 | {
24 | title: "其他",
25 | path: "others",
26 | component: () => import("./others-polarBar.md"),
27 | },
28 | ];
29 |
--------------------------------------------------------------------------------
/website/views/demo/Wave/basic.md:
--------------------------------------------------------------------------------
1 | ## 基本使用
2 |
3 | :::demo
4 |
5 | ```javascript
6 | const { Chart, Wave } = qcharts
7 | const chart = new Chart({ container: '#app' })
8 | const wave = new Wave({
9 | animation: {
10 | duration: 500
11 | },
12 | radius: 200,
13 | percent: 65,
14 | // 格式化文本
15 | formatter: per => {
16 | return '总占比:' + per + '%'
17 | }
18 | })
19 | // 波浪颜色
20 | wave.style('wave', {
21 | fillColor: '#1890ff',
22 | strokeColor: '#1477d4'
23 | })
24 | // 背景图形颜色
25 | wave.style('shape', {
26 | fillColor: '#d3eaff'
27 | })
28 | // 文字颜色
29 | wave.style('text', {
30 | fillColor: '#fff'
31 | })
32 | chart.append(wave)
33 | ```
34 |
35 | :::
36 |
--------------------------------------------------------------------------------
/src/utils/scaleLinear.js:
--------------------------------------------------------------------------------
1 | function scaleLinear() {
2 | let domain = [0, 1]
3 | let range = [0, 1]
4 | function scale(num) {
5 | let disDomain = domain[1] - domain[0]
6 | let disRange = range[1] - range[0]
7 | let per = (num - domain[0]) / disDomain || 0
8 | return range[0] + disRange * per
9 | }
10 | scale.domain = function(arr) {
11 | domain = arr
12 | return this
13 | }
14 | scale.range = function(arr) {
15 | range = arr
16 | return this
17 | }
18 | return scale
19 | }
20 |
21 | // const data = [80, 40, 30, 60, 70]
22 | // const s = scaleLinear().domain([0, 100]).range([0, 100])
23 | // console.log(data.map(s))
24 |
25 | export { scaleLinear }
26 |
--------------------------------------------------------------------------------
/website/views/more/routes.js:
--------------------------------------------------------------------------------
1 | const routes = []
2 | // 根据文件夹中的 markdown文件自动生成路由
3 | const contexts = require.context('.', true, /\.md$/)
4 |
5 | contexts.keys().forEach(key => {
6 | const dirName = key.substring(key.indexOf('/') + 1, key.lastIndexOf('/'))
7 | const fileName = key.substring(key.lastIndexOf('/') + 1, key.lastIndexOf('.'))
8 | if (fileName && fileName !== '') {
9 | routes.push({
10 | path: `${dirName}-${fileName}`,
11 | // https://github.com/webpack/webpack/issues/6680
12 | component: () => import('./' + key.replace('./', ''))
13 | })
14 | }
15 | })
16 | routes.push({
17 | path: '',
18 | component: () => import('./list.vue')
19 | })
20 | export default routes
21 |
--------------------------------------------------------------------------------
/lib/utils/scaleLinear.js:
--------------------------------------------------------------------------------
1 | function scaleLinear() {
2 | var domain = [0, 1];
3 | var range = [0, 1];
4 |
5 | function scale(num) {
6 | var disDomain = domain[1] - domain[0];
7 | var disRange = range[1] - range[0];
8 | var per = (num - domain[0]) / disDomain || 0;
9 | return range[0] + disRange * per;
10 | }
11 |
12 | scale.domain = function (arr) {
13 | domain = arr;
14 | return this;
15 | };
16 |
17 | scale.range = function (arr) {
18 | range = arr;
19 | return this;
20 | };
21 |
22 | return scale;
23 | } // const data = [80, 40, 30, 60, 70]
24 | // const s = scaleLinear().domain([0, 100]).range([0, 100])
25 | // console.log(data.map(s))
26 |
27 |
28 | export { scaleLinear };
--------------------------------------------------------------------------------
/website/views/doc/plugins/Tooltip.md:
--------------------------------------------------------------------------------
1 | ### 插件介绍
2 |
3 | Tooltip, 提示框。
4 |
5 | ### attrs
6 |
7 | | 属性名 | 类型 | 默认值 | 描述 |
8 | | --------- | ------------------ | -------- | ---------------------------- |
9 | | title | String \| Function | `null` | 标题 |
10 | | formatter | Function | `d => d` | 除标题外,其他文本格式化函数 |
11 |
12 | ### style
13 |
14 | ```javascript
15 | const tooltip = new Tooltip()
16 | tooltip.style('text', { color: '#fff' }
17 | ```
18 |
19 | 组件中可以自定义 css 属性的元素如下表:
20 |
21 | | 名称 | 基础类型 | 描述 |
22 | | ----- | --------- | ------------- |
23 | | title | 文本 | html 文本样式 |
24 | | point | html 容器 | html 容器样式 |
25 | | text | 文本 | html 文本样式 |
26 |
--------------------------------------------------------------------------------
/lib/utils/getLinePoint.js:
--------------------------------------------------------------------------------
1 | import _slicedToArray from "@babel/runtime/helpers/slicedToArray";
2 |
3 | /**
4 | * 获取直线上到point1距离为d的点坐标
5 | * @param {*} point1 直线开始坐标
6 | * @param {*} point2 直线结束坐标
7 | * @param {*} distance 直线上一点到point1点的距离
8 | */
9 | function getPointByDistance(point1, point2, distance) {
10 | var _point = _slicedToArray(point1, 2),
11 | x1 = _point[0],
12 | y1 = _point[1];
13 |
14 | var _point2 = _slicedToArray(point2, 2),
15 | x2 = _point2[0],
16 | y2 = _point2[1];
17 |
18 | var r = Math.sqrt((x1 - x2) * (x1 - x2) + (y1 - y2) * (y1 - y2));
19 | var x = distance * (x2 - x1) / r + x1;
20 | var y = distance * (y2 - y1) / r + y1;
21 | return [x, y];
22 | }
23 |
24 | export default getPointByDistance;
--------------------------------------------------------------------------------
/src/base/mixin.js:
--------------------------------------------------------------------------------
1 | const lifeCycle = {
2 | beforeCreate: 'beforeCreate', //创建前
3 | created: 'created', // 图表创建
4 | beforeRender: 'beforeRender', //图表渲染前
5 | rendered: 'rendered', // 图表渲染结束
6 | beforeUpdate: 'beforeUpdate', // 图表更新前
7 | updated: 'updated', // 图表更新
8 | beforeDestroy: 'beforeDestroy', // 图表卸载前
9 | destroyed: 'destroyed' // 图表卸载
10 | }
11 | function mixin(component) {
12 | component.on = component.addEventListener
13 | component.off = component.removeEventListener
14 | component.once = function(type, fn) {
15 | const listener = (...args) => {
16 | fn.apply(this, args)
17 | this.off(type, listener)
18 | }
19 | return this.on(type, listener)
20 | }
21 | }
22 |
23 | export { lifeCycle, mixin }
24 |
--------------------------------------------------------------------------------
/website/views/plugin/tooltip/routes.js:
--------------------------------------------------------------------------------
1 | export default [
2 | {
3 | title: '',
4 | path: '',
5 | redirect: 'default'
6 | },
7 | {
8 | title: '基本使用',
9 | path: 'default',
10 | component: () => import('./basic.md')
11 | },
12 | {
13 | title: '标题设置',
14 | path: 'title',
15 | component: () => import('./title.md')
16 | },
17 | {
18 | title: '位置固定',
19 | path: 'position',
20 | component: () => import('./position.md')
21 | }
22 |
23 | // {
24 | // title: '布局调整',
25 | // path: 'layout',
26 | // component: () => import('./layout.md')
27 | // },
28 |
29 | // {
30 | // title: '自定义',
31 | // path: 'personalise',
32 | // component: () => import('./personalise.md')
33 | // }
34 | ]
35 |
--------------------------------------------------------------------------------
/website/views/doc/api/wave.md:
--------------------------------------------------------------------------------
1 | ### 图表介绍
2 |
3 | Wave, 水波图
4 |
5 | ### 属性 attr
6 |
7 | | 名称 | 说明 | 默认值 |
8 | | ---------- | ---------- | ------------------------------------ |
9 | | clientRect | Object | {top,right,bottom,left,width,height} | 设置了 width,heigh,优先与 bottom,right |
10 | | percent | 百分比 | |
11 | | animation | 动画配置 | |
12 | | formatter | 文本格式化 | `(fn: Function)` | `d => d` |
13 |
14 | ### 样式
15 |
16 | 组件中可以自定义 css 属性的元素如下表:
17 |
18 | | 名称 | 基础类型 | 描述 |
19 | | ----- | -------- | -------------- |
20 | | wave | 面 | 水波图形的样式 |
21 | | shape | 面 | 水波背景的样式 |
22 | | text | 文本 | 文本的样式 |
23 |
--------------------------------------------------------------------------------
/website/views/plugin/legend/position.md:
--------------------------------------------------------------------------------
1 | ## 位置调整
2 |
3 | `Legend` 提供了 `top` 和 `left` 两种分别用于调整 **距离顶端** 和 **距离左端** 的距离的方法。传入要调整的数字或百分比即可。
4 |
5 | :::demo
6 |
7 | ```javascript
8 | const data = [
9 | { value: 3350, label: '直接访问' },
10 | { value: 3100, label: '邮件营销' },
11 | { value: 2340, label: '联盟广告' },
12 | { value: 1350, label: '视频广告' },
13 | { value: 1548, label: '搜索引擎' }
14 | ]
15 |
16 | const { Chart, Legend } = qcharts
17 |
18 | const chart = new Chart({ container: '#app' })
19 |
20 | const pie = new qcharts.Pie({
21 | radius: 0.6
22 | })
23 | .source(data)
24 | .setDataFields({ x: 'label', y: 'value' })
25 |
26 | const legend = new Legend()
27 | legend.top(50)
28 | legend.left('80%')
29 |
30 | chart.append(pie).add(legend)
31 | ```
32 |
33 | :::
34 |
--------------------------------------------------------------------------------
/website/views/demo/Map/routes.js:
--------------------------------------------------------------------------------
1 | export default [
2 | {
3 | title: '',
4 | path: '',
5 | redirect: 'default'
6 | },
7 | {
8 | title: '地图',
9 | path: 'default',
10 | component: () => import('./map.md')
11 | },
12 | {
13 | title: '交互组件-散点',
14 | path: 'component-scatter',
15 | component: () => import('./component-scatter.md')
16 | },
17 |
18 | {
19 | title: '交互组件-文字',
20 | path: 'component-label',
21 | component: () => import('./component-label.md')
22 | },
23 |
24 | {
25 | title: '交互组件-飞线',
26 | path: 'component-flyline',
27 | component: () => import('./component-flyline.md')
28 | },
29 |
30 | {
31 | title: '投影类型',
32 | path: 'projection',
33 | component: () => import('./projection.md')
34 | }
35 | ]
36 |
--------------------------------------------------------------------------------
/website/views/plugin/legend/layout-horizontal.md:
--------------------------------------------------------------------------------
1 | :::demo
2 |
3 | ```javascript
4 | const data = [2000, 2001, 2002, 2003, 2004, 2005, 2006, 2007, 2008, 2009, 2010, 2011, 2012, 2013, 2014, 2015, 2016, 2017, 2018, 2019, 2020, 2021, 2022, 2023, 2024, 2025, 2026, 2027, 2028, 2029, 2030].map((num) => {
5 | return {
6 | value: num
7 | }
8 | })
9 | const { Chart, Legend } = qcharts
10 |
11 | const chart = new Chart({ container: '#app' })
12 |
13 | chart.source(data, {
14 | value: 'value'
15 | })
16 |
17 | const l2 = new Legend({ orient: 'horizontal', align: ['left', 'top'] })
18 | const l3 = new Legend({ orient: 'horizontal', align: ['left', 'center'] })
19 | const l4 = new Legend({ orient: 'horizontal', align: ['left', 'bottom'] })
20 |
21 | chart.append([l2, l3, l4])
22 | ```
23 |
24 | :::
25 |
--------------------------------------------------------------------------------
/website/iframe.html:
--------------------------------------------------------------------------------
1 |
2 |
3 |
4 |
5 |
6 |
7 | QCharts
8 |
15 |
16 |
17 |
18 |
19 |
20 |
25 |
26 |
27 |
--------------------------------------------------------------------------------
/website/views/demo/PolarBar/default-polarBar.md:
--------------------------------------------------------------------------------
1 | ## Nightingale Rose Chart 南丁格尔图
2 |
3 | :::demo
4 |
5 | ```javascript
6 | const data = [
7 | { value: 6100, label: "TOP1" },
8 | { value: 5200, label: "TOP2" },
9 | { value: 4400, label: "TOP3" },
10 | { value: 3700, label: "TOP4" },
11 | { value: 2800, label: "TOP5" },
12 | { value: 3000, label: "TOP6" },
13 | { value: 5300, label: "TOP7" },
14 | { value: 3400, label: "TOP8" },
15 | ]
16 | const { Chart, PolarBar, Tooltip } = qcharts
17 | const chart = new Chart({
18 | container: "#app",
19 | })
20 | chart.source(data, {
21 | value: "value",
22 | text: "label",
23 | })
24 | const bar = new PolarBar({
25 | innerRadius: 0.1,
26 | radius: 0.8,
27 | })
28 | const tooltip = new Tooltip()
29 | chart.append([bar, tooltip])
30 | ```
31 |
32 | :::
33 |
--------------------------------------------------------------------------------
/src/utils/color.js:
--------------------------------------------------------------------------------
1 | export function hexToRgba(hex, opacity) {
2 | // 16进制颜色转rgba
3 | if (/^rgba\(.+\)$/.test(hex)) {
4 | return hex
5 | } else if (/^#([A-Fa-f0-9]{3}){1,2}$/.test(hex)) {
6 | let c = hex.substring(1).split('')
7 | if (c.length === 3) {
8 | c = [c[0], c[0], c[1], c[1], c[2], c[2]]
9 | }
10 | c = '0x' + c.join('')
11 | return 'rgba(' + [(c >> 16) & 255, (c >> 8) & 255, c & 255].join(',') + ',' + opacity + ')'
12 | } else {
13 | console.warn('Bad Hex>>>' + hex)
14 | }
15 | }
16 | export function randomHexColor() {
17 | // 随机生成十六进制颜色
18 | let random = Math.floor(Math.random() * 16777216).toString(16) // 生成ffffff以内16进制数
19 | while (random.length < 6) {
20 | // while循环判断hex位数,少于6位前面加0凑够6位
21 | random = `0${random}`
22 | }
23 | return `#${random}`
24 | }
25 |
--------------------------------------------------------------------------------
/website/views/demo/pie/arcPie.md:
--------------------------------------------------------------------------------
1 | ## 弧饼图
2 |
3 | 弧饼图继承至饼图,使用了不同的图形进行渲染。
4 |
5 | :::demo
6 |
7 | ```javascript
8 | const data = [
9 | {
10 | type: '污染源',
11 | count: 4454
12 | },
13 |
14 | {
15 | type: '消防场所',
16 | count: 1239
17 | },
18 |
19 | {
20 | type: '安全生产',
21 | count: 3758
22 | },
23 |
24 | {
25 | type: '治安场所',
26 | count: 4300
27 | }
28 | ]
29 |
30 | const { Chart, Pie, Legend } = qcharts
31 |
32 | const chart = new Chart({
33 | container: '#app'
34 | })
35 |
36 | chart.source(data, {
37 | row: 'type',
38 | value: 'count'
39 | })
40 |
41 | const pie = new Pie({
42 | radius: 0.6,
43 | innerRadius: 0.1,
44 | startAngle: 180,
45 | endAngle: 360
46 | })
47 |
48 | const legend = new Legend()
49 |
50 | chart.append([pie, legend])
51 | ```
52 |
53 | :::
54 |
--------------------------------------------------------------------------------
/lib/utils/color.js:
--------------------------------------------------------------------------------
1 | export function hexToRgba(hex, opacity) {
2 | // 16进制颜色转rgba
3 | if (/^rgba\(.+\)$/.test(hex)) {
4 | return hex;
5 | } else if (/^#([A-Fa-f0-9]{3}){1,2}$/.test(hex)) {
6 | var c = hex.substring(1).split('');
7 |
8 | if (c.length === 3) {
9 | c = [c[0], c[0], c[1], c[1], c[2], c[2]];
10 | }
11 |
12 | c = '0x' + c.join('');
13 | return 'rgba(' + [c >> 16 & 255, c >> 8 & 255, c & 255].join(',') + ',' + opacity + ')';
14 | } else {
15 | console.warn('Bad Hex>>>' + hex);
16 | }
17 | }
18 | export function randomHexColor() {
19 | // 随机生成十六进制颜色
20 | var random = Math.floor(Math.random() * 16777216).toString(16); // 生成ffffff以内16进制数
21 |
22 | while (random.length < 6) {
23 | // while循环判断hex位数,少于6位前面加0凑够6位
24 | random = "0".concat(random);
25 | }
26 |
27 | return "#".concat(random);
28 | }
--------------------------------------------------------------------------------
/website/views/more/pie/normal.md:
--------------------------------------------------------------------------------
1 | ## Donut Chart 动态环图
2 |
3 | :::demo
4 |
5 | ```javascript
6 | const data = [
7 | { name: '装备物资企业', value: 17 },
8 | { name: '通讯保障机构', value: 1 },
9 | { name: '存储仓库', value: 50 },
10 | { name: '医疗卫生机构', value: 182 },
11 | { name: '应急避难场所', value: 619 },
12 | { name: '运输机构', value: 1 }
13 | ]
14 | const length = data.length
15 | let counter = 0
16 | const { Chart, Pie, Legend } = qcharts
17 | const { Label } = spritejs
18 | const chart = new Chart({
19 | container: '#app'
20 | })
21 |
22 | chart.source(data, {
23 | row: 'name',
24 | value: 'value'
25 | })
26 |
27 | const pie = new Pie({
28 | startAngle: -90,
29 | endAngle: 270,
30 | innerRadius: 0.4,
31 | radius: 0.5,
32 | animation: { duration: 400 }
33 | })
34 | const legend = new Legend()
35 | chart.append([pie, legend])
36 | ```
37 |
38 | :::
39 |
--------------------------------------------------------------------------------
/website/views/plugin/routes.js:
--------------------------------------------------------------------------------
1 | import generateCommonPage from '../../utils/generateCommonPage'
2 | import AxisRoutes from './axis/routes'
3 | import LegendRoutes from './legend/routes'
4 | import TooltipRoutes from './tooltip/routes'
5 |
6 | export default [
7 | {
8 | title: '',
9 | path: '',
10 | redirect: 'axis'
11 | },
12 |
13 | {
14 | title: '坐标轴',
15 | path: 'axis',
16 | component: generateCommonPage('/plugin/axis/', AxisRoutes),
17 | children: AxisRoutes
18 | },
19 |
20 | {
21 | title: 'Legend',
22 | path: 'legend',
23 | component: generateCommonPage('/plugin/legend/', LegendRoutes),
24 | children: LegendRoutes
25 | },
26 |
27 | {
28 | title: 'Tooltip',
29 | path: 'tooltip',
30 | component: generateCommonPage('/plugin/tooltip/', TooltipRoutes),
31 | children: TooltipRoutes
32 | }
33 | ]
34 |
--------------------------------------------------------------------------------
/website/views/demo/pie/theme.md:
--------------------------------------------------------------------------------
1 | ## 主题切换
2 |
3 | :::demo
4 |
5 | ```javascript
6 | const data = [
7 | { value: 3350, label: '直接访问' },
8 | { value: 3100, label: '邮件营销' },
9 | { value: 2340, label: '联盟广告' },
10 | { value: 1350, label: '视频广告' },
11 | { value: 1548, label: '搜索引擎' }
12 | ]
13 |
14 | const chart = new qcharts.Chart({ container: '#app' })
15 |
16 | chart.setTheme('dark')
17 |
18 | const pie = new qcharts.Pie({
19 | radius: 0.6,
20 | innerRadius: 0.2
21 | })
22 | .source(data)
23 | .setDataFields({ x: 'label', y: 'value' })
24 |
25 | const step = () => {
26 | setTimeout(() => {
27 | chart.setTheme('default')
28 | setTimeout(() => {
29 | chart.setTheme('dark')
30 | requestAnimationFrame(step)
31 | }, 3000)
32 | }, 3000)
33 | }
34 |
35 | requestAnimationFrame(step)
36 |
37 | chart.append(pie)
38 | ```
39 |
40 | :::
41 |
--------------------------------------------------------------------------------
/website/views/doc/api/RadialBar.md:
--------------------------------------------------------------------------------
1 | ### 图表介绍
2 |
3 | RadialBar,玉玦图。
4 |
5 | ### attrs
6 |
7 | | 属性名 | 类型 | 默认值 | 描述 |
8 | | ------------- | ------ | ------ | ---------------- |
9 | | min | Number | `0` | 最小值 |
10 | | max | Number | `1` | 最大值 |
11 | | startAngle | Number | -90 | 起始角度 |
12 | | endAngle | Number | 270 | 结束角度 |
13 | | radius | Number | `0.8` | 外半径比例 |
14 | | innerRadius | Number | `0` | 内半径比例 |
15 | | strokeBgcolor | String | `#eee` | 背景圆弧的背景色 |
16 | | lineWidth | Number | `5` | 弧线宽度 |
17 |
18 | ### style
19 |
20 | 组件中可以自定义 css 属性的元素如下表:
21 |
22 | | 名称 | 基础类型 | 描述 |
23 | | --------- | -------- | ----------------- |
24 | | arc | 线 | 弧线样式 |
25 | | arc:hover | 线 | 弧线鼠标hover样式 |
26 |
27 |
--------------------------------------------------------------------------------
/website/views/demo/Gauge/pointer.md:
--------------------------------------------------------------------------------
1 | ### 指针调整
2 |
3 | 可以通过 `pointerWidth` 调整指针的宽度,值为`Number`或者`Array`。值若为`Array`,维度与 data 的维度保持一致;如果为`Number`则所有仪表盘的`pointerWidth`都为相同值。
4 |
5 | 指针支持通过 `style('pointer')`对颜色及属性进行修改
6 |
7 | :::demo
8 |
9 | ```javascript
10 |
11 | const { Chart, Gauge, Legend, Tooltip } = qcharts
12 |
13 | const chart = new Chart({ container: '#app' })
14 |
15 | const gauge = new Gauge({
16 | min: 0,
17 | max: 100,
18 | percent:45,
19 | lineWidth: 20,
20 | // 修改指针宽度
21 | pointerWidth: 10,
22 | tickStep: 10
23 | })
24 |
25 | gauge
26 | .style('title', { fontSize: 36 })
27 | .style('arc', { strokeColor: '#006666' })
28 | .style('pointer', { fillColor: '#006666' })
29 |
30 | chart.append(gauge)
31 |
32 | setInterval(() => {
33 | const val = (Math.random() * 100).toFixed(0)
34 | gauge.attr({
35 | percent:val
36 | })
37 | }, 3000)
38 | ```
39 |
40 | :::
41 |
--------------------------------------------------------------------------------
/website/views/plugin/axis/axis-alone.md:
--------------------------------------------------------------------------------
1 | ## 基础坐标轴
2 |
3 | 坐标轴组件会自己根据 chart 的 source 数据进行 layout 计算,并且进行默认布局,也会根据 chart 中的 visual 进行适配
4 |
5 | :::demo 基础坐标
6 |
7 | ```javascript
8 | const data = [
9 | { month: 'Jan', city: 'London', value: 3.9 },
10 | { month: 'Feb', city: 'London', value: 4.2 },
11 | { month: 'Mar', city: 'London', value: 5.7 },
12 | { month: 'Apr', city: 'London', value: 8.5 },
13 | { month: 'May', city: 'London', value: 11.9 },
14 | { month: 'Jun', city: 'London', value: 15.2 }
15 | ]
16 |
17 | const { Chart, Axis } = qcharts
18 |
19 | const chart = new Chart({
20 | container: '#app',
21 | size: ['100%', '100%']
22 | }).source(data, {
23 | row: 'city',
24 | value: 'value',
25 | text: 'month'
26 | })
27 |
28 | let xAxis = new Axis({ orient: 'bottom' })
29 | let yAxis = new Axis({ orient: 'left' })
30 |
31 | chart.append(xAxis).add(yAxis)
32 | ```
33 |
34 | :::
35 |
--------------------------------------------------------------------------------
/website/views/plugin/legend/routes.js:
--------------------------------------------------------------------------------
1 | export default [
2 | {
3 | title: '',
4 | path: '',
5 | redirect: 'default'
6 | },
7 | {
8 | title: '基本使用',
9 | path: 'default',
10 | component: () => import('./basic.md')
11 | },
12 | // {
13 | // title: '位置调整',
14 | // path: 'position',
15 | // component: () => import('./position.md')
16 | // },
17 |
18 | {
19 | title: '位置调整',
20 | path: 'layout',
21 | component: () => import('./layout.md')
22 | },
23 |
24 | {
25 | title: '水平分页',
26 | path: 'layout-horizontal',
27 | component: () => import('./layout-horizontal.md')
28 | },
29 |
30 | {
31 | title: '垂直分页',
32 | path: 'layout-vertical',
33 | component: () => import('./layout-vertical.md')
34 | }
35 |
36 | // {
37 | // title: '自定义',
38 | // path: 'personalise',
39 | // component: () => import('./personalise.md')
40 | // }
41 | ]
42 |
--------------------------------------------------------------------------------
/website/views/more/radar/easy.md:
--------------------------------------------------------------------------------
1 | ### 修改雷达图点形状
2 |
3 | :::demo
4 |
5 | ```javascript
6 | const data = [
7 | { date: '体力', category: '诸葛亮', sales: 100 },
8 | { date: '武力', category: '诸葛亮', sales: 69 },
9 | { date: '智力', category: '诸葛亮', sales: 100 },
10 | { date: '统帅', category: '诸葛亮', sales: 95 },
11 | { date: '魅力', category: '诸葛亮', sales: 95 },
12 | { date: '忠诚', category: '诸葛亮', sales: 100 }
13 | ]
14 |
15 | const { Chart, Radar, Legend, Tooltip } = qcharts
16 |
17 | const chart = new Chart({
18 | container: '#app'
19 | })
20 | chart.source(data, {
21 | row: 'category',
22 | value: 'sales',
23 | text: 'date'
24 | })
25 | const radar = new Radar().style('scale', false)
26 | radar.style('section', d => ({ opacity: 0.3 })).style('section:hover', d => ({ opacity: 0.5 }))
27 |
28 | const legend = new Legend({ align: ['center', '80%'] })
29 |
30 | chart.append([radar, legend, new Tooltip()])
31 | ```
32 |
33 | :::
34 |
--------------------------------------------------------------------------------
/docs/1.js:
--------------------------------------------------------------------------------
1 | (window.webpackJsonp_name_=window.webpackJsonp_name_||[]).push([[1],{144:function(e,t,n){var i=n(150);"string"==typeof i&&(i=[[e.i,i,""]]);var o={hmr:!0,transform:void 0,insertInto:void 0};n(17)(i,o);i.locals&&(e.exports=i.locals)},149:function(e,t,n){"use strict";n(144)},150:function(e,t,n){(e.exports=n(16)(!1)).push([e.i,".example-content{height:calc(100vh - 70px);padding-top:10px;padding-left:10px}.example-content section{height:100%}.example-content section h2{padding:10px}.example-content section .block-demo{margin-top:0;height:calc(100vh - 150px)}\n",""])},27:function(e,t,n){"use strict";n.r(t);var render=function(){var e=this.$createElement,t=this._self._c||e;return t("div",{staticClass:"example-content"},[t("router-view")],1)};render._withStripped=!0;var i={},o=(n(149),n(2)),a=Object(o.a)(i,render,[],!1,null,null,null);a.options.__file="website/views/more/index.vue";t.default=a.exports}}]);
2 | //# sourceMappingURL=1.js.map?v=d2f1c2b
--------------------------------------------------------------------------------
/website/views/plugin/tooltip/basic.md:
--------------------------------------------------------------------------------
1 | ## Tooltip
2 |
3 | 当实例化 `chart` 后,向 `chart` 添加 `Tooltip` 插件即可,`chart.append(new Tooltip())`。
4 |
5 | :::demo
6 |
7 | ```javascript
8 | const data = [1, 2, 3, 4, 5].map(num => {
9 | return { value: num }
10 | })
11 |
12 | const { Chart, Pie, Legend, Tooltip } = qcharts
13 |
14 | const chart = new Chart({
15 | container: '#app',
16 | size: ['100%', '100%']
17 | })
18 |
19 | chart.source(data, { value: 'value' })
20 |
21 | const pie = new Pie()
22 |
23 | const tooltip = new Tooltip({ formatter: d => d.value })
24 |
25 | chart.append([pie, tooltip])
26 | ```
27 |
28 | :::
29 |
30 | ### 属性
31 |
32 | | 属性名 | 类型 | 默认值 | 描述 |
33 | | --------- | ------------------ | -------- | ---------------------------- |
34 | | title | String \| Function | `null` | 标题 |
35 | | formatter | Function | `d => d` | 除标题外,其他文本格式化函数 |
36 |
--------------------------------------------------------------------------------
/babel.config.js:
--------------------------------------------------------------------------------
1 | // babel编译配置,导出es module
2 |
3 | module.exports = function(api) {
4 | const env = api.env()
5 |
6 | const getPragma = () => (env === 'wxapp' ? 'getApp().qcharts.h' : 'qcharts.h')
7 |
8 | const setting = {
9 | presets: [
10 | [
11 | '@babel/preset-env',
12 | {
13 | modules: env !== 'compile',// babel编译的时候保留 es module方式
14 | targets: {
15 | browsers: ['> 1%', 'last 2 versions', 'not ie <= 8']
16 | }
17 | }
18 | ]
19 | ],
20 | plugins: [
21 | '@babel/plugin-proposal-class-properties', // jsx 中需要,删除报错
22 | '@babel/plugin-proposal-object-rest-spread',
23 | [
24 | '@babel/plugin-transform-react-jsx',
25 | {
26 | pragma: getPragma()
27 | }
28 | ],
29 | 'inline-package-json',
30 | ['@babel/plugin-transform-runtime']
31 | ]
32 | }
33 |
34 | return setting
35 | }
36 |
--------------------------------------------------------------------------------
/website/views/more/pie/line.md:
--------------------------------------------------------------------------------
1 | ## Donut Chart 动态环图
2 |
3 | :::demo
4 |
5 | ```javascript
6 | const data = [
7 | { name: '存储仓库', value: 50 },
8 | { name: '装备物资企业', value: 17 },
9 | { name: '运输机构', value: 1 },
10 | { name: '通讯保障机构', value: 0 },
11 | { name: '医疗卫生机构', value: 182 },
12 | { name: '应急避难场所', value: 619 }
13 | ]
14 | const { Chart, Pie, Legend, Tooltip } = qcharts
15 |
16 | const chart = new Chart({
17 | container: '#app'
18 | })
19 |
20 | chart.source(data, {
21 | row: 'name',
22 | value: 'value'
23 | })
24 |
25 | const pie = new Pie({
26 | startAngle: -90,
27 | endAngle: 270,
28 | innerRadius: 0.4,
29 | radius: 0.7,
30 | clientRect: { top: '10%', left: '10%', right: '10%', bottom: '10%' }
31 | })
32 | pie.style('sector', { lineWidth: 1, strokeColor: '#fff' })
33 | pie.style('guideline', true)
34 | pie.style('guideText', { fontSize: '12px' })
35 | const legend = new Legend()
36 | chart.append([pie, legend])
37 | ```
38 |
39 | :::
40 |
--------------------------------------------------------------------------------
/website/views/plugin/tooltip/position.md:
--------------------------------------------------------------------------------
1 | ## 固定位置
2 |
3 | 使用 `Tooltip.position` 可以固定 `tooltip` 的位置。
4 |
5 | :::demo
6 |
7 | ```javascript
8 | const data = [
9 | { value: 1350, label: '直接访问' },
10 | { value: 2548, label: '搜索引擎' },
11 | { value: 3340, label: '联盟广告' },
12 | { value: 350, label: '视频广告' },
13 | { value: 2100, label: '邮件营销' }
14 | ]
15 |
16 | const { Chart, Pie, Legend, Tooltip } = qcharts
17 |
18 | const chart = new Chart({
19 | container: '#app',
20 | size: ['100%', '100%']
21 | })
22 |
23 | chart.source(data, { row: 'label', value: 'value' })
24 |
25 | const pie = new Pie()
26 |
27 | const tooltip = new Tooltip({ title: '网站流量来源', pos: ['0%', 20] })
28 | tooltip.style('background', () => ({ bgcolor: 'rgba(0, 0, 0, .5)' }))
29 | tooltip.style('title', () => ({ color: 'red' }))
30 | tooltip.style('icon', () => ({ bgcolor: 'red' }))
31 | tooltip.style('text', () => ({ color: 'blue' }))
32 |
33 | chart.append(pie).add(tooltip)
34 | ```
35 |
36 | :::
37 |
--------------------------------------------------------------------------------
/website/views/demo/radialBar/compose.md:
--------------------------------------------------------------------------------
1 | ## 组合
2 |
3 | :::demo
4 |
5 | ```javascript
6 | const data = [
7 | {
8 | question: '近 7 日睡眠状况',
9 | hour: [7, 8, 6, 7, 8, 7, 8]
10 | }
11 | ]
12 |
13 | const { Plot, Chart, Tooltip } = qcharts
14 |
15 | const plot = new Plot('.block-demo .demo', {})
16 |
17 | const chart = new Chart()
18 |
19 | chart.setTitle('图表组合', { color: 'red' })
20 |
21 | chart
22 | .radialBar({
23 | radius: 0.5
24 | // axis: 'angle'
25 | })
26 | .source(data)
27 | .setDataFields({ x: 'question', y: 'hour' })
28 | .text({ color: '#fff' })
29 |
30 | chart
31 | .pie({
32 | radius: 0.8,
33 | innerRadius: 0.6
34 | })
35 | .source(data[0].hour.map((d) => ({ question: data[0].question, hour: d })))
36 | .setDataFields({ x: 'question', y: 'hour' })
37 |
38 | chart.appendPlugin(new Tooltip({ lineHight: 22 }).formatter((data) => `${data.question}: ${data.percent}%`))
39 |
40 | plot.addChart(chart)
41 | plot.render()
42 | ```
43 |
44 | :::
45 |
--------------------------------------------------------------------------------
/lib/base/mixin.js:
--------------------------------------------------------------------------------
1 | var lifeCycle = {
2 | beforeCreate: 'beforeCreate',
3 | //创建前
4 | created: 'created',
5 | // 图表创建
6 | beforeRender: 'beforeRender',
7 | //图表渲染前
8 | rendered: 'rendered',
9 | // 图表渲染结束
10 | beforeUpdate: 'beforeUpdate',
11 | // 图表更新前
12 | updated: 'updated',
13 | // 图表更新
14 | beforeDestroy: 'beforeDestroy',
15 | // 图表卸载前
16 | destroyed: 'destroyed' // 图表卸载
17 |
18 | };
19 |
20 | function mixin(component) {
21 | component.on = component.addEventListener;
22 | component.off = component.removeEventListener;
23 |
24 | component.once = function (type, fn) {
25 | var _this = this;
26 |
27 | var listener = function listener() {
28 | for (var _len = arguments.length, args = new Array(_len), _key = 0; _key < _len; _key++) {
29 | args[_key] = arguments[_key];
30 | }
31 |
32 | fn.apply(_this, args);
33 |
34 | _this.off(type, listener);
35 | };
36 |
37 | return this.on(type, listener);
38 | };
39 | }
40 |
41 | export { lifeCycle, mixin };
--------------------------------------------------------------------------------
/website/utils/index.js:
--------------------------------------------------------------------------------
1 | export function throttle(
2 | fn,
3 | wait,
4 | options = { leading: false, trailing: false }
5 | ) {
6 | let context = null
7 | let args = null
8 | let result = null
9 | let previous = 0
10 | let timer = null
11 |
12 | const later = () => {
13 | previous = options.leading ? Date.now() : 0
14 | result = fn.apply(context, args)
15 | timer = null
16 | }
17 |
18 | return function() {
19 | const now = Date.now()
20 |
21 | if (!previous && !options.leading) {
22 | previous = now
23 | }
24 |
25 | const remaining = wait - (now - previous)
26 | context = this
27 | args = arguments
28 |
29 | if (remaining <= 0 || remaining > wait) {
30 | if (timer) {
31 | clearTimeout(timer)
32 | timer = null
33 | }
34 |
35 | previous = now
36 | result = fn.apply(context, args)
37 | } else if (!timer && options.trailing) {
38 | timer = setTimeout(later, remaining)
39 | }
40 |
41 | return result
42 | }
43 | }
44 |
--------------------------------------------------------------------------------
/website/views/demo/Gauge/tick.md:
--------------------------------------------------------------------------------
1 | ## 刻度
2 |
3 | 可以通过 `tickStep` 和 `tickLength` 分别控制 tick 的生成数和长度。当 `tickLength` 为负值时,将在外圈绘制刻度。
4 |
5 | :::demo
6 |
7 | ```javascript
8 |
9 | const { Chart, Gauge} = qcharts
10 |
11 | const chart = new Chart({ container: '#app' })
12 |
13 | const colors = ['#49d088', '#FE5555', '#F4B30E', '#473C8B']
14 |
15 | const gauge = new Gauge({
16 | min: 0,
17 | max: 10,
18 | percent:7.3,
19 | tickStep: 1,
20 | tickLength: -10
21 | })
22 |
23 | gauge.style('title', { fontSize: 36 })
24 |
25 | chart.append(gauge)
26 | ```
27 |
28 | :::
29 |
30 | ### 刻度上文字
31 |
32 | 可以通过 `labelOffset` 设置文字和刻度之间的距离。
33 |
34 | :::demo
35 |
36 | ```javascript
37 |
38 | const { Chart, Gauge } = qcharts
39 |
40 | const chart = new Chart({ container: '#app' })
41 |
42 | const gauge = new Gauge({
43 | min: 0,
44 | max: 10,
45 | percent:7.3,
46 | tickStep: 1,
47 | tickLength: 10,
48 | labelOffset: 20,
49 | })
50 |
51 | gauge.style('title', { fontSize: 36 })
52 |
53 | chart.append(gauge)
54 | ```
55 |
56 | :::
57 |
--------------------------------------------------------------------------------
/website/views/demo/Bar/default-bar.md:
--------------------------------------------------------------------------------
1 | ## Basic Bar Chart 基础条形图
2 |
3 | :::demo1
4 |
5 | ```javascript
6 | const data = [
7 | { value: 6100, label: "TOP1" },
8 | { value: 5200, label: "TOP2" },
9 | { value: 4400, label: "TOP3" },
10 | { value: 3700, label: "TOP4" },
11 | { value: 2800, label: "TOP5" },
12 | { value: 2000, label: "TOP6" },
13 | { value: 1300, label: "TOP7" },
14 | { value: 400, label: "TOP8" },
15 | ]
16 | const { Chart, Bar, Tooltip, Axis, Legend } = qcharts
17 | const chart = new Chart({
18 | container: "#app",
19 | })
20 | chart.source(data, {
21 | value: "value",
22 | text: "label",
23 | })
24 | const bar = new Bar({
25 | transpose: true,
26 | barWidth: 18,
27 | animation: {
28 | duration: 1000,
29 | easing: "elasticOut",
30 | },
31 | })
32 |
33 | const tooltip = new Tooltip()
34 | const axisBottom = new Axis().style("scale", false)
35 | const axisLeft = new Axis({
36 | orient: "left",
37 | }).style("grid", false)
38 | chart.append([bar, tooltip, axisBottom, axisLeft])
39 | ```
40 |
41 | :::
42 |
--------------------------------------------------------------------------------
/website/components/code-copy.svg:
--------------------------------------------------------------------------------
1 |
2 |
--------------------------------------------------------------------------------
/website/views/doc/plugins/Axis.md:
--------------------------------------------------------------------------------
1 | ### 插件介绍
2 |
3 | Axis, 坐标轴。
4 |
5 | #### attr 属性:
6 |
7 | | 名称 | 说明 | 类型 | 可选值 | 默认值 |
8 | | ----------- | ------------ | -------- | ------------------------------------------------------- | -------- |
9 | | orient | 坐标轴的方向 | | ['top','right','bottom','left'] | 'bottom' |
10 | | name | 坐标轴名称 | | | |
11 | | splitNumber | Number | 0 | 坐标轴的分割段数,同时须设置 visual 的 splitNumber 属性 |
12 | | formatter | Function | `d => d` | 文本格式化函数 |
13 |
14 | #### style 样式:
15 |
16 | ```javascript
17 | const axis = new Axis({ orient: 'left' })
18 | axis.style('scale', false)
19 | ```
20 |
21 | | 名称 | 基本类型 | 说明 |
22 | | ----- | -------- | ---------------- |
23 | | axis | 线 | 坐标轴样式 |
24 | | name | 文本 | 坐标轴名字 |
25 | | scale | 线 | 坐标轴上的刻度 |
26 | | label | 文本 | 坐标轴上文本类型 |
27 |
--------------------------------------------------------------------------------
/website/views/demo/Column/default-column.md:
--------------------------------------------------------------------------------
1 | ## Basic Column Chart 基础柱状图
2 |
3 | :::demo
4 |
5 | ```javascript
6 | const data = [
7 | { value: 22, label: '05-01' },
8 | { value: 60, label: '05-02' },
9 | { value: 56, label: '05-03' },
10 | { value: 85, label: '05-04' },
11 | { value: 136, label: '05-05' },
12 | { value: 108, label: '05-06' },
13 | { value: 64, label: '05-07' },
14 | { value: 35, label: '05-08' }
15 | ]
16 | const { Chart, Bar, Tooltip, Axis, Legend } = qcharts
17 | const chart = new Chart({
18 | container: '#app'
19 | })
20 | chart.source(data, {
21 | value: 'value',
22 | text: 'label'
23 | })
24 | const bar = new Bar({
25 | animation: {
26 | duration: 1000,
27 | easing: 'elasticOut'
28 | }
29 | })
30 | const tooltip = new Tooltip()
31 | const axisBottom = new Axis().style('grid', false)
32 | const axisLeft = new Axis({ orient: 'left' }).style('axis', false).style('scale', false)
33 | chart.append([bar, tooltip, axisBottom, axisLeft])
34 | bar.dataset.on('mouseEvent', function(...params) {
35 | console.log(params)
36 | })
37 | ```
38 |
39 | :::
40 |
--------------------------------------------------------------------------------
/LICENSE:
--------------------------------------------------------------------------------
1 | MIT License
2 |
3 | Copyright (c) 2020 QCharts
4 |
5 | Permission is hereby granted, free of charge, to any person obtaining a copy
6 | of this software and associated documentation files (the "Software"), to deal
7 | in the Software without restriction, including without limitation the rights
8 | to use, copy, modify, merge, publish, distribute, sublicense, and/or sell
9 | copies of the Software, and to permit persons to whom the Software is
10 | furnished to do so, subject to the following conditions:
11 |
12 | The above copyright notice and this permission notice shall be included in all
13 | copies or substantial portions of the Software.
14 |
15 | THE SOFTWARE IS PROVIDED "AS IS", WITHOUT WARRANTY OF ANY KIND, EXPRESS OR
16 | IMPLIED, INCLUDING BUT NOT LIMITED TO THE WARRANTIES OF MERCHANTABILITY,
17 | FITNESS FOR A PARTICULAR PURPOSE AND NONINFRINGEMENT. IN NO EVENT SHALL THE
18 | AUTHORS OR COPYRIGHT HOLDERS BE LIABLE FOR ANY CLAIM, DAMAGES OR OTHER
19 | LIABILITY, WHETHER IN AN ACTION OF CONTRACT, TORT OR OTHERWISE, ARISING FROM,
20 | OUT OF OR IN CONNECTION WITH THE SOFTWARE OR THE USE OR OTHER DEALINGS IN THE
21 | SOFTWARE.
22 |
--------------------------------------------------------------------------------
/website/views/more/test/line.md:
--------------------------------------------------------------------------------
1 | ## Basic Line Chart 基础折线图
2 |
3 | :::demo
4 |
5 | ```javascript
6 | const data = [
7 | { date: '05-01', catgory: '图例一', sales: 15.2 },
8 | { date: '05-02', catgory: '图例一', sales: 39.2 },
9 | { date: '05-03', catgory: '图例一', sales: 31.2 },
10 | { date: '05-04', catgory: '图例一', sales: 65.2 },
11 | { date: '05-05', catgory: '图例一', sales: 55.2 },
12 | { date: '05-06', catgory: '图例一', sales: 75.2 },
13 | { date: '05-07', catgory: '图例一', sales: 95.2 },
14 | { date: '05-08', catgory: '图例一', sales: 100 }
15 | ]
16 |
17 | const { Chart, LineTest, Legend, Tooltip, Axis } = qcharts
18 |
19 | const chart = new Chart({
20 | container: '#app'
21 | })
22 |
23 | chart.source(data, {
24 | row: 'catgory',
25 | value: 'sales',
26 | text: 'date'
27 | })
28 |
29 | const line = new LineTest()
30 | line.style('point', { strokeColor: '#fff' })
31 |
32 | const axisBottom = new Axis()
33 |
34 | const toolTip = new Tooltip()
35 |
36 | const axisLeft = new Axis({ orient: 'left' }).style('axis', false).style('scale', false)
37 |
38 | chart.append([line, axisBottom, axisLeft, toolTip])
39 | ```
40 |
41 | :::
42 |
--------------------------------------------------------------------------------
/website/views/demo/Area/area-default.md:
--------------------------------------------------------------------------------
1 | ## Basic Area Chart 基础面积图
2 |
3 | :::demo
4 |
5 | ```javascript
6 | const data = [
7 | { date: '05-01', category: '图例一', sales: 15.2 },
8 | { date: '05-02', category: '图例一', sales: 39.2 },
9 | { date: '05-03', category: '图例一', sales: 31.2 },
10 | { date: '05-04', category: '图例一', sales: 65.2 },
11 | { date: '05-05', category: '图例一', sales: 55.2 },
12 | { date: '05-06', category: '图例一', sales: 75.2 },
13 | { date: '05-07', category: '图例一', sales: 95.2 },
14 | { date: '05-08', category: '图例一', sales: 65.2 }
15 | ]
16 |
17 | const { Chart, Area, Axis, Legend, Tooltip } = qcharts
18 |
19 | const chart = new Chart({
20 | container: '#app'
21 | })
22 |
23 | chart.source(data, {
24 | row: 'category',
25 | value: 'sales',
26 | text: 'date'
27 | })
28 |
29 | const area = new Area()
30 |
31 | const axisBottom = new Axis().style('grid', false)
32 | const tooltip = new Tooltip()
33 | const legend = new Legend()
34 | const axisLeft = new Axis({ orient: 'left' }).style('axis', false).style('scale', false)
35 |
36 | chart.append([area, axisBottom, axisLeft, tooltip, legend])
37 | ```
38 |
39 | :::
40 |
--------------------------------------------------------------------------------
/website/views/demo/Funnel/funnel-default.md:
--------------------------------------------------------------------------------
1 | ## Basic Funnel Chart 基础漏斗图
2 |
3 | :::demo
4 |
5 | ```javascript
6 | const data = [
7 | { value: 3721, label: "浏览网站" },
8 | { value: 3006, label: "放入购入车" },
9 | { value: 2505, label: "生成订单" },
10 | { value: 2151, label: "支付订金" },
11 | { value: 1782, label: "完成订单" },
12 | { value: 1503, label: "完成交易" },
13 | { value: 1204, label: "未完成交易" },
14 | ]
15 |
16 | const { Chart, Funnel, Tooltip, Legend } = qcharts
17 |
18 | const chart = new Chart({
19 | container: "#app",
20 | })
21 |
22 | chart.source(data, {
23 | row: "label",
24 | value: "value",
25 | text: "label",
26 | })
27 | const tooltip = new Tooltip()
28 | const funnel = new Funnel({
29 | clientRect: {
30 | left: "25%",
31 | top: "10%",
32 | width: "50%",
33 | height: "80%",
34 | },
35 | align: "center",
36 | formatter: (d) => `${d.value}`,
37 | })
38 | .style("guideline", true)
39 | .style("guideText", true)
40 | .style("polygon:hover", (polygon, dataOrigin, index) => {
41 | return { opacity: 0.5 }
42 | })
43 | const legend = new Legend()
44 | chart.append([funnel, tooltip, legend])
45 | ```
46 |
47 | :::
48 |
--------------------------------------------------------------------------------
/website/views/demo/radialBar/radialBar.md:
--------------------------------------------------------------------------------
1 | ## 玉玦图
2 |
3 | :::demo
4 |
5 | ```javascript
6 | const data = [
7 | {
8 | type: '政法干部',
9 | count: 6654
10 | },
11 |
12 | {
13 | type: '平安志愿者',
14 | count: 5341
15 | },
16 |
17 | {
18 | type: '人民调解员',
19 | count: 3546
20 | },
21 |
22 | {
23 | type: '心理咨询师',
24 | count: 4321
25 | },
26 |
27 | {
28 | type: '法律工作者',
29 | count: 3923
30 | },
31 |
32 | {
33 | type: '网格员',
34 | count: 5345
35 | }
36 | ].sort((a, b) => a.count - b.count)
37 |
38 | const { Chart, RadialBar, Legend, Tooltip } = qcharts
39 |
40 | const chart = new Chart({
41 | container: '#app'
42 | })
43 |
44 | chart.source(data, {
45 | row: 'type',
46 | text: 'type',
47 | value: 'count'
48 | })
49 |
50 | const radialBar = new RadialBar({
51 | min: 0,
52 | max: 10000,
53 | radius: 0.6,
54 | innerRadius: 0.1,
55 | lineWidth: 10
56 | })
57 |
58 | radialBar.style('arc', { lineCap: 'round' })
59 |
60 | const legend = new Legend({
61 | orient: 'vertical',
62 | align: ['right', 'center'],
63 | })
64 |
65 | chart.append([radialBar, legend, new Tooltip()])
66 | ```
67 |
68 | :::
69 |
--------------------------------------------------------------------------------
/website/views/demo/line/line-default.md:
--------------------------------------------------------------------------------
1 | ## Basic Line Chart 基础折线图
2 |
3 | :::demo
4 |
5 | ```javascript
6 | const data = [
7 | { date: '05-01', catgory: '图例一', sales: 15.2 },
8 | { date: '05-02', catgory: '图例一', sales: 39.2 },
9 | { date: '05-03', catgory: '图例一', sales: 31.2 },
10 | { date: '05-04', catgory: '图例一', sales: 65.2 },
11 | { date: '05-05', catgory: '图例一', sales: 55.2 },
12 | { date: '05-06', catgory: '图例一', sales: 75.2 },
13 | { date: '05-07', catgory: '图例一', sales: 95.2 },
14 | { date: '05-08', catgory: '图例一', sales: 100 }
15 | ]
16 |
17 | const { Chart, Line, Legend, Tooltip, Axis } = qcharts
18 | const chart = new Chart({
19 | container: '#app'
20 | })
21 | chart.source(data, {
22 | row: 'catgory',
23 | value: 'sales',
24 | text: 'date'
25 | })
26 | const line = new Line()
27 | const axisBottom = new Axis().style('grid', false)
28 | const toolTip = new Tooltip({
29 | title: arr => {
30 | return arr[0].date + ':数据'
31 | }
32 | })
33 | const legend = new Legend()
34 | const axisLeft = new Axis({ orient: 'left' }).style('axis', false).style('scale', false)
35 |
36 | chart.append([line, axisBottom, axisLeft, toolTip, legend])
37 | ```
38 |
39 | :::
40 |
--------------------------------------------------------------------------------
/website/views/doc/plot.md:
--------------------------------------------------------------------------------
1 | # Plot
2 |
3 | 绘制图表前,需要指定图表的绘制区域,该项工作由 `qcharts.Plot` 完成。创建绘制区域的方式如下:
4 |
5 | ```javascript
6 | new qcharts.Plot('#app', {
7 | viewport: [400, 360]
8 | })
9 | ```
10 |
11 | 其中主要的参数:挂载点(DOM 节点)、视图大小(viewport)。
12 |
13 | ## 绑定图表实例
14 |
15 | 创建绘制区域后,可将图表实例绑定到该绘制区域,然后进行渲染。
16 |
17 | ```javascript
18 | const plot = new qcharts.Plot('#app', {
19 | viewport: [400, 360]
20 | })
21 |
22 | plot.addChart(/* chart 实例 */)
23 | ```
24 |
25 | ## 划分子区域
26 |
27 | 如果需要在绘制区域上绘制多个图表实例,这时候就需要划分子区域。划分子区域的方式:
28 |
29 | ```javascript
30 | const plot = new qcharts.Plot('#app', {
31 | viewport: [400, 360]
32 | })
33 |
34 | plot.subPlot(0, 0, 200, 360)
35 | plot.subPlot(200, 0, 200, 360)
36 | ```
37 |
38 | `subPlot` 接收的参数为:`(x, y, width, height)`,其中 `x` 和 `y` 指定子区域的位置,`width` 和 `height` 指定子区域宽高。
39 |
40 | 需要注意的是,如果想要把某个图表实例指定到子区域进行绘制,使用方式应当为:
41 |
42 | ```javascript
43 | plot.subPlot(0, 0, 200, 360).addChart(chart)
44 | ```
45 |
46 | ## 渲染图表
47 |
48 | 如果已经进行了相关图表的绑定,只需使用 `plot.render()` 即可渲染绑定的所有图表实例。
49 |
50 | ## `Plot` 和 `subPlot` 做了什么?
51 |
52 | 当实例化一个 `Plot` 时,实际上是渲染了一个 `canvas`,该 `canvas` 便是之后所有图形渲染的载体。而 `subPlot` 则是进一步实例化了一个 [`Group` (`spritejs.Group`)]() 实例来做图表的容器。
53 |
--------------------------------------------------------------------------------
/website/views/demo/Map/component-label.md:
--------------------------------------------------------------------------------
1 | ## 文字
2 |
3 | :::demo
4 |
5 | ```javascript
6 | fetch('http://s5.qhres.com/static/81bf507dbbc7c08d.json')
7 | .then((res) => res.json())
8 | .then((mapData) => {
9 | const { Chart, Tooltip, Text, Map } = qcharts
10 |
11 | const chart = new Chart({
12 | container: '#app'
13 | })
14 |
15 | const map = new qcharts.Map({
16 | projection: 'geoMercator'
17 | })
18 |
19 | map.setGeomData(mapData, { items: mapData.features }).style('normal', { fillColor: '#214882', color: '#479cd3' })
20 |
21 | map.add(Map.Text, {
22 | style: {
23 | normal(attrs, data, i) {
24 | return {
25 | text: data.properties.name,
26 | color: '#fff',
27 | fontSize: '8px',
28 | anchor: [0, 0.5],
29 | translate: [8, 0]
30 | }
31 | }
32 | }
33 | })
34 |
35 | const tooltip = new Tooltip()
36 | tooltip.formatter((data) => `${data.properties.name}`)
37 |
38 | chart
39 | .add(map)
40 | .add(tooltip)
41 | .add(new Text({ text: '中国各省市' }))
42 |
43 | chart.setTheme('dark')
44 | })
45 | ```
46 |
47 | :::
48 |
--------------------------------------------------------------------------------
/website/components/play.svg:
--------------------------------------------------------------------------------
1 |
2 |
--------------------------------------------------------------------------------
/website/views/demo/radar/radar_point_style.md:
--------------------------------------------------------------------------------
1 | ## 双色雷达图
2 |
3 | :::demo point
4 |
5 | ```javascript
6 | const data = [
7 | { label: '分类一', category: '类别一', value: 19 },
8 | { label: '分类二', category: '类别一', value: 74 },
9 | { label: '分类三', category: '类别一', value: 40 },
10 | { label: '分类四', category: '类别一', value: 46 },
11 | { label: '分类五', category: '类别一', value: 30 },
12 | { label: '分类六', category: '类别一', value: 62 },
13 |
14 | { label: '分类一', category: '类别二', value: 69 },
15 | { label: '分类二', category: '类别二', value: 14 },
16 | { label: '分类三', category: '类别二', value: 70 },
17 | { label: '分类四', category: '类别二', value: 26 },
18 | { label: '分类五', category: '类别二', value: 50 },
19 | { label: '分类六', category: '类别二', value: 52 }
20 | ]
21 |
22 | const { Chart, Radar, Tooltip, Legend } = qcharts
23 |
24 | const chart = new Chart({
25 | container: '#app'
26 | })
27 | chart.source(data, {
28 | row: 'category',
29 | value: 'value',
30 | text: 'label'
31 | })
32 |
33 | const radar = new Radar()
34 |
35 | radar.style('section', (d) => ({ opacity: 0.3 }))
36 |
37 | const legend = new Legend({ align: ['center', 'bottom'] })
38 | chart.append([radar, legend])
39 | ```
40 |
41 | :::
42 |
--------------------------------------------------------------------------------
/website/components/down.svg:
--------------------------------------------------------------------------------
1 |
2 |
--------------------------------------------------------------------------------
/website/views/doc/theme.md:
--------------------------------------------------------------------------------
1 | ### 主题
2 |
3 | Qcharts 几乎所有的样式都在一个独立的配置文件中,通过修改这个配置文件,可以让 Qcharts 进行全局换肤,修改方式如下:
4 |
5 | ```js
6 | const { theme } = qcharts
7 | theme.set({
8 | colors: ['#71dac7', '#d57a77'],
9 | visuals: {
10 | Line: {
11 | //折线图
12 | styles: {
13 | point: { pointType: 'star' }
14 | },
15 | sttrs: {}
16 | },
17 | Area: {
18 | //面积图
19 | styles: {},
20 | sttrs: {}
21 | },
22 | Bar: {
23 | //柱状图
24 | styles: {},
25 | sttrs: {}
26 | }
27 | //...
28 | },
29 | plugins: {
30 | // 富矿提示
31 | Tooltip: {
32 | styles: {},
33 | attrs: {}
34 | },
35 | // 坐标轴
36 | Axis: {
37 | styles: {},
38 | attrs: {}
39 | }
40 | //...
41 | }
42 | })
43 | ```
44 |
45 | 通过 `qcharts.theme` 可以获取到默认的全局 theme 配置,方便对属性进行查看修改
46 |
47 | 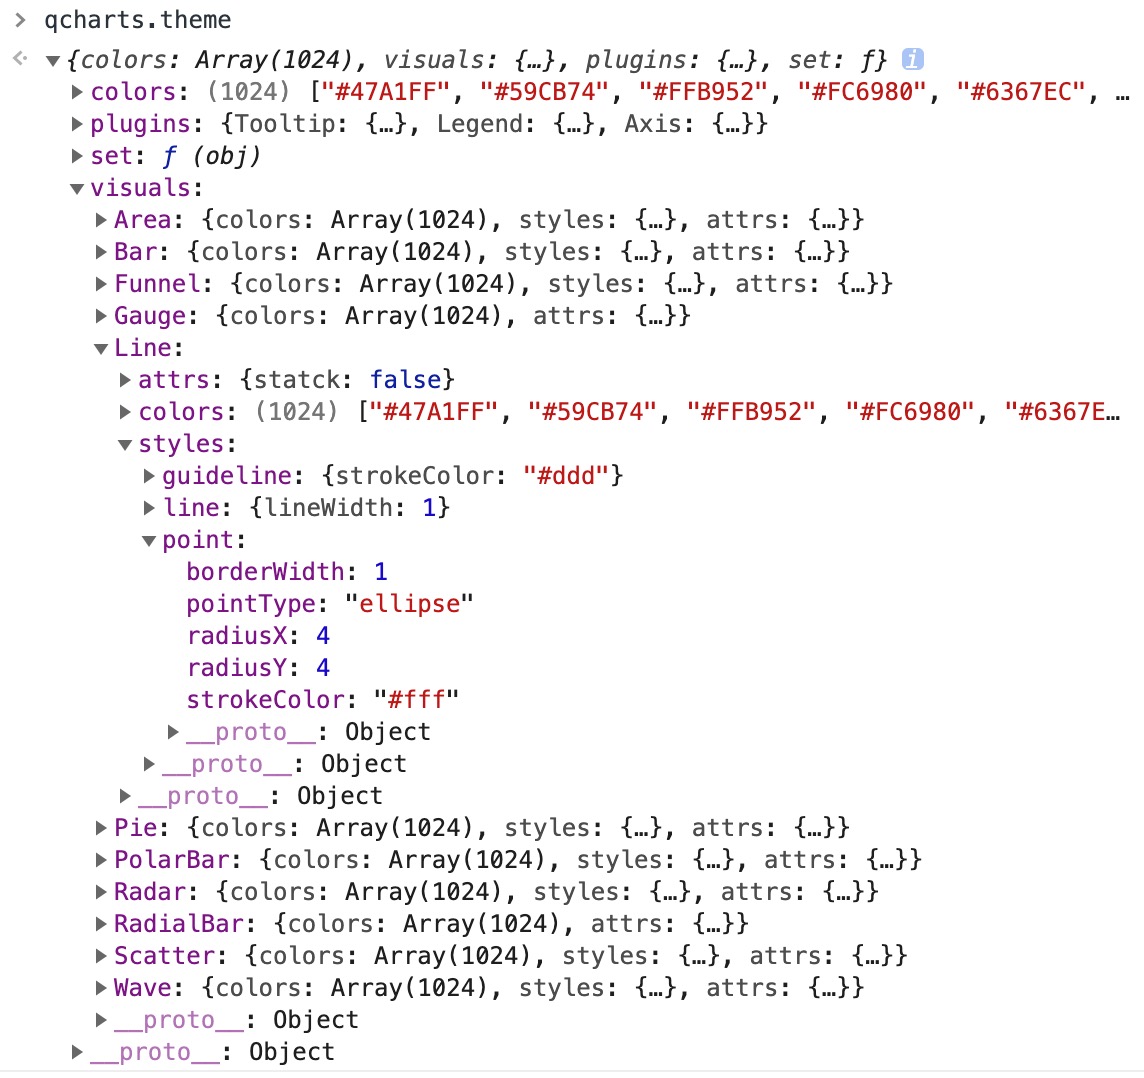 48 |
49 | 也可以单独设置某个组件的样式,单独通过 style 设置的优先级高于统一 theme 设置
50 |
51 | ```js
52 | const line = new Line()
53 | line.style('point', { pointType: 'star', angles: 5, innerRadius: 5, outerRadius: 10, strokeColor: '#fff' })
54 | line.style('point:hover', { strokeColor: '#f0f' })
55 | ```
56 |
--------------------------------------------------------------------------------
/website/views/doc/routes.js:
--------------------------------------------------------------------------------
1 | import generateCommonPage from '../../utils/generateCommonPage'
2 | import apiRoutes from './api'
3 | import pluginsRoutes from './plugins'
4 |
5 | export default [
6 | {
7 | title: '',
8 | path: '',
9 | redirect: 'apiinfo'
10 | },
11 | {
12 | title: 'Chart 图表主体',
13 | path: 'chart',
14 | component: () => import('./chart.md')
15 | },
16 | {
17 | title: 'Dataset 数据集',
18 | path: 'dataset',
19 | component: () => import('./dataset.md')
20 | },
21 | {
22 | title: 'Theme主题',
23 | path: 'theme',
24 | component: () => import('./theme.md')
25 | },
26 | {
27 | title: 'API简述',
28 | path: 'apiinfo',
29 | component: () => import('./apiinfo.md')
30 | },
31 | {
32 | title: 'Visual(图形)',
33 | path: 'api',
34 | component: generateCommonPage('/doc/api/', apiRoutes),
35 | children: apiRoutes
36 | },
37 |
38 | {
39 | title: 'Plugin(插件)',
40 | path: 'plugin',
41 | component: generateCommonPage('/doc/plugin/', pluginsRoutes),
42 | children: pluginsRoutes
43 | }
44 |
45 | // {
46 | // title: '自定义样式',
47 | // path: 'style',
48 | // component: () => import('./style.md')
49 | // },
50 | ]
51 |
--------------------------------------------------------------------------------
/website/views/doc/api/scatter.md:
--------------------------------------------------------------------------------
1 | ## 散点图
2 |
3 | ### 图表介绍
4 |
5 | 散点图根据数据的 x,y 确定散点的位置,气泡图是散点图的一种扩展,气泡图相较于散点图多一个维度,通过 **areaField** 字段可设置气泡的大小,默认为 areaField 值的大小,也可设置
6 | **areaRange** 将 areaField 的值进行线性映射。气泡图还可以通过 **labelField** 字段来设置显示的 label 。
7 |
8 | ### attrs
9 |
10 | | 属性 | 说明 | 类型 | 默认值 |
11 | | ------------- | --------------------------------------------------------- | ------- | ------ |
12 | | areaField | 气泡大小字段值,不设置此值则为散点图,可通过 style 自定义 | String | null |
13 | | areaRange | 面积映射,设置此值则将 areaField 进行线性映射 | Array | null |
14 | | labelField | 气泡图中显示 label 的字段,可通过 style 自定义 | String | null |
15 | | showGuideLine | hover 时的辅助线,默认不显示辅助线 | Boolean | false |
16 | | layoutWay | 坐标轴的相关属性 | Object | null |
17 |
18 | ### 可设置 style 名称
19 |
20 | | 名称 | 基本类型 | 说明 |
21 | | ----------- | -------- | ------------------- |
22 | | point | 面 | 点的样式,拥有Arc元素的全部属性 |
23 | | point:hover | 面 | 点 hover 样式,拥有Arc元素的全部属性 |
24 | | label | 文本 | label 样式 |
25 | | guideline | 线 | 指导线样式 |
26 |
--------------------------------------------------------------------------------
/website/views/plugin/tooltip/title.md:
--------------------------------------------------------------------------------
1 | ## 标题设置
2 |
3 | `Tooltip` 的标题可以设置为 `string`,也可以设置为 `function`。两者区别:`string` 将固定标题为某字符串,`function` 则将 title 设置为函数返回值。
4 |
5 | :::demo
6 |
7 | ```javascript
8 | const data = [1, 2, 3, 4, 5].map((num) => {
9 | return { value: num }
10 | })
11 |
12 | const { Chart, Pie, Legend, Tooltip } = qcharts
13 |
14 | const chart = new Chart({
15 | container: '#app',
16 | size: ['100%', '100%']
17 | })
18 |
19 | chart.source(data, { value: 'value' })
20 |
21 | const pie = new Pie()
22 |
23 | const tooltip = new Tooltip({ title: '数字', formatter: (d) => d.value })
24 |
25 | chart.append([pie, tooltip])
26 | ```
27 |
28 | :::
29 |
30 | :::demo
31 |
32 | ```javascript
33 | const data = [1, 2, 3, 4, 5].map((num) => {
34 | return { value: num }
35 | })
36 |
37 | const { Chart, Pie, Legend, Tooltip } = qcharts
38 |
39 | const chart = new Chart({
40 | container: '#app',
41 | size: ['100%', '100%']
42 | })
43 |
44 | chart.source(data, { value: 'value' })
45 |
46 | const pie = new Pie()
47 |
48 | const tooltip = new Tooltip({
49 | title: (d) => {
50 | return `数组 ${d[0].value}`
51 | },
52 | formatter: (d) => d.value
53 | })
54 |
55 | chart.append([pie, tooltip])
56 | ```
57 |
58 | :::
59 |
--------------------------------------------------------------------------------
/website/views/demo/Wave/wave.md:
--------------------------------------------------------------------------------
1 | ## 水波进度
2 |
3 | :::demo
4 |
5 | ```javascript
6 | const data = [
7 | {
8 | sex: 'male',
9 | value: 63
10 | },
11 | {
12 | sex: 'middle',
13 | value: 16
14 | },
15 | {
16 | sex: 'female',
17 | value: 21
18 | }
19 | ]
20 |
21 | const { Chart, Progress, Tooltip } = qcharts
22 |
23 | const chart = new Chart({ container: '#app' })
24 |
25 | const colors = ['#49d088', '#FE5555', '#F4B30E', 'red']
26 |
27 | const progress = new Progress({
28 | min: 0,
29 | max: 100,
30 | type: 'wave',
31 | radius: 60,
32 | offset: 10,
33 | lineWidth: 10
34 | })
35 | .source(data)
36 | .setDataFields({ x: 'sex', y: 'value' })
37 | .style('normal', (attrs, d, i) => {
38 | return { fillColor: colors[i], color: colors[3 - i] }
39 | })
40 | .formatter((d) => `${d.value}`)
41 |
42 | chart.append(progress).add(new Tooltip().formatter((d) => `${d.value}`))
43 | ```
44 |
45 | :::
46 |
47 | ### 属性
48 |
49 | 当 `type` 为 `wave` 时,相关属性如下。
50 |
51 | | 名称 | 说明 | 参数 |
52 | | --------- | -------------- | --------------- |
53 | | radius | 内圈圆半径 | `(val: Number)` |
54 | | lineWidth | 外圈圆环宽度 | `(val: Number)` |
55 | | offset | 内外圈之间留白 | `(val: Number)` |
56 |
--------------------------------------------------------------------------------
/website/views/demo/Gauge/style.md:
--------------------------------------------------------------------------------
1 | ## 样式调整
2 |
3 | - `arc`: 控制弧线
4 | - `title`: 控制仪表盘中心标题
5 | - `subTitle`: 控制仪表盘中心副标题
6 | - `tickLine`: 控制刻度线
7 | - `tickText`: 控制刻度文字
8 |
9 | :::demo
10 |
11 | ```javascript
12 | const data = [
13 | {
14 | text: '收入',
15 | value: 600
16 | }
17 | ]
18 |
19 | const { Chart, Gauge, Legend, Tooltip } = qcharts
20 |
21 | const chart = new Chart({ container: '#app', forceFit: true })
22 |
23 | chart.source(data, {
24 | row: 'text',
25 | value: 'value'
26 | })
27 |
28 | const gauge = new Gauge({
29 | min: 0,
30 | max: 1000,
31 | tickStep: 200,
32 | title: '标题',
33 | subTitle: '副标题'
34 | })
35 |
36 | gauge.style('arc', { color: '#0f0' })
37 |
38 | gauge.style('title', { color: 'red' })
39 | gauge.style('subTitle', { color: 'blue' })
40 |
41 | gauge.style('tickLine', (attrs, data, i) => {
42 | if (i % 2) {
43 | return { color: '#f00', lineWidth: 2 }
44 | } else if (i === 4) {
45 | return { color: 'transparent' }
46 | }
47 | })
48 | gauge.style('tickText', (attrs, data, i) => {
49 | if (i % 2) {
50 | return { color: '#f00', lineWidth: 2 }
51 | } else if (i === 2) {
52 | return { color: 'transparent' }
53 | }
54 | })
55 |
56 | chart.append(gauge)
57 | ```
58 |
59 | :::
60 |
--------------------------------------------------------------------------------
/website/views/demo/line/routes.js:
--------------------------------------------------------------------------------
1 | export default [
2 | {
3 | title: '',
4 | path: '',
5 | redirect: 'default'
6 | },
7 | {
8 | title: '基础折线图',
9 | path: 'default',
10 | component: () => import('./line-default.md')
11 | },
12 | {
13 | title: '双折线图',
14 | path: 'double',
15 | component: () => import('./line-double.md')
16 | },
17 | {
18 | title: '曲线折线图',
19 | path: 'smooth',
20 | component: () => import('./line-smooth.md')
21 | },
22 | {
23 | title: '多折线图',
24 | path: 'multi',
25 | component: () => import('./line-multi.md')
26 | }
27 | // {
28 | // title: '其它',
29 | // path: 'others',
30 | // component: () => import('./line-others.md')
31 | // },
32 | // {
33 | // title: '个性化',
34 | // path: 'style',
35 | // component: () => import('./line-style.md')
36 | // },
37 | // {
38 | // title: '数据更新',
39 | // path: 'update',
40 | // component: () => import('./line-update.md')
41 | // },
42 | // {
43 | // title: '交换坐标轴',
44 | // path: 'swapaxis',
45 | // component: () => import('./line-swapaxis.md')
46 | // },
47 | // {
48 | // title: '多图融合',
49 | // path: 'axisgap',
50 | // component: () => import('./line-gap.md')
51 | // }
52 | ]
53 |
--------------------------------------------------------------------------------
/website/views/more/radar/pointStyle.md:
--------------------------------------------------------------------------------
1 | ### 修改雷达图点形状
2 |
3 | :::demo
4 |
5 | ```javascript
6 | const data = [
7 | { label: '分类一', category: '类别一', value: 19 },
8 | { label: '分类二', category: '类别一', value: 74 },
9 | { label: '分类三', category: '类别一', value: 40 },
10 | { label: '分类四', category: '类别一', value: 46 },
11 | { label: '分类五', category: '类别一', value: 30 },
12 | { label: '分类六', category: '类别一', value: 62 },
13 |
14 | { label: '分类一', category: '类别二', value: 69 },
15 | { label: '分类二', category: '类别二', value: 14 },
16 | { label: '分类三', category: '类别二', value: 70 },
17 | { label: '分类四', category: '类别二', value: 26 },
18 | { label: '分类五', category: '类别二', value: 50 },
19 | { label: '分类六', category: '类别二', value: 52 }
20 | ]
21 |
22 | const { Chart, Radar, Tooltip, Legend } = qcharts
23 |
24 | const chart = new Chart({
25 | container: '#app'
26 | })
27 | chart.source(data, {
28 | row: 'category',
29 | value: 'value',
30 | text: 'label'
31 | })
32 |
33 | const radar = new Radar()
34 |
35 | radar.style('point', (d, data, i) => {
36 | if (data.category === '类别一') {
37 | return { pointType: 'rect' }
38 | }
39 | })
40 |
41 | const legend = new Legend({ align: ['center', 'bottom'] })
42 | chart.append([radar, legend])
43 | ```
44 |
45 | :::
46 |
--------------------------------------------------------------------------------
/website/views/demo/radar/radar.md:
--------------------------------------------------------------------------------
1 | ## 基本雷达图
2 |
3 | :::demo 基本雷达图
4 |
5 | ```javascript
6 | const data = [
7 | { label: '分类一', category: '类别一', value: 19 },
8 | { label: '分类二', category: '类别一', value: 74 },
9 | { label: '分类三', category: '类别一', value: 40 },
10 | { label: '分类四', category: '类别一', value: 46 },
11 | { label: '分类五', category: '类别一', value: 30 },
12 | { label: '分类六', category: '类别一', value: 62 },
13 |
14 | { label: '分类一', category: '类别二', value: 69 },
15 | { label: '分类二', category: '类别二', value: 14 },
16 | { label: '分类三', category: '类别二', value: 70 },
17 | { label: '分类四', category: '类别二', value: 26 },
18 | { label: '分类五', category: '类别二', value: 50 },
19 | { label: '分类六', category: '类别二', value: 52 },
20 | ]
21 |
22 | const { Chart, Radar,Legend, Tooltip } = qcharts
23 |
24 | const chart = new Chart({
25 | container: '#app',
26 | })
27 | chart.source(data, {
28 | row: 'category',
29 | value: 'value',
30 | text: 'label',
31 | })
32 | const radar = new Radar()
33 | radar.style('section', (d) => ({ opacity: 0.3 }))
34 | .style('section:hover',d=>({opacity: 0.8,lineWidth:2,strokeColor:'red'}))
35 |
36 | const legend = new Legend({ align: ['center', 'bottom'] })
37 |
38 | chart.append([radar,legend, new Tooltip()])
39 | ```
40 |
41 | :::
42 |
--------------------------------------------------------------------------------
/website/views/demo/pie/rose_layoutScale.md:
--------------------------------------------------------------------------------
1 | ## Nightingle Rose Chart 南丁格尔玫瑰图 - 数值变换
2 |
3 | :::demo
4 |
5 | ```javascript
6 | let data = [
7 | { value: 335, name: '直接访问' },
8 | { value: 210, name: '邮件营销' },
9 | { value: 2800, name: '联盟广告' },
10 | { value: 254, name: '视频广告' },
11 | { value: 200, name: '搜索引擎' }
12 | ]
13 | const { Chart, Pie, Tooltip, Legend } = qcharts
14 |
15 | const chart = new Chart({ container: '#app' })
16 |
17 | chart.source(data, {
18 | row: 'name',
19 | value: 'value',
20 | layoutScale: 'log' //['log','log2','log10','sqrt','sqrt3','sqrt~n','pow','pow3','pow~n']
21 | })
22 |
23 | const pie = new Pie({
24 | radius: 0.7,
25 | pos: [0, 0],
26 | size: ['80%', '100%'],
27 | rose: true
28 | })
29 | pie.style('guideline', true)
30 | pie.style('guideText', { fontSize: '12px' })
31 |
32 | const legend = new Legend({
33 | formatter: function(name, data, i) {
34 | return name
35 | //console.log(data)
36 | },
37 | orient: 'vertical',
38 | align: ['right', 'center']
39 | })
40 | legend.style('icon', (attrs, d, i) => ({
41 | borderRadius: 10,
42 | marginTop: i > 0 ? 15 : 0
43 | }))
44 | legend.style('text', (attrs, d, i) => ({
45 | marginTop: i > 0 ? 15 : 0
46 | }))
47 |
48 | chart.append(pie)
49 | chart.append(legend)
50 | ```
51 |
52 | :::
53 |
--------------------------------------------------------------------------------
/website/views/demo/Wave/label.md:
--------------------------------------------------------------------------------
1 | ## 文字
2 |
3 | 目前 `labelPosition` 只支持 `top`、`right`、`bottom` 和 `left` 之一,如果需要作偏移,可以配合使用 `spritejs.Label` 的 `translate` 属性。
4 |
5 | :::demo
6 |
7 | ```javascript
8 | const data = [
9 | {
10 | sex: 'male',
11 | value: 63
12 | },
13 |
14 | {
15 | sex: 'middle',
16 | value: 16
17 | },
18 |
19 | {
20 | sex: 'female',
21 | value: 21
22 | }
23 | ]
24 |
25 | const { Chart, Progress, Tooltip } = qcharts
26 |
27 | const chart = new Chart({ container: '#app' })
28 |
29 | chart.source(data, {
30 | row: 'sex',
31 | text: 'sex',
32 | value: 'value'
33 | })
34 |
35 | const colors = ['#49d088', '#FE5555', '#F4B30E', 'red']
36 |
37 | const progress = new Progress({
38 | min: 0,
39 | max: 100,
40 | label: true,
41 | labelPosition: 'top',
42 | formatter: (d) => `${d.value}`
43 | })
44 |
45 | chart.append(progress).add(new Tooltip({ formatter: (d) => `${d.value}` }))
46 | ```
47 |
48 | :::
49 |
50 | ### 属性
51 |
52 | | 名称 | 说明 | 参数 |
53 | | ------------- | ------------ | -------------------------------------------- |
54 | | label | 是否显示文字 | `(flag: Boolean)` |
55 | | labelPosition | 文字位置 | `(pos: 'top' | 'right' | 'bottom' | 'left')` |
56 |
--------------------------------------------------------------------------------
/website/views/demo/Funnel/funnel-others.md:
--------------------------------------------------------------------------------
1 | ## 样式调整
2 |
3 | :::demo
4 |
5 | ```javascript
6 | const data = [
7 | { value: 3350, label: "直接访问" },
8 | { value: 1648, label: "搜索引擎" },
9 | { value: 2440, label: "联盟广告" },
10 | { value: 1550, label: "视频广告" },
11 | { value: 3000, label: "邮件营销" },
12 | ]
13 | data.sort((a, b) => {
14 | return b.value - a.value
15 | })
16 | const { Chart, Funnel, Tooltip, Legend } = qcharts
17 |
18 | const chart = new Chart({
19 | container: "#app",
20 | })
21 |
22 | chart.source(data, {
23 | row: "label",
24 | value: "value",
25 | text: "label",
26 | })
27 | const tooltip = new Tooltip()
28 | const rightFunnel = new Funnel({
29 | clientRect: {
30 | left: "22%",
31 | top: "15%",
32 | width: "25%",
33 | height: "70%",
34 | },
35 | align: "right",
36 | pyramid: true,
37 | })
38 | .style("guideline", true)
39 | .style("guideText", true)
40 |
41 | const leftFunnel = new Funnel({
42 | clientRect: {
43 | left: "50%",
44 | top: "15%",
45 | width: "25%",
46 | height: "70%",
47 | },
48 | align: "left",
49 | pyramid: true,
50 | })
51 | .style("guideline", true)
52 | .style("guideText", true)
53 | const legend = new Legend({ align: ["center", "bottom"] })
54 | chart.append([rightFunnel, leftFunnel, tooltip, legend])
55 | ```
56 |
57 | :::
58 |
--------------------------------------------------------------------------------
/website/views/more/pie/donut.md:
--------------------------------------------------------------------------------
1 | ## Donut Chart 动态环图
2 |
3 | :::demo
4 |
5 | ```javascript
6 | const data = [
7 | {
8 | year: '2016',
9 | sales: 17,
10 | selected: true
11 | },
12 | {
13 | year: '2017',
14 | sales: 28
15 | },
16 | {
17 | year: '2018',
18 | sales: 25
19 | },
20 | {
21 | year: '2019',
22 | sales: 7
23 | },
24 | {
25 | year: '2020',
26 | sales: 22
27 | }
28 | ]
29 | const length = data.length
30 | let counter = 0
31 | const { Chart, Pie } = qcharts
32 | const { Label } = spritejs
33 | const chart = new Chart({
34 | container: '#app'
35 | })
36 |
37 | chart.source(data, {
38 | row: 'year',
39 | value: 'sales'
40 | })
41 |
42 | const pie = new Pie({
43 | innerRadius: 0.4,
44 | radius: 0.5,
45 | animation: { duration: 400 },
46 | formatter: function(str) {
47 | return `${str} %`
48 | }
49 | })
50 |
51 | chart.append([pie])
52 |
53 | setInterval(changeData, 3000)
54 | //数据被选中动画模拟,轮流设置数据的selected属性,同时移除上一个数据的selected属性
55 | function changeData() {
56 | if (counter < 4) {
57 | counter++
58 | } else {
59 | counter = 0
60 | }
61 | pie.dataset.forEach((item, ind) => {
62 | if (item.state === 'hover' && ind !== counter) {
63 | item.state = 'default'
64 | }
65 | })
66 | pie.dataset[counter].state = 'hover'
67 | }
68 | ```
69 |
70 | :::
71 |
--------------------------------------------------------------------------------
/website/views/demo/VisualLink/basic.md:
--------------------------------------------------------------------------------
1 | ## visual 联动
2 |
3 | :::demo
4 |
5 | ```javascript
6 | const data = [
7 | { value: 3350, label: '直接访问' },
8 | { value: 1548, label: '搜索引擎', selected: true },
9 | { value: 2340, label: '联盟广告' },
10 | { value: 1350, label: '视频广告' },
11 | { value: 3100, label: '邮件营销' }
12 | ]
13 | const total = data.reduce((a, c) => (a += c['value']), 0)
14 |
15 | const { Chart, Pie, Progress, Legend, Tooltip } = qcharts
16 |
17 | const chart = new Chart({
18 | container: '#app'
19 | })
20 |
21 | chart.source(data, {
22 | row: 'label',
23 | col: 'value',
24 | value: 'value'
25 | })
26 |
27 | const ds = chart.dataset
28 |
29 | const pie = new Pie({
30 | radius: 0.6,
31 | translateOnClick: false
32 | })
33 | const progress = new Progress({
34 | min: 0,
35 | max: total,
36 | pos: ['75%', 0],
37 | size: ['25%', '25%'],
38 | lineWidth: 2,
39 | formatter: (d) => d.label + ':' + ((d.value / total) * 100).toFixed(0) + '%'
40 | })
41 | const legend = new Legend()
42 |
43 | pie.on('select', (attrs, data, index) => {
44 | const { label } = data
45 | const color = pie.color(index)
46 | progress.style('normal', { wavesColor: color, outlineColor: color }).source(ds.selectRows(label))
47 | })
48 |
49 | progress.source(ds.selectRows('直接访问'))
50 |
51 | chart.append([pie, legend, progress])
52 | ```
53 |
54 | :::
55 |
--------------------------------------------------------------------------------
/website/views/doc/api/Pie.md:
--------------------------------------------------------------------------------
1 | ### 图表介绍
2 |
3 | Pie, 饼图。
4 |
5 | ### attrs
6 |
7 | | 属性名 | 类型 | 默认值 | 描述 |
8 | | ----------- | -------------- | ------------------------------------ | -------------------------------------- |
9 | | clientRect | Object | {top,right,bottom,left,width,height} | 设置了 width,heigh,优先与 bottom,right |
10 | | startAngle | Number | `Math.PI * -0.5` | 起始角度 |
11 | | endAngle | Number | `Math.PI * 1.5` | 结束角度 |
12 | | radius | Number | `0.8` | 外半径比例 |
13 | | innerRadius | Number | `0` | 内半径比例 |
14 | | animation | Boolean,Object | {easing:'',duration} | 动画配置 |
15 |
16 | ### style
17 |
18 | ```javascript
19 | const pie = new Pie()
20 | pie.style('text', { color: '#fff' }
21 | ```
22 |
23 | 组件中可以自定义 css 属性的元素如下表:
24 |
25 | | 名称 | 基础类型 | 描述 |
26 | | --------- | -------- | -------------- |
27 | | sector | 面 | 扇形样式 |
28 | | text | 文本 | 扇形上文字样式 |
29 | | guideline | 线 | 指导线样式 |
30 | | guideText | 文本 | 指导文字样式 |
31 |
--------------------------------------------------------------------------------
/website/views/plugin/axis/axis-style.md:
--------------------------------------------------------------------------------
1 | ## 基础坐标轴
2 |
3 | :::demo 基础坐标
4 |
5 | ```javascript
6 | const data = [
7 | { month: 'Jan', city: 'London', value: 3.9 },
8 | { month: 'Feb', city: 'London', value: 4.2 },
9 | { month: 'Mar', city: 'London', value: 5.7 },
10 | { month: 'Apr', city: 'London', value: 8.5 },
11 | { month: 'May', city: 'London', value: 11.9 },
12 | { month: 'Jun', city: 'London', value: 15.2 }
13 | ]
14 |
15 | const { Chart, Axis, Line } = qcharts
16 |
17 | const chart = new Chart({
18 | container: '#app',
19 | size: ['100%', '100%']
20 | }).source(data, {
21 | row: 'city',
22 | value: 'value',
23 | text: 'month'
24 | })
25 |
26 | const line = new Line().style('point', { color: '#fff' })
27 |
28 | let xAxis = new Axis({})
29 | .style('label', function(attrs, data, i) {
30 | if (i % 2 === 0) {
31 | return false
32 | } else {
33 | if (data.text.indexOf('A') === 0) {
34 | return {
35 | rotate: 45,
36 | translate: [-5, -5],
37 | anchor: [0, 0],
38 | color: '#00f'
39 | }
40 | } else {
41 | return { color: '#f00' }
42 | }
43 | }
44 | })
45 | .style('scale', function(attrs, data, i) {
46 | if (i % 2 === 0) {
47 | return false
48 | }
49 | })
50 | let yAxis = new Axis({ orient: 'left' })
51 |
52 | chart.append([line, xAxis, yAxis])
53 | ```
54 |
55 | :::
56 |
--------------------------------------------------------------------------------
/website/views/plugin/legend/basic.md:
--------------------------------------------------------------------------------
1 | ## Legend
2 |
3 | 当实例化 `chart` 后,向 `chart` 添加 `Legend` 插件即可,`chart.append(new Legend())`。
4 |
5 | :::demo
6 |
7 | ```javascript
8 | const data = [{ value: 2010 }, { value: 2011 }, { value: 2012 }]
9 | const { Chart, Legend } = qcharts
10 |
11 | const chart = new Chart({ container: '#app' })
12 | chart.source(data, {
13 | value: 'value'
14 | })
15 |
16 | const l1 = new Legend({ orient: 'vertical', align: ['left', 'top'] })
17 | const l2 = new Legend({ orient: 'vertical', align: ['left', 'bottom'] })
18 | const l3 = new Legend({ orient: 'vertical', align: ['center', 'center'] })
19 | const l4 = new Legend({ orient: 'vertical', align: ['right', 'top'] })
20 | const l5 = new Legend({ orient: 'vertical', align: ['right', 'bottom'] })
21 |
22 | chart.append([l1, l2, l3, l4, l5])
23 | ```
24 |
25 | :::
26 |
27 | ### 属性
28 |
29 | | 属性名 | 类型 | 默认值 | 描述 |
30 | | ----------- | -------- | ------------------- | ----------------------------------------------------------------- |
31 | | `orient` | String | 'horizontal' | legend 排列方式,默认水平排列,可取值:`horizontal` 、 `vertical` |
32 | | `align` | Array | `['left', 'top']` | legend 绘制位置,默认靠左靠顶 |
33 | | `formatter` | Function | `d => d.value || d` | legend 文本格式化函数 |
34 |
--------------------------------------------------------------------------------
/src/utils/getStyle.js:
--------------------------------------------------------------------------------
1 | // merge style
2 | import { deepObjectMerge, jsType } from '@qcharts/utils'
3 | /**
4 | * chart:当前的图表
5 | * key:当前的样式名称
6 | * defaultstyle:为数组或者对象,表示默认的样式
7 | * args:调用style方法的时候,style以后的参数,如 line.style('line',function(...args){})
8 | */
9 | export function getStyle(chart, key, defaultStyle, args) {
10 | //合并样式
11 | let oStyle = defaultStyle
12 | let arrStyle = defaultStyle
13 | let oArgs = args
14 | if (jsType(defaultStyle) === 'array') {
15 | //oStyle = deepObjectMerge.apply(this, defaultStyle)
16 | oStyle = deepObjectMerge.call(this, {}, ...defaultStyle)
17 | } else {
18 | arrStyle = [defaultStyle]
19 | }
20 | if (jsType(args) !== 'array') {
21 | oArgs = [args]
22 | }
23 | let cusStyle = chart.style(key)(oStyle, ...oArgs)
24 | if (cusStyle === false) {
25 | return false
26 | } else if (arrStyle.includes(false) && cusStyle === undefined) {
27 | return false
28 | } else if (cusStyle !== undefined) {
29 | //如果返回的cusStyle不是false或者undefined,需要把default样式进行重写叠加
30 | let curStyle = defaultStyle
31 | if (jsType(defaultStyle) !== 'array') {
32 | curStyle = [defaultStyle]
33 | }
34 | //获取default样式
35 | let oDefaultStyle = chart.defaultStyles()[key]
36 | oStyle = deepObjectMerge({}, oDefaultStyle, curStyle.filter(Boolean)[0], oStyle)
37 | }
38 | let resStyle = deepObjectMerge({}, oStyle, cusStyle)
39 | return resStyle
40 | }
41 |
--------------------------------------------------------------------------------
/src/index.js:
--------------------------------------------------------------------------------
1 | import { h, easing } from '@qcharts/vnode'
2 | import Dataset from '@qcharts/dataset'
3 | import Line from './visuals/Line/index'
4 | import Pie from './visuals/Pie/index'
5 | import Area from './visuals/Area/index'
6 | import Radar from './visuals/Radar/index'
7 | import Bar from './visuals/Bar/index'
8 | import PolarBar from './visuals/PolarBar/index'
9 | import Funnel from './visuals/Funnel/index'
10 | import Scatter from './visuals/Scatter/index'
11 | import Wave from './visuals/Wave/index'
12 | import Gauge from './visuals/Gauge'
13 | import RadialBar from './visuals/RadialBar'
14 | import Axis from './plugins/Axis/index'
15 | import Legend from './plugins/Legend/index'
16 | import Tooltip from './plugins/Tooltip/index'
17 | import { getGlobal } from './base/platform'
18 | import Chart from './Chart'
19 | import theme from './theme/default'
20 | const version = '1.0.37'
21 | const qcharts = {
22 | version,
23 | Line,
24 | Pie,
25 | Area,
26 | Radar,
27 | Bar,
28 | PolarBar,
29 | Funnel,
30 | Scatter,
31 | Gauge,
32 | RadialBar,
33 | Legend,
34 | Axis,
35 | Wave,
36 | Tooltip,
37 | h,
38 | theme,
39 | Chart,
40 | easing
41 | }
42 |
43 | const global = getGlobal()
44 | global.qcharts = qcharts
45 |
46 | export { Dataset, Line, Pie, Area, Wave, Radar, Tooltip, Bar, PolarBar, Funnel, Scatter, Gauge, RadialBar, Axis, Legend, Chart, h, theme, easing, version }
47 |
48 | export default qcharts
49 |
--------------------------------------------------------------------------------
/website/views/demo/Area/area-nostack.md:
--------------------------------------------------------------------------------
1 | :::demo
2 |
3 | ```javascript
4 | const data = [
5 | { product: '茶叶', year: '2016', sales: 81.2 },
6 | { product: '茶叶', year: '2017', sales: 121.2 },
7 | { product: '茶叶', year: '2018', sales: 41.2 },
8 | { product: '牛奶', year: '2016', sales: 89.2 },
9 | { product: '牛奶', year: '2017', sales: 50.6 },
10 | { product: '牛奶', year: '2018', sales: 80.2 },
11 | { product: '咖啡', year: '2016', sales: 35.2 },
12 | { product: '咖啡', year: '2017', sales: 79.6 },
13 | { product: '咖啡', year: '2018', sales: 61.2 },
14 | { product: '椰汁', year: '2016', sales: 55.2 },
15 | { product: '椰汁', year: '2017', sales: 69.6 },
16 | { product: '椰汁', year: '2018', sales: 21.2 }
17 | ]
18 |
19 | const { Chart, Area, Legend, Tooltip, Axis } = qcharts
20 |
21 | const chart = new Chart({
22 | container: '#app'
23 | })
24 |
25 | chart.source(data, {
26 | row: 'year',
27 | value: 'sales',
28 | text: 'product'
29 | })
30 |
31 | const area = new Area({ stack: false })
32 |
33 | const tooltip = new Tooltip({
34 | formatter: function(data) {
35 | return `${data.product} ${data.year} ${data.sales}`
36 | }
37 | })
38 |
39 | const axisBottom = new Axis()
40 |
41 | const axisLeft = new Axis({ orient: 'left' }).style('axis', false).style('scale', false)
42 |
43 | const legend = new Legend({ align: ['center', 'bottom'] })
44 |
45 | chart.append([area, tooltip, axisBottom, axisLeft, legend])
46 | ```
47 |
48 | :::
49 |
--------------------------------------------------------------------------------
/website/views/plugin/axis/axis-default.md:
--------------------------------------------------------------------------------
1 | ## 基础坐标轴
2 |
3 | :::demo 基础坐标
4 |
5 | ```javascript
6 | const data = [
7 | { month: 'Jan', city: 'London', value: 3.9 },
8 | { month: 'Feb', city: 'London', value: 4.2 },
9 | { month: 'Mar', city: 'London', value: 5.7 },
10 | { month: 'Apr', city: 'London', value: 8.5 },
11 | { month: 'May', city: 'London', value: 11.9 },
12 | { month: 'Jun', city: 'London', value: 15.2 }
13 | ]
14 |
15 | const { Chart, Axis, Line } = qcharts
16 |
17 | const chart = new Chart({
18 | container: '#app',
19 | size: ['100%', '100%']
20 | }).source(data, {
21 | row: 'city',
22 | value: 'value',
23 | text: 'month'
24 | })
25 |
26 | const line = new Line().style('point', { color: '#fff' })
27 |
28 | let xAxis = new Axis({
29 | formatter: (str) => {
30 | return str + '-' + 1
31 | }
32 | })
33 | let yAxis = new Axis({ orient: 'left' })
34 |
35 | chart.append([line, xAxis, yAxis])
36 | ```
37 |
38 | :::
39 |
40 | #### 方法:
41 |
42 | | 名称 | 说明 | 类型 | 可选值 | 默认值 |
43 | | ------ | ------------ | ---- | ------------------------------- | -------- |
44 | | orient | 坐标轴的方向 | | ['top','right','bottom','left'] | 'bottom' |
45 |
46 | #### style 属性:
47 |
48 | | 名称 | 说明 | 类型 |
49 | | ----- | ------------ | --------------------- |
50 | | axis | 轴体的样式 | 轴体对应 Rect 类 |
51 | | scale | 刻度的样式 | scale 对应 Rect 类 |
52 | | label | 轴上文本样式 | label 对应的 label 类 |
53 |
--------------------------------------------------------------------------------
/website/views/doc/api/index.js:
--------------------------------------------------------------------------------
1 | export default [
2 | {
3 | title: '',
4 | path: '',
5 | redirect: 'pie'
6 | },
7 | {
8 | title: 'Line(折线图)',
9 | path: 'line',
10 | component: () => import('./line-api.md')
11 | },
12 | {
13 | title: 'Area(面积图)',
14 | path: 'area',
15 | component: () => import('./area-api.md')
16 | },
17 | {
18 | title: 'Bar(柱状图、条形图)',
19 | path: 'bar',
20 | component: () => import('./bar-api.md')
21 | },
22 | {
23 | title: 'Pie(饼图)',
24 | path: 'pie',
25 | component: () => import('./Pie.md')
26 | },
27 |
28 | {
29 | title: 'Radar(雷达图)',
30 | path: 'radar',
31 | component: () => import('./radar.md')
32 | },
33 | {
34 | title: 'Scatter(散点图)',
35 | path: 'scatter',
36 | component: () => import('./scatter.md')
37 | },
38 | {
39 | title: 'Wave(水波图)',
40 | path: 'wave',
41 | component: () => import('./wave.md')
42 | },
43 | {
44 | title: 'Funnel(漏斗图)',
45 | path: 'funnel',
46 | component: () => import('./funnel-api.md')
47 | },
48 |
49 | {
50 | title: 'Gauge(仪表盘)',
51 | path: 'gauge',
52 | component: () => import('./Gauge.md')
53 | },
54 |
55 | {
56 | title: 'RadialBar(玉块图)',
57 | path: 'radialBar',
58 | component: () => import('./RadialBar.md')
59 | },
60 |
61 | {
62 | title: 'PolarBar(极坐标柱状图)',
63 | path: 'polarBar',
64 | component: () => import('./polarBar.md')
65 | }
66 | ]
67 |
--------------------------------------------------------------------------------
/website/views/demo/pie/dounght.md:
--------------------------------------------------------------------------------
1 | ## Donut Chart 环图
2 |
3 | :::demo
4 |
5 | ```javascript
6 | const data = [
7 | {
8 | year: '2001',
9 | population: 4
10 | },
11 | {
12 | year: '2002',
13 | population: 38
14 | },
15 | {
16 | year: '2003',
17 | population: 33.7
18 | },
19 | {
20 | year: '2004',
21 | population: 30.7
22 | },
23 | {
24 | year: '2005',
25 | population: 25.8
26 | },
27 | {
28 | year: '2006',
29 | population: 31.7
30 | },
31 | {
32 | year: '2007',
33 | population: 33
34 | },
35 | {
36 | year: '2008',
37 | population: 46
38 | },
39 | {
40 | year: '2009',
41 | population: 38.3
42 | },
43 | {
44 | year: '2010',
45 | population: 2800
46 | }
47 | ]
48 |
49 | const { Chart, Pie, Legend, Tooltip } = qcharts
50 |
51 | const chart = new Chart({
52 | container: '#app'
53 | })
54 |
55 | chart.source(data, {
56 | row: 'year',
57 | value: 'population',
58 | //布局数据方式
59 | layoutScale: 'sqrt'
60 | })
61 |
62 | const pie = new Pie({
63 | innerRadius: 0.4,
64 | radius: 0.7,
65 | clientRect: { top: '10%', left: '10%', right: '10%', bottom: '10%' }
66 | })
67 | pie.style('sector', { lineWidth: 1, strokeColor: '#fff' })
68 | pie.style('guideline', true)
69 | pie.style('guideText', { fontSize: '12px' })
70 |
71 | const legend = new Legend({ orient: 'vertical', align: ['right', 'center'] })
72 |
73 | chart.append([pie, legend])
74 | ```
75 |
76 | :::
77 |
--------------------------------------------------------------------------------
/website/views/more/test/style.md:
--------------------------------------------------------------------------------
1 | ## Double Line Chart 双 Y 轴折线图
2 |
3 | :::demo
4 |
5 | ```javascript
6 | const data = [
7 | { date: '05-01', category: '图例一', sales: 15.2 },
8 | { date: '05-02', category: '图例一', sales: 39.2 },
9 | { date: '05-03', category: '图例一', sales: 51.2 },
10 | { date: '05-04', category: '图例一', sales: 65.2 },
11 | { date: '05-05', category: '图例一', sales: 55.2 },
12 | { date: '05-06', category: '图例一', sales: 75.2 },
13 | { date: '05-07', category: '图例一', sales: 85.2 },
14 | { date: '05-08', category: '图例一', sales: 65.2 },
15 | { date: '05-01', category: '图例二', sales: 20.2 },
16 | { date: '05-02', category: '图例二', sales: 49.2 },
17 | { date: '05-03', category: '图例二', sales: 57.2 },
18 | { date: '05-04', category: '图例二', sales: 55.2 },
19 | { date: '05-05', category: '图例二', sales: 75.2 },
20 | { date: '05-06', category: '图例二', sales: 95.2 },
21 | { date: '05-07', category: '图例二', sales: 90.2 },
22 | { date: '05-08', category: '图例二', sales: 85.2 }
23 | ]
24 | const { Chart, Line } = qcharts
25 | const $wrap = document.querySelector('#app')
26 | const chart = new Chart({
27 | container: $wrap
28 | })
29 |
30 | chart.source(data, {
31 | row: 'category',
32 | value: 'sales',
33 | text: 'date'
34 | })
35 | const line = new Line({ splitNumber: 5 })
36 | //line.style({ line: { lineWidth: 2 } })
37 | chart.dataset.on('change', function(res) {
38 | console.log('dataset', res)
39 | })
40 |
41 | chart.append([line])
42 | ```
43 |
44 | :::
45 |
--------------------------------------------------------------------------------
/website/views/doc/chart.md:
--------------------------------------------------------------------------------
1 | ## 图表结构
2 |
3 | 图表由 chart、visual、plugin 组成
4 |
5 |
48 |
49 | 也可以单独设置某个组件的样式,单独通过 style 设置的优先级高于统一 theme 设置
50 |
51 | ```js
52 | const line = new Line()
53 | line.style('point', { pointType: 'star', angles: 5, innerRadius: 5, outerRadius: 10, strokeColor: '#fff' })
54 | line.style('point:hover', { strokeColor: '#f0f' })
55 | ```
56 |
--------------------------------------------------------------------------------
/website/views/doc/routes.js:
--------------------------------------------------------------------------------
1 | import generateCommonPage from '../../utils/generateCommonPage'
2 | import apiRoutes from './api'
3 | import pluginsRoutes from './plugins'
4 |
5 | export default [
6 | {
7 | title: '',
8 | path: '',
9 | redirect: 'apiinfo'
10 | },
11 | {
12 | title: 'Chart 图表主体',
13 | path: 'chart',
14 | component: () => import('./chart.md')
15 | },
16 | {
17 | title: 'Dataset 数据集',
18 | path: 'dataset',
19 | component: () => import('./dataset.md')
20 | },
21 | {
22 | title: 'Theme主题',
23 | path: 'theme',
24 | component: () => import('./theme.md')
25 | },
26 | {
27 | title: 'API简述',
28 | path: 'apiinfo',
29 | component: () => import('./apiinfo.md')
30 | },
31 | {
32 | title: 'Visual(图形)',
33 | path: 'api',
34 | component: generateCommonPage('/doc/api/', apiRoutes),
35 | children: apiRoutes
36 | },
37 |
38 | {
39 | title: 'Plugin(插件)',
40 | path: 'plugin',
41 | component: generateCommonPage('/doc/plugin/', pluginsRoutes),
42 | children: pluginsRoutes
43 | }
44 |
45 | // {
46 | // title: '自定义样式',
47 | // path: 'style',
48 | // component: () => import('./style.md')
49 | // },
50 | ]
51 |
--------------------------------------------------------------------------------
/website/views/doc/api/scatter.md:
--------------------------------------------------------------------------------
1 | ## 散点图
2 |
3 | ### 图表介绍
4 |
5 | 散点图根据数据的 x,y 确定散点的位置,气泡图是散点图的一种扩展,气泡图相较于散点图多一个维度,通过 **areaField** 字段可设置气泡的大小,默认为 areaField 值的大小,也可设置
6 | **areaRange** 将 areaField 的值进行线性映射。气泡图还可以通过 **labelField** 字段来设置显示的 label 。
7 |
8 | ### attrs
9 |
10 | | 属性 | 说明 | 类型 | 默认值 |
11 | | ------------- | --------------------------------------------------------- | ------- | ------ |
12 | | areaField | 气泡大小字段值,不设置此值则为散点图,可通过 style 自定义 | String | null |
13 | | areaRange | 面积映射,设置此值则将 areaField 进行线性映射 | Array | null |
14 | | labelField | 气泡图中显示 label 的字段,可通过 style 自定义 | String | null |
15 | | showGuideLine | hover 时的辅助线,默认不显示辅助线 | Boolean | false |
16 | | layoutWay | 坐标轴的相关属性 | Object | null |
17 |
18 | ### 可设置 style 名称
19 |
20 | | 名称 | 基本类型 | 说明 |
21 | | ----------- | -------- | ------------------- |
22 | | point | 面 | 点的样式,拥有Arc元素的全部属性 |
23 | | point:hover | 面 | 点 hover 样式,拥有Arc元素的全部属性 |
24 | | label | 文本 | label 样式 |
25 | | guideline | 线 | 指导线样式 |
26 |
--------------------------------------------------------------------------------
/website/views/plugin/tooltip/title.md:
--------------------------------------------------------------------------------
1 | ## 标题设置
2 |
3 | `Tooltip` 的标题可以设置为 `string`,也可以设置为 `function`。两者区别:`string` 将固定标题为某字符串,`function` 则将 title 设置为函数返回值。
4 |
5 | :::demo
6 |
7 | ```javascript
8 | const data = [1, 2, 3, 4, 5].map((num) => {
9 | return { value: num }
10 | })
11 |
12 | const { Chart, Pie, Legend, Tooltip } = qcharts
13 |
14 | const chart = new Chart({
15 | container: '#app',
16 | size: ['100%', '100%']
17 | })
18 |
19 | chart.source(data, { value: 'value' })
20 |
21 | const pie = new Pie()
22 |
23 | const tooltip = new Tooltip({ title: '数字', formatter: (d) => d.value })
24 |
25 | chart.append([pie, tooltip])
26 | ```
27 |
28 | :::
29 |
30 | :::demo
31 |
32 | ```javascript
33 | const data = [1, 2, 3, 4, 5].map((num) => {
34 | return { value: num }
35 | })
36 |
37 | const { Chart, Pie, Legend, Tooltip } = qcharts
38 |
39 | const chart = new Chart({
40 | container: '#app',
41 | size: ['100%', '100%']
42 | })
43 |
44 | chart.source(data, { value: 'value' })
45 |
46 | const pie = new Pie()
47 |
48 | const tooltip = new Tooltip({
49 | title: (d) => {
50 | return `数组 ${d[0].value}`
51 | },
52 | formatter: (d) => d.value
53 | })
54 |
55 | chart.append([pie, tooltip])
56 | ```
57 |
58 | :::
59 |
--------------------------------------------------------------------------------
/website/views/demo/Wave/wave.md:
--------------------------------------------------------------------------------
1 | ## 水波进度
2 |
3 | :::demo
4 |
5 | ```javascript
6 | const data = [
7 | {
8 | sex: 'male',
9 | value: 63
10 | },
11 | {
12 | sex: 'middle',
13 | value: 16
14 | },
15 | {
16 | sex: 'female',
17 | value: 21
18 | }
19 | ]
20 |
21 | const { Chart, Progress, Tooltip } = qcharts
22 |
23 | const chart = new Chart({ container: '#app' })
24 |
25 | const colors = ['#49d088', '#FE5555', '#F4B30E', 'red']
26 |
27 | const progress = new Progress({
28 | min: 0,
29 | max: 100,
30 | type: 'wave',
31 | radius: 60,
32 | offset: 10,
33 | lineWidth: 10
34 | })
35 | .source(data)
36 | .setDataFields({ x: 'sex', y: 'value' })
37 | .style('normal', (attrs, d, i) => {
38 | return { fillColor: colors[i], color: colors[3 - i] }
39 | })
40 | .formatter((d) => `${d.value}`)
41 |
42 | chart.append(progress).add(new Tooltip().formatter((d) => `${d.value}`))
43 | ```
44 |
45 | :::
46 |
47 | ### 属性
48 |
49 | 当 `type` 为 `wave` 时,相关属性如下。
50 |
51 | | 名称 | 说明 | 参数 |
52 | | --------- | -------------- | --------------- |
53 | | radius | 内圈圆半径 | `(val: Number)` |
54 | | lineWidth | 外圈圆环宽度 | `(val: Number)` |
55 | | offset | 内外圈之间留白 | `(val: Number)` |
56 |
--------------------------------------------------------------------------------
/website/views/demo/Gauge/style.md:
--------------------------------------------------------------------------------
1 | ## 样式调整
2 |
3 | - `arc`: 控制弧线
4 | - `title`: 控制仪表盘中心标题
5 | - `subTitle`: 控制仪表盘中心副标题
6 | - `tickLine`: 控制刻度线
7 | - `tickText`: 控制刻度文字
8 |
9 | :::demo
10 |
11 | ```javascript
12 | const data = [
13 | {
14 | text: '收入',
15 | value: 600
16 | }
17 | ]
18 |
19 | const { Chart, Gauge, Legend, Tooltip } = qcharts
20 |
21 | const chart = new Chart({ container: '#app', forceFit: true })
22 |
23 | chart.source(data, {
24 | row: 'text',
25 | value: 'value'
26 | })
27 |
28 | const gauge = new Gauge({
29 | min: 0,
30 | max: 1000,
31 | tickStep: 200,
32 | title: '标题',
33 | subTitle: '副标题'
34 | })
35 |
36 | gauge.style('arc', { color: '#0f0' })
37 |
38 | gauge.style('title', { color: 'red' })
39 | gauge.style('subTitle', { color: 'blue' })
40 |
41 | gauge.style('tickLine', (attrs, data, i) => {
42 | if (i % 2) {
43 | return { color: '#f00', lineWidth: 2 }
44 | } else if (i === 4) {
45 | return { color: 'transparent' }
46 | }
47 | })
48 | gauge.style('tickText', (attrs, data, i) => {
49 | if (i % 2) {
50 | return { color: '#f00', lineWidth: 2 }
51 | } else if (i === 2) {
52 | return { color: 'transparent' }
53 | }
54 | })
55 |
56 | chart.append(gauge)
57 | ```
58 |
59 | :::
60 |
--------------------------------------------------------------------------------
/website/views/demo/line/routes.js:
--------------------------------------------------------------------------------
1 | export default [
2 | {
3 | title: '',
4 | path: '',
5 | redirect: 'default'
6 | },
7 | {
8 | title: '基础折线图',
9 | path: 'default',
10 | component: () => import('./line-default.md')
11 | },
12 | {
13 | title: '双折线图',
14 | path: 'double',
15 | component: () => import('./line-double.md')
16 | },
17 | {
18 | title: '曲线折线图',
19 | path: 'smooth',
20 | component: () => import('./line-smooth.md')
21 | },
22 | {
23 | title: '多折线图',
24 | path: 'multi',
25 | component: () => import('./line-multi.md')
26 | }
27 | // {
28 | // title: '其它',
29 | // path: 'others',
30 | // component: () => import('./line-others.md')
31 | // },
32 | // {
33 | // title: '个性化',
34 | // path: 'style',
35 | // component: () => import('./line-style.md')
36 | // },
37 | // {
38 | // title: '数据更新',
39 | // path: 'update',
40 | // component: () => import('./line-update.md')
41 | // },
42 | // {
43 | // title: '交换坐标轴',
44 | // path: 'swapaxis',
45 | // component: () => import('./line-swapaxis.md')
46 | // },
47 | // {
48 | // title: '多图融合',
49 | // path: 'axisgap',
50 | // component: () => import('./line-gap.md')
51 | // }
52 | ]
53 |
--------------------------------------------------------------------------------
/website/views/more/radar/pointStyle.md:
--------------------------------------------------------------------------------
1 | ### 修改雷达图点形状
2 |
3 | :::demo
4 |
5 | ```javascript
6 | const data = [
7 | { label: '分类一', category: '类别一', value: 19 },
8 | { label: '分类二', category: '类别一', value: 74 },
9 | { label: '分类三', category: '类别一', value: 40 },
10 | { label: '分类四', category: '类别一', value: 46 },
11 | { label: '分类五', category: '类别一', value: 30 },
12 | { label: '分类六', category: '类别一', value: 62 },
13 |
14 | { label: '分类一', category: '类别二', value: 69 },
15 | { label: '分类二', category: '类别二', value: 14 },
16 | { label: '分类三', category: '类别二', value: 70 },
17 | { label: '分类四', category: '类别二', value: 26 },
18 | { label: '分类五', category: '类别二', value: 50 },
19 | { label: '分类六', category: '类别二', value: 52 }
20 | ]
21 |
22 | const { Chart, Radar, Tooltip, Legend } = qcharts
23 |
24 | const chart = new Chart({
25 | container: '#app'
26 | })
27 | chart.source(data, {
28 | row: 'category',
29 | value: 'value',
30 | text: 'label'
31 | })
32 |
33 | const radar = new Radar()
34 |
35 | radar.style('point', (d, data, i) => {
36 | if (data.category === '类别一') {
37 | return { pointType: 'rect' }
38 | }
39 | })
40 |
41 | const legend = new Legend({ align: ['center', 'bottom'] })
42 | chart.append([radar, legend])
43 | ```
44 |
45 | :::
46 |
--------------------------------------------------------------------------------
/website/views/demo/radar/radar.md:
--------------------------------------------------------------------------------
1 | ## 基本雷达图
2 |
3 | :::demo 基本雷达图
4 |
5 | ```javascript
6 | const data = [
7 | { label: '分类一', category: '类别一', value: 19 },
8 | { label: '分类二', category: '类别一', value: 74 },
9 | { label: '分类三', category: '类别一', value: 40 },
10 | { label: '分类四', category: '类别一', value: 46 },
11 | { label: '分类五', category: '类别一', value: 30 },
12 | { label: '分类六', category: '类别一', value: 62 },
13 |
14 | { label: '分类一', category: '类别二', value: 69 },
15 | { label: '分类二', category: '类别二', value: 14 },
16 | { label: '分类三', category: '类别二', value: 70 },
17 | { label: '分类四', category: '类别二', value: 26 },
18 | { label: '分类五', category: '类别二', value: 50 },
19 | { label: '分类六', category: '类别二', value: 52 },
20 | ]
21 |
22 | const { Chart, Radar,Legend, Tooltip } = qcharts
23 |
24 | const chart = new Chart({
25 | container: '#app',
26 | })
27 | chart.source(data, {
28 | row: 'category',
29 | value: 'value',
30 | text: 'label',
31 | })
32 | const radar = new Radar()
33 | radar.style('section', (d) => ({ opacity: 0.3 }))
34 | .style('section:hover',d=>({opacity: 0.8,lineWidth:2,strokeColor:'red'}))
35 |
36 | const legend = new Legend({ align: ['center', 'bottom'] })
37 |
38 | chart.append([radar,legend, new Tooltip()])
39 | ```
40 |
41 | :::
42 |
--------------------------------------------------------------------------------
/website/views/demo/pie/rose_layoutScale.md:
--------------------------------------------------------------------------------
1 | ## Nightingle Rose Chart 南丁格尔玫瑰图 - 数值变换
2 |
3 | :::demo
4 |
5 | ```javascript
6 | let data = [
7 | { value: 335, name: '直接访问' },
8 | { value: 210, name: '邮件营销' },
9 | { value: 2800, name: '联盟广告' },
10 | { value: 254, name: '视频广告' },
11 | { value: 200, name: '搜索引擎' }
12 | ]
13 | const { Chart, Pie, Tooltip, Legend } = qcharts
14 |
15 | const chart = new Chart({ container: '#app' })
16 |
17 | chart.source(data, {
18 | row: 'name',
19 | value: 'value',
20 | layoutScale: 'log' //['log','log2','log10','sqrt','sqrt3','sqrt~n','pow','pow3','pow~n']
21 | })
22 |
23 | const pie = new Pie({
24 | radius: 0.7,
25 | pos: [0, 0],
26 | size: ['80%', '100%'],
27 | rose: true
28 | })
29 | pie.style('guideline', true)
30 | pie.style('guideText', { fontSize: '12px' })
31 |
32 | const legend = new Legend({
33 | formatter: function(name, data, i) {
34 | return name
35 | //console.log(data)
36 | },
37 | orient: 'vertical',
38 | align: ['right', 'center']
39 | })
40 | legend.style('icon', (attrs, d, i) => ({
41 | borderRadius: 10,
42 | marginTop: i > 0 ? 15 : 0
43 | }))
44 | legend.style('text', (attrs, d, i) => ({
45 | marginTop: i > 0 ? 15 : 0
46 | }))
47 |
48 | chart.append(pie)
49 | chart.append(legend)
50 | ```
51 |
52 | :::
53 |
--------------------------------------------------------------------------------
/website/views/demo/Wave/label.md:
--------------------------------------------------------------------------------
1 | ## 文字
2 |
3 | 目前 `labelPosition` 只支持 `top`、`right`、`bottom` 和 `left` 之一,如果需要作偏移,可以配合使用 `spritejs.Label` 的 `translate` 属性。
4 |
5 | :::demo
6 |
7 | ```javascript
8 | const data = [
9 | {
10 | sex: 'male',
11 | value: 63
12 | },
13 |
14 | {
15 | sex: 'middle',
16 | value: 16
17 | },
18 |
19 | {
20 | sex: 'female',
21 | value: 21
22 | }
23 | ]
24 |
25 | const { Chart, Progress, Tooltip } = qcharts
26 |
27 | const chart = new Chart({ container: '#app' })
28 |
29 | chart.source(data, {
30 | row: 'sex',
31 | text: 'sex',
32 | value: 'value'
33 | })
34 |
35 | const colors = ['#49d088', '#FE5555', '#F4B30E', 'red']
36 |
37 | const progress = new Progress({
38 | min: 0,
39 | max: 100,
40 | label: true,
41 | labelPosition: 'top',
42 | formatter: (d) => `${d.value}`
43 | })
44 |
45 | chart.append(progress).add(new Tooltip({ formatter: (d) => `${d.value}` }))
46 | ```
47 |
48 | :::
49 |
50 | ### 属性
51 |
52 | | 名称 | 说明 | 参数 |
53 | | ------------- | ------------ | -------------------------------------------- |
54 | | label | 是否显示文字 | `(flag: Boolean)` |
55 | | labelPosition | 文字位置 | `(pos: 'top' | 'right' | 'bottom' | 'left')` |
56 |
--------------------------------------------------------------------------------
/website/views/demo/Funnel/funnel-others.md:
--------------------------------------------------------------------------------
1 | ## 样式调整
2 |
3 | :::demo
4 |
5 | ```javascript
6 | const data = [
7 | { value: 3350, label: "直接访问" },
8 | { value: 1648, label: "搜索引擎" },
9 | { value: 2440, label: "联盟广告" },
10 | { value: 1550, label: "视频广告" },
11 | { value: 3000, label: "邮件营销" },
12 | ]
13 | data.sort((a, b) => {
14 | return b.value - a.value
15 | })
16 | const { Chart, Funnel, Tooltip, Legend } = qcharts
17 |
18 | const chart = new Chart({
19 | container: "#app",
20 | })
21 |
22 | chart.source(data, {
23 | row: "label",
24 | value: "value",
25 | text: "label",
26 | })
27 | const tooltip = new Tooltip()
28 | const rightFunnel = new Funnel({
29 | clientRect: {
30 | left: "22%",
31 | top: "15%",
32 | width: "25%",
33 | height: "70%",
34 | },
35 | align: "right",
36 | pyramid: true,
37 | })
38 | .style("guideline", true)
39 | .style("guideText", true)
40 |
41 | const leftFunnel = new Funnel({
42 | clientRect: {
43 | left: "50%",
44 | top: "15%",
45 | width: "25%",
46 | height: "70%",
47 | },
48 | align: "left",
49 | pyramid: true,
50 | })
51 | .style("guideline", true)
52 | .style("guideText", true)
53 | const legend = new Legend({ align: ["center", "bottom"] })
54 | chart.append([rightFunnel, leftFunnel, tooltip, legend])
55 | ```
56 |
57 | :::
58 |
--------------------------------------------------------------------------------
/website/views/more/pie/donut.md:
--------------------------------------------------------------------------------
1 | ## Donut Chart 动态环图
2 |
3 | :::demo
4 |
5 | ```javascript
6 | const data = [
7 | {
8 | year: '2016',
9 | sales: 17,
10 | selected: true
11 | },
12 | {
13 | year: '2017',
14 | sales: 28
15 | },
16 | {
17 | year: '2018',
18 | sales: 25
19 | },
20 | {
21 | year: '2019',
22 | sales: 7
23 | },
24 | {
25 | year: '2020',
26 | sales: 22
27 | }
28 | ]
29 | const length = data.length
30 | let counter = 0
31 | const { Chart, Pie } = qcharts
32 | const { Label } = spritejs
33 | const chart = new Chart({
34 | container: '#app'
35 | })
36 |
37 | chart.source(data, {
38 | row: 'year',
39 | value: 'sales'
40 | })
41 |
42 | const pie = new Pie({
43 | innerRadius: 0.4,
44 | radius: 0.5,
45 | animation: { duration: 400 },
46 | formatter: function(str) {
47 | return `${str} %`
48 | }
49 | })
50 |
51 | chart.append([pie])
52 |
53 | setInterval(changeData, 3000)
54 | //数据被选中动画模拟,轮流设置数据的selected属性,同时移除上一个数据的selected属性
55 | function changeData() {
56 | if (counter < 4) {
57 | counter++
58 | } else {
59 | counter = 0
60 | }
61 | pie.dataset.forEach((item, ind) => {
62 | if (item.state === 'hover' && ind !== counter) {
63 | item.state = 'default'
64 | }
65 | })
66 | pie.dataset[counter].state = 'hover'
67 | }
68 | ```
69 |
70 | :::
71 |
--------------------------------------------------------------------------------
/website/views/demo/VisualLink/basic.md:
--------------------------------------------------------------------------------
1 | ## visual 联动
2 |
3 | :::demo
4 |
5 | ```javascript
6 | const data = [
7 | { value: 3350, label: '直接访问' },
8 | { value: 1548, label: '搜索引擎', selected: true },
9 | { value: 2340, label: '联盟广告' },
10 | { value: 1350, label: '视频广告' },
11 | { value: 3100, label: '邮件营销' }
12 | ]
13 | const total = data.reduce((a, c) => (a += c['value']), 0)
14 |
15 | const { Chart, Pie, Progress, Legend, Tooltip } = qcharts
16 |
17 | const chart = new Chart({
18 | container: '#app'
19 | })
20 |
21 | chart.source(data, {
22 | row: 'label',
23 | col: 'value',
24 | value: 'value'
25 | })
26 |
27 | const ds = chart.dataset
28 |
29 | const pie = new Pie({
30 | radius: 0.6,
31 | translateOnClick: false
32 | })
33 | const progress = new Progress({
34 | min: 0,
35 | max: total,
36 | pos: ['75%', 0],
37 | size: ['25%', '25%'],
38 | lineWidth: 2,
39 | formatter: (d) => d.label + ':' + ((d.value / total) * 100).toFixed(0) + '%'
40 | })
41 | const legend = new Legend()
42 |
43 | pie.on('select', (attrs, data, index) => {
44 | const { label } = data
45 | const color = pie.color(index)
46 | progress.style('normal', { wavesColor: color, outlineColor: color }).source(ds.selectRows(label))
47 | })
48 |
49 | progress.source(ds.selectRows('直接访问'))
50 |
51 | chart.append([pie, legend, progress])
52 | ```
53 |
54 | :::
55 |
--------------------------------------------------------------------------------
/website/views/doc/api/Pie.md:
--------------------------------------------------------------------------------
1 | ### 图表介绍
2 |
3 | Pie, 饼图。
4 |
5 | ### attrs
6 |
7 | | 属性名 | 类型 | 默认值 | 描述 |
8 | | ----------- | -------------- | ------------------------------------ | -------------------------------------- |
9 | | clientRect | Object | {top,right,bottom,left,width,height} | 设置了 width,heigh,优先与 bottom,right |
10 | | startAngle | Number | `Math.PI * -0.5` | 起始角度 |
11 | | endAngle | Number | `Math.PI * 1.5` | 结束角度 |
12 | | radius | Number | `0.8` | 外半径比例 |
13 | | innerRadius | Number | `0` | 内半径比例 |
14 | | animation | Boolean,Object | {easing:'',duration} | 动画配置 |
15 |
16 | ### style
17 |
18 | ```javascript
19 | const pie = new Pie()
20 | pie.style('text', { color: '#fff' }
21 | ```
22 |
23 | 组件中可以自定义 css 属性的元素如下表:
24 |
25 | | 名称 | 基础类型 | 描述 |
26 | | --------- | -------- | -------------- |
27 | | sector | 面 | 扇形样式 |
28 | | text | 文本 | 扇形上文字样式 |
29 | | guideline | 线 | 指导线样式 |
30 | | guideText | 文本 | 指导文字样式 |
31 |
--------------------------------------------------------------------------------
/website/views/plugin/axis/axis-style.md:
--------------------------------------------------------------------------------
1 | ## 基础坐标轴
2 |
3 | :::demo 基础坐标
4 |
5 | ```javascript
6 | const data = [
7 | { month: 'Jan', city: 'London', value: 3.9 },
8 | { month: 'Feb', city: 'London', value: 4.2 },
9 | { month: 'Mar', city: 'London', value: 5.7 },
10 | { month: 'Apr', city: 'London', value: 8.5 },
11 | { month: 'May', city: 'London', value: 11.9 },
12 | { month: 'Jun', city: 'London', value: 15.2 }
13 | ]
14 |
15 | const { Chart, Axis, Line } = qcharts
16 |
17 | const chart = new Chart({
18 | container: '#app',
19 | size: ['100%', '100%']
20 | }).source(data, {
21 | row: 'city',
22 | value: 'value',
23 | text: 'month'
24 | })
25 |
26 | const line = new Line().style('point', { color: '#fff' })
27 |
28 | let xAxis = new Axis({})
29 | .style('label', function(attrs, data, i) {
30 | if (i % 2 === 0) {
31 | return false
32 | } else {
33 | if (data.text.indexOf('A') === 0) {
34 | return {
35 | rotate: 45,
36 | translate: [-5, -5],
37 | anchor: [0, 0],
38 | color: '#00f'
39 | }
40 | } else {
41 | return { color: '#f00' }
42 | }
43 | }
44 | })
45 | .style('scale', function(attrs, data, i) {
46 | if (i % 2 === 0) {
47 | return false
48 | }
49 | })
50 | let yAxis = new Axis({ orient: 'left' })
51 |
52 | chart.append([line, xAxis, yAxis])
53 | ```
54 |
55 | :::
56 |
--------------------------------------------------------------------------------
/website/views/plugin/legend/basic.md:
--------------------------------------------------------------------------------
1 | ## Legend
2 |
3 | 当实例化 `chart` 后,向 `chart` 添加 `Legend` 插件即可,`chart.append(new Legend())`。
4 |
5 | :::demo
6 |
7 | ```javascript
8 | const data = [{ value: 2010 }, { value: 2011 }, { value: 2012 }]
9 | const { Chart, Legend } = qcharts
10 |
11 | const chart = new Chart({ container: '#app' })
12 | chart.source(data, {
13 | value: 'value'
14 | })
15 |
16 | const l1 = new Legend({ orient: 'vertical', align: ['left', 'top'] })
17 | const l2 = new Legend({ orient: 'vertical', align: ['left', 'bottom'] })
18 | const l3 = new Legend({ orient: 'vertical', align: ['center', 'center'] })
19 | const l4 = new Legend({ orient: 'vertical', align: ['right', 'top'] })
20 | const l5 = new Legend({ orient: 'vertical', align: ['right', 'bottom'] })
21 |
22 | chart.append([l1, l2, l3, l4, l5])
23 | ```
24 |
25 | :::
26 |
27 | ### 属性
28 |
29 | | 属性名 | 类型 | 默认值 | 描述 |
30 | | ----------- | -------- | ------------------- | ----------------------------------------------------------------- |
31 | | `orient` | String | 'horizontal' | legend 排列方式,默认水平排列,可取值:`horizontal` 、 `vertical` |
32 | | `align` | Array | `['left', 'top']` | legend 绘制位置,默认靠左靠顶 |
33 | | `formatter` | Function | `d => d.value || d` | legend 文本格式化函数 |
34 |
--------------------------------------------------------------------------------
/src/utils/getStyle.js:
--------------------------------------------------------------------------------
1 | // merge style
2 | import { deepObjectMerge, jsType } from '@qcharts/utils'
3 | /**
4 | * chart:当前的图表
5 | * key:当前的样式名称
6 | * defaultstyle:为数组或者对象,表示默认的样式
7 | * args:调用style方法的时候,style以后的参数,如 line.style('line',function(...args){})
8 | */
9 | export function getStyle(chart, key, defaultStyle, args) {
10 | //合并样式
11 | let oStyle = defaultStyle
12 | let arrStyle = defaultStyle
13 | let oArgs = args
14 | if (jsType(defaultStyle) === 'array') {
15 | //oStyle = deepObjectMerge.apply(this, defaultStyle)
16 | oStyle = deepObjectMerge.call(this, {}, ...defaultStyle)
17 | } else {
18 | arrStyle = [defaultStyle]
19 | }
20 | if (jsType(args) !== 'array') {
21 | oArgs = [args]
22 | }
23 | let cusStyle = chart.style(key)(oStyle, ...oArgs)
24 | if (cusStyle === false) {
25 | return false
26 | } else if (arrStyle.includes(false) && cusStyle === undefined) {
27 | return false
28 | } else if (cusStyle !== undefined) {
29 | //如果返回的cusStyle不是false或者undefined,需要把default样式进行重写叠加
30 | let curStyle = defaultStyle
31 | if (jsType(defaultStyle) !== 'array') {
32 | curStyle = [defaultStyle]
33 | }
34 | //获取default样式
35 | let oDefaultStyle = chart.defaultStyles()[key]
36 | oStyle = deepObjectMerge({}, oDefaultStyle, curStyle.filter(Boolean)[0], oStyle)
37 | }
38 | let resStyle = deepObjectMerge({}, oStyle, cusStyle)
39 | return resStyle
40 | }
41 |
--------------------------------------------------------------------------------
/src/index.js:
--------------------------------------------------------------------------------
1 | import { h, easing } from '@qcharts/vnode'
2 | import Dataset from '@qcharts/dataset'
3 | import Line from './visuals/Line/index'
4 | import Pie from './visuals/Pie/index'
5 | import Area from './visuals/Area/index'
6 | import Radar from './visuals/Radar/index'
7 | import Bar from './visuals/Bar/index'
8 | import PolarBar from './visuals/PolarBar/index'
9 | import Funnel from './visuals/Funnel/index'
10 | import Scatter from './visuals/Scatter/index'
11 | import Wave from './visuals/Wave/index'
12 | import Gauge from './visuals/Gauge'
13 | import RadialBar from './visuals/RadialBar'
14 | import Axis from './plugins/Axis/index'
15 | import Legend from './plugins/Legend/index'
16 | import Tooltip from './plugins/Tooltip/index'
17 | import { getGlobal } from './base/platform'
18 | import Chart from './Chart'
19 | import theme from './theme/default'
20 | const version = '1.0.37'
21 | const qcharts = {
22 | version,
23 | Line,
24 | Pie,
25 | Area,
26 | Radar,
27 | Bar,
28 | PolarBar,
29 | Funnel,
30 | Scatter,
31 | Gauge,
32 | RadialBar,
33 | Legend,
34 | Axis,
35 | Wave,
36 | Tooltip,
37 | h,
38 | theme,
39 | Chart,
40 | easing
41 | }
42 |
43 | const global = getGlobal()
44 | global.qcharts = qcharts
45 |
46 | export { Dataset, Line, Pie, Area, Wave, Radar, Tooltip, Bar, PolarBar, Funnel, Scatter, Gauge, RadialBar, Axis, Legend, Chart, h, theme, easing, version }
47 |
48 | export default qcharts
49 |
--------------------------------------------------------------------------------
/website/views/demo/Area/area-nostack.md:
--------------------------------------------------------------------------------
1 | :::demo
2 |
3 | ```javascript
4 | const data = [
5 | { product: '茶叶', year: '2016', sales: 81.2 },
6 | { product: '茶叶', year: '2017', sales: 121.2 },
7 | { product: '茶叶', year: '2018', sales: 41.2 },
8 | { product: '牛奶', year: '2016', sales: 89.2 },
9 | { product: '牛奶', year: '2017', sales: 50.6 },
10 | { product: '牛奶', year: '2018', sales: 80.2 },
11 | { product: '咖啡', year: '2016', sales: 35.2 },
12 | { product: '咖啡', year: '2017', sales: 79.6 },
13 | { product: '咖啡', year: '2018', sales: 61.2 },
14 | { product: '椰汁', year: '2016', sales: 55.2 },
15 | { product: '椰汁', year: '2017', sales: 69.6 },
16 | { product: '椰汁', year: '2018', sales: 21.2 }
17 | ]
18 |
19 | const { Chart, Area, Legend, Tooltip, Axis } = qcharts
20 |
21 | const chart = new Chart({
22 | container: '#app'
23 | })
24 |
25 | chart.source(data, {
26 | row: 'year',
27 | value: 'sales',
28 | text: 'product'
29 | })
30 |
31 | const area = new Area({ stack: false })
32 |
33 | const tooltip = new Tooltip({
34 | formatter: function(data) {
35 | return `${data.product} ${data.year} ${data.sales}`
36 | }
37 | })
38 |
39 | const axisBottom = new Axis()
40 |
41 | const axisLeft = new Axis({ orient: 'left' }).style('axis', false).style('scale', false)
42 |
43 | const legend = new Legend({ align: ['center', 'bottom'] })
44 |
45 | chart.append([area, tooltip, axisBottom, axisLeft, legend])
46 | ```
47 |
48 | :::
49 |
--------------------------------------------------------------------------------
/website/views/plugin/axis/axis-default.md:
--------------------------------------------------------------------------------
1 | ## 基础坐标轴
2 |
3 | :::demo 基础坐标
4 |
5 | ```javascript
6 | const data = [
7 | { month: 'Jan', city: 'London', value: 3.9 },
8 | { month: 'Feb', city: 'London', value: 4.2 },
9 | { month: 'Mar', city: 'London', value: 5.7 },
10 | { month: 'Apr', city: 'London', value: 8.5 },
11 | { month: 'May', city: 'London', value: 11.9 },
12 | { month: 'Jun', city: 'London', value: 15.2 }
13 | ]
14 |
15 | const { Chart, Axis, Line } = qcharts
16 |
17 | const chart = new Chart({
18 | container: '#app',
19 | size: ['100%', '100%']
20 | }).source(data, {
21 | row: 'city',
22 | value: 'value',
23 | text: 'month'
24 | })
25 |
26 | const line = new Line().style('point', { color: '#fff' })
27 |
28 | let xAxis = new Axis({
29 | formatter: (str) => {
30 | return str + '-' + 1
31 | }
32 | })
33 | let yAxis = new Axis({ orient: 'left' })
34 |
35 | chart.append([line, xAxis, yAxis])
36 | ```
37 |
38 | :::
39 |
40 | #### 方法:
41 |
42 | | 名称 | 说明 | 类型 | 可选值 | 默认值 |
43 | | ------ | ------------ | ---- | ------------------------------- | -------- |
44 | | orient | 坐标轴的方向 | | ['top','right','bottom','left'] | 'bottom' |
45 |
46 | #### style 属性:
47 |
48 | | 名称 | 说明 | 类型 |
49 | | ----- | ------------ | --------------------- |
50 | | axis | 轴体的样式 | 轴体对应 Rect 类 |
51 | | scale | 刻度的样式 | scale 对应 Rect 类 |
52 | | label | 轴上文本样式 | label 对应的 label 类 |
53 |
--------------------------------------------------------------------------------
/website/views/doc/api/index.js:
--------------------------------------------------------------------------------
1 | export default [
2 | {
3 | title: '',
4 | path: '',
5 | redirect: 'pie'
6 | },
7 | {
8 | title: 'Line(折线图)',
9 | path: 'line',
10 | component: () => import('./line-api.md')
11 | },
12 | {
13 | title: 'Area(面积图)',
14 | path: 'area',
15 | component: () => import('./area-api.md')
16 | },
17 | {
18 | title: 'Bar(柱状图、条形图)',
19 | path: 'bar',
20 | component: () => import('./bar-api.md')
21 | },
22 | {
23 | title: 'Pie(饼图)',
24 | path: 'pie',
25 | component: () => import('./Pie.md')
26 | },
27 |
28 | {
29 | title: 'Radar(雷达图)',
30 | path: 'radar',
31 | component: () => import('./radar.md')
32 | },
33 | {
34 | title: 'Scatter(散点图)',
35 | path: 'scatter',
36 | component: () => import('./scatter.md')
37 | },
38 | {
39 | title: 'Wave(水波图)',
40 | path: 'wave',
41 | component: () => import('./wave.md')
42 | },
43 | {
44 | title: 'Funnel(漏斗图)',
45 | path: 'funnel',
46 | component: () => import('./funnel-api.md')
47 | },
48 |
49 | {
50 | title: 'Gauge(仪表盘)',
51 | path: 'gauge',
52 | component: () => import('./Gauge.md')
53 | },
54 |
55 | {
56 | title: 'RadialBar(玉块图)',
57 | path: 'radialBar',
58 | component: () => import('./RadialBar.md')
59 | },
60 |
61 | {
62 | title: 'PolarBar(极坐标柱状图)',
63 | path: 'polarBar',
64 | component: () => import('./polarBar.md')
65 | }
66 | ]
67 |
--------------------------------------------------------------------------------
/website/views/demo/pie/dounght.md:
--------------------------------------------------------------------------------
1 | ## Donut Chart 环图
2 |
3 | :::demo
4 |
5 | ```javascript
6 | const data = [
7 | {
8 | year: '2001',
9 | population: 4
10 | },
11 | {
12 | year: '2002',
13 | population: 38
14 | },
15 | {
16 | year: '2003',
17 | population: 33.7
18 | },
19 | {
20 | year: '2004',
21 | population: 30.7
22 | },
23 | {
24 | year: '2005',
25 | population: 25.8
26 | },
27 | {
28 | year: '2006',
29 | population: 31.7
30 | },
31 | {
32 | year: '2007',
33 | population: 33
34 | },
35 | {
36 | year: '2008',
37 | population: 46
38 | },
39 | {
40 | year: '2009',
41 | population: 38.3
42 | },
43 | {
44 | year: '2010',
45 | population: 2800
46 | }
47 | ]
48 |
49 | const { Chart, Pie, Legend, Tooltip } = qcharts
50 |
51 | const chart = new Chart({
52 | container: '#app'
53 | })
54 |
55 | chart.source(data, {
56 | row: 'year',
57 | value: 'population',
58 | //布局数据方式
59 | layoutScale: 'sqrt'
60 | })
61 |
62 | const pie = new Pie({
63 | innerRadius: 0.4,
64 | radius: 0.7,
65 | clientRect: { top: '10%', left: '10%', right: '10%', bottom: '10%' }
66 | })
67 | pie.style('sector', { lineWidth: 1, strokeColor: '#fff' })
68 | pie.style('guideline', true)
69 | pie.style('guideText', { fontSize: '12px' })
70 |
71 | const legend = new Legend({ orient: 'vertical', align: ['right', 'center'] })
72 |
73 | chart.append([pie, legend])
74 | ```
75 |
76 | :::
77 |
--------------------------------------------------------------------------------
/website/views/more/test/style.md:
--------------------------------------------------------------------------------
1 | ## Double Line Chart 双 Y 轴折线图
2 |
3 | :::demo
4 |
5 | ```javascript
6 | const data = [
7 | { date: '05-01', category: '图例一', sales: 15.2 },
8 | { date: '05-02', category: '图例一', sales: 39.2 },
9 | { date: '05-03', category: '图例一', sales: 51.2 },
10 | { date: '05-04', category: '图例一', sales: 65.2 },
11 | { date: '05-05', category: '图例一', sales: 55.2 },
12 | { date: '05-06', category: '图例一', sales: 75.2 },
13 | { date: '05-07', category: '图例一', sales: 85.2 },
14 | { date: '05-08', category: '图例一', sales: 65.2 },
15 | { date: '05-01', category: '图例二', sales: 20.2 },
16 | { date: '05-02', category: '图例二', sales: 49.2 },
17 | { date: '05-03', category: '图例二', sales: 57.2 },
18 | { date: '05-04', category: '图例二', sales: 55.2 },
19 | { date: '05-05', category: '图例二', sales: 75.2 },
20 | { date: '05-06', category: '图例二', sales: 95.2 },
21 | { date: '05-07', category: '图例二', sales: 90.2 },
22 | { date: '05-08', category: '图例二', sales: 85.2 }
23 | ]
24 | const { Chart, Line } = qcharts
25 | const $wrap = document.querySelector('#app')
26 | const chart = new Chart({
27 | container: $wrap
28 | })
29 |
30 | chart.source(data, {
31 | row: 'category',
32 | value: 'sales',
33 | text: 'date'
34 | })
35 | const line = new Line({ splitNumber: 5 })
36 | //line.style({ line: { lineWidth: 2 } })
37 | chart.dataset.on('change', function(res) {
38 | console.log('dataset', res)
39 | })
40 |
41 | chart.append([line])
42 | ```
43 |
44 | :::
45 |
--------------------------------------------------------------------------------
/website/views/doc/chart.md:
--------------------------------------------------------------------------------
1 | ## 图表结构
2 |
3 | 图表由 chart、visual、plugin 组成
4 |
5 | 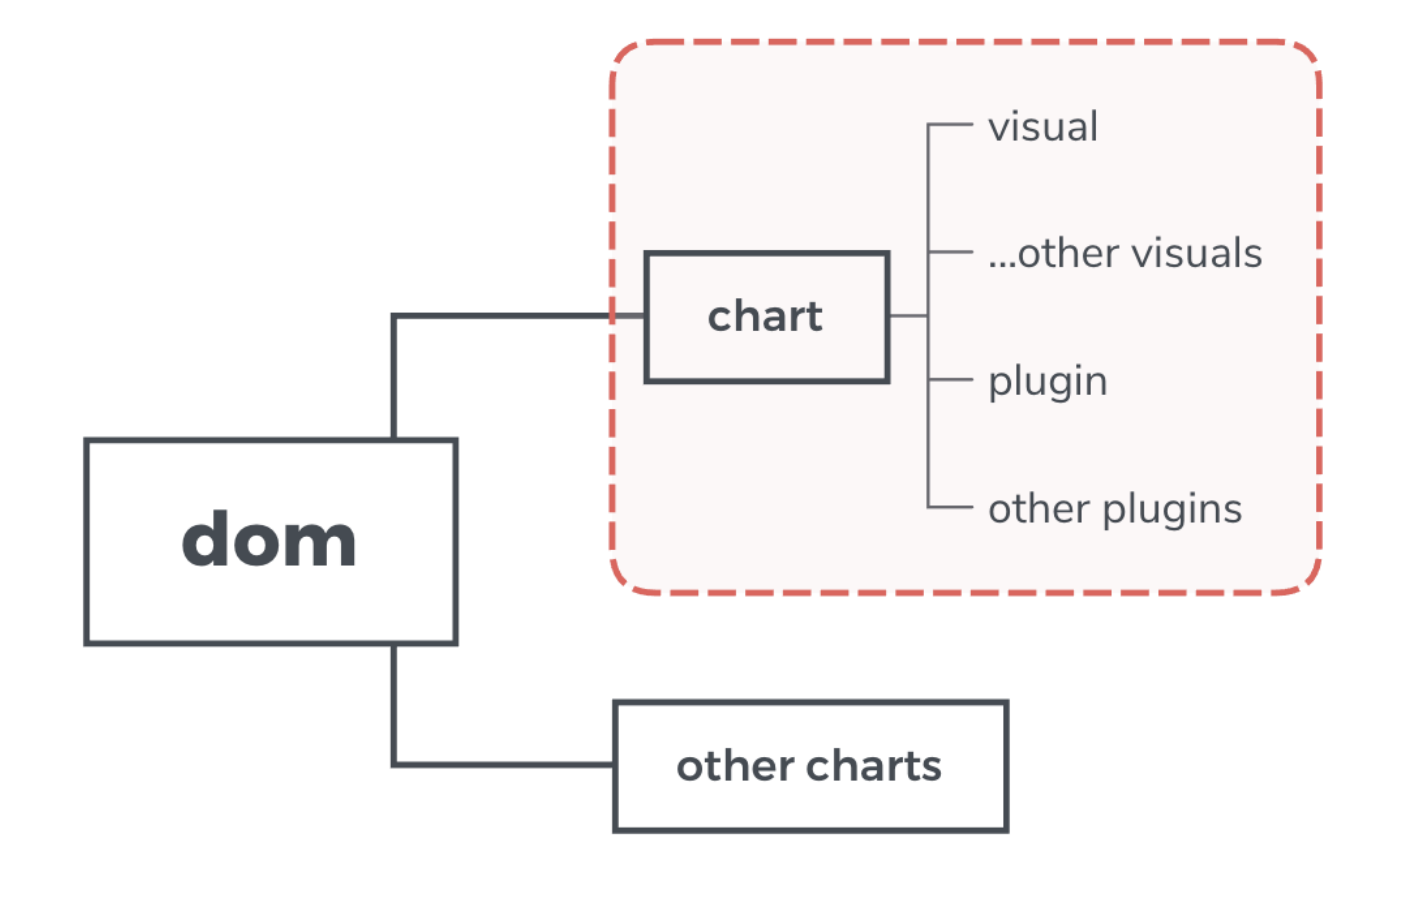
6 |
7 | ## 绘制图表
8 |
9 | 绘制图表与添加插件的方法均为:`chart.append(/* visual 实例 或者 plugin 实例 */)`。
10 |
11 | ```javascript
12 | const data = [
13 | { date: '05-01', catgory: '图例一', sales: 15.2 },
14 | { date: '05-02', catgory: '图例一', sales: 39.2 },
15 | { date: '05-03', catgory: '图例一', sales: 31.2 },
16 | { date: '05-04', catgory: '图例一', sales: 65.2 },
17 | { date: '05-05', catgory: '图例一', sales: 55.2 }
18 | ]
19 |
20 | const { Chart, Line, Legend, Tooltip, Axis } = qcharts
21 | const chart = new Chart({
22 | container: '#app'
23 | })
24 | chart.source(data, {
25 | row: 'catgory',
26 | value: 'sales',
27 | text: 'date'
28 | })
29 | const line = new Line()
30 | const axisBottom = new Axis().style('grid', false)
31 | const toolTip = new Tooltip()
32 | const legend = new Legend()
33 | const axisLeft = new Axis({ orient: 'left' })
34 |
35 | chart.append([line, axisBottom, axisLeft, toolTip, legend])
36 | ```
37 |
38 | 在 `qcharts` 中将传统的图表类型(如:`pie` 和 `line`)区分为 `visual`,意为一种可视类型。可以在一个 `chart` 传入多个 `visual` 实例。
39 |
40 | ## 数据更新
41 |
42 | 在 `qcharts` 如果数据存在更新,可以直接更新数据,如下:
43 |
44 | ```javascript
45 | chart.source(newData, {
46 | row: 'catgory',
47 | value: 'value',
48 | text: 'text'
49 | })
50 | ```
51 |
52 | 如果更新的数据中,对应的字段名称都没有改变,直接
53 |
54 | ```javascript
55 | chart.source(newData)
56 | ```
57 |
--------------------------------------------------------------------------------
/website/views/demo/radar/index.js:
--------------------------------------------------------------------------------
1 | export default [
2 | {
3 | title: '',
4 | path: '',
5 | redirect: 'default'
6 | },
7 | {
8 | title: '基础雷达图',
9 | path: 'default',
10 | component: () => import('./radar.md')
11 | },
12 | {
13 | title: '双色雷达图',
14 | path: 'radarPoint',
15 | component: () => import('./radar_point_style.md')
16 | },
17 | // {
18 | // title: '边样式',
19 | // path: 'radarBorder',
20 | // component: () => import('./radar_border_style.md')
21 | // },
22 | // {
23 | // title: '面样式',
24 | // path: 'radarArea',
25 | // component: () => import('./radar_area_style.md')
26 | // },
27 | // {
28 | // title: '坐标轴线样式',
29 | // path: 'radarAxis',
30 | // component: () => import('./radar_axis_style.md')
31 | // },
32 | // {
33 | // title: '网格样式',
34 | // path: 'radarGrid',
35 | // component: () => import('./radar_grid_style.md')
36 | // },
37 | // {
38 | // title: 'x轴文字样式',
39 | // path: 'radarXLabel',
40 | // component: () => import('./radar_label_style.md')
41 | // },
42 | // {
43 | // title: 'y轴文字样式',
44 | // path: 'radarYLabel',
45 | // component: () => import('./radar_label_y_style.md')
46 | // },
47 | {
48 | title: '数据更新',
49 | path: 'radar_update',
50 | component: () => import('./radar_update.md')
51 | },
52 | {
53 | title: '点样式',
54 | path: 'radar_pointSymbol',
55 | component: () => import('./radar_pointSymbol.md')
56 | }
57 | ]
58 |
--------------------------------------------------------------------------------
/website/views/more/list.vue:
--------------------------------------------------------------------------------
1 |
2 |
12 |
13 |
14 |
29 |
30 |
67 |
--------------------------------------------------------------------------------
/website/components/recovery.svg:
--------------------------------------------------------------------------------
1 |
2 |
--------------------------------------------------------------------------------
/website/components/search.svg:
--------------------------------------------------------------------------------
1 |
2 |
3 |
9 |
--------------------------------------------------------------------------------
/website/router/index.js:
--------------------------------------------------------------------------------
1 | import Vue from 'vue'
2 | import Router from 'vue-router'
3 |
4 | import Article from '../components/Article.vue'
5 | import docs from '../views/doc/routes.js'
6 | import demos from '../views/demo/routes.js'
7 | import plugins from '../views/plugin/routes.js'
8 | import mores from '../views/more/routes'
9 |
10 | Vue.use(Router)
11 |
12 | function withArticleContainer(parentRoutePath, routes) {
13 | return {
14 | template: '',
15 | components: {
16 | Article
17 | },
18 | data() {
19 | return {
20 | parentRoutePath,
21 | routes
22 | }
23 | }
24 | }
25 | }
26 |
27 | export default new Router({
28 | mode: 'hash',
29 | routes: [
30 | {
31 | path: '/',
32 | redirect: '/home'
33 | },
34 | {
35 | path: '/home',
36 | component: () => import('../views/home/index.vue')
37 | },
38 | {
39 | path: '/doc',
40 | component: withArticleContainer('doc', docs),
41 | children: docs
42 | },
43 |
44 | {
45 | path: '/demo',
46 | component: withArticleContainer('demo', demos),
47 | children: demos
48 | },
49 | {
50 | path: '/more',
51 | component: withArticleContainer('demo', mores),
52 | children: mores
53 | },
54 | {
55 | path: '/plugin',
56 | component: withArticleContainer('plugin', plugins),
57 | children: plugins
58 | }
59 | ]
60 | })
61 |
--------------------------------------------------------------------------------
/website/views/more/line/endPoint.md:
--------------------------------------------------------------------------------
1 | ## 折线结束点
2 |
3 | :::demo
4 |
5 | ```javascript
6 | const data = [
7 | { date: '05-01', catgory: '图例一', sales: 15.2 },
8 | { date: '05-02', catgory: '图例一', sales: 39.2 },
9 | { date: '05-03', catgory: '图例一', sales: 31.2 },
10 | { date: '05-04', catgory: '图例一', sales: 65.2 },
11 | { date: '05-05', catgory: '图例一', sales: 55.2 },
12 | { date: '05-06', catgory: '图例一', sales: 75.2 },
13 | { date: '05-07', catgory: '图例一', sales: 95.2 },
14 | { date: '05-08', catgory: '图例一' }
15 | ]
16 |
17 | const { Chart, Line, Legend, Tooltip, Axis } = qcharts
18 |
19 | const chart = new Chart({
20 | container: '#app'
21 | })
22 |
23 | chart.source(data, {
24 | row: 'catgory',
25 | value: 'sales',
26 | text: 'date'
27 | })
28 |
29 | const line = new Line({ smooth: true })
30 | line.style('point', function(attr, data, i, j) {
31 | if (j === 6) {
32 | return { size: 5, strokeColor: '#fff' }
33 | }
34 | return false
35 | })
36 |
37 | const tooltip = new Tooltip({
38 | formatter: function(data) {
39 | return `${data.date} ${data.sales}`
40 | }
41 | })
42 |
43 | const axisBottom = new Axis().style('grid', { lineDash: [6, 6] })
44 |
45 | const axisLeft = new Axis({ orient: 'left' }).style('scale', false).style('grid', false)
46 |
47 | const legend = new Legend({ align: ['center', 'bottom'] }).style('icon', { borderRadius: 10 }).style('text', { fontSize: 12 })
48 |
49 | chart.append([line, tooltip, axisBottom, axisLeft, legend])
50 | ```
51 |
52 | :::
53 |
--------------------------------------------------------------------------------
/website/views/doc/api/polarBar.md:
--------------------------------------------------------------------------------
1 | ### 图表介绍
2 |
3 | PolarBar Chart, 极坐标柱状图。
4 |
5 | ### attrs
6 |
7 | attrs 包含若干布局属性,将这些属性放入 Object 对象传入组件
8 |
9 | | 属性名 | 类型 | 默认值 | 描述 |
10 | | ------------- | ------- | ------- | ---------------------------------- |
11 | | innerRadius | Number | `0` | 内半径比例,0-1 之间 |
12 | | radius | Number | `1` | 外半径比例,0-1 之间 |
13 | | groupPadAngle | Number | `0` | 两组扇形之间间距,角度表示 |
14 | | stack | Boolean | `false` | 是否设置为堆叠图,二维数据无法堆叠 |
15 | | stackGap | Number | `0` | 堆叠图中柱子间距,单位为像素 |
16 | | padAngle | Number | `0` | 扇形之间间距,角度表示 |
17 |
18 | ### style 属性
19 |
20 | 组件中可以自定义 css 属性的元素如下表:
21 |
22 | | 名称 | 基本类型 | 描述 |
23 | | ---------------- | -------- | ------------ |
24 | | backgroundpillar | 面 | 背景柱子样式 |
25 | | pillar | 面 | 柱子样式 |
26 |
27 | 使用方法可在[样式调整 demo](#/demo/polarBar/others)中查看,用法如下:
28 |
29 | style 设置方式可以是 Boolean、 obj 属性或者函数,例如:
30 |
31 | ```javascript
32 | // 新建PolarBar组件
33 | const bar = new PolarBar()
34 |
35 | //设置spritejs的attr属性来设置样式
36 | //设置鼠标移入柱子时样式
37 | bar.style('pillar',{fillColor:'#f00', opacity:'0.5'})
38 |
39 | //attrs为元素绘制属性,data为元素对应数据,i为元素序列
40 | bar.style('pillar', (attrs, data, i) => {
41 | //将偶数序列的柱子设置圆角
42 | if (i % 2 === 0) {
43 | return {
44 | borderRadius: 10
45 | }
46 | }
47 | return { opacity: 0.5, fillColor: 'blue' }
48 | })
49 | ```
50 |
--------------------------------------------------------------------------------
/website/styles/index.scss:
--------------------------------------------------------------------------------
1 | // ::-webkit-scrollbar {
2 | // width: 6px;
3 | // height: 6px;
4 | // }
5 |
6 | // ::-webkit-scrollbar-track {
7 | // opacity: 0;
8 | // }
9 |
10 | // ::-webkit-scrollbar-thumb {
11 | // background-color: hsla(220, 4%, 58%, 0.3);
12 | // border-radius: 5px;
13 | // }
14 |
15 | @import './normalize.scss';
16 | @import './markdown.scss';
17 |
18 | *,
19 | *::before,
20 | *::after {
21 | box-sizing: border-box;
22 | }
23 |
24 | html,
25 | body {
26 | height: 100%;
27 | margin: 0;
28 | padding: 0;
29 | }
30 |
31 | ul {
32 | padding: 0;
33 | margin: 0;
34 | list-style: none;
35 | }
36 |
37 | #app {
38 | font-family: 'Avenir', Helvetica, Arial, sans-serif;
39 | -webkit-font-smoothing: antialiased;
40 | -moz-osx-font-smoothing: grayscale;
41 | width: 100vw;
42 | height: 100vh;
43 | display: flex;
44 | flex-direction: column;
45 |
46 | a {
47 | text-decoration: none;
48 | word-break: keep-all;
49 | }
50 |
51 | a:hover {
52 | text-decoration: none !important;
53 | }
54 | }
55 |
56 | /*定义滚动条高宽及背景 高宽分别对应横竖滚动条的尺寸*/
57 |
58 | ::-webkit-scrollbar {
59 | width: 8px;
60 | height: 8px;
61 | }
62 |
63 | /*定义滚动条轨道 内阴影+圆角*/
64 |
65 | ::-webkit-scrollbar-track {
66 | border-radius: 10px;
67 | }
68 |
69 | /*定义滑块 内阴影+圆角*/
70 |
71 | ::-webkit-scrollbar-thumb {
72 | position: relative;
73 | display: block;
74 | cursor: pointer;
75 | border-radius: 4px;
76 | background-color: hsla(220, 4%, 58%, 0.3);
77 | transition: background-color 0.3s;
78 | }
--------------------------------------------------------------------------------
/website/views/demo/Wave/shape.md:
--------------------------------------------------------------------------------
1 | ## 自定义
2 |
3 | :::demo
4 |
5 | ```javascript
6 | const shape =
7 | 'm301.855,200.202c-3.674,-1.385 -7.452,-1.966 -11.146,-1.794c0.659,-2.922 0.844,-5.85 0.58,-8.719c-0.937,-10.407 -7.663,-19.864 -18.063,-23.834c-10.697,-4.043 -22.298,-1.168 -29.902,6.403c3.015,0.026 6.074,0.594 9.035,1.728c13.626,5.151 20.465,20.379 15.32,34.004c-1.905,5.02 -5.177,9.115 -9.22,12.05c-6.951,4.992 -16.19,6.536 -24.777,3.271c-13.625,-5.137 -20.471,-20.371 -15.32,-34.004c0.673,-1.768 1.523,-3.423 2.526,-4.992l-0.014,0c0,0 0,0 0,0.014c4.386,-6.853 8.145,-14.279 11.146,-22.187c23.294,-61.505 -7.689,-130.278 -69.215,-153.579c-61.532,-23.293 -130.279,7.69 -153.579,69.202c-6.371,16.785 -8.679,34.097 -7.426,50.901c0.026,0.554 0.079,1.121 0.132,1.688c4.973,57.107 41.767,109.148 98.945,130.793c58.162,22.008 121.303,6.529 162.839,-34.465c7.103,-6.893 17.826,-9.444 27.679,-5.719c11.858,4.491 18.565,16.6 16.719,28.643c4.438,-3.126 8.033,-7.564 10.117,-13.045c5.52,-14.569 -1.82,-30.852 -16.376,-36.359z'
8 |
9 | const { Chart, Wave } = qcharts
10 |
11 | const chart = new Chart({ container: '#app' })
12 |
13 | const wave = new Wave({
14 | //固定位置,窗口变化的时候,位置不移动
15 | clientRect: { top: 0, left: 0 },
16 | percent: 65,
17 | shape: shape,
18 | formatter: per => {
19 | return '总占比:' + per + '%'
20 | }
21 | })
22 | //文本样式
23 | wave.style('text', {
24 | fillColor: '#fff',
25 | pos: [130, 130]
26 | })
27 | chart.append(wave)
28 | setTimeout(_ => {
29 | wave.attr({ percent: 80 })
30 | }, 2000)
31 | ```
32 |
33 | :::
34 |
--------------------------------------------------------------------------------
/src/utils/Point.js:
--------------------------------------------------------------------------------
1 | import { Sprite, Path, Ellipse, Rect, Triangle, Parallel, Regular, Star, Group } from 'spritejs'
2 | import { jsType } from '@qcharts/utils'
3 |
4 | const allPoint = {
5 | sprite: Sprite,
6 | path: Path,
7 | ellipse: Ellipse,
8 | rect: Rect,
9 | triangle: Triangle,
10 | parallel: Parallel,
11 | regular: Regular,
12 | star: Star
13 | }
14 | class Point extends Group {
15 | constructor(attrs = {}) {
16 | super()
17 | this.pointType = null
18 | this.$sprite = null
19 | this.attr({ pointType: 'ellipse', ...attrs })
20 | }
21 | attr(name, val) {
22 | let attrs = name
23 | if (jsType(name) !== 'object') {
24 | attrs = {}
25 | attrs[name] = val
26 | }
27 | this.renderSymbol(attrs)
28 | }
29 | renderSymbol(attrs) {
30 | const { pointType, pos, ...renderAttr } = attrs
31 |
32 | if (pointType && pointType !== this.pointType) {
33 | if (!Object.keys(allPoint).includes(pointType)) {
34 | throw new Error(
35 | `pointType should be one of 'sprite','path','ellipse','rect','triangle','parallel','regular','star' but it is ${pointType}`
36 | )
37 | }
38 | this.$sprite && this.$sprite.remove()
39 | this.$sprite = new allPoint[pointType](renderAttr)
40 | this.append(this.$sprite)
41 | } else {
42 | this.$sprite.attr(renderAttr)
43 | }
44 | if (pos && pos.length) {
45 | super.attr('pos', pos)
46 | }
47 |
48 | this.pointType = pointType
49 | }
50 | }
51 | export default Point
52 |
--------------------------------------------------------------------------------
/website/views/more/scatter/safe.md:
--------------------------------------------------------------------------------
1 | ## 散点图隐藏坐标轴
2 |
3 | :::demo
4 |
5 | ```javascript
6 | const data = [
7 | {
8 | value: 10,
9 | name: '危化品企业'
10 | },
11 | {
12 | value: 17,
13 | name: '危险源(库区储/罐区)'
14 | },
15 | {
16 | value: 13,
17 | name: '预警'
18 | },
19 | {
20 | value: 7,
21 | name: '报警数'
22 | }
23 | ]
24 |
25 | const { Chart, Scatter, Axis } = qcharts
26 |
27 | const chart = new Chart({
28 | container: '#app'
29 | })
30 |
31 | chart.source(data, {
32 | text: 'name',
33 | value: 'value'
34 | })
35 | const scatter = new Scatter({
36 | axisGap: true,
37 | areaField: 'value',
38 | labelField: 'name',
39 | areaRange: [20, 45]
40 | })
41 |
42 | scatter
43 | .style('point', (attr, data, i) => {
44 | return { fillColor: 'rgba(48, 251, 171,0.4)', strokeColor: 'rgba(48, 251, 171,1)' }
45 | })
46 | .style('label', (attr, data, i) => {
47 | return { text: data.value, fillColor: '#fff', fontSize: 20 }
48 | })
49 |
50 | const axis = new Axis({ type: 'category' })
51 | .style('label', { width: 200, fillColor: 'rgba(48, 251, 171,1)' })
52 | .style('scale', false)
53 | .style('axis', { strokeColor: 'rgba(48, 251, 171,1)' })
54 | .style('grid', { strokeColor: 'rgba(48, 251, 171,1)' })
55 | const axisTop = new Axis({ orient: 'top' })
56 | .style('label', false)
57 | .style('scale', false)
58 | .style('grid', false)
59 | .style('axis', { lineDash: [3, 3], strokeColor: 'rgba(48, 251, 171,1)' })
60 | chart.append([scatter, axis, axisTop])
61 | ```
62 |
63 | :::
64 |
--------------------------------------------------------------------------------
/website/views/doc/api/radar.md:
--------------------------------------------------------------------------------
1 | ## 雷达图
2 |
3 | ### attrs
4 |
5 | attrs 包含若干属性,可以初始化图表的时候对图表进行配置
6 |
7 | | 属性 | 说明 | 类型 | 默认值 |
8 | | ----------- | --------------------------------------- | ------------- | --------------- |
9 | | gridType | 网格的类型,可选值为'polygon'和'circle' | String | polygon |
10 | | splitNumber | 背景网格的层数 | Number | 4 |
11 | | startAngle | 坐标轴的起始角度 | Number | 270 |
12 | | radius | 雷达图的轴长,范围[0,1] | Number | 0.6 |
13 | | labelOffset | 雷达图轴标记偏移量 | Number | 6 |
14 |
15 | ### 可配置 Style 名称
16 |
17 | ```js
18 | const radar = new Radar()
19 | radar.style('point', { size: 5 })
20 | // 或者函数模式
21 | radar.style('point',(attr,data,i)=>{return {size:5}})
22 | ```
23 |
24 | style 方式支持链式调用,第一个参数为 style 名称,第二个参数为设置的样式 Object,也可以为函数形式,对样式进行详细设置
25 |
26 | | 名称 | 基础类型 | 描述 |
27 | | ------------- | -------- | ------------------------ |
28 | | section | 面 | 雷达图数据区样式 |
29 | | section:hover | 面 | 雷达图数据区 hover 样式 |
30 | | point | 面,除了基础面的全部属性外,还有(Point)的特殊属性 | 雷达图数据区域的点的样式 |
31 | | axis | 线 | 坐标轴的样式 |
32 | | grid | 线 | 雷达图背景网格样式 |
33 | | label | 文本 | 类别指示文字的样式(x 轴) |
34 | | scale | 文本 | 数值指示文字,(y 轴) |
35 |
--------------------------------------------------------------------------------
/lib/index.js:
--------------------------------------------------------------------------------
1 | import { h, easing } from '@qcharts/vnode';
2 | import Dataset from '@qcharts/dataset';
3 | import Line from './visuals/Line/index';
4 | import Pie from './visuals/Pie/index';
5 | import Area from './visuals/Area/index';
6 | import Radar from './visuals/Radar/index';
7 | import Bar from './visuals/Bar/index';
8 | import PolarBar from './visuals/PolarBar/index';
9 | import Funnel from './visuals/Funnel/index';
10 | import Scatter from './visuals/Scatter/index';
11 | import Wave from './visuals/Wave/index';
12 | import Gauge from './visuals/Gauge';
13 | import RadialBar from './visuals/RadialBar';
14 | import Axis from './plugins/Axis/index';
15 | import Legend from './plugins/Legend/index';
16 | import Tooltip from './plugins/Tooltip/index';
17 | import { getGlobal } from './base/platform';
18 | import Chart from './Chart';
19 | import theme from './theme/default';
20 | var version = '1.0.37';
21 | var qcharts = {
22 | version: version,
23 | Line: Line,
24 | Pie: Pie,
25 | Area: Area,
26 | Radar: Radar,
27 | Bar: Bar,
28 | PolarBar: PolarBar,
29 | Funnel: Funnel,
30 | Scatter: Scatter,
31 | Gauge: Gauge,
32 | RadialBar: RadialBar,
33 | Legend: Legend,
34 | Axis: Axis,
35 | Wave: Wave,
36 | Tooltip: Tooltip,
37 | h: h,
38 | theme: theme,
39 | Chart: Chart,
40 | easing: easing
41 | };
42 | var global = getGlobal();
43 | global.qcharts = qcharts;
44 | export { Dataset, Line, Pie, Area, Wave, Radar, Tooltip, Bar, PolarBar, Funnel, Scatter, Gauge, RadialBar, Axis, Legend, Chart, h, theme, easing, version };
45 | export default qcharts;
--------------------------------------------------------------------------------
/website/views/demo/line/line-double.md:
--------------------------------------------------------------------------------
1 | ## Double Line Chart 双折线图
2 |
3 | :::demo
4 |
5 | ```javascript
6 | const data = [
7 | { date: '05-01', catgory: '图例一', sales: 15.2 },
8 | { date: '05-02', catgory: '图例一', sales: 39.2 },
9 | { date: '05-03', catgory: '图例一', sales: 51.2 },
10 | { date: '05-04', catgory: '图例一', sales: 65.2 },
11 | { date: '05-05', catgory: '图例一', sales: 55.2 },
12 | { date: '05-06', catgory: '图例一', sales: 75.2 },
13 | { date: '05-07', catgory: '图例一', sales: 95.2 },
14 | { date: '05-08', catgory: '图例一', sales: 65.2 },
15 | { date: '05-01', catgory: '图例二', sales: 20.2 },
16 | { date: '05-02', catgory: '图例二', sales: 49.2 },
17 | { date: '05-03', catgory: '图例二', sales: 57.2 },
18 | { date: '05-04', catgory: '图例二', sales: 55.2 },
19 | { date: '05-05', catgory: '图例二', sales: 75.2 },
20 | { date: '05-06', catgory: '图例二', sales: 95.2 },
21 | { date: '05-07', catgory: '图例二', sales: 110.2 },
22 | { date: '05-08', catgory: '图例二', sales: 85.2 }
23 | ]
24 |
25 | const { Chart, Line, Axis, Tooltip, Legend, theme } = qcharts
26 |
27 | const chart = new Chart({
28 | container: '#app'
29 | })
30 |
31 | chart.source(data, {
32 | row: 'catgory',
33 | value: 'sales',
34 | text: 'date'
35 | })
36 |
37 | const line = new Line()
38 | const axisBottom = new Axis().style('grid', false)
39 | const tooltip = new Tooltip()
40 | const legend = new Legend()
41 |
42 | const axisLeft = new Axis({ orient: 'left' }).style('axis', false).style('scale', false)
43 |
44 | chart.append([line, axisBottom, legend, axisLeft, tooltip])
45 | ```
46 |
47 | :::
48 |
--------------------------------------------------------------------------------
/website/views/demo/radar/radar_border_style.md:
--------------------------------------------------------------------------------
1 | ## border 样式设置
2 |
3 | :::demo 边
4 |
5 | ```javascript
6 | const data = [
7 | { label: '客服', category: '实际开销', value: 2 },
8 | { label: '研发', category: '实际开销', value: 22 },
9 | { label: '市场', category: '实际开销', value: 69 },
10 | { label: '扯淡', category: '实际开销', value: 69 },
11 | { label: '销售', category: '实际开销', value: 66 },
12 | { label: '管理', category: '实际开销', value: 32 },
13 | { label: '技术', category: '实际开销', value: 24 },
14 |
15 | { label: '客服', category: '节能减排', value: 100 },
16 | { label: '研发', category: '节能减排', value: 47 },
17 | { label: '市场', category: '节能减排', value: 73 },
18 | { label: '扯淡', category: '节能减排', value: 48 },
19 | { label: '销售', category: '节能减排', value: 10 },
20 | { label: '管理', category: '节能减排', value: 41 },
21 | { label: '技术', category: '节能减排', value: 32 }
22 | ]
23 |
24 | const { Chart, Radar, Tooltip, Legend } = qcharts
25 |
26 | const chart = new Chart({
27 | container: '#app'
28 | })
29 | chart.source(data, {
30 | row: 'category',
31 | value: 'value',
32 | text: 'label'
33 | })
34 |
35 | const radar = new Radar()
36 | radar
37 | .style('section', (attr, data, i) => {
38 | if (i === 0) {
39 | return { lineWidth: 2, strokeColor: '#f77' }
40 | } else {
41 | return { lineDash: [2, 10] }
42 | }
43 | })
44 | .style('section:hover', (attr, data, i) => ({
45 | lineWidth: 4,
46 | strokeColor: 'red'
47 | }))
48 |
49 | chart.append(radar)
50 | ```
51 |
52 | :::
53 |
54 | ### section 可配置 style 说明
55 |
56 | 名称:section、section:hover
57 |
58 | 同面样式设置
59 |
--------------------------------------------------------------------------------
/website/views/demo/Area/area-stack.md:
--------------------------------------------------------------------------------
1 | ## Stacked Area Chart 堆叠面积图
2 |
3 | :::demo
4 |
5 | ```javascript
6 | const data = [
7 | { date: '05-01', category: '图例一', sales: 15.2 },
8 | { date: '05-02', category: '图例一', sales: 39.2 },
9 | { date: '05-03', category: '图例一', sales: 31.2 },
10 | { date: '05-04', category: '图例一', sales: 65.2 },
11 | { date: '05-05', category: '图例一', sales: 55.2 },
12 | { date: '05-06', category: '图例一', sales: 75.2 },
13 | { date: '05-07', category: '图例一', sales: 95.2 },
14 | { date: '05-08', category: '图例一', sales: 65.2 },
15 | { date: '05-01', category: '图例二', sales: 10.2 },
16 | { date: '05-02', category: '图例二', sales: 30.2 },
17 | { date: '05-03', category: '图例二', sales: 25.2 },
18 | { date: '05-04', category: '图例二', sales: 70.2 },
19 | { date: '05-05', category: '图例二', sales: 45.2 },
20 | { date: '05-06', category: '图例二', sales: 56.2 },
21 | { date: '05-07', category: '图例二', sales: 70.2 },
22 | { date: '05-08', category: '图例二', sales: 45.2 }
23 | ]
24 |
25 | const { Chart, Area, Axis, Legend, Tooltip } = qcharts
26 |
27 | const chart = new Chart({
28 | container: '#app'
29 | })
30 |
31 | chart.source(data, {
32 | row: 'category',
33 | value: 'sales',
34 | text: 'date'
35 | })
36 |
37 | const area = new Area({ smooth: true })
38 |
39 | const axisBottom = new Axis().style('grid', false)
40 | const tooltip = new Tooltip()
41 | const legend = new Legend()
42 | const axisLeft = new Axis({ orient: 'left' }).style('axis', false).style('scale', false)
43 |
44 | chart.append([area, axisBottom, axisLeft, tooltip, legend])
45 | ```
46 |
47 | :::
48 |
--------------------------------------------------------------------------------
/website/App.vue:
--------------------------------------------------------------------------------
1 |
2 |
3 |
4 |
5 |
6 |
7 |
39 |
51 |
75 |
--------------------------------------------------------------------------------
/lib/utils/getStyle.js:
--------------------------------------------------------------------------------
1 | import _toConsumableArray from "@babel/runtime/helpers/toConsumableArray";
2 | // merge style
3 | import { deepObjectMerge, jsType } from '@qcharts/utils';
4 | /**
5 | * chart:当前的图表
6 | * key:当前的样式名称
7 | * defaultstyle:为数组或者对象,表示默认的样式
8 | * args:调用style方法的时候,style以后的参数,如 line.style('line',function(...args){})
9 | */
10 |
11 | export function getStyle(chart, key, defaultStyle, args) {
12 | //合并样式
13 | var oStyle = defaultStyle;
14 | var arrStyle = defaultStyle;
15 | var oArgs = args;
16 |
17 | if (jsType(defaultStyle) === 'array') {
18 | //oStyle = deepObjectMerge.apply(this, defaultStyle)
19 | oStyle = deepObjectMerge.call.apply(deepObjectMerge, [this, {}].concat(_toConsumableArray(defaultStyle)));
20 | } else {
21 | arrStyle = [defaultStyle];
22 | }
23 |
24 | if (jsType(args) !== 'array') {
25 | oArgs = [args];
26 | }
27 |
28 | var cusStyle = chart.style(key).apply(void 0, [oStyle].concat(_toConsumableArray(oArgs)));
29 |
30 | if (cusStyle === false) {
31 | return false;
32 | } else if (arrStyle.includes(false) && cusStyle === undefined) {
33 | return false;
34 | } else if (cusStyle !== undefined) {
35 | //如果返回的cusStyle不是false或者undefined,需要把default样式进行重写叠加
36 | var curStyle = defaultStyle;
37 |
38 | if (jsType(defaultStyle) !== 'array') {
39 | curStyle = [defaultStyle];
40 | } //获取default样式
41 |
42 |
43 | var oDefaultStyle = chart.defaultStyles()[key];
44 | oStyle = deepObjectMerge({}, oDefaultStyle, curStyle.filter(Boolean)[0], oStyle);
45 | }
46 |
47 | var resStyle = deepObjectMerge({}, oStyle, cusStyle);
48 | return resStyle;
49 | }
--------------------------------------------------------------------------------
/website/views/demo/pie/routes.js:
--------------------------------------------------------------------------------
1 | export default [
2 | {
3 | title: '',
4 | path: '',
5 | redirect: 'default'
6 | },
7 |
8 | {
9 | title: '饼图',
10 | path: 'default',
11 | component: () => import('./pie.md')
12 | },
13 |
14 | {
15 | title: '嵌套饼图',
16 | path: 'nest',
17 | component: () => import('./nest.md')
18 | },
19 |
20 | {
21 | title: '环图',
22 | path: 'dounght',
23 | component: () => import('./dounght.md')
24 | },
25 |
26 | {
27 | title: '南丁格尔玫瑰图',
28 | path: 'rose',
29 | hidden: true,
30 | component: () => import('./rose.md')
31 | },
32 |
33 | {
34 | title: '弧饼图',
35 | path: 'arcPie',
36 | component: () => import('./arcPie.md')
37 | }
38 | // {
39 | // title: '其他',
40 | // path: 'other',
41 | // component: () => import('./rose_layoutScale.md')
42 | // }
43 |
44 | // {
45 | // title: '图表组合',
46 | // path: 'compose',
47 | // component: () => import('./compose.md')
48 | // },
49 |
50 | // {
51 | // title: '日历饼图',
52 | // path: 'calendar',
53 | // component: () => import('./calendar.md')
54 | // }
55 |
56 | // {
57 | // title: '图表联动',
58 | // path: 'link',
59 | // component: () => import('./link.md')
60 | // },
61 |
62 | // {
63 | // title: '主题切换',
64 | // path: 'theme',
65 | // component: () => import('./theme.md')
66 | // },
67 |
68 | // {
69 | // title: '个性化',
70 | // path: 'personalise',
71 | // component: () => import('./personalise.md')
72 | // },
73 |
74 | // {
75 | // title: 'TODO',
76 | // path: 'todo',
77 | // component: () => import('./todo.md')
78 | // }
79 | ]
80 |
--------------------------------------------------------------------------------
/website/views/doc/api/funnel-api.md:
--------------------------------------------------------------------------------
1 | ### 图表介绍
2 |
3 | Funnel Chart,漏斗图。
4 |
5 | ### attrs
6 |
7 | attrs 包含若干布局属性,将这些属性放入 Object 对象传入组件
8 |
9 | | 属性名 | 类型 | 默认值 | 描述 |
10 | | ---------- | ------- | ------------------------------------ | -------------------------------------- |
11 | | align | String | 'center' | 组件位置,可选值 left、center、right |
12 | | pyramid | Boolean | false | 漏斗形状是否为金字塔底 |
13 | | clientRect | Object | {top,right,bottom,left,width,height} | 设置了 width,heigh,优先与 bottom,right |
14 |
15 | ### style 属性
16 |
17 | 组件中可以自定义属性的元素如下表:
18 |
19 | | 名称 | 基本类型 | 描述 |
20 | | ------------- | -------- | ------------------------- |
21 | | polygon | 面 | 漏斗区块样式 |
22 | | polygon:hover | 面 | 鼠标 hover 时漏斗区块样式 |
23 | | guideText | 文本 | 组件上的文本样式 |
24 | | guideline | 线 | 指示线样式 |
25 |
26 | 使用方法可在[样式调整 demo](#/demo/funnel/others)中查看,用法如下:
27 |
28 | 在 data 中定义元素样式,可以是 Boolean、 obj 属性或者函数,例如:
29 |
30 | ```javascript
31 | // 新建funnel组件
32 | const funnel = new Funnel()
33 |
34 | //设置true或false来隐藏组件元素
35 | //隐藏漏斗上的文字
36 | funnel.style("text", false)
37 |
38 | //参考spritejs的attr属性来设置样式
39 | //设置指示线样式
40 | funnel.style("guideline", { length: 20, color: "#000", lineDash: [2, 2] })
41 |
42 | //参数polygon为绘制的polygon属性,dataOrigin为原始数据项,index是绘制索引
43 | funnel.style("polygon", (polygon, dataOrigin, index) => {
44 | // 根据索引来给每个元素赋色
45 | if (index % 2 === 0) {
46 | return { fillColor: "#59CB74" }
47 | }
48 | return { fillColor: "#FBD54A" }
49 | })
50 | ```
51 |
--------------------------------------------------------------------------------
/website/views/doc/plugins/Legend.md:
--------------------------------------------------------------------------------
1 | ### 插件介绍
2 |
3 | Legend, 图例。
4 |
5 | ### attrs
6 |
7 | | 属性名 | 类型 | 默认值 | 描述 |
8 | | --------- | -------- | ----------------- | ------------------------------------------------------------------------------------------------------------------------------------------------------------------------------------------------------------------- |
9 | | orient | String | `horizontal` | 布局方式,默认水平布局,可选值 `horizontal | vertical` |
10 | | align | Array | `['left', 'top']` | 对齐方式,第 1 个值控制水平方向布局(可选值:`left | center | right`,也可设置为 **_数字_** 或 **_百分比_**),第 2 个值控制垂直方向布局(可选值:`top | center | bottom`, 也可设置为 **_数字_** 或 **_百分比_**) |
11 | | formatter | Function | `d => d` | 文本格式化函数 |
12 |
13 | ### style
14 |
15 | ```javascript
16 | const legend = new Legend()
17 | legend.style('text', { color: '#fff' }
18 | ```
19 |
20 | 组件中可以自定义 css 属性的元素如下表:
21 |
22 | | 名称 | 基础类型 | 描述 |
23 | | ---------- | -------- | ------------------ |
24 | | icon | 面 | 图标样式 |
25 | | icon:hover | 面 | 鼠标经过时图标样式 |
26 | | text | 文本 | 文字样式 |
27 | | text:hover | 文本 | 鼠标经过时文字样式 |
28 |
--------------------------------------------------------------------------------
/website/views/more/bar/noAxis.md:
--------------------------------------------------------------------------------
1 | ## 隐藏坐标轴
2 |
3 | :::demo
4 |
5 | ```javascript
6 | const data = [
7 | { value: 2200, label: "05-01" },
8 | { value: 6000, label: "05-02" },
9 | { value: 5600, label: "05-03" },
10 | { value: 8500, label: "05-04" },
11 | { value: 13600, label: "05-05" },
12 | { value: 10800, label: "05-06" },
13 | { value: 6400, label: "05-07" },
14 | { value: 3500, label: "05-08" },
15 | ]
16 | const { Chart, Bar, Tooltip, Axis } = qcharts
17 | const chart = new Chart({
18 | container: "#app",
19 | })
20 | chart.source(data, {
21 | value: "value",
22 | text: "label",
23 | })
24 | let bool = true
25 | const bar = new Bar({})
26 | .style("pillar", { bgcolor: "#47A1FF" })
27 | .style("text", (attrs, data, i, j) => {
28 | let size = attrs.barAttrs.size
29 | let points = attrs.barAttrs.points
30 | let str = data.value + ""
31 |
32 | let result = str
33 | .split("")
34 | .reverse()
35 | .reduce((prev, next, index) => {
36 | return (index % 3 ? next : next + ",") + prev
37 | })
38 | return {
39 | fillColor: "#2AAAFF",
40 | rotate: 0,
41 | text: result,
42 | anchor: [0.5, 1],
43 | pos: [(points[0][0] + points[1][0]) / 2, points[0][1]],
44 | padding: 0,
45 | }
46 | })
47 | const tooltip = new Tooltip({
48 | formatter: (d) => `${d.label}: ${d.value}`,
49 | })
50 |
51 | const axisBottom = new Axis()
52 | .style("axis", false)
53 | .style("scale", false)
54 | .style("label", function(attrs, data, i) {
55 | return {
56 | rotate: 45,
57 | translate: [-10, 0],
58 | anchor: [0, 0],
59 | }
60 | })
61 |
62 | chart.append([bar, tooltip, axisBottom])
63 | ```
64 |
65 | :::
66 |
--------------------------------------------------------------------------------
/docs/56.js:
--------------------------------------------------------------------------------
1 | (window.webpackJsonp_name_=window.webpackJsonp_name_||[]).push([[56],{231:function(t,_,v){"use strict";v.r(_);var render=function(){var t=this.$createElement;this._self._c;return this._m(0)};render._withStripped=!0;var e={components:{}},d=v(2),n=Object(d.a)(e,render,[function(){var t=this,_=t.$createElement,v=t._self._c||_;return v("section",[v("h3",[t._v("图表介绍")]),t._v(" "),v("p",[t._v("Wave, 水波图")]),t._v(" "),v("h3",[t._v("属性 attr")]),t._v(" "),v("table",[v("thead",[v("tr",[v("th",[t._v("名称")]),t._v(" "),v("th",[t._v("说明")]),t._v(" "),v("th",[t._v("默认值")])])]),t._v(" "),v("tbody",[v("tr",[v("td",[t._v("clientRect")]),t._v(" "),v("td",[t._v("Object")]),t._v(" "),v("td",[t._v("{top,right,bottom,left,width,height}")])]),t._v(" "),v("tr",[v("td",[t._v("percent")]),t._v(" "),v("td",[t._v("百分比")]),t._v(" "),v("td")]),t._v(" "),v("tr",[v("td",[t._v("animation")]),t._v(" "),v("td",[t._v("动画配置")]),t._v(" "),v("td")]),t._v(" "),v("tr",[v("td",[t._v("formatter")]),t._v(" "),v("td",[t._v("文本格式化")]),t._v(" "),v("td",[v("code",{pre:!0},[t._v("(fn: Function)")])])])])]),t._v(" "),v("h3",[t._v("样式")]),t._v(" "),v("p",[t._v("组件中可以自定义 css 属性的元素如下表:")]),t._v(" "),v("table",[v("thead",[v("tr",[v("th",[t._v("名称")]),t._v(" "),v("th",[t._v("基础类型")]),t._v(" "),v("th",[t._v("描述")])])]),t._v(" "),v("tbody",[v("tr",[v("td",[t._v("wave")]),t._v(" "),v("td",[t._v("面")]),t._v(" "),v("td",[t._v("水波图形的样式")])]),t._v(" "),v("tr",[v("td",[t._v("shape")]),t._v(" "),v("td",[t._v("面")]),t._v(" "),v("td",[t._v("水波背景的样式")])]),t._v(" "),v("tr",[v("td",[t._v("text")]),t._v(" "),v("td",[t._v("文本")]),t._v(" "),v("td",[t._v("文本的样式")])])])])])}],!1,null,null,null);n.options.__file="website/views/doc/api/wave.md";_.default=n.exports}}]);
2 | //# sourceMappingURL=56.js.map?v=d2f1c2b
--------------------------------------------------------------------------------
/website/views/plugin/legend/layout.md:
--------------------------------------------------------------------------------
1 | ## 位置调整
2 |
3 | 通过设置 `Legend` 的 `align` 属性,可以进行位置调整。
4 |
5 | :::demo
6 |
7 | ```javascript
8 | const data = [{ value: 2010 }, { value: 2011 }, { value: 2012 }]
9 | const { Chart, Legend } = qcharts
10 |
11 | const chart = new Chart({ container: '#app' })
12 | chart.source(data, {
13 | value: 'value'
14 | })
15 |
16 | const l1 = new Legend({ orient: 'vertical', align: ['left', 'top'] })
17 | const l2 = new Legend({ orient: 'vertical', align: ['left', 'center'] })
18 | const l3 = new Legend({ orient: 'vertical', align: ['left', 'bottom'] })
19 | const l4 = new Legend({ orient: 'vertical', align: ['center', 'top'] })
20 | const l5 = new Legend({ orient: 'vertical', align: ['center', 'center'] })
21 | const l6 = new Legend({ orient: 'vertical', align: ['center', 'bottom'] })
22 | const l7 = new Legend({ orient: 'vertical', align: ['right', 'top'] })
23 | const l8 = new Legend({ orient: 'vertical', align: ['right', 'center'] })
24 | const l9 = new Legend({ orient: 'vertical', align: ['right', 'bottom'] })
25 |
26 | const l00 = new Legend({ orient: 'vertical', align: ['25%', '25%'] })
27 | const l01 = new Legend({ orient: 'vertical', align: ['75%', 130] })
28 | const l02 = new Legend({ orient: 'vertical', align: ['25%', '75%'] })
29 | const l03 = new Legend({ orient: 'vertical', align: ['75%', 375] })
30 |
31 | chart.append([l1, l2, l3, l4, l5, l6, l7, l8, l9, l00, l01, l02, l03])
32 | ```
33 |
34 | :::
35 |
36 | ### `align` 的取值
37 |
38 | `align` 应当为一个数组。数组第 1 项控制水平方向位置,数组第 2 项控制垂直方向位置。
39 |
40 | 其中,第 1 项可取值:
41 |
42 | `left`、`center`、`right` 分别代表着 左对齐、居中 、右对齐,此外也可设置为 **_数字_** 或 **_百分比_**。
43 |
44 | 第 2 项可取值:
45 |
46 | `top`、`center`、`bottom` 分别代表着 靠顶、居中、靠底,此外也可设置为 **_数字_** 或 **_百分比_**。
47 |
--------------------------------------------------------------------------------
/website/views/more/test/axis.md:
--------------------------------------------------------------------------------
1 | ## Double Line Chart 双 Y 轴折线图
2 |
3 | :::demo
4 |
5 | ```javascript
6 | const data = [
7 | { date: '05-01', category: '图例一', sales: 15.2 },
8 | { date: '05-02', category: '图例一', sales: 39.2 },
9 | { date: '05-03', category: '图例一', sales: 51.2 },
10 | { date: '05-04', category: '图例一', sales: 65.2 },
11 | { date: '05-05', category: '图例一', sales: 55.2 },
12 | { date: '05-06', category: '图例一', sales: 75.2 },
13 | { date: '05-07', category: '图例一', sales: 85.2 },
14 | { date: '05-08', category: '图例一', sales: 65.2 },
15 | { date: '05-01', category: '图例二', sales: 20.2 },
16 | { date: '05-02', category: '图例二', sales: 49.2 },
17 | { date: '05-03', category: '图例二', sales: 57.2 },
18 | { date: '05-04', category: '图例二', sales: 55.2 },
19 | { date: '05-05', category: '图例二', sales: 75.2 },
20 | { date: '05-06', category: '图例二', sales: 95.2 },
21 | { date: '05-07', category: '图例二', sales: 90.2 },
22 | { date: '05-08', category: '图例二', sales: 85.2 }
23 | ]
24 |
25 | const { Chart, Line, Axis } = qcharts
26 |
27 | const chart = new Chart({
28 | container: '#app'
29 | })
30 |
31 | chart.source(data, {
32 | row: 'category',
33 | value: 'sales',
34 | text: 'date'
35 | })
36 | let newData = chart.dataset.selectRows(['图例一'])
37 | const line = new Line({ smooth: true, splitNumber: 5 })
38 | const leftAxis = new Axis({ orient: 'left' })
39 | const bottomAxis = new Axis()
40 | chart.dataset.on('change', function(res) {
41 | console.log('dataset', res)
42 | })
43 | newData.on('change', function(res) {
44 | console.log('newData', res)
45 | })
46 |
47 | chart.append([bottomAxis, leftAxis, line])
48 | setTimeout(function() {
49 | //chart.source(data1)
50 | }, 1000)
51 | ```
52 |
53 | :::
54 |
--------------------------------------------------------------------------------
/website/views/demo/radar/radar_grid_style.md:
--------------------------------------------------------------------------------
1 | ## grid 样式设置
2 |
3 | :::demo
4 |
5 | ```javascript
6 | const data = [
7 | { label: '客服', category: '实际开销', value: 2 },
8 | { label: '研发', category: '实际开销', value: 22 },
9 | { label: '市场', category: '实际开销', value: 69 },
10 | { label: '扯淡', category: '实际开销', value: 69 },
11 | { label: '销售', category: '实际开销', value: 66 },
12 | { label: '管理', category: '实际开销', value: 32 },
13 | { label: '技术', category: '实际开销', value: 24 },
14 |
15 | { label: '客服', category: '节能减排', value: 100 },
16 | { label: '研发', category: '节能减排', value: 47 },
17 | { label: '市场', category: '节能减排', value: 73 },
18 | { label: '扯淡', category: '节能减排', value: 48 },
19 | { label: '销售', category: '节能减排', value: 10 },
20 | { label: '管理', category: '节能减排', value: 41 },
21 | { label: '技术', category: '节能减排', value: 32 }
22 | ]
23 |
24 | const { Chart, Radar, Tooltip, Legend } = qcharts
25 |
26 | const chart = new Chart({
27 | container: '#app'
28 | })
29 | chart.source(data, {
30 | row: 'category',
31 | value: 'value',
32 | text: 'label'
33 | })
34 |
35 | const radar = new Radar({ gridType: 'circle' })
36 | radar
37 | .style('grid', (attr, data, i) => {
38 | return {
39 | lineWidth: 1,
40 | color: '#34495e'
41 | }
42 | })
43 | .style('grid:hover', (attr, data, i) => ({ lineWidth: 3 }))
44 |
45 | chart.append(radar)
46 | ```
47 |
48 | :::
49 |
50 | ### grid 可配置 style 说明
51 |
52 | 名称:grid、grid:hover
53 |
54 | 函数参数:
55 |
56 | ```json
57 | {
58 | "attr": { color, fillColor, lineWidth, lineDash, opacity },
59 | "data": { level },
60 | index
61 | }
62 | ```
63 |
64 | 可配置属性
65 |
66 | ```json
67 | { color, fillColor, lineWidth, lineDash, opacity }
68 | ```
69 |
70 | 返回 false 则不渲染
71 |
--------------------------------------------------------------------------------
/website/views/demo/radar/radar_label_y_style.md:
--------------------------------------------------------------------------------
1 | ## label 样式设置 (Y 轴)
2 |
3 | :::demo label
4 |
5 | ```javascript
6 | const data = [
7 | { label: '客服', category: '实际开销', value: 2 },
8 | { label: '研发', category: '实际开销', value: 22 },
9 | { label: '市场', category: '实际开销', value: 69 },
10 | { label: '扯淡', category: '实际开销', value: 69 },
11 | { label: '销售', category: '实际开销', value: 66 },
12 | { label: '管理', category: '实际开销', value: 32 },
13 | { label: '技术', category: '实际开销', value: 24 },
14 |
15 | { label: '客服', category: '节能减排', value: 100 },
16 | { label: '研发', category: '节能减排', value: 47 },
17 | { label: '市场', category: '节能减排', value: 73 },
18 | { label: '扯淡', category: '节能减排', value: 48 },
19 | { label: '销售', category: '节能减排', value: 10 },
20 | { label: '管理', category: '节能减排', value: 41 },
21 | { label: '技术', category: '节能减排', value: 32 }
22 | ]
23 |
24 | const { Chart, Radar, Tooltip, Legend } = qcharts
25 |
26 | const chart = new Chart({
27 | container: '#app'
28 | })
29 | chart.source(data, {
30 | row: 'category',
31 | value: 'value',
32 | text: 'label'
33 | })
34 |
35 | const radar = new Radar()
36 |
37 | radar
38 | .style('scale', (attr, data, i) => {
39 | const colors = ['red', 'green', 'blue', 'black']
40 | return i < 4 ? { color: colors[i], display: 'block' } : { color: colors[4 - i], display: 'block' }
41 | })
42 | .style('scale:hover', (attr, data, i) => ({ font: '17px 宋体' }))
43 |
44 | chart.append(radar)
45 | ```
46 |
47 | :::
48 |
49 | ### scale 可配置 style 说明
50 |
51 | 名称:scale、scale:hover
52 |
53 | 函数参数:
54 |
55 | ```json
56 | {
57 | "attr": { color, font, radian },
58 | "data": { text, index },
59 | index
60 | }
61 | ```
62 |
63 | 可配置属性
64 |
65 | ```json
66 | { color, font, offset }
67 | ```
68 |
--------------------------------------------------------------------------------
/website/views/doc/api/area-api.md:
--------------------------------------------------------------------------------
1 | ### 图表介绍
2 |
3 | Area Chart, 面积图。
4 |
5 | ### attrs
6 |
7 | attrs 包含若干布局属性,将这些属性放入 Object 对象传入组件
8 |
9 | | 属性名 | 类型 | 默认值 | 描述 |
10 | | ----------- | ------- | ------------------------------------ | ------------------------------------------------------------------------------------- |
11 | | clientRect | Object | {top,right,bottom,left,width,height} | 设置了 width,heigh,优先与 bottom,right |
12 | | smooth | Boolean | false | 曲线是否平滑 |
13 | | axisGap | Boolean | false | 开始绘图区域与坐标轴是否有间隙 |
14 | | splitNumber | Number | 0 | 坐标轴的分割段数,用来计算面积图的最大高度,在设置坐标轴的 splitNumber 属性时同步加上 |
15 | | strack | Boolean | true | 是否堆叠 |
16 |
17 | ### style 属性
18 |
19 | ```javascript
20 | const area = new Area({ smooth: true })
21 | area.style('area', function(attrs, data, i) {
22 | if (i === 0) {
23 | return { fillColor: 'transparent' }
24 | }
25 | })
26 | ```
27 |
28 | 组件中可以自定义 css 属性的元素如下表:
29 |
30 | | 名称 | 基础类型 | 描述 |
31 | | ----------- | -------- | ------------------------ |
32 | | guideline | 线 | 指导线样式 |
33 | | line | 线 | 线条样式 |
34 | | area | 面 | 面积样式设置 (Polygon) |
35 | | point | 面 | 线条上标记点样式 |
36 | | point:hover | 面 | hover 时线条上标记点样式 |
--------------------------------------------------------------------------------
/website/views/demo/radar/radar_area_style.md:
--------------------------------------------------------------------------------
1 | ## section 样式设置
2 |
3 | :::demo area
4 |
5 | ```javascript
6 | const data = [
7 | { label: '客服', category: '实际开销', value: 2 },
8 | { label: '研发', category: '实际开销', value: 22 },
9 | { label: '市场', category: '实际开销', value: 69 },
10 | { label: '扯淡', category: '实际开销', value: 69 },
11 | { label: '销售', category: '实际开销', value: 66 },
12 | { label: '管理', category: '实际开销', value: 32 },
13 | { label: '技术', category: '实际开销', value: 24 },
14 |
15 | { label: '客服', category: '节能减排', value: 100 },
16 | { label: '研发', category: '节能减排', value: 47 },
17 | { label: '市场', category: '节能减排', value: 73 },
18 | { label: '扯淡', category: '节能减排', value: 48 },
19 | { label: '销售', category: '节能减排', value: 10 },
20 | { label: '管理', category: '节能减排', value: 41 },
21 | { label: '技术', category: '节能减排', value: 32 }
22 | ]
23 |
24 | const { Chart, Radar, Tooltip, Legend } = qcharts
25 |
26 | const chart = new Chart({
27 | container: '#app'
28 | })
29 | chart.source(data, {
30 | row: 'category',
31 | value: 'value',
32 | text: 'label'
33 | })
34 |
35 | const radar = new Radar()
36 | radar
37 | .style('section', (attr, data, i) => {
38 | const obj = {
39 | 实际开销: '#00C8FB',
40 | 节能减排: '#D77169'
41 | }
42 | return { fillColor: obj[data[0].category], opacity: 0.5 }
43 | })
44 | .style('section:hover', (attr, data, i) => ({ fillColor: 'red' }))
45 |
46 | chart.append(radar)
47 | ```
48 |
49 | :::
50 |
51 | ### section 可配置 style 说明
52 |
53 | 名称:section、section:hover
54 |
55 | 函数参数:
56 |
57 | ```json
58 | {
59 | "attr": { fillColor, opacity },
60 | "data": { category },
61 | index
62 | }
63 | ```
64 |
65 | 可配置属性
66 |
67 | ```json
68 | { fillColor, opacity }
69 | ```
70 |
71 | 返回 false 则不渲染
72 |
--------------------------------------------------------------------------------
/website/views/demo/radar/radar_axis_style.md:
--------------------------------------------------------------------------------
1 | ## axis 样式设置
2 |
3 | :::demo 坐标轴
4 |
5 | ```javascript
6 | const data = [
7 | { label: '客服', category: '实际开销', value: 2 },
8 | { label: '研发', category: '实际开销', value: 22 },
9 | { label: '市场', category: '实际开销', value: 69 },
10 | { label: '扯淡', category: '实际开销', value: 69 },
11 | { label: '销售', category: '实际开销', value: 66 },
12 | { label: '管理', category: '实际开销', value: 32 },
13 | { label: '技术', category: '实际开销', value: 24 },
14 |
15 | { label: '客服', category: '节能减排', value: 100 },
16 | { label: '研发', category: '节能减排', value: 47 },
17 | { label: '市场', category: '节能减排', value: 73 },
18 | { label: '扯淡', category: '节能减排', value: 48 },
19 | { label: '销售', category: '节能减排', value: 10 },
20 | { label: '管理', category: '节能减排', value: 41 },
21 | { label: '技术', category: '节能减排', value: 32 }
22 | ]
23 |
24 | const { Chart, Radar, Tooltip, Legend } = qcharts
25 |
26 | const chart = new Chart({
27 | container: '#app'
28 | })
29 | chart.source(data, {
30 | row: 'category',
31 | value: 'value',
32 | text: 'label'
33 | })
34 |
35 | const radar = new Radar()
36 |
37 | radar
38 | .style('axis', (attr, data, i) => {
39 | return i % 2 === 0 ? { color: 'red' } : { color: 'green', lineDash: [2, 10] }
40 | })
41 | .style('axis:hover', (attr, data, i) => ({
42 | lineWidth: attr.lineWidth + 2
43 | }))
44 |
45 | chart.append(radar)
46 | ```
47 |
48 | :::
49 |
50 | ### axis 可配置 style 说明
51 |
52 | 名称:axis、axis:hover
53 |
54 | 函数参数:
55 |
56 | ```json
57 | {
58 | "attr": { color, lineWidth, lineDash, renderAxisLabel },
59 | "data": { category, radian },
60 | index
61 | }
62 | ```
63 |
64 | 可配置属性
65 |
66 | ```json
67 | { color, lineWidth, lineDash, renderAxisLabel }
68 | ```
69 |
70 | 返回 false 则不渲染
71 |
--------------------------------------------------------------------------------
/website/views/demo/radar/radar_label_style.md:
--------------------------------------------------------------------------------
1 | ## label 样式设置 (x 轴)
2 |
3 | :::demo label
4 |
5 | ```javascript
6 | const data = [
7 | { label: '客服', category: '实际开销', value: 2 },
8 | { label: '研发', category: '实际开销', value: 22 },
9 | { label: '市场', category: '实际开销', value: 69 },
10 | { label: '扯淡', category: '实际开销', value: 69 },
11 | { label: '销售', category: '实际开销', value: 66 },
12 | { label: '管理', category: '实际开销', value: 32 },
13 | { label: '技术', category: '实际开销', value: 24 },
14 |
15 | { label: '客服', category: '节能减排', value: 100 },
16 | { label: '研发', category: '节能减排', value: 47 },
17 | { label: '市场', category: '节能减排', value: 73 },
18 | { label: '扯淡', category: '节能减排', value: 48 },
19 | { label: '销售', category: '节能减排', value: 10 },
20 | { label: '管理', category: '节能减排', value: 41 },
21 | { label: '技术', category: '节能减排', value: 32 }
22 | ]
23 |
24 | const { Chart, Radar, Tooltip, Legend } = qcharts
25 |
26 | const chart = new Chart({
27 | container: '#app'
28 | })
29 | chart.source(data, {
30 | row: 'category',
31 | value: 'value',
32 | text: 'label'
33 | })
34 |
35 | const radar = new Radar()
36 |
37 | radar
38 | .style('label', (attr, data, i) => {
39 | const colors = ['red', 'green', 'blue', 'black']
40 | return i < 4 ? { color: colors[i], offset: 10 } : { color: colors[7 - i] }
41 | })
42 | .style('label:hover', (attr, data, i) => ({ font: '17px 宋体' }))
43 |
44 | chart.append(radar)
45 | ```
46 |
47 | :::
48 |
49 | ### label 可配置 style 说明
50 |
51 | 名称:label、label:hover
52 |
53 | 函数参数:
54 |
55 | ```json
56 | {
57 | "attr": { color, font, radian },
58 | "data": { label },
59 | index
60 | }
61 | ```
62 |
63 | 可配置属性
64 |
65 | ```json
66 | { color, font, offset }
67 | ```
68 |
69 | offset 为偏移量
70 | 返回 false 则不渲染
71 |
--------------------------------------------------------------------------------
/website/views/demo/Column/group-column.md:
--------------------------------------------------------------------------------
1 | ## Group Column Chart 分组柱状图
2 |
3 | :::demo
4 |
5 | ```javascript
6 | const data = [
7 | {
8 | product: "05-08",
9 | year: "图例一",
10 | sales: 42,
11 | },
12 | {
13 | product: "05-08",
14 | year: "图例二",
15 | sales: 78.2,
16 | },
17 | {
18 | product: "05-08",
19 | year: "图例三",
20 | sales: 62,
21 | },
22 | {
23 | product: "05-09",
24 | year: "图例一",
25 | sales: 80,
26 | },
27 | {
28 | product: "05-09",
29 | year: "图例二",
30 | sales: 108,
31 | },
32 | {
33 | product: "05-09",
34 | year: "图例三",
35 | sales: 64,
36 | },
37 | {
38 | product: "05-10",
39 | year: "图例一",
40 | sales: 36,
41 | },
42 | {
43 | product: "05-10",
44 | year: "图例二",
45 | sales: 91,
46 | },
47 | {
48 | product: "05-10",
49 | year: "图例三",
50 | sales: 56,
51 | },
52 | ]
53 | const { Chart, Bar, Tooltip, Axis, Legend } = qcharts
54 | const chart = new Chart({
55 | container: "#app",
56 | })
57 | chart.source(data, {
58 | row: "year",
59 | value: "sales",
60 | text: "product",
61 | })
62 | const bar = new Bar({
63 | transpose: false,
64 | barWidth: 20,
65 | })
66 | const tooltip = new Tooltip()
67 | const colors = ["#F00", "#FF0", "#0FF"]
68 | const legend = new Legend().style("point", (i, j, k) => {
69 | return {
70 | pointType: "star",
71 | angles: 5,
72 | innerRadius: 4,
73 | outerRadius: 8,
74 | fillColor: colors[k],
75 | translate: [2, 5],
76 | }
77 | })
78 | const axisBottom = new Axis().style("grid", false)
79 | const axisLeft = new Axis({ orient: "left" })
80 | .style("axis", false)
81 | .style("scale", false)
82 | chart.append([bar, tooltip, axisBottom, axisLeft, legend])
83 | ```
84 |
85 | :::
86 |
--------------------------------------------------------------------------------
/website/views/demo/radar/radar_update.md:
--------------------------------------------------------------------------------
1 | ## 雷达图数据更新
2 |
3 | :::demo 数据更新
4 |
5 | ```javascript
6 | const data = [
7 | { label: '客服', category: '实际开销', value: 2 },
8 | { label: '研发', category: '实际开销', value: 22 },
9 | { label: '市场', category: '实际开销', value: 69 },
10 | { label: '扯淡', category: '实际开销', value: 69 },
11 | { label: '销售', category: '实际开销', value: 66 },
12 | { label: '管理', category: '实际开销', value: 32 },
13 | { label: '技术', category: '实际开销', value: 24 },
14 |
15 | { label: '客服', category: '节能减排', value: 100 },
16 | { label: '研发', category: '节能减排', value: 47 },
17 | { label: '市场', category: '节能减排', value: 73 },
18 | { label: '扯淡', category: '节能减排', value: 48 },
19 | { label: '销售', category: '节能减排', value: 10 },
20 | { label: '管理', category: '节能减排', value: 41 },
21 | { label: '技术', category: '节能减排', value: 32 }
22 | ]
23 |
24 | const { Chart, Radar, Tooltip, Legend } = qcharts
25 |
26 | const chart = new Chart({
27 | container: '#app'
28 | })
29 | chart.source(data, {
30 | row: 'category',
31 | value: 'value',
32 | text: 'label'
33 | })
34 |
35 | const radar = new Radar()
36 |
37 | chart.append(new Legend())
38 |
39 | const data2 = [
40 | { label: '客服', category: '添加测试', value: 130 },
41 | { label: '研发', category: '添加测试', value: 92 },
42 | { label: '市场', category: '添加测试', value: 70 },
43 | { label: '扯淡', category: '添加测试', value: 65 },
44 | { label: '销售', category: '添加测试', value: 21 },
45 | { label: '管理', category: '添加测试', value: 66 },
46 | { label: '技术', category: '添加测试', value: 70 }
47 | ]
48 |
49 | let change = true
50 | setInterval(() => {
51 | if (change) {
52 | chart.source(data2)
53 | } else {
54 | chart.source(data)
55 | }
56 | change = !change
57 | }, 3000)
58 |
59 | chart.append(radar)
60 | ```
61 |
62 | :::
63 |
--------------------------------------------------------------------------------
/website/views/demo/pie/nest.md:
--------------------------------------------------------------------------------
1 | ## Nested Pie Chart 嵌套饼图
2 |
3 | :::demo
4 |
5 | ```javascript
6 | const data = [
7 | { value: 204, name: '图例一' },
8 | { value: 451, name: '图例二' },
9 | { value: 347, name: '图例三' },
10 | { value: 256, name: '图例四' },
11 |
12 | { value: 2790, name: '图例1' },
13 | { value: 2548, name: '图例2' },
14 | { value: 1350, name: '图例3' },
15 | { value: 3100, name: '图例4' },
16 | { value: 2340, name: '图例5' },
17 | { value: 1350, name: '图例6' },
18 | { value: 2450, name: '图例7' },
19 | { value: 1550, name: '图例8' },
20 | { value: 3450, name: '图例9' },
21 | { value: 2750, name: '图例10' }
22 | ]
23 |
24 | const { Chart, Pie, Legend, Tooltip, theme } = qcharts
25 | const colors1 = ['#5982F6', '#59CB74', '#DA65CC', '#FC6980']
26 | const colors2 = ['#47A1FF', '#6CD3FF', '#A2E5FF', '#4DCCCB', '#3FDDC7', '#ADDF84', '#FBD54A', '#FFB952', '#F79452', '#E37474']
27 | const colors = colors1.concat(colors2)
28 | theme.set({ colors })
29 | const chart = new Chart({
30 | container: '#app'
31 | })
32 |
33 | chart.source(data, {
34 | row: 'name',
35 | value: 'value'
36 | })
37 |
38 | const ds = chart.dataset
39 |
40 | const pie = new Pie({
41 | radius: 0.4,
42 | pos: [0, 0]
43 | }).source(ds.selectRows(data.slice(0, 4).map(d => d.name)))
44 |
45 | //可以通过设置单个visual的主题,设置样式和属性
46 | pie.theme.set({
47 | colors: colors1,
48 | attrs: {},
49 | styles: {
50 | guideText: { borderRadius: 2, bgcolor: 'rgba(255,255,255,0.7)' }
51 | }
52 | })
53 |
54 | const pie2 = new Pie({
55 | innerRadius: 0.5,
56 | radius: 0.7
57 | }).source(ds.selectRows(data.slice(4).map(d => d.name)))
58 |
59 | pie2.theme.set({ colors: colors2 })
60 | const legend = new Legend({ orient: 'vertical', align: ['right', 'center'] })
61 |
62 | chart.append([pie2, pie, legend])
63 | ```
64 |
65 | :::
66 |
--------------------------------------------------------------------------------
/website/views/demo/Area/area-range.md:
--------------------------------------------------------------------------------
1 | ## Range Area Chart 区间面积图
2 |
3 | :::demo
4 |
5 | ```javascript
6 | const data = [
7 | { date: '05-01', category: '图例一', sales: 15.2 },
8 | { date: '05-02', category: '图例一', sales: 39.2 },
9 | { date: '05-03', category: '图例一', sales: 31.2 },
10 | { date: '05-04', category: '图例一', sales: 65.2 },
11 | { date: '05-05', category: '图例一', sales: 55.2 },
12 | { date: '05-06', category: '图例一', sales: 75.2 },
13 | { date: '05-07', category: '图例一', sales: 95.2 },
14 | { date: '05-08', category: '图例一', sales: 65.2 },
15 | { date: '05-01', category: '图例二', sales: 10.2 },
16 | { date: '05-02', category: '图例二', sales: 30.2 },
17 | { date: '05-03', category: '图例二', sales: 25.2 },
18 | { date: '05-04', category: '图例二', sales: 70.2 },
19 | { date: '05-05', category: '图例二', sales: 45.2 },
20 | { date: '05-06', category: '图例二', sales: 56.2 },
21 | { date: '05-07', category: '图例二', sales: 70.2 },
22 | { date: '05-08', category: '图例二', sales: 45.2 }
23 | ]
24 |
25 | const { Chart, Area, Axis, Tooltip } = qcharts
26 |
27 | const chart = new Chart({
28 | container: '#app'
29 | })
30 |
31 | chart.source(data, {
32 | row: 'category',
33 | value: 'sales',
34 | text: 'date'
35 | })
36 |
37 | const area = new Area({ smooth: true }).style('area', function(attrs, data, i) {
38 | if (i === 0) {
39 | return { fillColor: 'transparent', strokeColor: 'transparent' }
40 | } else if (i === 1) {
41 | return { fillColor: '#eee' }
42 | }
43 | })
44 |
45 | const axisBottom = new Axis().style('grid', false)
46 | const tooltip = new Tooltip()
47 | const axisLeft = new Axis({ orient: 'left' })
48 | .style('axis', false)
49 | .style('scale', false)
50 | .style('grid', false)
51 |
52 | chart.append([area, axisBottom, axisLeft, tooltip])
53 | ```
54 |
55 | :::
56 |
--------------------------------------------------------------------------------
/website/views/more/bar/cutBar.md:
--------------------------------------------------------------------------------
1 | ## 柱状图颜色渐变
2 |
3 | :::demo
4 |
5 | ```javascript
6 | const data = [
7 | { value: 7, label: '易涝区' },
8 | { value: 11, label: '台风易受灾区' },
9 | { value: 20, label: '坍塌' },
10 | { value: 6, label: '滑坡' },
11 | { value: 3, label: '泥石流危险区' }
12 | ]
13 | const BAR_WIDTH = 30
14 | const color = '#30FBAB'
15 | const { Chart, Bar, Tooltip, Axis, theme } = qcharts
16 | theme.set({ colors: [color] })
17 |
18 | const { Gradient } = spritejs
19 | const chart = new Chart({
20 | container: '#app'
21 | })
22 |
23 | chart.source(data, {
24 | value: 'value',
25 | text: 'label'
26 | })
27 |
28 | const bar = new Bar({ barWidth: BAR_WIDTH })
29 | .style('text', (attrs, data, i, j) => {
30 | const size = attrs.barAttrs.size
31 | const points = attrs.barAttrs.points
32 | return {
33 | padding: 0,
34 | rotate: 0,
35 | text: data.value,
36 | fillColor: color,
37 | anchor: [0.5, 1],
38 | pos: [(points[0][0] + points[1][0]) / 2, points[0][1] - 20]
39 | }
40 | })
41 | .style('pillar', (attrs, data, i, j) => {
42 | const points = attrs.points
43 | points[0][1] = points[0][1] + BAR_WIDTH / 2
44 | return { points }
45 | })
46 | const tooltip = new Tooltip({
47 | formatter: d => `${d.label}: ${d.value}`
48 | })
49 | const axisLeft = new Axis({ orient: 'left' })
50 | .style('axis', false)
51 | .style('scale', false)
52 | .style('grid', { strokeColor: 'rgba(48, 251, 171,0.5)' })
53 | .style('label', { fillColor: color })
54 | const axisBottom = new Axis()
55 | .style('scale', false)
56 | .style('axis', { strokeColor: 'rgba(48, 251, 171,1)' })
57 | .style('label', { padding: [20, 5], fillColor: color })
58 | .style('grid', false)
59 |
60 | chart.append([bar, tooltip, axisBottom, axisLeft])
61 | ```
62 |
63 | :::
64 |
--------------------------------------------------------------------------------
/website/views/demo/line/line-smooth.md:
--------------------------------------------------------------------------------
1 | ## Curve Line Chart 曲线折线图
2 |
3 | :::demo
4 |
5 | ```javascript
6 | const data = [
7 | { date: '05-01', catgory: '图例一', sales: 15.2 },
8 | { date: '05-02', catgory: '图例一', sales: 39.2 },
9 | { date: '05-03', catgory: '图例一', sales: 51.2 },
10 | { date: '05-04', catgory: '图例一', sales: 65.2 },
11 | { date: '05-05', catgory: '图例一', sales: 55.2 },
12 | { date: '05-06', catgory: '图例一', sales: 75.2 },
13 | { date: '05-07', catgory: '图例一', sales: 95.2 },
14 | { date: '05-08', catgory: '图例一', sales: 65.2 },
15 | { date: '05-01', catgory: '图例二', sales: 20.2 },
16 | { date: '05-02', catgory: '图例二', sales: 49.2 },
17 | { date: '05-03', catgory: '图例二', sales: 57.2 },
18 | { date: '05-04', catgory: '图例二', sales: 55.2 },
19 | { date: '05-05', catgory: '图例二', sales: 75.2 },
20 | { date: '05-06', catgory: '图例二', sales: 95.2 },
21 | { date: '05-07', catgory: '图例二', sales: 110.2 },
22 | { date: '05-08', catgory: '图例二', sales: 85.2 }
23 | ]
24 |
25 | const { Chart, Line, Axis, Legend, Tooltip, theme } = qcharts
26 | //修改全局样式
27 | theme.set({
28 | visuals: {
29 | Line: {
30 | styles: {
31 | line: { lineWidth: 2 }
32 | }
33 | }
34 | }
35 | })
36 |
37 | const chart = new Chart({
38 | container: '#app'
39 | })
40 |
41 | chart.source(data, {
42 | row: 'catgory',
43 | value: 'sales',
44 | text: 'date'
45 | })
46 |
47 | const line = new Line()
48 | line.style('line', function(attrs, data, i) {
49 | if (i === 1) {
50 | return { smooth: true }
51 | }
52 | })
53 |
54 | const axisBottom = new Axis().style('grid', false)
55 | const tooltip = new Tooltip()
56 | const legend = new Legend()
57 | const axisLeft = new Axis({ orient: 'left' }).style('axis', false).style('scale', false)
58 |
59 | chart.append([line, axisBottom, axisLeft, tooltip, legend])
60 | ```
61 |
62 | :::
63 |
--------------------------------------------------------------------------------
/website/views/doc/api/Gauge.md:
--------------------------------------------------------------------------------
1 | ### 图表介绍
2 |
3 | Gauge, 仪表盘。
4 |
5 | ### attrs
6 |
7 | | 属性名 | 类型 | 默认值 | 描述 |
8 | | ------------- | ------------------ | -------- | ------------------------------------------------------ |
9 | | title | String \| Function | `d => d` | 标题 |
10 | | min | Number | `0` | 最小值 |
11 | | max | Number | `1` | 最大值 |
12 | | startAngle | Number | 140 | 起始角度 |
13 | | endAngle | Number | 400 | 结束角度 |
14 | | strokeBgcolor | String | `#eee` | 背景色 |
15 | | lineWidth | Number | `0` | 弧线宽度 |
16 | | lineCap | String | `round` | 弧线线帽 |
17 | | tickStep | Number | `0.1` | tick 步进,生成 tick 的数量为 `(max - min) / tickStep` |
18 | | tickLength | Number | `5` | 刻度长度,为负值时向外绘制 |
19 | | labelOffset | Number | `5` | 刻度上文字与刻度线距离 |
20 | | tickFormatter | Function | `d => d` | 刻度文本格式化 |
21 |
22 | ### style
23 |
24 | 组件中可以自定义 css 属性的元素如下表:
25 |
26 | | 名称 | 基础类型 | 描述 |
27 | | -------- | -------- | ------------ |
28 | | arc | 线 | 弧线样式 |
29 | | pointer | 面 | 仪表盘指针 |
30 | | title | 文本 | 标题样式 |
31 | | tickLine | 文本 | 刻度线样式 |
32 | | tickText | 文本 | 刻度文字样式 |
33 |
--------------------------------------------------------------------------------
/website/views/more/bar/textureBar.md:
--------------------------------------------------------------------------------
1 | ## 纹理条形图
2 |
3 | :::demo
4 |
5 | ```javascript
6 | const data = [
7 | { value: 43, label: "TOP1" },
8 | { value: 26, label: "TOP2" },
9 | { value: 24, label: "TOP3" },
10 | { value: 20, label: "TOP4" },
11 | { value: 10, label: "TOP5" },
12 | ]
13 | const { Chart, Bar, Tooltip, Axis, Legend } = qcharts
14 | const chart = new Chart({
15 | container: "#app",
16 | })
17 | chart.source(data, {
18 | value: "value",
19 | text: "label",
20 | })
21 | const bar = new Bar({
22 | transpose: true,
23 | barWidth: 30,
24 | })
25 |
26 | const texture1 = "https://p3.ssl.qhimg.com/t01128a717c0ff244f1.png"
27 | const texture2 = "https://p5.ssl.qhimg.com/t01c5d76eabda023606.png"
28 | bar
29 | .style("pillar", (attrs, data, i, j) => {
30 | if (i === 0) {
31 | return {
32 | texture: texture1,
33 | textureRect: [0, 0, 445, 40],
34 | }
35 | } else {
36 | return {
37 | texture: texture2,
38 | textureRect: [0, 0, 445, 40],
39 | }
40 | }
41 | })
42 | .style("text", (attrs, data, i, j) => {
43 | let size = attrs.barAttrs.size
44 | let points = attrs.barAttrs.points
45 | return {
46 | color: "#1DCE91",
47 | rotate: 0,
48 | text: data.value,
49 | anchor: [0, 0.5],
50 | pos: [points[1][0] + 5, (points[1][1] + points[2][1]) / 2],
51 | }
52 | })
53 | const tooltip = new Tooltip({
54 | formatter: (d) => `${d.label}: ${d.value}`,
55 | })
56 | const legend = new Legend({ align: ["center", "bottom"] }).style("text", {
57 | text: "图例一",
58 | })
59 |
60 | const axisLeft = new Axis({
61 | orient: "left",
62 | })
63 | .style("axis", { strokeColor: "#1DCE91" })
64 | .style("grid", false)
65 | .style("scale", false)
66 | .style("label", { color: "#1DCE91" })
67 | chart.append([bar, axisLeft])
68 | ```
69 |
70 | :::
71 |
--------------------------------------------------------------------------------
/website/views/more/test/dom.md:
--------------------------------------------------------------------------------
1 | ## Double Line Chart 双 Y 轴折线图
2 |
3 | :::demo
4 |
5 | ```javascript
6 | const data = [
7 | { date: '05-01', category: '图例一', sales: 15.2 },
8 | { date: '05-02', category: '图例一', sales: 39.2 },
9 | { date: '05-03', category: '图例一', sales: 51.2 },
10 | { date: '05-04', category: '图例一', sales: 65.2 },
11 | { date: '05-05', category: '图例一', sales: 55.2 },
12 | { date: '05-06', category: '图例一', sales: 75.2 },
13 | { date: '05-07', category: '图例一', sales: 85.2 },
14 | { date: '05-08', category: '图例一', sales: 65.2 },
15 | { date: '05-01', category: '图例二', sales: 20.2 },
16 | { date: '05-02', category: '图例二', sales: 49.2 },
17 | { date: '05-03', category: '图例二', sales: 57.2 },
18 | { date: '05-04', category: '图例二', sales: 55.2 },
19 | { date: '05-05', category: '图例二', sales: 75.2 },
20 | { date: '05-06', category: '图例二', sales: 95.2 },
21 | { date: '05-07', category: '图例二', sales: 90.2 },
22 | { date: '05-08', category: '图例二', sales: 85.2 }
23 | ]
24 | const { Chart, Line } = qcharts
25 | const $wrap = document.querySelector('#app')
26 | const chart = new Chart({
27 | container: $wrap
28 | })
29 |
30 | chart.source(data, {
31 | row: 'category',
32 | value: 'sales',
33 | text: 'date'
34 | })
35 |
36 | let rows = chart.dataset.rows
37 | rows.forEach(row => {
38 | let span = document.createElement('span')
39 | span.setAttribute('style', 'padding:10px;position:relative;z-index:1')
40 | span.innerHTML = row.name
41 | $wrap.append(span)
42 | span.addEventListener(
43 | 'click',
44 | _ => {
45 | row.state = row.state === 'disabled' ? 'default' : 'disabled'
46 | },
47 | false
48 | )
49 | })
50 | const line = new Line({ splitNumber: 5 })
51 | chart.dataset.on('change', function(res) {
52 | console.log('dataset', res)
53 | })
54 |
55 | chart.append([line])
56 | ```
57 |
58 | :::
59 |
--------------------------------------------------------------------------------
/website/views/demo/pie/calendar.md:
--------------------------------------------------------------------------------
1 | ## 日历
2 |
3 | :::demo
4 |
5 | ```javascript
6 | const days = Array.from({ length: 28 }, (d, i) => `2月${i + 1}日`)
7 | const data = days.reduce((a, c) => {
8 | const data = ['工作', '娱乐', '睡觉'].map((type) => ({
9 | day: c,
10 | type,
11 | value: Math.round(Math.random() * 24)
12 | }))
13 | a.push.apply(a, data)
14 | return a
15 | }, [])
16 |
17 | const data2 = days.reduce((a, c) => {
18 | const data = ['工作', '娱乐', '睡觉'].map((type) => ({
19 | day: c,
20 | type,
21 | value: Math.round(Math.random() * 24)
22 | }))
23 | a.push.apply(a, data)
24 | return a
25 | }, [])
26 |
27 | const { Chart, Pie, Legend, Text, Toolbox } = qcharts
28 |
29 | const chart = new Chart({
30 | container: '#app'
31 | })
32 |
33 | chart.source(data, {
34 | row: 'day',
35 | col: 'type',
36 | value: 'value'
37 | })
38 |
39 | const ds = chart.dataset
40 |
41 | const weekdays = ['一', '二', '三', '四', '五', '六', '日']
42 |
43 | days.slice(0, 7).forEach((d, i) => {
44 | const pos = [14 * (i % 7) + 10 + '%', 15 * ~~(i / 7) + 10 + '%']
45 | const text = new Text({
46 | text: '星期' + weekdays[i],
47 | pos
48 | })
49 | chart.append(text)
50 | })
51 |
52 | days.forEach((d, i) => {
53 | const size = ['8%', '8%']
54 | const pos = [14 * ((i + 2) % 7) + 8 + '%', 14 * ~~((i + 2) / 7) + 20 + '%']
55 |
56 | const pie = new Pie({ size, pos })
57 | pie.source(ds.selectRows(d))
58 | pie.style('text', { color: '#fff' })
59 |
60 | const text = new Text({
61 | text: i + 1,
62 | pos,
63 | anchor: [1.5, 1.0]
64 | })
65 |
66 | chart.append([text, pie])
67 | })
68 |
69 | const legend = new Legend({
70 | layout: 'horizontal',
71 | pos: ['35%', '90%'],
72 | layoutBy: 'cols',
73 |
74 | horizontal: 'center',
75 | vertical: 'bottom'
76 | })
77 | legend.source(['工作', '娱乐', '睡觉'])
78 |
79 | chart.append([legend])
80 | ```
81 |
82 | :::
83 |
--------------------------------------------------------------------------------
/website/components/full-screen.svg:
--------------------------------------------------------------------------------
1 |
2 |
--------------------------------------------------------------------------------
/lib/base/BasePlugin.js:
--------------------------------------------------------------------------------
1 | import _classCallCheck from "@babel/runtime/helpers/classCallCheck";
2 | import _inherits from "@babel/runtime/helpers/inherits";
3 | import _possibleConstructorReturn from "@babel/runtime/helpers/possibleConstructorReturn";
4 | import _getPrototypeOf from "@babel/runtime/helpers/getPrototypeOf";
5 |
6 | function _createSuper(Derived) { var hasNativeReflectConstruct = _isNativeReflectConstruct(); return function _createSuperInternal() { var Super = _getPrototypeOf(Derived), result; if (hasNativeReflectConstruct) { var NewTarget = _getPrototypeOf(this).constructor; result = Reflect.construct(Super, arguments, NewTarget); } else { result = Super.apply(this, arguments); } return _possibleConstructorReturn(this, result); }; }
7 |
8 | function _isNativeReflectConstruct() { if (typeof Reflect === "undefined" || !Reflect.construct) return false; if (Reflect.construct.sham) return false; if (typeof Proxy === "function") return true; try { Boolean.prototype.valueOf.call(Reflect.construct(Boolean, [], function () {})); return true; } catch (e) { return false; } }
9 |
10 | import Base from './Base';
11 | import theme from '../theme/default';
12 | import { deepObjectMerge } from '@qcharts/utils';
13 | import filterClone from 'filter-clone';
14 |
15 | var BasePlugin = /*#__PURE__*/function (_Base) {
16 | _inherits(BasePlugin, _Base);
17 |
18 | var _super = _createSuper(BasePlugin);
19 |
20 | function BasePlugin(attrs) {
21 | var _this;
22 |
23 | _classCallCheck(this, BasePlugin);
24 |
25 | _this = _super.call(this, attrs);
26 | _this.theme = theme.plugins[_this.constructorName]; //如果当前对象设置了theme,不继承theme
27 |
28 | _this.theme.set = function (obj) {
29 | if (_this.theme === theme.plugins[_this.constructorName]) {
30 | _this.theme = filterClone(_this.theme);
31 | }
32 |
33 | _this.theme = deepObjectMerge({}, _this.theme, obj);
34 | };
35 |
36 | return _this;
37 | }
38 |
39 | return BasePlugin;
40 | }(Base);
41 |
42 | export { BasePlugin as default };
--------------------------------------------------------------------------------
/lib/base/BaseVisual.js:
--------------------------------------------------------------------------------
1 | import _classCallCheck from "@babel/runtime/helpers/classCallCheck";
2 | import _inherits from "@babel/runtime/helpers/inherits";
3 | import _possibleConstructorReturn from "@babel/runtime/helpers/possibleConstructorReturn";
4 | import _getPrototypeOf from "@babel/runtime/helpers/getPrototypeOf";
5 |
6 | function _createSuper(Derived) { var hasNativeReflectConstruct = _isNativeReflectConstruct(); return function _createSuperInternal() { var Super = _getPrototypeOf(Derived), result; if (hasNativeReflectConstruct) { var NewTarget = _getPrototypeOf(this).constructor; result = Reflect.construct(Super, arguments, NewTarget); } else { result = Super.apply(this, arguments); } return _possibleConstructorReturn(this, result); }; }
7 |
8 | function _isNativeReflectConstruct() { if (typeof Reflect === "undefined" || !Reflect.construct) return false; if (Reflect.construct.sham) return false; if (typeof Proxy === "function") return true; try { Boolean.prototype.valueOf.call(Reflect.construct(Boolean, [], function () {})); return true; } catch (e) { return false; } }
9 |
10 | import Base from './Base';
11 | import theme from '../theme/default';
12 | import { deepObjectMerge } from '@qcharts/utils';
13 | import filterClone from 'filter-clone';
14 |
15 | var BaseVisual = /*#__PURE__*/function (_Base) {
16 | _inherits(BaseVisual, _Base);
17 |
18 | var _super = _createSuper(BaseVisual);
19 |
20 | function BaseVisual(attrs) {
21 | var _this;
22 |
23 | _classCallCheck(this, BaseVisual);
24 |
25 | _this = _super.call(this, attrs);
26 | _this.theme = theme.visuals[_this.constructorName]; //如果当前对象设置了theme,不继承theme
27 |
28 | _this.theme.set = function (obj) {
29 | if (_this.theme === theme.visuals[_this.constructorName]) {
30 | _this.theme = filterClone(_this.theme);
31 | }
32 |
33 | _this.theme = deepObjectMerge({}, _this.theme, obj);
34 | };
35 |
36 | return _this;
37 | }
38 |
39 | return BaseVisual;
40 | }(Base);
41 |
42 | export { BaseVisual as default };
--------------------------------------------------------------------------------
/website/views/demo/PolarBar/group-polarBar.md:
--------------------------------------------------------------------------------
1 | ## Nightingale Group Chart 分组图
2 |
3 | :::demo
4 |
5 | ```javascript
6 | const data = [
7 | {
8 | product: "05-08",
9 | year: "图例一",
10 | sales: 3000,
11 | },
12 | {
13 | product: "05-08",
14 | year: "图例二",
15 | sales: 1000,
16 | },
17 | {
18 | product: "05-08",
19 | year: "图例三",
20 | sales: 2000,
21 | },
22 | {
23 | product: "05-09",
24 | year: "图例一",
25 | sales: 3000,
26 | },
27 | {
28 | product: "05-09",
29 | year: "图例二",
30 | sales: 1000,
31 | },
32 | {
33 | product: "05-09",
34 | year: "图例三",
35 | sales: 2000,
36 | },
37 |
38 | {
39 | product: "05-10",
40 | year: "图例一",
41 | sales: 1700,
42 | },
43 | {
44 | product: "05-10",
45 | year: "图例二",
46 | sales: 2400,
47 | },
48 | {
49 | product: "05-10",
50 | year: "图例三",
51 | sales: 3700,
52 | },
53 |
54 | {
55 | product: "05-11",
56 | year: "图例一",
57 | sales: 4200,
58 | },
59 | {
60 | product: "05-11",
61 | year: "图例二",
62 | sales: 2800,
63 | },
64 | {
65 | product: "05-11",
66 | year: "图例三",
67 | sales: 3100,
68 | },
69 |
70 | {
71 | product: "05-12",
72 | year: "图例一",
73 | sales: 5100,
74 | },
75 | {
76 | product: "05-12",
77 | year: "图例二",
78 | sales: 2500,
79 | },
80 | {
81 | product: "05-12",
82 | year: "图例三",
83 | sales: 350,
84 | },
85 | ]
86 | const { Chart, PolarBar, Tooltip, Legend } = qcharts
87 | const chart = new Chart({
88 | container: "#app",
89 | })
90 | chart.source(data, {
91 | row: "year",
92 | value: "sales",
93 | text: "product",
94 | })
95 | const bar = new PolarBar({
96 | innerRadius: 0.3,
97 | radius: 0.7,
98 | groupPadAngle: 30,
99 | })
100 | const legend = new Legend()
101 | const tooltip = new Tooltip()
102 |
103 | chart.append([bar, tooltip, legend])
104 | ```
105 |
106 | :::
107 |
--------------------------------------------------------------------------------
/docs/2.js:
--------------------------------------------------------------------------------
1 | (window.webpackJsonp_name_=window.webpackJsonp_name_||[]).push([[2],{66:function(t,i,p){"use strict";p.r(i),i.default=[{img:"https://p2.ssl.qhimg.com/d/inn/e48ee7ed2877/multipleXAxis.png",title:"双X轴折线图",path:"line-multipleXAxis"},{img:"https://p0.ssl.qhimg.com/t0144009aa56754cd60.png",title:"双Y轴折线图",path:"line-multipleYAxis"},{img:"https://p5.ssl.qhimg.com/t013417fb93fa37e2ea.png",title:"坐标轴间隔显示",path:"line-axisLine"},{img:"https://p2.ssl.qhimg.com/t01d660089a40290d6a.png",title:"折线结束点",path:"line-endPoint"},{img:"https://p4.ssl.qhimg.com/t010c7b316126d20d3d.png",title:"折线面积图",path:"area-lineArea"},{img:"https://p5.ssl.qhimg.com/d/inn/e48ee7ed2877/mixLineAndBar.png",title:"图表组合",path:"line-mixLineAndBar"},{img:"https://p0.ssl.qhimg.com/t01abca5ece564da66a.png",title:"隐藏坐标轴",path:"bar-noAxis"},{img:"https://p1.ssl.qhimg.com/t01a84f61bbda1ef444.png",title:"柱状图颜色渐变",path:"bar-gradualBar"},{img:"https://p4.ssl.qhimg.com/t01ecf1d8114c5aa86b.png",title:"切角柱状图",path:"bar-cutBar"},{img:"https://p1.ssl.qhimg.com/t0153188b21ef99f471.png",title:"无坐标散点图",path:"scatter-common"},{img:"https://p4.ssl.qhimg.com/t0168ac425d625cd18f.png",title:"散点图",path:"scatter-safe"},{img:"https://p4.ssl.qhimg.com/t011fd6cb1216213c93.png",title:"散点折线图",path:"scatter-line"},{img:"https://p5.ssl.qhimg.com/t0157877d6e2d30f7b9.png",title:"简洁雷达图",path:"radar-easy"},{img:"http://p2.qhimg.com/t01670ed67013eafe8b.png",title:"间距堆叠条形图",path:"bar-gapStackBar"},{img:"https://p1.ssl.qhimg.com/d/inn/67523310f062/gapStackBar2.png",title:"间距堆叠条形图2",path:"bar-gapStackBar2"},{img:"http://p9.qhimg.com/t0173ea1c4135741bf9.png",title:"纹理条形图",path:"bar-textureBar"},{img:"https://p2.ssl.qhimg.com/t016f1be9b3f280bb41.png",title:"自定义颜色极坐标柱状图",path:"polarBar-stackPolarBar"},{img:"https://p5.ssl.qhimg.com/t0111906506d1b724d5.png",title:"负值堆叠柱状图",path:"bar-negativeStackBar"},{img:"https://p0.ssl.qhimg.com/d/inn/df0b4188f12f/negativeStackBar2.png",title:"负值堆叠柱状图2",path:"bar-negativeStackBar2"},{img:"https://p3.ssl.qhimg.com/t012408ef8db6084cbd.png",title:"动态文字环图",path:"pie-donut"}]}}]);
2 | //# sourceMappingURL=2.js.map?v=d2f1c2b
--------------------------------------------------------------------------------
/website/views/demo/pie/link.md:
--------------------------------------------------------------------------------
1 | ## 图表联动
2 |
3 | :::demo
4 |
5 | ```javascript
6 | const data = [
7 | {
8 | type: '男性',
9 | value: 56.4
10 | },
11 | {
12 | type: '女性',
13 | value: 43.6
14 | }
15 | ]
16 |
17 | const { Chart, Tooltip, InteractionHooks } = qcharts
18 |
19 | const chart1 = new Chart({
20 | container: '#app',
21 | size: ['50%', '100%']
22 | })
23 |
24 | chart1.setTitle('短视频用户性别分布')
25 |
26 | const pie1 = new qcharts.Pie({
27 | radius: 0.7,
28 | innerRadius: 0.2
29 | })
30 | .source(data)
31 | .setDataFields({ x: 'type', y: 'value' })
32 | .style('sector', (attrs, data, i) => {
33 | return data.type === '男性'
34 | ? { fillColor: '#0a9afe' }
35 | : { fillColor: '#eceef1' }
36 | })
37 | .style('text', (attrs, data, i) => data.type === '男性')
38 |
39 | chart1
40 | .add(pie1)
41 | .add(
42 | new Tooltip({ lineHight: 22 }).formatter(
43 | data => `访问来源:\n${data.type}: ${data.value}%`
44 | )
45 | )
46 |
47 | const chart2 = new Chart({
48 | container: '#app',
49 | pos: ['50%', 0],
50 | size: ['50%', '100%']
51 | })
52 |
53 | const pie2 = new qcharts.Pie({
54 | radius: 0.7,
55 | innerRadius: 0.2
56 | })
57 | .source(data.reverse())
58 | .setDataFields({ x: 'type', y: 'value' })
59 | .style('sector', (attrs, data, i) => {
60 | return data.type === '女性'
61 | ? { fillColor: '#f0657d' }
62 | : { fillColor: '#eceef1' }
63 | })
64 | .style('text', (attrs, data, i) => data.type === '女性')
65 |
66 | chart2
67 | .add(pie2)
68 | .add(
69 | new Tooltip({ lineHight: 14 }).formatter(
70 | data => `访问来源:\n${data.type}: ${data.value}%`
71 | )
72 | )
73 |
74 | chart1.on(InteractionHooks.showTooltip, e => {
75 | chart2.emit(InteractionHooks.showTooltip, {
76 | offsetX: e.offsetX + 200,
77 | offsetY: e.offsetY + 90,
78 | data: data[e.index]
79 | })
80 | })
81 |
82 | chart1.on(InteractionHooks.hideTooltip, e => {
83 | chart2.emit(InteractionHooks.hideTooltip)
84 | })
85 |
86 | chart1.render()
87 | chart2.render()
88 | ```
89 |
90 | :::
91 |
--------------------------------------------------------------------------------
/website/views/doc/api/line-api.md:
--------------------------------------------------------------------------------
1 | ### 图表介绍
2 |
3 | Line Chart, 折线图。
4 |
5 | ### 属性 attrs
6 |
7 | 通过设置 Line 的属性来产生不同的样式,包含若干属性
8 |
9 | | 属性名 | 类型 | 默认值 | 描述 |
10 | | ----------- | ------- | ------------------------------------ | --------------------------------------------------------------------------------- |
11 | | clientRect | Object | {top,right,bottom,left,width,height} | 设置了 width,heigh,优先与 bottom,right |
12 | | smooth | Boolean | false | 曲线是否平滑 |
13 | | axisGap | Boolean | false | 开始绘图区域与坐标轴是否有间隙 |
14 | | splitNumber | Number | 0 | 坐标轴的分割段数,用来计算线的最大高度,在设置坐标轴的 splitNumber 属性时同步加上 |
15 |
16 | ### style 属性
17 |
18 | ```javascript
19 | const line = new Line({ smooth: true })
20 | line.style('point', { pointType: 'star', size: 8 })
21 | ```
22 |
23 | 组件中可以自定义 css 属性的元素如下表:
24 |
25 | | 名称 | 基础类型 | 描述 |
26 | | ----------- | ---------------------------------------------------------------------------------------------------------------------- | ------------------------ |
27 | | guideline | 线 | 指导线样式 |
28 | | line | 线 | 线条样式 |
29 | | point | 面,除了基础面的全部属性外,还有(Point)的特殊属性 | 线条上标记点样式 |
30 | | point:hover | 面,除了基础面的全部属性外,还有(Point)的特殊属性 | hover 时线条上标记点样式 |
31 |
--------------------------------------------------------------------------------
/lib/visuals/Area/index.js:
--------------------------------------------------------------------------------
1 | import _classCallCheck from "@babel/runtime/helpers/classCallCheck";
2 | import _createClass from "@babel/runtime/helpers/createClass";
3 | import _get from "@babel/runtime/helpers/get";
4 | import _inherits from "@babel/runtime/helpers/inherits";
5 | import _possibleConstructorReturn from "@babel/runtime/helpers/possibleConstructorReturn";
6 | import _getPrototypeOf from "@babel/runtime/helpers/getPrototypeOf";
7 |
8 | function _createSuper(Derived) { var hasNativeReflectConstruct = _isNativeReflectConstruct(); return function _createSuperInternal() { var Super = _getPrototypeOf(Derived), result; if (hasNativeReflectConstruct) { var NewTarget = _getPrototypeOf(this).constructor; result = Reflect.construct(Super, arguments, NewTarget); } else { result = Super.apply(this, arguments); } return _possibleConstructorReturn(this, result); }; }
9 |
10 | function _isNativeReflectConstruct() { if (typeof Reflect === "undefined" || !Reflect.construct) return false; if (Reflect.construct.sham) return false; if (typeof Proxy === "function") return true; try { Boolean.prototype.valueOf.call(Reflect.construct(Boolean, [], function () {})); return true; } catch (e) { return false; } }
11 |
12 | import Line from '../Line';
13 | import { deepObjectMerge } from '@qcharts/utils';
14 |
15 | var Area = /*#__PURE__*/function (_Line) {
16 | _inherits(Area, _Line);
17 |
18 | var _super = _createSuper(Area);
19 |
20 | function Area(attrs) {
21 | var _this;
22 |
23 | _classCallCheck(this, Area);
24 |
25 | _this = _super.call(this, attrs);
26 | _this.type = 'area';
27 | return _this;
28 | }
29 |
30 | _createClass(Area, [{
31 | key: "defaultAttrs",
32 | value: function defaultAttrs() {
33 | return deepObjectMerge({}, _get(_getPrototypeOf(Area.prototype), "defaultAttrs", this).call(this), {
34 | stack: true,
35 | animation: {
36 | duration: 700,
37 | easing: 'bounceOut'
38 | },
39 | layer: 'area'
40 | });
41 | }
42 | }]);
43 |
44 | return Area;
45 | }(Line);
46 |
47 | export default Area;
--------------------------------------------------------------------------------
/website/views/demo/Area/area-others.md:
--------------------------------------------------------------------------------
1 | ## 其它面积图
2 |
3 | #### Data update 数据更新面积图
4 |
5 | :::demo
6 |
7 | ```javascript
8 | const data = [
9 | { product: '茶叶', year: '2016', sales: 81.2 },
10 | { product: '茶叶', year: '2017', sales: 121.2 },
11 | { product: '茶叶', year: '2018', sales: 41.2 },
12 | { product: '牛奶', year: '2016', sales: 89.2 },
13 | { product: '牛奶', year: '2017', sales: 50.6 },
14 | { product: '牛奶', year: '2018', sales: 80.2 },
15 | { product: '咖啡', year: '2016', sales: 35.2 },
16 | { product: '咖啡', year: '2017', sales: 79.6 },
17 | { product: '咖啡', year: '2018', sales: 61.2 },
18 | { product: '椰汁', year: '2016', sales: 55.2 },
19 | { product: '椰汁', year: '2017', sales: 69.6 },
20 | { product: '椰汁', year: '2018', sales: 21.2 }
21 | ]
22 |
23 | const newData = [
24 | { product: '茶叶', year: '2016', sales: 181.2 },
25 | { product: '茶叶', year: '2017', sales: 51.2 },
26 | { product: '茶叶', year: '2018', sales: 31.2 },
27 | { product: '牛奶', year: '2016', sales: 59.2 },
28 | { product: '牛奶', year: '2017', sales: 179.6 },
29 | { product: '牛奶', year: '2018', sales: 130.2 },
30 | { product: '咖啡', year: '2016', sales: 135.2 },
31 | { product: '咖啡', year: '2017', sales: 69.6 },
32 | { product: '咖啡', year: '2018', sales: 91.2 },
33 | { product: '椰汁', year: '2016', sales: 85.2 },
34 | { product: '椰汁', year: '2017', sales: 59.6 },
35 | { product: '椰汁', year: '2018', sales: 31.2 }
36 | ]
37 |
38 | const { Chart, Area, Axis, Legend } = qcharts
39 | const chart = new Chart({
40 | container: '#app'
41 | })
42 | chart.source(data, {
43 | row: 'year',
44 | value: 'sales',
45 | text: 'product'
46 | })
47 | const area = new Area({ smooth: true })
48 | const axisBottom = new Axis().style('grid', false)
49 | const axisLeft = new Axis({ orient: 'left' }).style('axis', false).style('scale', false)
50 | const legend = new Legend()
51 | chart.append([area, axisBottom, axisLeft, legend])
52 |
53 | setTimeout(() => {
54 | chart.source(newData, {
55 | row: 'year',
56 | value: 'sales',
57 | text: 'product'
58 | })
59 | }, 2000)
60 | ```
61 |
62 | :::
63 |
--------------------------------------------------------------------------------
/website/views/demo/Bar/group-bar.md:
--------------------------------------------------------------------------------
1 | ## Group Bar Chart 分组条形图
2 |
3 | :::demo
4 |
5 | ```javascript
6 | const data = [
7 | {
8 | product: '05-12',
9 | year: '图例一',
10 | sales: 3000
11 | },
12 | {
13 | product: '05-12',
14 | year: '图例二',
15 | sales: 3500
16 | },
17 | {
18 | product: '05-12',
19 | year: '图例三',
20 | sales: 2000
21 | },
22 | {
23 | product: '05-13',
24 | year: '图例一',
25 | sales: 5800
26 | },
27 | {
28 | product: '05-13',
29 | year: '图例二',
30 | sales: 4200
31 | },
32 | {
33 | product: '05-13',
34 | year: '图例三',
35 | sales: 2700
36 | },
37 | {
38 | product: '05-14',
39 | year: '图例一',
40 | sales: 2600
41 | },
42 | {
43 | product: '05-14',
44 | year: '图例二',
45 | sales: 1800
46 | },
47 | {
48 | product: '05-14',
49 | year: '图例三',
50 | sales: 3800
51 | },
52 | {
53 | product: '05-15',
54 | year: '图例一',
55 | sales: 3400
56 | },
57 | {
58 | product: '05-15',
59 | year: '图例二',
60 | sales: 5100
61 | },
62 | {
63 | product: '05-15',
64 | year: '图例三',
65 | sales: 4300
66 | },
67 | {
68 | product: '05-16',
69 | year: '图例一',
70 | sales: 3100
71 | },
72 | {
73 | product: '05-16',
74 | year: '图例二',
75 | sales: 3400
76 | },
77 | {
78 | product: '05-16',
79 | year: '图例三',
80 | sales: 2100
81 | }
82 | ]
83 | const { Chart, Bar, Tooltip, Axis, Legend } = qcharts
84 | const chart = new Chart({
85 | container: '#app'
86 | })
87 | chart.source(data, {
88 | row: 'year',
89 | value: 'sales',
90 | text: 'product'
91 | })
92 | const bar = new Bar({
93 | transpose: true,
94 | barWidth: 12
95 | })
96 | const tooltip = new Tooltip()
97 | const legend = new Legend()
98 | const axisBottom = new Axis().style('scale', false)
99 | const axisLeft = new Axis({
100 | orient: 'left'
101 | }).style('grid', false)
102 | chart.append([bar, tooltip, axisBottom, axisLeft, legend])
103 | ```
104 |
--------------------------------------------------------------------------------
/docs/63.js:
--------------------------------------------------------------------------------
1 | (window.webpackJsonp_name_=window.webpackJsonp_name_||[]).push([[63],{238:function(t,_,v){"use strict";v.r(_);var render=function(){var t=this.$createElement;this._self._c;return this._m(0)};render._withStripped=!0;var e={components:{}},s=v(2),r=Object(s.a)(e,render,[function(){var t=this,_=t.$createElement,v=t._self._c||_;return v("section",[v("h3",[t._v("插件介绍")]),t._v(" "),v("p",[t._v("Tooltip, 提示框。")]),t._v(" "),v("h3",[t._v("attrs")]),t._v(" "),v("table",[v("thead",[v("tr",[v("th",[t._v("属性名")]),t._v(" "),v("th",[t._v("类型")]),t._v(" "),v("th",[t._v("默认值")]),t._v(" "),v("th",[t._v("描述")])])]),t._v(" "),v("tbody",[v("tr",[v("td",[t._v("title")]),t._v(" "),v("td",[t._v("String | Function")]),t._v(" "),v("td",[v("code",{pre:!0},[t._v("null")])]),t._v(" "),v("td",[t._v("标题")])]),t._v(" "),v("tr",[v("td",[t._v("formatter")]),t._v(" "),v("td",[t._v("Function")]),t._v(" "),v("td",[v("code",{pre:!0},[t._v("d => d")])]),t._v(" "),v("td",[t._v("除标题外,其他文本格式化函数")])])])]),t._v(" "),v("h3",[t._v("style")]),t._v(" "),v("pre",{pre:!0},[v("code",{pre:!0,attrs:{"v-pre":"",class:"language-javascript"}},[v("span",{pre:!0,attrs:{class:"hljs-keyword"}},[t._v("const")]),t._v(" tooltip = "),v("span",{pre:!0,attrs:{class:"hljs-keyword"}},[t._v("new")]),t._v(" Tooltip()\ntooltip.style("),v("span",{pre:!0,attrs:{class:"hljs-string"}},[t._v("'text'")]),t._v(", { "),v("span",{pre:!0,attrs:{class:"hljs-attr"}},[t._v("color")]),t._v(": "),v("span",{pre:!0,attrs:{class:"hljs-string"}},[t._v("'#fff'")]),t._v(" }\n")])]),t._v(" "),v("p",[t._v("组件中可以自定义 css 属性的元素如下表:")]),t._v(" "),v("table",[v("thead",[v("tr",[v("th",[t._v("名称")]),t._v(" "),v("th",[t._v("基础类型")]),t._v(" "),v("th",[t._v("描述")])])]),t._v(" "),v("tbody",[v("tr",[v("td",[t._v("title")]),t._v(" "),v("td",[t._v("文本")]),t._v(" "),v("td",[t._v("html 文本样式")])]),t._v(" "),v("tr",[v("td",[t._v("point")]),t._v(" "),v("td",[t._v("html 容器")]),t._v(" "),v("td",[t._v("html 容器样式")])]),t._v(" "),v("tr",[v("td",[t._v("text")]),t._v(" "),v("td",[t._v("文本")]),t._v(" "),v("td",[t._v("html 文本样式")])])])])])}],!1,null,null,null);r.options.__file="website/views/doc/plugins/Tooltip.md";_.default=r.exports}}]);
2 | //# sourceMappingURL=63.js.map?v=d2f1c2b
--------------------------------------------------------------------------------
/website/views/demo/Bar/stack-bar.md:
--------------------------------------------------------------------------------
1 | ## Stack Bar Chart 堆叠条形图
2 |
3 | :::demo
4 |
5 | ```javascript
6 | const data = [
7 | {
8 | data: '05-12',
9 | type: '图例一',
10 | value: 11
11 | },
12 | {
13 | data: '05-12',
14 | type: '图例二',
15 | value: 12.2
16 | },
17 | {
18 | data: '05-13',
19 | type: '图例一',
20 | value: 28
21 | },
22 | {
23 | data: '05-13',
24 | type: '图例二',
25 | value: 31
26 | },
27 | {
28 | data: '05-14',
29 | type: '图例一',
30 | value: 36
31 | },
32 | {
33 | data: '05-14',
34 | type: '图例二',
35 | value: 18
36 | },
37 | {
38 | data: '05-15',
39 | type: '图例一',
40 | value: 58
41 | },
42 | {
43 | data: '05-15',
44 | type: '图例二',
45 | value: 30.2
46 | },
47 | {
48 | data: '05-16',
49 | type: '图例一',
50 | value: 86.2
51 | },
52 | {
53 | data: '05-16',
54 | type: '图例二',
55 | value: 41.2
56 | },
57 | {
58 | data: '05-17',
59 | type: '图例一',
60 | value: 71.2
61 | },
62 | {
63 | data: '05-17',
64 | type: '图例二',
65 | value: 45.2
66 | },
67 | {
68 | data: '05-18',
69 | type: '图例一',
70 | value: 41.2
71 | },
72 | {
73 | data: '05-18',
74 | type: '图例二',
75 | value: 22.2
76 | },
77 | {
78 | data: '05-19',
79 | type: '图例一',
80 | value: 16.2
81 | },
82 | {
83 | data: '05-19',
84 | type: '图例二',
85 | value: 20.2
86 | }
87 | ]
88 | const { Chart, Bar, Tooltip, Axis, Legend } = qcharts
89 | const chart = new Chart({
90 | container: '#app'
91 | })
92 | chart.source(data, {
93 | row: 'type',
94 | value: 'value',
95 | text: 'data'
96 | })
97 | const bar = new Bar({
98 | stack: true,
99 | transpose: true,
100 | barWidth: 20
101 | })
102 | const tooltip = new Tooltip()
103 | const legend = new Legend()
104 | const axisBottom = new Axis().style('scale', false)
105 | const axisLeft = new Axis({
106 | orient: 'left'
107 | }).style('grid', false)
108 | chart.append([bar, tooltip, axisBottom, axisLeft, legend])
109 | ```
110 |
111 | :::
112 |
--------------------------------------------------------------------------------
/website/views/demo/Column/stack-column.md:
--------------------------------------------------------------------------------
1 | ## Stack Column Chart 堆叠柱状图
2 |
3 | :::demo
4 |
5 | ```javascript
6 | const data = [
7 | {
8 | data: "05-01",
9 | type: "图例一",
10 | value: 11,
11 | },
12 | {
13 | data: "05-01",
14 | type: "图例二",
15 | value: 12.2,
16 | },
17 | {
18 | data: "05-02",
19 | type: "图例一",
20 | value: 28,
21 | },
22 | {
23 | data: "05-02",
24 | type: "图例二",
25 | value: 31,
26 | },
27 | {
28 | data: "05-03",
29 | type: "图例一",
30 | value: 36,
31 | },
32 | {
33 | data: "05-03",
34 | type: "图例二",
35 | value: 18,
36 | },
37 | {
38 | data: "05-04",
39 | type: "图例一",
40 | value: 58,
41 | },
42 | {
43 | data: "05-04",
44 | type: "图例二",
45 | value: 30.2,
46 | },
47 | {
48 | data: "05-05",
49 | type: "图例一",
50 | value: 86.2,
51 | },
52 | {
53 | data: "05-05",
54 | type: "图例二",
55 | value: 41.2,
56 | },
57 | {
58 | data: "05-06",
59 | type: "图例一",
60 | value: 71.2,
61 | },
62 | {
63 | data: "05-06",
64 | type: "图例二",
65 | value: 45.2,
66 | },
67 | {
68 | data: "05-07",
69 | type: "图例一",
70 | value: 41.2,
71 | },
72 | {
73 | data: "05-07",
74 | type: "图例二",
75 | value: 22.2,
76 | },
77 | {
78 | data: "05-08",
79 | type: "图例一",
80 | value: 16.2,
81 | },
82 | {
83 | data: "05-08",
84 | type: "图例二",
85 | value: 20.2,
86 | },
87 | ]
88 | const { Chart, Bar, Tooltip, Axis, Legend } = qcharts
89 | const chart = new Chart({
90 | container: "#app",
91 | })
92 | chart.source(data, {
93 | row: "type",
94 | value: "value",
95 | text: "data",
96 | })
97 | const colors = ["#F00", "#FF0", "#0FF"]
98 | const bar = new Bar({
99 | stack: true,
100 | })
101 | const legend = new Legend()
102 | const tooltip = new Tooltip()
103 | const axisBottom = new Axis().style("grid", false)
104 | const axisLeft = new Axis({ orient: "left" })
105 | .style("axis", false)
106 | .style("scale", false)
107 | chart.append([bar, tooltip, axisBottom, axisLeft, legend])
108 | ```
109 |
110 | :::
111 |
--------------------------------------------------------------------------------
/website/views/more/polarBar/stackPolarBar.md:
--------------------------------------------------------------------------------
1 | ## 自定义颜色极坐标柱状图
2 |
3 | :::demo
4 |
5 | ```javascript
6 | const data = [
7 | {
8 | product: '05-08',
9 | year: '图例一',
10 | sales: 5
11 | },
12 | {
13 | product: '05-08',
14 | year: '图例二',
15 | sales: 15
16 | },
17 |
18 | {
19 | product: '05-09',
20 | year: '图例一',
21 | sales: 10
22 | },
23 | {
24 | product: '05-09',
25 | year: '图例二',
26 | sales: 25
27 | },
28 |
29 | {
30 | product: '05-10',
31 | year: '图例一',
32 | sales: 20
33 | },
34 | {
35 | product: '05-10',
36 | year: '图例二',
37 | sales: 30
38 | },
39 | {
40 | product: '05-11',
41 | year: '图例一',
42 | sales: 30
43 | },
44 | {
45 | product: '05-11',
46 | year: '图例二',
47 | sales: 30
48 | },
49 | {
50 | product: '05-12',
51 | year: '图例一',
52 | sales: 35
53 | },
54 | {
55 | product: '05-12',
56 | year: '图例二',
57 | sales: 35
58 | }
59 | ]
60 | const { Chart, PolarBar, Tooltip, Axis, Legend } = qcharts
61 | const chart = new Chart({
62 | container: '#app'
63 | })
64 | chart.source(data, {
65 | row: 'year',
66 | value: 'sales',
67 | text: 'product'
68 | })
69 | const colors = ['#FF0000', '#F28F0F', '#FFFF00', '#00FF00', '#44256F']
70 | const bar = new PolarBar({
71 | stack: true,
72 | radius: 0.7,
73 | innerRadius: 0.2
74 | }).style('pillar', (attr, data, i) => {
75 | if (i % 2 !== 0) {
76 | return { strokeColor: '#fff', lineWidth: 1, fillColor: '#226464' }
77 | } else {
78 | return {
79 | strokeColor: '#fff',
80 | lineWidth: 1,
81 | fillColor: colors[Math.floor(i / 2)]
82 | }
83 | }
84 | })
85 | const tooltip = new Tooltip({
86 | formatter: (d) => `${d.product} - ${d.year} - ${d.sales}`
87 | }).style('icon', (attr, data, i) => {
88 | if (i % 2 !== 0) {
89 | return { strokeColor: '#fff', lineWidth: 1, fillColor: '#226464' }
90 | } else {
91 | return {
92 | strokeColor: '#fff',
93 | lineWidth: 1,
94 | fillColor: colors[Math.floor(i / 2)]
95 | }
96 | }
97 | })
98 | chart.append([bar, tooltip])
99 | ```
100 |
101 | :::
102 |
--------------------------------------------------------------------------------
/website/views/more/line/axisLine.md:
--------------------------------------------------------------------------------
1 | ## 折线图与柱状图组合
2 |
3 | :::demo
4 |
5 | ```javascript
6 | const data = [
7 | { date: '1月', category: '降水量', val: 15.2 },
8 | { date: '2月', category: '降水量', val: 19.2 },
9 | { date: '3月', category: '降水量', val: 11.2 },
10 | { date: '4月', category: '降水量', val: 45.2 },
11 | { date: '5月', category: '降水量', val: 55.2 },
12 | { date: '6月', category: '降水量', val: 75.2 },
13 | { date: '7月', category: '降水量', val: 95.2 },
14 | { date: '8月', category: '降水量', val: 135.2 },
15 | { date: '9月', category: '降水量', val: 162.2 },
16 | { date: '10月', category: '降水量', val: 32.2 },
17 | { date: '11月', category: '降水量', val: 32.2 },
18 | { date: '12月', category: '降水量', val: 15.2 },
19 | { date: '1月', category: '气温', val: 2.2 },
20 | { date: '2月', category: '气温', val: 3.2 },
21 | { date: '3月', category: '气温', val: 5.2 },
22 | { date: '4月', category: '气温', val: 6.2 },
23 | { date: '5月', category: '气温', val: 8.2 },
24 | { date: '6月', category: '气温', val: 15.2 },
25 | { date: '7月', category: '气温', val: 25.2 },
26 | { date: '8月', category: '气温', val: 23.2 },
27 | { date: '9月', category: '气温', val: 24.2 },
28 | { date: '10月', category: '气温', val: 16.2 },
29 | { date: '11月', category: '气温', val: 12.2 },
30 | { date: '12月', category: '气温', val: 6.6 }
31 | ]
32 |
33 | const { Chart, Line, Bar, Legend, Axis } = qcharts
34 |
35 | const chart = new Chart({
36 | container: '#app'
37 | })
38 |
39 | chart.source(data, {
40 | row: 'category',
41 | value: 'val',
42 | text: 'date'
43 | })
44 |
45 | const line = new Line()
46 |
47 | const axisLeft = new Axis({
48 | orient: 'left',
49 | formatter: val => {
50 | return `${val} ml`
51 | }
52 | })
53 | .style('axis', false)
54 | .style('scale', false)
55 | .style('grid', { lineDash: [3, 3] })
56 |
57 | const axisBottom = new Axis()
58 | .style('scale', hideAxis)
59 | .style('label', hideAxis)
60 | .style('grid', false)
61 |
62 | function hideAxis(attrs, data, i) {
63 | if (i % 2 !== 0) {
64 | return false
65 | }
66 | }
67 | const legend = new Legend({ align: ['center', 'bottom'] }).style('icon', { borderRadius: 10 }).style('text', { fontSize: 12 })
68 |
69 | chart.append([line, axisBottom, axisLeft, legend])
70 | ```
71 |
72 | :::
73 |
--------------------------------------------------------------------------------
/website/views/demo/pie/rose.md:
--------------------------------------------------------------------------------
1 | ## Nightingle Rose Chart 南丁格尔玫瑰图
2 |
3 | :::demo
4 |
5 | ```javascript
6 | const data = [
7 | { value: 335, name: '直接访问' },
8 | { value: 310, name: '邮件营销' },
9 | { value: 280, name: '联盟广告' },
10 | { value: 254, name: '视频广告' },
11 | { value: 200, name: '搜索引擎' }
12 | ]
13 | const { Chart, Pie, Tooltip, Legend } = qcharts
14 |
15 | const chart = new Chart({ container: '#app' })
16 |
17 | chart.source(data, {
18 | row: 'name',
19 | value: 'value'
20 | })
21 |
22 | const pie = new Pie({
23 | radius: 0.7,
24 | pos: [0, 0],
25 | size: ['80%', '100%'],
26 | rose: true
27 | })
28 | pie.style('guideline', true)
29 | pie.style('guideText', { fontSize: '12px' })
30 |
31 | const legend = new Legend({ orient: 'vertical', align: ['right', 'center'] })
32 | legend.style('icon', (attrs, d, i) => ({
33 | borderRadius: 10,
34 | marginTop: i > 0 ? 15 : 0
35 | }))
36 | legend.style('text', (attrs, d, i) => ({
37 | marginTop: i > 0 ? 15 : 0
38 | }))
39 |
40 | chart.append(pie)
41 | chart.append(legend)
42 | ```
43 |
44 | :::
45 |
46 | ### 设定角度
47 |
48 | :::demo
49 |
50 | ```javascript
51 | const data = [
52 | { value: 335, name: '直接访问' },
53 | { value: 310, name: '邮件营销' },
54 | { value: 280, name: '联盟广告' },
55 | { value: 254, name: '视频广告' },
56 | { value: 200, name: '搜索引擎' }
57 | ]
58 | const { Chart, Pie, Axis, Tooltip, Legend } = qcharts
59 |
60 | const chart = new Chart({ container: '#app' })
61 |
62 | chart.source(data, {
63 | row: 'name',
64 | value: 'value'
65 | })
66 |
67 | const pie = new Pie({
68 | size: [360, 360],
69 | radius: 1,
70 | rose: true,
71 | startAngle: Math.PI * 1,
72 | endAngle: Math.PI * 1.5
73 | })
74 | pie.style('text', true)
75 |
76 | const legend = new Legend({ orient: 'vertical', align: ['right', 'center'] })
77 | legend.style('icon', (attrs, d, i) => ({
78 | borderRadius: 10,
79 | marginTop: i > 0 ? 15 : 0
80 | }))
81 | legend.style('text', (attrs, d, i) => ({
82 | marginTop: i > 0 ? 15 : 0
83 | }))
84 |
85 | const axisBottom = new Axis()
86 | const axisLeft = new Axis({
87 | orient: 'right',
88 | grid: true,
89 | coord: 'polar',
90 | coordPos: ['100%', '100%']
91 | })
92 |
93 | chart.append(pie)
94 | chart.append([legend, axisBottom, axisLeft])
95 | ```
96 |
97 | :::
98 |
--------------------------------------------------------------------------------
/website/views/demo/scatter/scatter_update.md:
--------------------------------------------------------------------------------
1 | ## 散点图数据更新
2 |
3 | :::demo
4 |
5 | ```javascript
6 | const data = [
7 | {
8 | gender: 'female',
9 | height: 167.6,
10 | weight: 68.8,
11 | },
12 | {
13 | gender: 'female',
14 | height: 159.5,
15 | weight: 50.6,
16 | },
17 | {
18 | gender: 'female',
19 | height: 175,
20 | weight: 82.5,
21 | },
22 | {
23 | gender: 'female',
24 | height: 166.8,
25 | weight: 57.2,
26 | },
27 | {
28 | gender: 'male',
29 | height: 181.6,
30 | weight: 75.5,
31 | },
32 | {
33 | gender: 'male',
34 | height: 176.5,
35 | weight: 73,
36 | },
37 | {
38 | gender: 'male',
39 | height: 175,
40 | weight: 70.2,
41 | },
42 | {
43 | gender: 'male',
44 | height: 174,
45 | weight: 73.4,
46 | },
47 | ]
48 |
49 | const data2 = [
50 | {
51 | gender: 'female',
52 | height: 155.8,
53 | weight: 53.6,
54 | },
55 | {
56 | gender: 'female',
57 | height: 170,
58 | weight: 59,
59 | },
60 | {
61 | gender: 'female',
62 | height: 159.1,
63 | weight: 47.6,
64 | },
65 |
66 | {
67 | gender: 'male',
68 | height: 177.8,
69 | weight: 64.1,
70 | },
71 | {
72 | gender: 'male',
73 | height: 180.3,
74 | weight: 83.2,
75 | },
76 | {
77 | gender: 'male',
78 | height: 160.3,
79 | weight: 83.2,
80 | },
81 | ]
82 |
83 | const { Chart, Axis, Scatter, Legend, Tooltip } = qcharts
84 |
85 | const chart = new Chart({
86 | container: '#app',
87 | })
88 | chart.source(data, {
89 | row: 'gender',
90 | text: 'height',
91 | value: 'weight',
92 | })
93 |
94 | const scatter = new Scatter({
95 | showGuideLine: true,
96 | })
97 |
98 | const axisBottom = new Axis()
99 |
100 | const axisLeft = new Axis({ orient: 'left' })
101 |
102 | const legend = new Legend({ align: ['center', 'bottom'] })
103 |
104 | chart.append([axisBottom, axisLeft, legend, scatter])
105 |
106 | let count = 1
107 | const inter = setInterval(() => {
108 | if (count%2 ===0) {
109 | chart.source(data2)
110 | } else {
111 | chart.source(data)
112 | }
113 | count+=1
114 | }, 5000)
115 |
116 | ```
117 |
118 | :::
119 |
--------------------------------------------------------------------------------
/website/views/plugin/legend/personalise.md:
--------------------------------------------------------------------------------
1 | ## 自定义
2 |
3 | 如果提供的 `Legend` 无法满足个性化需求。可以通过监听 `chart` 上的 `InteractionHooks` 来完成自定义。
4 |
5 | ```javascript
6 | const { Chart, InteractionHooks } = qcharts
7 |
8 | chart.on(InteractionHooks.renderLegend, createLegend)
9 | chart.emit(InteractionHooks.toggleLegend, data)
10 | ```
11 |
12 | :::demo
13 |
14 | ```javascript
15 | const data = [
16 | { value: 3350, label: '直接访问' },
17 | { value: 3100, label: '邮件营销' },
18 | { value: 2340, label: '联盟广告' },
19 | { value: 1350, label: '视频广告' },
20 | { value: 1548, label: '搜索引擎' }
21 | ]
22 |
23 | const { Chart, InteractionHooks } = qcharts
24 |
25 | const chart = new Chart({ container: '#app' })
26 |
27 | const pie = new qcharts.Pie({
28 | radius: 0.6,
29 | innerRadius: 0.2
30 | })
31 | .source(data)
32 | .setDataFields({ x: 'label', y: 'value' })
33 |
34 | const oApp = document.querySelector('#app')
35 | const total = data.reduce((a, c) => (a += c.value), 0)
36 | const legends = []
37 |
38 | const createLegend = (data) => {
39 | if (legends[data.index]) {
40 | // 已经创建
41 | return
42 | }
43 |
44 | const oDiv = document.createElement('div')
45 |
46 | oDiv.style = `
47 | position: relative;
48 | z-index: 1000;
49 | `
50 |
51 | const setInnerHTML = (data) => {
52 | const color1 = data.disabled ? '#ccc' : '#333'
53 | const color2 = data.disabled ? '#ccc' : data.color
54 |
55 | oDiv.innerHTML = `
56 |
57 | ${data.index}
58 |
59 | ${data.label}
60 |
61 | ${((data.value / total) * 100).toFixed(2)}%
62 |
63 | ${data.value}
64 | `
65 | }
66 |
67 | setInnerHTML(data)
68 |
69 | oDiv.addEventListener('click', () => {
70 | data.disabled = !data.disabled
71 | setInnerHTML(data)
72 | // 发射交互钩子
73 | chart.emit(InteractionHooks.toggleLegend, data)
74 | })
75 |
76 | legends[data.index] = oDiv
77 |
78 | oApp.appendChild(oDiv)
79 | }
80 |
81 | // 监听交互钩子
82 | chart.on(InteractionHooks.renderLegend, createLegend)
83 |
84 | chart.append(pie)
85 | ```
86 |
87 | :::
88 |
--------------------------------------------------------------------------------
/website/views/demo/Bar/update-bar.md:
--------------------------------------------------------------------------------
1 | ## 数据更新
2 |
3 | :::demo1
4 |
5 | ```javascript
6 | const data0 = [
7 | { value: 542.64, label: '腾讯' },
8 | { value: 363.89, label: '百度' },
9 | { value: 56.06, label: '网易' },
10 | { value: 33.66, label: '新浪' },
11 | { value: 32.11, label: '360' },
12 | { value: 31.88, label: '新东方' },
13 | { value: 30.37, label: '携程' },
14 | { value: 18.27, label: '搜狐' },
15 | { value: 17.97, label: '搜房网' }
16 | ]
17 | const data1 = [
18 | { value: 642.64, label: '腾讯' },
19 | { value: 463.89, label: '百度' },
20 | { value: 156.06, label: '网易' },
21 | { value: 100.66, label: '新浪' },
22 | { value: 132.11, label: '360' },
23 | { value: 88.88, label: '新东方' },
24 | { value: 70.37, label: '携程' },
25 | { value: 68.27, label: '搜狐' },
26 | { value: 27.97, label: '搜房网' }
27 | ]
28 | const data2 = [
29 | { value: 1042.64, label: '腾讯' },
30 | { value: 863.89, label: '百度' },
31 | { value: 456.06, label: '网易' },
32 | { value: 333.66, label: '新浪' },
33 | { value: 232.11, label: '360' },
34 | { value: 231.88, label: '新东方' },
35 | { value: 130.37, label: '携程' },
36 | { value: 118.27, label: '搜狐' },
37 | { value: 37.97, label: '搜房网' }
38 | ]
39 |
40 | let bool = true
41 | const { Chart, Bar, Tooltip, Axis, Legend } = qcharts
42 | const chart = new Chart({
43 | container: '#app'
44 | })
45 | chart.source(data0, {
46 | row: '*',
47 | value: 'value',
48 | text: 'label'
49 | })
50 | const bar = new Bar({
51 | pos: ['20%', '10%'],
52 | size: ['70%', '80%'],
53 | transpose: true,
54 | barWidth: 18
55 | })
56 | // bar.style('pillar', { fillColor: '#47A1FF' })
57 | const tooltip = new Tooltip({
58 | formatter: (d) => `${d.label}: ${d.value}`
59 | })
60 | const legend = new Legend({ align: ['center', 'bottom'] }).style('text', {
61 | text: '图例一'
62 | })
63 | const axisBottom = new Axis().style('scale', false).style('grid', true)
64 | const axisLeft = new Axis({
65 | orient: 'left'
66 | }).style('grid', false)
67 | chart.append([bar, tooltip, legend, axisBottom, axisLeft])
68 |
69 | // setTimeout(changeData, 3000)
70 | let i = 1
71 | let str = 'data'
72 | function changeData() {
73 | let dataStr = str + (i % 3)
74 | chart.source(window[dataStr], {
75 | row: '*',
76 | value: 'value',
77 | text: 'label'
78 | })
79 | i++
80 | setTimeout(changeData, 5000)
81 | }
82 | ```
83 |
84 | :::
85 |
--------------------------------------------------------------------------------
/website/views/demo/Bar/column-line.md:
--------------------------------------------------------------------------------
1 | ## Bar-line Chart 柱状折线图
2 |
3 | :::demo
4 |
5 | ```javascript
6 | var data = [
7 | {
8 | name: 'London',
9 | 月份: 'Jan',
10 | 月均降雨量: 18.9
11 | },
12 | {
13 | name: 'London',
14 | 月份: 'Feb',
15 | 月均降雨量: 28.8
16 | },
17 | {
18 | name: 'London',
19 | 月份: 'Mar',
20 | 月均降雨量: 39.3
21 | },
22 | {
23 | name: 'London',
24 | 月份: 'Apr',
25 | 月均降雨量: 81.4
26 | },
27 | {
28 | name: 'London',
29 | 月份: 'May',
30 | 月均降雨量: 47
31 | },
32 | {
33 | name: 'London',
34 | 月份: 'Jun',
35 | 月均降雨量: 20.3
36 | },
37 | {
38 | name: 'London',
39 | 月份: 'Jul',
40 | 月均降雨量: 24
41 | },
42 | {
43 | name: 'London',
44 | 月份: 'Aug',
45 | 月均降雨量: 35.6
46 | },
47 | {
48 | name: 'Berlin',
49 | 月份: 'Jan',
50 | 月均降雨量: 12.4
51 | },
52 | {
53 | name: 'Berlin',
54 | 月份: 'Feb',
55 | 月均降雨量: 23.2
56 | },
57 | {
58 | name: 'Berlin',
59 | 月份: 'Mar',
60 | 月均降雨量: 34.5
61 | },
62 | {
63 | name: 'Berlin',
64 | 月份: 'Apr',
65 | 月均降雨量: 99.7
66 | },
67 | {
68 | name: 'Berlin',
69 | 月份: 'May',
70 | 月均降雨量: 52.6
71 | },
72 | {
73 | name: 'Berlin',
74 | 月份: 'Jun',
75 | 月均降雨量: 35.5
76 | },
77 | {
78 | name: 'Berlin',
79 | 月份: 'Jul',
80 | 月均降雨量: 37.4
81 | },
82 | {
83 | name: 'Berlin',
84 | 月份: 'Aug',
85 | 月均降雨量: 42.4
86 | }
87 | ]
88 |
89 | const { Chart, Axis, Line, Bar, Legend } = qcharts
90 |
91 | const chart = new Chart({
92 | container: '#app'
93 | })
94 |
95 | chart.source(data, {
96 | row: 'name',
97 | text: '月份',
98 | value: '月均降雨量'
99 | })
100 |
101 | const bar = new Bar({
102 | transpose: false,
103 | pos: ['10%', '10%'],
104 | size: ['80%', '80%'],
105 | barWidth: 20,
106 | mouseDisabled: true
107 | })
108 |
109 | const line = new Line({
110 | smooth: true,
111 | axisGap: true
112 | })
113 |
114 | const tooltip = new qcharts.Tooltip({
115 | formatter: (d) => `${d.name}: ${d['月份']}: ${d['月均降雨量']}`
116 | })
117 | const legend = new Legend({ align: ['center', 'bottom'] })
118 |
119 | const axisBottom = new Axis()
120 | const axisLeft = new Axis({ orient: 'left' })
121 |
122 | chart.append([bar, line, tooltip, legend, axisBottom, axisLeft])
123 | ```
124 |
125 | :::
126 |
--------------------------------------------------------------------------------
/README.md:
--------------------------------------------------------------------------------
1 | # QCharts
2 |
3 | ### 特点
4 |
5 | QCharts 是一个基于 spritejs 封装的图表库,它以数据驱动,将图表以最小组件进行拆分,具有高度全面灵活的属性配置方法,可对图表绘制过程中所有的点、线、面的大小、位置、填充颜色、描边颜色、描边线型、透明度等属性进行配置,配置方法简单易懂,语义清晰,无论如何复杂的图表,Qcharts 都能轻松胜任。 → 详细文档,Demo:Quickstart
6 |
7 | ### 安装
8 |
9 | 1.通过 npm 获取 QCharts,我们提供了 QCharts npm 包,通过下面的命令即可完成安装
10 |
11 | ```shell
12 | npm install @qcharts/core --save
13 | ```
14 |
15 | ```javascript
16 | // 通过模块引入的方式使用CatCharts
17 | import { Chart, Pie, Tooltip, Legend } from '@qcharts/core'
18 | ```
19 |
20 | 2.既可以下载脚本到本地,也可以通过 cdn 获取 QCharts;QCharts 依赖于 spritejs,需要先引入 spritejs。
21 |
22 | ```html
23 |
24 |
25 | ```
26 |
27 | ### 开始使用
28 |
29 | 1.创建 div 图表容器,Qcharts 初始化 container 属性支持 id 选择器与 class 选择器
30 |
31 | ```html
32 |
33 | ```
34 |
35 | 2.编写绘图代码
36 |
37 | ```javascript
38 | // 指定图表数据源
39 | chart.source(data, {
40 | row: 'catgory', // 以catgory字段分组
41 | value: 'sales', // 以sales字段取值
42 | text: 'date' // date为文本字段
43 | })
44 |
45 | // 创建折线对象
46 | const line = new Line()
47 | // 设置折线点的描边颜色为白色
48 | line.style('point', { strokeColor: '#fff' })
49 | // 创建提示框对象,格式化展示属性为:date scale
50 | const tooltip = new Tooltip({
51 | formatter: function(data) {
52 | return `${data.date} ${data.sales}`
53 | }
54 | })
55 | // 创建底部坐标轴对象
56 | const axisBottom = new Axis()
57 | // 创建左侧坐标轴对象。隐藏轴体直线和刻度
58 | const axisLeft = new Axis({ orient: 'left' }).style('axis', false).style('scale', false)
59 | // 创建图例对象,设置位置以及图标和文本大小
60 | const legend = new Legend({ align: ['center', 'bottom'] }).style('icon', { borderRadius: 10 }).style('text', { fontSize: 12 })
61 | // 装载组件
62 | chart.append([line, tooltip, axisBottom, axisLeft, legend])
63 | // 渲染图表
64 | ```
65 |
66 | 一张折线图就绘制成功
67 |
68 | 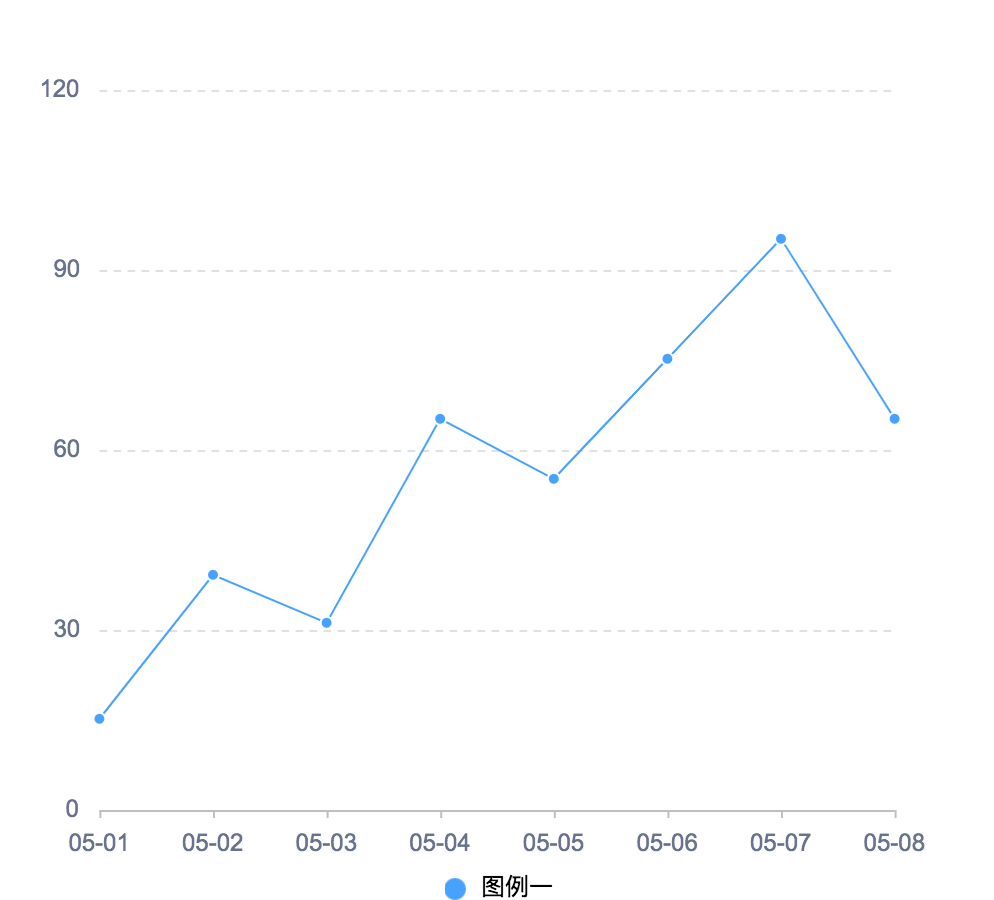 69 |
70 | ## 在 React/Vue 中使用 Qcharts
71 |
72 | 基于 Qcharts 良好的组合性和扩展性,Qcharts 天然支持对 React 和 Vue 这两个常用框架的深度整合,在 React 环境下,我们推荐使用[qcharts-react](https://www.qcharts.cn/qcharts-react) ,在 Vue 环境下,我们推荐使用 [qcharts-vue](https://www.qcharts.cn/qcharts-vue)。这两个产品都是基于 Qcharts 的封装,与 Qcharts 有着一致的开发体验,可以前往官网获取详细的使用说明和示例。当然,你可以自己动手封装成其他框架下的组件,在 Qcharts 下,这些封装成本非常低。
73 |
--------------------------------------------------------------------------------
/docs/48.js:
--------------------------------------------------------------------------------
1 | (window.webpackJsonp_name_=window.webpackJsonp_name_||[]).push([[48],{234:function(_,v,t){"use strict";t.r(v);var render=function(){var _=this.$createElement;this._self._c;return this._m(0)};render._withStripped=!0;var e={components:{}},d=t(2),r=Object(d.a)(e,render,[function(){var _=this,v=_.$createElement,t=_._self._c||v;return t("section",[t("h3",[_._v("图表介绍")]),_._v(" "),t("p",[_._v("RadialBar,玉玦图。")]),_._v(" "),t("h3",[_._v("attrs")]),_._v(" "),t("table",[t("thead",[t("tr",[t("th",[_._v("属性名")]),_._v(" "),t("th",[_._v("类型")]),_._v(" "),t("th",[_._v("默认值")]),_._v(" "),t("th",[_._v("描述")])])]),_._v(" "),t("tbody",[t("tr",[t("td",[_._v("min")]),_._v(" "),t("td",[_._v("Number")]),_._v(" "),t("td",[t("code",{pre:!0},[_._v("0")])]),_._v(" "),t("td",[_._v("最小值")])]),_._v(" "),t("tr",[t("td",[_._v("max")]),_._v(" "),t("td",[_._v("Number")]),_._v(" "),t("td",[t("code",{pre:!0},[_._v("1")])]),_._v(" "),t("td",[_._v("最大值")])]),_._v(" "),t("tr",[t("td",[_._v("startAngle")]),_._v(" "),t("td",[_._v("Number")]),_._v(" "),t("td",[_._v("-90")]),_._v(" "),t("td",[_._v("起始角度")])]),_._v(" "),t("tr",[t("td",[_._v("endAngle")]),_._v(" "),t("td",[_._v("Number")]),_._v(" "),t("td",[_._v("270")]),_._v(" "),t("td",[_._v("结束角度")])]),_._v(" "),t("tr",[t("td",[_._v("radius")]),_._v(" "),t("td",[_._v("Number")]),_._v(" "),t("td",[t("code",{pre:!0},[_._v("0.8")])]),_._v(" "),t("td",[_._v("外半径比例")])]),_._v(" "),t("tr",[t("td",[_._v("innerRadius")]),_._v(" "),t("td",[_._v("Number")]),_._v(" "),t("td",[t("code",{pre:!0},[_._v("0")])]),_._v(" "),t("td",[_._v("内半径比例")])]),_._v(" "),t("tr",[t("td",[_._v("strokeBgcolor")]),_._v(" "),t("td",[_._v("String")]),_._v(" "),t("td",[t("code",{pre:!0},[_._v("#eee")])]),_._v(" "),t("td",[_._v("背景圆弧的背景色")])]),_._v(" "),t("tr",[t("td",[_._v("lineWidth")]),_._v(" "),t("td",[_._v("Number")]),_._v(" "),t("td",[t("code",{pre:!0},[_._v("5")])]),_._v(" "),t("td",[_._v("弧线宽度")])])])]),_._v(" "),t("h3",[_._v("style")]),_._v(" "),t("p",[_._v("组件中可以自定义 css 属性的元素如下表:")]),_._v(" "),t("table",[t("thead",[t("tr",[t("th",[_._v("名称")]),_._v(" "),t("th",[_._v("基础类型")]),_._v(" "),t("th",[_._v("描述")])])]),_._v(" "),t("tbody",[t("tr",[t("td",[_._v("arc")]),_._v(" "),t("td",[_._v("线")]),_._v(" "),t("td",[_._v("弧线样式")])]),_._v(" "),t("tr",[t("td",[_._v("arc:hover")]),_._v(" "),t("td",[_._v("线")]),_._v(" "),t("td",[_._v("弧线鼠标hover样式")])])])])])}],!1,null,null,null);r.options.__file="website/views/doc/api/RadialBar.md";v.default=r.exports}}]);
2 | //# sourceMappingURL=48.js.map?v=d2f1c2b
--------------------------------------------------------------------------------
/docs/61.js:
--------------------------------------------------------------------------------
1 | (window.webpackJsonp_name_=window.webpackJsonp_name_||[]).push([[61],{236:function(t,_,v){"use strict";v.r(_);var render=function(){var t=this.$createElement;this._self._c;return this._m(0)};render._withStripped=!0;var e={components:{}},r=v(2),s=Object(r.a)(e,render,[function(){var t=this,_=t.$createElement,v=t._self._c||_;return v("section",[v("h3",[t._v("插件介绍")]),t._v(" "),v("p",[t._v("Legend, 图例。")]),t._v(" "),v("h3",[t._v("attrs")]),t._v(" "),v("table",[v("thead",[v("tr",[v("th",[t._v("属性名")]),t._v(" "),v("th",[t._v("类型")]),t._v(" "),v("th",[t._v("默认值")]),t._v(" "),v("th",[t._v("描述")])])]),t._v(" "),v("tbody",[v("tr",[v("td",[t._v("orient")]),t._v(" "),v("td",[t._v("String")]),t._v(" "),v("td",[v("code",{pre:!0},[t._v("horizontal")])]),t._v(" "),v("td",[t._v("布局方式,默认水平布局,可选值 `horizontal")])]),t._v(" "),v("tr",[v("td",[t._v("align")]),t._v(" "),v("td",[t._v("Array")]),t._v(" "),v("td",[v("code",{pre:!0},[t._v("['left', 'top']")])]),t._v(" "),v("td",[t._v("对齐方式,第 1 个值控制水平方向布局(可选值:`left")])]),t._v(" "),v("tr",[v("td",[t._v("formatter")]),t._v(" "),v("td",[t._v("Function")]),t._v(" "),v("td",[v("code",{pre:!0},[t._v("d => d")])]),t._v(" "),v("td",[t._v("文本格式化函数")])])])]),t._v(" "),v("h3",[t._v("style")]),t._v(" "),v("pre",{pre:!0},[v("code",{pre:!0,attrs:{"v-pre":"",class:"language-javascript"}},[v("span",{pre:!0,attrs:{class:"hljs-keyword"}},[t._v("const")]),t._v(" legend = "),v("span",{pre:!0,attrs:{class:"hljs-keyword"}},[t._v("new")]),t._v(" Legend()\nlegend.style("),v("span",{pre:!0,attrs:{class:"hljs-string"}},[t._v("'text'")]),t._v(", { "),v("span",{pre:!0,attrs:{class:"hljs-attr"}},[t._v("color")]),t._v(": "),v("span",{pre:!0,attrs:{class:"hljs-string"}},[t._v("'#fff'")]),t._v(" }\n")])]),t._v(" "),v("p",[t._v("组件中可以自定义 css 属性的元素如下表:")]),t._v(" "),v("table",[v("thead",[v("tr",[v("th",[t._v("名称")]),t._v(" "),v("th",[t._v("基础类型")]),t._v(" "),v("th",[t._v("描述")])])]),t._v(" "),v("tbody",[v("tr",[v("td",[t._v("icon")]),t._v(" "),v("td",[t._v("面")]),t._v(" "),v("td",[t._v("图标样式")])]),t._v(" "),v("tr",[v("td",[t._v("icon:hover")]),t._v(" "),v("td",[t._v("面")]),t._v(" "),v("td",[t._v("鼠标经过时图标样式")])]),t._v(" "),v("tr",[v("td",[t._v("text")]),t._v(" "),v("td",[t._v("文本")]),t._v(" "),v("td",[t._v("文字样式")])]),t._v(" "),v("tr",[v("td",[t._v("text:hover")]),t._v(" "),v("td",[t._v("文本")]),t._v(" "),v("td",[t._v("鼠标经过时文字样式")])])])])])}],!1,null,null,null);s.options.__file="website/views/doc/plugins/Legend.md";_.default=s.exports}}]);
2 | //# sourceMappingURL=61.js.map?v=d2f1c2b
--------------------------------------------------------------------------------
69 |
70 | ## 在 React/Vue 中使用 Qcharts
71 |
72 | 基于 Qcharts 良好的组合性和扩展性,Qcharts 天然支持对 React 和 Vue 这两个常用框架的深度整合,在 React 环境下,我们推荐使用[qcharts-react](https://www.qcharts.cn/qcharts-react) ,在 Vue 环境下,我们推荐使用 [qcharts-vue](https://www.qcharts.cn/qcharts-vue)。这两个产品都是基于 Qcharts 的封装,与 Qcharts 有着一致的开发体验,可以前往官网获取详细的使用说明和示例。当然,你可以自己动手封装成其他框架下的组件,在 Qcharts 下,这些封装成本非常低。
73 |
--------------------------------------------------------------------------------
/docs/48.js:
--------------------------------------------------------------------------------
1 | (window.webpackJsonp_name_=window.webpackJsonp_name_||[]).push([[48],{234:function(_,v,t){"use strict";t.r(v);var render=function(){var _=this.$createElement;this._self._c;return this._m(0)};render._withStripped=!0;var e={components:{}},d=t(2),r=Object(d.a)(e,render,[function(){var _=this,v=_.$createElement,t=_._self._c||v;return t("section",[t("h3",[_._v("图表介绍")]),_._v(" "),t("p",[_._v("RadialBar,玉玦图。")]),_._v(" "),t("h3",[_._v("attrs")]),_._v(" "),t("table",[t("thead",[t("tr",[t("th",[_._v("属性名")]),_._v(" "),t("th",[_._v("类型")]),_._v(" "),t("th",[_._v("默认值")]),_._v(" "),t("th",[_._v("描述")])])]),_._v(" "),t("tbody",[t("tr",[t("td",[_._v("min")]),_._v(" "),t("td",[_._v("Number")]),_._v(" "),t("td",[t("code",{pre:!0},[_._v("0")])]),_._v(" "),t("td",[_._v("最小值")])]),_._v(" "),t("tr",[t("td",[_._v("max")]),_._v(" "),t("td",[_._v("Number")]),_._v(" "),t("td",[t("code",{pre:!0},[_._v("1")])]),_._v(" "),t("td",[_._v("最大值")])]),_._v(" "),t("tr",[t("td",[_._v("startAngle")]),_._v(" "),t("td",[_._v("Number")]),_._v(" "),t("td",[_._v("-90")]),_._v(" "),t("td",[_._v("起始角度")])]),_._v(" "),t("tr",[t("td",[_._v("endAngle")]),_._v(" "),t("td",[_._v("Number")]),_._v(" "),t("td",[_._v("270")]),_._v(" "),t("td",[_._v("结束角度")])]),_._v(" "),t("tr",[t("td",[_._v("radius")]),_._v(" "),t("td",[_._v("Number")]),_._v(" "),t("td",[t("code",{pre:!0},[_._v("0.8")])]),_._v(" "),t("td",[_._v("外半径比例")])]),_._v(" "),t("tr",[t("td",[_._v("innerRadius")]),_._v(" "),t("td",[_._v("Number")]),_._v(" "),t("td",[t("code",{pre:!0},[_._v("0")])]),_._v(" "),t("td",[_._v("内半径比例")])]),_._v(" "),t("tr",[t("td",[_._v("strokeBgcolor")]),_._v(" "),t("td",[_._v("String")]),_._v(" "),t("td",[t("code",{pre:!0},[_._v("#eee")])]),_._v(" "),t("td",[_._v("背景圆弧的背景色")])]),_._v(" "),t("tr",[t("td",[_._v("lineWidth")]),_._v(" "),t("td",[_._v("Number")]),_._v(" "),t("td",[t("code",{pre:!0},[_._v("5")])]),_._v(" "),t("td",[_._v("弧线宽度")])])])]),_._v(" "),t("h3",[_._v("style")]),_._v(" "),t("p",[_._v("组件中可以自定义 css 属性的元素如下表:")]),_._v(" "),t("table",[t("thead",[t("tr",[t("th",[_._v("名称")]),_._v(" "),t("th",[_._v("基础类型")]),_._v(" "),t("th",[_._v("描述")])])]),_._v(" "),t("tbody",[t("tr",[t("td",[_._v("arc")]),_._v(" "),t("td",[_._v("线")]),_._v(" "),t("td",[_._v("弧线样式")])]),_._v(" "),t("tr",[t("td",[_._v("arc:hover")]),_._v(" "),t("td",[_._v("线")]),_._v(" "),t("td",[_._v("弧线鼠标hover样式")])])])])])}],!1,null,null,null);r.options.__file="website/views/doc/api/RadialBar.md";v.default=r.exports}}]);
2 | //# sourceMappingURL=48.js.map?v=d2f1c2b
--------------------------------------------------------------------------------
/docs/61.js:
--------------------------------------------------------------------------------
1 | (window.webpackJsonp_name_=window.webpackJsonp_name_||[]).push([[61],{236:function(t,_,v){"use strict";v.r(_);var render=function(){var t=this.$createElement;this._self._c;return this._m(0)};render._withStripped=!0;var e={components:{}},r=v(2),s=Object(r.a)(e,render,[function(){var t=this,_=t.$createElement,v=t._self._c||_;return v("section",[v("h3",[t._v("插件介绍")]),t._v(" "),v("p",[t._v("Legend, 图例。")]),t._v(" "),v("h3",[t._v("attrs")]),t._v(" "),v("table",[v("thead",[v("tr",[v("th",[t._v("属性名")]),t._v(" "),v("th",[t._v("类型")]),t._v(" "),v("th",[t._v("默认值")]),t._v(" "),v("th",[t._v("描述")])])]),t._v(" "),v("tbody",[v("tr",[v("td",[t._v("orient")]),t._v(" "),v("td",[t._v("String")]),t._v(" "),v("td",[v("code",{pre:!0},[t._v("horizontal")])]),t._v(" "),v("td",[t._v("布局方式,默认水平布局,可选值 `horizontal")])]),t._v(" "),v("tr",[v("td",[t._v("align")]),t._v(" "),v("td",[t._v("Array")]),t._v(" "),v("td",[v("code",{pre:!0},[t._v("['left', 'top']")])]),t._v(" "),v("td",[t._v("对齐方式,第 1 个值控制水平方向布局(可选值:`left")])]),t._v(" "),v("tr",[v("td",[t._v("formatter")]),t._v(" "),v("td",[t._v("Function")]),t._v(" "),v("td",[v("code",{pre:!0},[t._v("d => d")])]),t._v(" "),v("td",[t._v("文本格式化函数")])])])]),t._v(" "),v("h3",[t._v("style")]),t._v(" "),v("pre",{pre:!0},[v("code",{pre:!0,attrs:{"v-pre":"",class:"language-javascript"}},[v("span",{pre:!0,attrs:{class:"hljs-keyword"}},[t._v("const")]),t._v(" legend = "),v("span",{pre:!0,attrs:{class:"hljs-keyword"}},[t._v("new")]),t._v(" Legend()\nlegend.style("),v("span",{pre:!0,attrs:{class:"hljs-string"}},[t._v("'text'")]),t._v(", { "),v("span",{pre:!0,attrs:{class:"hljs-attr"}},[t._v("color")]),t._v(": "),v("span",{pre:!0,attrs:{class:"hljs-string"}},[t._v("'#fff'")]),t._v(" }\n")])]),t._v(" "),v("p",[t._v("组件中可以自定义 css 属性的元素如下表:")]),t._v(" "),v("table",[v("thead",[v("tr",[v("th",[t._v("名称")]),t._v(" "),v("th",[t._v("基础类型")]),t._v(" "),v("th",[t._v("描述")])])]),t._v(" "),v("tbody",[v("tr",[v("td",[t._v("icon")]),t._v(" "),v("td",[t._v("面")]),t._v(" "),v("td",[t._v("图标样式")])]),t._v(" "),v("tr",[v("td",[t._v("icon:hover")]),t._v(" "),v("td",[t._v("面")]),t._v(" "),v("td",[t._v("鼠标经过时图标样式")])]),t._v(" "),v("tr",[v("td",[t._v("text")]),t._v(" "),v("td",[t._v("文本")]),t._v(" "),v("td",[t._v("文字样式")])]),t._v(" "),v("tr",[v("td",[t._v("text:hover")]),t._v(" "),v("td",[t._v("文本")]),t._v(" "),v("td",[t._v("鼠标经过时文字样式")])])])])])}],!1,null,null,null);s.options.__file="website/views/doc/plugins/Legend.md";_.default=s.exports}}]);
2 | //# sourceMappingURL=61.js.map?v=d2f1c2b
--------------------------------------------------------------------------------