├── .github
├── ISSUE_TEMPLATE
│ ├── bug-report.md
│ └── feature_request.md
├── pull_request_template.md
└── workflows
│ └── pull-request.yaml
├── .gitignore
├── .metadata
├── CHANGELOG.md
├── LICENSE
├── README.md
├── analysis_options.yaml
├── example
├── .gitignore
├── .metadata
├── README.md
├── analysis_options.yaml
├── lib
│ ├── bar.dart
│ ├── column.dart
│ ├── common.dart
│ ├── line.dart
│ └── main.dart
├── pubspec.lock
└── pubspec.yaml
├── lib
├── src
│ ├── bar.dart
│ ├── column.dart
│ ├── line.dart
│ └── utils.dart
└── tiny_charts.dart
├── pubspec.yaml
└── test
├── bar_test.dart
├── column_test.dart
├── goldens
├── bar
│ ├── 1.png
│ ├── 2.png
│ ├── 3.png
│ ├── 4.png
│ └── 5.png
├── column
│ ├── 1.png
│ ├── 2.png
│ ├── 3.png
│ ├── 4.png
│ └── 5.png
└── line
│ ├── 1.png
│ ├── 2.png
│ └── 3.png
├── line_test.dart
└── utils.dart
/.github/ISSUE_TEMPLATE/bug-report.md:
--------------------------------------------------------------------------------
1 | ---
2 | name: Bug report
3 | about: You are trying to use this package but you are noticing some strange behaviour, that it throws an unexpected exception, or that it is not working according to the specifications.
4 | title: ""
5 | labels: bug
6 | assignees: ''
7 | ---
8 |
9 |
10 |
11 | ### Given
12 |
13 |
14 |
15 | ### When
16 |
17 |
18 |
19 | ### Then
20 |
21 | **Reality**
22 |
23 |
24 | **Expectation**
25 |
26 |
27 | # Flutter doctor output
28 |
29 |
30 |
31 | ```
32 | Output of: flutter doctor -v
33 | ```
34 |
35 | # More environment information
36 |
37 |
42 |
43 | # Log information
44 |
45 |
46 |
47 | ```
48 | Enter log information in this code block
49 | ```
50 |
51 | # More information
52 |
53 |
54 |
55 |
56 |
--------------------------------------------------------------------------------
/.github/ISSUE_TEMPLATE/feature_request.md:
--------------------------------------------------------------------------------
1 | ---
2 | name: Feature request
3 | about: Suggest an idea for this project
4 | title: ''
5 | labels: improvement
6 | assignees: ''
7 |
8 | ---
9 |
10 |
11 |
12 |
13 | ## Summary
14 |
15 |
16 | ## Acceptance criteria
17 | -
18 |
19 | ## Technical details
20 |
21 |
22 |
--------------------------------------------------------------------------------
/.github/pull_request_template.md:
--------------------------------------------------------------------------------
1 | ### Related to
2 |
3 |
4 |
5 | ### Context
6 |
7 |
8 |
9 | ### Approach
10 |
11 |
--------------------------------------------------------------------------------
/.github/workflows/pull-request.yaml:
--------------------------------------------------------------------------------
1 | name: pull-request
2 |
3 | on:
4 | push:
5 | branches:
6 | - main
7 | pull_request:
8 | types: [ opened, reopened, synchronize ]
9 |
10 | jobs:
11 | # BEGIN LINTING STAGE
12 | dartdoc:
13 | runs-on: ubuntu-latest
14 | steps:
15 | - uses: actions/checkout@v2
16 | - uses: subosito/flutter-action@v1
17 | with:
18 | channel: "beta"
19 | - uses: flame-engine/flame-dartdoc-action@v2
20 |
21 | format:
22 | runs-on: ubuntu-latest
23 | steps:
24 | - uses: actions/checkout@v2
25 | - uses: subosito/flutter-action@v1
26 | with:
27 | channel: "beta"
28 | - uses: flame-engine/flame-format-action@v1
29 |
30 | analyze:
31 | runs-on: ubuntu-latest
32 | steps:
33 | - uses: actions/checkout@v2
34 | - uses: subosito/flutter-action@v1
35 | with:
36 | channel: "beta"
37 | - uses: flame-engine/flame-analyze-action@v2
38 | # END LINTING STAGE
39 |
40 | # BEGIN TESTING STAGE
41 | test:
42 | runs-on: ubuntu-latest
43 | steps:
44 | - uses: actions/checkout@v2
45 | - uses: subosito/flutter-action@v1
46 | with:
47 | channel: "beta"
48 | - uses: flame-engine/flame-test-action@v1
49 | # END TESTING STAGE
--------------------------------------------------------------------------------
/.gitignore:
--------------------------------------------------------------------------------
1 | # Miscellaneous
2 | *.class
3 | *.log
4 | *.pyc
5 | *.swp
6 | .DS_Store
7 | .atom/
8 | .buildlog/
9 | .history
10 | .svn/
11 |
12 | # IntelliJ related
13 | *.iml
14 | *.ipr
15 | *.iws
16 | .idea/
17 |
18 | # The .vscode folder contains launch configuration and tasks you configure in
19 | # VS Code which you may wish to be included in version control, so this line
20 | # is commented out by default.
21 | #.vscode/
22 |
23 | # Flutter/Dart/Pub related
24 | # Libraries should not include pubspec.lock, per https://dart.dev/guides/libraries/private-files#pubspeclock.
25 | /pubspec.lock
26 | **/doc/api/
27 | .dart_tool/
28 | .packages
29 | build/
30 |
31 |
32 | # Android related
33 | **/android/**/gradle-wrapper.jar
34 | **/android/.gradle
35 | **/android/captures/
36 | **/android/gradlew
37 | **/android/gradlew.bat
38 | **/android/local.properties
39 | **/android/**/GeneratedPluginRegistrant.java
40 |
41 | # iOS/XCode related
42 | **/ios/**/*.mode1v3
43 | **/ios/**/*.mode2v3
44 | **/ios/**/*.moved-aside
45 | **/ios/**/*.pbxuser
46 | **/ios/**/*.perspectivev3
47 | **/ios/**/*sync/
48 | **/ios/**/.sconsign.dblite
49 | **/ios/**/.tags*
50 | **/ios/**/.vagrant/
51 | **/ios/**/DerivedData/
52 | **/ios/**/Icon?
53 | **/ios/**/Pods/
54 | **/ios/**/.symlinks/
55 | **/ios/**/profile
56 | **/ios/**/xcuserdata
57 | **/ios/.generated/
58 | **/ios/Flutter/App.framework
59 | **/ios/Flutter/Flutter.framework
60 | **/ios/Flutter/Flutter.podspec
61 | **/ios/Flutter/Generated.xcconfig
62 | **/ios/Flutter/app.flx
63 | **/ios/Flutter/app.zip
64 | **/ios/Flutter/flutter_assets/
65 | **/ios/Flutter/flutter_export_environment.sh
66 | **/ios/ServiceDefinitions.json
67 | **/ios/Runner/GeneratedPluginRegistrant.*
68 |
69 | # Exceptions to above rules.
70 | !**/ios/**/default.mode1v3
71 | !**/ios/**/default.mode2v3
72 | !**/ios/**/default.pbxuser
73 | !**/ios/**/default.perspectivev3
74 |
75 | test/**/failures/
76 |
--------------------------------------------------------------------------------
/.metadata:
--------------------------------------------------------------------------------
1 | # This file tracks properties of this Flutter project.
2 | # Used by Flutter tool to assess capabilities and perform upgrades etc.
3 | #
4 | # This file should be version controlled and should not be manually edited.
5 |
6 | version:
7 | revision: 7f0050f5b3f37d36e6d2e3044ae4ebfc99aa1287
8 | channel: master
9 |
10 | project_type: package
11 |
--------------------------------------------------------------------------------
/CHANGELOG.md:
--------------------------------------------------------------------------------
1 | ## 0.1.0
2 |
3 | * Initial version
--------------------------------------------------------------------------------
/LICENSE:
--------------------------------------------------------------------------------
1 | BSD 3-Clause License
2 |
3 | Copyright (c) 2022, Rows GmbH (rows.com)
4 | All rights reserved.
5 |
6 | Redistribution and use in source and binary forms, with or without
7 | modification, are permitted provided that the following conditions are met:
8 |
9 | 1. Redistributions of source code must retain the above copyright notice, this
10 | list of conditions and the following disclaimer.
11 |
12 | 2. Redistributions in binary form must reproduce the above copyright notice,
13 | this list of conditions and the following disclaimer in the documentation
14 | and/or other materials provided with the distribution.
15 |
16 | 3. Neither the name of the copyright holder nor the names of its
17 | contributors may be used to endorse or promote products derived from
18 | this software without specific prior written permission.
19 |
20 | THIS SOFTWARE IS PROVIDED BY THE COPYRIGHT HOLDERS AND CONTRIBUTORS "AS IS"
21 | AND ANY EXPRESS OR IMPLIED WARRANTIES, INCLUDING, BUT NOT LIMITED TO, THE
22 | IMPLIED WARRANTIES OF MERCHANTABILITY AND FITNESS FOR A PARTICULAR PURPOSE ARE
23 | DISCLAIMED. IN NO EVENT SHALL THE COPYRIGHT HOLDER OR CONTRIBUTORS BE LIABLE
24 | FOR ANY DIRECT, INDIRECT, INCIDENTAL, SPECIAL, EXEMPLARY, OR CONSEQUENTIAL
25 | DAMAGES (INCLUDING, BUT NOT LIMITED TO, PROCUREMENT OF SUBSTITUTE GOODS OR
26 | SERVICES; LOSS OF USE, DATA, OR PROFITS; OR BUSINESS INTERRUPTION) HOWEVER
27 | CAUSED AND ON ANY THEORY OF LIABILITY, WHETHER IN CONTRACT, STRICT LIABILITY,
28 | OR TORT (INCLUDING NEGLIGENCE OR OTHERWISE) ARISING IN ANY WAY OUT OF THE USE
29 | OF THIS SOFTWARE, EVEN IF ADVISED OF THE POSSIBILITY OF SUCH DAMAGE.
30 |
--------------------------------------------------------------------------------
/README.md:
--------------------------------------------------------------------------------
1 |
2 |
3 |
4 |  5 |
5 |
6 |
7 |
8 |
9 |
10 |
11 | Spreadsheet with superpowers ✨!
12 |
13 |
14 |
15 |
16 |
17 |  18 |
18 |  19 |
19 |
20 |
21 |
22 | ---
23 |
24 |
25 | # Tiny charts 🤏
26 | Sparkline charts for fast data visualization on Flutter apps
27 |
28 |
29 | ## Installation
30 |
31 | ```
32 | flutter pub add tiny_charts
33 | ```
34 |
35 | ## Usage
36 |
37 | ## 📈 Line charts
38 |
39 | ### From offsets
40 |
41 | 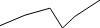
42 |
43 | ```dart
44 | void build(BuildContext context) {
45 | return TinyLineChart(
46 | width: 100,
47 | height: 28,
48 | dataPoints: const [
49 | Offset(0, 2),
50 | Offset(1, 11),
51 | Offset(2, 17),
52 | Offset(2.5, 0),
53 | Offset(3, 10),
54 | Offset(4, 24),
55 | ],
56 | );
57 | }
58 | ```
59 |
60 | ### From vectors
61 |
62 | Using vector_math's Vector2 class.
63 |
64 | 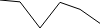
65 |
66 | ```dart
67 | import 'package:vector_math/vector_math.dart';
68 |
69 | void build(BuildContext context) {
70 | return TinyLineChart.fromDataVectors(
71 | width: 100,
72 | height: 28,
73 | dataPoints: [
74 | Vector2(0, 14),
75 | Vector2(1, 13.2),
76 | Vector2(2, 2),
77 | Vector2(3, 13),
78 | Vector2(4, 10),
79 | Vector2(5, 4),
80 | ],
81 | );
82 | }
83 | ```
84 |
85 | ### With options
86 |
87 | Passing custom options
88 |
89 | 
90 |
91 | ```dart
92 | void build(BuildContext context) {
93 | return TinyLineChart(
94 | width: 100,
95 | height: 28,
96 | dataPoints: const [
97 | Offset(0, 2),
98 | Offset(1, 11),
99 | Offset(2, 17),
100 | Offset(2.5, 0),
101 | Offset(3, 10),
102 | Offset(4, 24),
103 | ],
104 | options: const TinyLineChartOptions(
105 | color: Color(0xFFC93B8C),
106 | lineWidth: 3,
107 | yMinLimit: -2,
108 | yMaxLimit: 27,
109 | ),
110 | );
111 | }
112 | ```
113 |
114 | ## Bar charts
115 |
116 | ### Single
117 |
118 | 
119 |
120 | ```dart
121 | void build(BuildContext context) {
122 | return TinyBarChart.single(
123 | value: 68.12,
124 | max: 100,
125 | color: const Color(0xFF236536),
126 | width: 120,
127 | height: 28,
128 | );
129 | }
130 | ```
131 |
132 | ### Stacked
133 |
134 | 
135 |
136 | ```dart
137 | void build(BuildContext context) {
138 | return TinyBarChart.stacked(
139 | data: const [24, 12, 4],
140 | width: 120,
141 | height: 28,
142 | );
143 | }
144 | ```
145 |
146 | ### From data vectors
147 |
148 | 
149 |
150 | ```dart
151 | void build(BuildContext context) {
152 | return TinyBarChart.stackedFromDataVectors(
153 | dataPoints: [
154 | Vector2(1, 20),
155 | Vector2(2, 12),
156 | Vector2(0, 12),
157 | Vector2(4, 24),
158 | ],
159 | );
160 | }
161 | ```
162 |
163 | ### With options
164 |
165 | 
166 |
167 | ```dart
168 | void build(BuildContext context) {
169 | return TinyBarChart.stacked(
170 | data: const [24, 12, 4],
171 | options: const TinyBarChartOptions(
172 | colors: [
173 | Color(0xFFFF0000),
174 | Color(0xBEEE0260),
175 | Color(0x97FF74AD),
176 | ],
177 | ),
178 | width: 120,
179 | height: 28,
180 | );
181 | }
182 | ```
183 |
184 | ## 📊 Column charts
185 |
186 | ### From values
187 |
188 | 
189 |
190 | ```dart
191 | void build(BuildContext context) {
192 | return TinyColumnChart(
193 | data: const [20, 22, 14, 12, 19, 28, 1, 11],
194 | width: 120,
195 | height: 28,
196 | );
197 | }
198 | ```
199 |
200 | ### From vectors
201 |
202 | 
203 |
204 | ```dart
205 | void build(BuildContext context) {
206 | return TinyColumnChart.fromDataVectors(
207 | dataPoints: [
208 | Vector2(0, 18),
209 | Vector2(6, 22),
210 | Vector2(2, 12),
211 | Vector2(3, 14),
212 | Vector2(5, 34),
213 | Vector2(4, 5),
214 | Vector2(1, 24),
215 | ],
216 | width: 120,
217 | height: 28,
218 | );
219 | }
220 | ```
221 |
222 | ### With negative values
223 |
224 | 
225 |
226 | ```dart
227 | void build(BuildContext context) {
228 | return TinyColumnChart(
229 | data: const [20, -22, 14, -12, -19, 28, 1, 11],
230 | width: 120,
231 | height: 28,
232 | );
233 | }
234 | ```
235 |
236 | ## With options
237 |
238 | * With axis
239 |
240 | 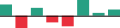
241 |
242 | ```dart
243 | void build(BuildContext context) {
244 | return TinyColumnChart(
245 | data: const [20, -22, 14, -12, -19, 28, 5, 11],
246 | width: 120,
247 | height: 28,
248 | options: const TinyColumnChartOptions(
249 | positiveColor: Color(0xFF27A083),
250 | negativeColor: Color(0xFFE92F3C),
251 | showAxis: true,
252 | ),
253 | );
254 | }
255 | ```
256 |
257 | * Custom colors
258 |
259 | 
260 |
261 | ```dart
262 | void build(BuildContext context) {
263 | return TinyColumnChart(
264 | data: const [18, 22, 28, -12, 32, 12, 9, 14, -34, -25, 24],
265 | width: 120,
266 | height: 28,
267 | options: const TinyColumnChartOptions(
268 | positiveColor: Color(0xFF0023C6),
269 | negativeColor: Color(0xFFBA2500),
270 | showAxis: true,
271 | axisColor: Color(0xFF00FF00),
272 | lowestColor: Color(0xFFFF4A1A),
273 | highestColor: Color(0xFF3083FF),
274 | firstColor: Color(0xFFFFE500),
275 | lastColor: Color(0xFF8000FF),
276 | ),
277 | );
278 | }
279 | ```
280 |
--------------------------------------------------------------------------------
/analysis_options.yaml:
--------------------------------------------------------------------------------
1 | include: package:rows_lint/analysis_options.yaml
2 |
3 | # We have a bug on the include above and it seems like the only fix is to exclude sub projects
4 | analyzer:
5 | exclude:
6 | - 'test/**/*.mocks.dart'
7 |
--------------------------------------------------------------------------------
/example/.gitignore:
--------------------------------------------------------------------------------
1 | # Miscellaneous
2 | *.class
3 | *.log
4 | *.pyc
5 | *.swp
6 | .DS_Store
7 | .atom/
8 | .buildlog/
9 | .history
10 | .svn/
11 |
12 | # IntelliJ related
13 | *.iml
14 | *.ipr
15 | *.iws
16 | .idea/
17 |
18 | # The .vscode folder contains launch configuration and tasks you configure in
19 | # VS Code which you may wish to be included in version control, so this line
20 | # is commented out by default.
21 | #.vscode/
22 |
23 | # Flutter/Dart/Pub related
24 | **/doc/api/
25 | **/ios/Flutter/.last_build_id
26 | .dart_tool/
27 | .flutter-plugins
28 | .flutter-plugins-dependencies
29 | .packages
30 | .pub-cache/
31 | .pub/
32 | /build/
33 |
34 | # Web related
35 | lib/generated_plugin_registrant.dart
36 |
37 | # Symbolication related
38 | app.*.symbols
39 |
40 | # Obfuscation related
41 | app.*.map.json
42 |
43 | # Android Studio will place build artifacts here
44 | /android/app/debug
45 | /android/app/profile
46 | /android/app/release
47 |
48 | /macos
49 | /android
50 | /ios
51 | /windows
52 | /linux
53 | /web
54 | /test
55 |
--------------------------------------------------------------------------------
/example/.metadata:
--------------------------------------------------------------------------------
1 | # This file tracks properties of this Flutter project.
2 | # Used by Flutter tool to assess capabilities and perform upgrades etc.
3 | #
4 | # This file should be version controlled and should not be manually edited.
5 |
6 | version:
7 | revision: 7f0050f5b3f37d36e6d2e3044ae4ebfc99aa1287
8 | channel: master
9 |
10 | project_type: app
11 |
--------------------------------------------------------------------------------
/example/README.md:
--------------------------------------------------------------------------------
1 | # example
2 |
3 | A new Flutter project.
4 |
5 | ## Getting Started
6 |
7 | This project is a starting point for a Flutter application.
8 |
9 | A few resources to get you started if this is your first Flutter project:
10 |
11 | - [Lab: Write your first Flutter app](https://flutter.dev/docs/get-started/codelab)
12 | - [Cookbook: Useful Flutter samples](https://flutter.dev/docs/cookbook)
13 |
14 | For help getting started with Flutter, view our
15 | [online documentation](https://flutter.dev/docs), which offers tutorials,
16 | samples, guidance on mobile development, and a full API reference.
17 |
--------------------------------------------------------------------------------
/example/analysis_options.yaml:
--------------------------------------------------------------------------------
1 | include: package:rows_lint/analysis_options.yaml
2 |
3 |
4 |
--------------------------------------------------------------------------------
/example/lib/bar.dart:
--------------------------------------------------------------------------------
1 | import 'package:dashbook/dashbook.dart';
2 | import 'package:flutter/widgets.dart';
3 | import 'package:tiny_charts/tiny_charts.dart';
4 | import 'package:vector_math/vector_math.dart';
5 |
6 | import 'common.dart';
7 |
8 | void addBarChartStories(Dashbook dashbook) {
9 | dashbook.storiesOf('Tiny Bar Chart')
10 | ..add('Single value', single)
11 | ..add('Stacked values', stacked)
12 | ..add('Stacked vectors', stackedVectors)
13 | ..add('Stacked values playground', stackedPlayground)
14 | ..add('Stacked values options playground', stackedOptionsPlayground);
15 | }
16 |
17 | Widget single(DashbookContext context) {
18 | return DemoStage(
19 | child: TinyBarChart.single(
20 | value: 68,
21 | max: 100,
22 | color: context.colorProperty('color', const Color(0xFF236536)),
23 | width: context.numberProperty('width', 120),
24 | height: context.numberProperty('height', 28),
25 | ),
26 | );
27 | }
28 |
29 | Widget stacked(DashbookContext context) {
30 | return DemoStage(
31 | child: TinyBarChart.stacked(
32 | data: const [4, 20, 14],
33 | width: context.numberProperty('width', 120),
34 | height: context.numberProperty('height', 28),
35 | ),
36 | );
37 | }
38 |
39 | Widget stackedVectors(DashbookContext context) {
40 | return DemoStage(
41 | child: TinyBarChart.stackedFromDataVectors(
42 | dataPoints: [
43 | Vector2(2, 20),
44 | Vector2(0, 4),
45 | Vector2(4, 14),
46 | ],
47 | width: context.numberProperty('width', 120),
48 | height: context.numberProperty('height', 28),
49 | ),
50 | );
51 | }
52 |
53 | Widget stackedPlayground(DashbookContext context) {
54 | return DemoStage(
55 | child: TinyBarChart.stacked(
56 | data: [
57 | context.numberProperty('1st option', 4),
58 | context.numberProperty('2nd option', 20),
59 | context.numberProperty('3rd option', 14),
60 | ],
61 | width: context.numberProperty('width', 120),
62 | height: context.numberProperty('height', 28),
63 | ),
64 | );
65 | }
66 |
67 | Widget stackedOptionsPlayground(DashbookContext context) {
68 | return DemoStage(
69 | child: TinyBarChart.stacked(
70 | data: const [4, 20, 14, 1, 12, 9],
71 | options: TinyBarChartOptions(
72 | colors: [
73 | context.colorProperty('color 1', const Color(0xFF310813)),
74 | context.colorProperty('color 2', const Color(0xFFF8EC08)),
75 | context.colorProperty('color 3', const Color(0xFF22AF99)),
76 | ],
77 | max: context.numberProperty('max', 100),
78 | ),
79 | width: context.numberProperty('width', 220),
80 | height: context.numberProperty('height', 28),
81 | ),
82 | );
83 | }
84 |
--------------------------------------------------------------------------------
/example/lib/column.dart:
--------------------------------------------------------------------------------
1 | import 'package:dashbook/dashbook.dart';
2 | import 'package:flutter/widgets.dart';
3 | import 'package:tiny_charts/tiny_charts.dart';
4 | import 'package:vector_math/vector_math.dart';
5 |
6 | import 'common.dart';
7 |
8 | void addColumnChartStories(Dashbook dashbook) {
9 | dashbook.storiesOf('Tiny Column Chart')
10 | ..add('List of values', listOfValues)
11 | ..add('List of vectors', listOfVectors)
12 | ..add('Values playground', valuesPlayground)
13 | ..add('Options playground', optionsPlayground);
14 | }
15 |
16 | Widget listOfValues(DashbookContext context) {
17 | return DemoStage(
18 | child: TinyColumnChart(
19 | data: const [20, 22, 14, 12, 19, 28, -15, 11],
20 | width: context.numberProperty('width', 120),
21 | height: context.numberProperty('height', 28),
22 | ),
23 | );
24 | }
25 |
26 | Widget listOfVectors(DashbookContext context) {
27 | return DemoStage(
28 | child: TinyColumnChart.fromDataVectors(
29 | dataPoints: [
30 | Vector2(0, 18),
31 | Vector2(6, 22),
32 | Vector2(2, 12),
33 | Vector2(3, 14),
34 | Vector2(5, -34),
35 | Vector2(4, 5),
36 | Vector2(1, 24),
37 | ],
38 | width: context.numberProperty('width', 120),
39 | height: context.numberProperty('height', 28),
40 | ),
41 | );
42 | }
43 |
44 | Widget valuesPlayground(DashbookContext context) {
45 | return DemoStage(
46 | child: TinyColumnChart(
47 | data: [
48 | context.numberProperty('1', 18),
49 | context.numberProperty('2', 22),
50 | context.numberProperty('3', -2),
51 | context.numberProperty('4', 12),
52 | context.numberProperty('5', 14),
53 | context.numberProperty('6', 34),
54 | context.numberProperty('7', -15),
55 | context.numberProperty('8', 24),
56 | ],
57 | width: context.numberProperty('width', 120),
58 | height: context.numberProperty('height', 28),
59 | ),
60 | );
61 | }
62 |
63 | Widget optionsPlayground(DashbookContext context) {
64 | return DemoStage(
65 | child: TinyColumnChart(
66 | data: const [18, 22, -2, 32, 14, -34, -5, 24],
67 | width: context.numberProperty('width', 120),
68 | height: context.numberProperty('height', 28),
69 | options: TinyColumnChartOptions(
70 | maxLimit: context.numberProperty('maxLimit', 30),
71 | minLimit: context.numberProperty('minLimit', -12),
72 | positiveColor: context.colorProperty(
73 | 'positiveColor',
74 | const Color(0xFF236536),
75 | ),
76 | negativeColor: context.colorProperty(
77 | 'negativeColor',
78 | const Color(0xFFD70000),
79 | ),
80 | lowestColor: context.colorProperty(
81 | 'lowestColor',
82 | const Color(0xFFAC2701),
83 | ),
84 | highestColor: context.colorProperty(
85 | 'highestColor',
86 | const Color(0xFF00D73F),
87 | ),
88 | firstColor: context.colorProperty(
89 | 'firstColor',
90 | const Color(0xFFFFE500),
91 | ),
92 | lastColor: context.colorProperty(
93 | 'lastColor',
94 | const Color(0xFFD900FF),
95 | ),
96 | showAxis: context.boolProperty('showAxis', true),
97 | axisColor: context.colorProperty(
98 | 'axisColor',
99 | const Color(0xFF000000),
100 | ),
101 | ),
102 | ),
103 | );
104 | }
105 |
--------------------------------------------------------------------------------
/example/lib/common.dart:
--------------------------------------------------------------------------------
1 | import 'package:flutter/widgets.dart';
2 |
3 | class DemoStage extends StatelessWidget {
4 | final Widget child;
5 |
6 | const DemoStage({
7 | Key? key,
8 | required this.child,
9 | }) : super(key: key);
10 |
11 | @override
12 | Widget build(BuildContext context) {
13 | return ColoredBox(
14 | color: const Color(0xFFFFFFFF),
15 | child: Center(
16 | child: ColoredBox(
17 | color: const Color(0xFFFFFFFF),
18 | child: Padding(
19 | padding: const EdgeInsets.all(10),
20 | child: ClipRect(
21 | child: child,
22 | ),
23 | ),
24 | ),
25 | ),
26 | );
27 | }
28 | }
29 |
--------------------------------------------------------------------------------
/example/lib/line.dart:
--------------------------------------------------------------------------------
1 | import 'package:dashbook/dashbook.dart';
2 | import 'package:flutter/widgets.dart';
3 | import 'package:tiny_charts/tiny_charts.dart';
4 | import 'package:vector_math/vector_math.dart';
5 |
6 | import 'common.dart';
7 |
8 | void addLineChartStories(Dashbook dashbook) {
9 | dashbook
10 | .storiesOf('Tiny Line Chart')
11 | .add('Simple', simple)
12 | .add('Data playground', dataPlayground)
13 | .add('Options playground', optionsPlayground);
14 | }
15 |
16 | Widget simple(DashbookContext context) {
17 | return DemoStage(
18 | child: TinyLineChart(
19 | width: 100,
20 | height: 28,
21 | dataPoints: const [
22 | Offset(0, 2),
23 | Offset(1, 11),
24 | Offset(2, 17),
25 | Offset(2.5, 0),
26 | Offset(3, 10),
27 | Offset(4, 24),
28 | ],
29 | ),
30 | );
31 | }
32 |
33 | Widget dataPlayground(DashbookContext context) {
34 | return DemoStage(
35 | child: TinyLineChart(
36 | width: context.numberProperty('width', 120),
37 | height: context.numberProperty('height', 28),
38 | dataPoints: {
39 | Offset(
40 | context.numberProperty('1st x', 0),
41 | context.numberProperty('1st y', 12),
42 | ),
43 | Offset(
44 | context.numberProperty('2nd x', 1),
45 | context.numberProperty('2nd y', 11),
46 | ),
47 | Offset(
48 | context.numberProperty('3rd x', 2),
49 | context.numberProperty('3rd y', 17),
50 | ),
51 | Offset(
52 | context.numberProperty('4th x', 3),
53 | context.numberProperty('4th y', 5),
54 | ),
55 | Offset(
56 | context.numberProperty('5th x', 4),
57 | context.numberProperty('5th y', 22),
58 | ),
59 | Offset(
60 | context.numberProperty('6th x', 5),
61 | context.numberProperty('6th y', 19),
62 | ),
63 | },
64 | ),
65 | );
66 | }
67 |
68 | Widget optionsPlayground(DashbookContext context) {
69 | return DemoStage(
70 | child: TinyLineChart.fromDataVectors(
71 | width: context.numberProperty('width', 120),
72 | height: context.numberProperty('height', 28),
73 | options: TinyLineChartOptions(
74 | color: context.colorProperty(
75 | 'color',
76 | const Color(0xFFD72282),
77 | ),
78 | lineWidth: context.numberProperty('lineWidth', 1),
79 | xMinLimit: context.numberProperty('xMinLimit', 0),
80 | xMaxLimit: context.numberProperty('xMaxLimit', 5),
81 | yMinLimit: context.numberProperty('yMinLimit', 5),
82 | yMaxLimit: context.numberProperty('yMaxLimit', 22),
83 | ),
84 | dataPoints: [
85 | Vector2(0, 12),
86 | Vector2(1, 11),
87 | Vector2(2, 17),
88 | Vector2(3, 5),
89 | Vector2(4, 22),
90 | Vector2(5, 19),
91 | ],
92 | ),
93 | );
94 | }
95 |
--------------------------------------------------------------------------------
/example/lib/main.dart:
--------------------------------------------------------------------------------
1 | import 'package:dashbook/dashbook.dart';
2 | import 'package:flutter/material.dart';
3 |
4 | import 'bar.dart';
5 | import 'column.dart';
6 | import 'line.dart';
7 |
8 | void main() {
9 | runApp(
10 | Builder(
11 | builder: (context) {
12 | final dashbook = Dashbook(
13 | title: 'Tiny charts stories',
14 | );
15 | addLineChartStories(dashbook);
16 | addBarChartStories(dashbook);
17 | addColumnChartStories(dashbook);
18 | return dashbook;
19 | },
20 | ),
21 | );
22 | }
23 |
--------------------------------------------------------------------------------
/example/pubspec.lock:
--------------------------------------------------------------------------------
1 | # Generated by pub
2 | # See https://dart.dev/tools/pub/glossary#lockfile
3 | packages:
4 | args:
5 | dependency: transitive
6 | description:
7 | name: args
8 | url: "https://pub.dartlang.org"
9 | source: hosted
10 | version: "2.3.0"
11 | characters:
12 | dependency: transitive
13 | description:
14 | name: characters
15 | url: "https://pub.dartlang.org"
16 | source: hosted
17 | version: "1.2.0"
18 | charcode:
19 | dependency: transitive
20 | description:
21 | name: charcode
22 | url: "https://pub.dartlang.org"
23 | source: hosted
24 | version: "1.3.1"
25 | collection:
26 | dependency: transitive
27 | description:
28 | name: collection
29 | url: "https://pub.dartlang.org"
30 | source: hosted
31 | version: "1.15.0"
32 | dashbook:
33 | dependency: "direct main"
34 | description:
35 | name: dashbook
36 | url: "https://pub.dartlang.org"
37 | source: hosted
38 | version: "0.1.5"
39 | device_frame:
40 | dependency: transitive
41 | description:
42 | name: device_frame
43 | url: "https://pub.dartlang.org"
44 | source: hosted
45 | version: "0.4.2"
46 | effective_dart:
47 | dependency: transitive
48 | description:
49 | name: effective_dart
50 | url: "https://pub.dartlang.org"
51 | source: hosted
52 | version: "1.3.2"
53 | ffi:
54 | dependency: transitive
55 | description:
56 | name: ffi
57 | url: "https://pub.dartlang.org"
58 | source: hosted
59 | version: "1.1.2"
60 | file:
61 | dependency: transitive
62 | description:
63 | name: file
64 | url: "https://pub.dartlang.org"
65 | source: hosted
66 | version: "6.1.2"
67 | flutter:
68 | dependency: "direct main"
69 | description: flutter
70 | source: sdk
71 | version: "0.0.0"
72 | flutter_colorpicker:
73 | dependency: transitive
74 | description:
75 | name: flutter_colorpicker
76 | url: "https://pub.dartlang.org"
77 | source: hosted
78 | version: "0.5.0"
79 | flutter_markdown:
80 | dependency: transitive
81 | description:
82 | name: flutter_markdown
83 | url: "https://pub.dartlang.org"
84 | source: hosted
85 | version: "0.6.9"
86 | flutter_svg:
87 | dependency: transitive
88 | description:
89 | name: flutter_svg
90 | url: "https://pub.dartlang.org"
91 | source: hosted
92 | version: "0.22.0"
93 | flutter_web_plugins:
94 | dependency: transitive
95 | description: flutter
96 | source: sdk
97 | version: "0.0.0"
98 | freezed_annotation:
99 | dependency: transitive
100 | description:
101 | name: freezed_annotation
102 | url: "https://pub.dartlang.org"
103 | source: hosted
104 | version: "0.14.3"
105 | js:
106 | dependency: transitive
107 | description:
108 | name: js
109 | url: "https://pub.dartlang.org"
110 | source: hosted
111 | version: "0.6.4"
112 | json_annotation:
113 | dependency: transitive
114 | description:
115 | name: json_annotation
116 | url: "https://pub.dartlang.org"
117 | source: hosted
118 | version: "4.4.0"
119 | markdown:
120 | dependency: transitive
121 | description:
122 | name: markdown
123 | url: "https://pub.dartlang.org"
124 | source: hosted
125 | version: "4.0.1"
126 | material_color_utilities:
127 | dependency: transitive
128 | description:
129 | name: material_color_utilities
130 | url: "https://pub.dartlang.org"
131 | source: hosted
132 | version: "0.1.4"
133 | meta:
134 | dependency: transitive
135 | description:
136 | name: meta
137 | url: "https://pub.dartlang.org"
138 | source: hosted
139 | version: "1.7.0"
140 | path:
141 | dependency: transitive
142 | description:
143 | name: path
144 | url: "https://pub.dartlang.org"
145 | source: hosted
146 | version: "1.8.1"
147 | path_drawing:
148 | dependency: transitive
149 | description:
150 | name: path_drawing
151 | url: "https://pub.dartlang.org"
152 | source: hosted
153 | version: "0.5.1+1"
154 | path_parsing:
155 | dependency: transitive
156 | description:
157 | name: path_parsing
158 | url: "https://pub.dartlang.org"
159 | source: hosted
160 | version: "0.2.1"
161 | path_provider_linux:
162 | dependency: transitive
163 | description:
164 | name: path_provider_linux
165 | url: "https://pub.dartlang.org"
166 | source: hosted
167 | version: "2.1.4"
168 | path_provider_platform_interface:
169 | dependency: transitive
170 | description:
171 | name: path_provider_platform_interface
172 | url: "https://pub.dartlang.org"
173 | source: hosted
174 | version: "2.0.1"
175 | path_provider_windows:
176 | dependency: transitive
177 | description:
178 | name: path_provider_windows
179 | url: "https://pub.dartlang.org"
180 | source: hosted
181 | version: "2.0.4"
182 | petitparser:
183 | dependency: transitive
184 | description:
185 | name: petitparser
186 | url: "https://pub.dartlang.org"
187 | source: hosted
188 | version: "4.4.0"
189 | platform:
190 | dependency: transitive
191 | description:
192 | name: platform
193 | url: "https://pub.dartlang.org"
194 | source: hosted
195 | version: "3.1.0"
196 | plugin_platform_interface:
197 | dependency: transitive
198 | description:
199 | name: plugin_platform_interface
200 | url: "https://pub.dartlang.org"
201 | source: hosted
202 | version: "2.0.2"
203 | process:
204 | dependency: transitive
205 | description:
206 | name: process
207 | url: "https://pub.dartlang.org"
208 | source: hosted
209 | version: "4.2.4"
210 | rows_lint:
211 | dependency: "direct dev"
212 | description:
213 | name: rows_lint
214 | url: "https://pub.dartlang.org"
215 | source: hosted
216 | version: "0.1.1"
217 | shared_preferences:
218 | dependency: transitive
219 | description:
220 | name: shared_preferences
221 | url: "https://pub.dartlang.org"
222 | source: hosted
223 | version: "2.0.11"
224 | shared_preferences_android:
225 | dependency: transitive
226 | description:
227 | name: shared_preferences_android
228 | url: "https://pub.dartlang.org"
229 | source: hosted
230 | version: "2.0.9"
231 | shared_preferences_ios:
232 | dependency: transitive
233 | description:
234 | name: shared_preferences_ios
235 | url: "https://pub.dartlang.org"
236 | source: hosted
237 | version: "2.0.8"
238 | shared_preferences_linux:
239 | dependency: transitive
240 | description:
241 | name: shared_preferences_linux
242 | url: "https://pub.dartlang.org"
243 | source: hosted
244 | version: "2.0.3"
245 | shared_preferences_macos:
246 | dependency: transitive
247 | description:
248 | name: shared_preferences_macos
249 | url: "https://pub.dartlang.org"
250 | source: hosted
251 | version: "2.0.2"
252 | shared_preferences_platform_interface:
253 | dependency: transitive
254 | description:
255 | name: shared_preferences_platform_interface
256 | url: "https://pub.dartlang.org"
257 | source: hosted
258 | version: "2.0.0"
259 | shared_preferences_web:
260 | dependency: transitive
261 | description:
262 | name: shared_preferences_web
263 | url: "https://pub.dartlang.org"
264 | source: hosted
265 | version: "2.0.2"
266 | shared_preferences_windows:
267 | dependency: transitive
268 | description:
269 | name: shared_preferences_windows
270 | url: "https://pub.dartlang.org"
271 | source: hosted
272 | version: "2.0.3"
273 | sky_engine:
274 | dependency: transitive
275 | description: flutter
276 | source: sdk
277 | version: "0.0.99"
278 | tiny_charts:
279 | dependency: "direct main"
280 | description:
281 | path: ".."
282 | relative: true
283 | source: path
284 | version: "1.0.0"
285 | typed_data:
286 | dependency: transitive
287 | description:
288 | name: typed_data
289 | url: "https://pub.dartlang.org"
290 | source: hosted
291 | version: "1.3.0"
292 | url_launcher:
293 | dependency: transitive
294 | description:
295 | name: url_launcher
296 | url: "https://pub.dartlang.org"
297 | source: hosted
298 | version: "6.0.17"
299 | url_launcher_android:
300 | dependency: transitive
301 | description:
302 | name: url_launcher_android
303 | url: "https://pub.dartlang.org"
304 | source: hosted
305 | version: "6.0.13"
306 | url_launcher_ios:
307 | dependency: transitive
308 | description:
309 | name: url_launcher_ios
310 | url: "https://pub.dartlang.org"
311 | source: hosted
312 | version: "6.0.13"
313 | url_launcher_linux:
314 | dependency: transitive
315 | description:
316 | name: url_launcher_linux
317 | url: "https://pub.dartlang.org"
318 | source: hosted
319 | version: "2.0.2"
320 | url_launcher_macos:
321 | dependency: transitive
322 | description:
323 | name: url_launcher_macos
324 | url: "https://pub.dartlang.org"
325 | source: hosted
326 | version: "2.0.2"
327 | url_launcher_platform_interface:
328 | dependency: transitive
329 | description:
330 | name: url_launcher_platform_interface
331 | url: "https://pub.dartlang.org"
332 | source: hosted
333 | version: "2.0.4"
334 | url_launcher_web:
335 | dependency: transitive
336 | description:
337 | name: url_launcher_web
338 | url: "https://pub.dartlang.org"
339 | source: hosted
340 | version: "2.0.5"
341 | url_launcher_windows:
342 | dependency: transitive
343 | description:
344 | name: url_launcher_windows
345 | url: "https://pub.dartlang.org"
346 | source: hosted
347 | version: "2.0.2"
348 | vector_math:
349 | dependency: transitive
350 | description:
351 | name: vector_math
352 | url: "https://pub.dartlang.org"
353 | source: hosted
354 | version: "2.1.2"
355 | win32:
356 | dependency: transitive
357 | description:
358 | name: win32
359 | url: "https://pub.dartlang.org"
360 | source: hosted
361 | version: "2.3.3"
362 | xdg_directories:
363 | dependency: transitive
364 | description:
365 | name: xdg_directories
366 | url: "https://pub.dartlang.org"
367 | source: hosted
368 | version: "0.2.0"
369 | xml:
370 | dependency: transitive
371 | description:
372 | name: xml
373 | url: "https://pub.dartlang.org"
374 | source: hosted
375 | version: "5.3.1"
376 | sdks:
377 | dart: ">=2.16.0-100.0.dev <3.0.0"
378 | flutter: ">=2.5.0"
379 |
--------------------------------------------------------------------------------
/example/pubspec.yaml:
--------------------------------------------------------------------------------
1 | name: example
2 | description: Tiny charts example
3 | publish_to: 'none'
4 | version: 1.0.0+1
5 |
6 | environment:
7 | sdk: ">=2.12.0 <3.0.0"
8 |
9 | dependencies:
10 | flutter:
11 | sdk: flutter
12 | tiny_charts:
13 | path: ../
14 | dashbook: ^0.1.5
15 |
16 | dev_dependencies:
17 | rows_lint: 0.1.1
18 |
19 | flutter:
20 | uses-material-design: true
21 |
22 |
--------------------------------------------------------------------------------
/lib/src/bar.dart:
--------------------------------------------------------------------------------
1 | import 'package:flutter/material.dart';
2 | import 'package:vector_math/vector_math.dart';
3 |
4 | import 'utils.dart';
5 |
6 | /// Default [TinyBarChartOptions] for [TinyBarChart.stacked] and
7 | /// [TinyBarChart.stackedFromDataVectors].
8 | const kDefaultBarChartOptions = TinyBarChartOptions(
9 | colors: [Color(0xFF000000), Color(0x55000000)],
10 | );
11 |
12 | /// A [Widget] that paints a simple bar chart.
13 | ///
14 | /// It is ideal for sparkline charts.
15 | ///
16 | /// The chart can be [TinyBarChart.single] or [TinyBarChart.stacked].
17 | /// For stacked, it is also possible to pass the data in raw vectors by using
18 | /// [TinyBarChart.stackedFromDataVectors].
19 | ///
20 | /// The chart is rendered with a series of bars each representing the y value
21 | /// of each element [dataPoints]. The bars are sorted by the x values.
22 | ///
23 | /// The bars are rendered side by side (stacked).
24 | ///
25 | /// The width of each bar represents the percentage of space occupied by the
26 | /// data point value in a data space between zero and the "max" value.
27 | /// The "max" value is equal to [options.max] or, when null, the sum of all
28 | /// bar values.
29 | ///
30 | /// If both [width] and [height] are passed, the chart will try to keep aspect
31 | /// ratio.
32 | ///
33 | /// See also:
34 | /// - [TinyBarChart.single] to build a bar chart that represents only one value.
35 | /// - [TinyBarChart.stacked] To build a bar chart of stacked bars.
36 | /// - [TinyBarChart.stackedFromDataVectors] To build a stacked bar chart from
37 | /// raw [Vector2].
38 | /// - [TinyBarChartOptions] for more details on options.
39 | class TinyBarChart extends StatelessWidget {
40 | /// A set of options to customize the chart display, defaults to
41 | /// [kDefaultBarChartOptions] when null on construction.
42 | final TinyBarChartOptions options;
43 |
44 | /// The set of vectors that represents the bars data.
45 | final Iterable dataPoints;
46 |
47 | /// If non-null, require the chart to have this width.
48 | final double? width;
49 |
50 | /// If non-null, require the chart to have this height.
51 | final double? height;
52 |
53 | /// Creates a [TinyBarChart] that represents the percentage of [value] in
54 | /// relation to [max].
55 | ///
56 | /// Defines a single element to [dataPoints] based on [value] and creates a
57 | /// [TinyBarChartOptions] based on [max] and [color].
58 | ///
59 | /// [color] defaults to [kDefaultBarChartOptions].colorOdd
60 | ///
61 | /// See also:
62 | /// - [TinyBarChart.stacked] To build a bar chart of stacked bars.
63 | /// - [TinyBarChart.stackedFromDataVectors] To build a stacked bar chart from
64 | /// raw [Vector2].
65 | factory TinyBarChart.single({
66 | Key? key,
67 | required double value,
68 | required double max,
69 | Color? color,
70 | double? width,
71 | double? height,
72 | }) {
73 | return TinyBarChart.stackedFromDataVectors(
74 | key: key,
75 | dataPoints: [
76 | Vector2(0, value),
77 | ],
78 | options: TinyBarChartOptions(
79 | max: max,
80 | colors: [color ?? kDefaultBarChartOptions.colors.first],
81 | ),
82 | width: width,
83 | height: height,
84 | );
85 | }
86 |
87 | /// Creates a [TinyBarChart] that represents the bars defined by [data].
88 | ///
89 | /// The width of each bar represents the percentage of space occupied by the
90 | /// data point value in a data space between zero and the "max" value.
91 | ///
92 | /// The "max" value is equal to [options.max] or, when null, the sum of all
93 | /// bar values.
94 | ///
95 | /// [options] defaults to [kDefaultBarChartOptions]
96 | ///
97 | /// See also:
98 | /// - [TinyBarChart.stackedFromDataVectors] To build a stacked bar chart from
99 | /// raw [Vector2].
100 | /// - [TinyBarChart.single] to build a bar chart that represents only one
101 | /// value.
102 | factory TinyBarChart.stacked({
103 | Key? key,
104 | required Iterable data,
105 | TinyBarChartOptions? options,
106 | double? width,
107 | double? height,
108 | }) {
109 | return TinyBarChart.stackedFromDataVectors(
110 | key: key,
111 | dataPoints: [
112 | for (var index = 0; index < data.length; index++)
113 | Vector2(index.toDouble(), data.elementAt(index))
114 | ],
115 | options: options,
116 | width: width,
117 | height: height,
118 | );
119 | }
120 |
121 | /// Just like [TinyBarChart.stacked] except the data is represented by a
122 | /// list of [Vector2].
123 | ///
124 | /// For each bar is based on a [Vector2], the x value represents the order of
125 | /// the data and the y value represents the actual value of the bar.
126 | ///
127 | /// See also:
128 | /// - [TinyBarChart.stacked] To build a bar chart of stacked bars.
129 | /// - [TinyBarChart.single] to build a bar chart that represents only one
130 | /// value.
131 | const TinyBarChart.stackedFromDataVectors({
132 | Key? key,
133 | required this.dataPoints,
134 | TinyBarChartOptions? options,
135 | this.width,
136 | this.height,
137 | }) : options = options ?? kDefaultBarChartOptions,
138 | super(key: key);
139 |
140 | @override
141 | Widget build(BuildContext context) {
142 | return CustomMultiChildLayout(
143 | delegate: _TinyBarChartLayoutDelegate(
144 | dataPoints: dataPoints,
145 | width: width,
146 | height: height,
147 | options: options,
148 | ),
149 | children: [
150 | for (int index = 0; index < dataPoints.length; index++)
151 | LayoutId(
152 | id: index,
153 | child: Tooltip(
154 | message: dataPoints.elementAt(index).y.toStringAsFixed(2),
155 | child: ColoredBox(
156 | color: options.colors.elementAt(index % options.colors.length),
157 | ),
158 | ),
159 | )
160 | ],
161 | );
162 | }
163 | }
164 |
165 | class _TinyBarChartLayoutDelegate extends MultiChildLayoutDelegate {
166 | final double? width;
167 | final double? height;
168 | final Iterable dataPoints;
169 | final TinyBarChartOptions options;
170 |
171 | _TinyBarChartLayoutDelegate({
172 | required this.dataPoints,
173 | required this.width,
174 | required this.height,
175 | required this.options,
176 | });
177 |
178 | @override
179 | Size getSize(BoxConstraints constraints) {
180 | return defineTinyChartSize(
181 | constraints: constraints,
182 | width: width,
183 | height: height,
184 | );
185 | }
186 |
187 | @override
188 | void performLayout(Size size) {
189 | // First sort the data points
190 | final sortedDataPoints = dataPoints.toList()
191 | ..sort(
192 | (a, b) => a.x.compareTo(b.x),
193 | );
194 |
195 | // Then tet the actual max value.
196 | final effectiveMax = options.max ??
197 | sortedDataPoints.fold(
198 | 0.0,
199 | (previousValue, element) => previousValue + element.y.abs(),
200 | );
201 |
202 | var valueAcc = 0.0;
203 | var sizeAcc = 0.0;
204 | var index = 0;
205 | for (final dataPoint in sortedDataPoints) {
206 | // When already outside the max value, position and layout with minimal
207 | // dimensions.
208 | if (valueAcc >= effectiveMax) {
209 | layoutChild(index, BoxConstraints.tight(Size.zero));
210 |
211 | positionChild(index, Offset.zero);
212 | index++;
213 | continue;
214 | }
215 |
216 | final absY = dataPoint.y.abs();
217 |
218 | final double width;
219 | if ((valueAcc + absY) > effectiveMax) {
220 | // when extrapolating max, just paint the remaining space
221 | width = size.width - sizeAcc;
222 | } else {
223 | // get the bar value converted to pixels
224 | width = calculatePhysicalPositionFromDataPosition(
225 | dataPoint: dataPoint.y.abs(),
226 | dataSpaceStart: 0,
227 | dataSpaceEnd: effectiveMax,
228 | physicalExtent: size.width,
229 | );
230 | }
231 |
232 | layoutChild(
233 | index,
234 | BoxConstraints.tightFor(width: width, height: size.height),
235 | );
236 |
237 | positionChild(
238 | index,
239 | Offset(sizeAcc, 0.0),
240 | );
241 |
242 | valueAcc += absY;
243 | sizeAcc += width;
244 | index++;
245 | }
246 | }
247 |
248 | @override
249 | bool shouldRelayout(covariant MultiChildLayoutDelegate oldDelegate) {
250 | return oldDelegate is! _TinyBarChartLayoutDelegate ||
251 | oldDelegate.runtimeType != _TinyBarChartLayoutDelegate ||
252 | width != oldDelegate.width ||
253 | height != oldDelegate.height ||
254 | !kIterableVectorEquality.equals(dataPoints, oldDelegate.dataPoints) ||
255 | options.max != oldDelegate.options.max;
256 | }
257 | }
258 |
259 | /// A set of options to customize a [TinyBarChart] display.
260 | ///
261 | /// Specify [max] to customize the data space in which the chart will paint the
262 | /// bars.
263 | ///
264 | /// When omitted, the chart will consider the space between zero and the sum of
265 | /// all bar values as the as the data space.
266 | ///
267 | /// See also:
268 | /// - [TinyBarChart.options] the field that receives these options.
269 | @immutable
270 | class TinyBarChartOptions {
271 | /// Specify [max] to customize the data space in which the chart will paint
272 | /// the bars.
273 | ///
274 | /// When omitted, the chart will consider the space between zero and the sum
275 | /// of all bar values as the as the data space.
276 | final double? max;
277 |
278 | /// Customize the colors of bars. The color of each bar selection will cycle
279 | /// though this field.
280 | final Iterable colors;
281 |
282 | const TinyBarChartOptions({
283 | this.max,
284 | required this.colors,
285 | });
286 |
287 | @override
288 | bool operator ==(Object other) =>
289 | identical(this, other) ||
290 | other is TinyBarChartOptions &&
291 | runtimeType == other.runtimeType &&
292 | max == other.max &&
293 | kIterableColorEquality.equals(colors, other.colors);
294 |
295 | @override
296 | int get hashCode => max.hashCode ^ colors.hashCode;
297 | }
298 |
--------------------------------------------------------------------------------
/lib/src/column.dart:
--------------------------------------------------------------------------------
1 | import 'dart:math';
2 |
3 | import 'package:flutter/material.dart';
4 | import 'package:vector_math/vector_math.dart';
5 |
6 | import 'utils.dart';
7 |
8 | var _kAxisLayoutId = 'axis';
9 |
10 | /// Default [TinyColumnChartOptions] for [new TinyColumnChart] and
11 | /// [TinyColumnChart.fromDataVectors].
12 | const kDefaultColumnChartOptions = TinyColumnChartOptions(
13 | positiveColor: Color(0xFF27A083),
14 | negativeColor: Color(0xFFE92F3C),
15 | );
16 |
17 | /// A [Widget] that paints a simple column chart.
18 | ///
19 | /// It is ideal for sparkline charts.
20 | ///
21 | /// The data can be provided by a list of double values by `vector_math`'s
22 | /// [Vector2]. Then that is the case, the x value in each vector represents the
23 | /// column order and the y represents the value.
24 | ///
25 | /// The chart renders each column with its respective value. Negative columns
26 | /// are rendered in a specific color with (if specified) an axis line in thee
27 | /// position equal to zero.
28 | ///
29 | /// If both [width] and [height] are passed, the chart will try to keep aspect
30 | /// ratio.
31 | ///
32 | /// To customize things like column colors and axis line visibility, see
33 | /// [options].
34 | ///
35 | /// See also:
36 | /// - [new TinyColumnChart] to build a column chart based on a list of numbers.
37 | /// = [TinyColumnChart.fromDataVectors] to build a column chart based on a
38 | /// list of [Vector2].
39 | /// - [TinyColumnChartOptions] for more details on options.
40 | class TinyColumnChart extends StatefulWidget {
41 | /// A set of options to customize the chart display, defaults to
42 | /// [kDefaultColumnChartOptions] when null on construction.
43 | final TinyColumnChartOptions options;
44 |
45 | /// The set of vectors that represents the columns data.
46 | final Iterable dataPoints;
47 |
48 | /// If non-null, require the chart to have this width.
49 | final double? width;
50 |
51 | /// If non-null, require the chart to have this height.
52 | final double? height;
53 |
54 | /// Creates a [TinyColumnChart] from a [Iterable] of [double].
55 | ///
56 | /// [dataPoints] will be converted and saved into [TinyLineChart.dataPoints]
57 | /// as a [Vector2] list.
58 | ///
59 | /// See also:
60 | /// = [TinyColumnChart.fromDataVectors] to build a column chart based on a
61 | /// list of [Vector2].
62 | factory TinyColumnChart({
63 | Key? key,
64 | required Iterable data,
65 | TinyColumnChartOptions? options,
66 | double? width,
67 | double? height,
68 | }) {
69 | return TinyColumnChart.fromDataVectors(
70 | key: key,
71 | dataPoints: [
72 | for (var index = 0; index < data.length; index++)
73 | Vector2(index.toDouble(), data.elementAt(index))
74 | ],
75 | options: options,
76 | width: width,
77 | height: height,
78 | );
79 | }
80 |
81 | /// Creates a [TinyLineChart] from a [Iterable] of [Vector2].
82 | ///
83 | /// The x value in each vector represents the column order and the
84 | /// y represents its value.
85 | const TinyColumnChart.fromDataVectors({
86 | Key? key,
87 | required this.dataPoints,
88 | TinyColumnChartOptions? options,
89 | this.width,
90 | this.height,
91 | }) : options = options ?? kDefaultColumnChartOptions,
92 | super(key: key);
93 |
94 | @override
95 | State createState() => _TinyColumnChartState();
96 | }
97 |
98 | class _TinyColumnChartState extends State {
99 | late List sortedColumns;
100 | late double positiveAxisHeight;
101 | double lowestValue = double.infinity;
102 | double highestValue = -double.infinity;
103 |
104 | @override
105 | void initState() {
106 | super.initState();
107 | updateColumns();
108 | }
109 |
110 | @override
111 | void didUpdateWidget(covariant TinyColumnChart oldWidget) {
112 | super.didUpdateWidget(oldWidget);
113 | updateColumns();
114 | }
115 |
116 | void updateColumns() {
117 | final sortedColumns = widget.dataPoints.toList()
118 | ..sort(
119 | (a, b) => a.x.compareTo(b.x),
120 | );
121 |
122 | var lowestValue = double.infinity;
123 | var highestValue = -double.infinity;
124 | final lowColor = widget.options.lowestColor;
125 | final highColor = widget.options.highestColor;
126 |
127 | // Only compute the boundary values when boundary colors are specified.
128 | if (lowColor != null || highColor != null) {
129 | for (final column in sortedColumns) {
130 | lowestValue = min(lowestValue, column.y);
131 | highestValue = max(highestValue, column.y);
132 | }
133 | }
134 |
135 | setState(() {
136 | this.sortedColumns = sortedColumns;
137 | this.lowestValue = lowestValue;
138 | this.highestValue = highestValue;
139 | });
140 | }
141 |
142 | @override
143 | Widget build(BuildContext context) {
144 | return CustomMultiChildLayout(
145 | delegate: _TinyColumnChartLayoutDelegate(
146 | sortedColumns: sortedColumns,
147 | width: widget.width,
148 | height: widget.height,
149 | options: widget.options,
150 | ),
151 | children: [
152 | for (int index = 0; index < sortedColumns.length; index++)
153 | LayoutId(
154 | id: index,
155 | child: Tooltip(
156 | message: sortedColumns.elementAt(index).y.toStringAsFixed(2),
157 | child: CustomPaint(
158 | painter: _TinyColumnChartPaintDelegate(
159 | options: widget.options,
160 | dataPoint: sortedColumns.elementAt(index),
161 | index: index,
162 | columnsCount: sortedColumns.length,
163 | lowestValue: lowestValue,
164 | highestValue: highestValue,
165 | ),
166 | ),
167 | ),
168 | ),
169 | if (widget.options.showAxis == true)
170 | LayoutId(
171 | id: _kAxisLayoutId,
172 | child: ColoredBox(
173 | color: widget.options.axisColor,
174 | ),
175 | )
176 | ],
177 | );
178 | }
179 | }
180 |
181 | class _TinyColumnChartLayoutDelegate extends MultiChildLayoutDelegate {
182 | final double? width;
183 | final double? height;
184 | final Iterable sortedColumns;
185 | final TinyColumnChartOptions options;
186 | late final Aabb2 limits;
187 |
188 | _TinyColumnChartLayoutDelegate({
189 | required this.sortedColumns,
190 | required this.options,
191 | this.width,
192 | this.height,
193 | }) {
194 | limits = getEffectiveLimits();
195 | }
196 |
197 | double positiveSpaceHeight = 0;
198 | double negativeSpaceHeight = 0;
199 |
200 | /// Get he effective limits given the limits recovered from the data points
201 | /// passed to [options].
202 | Aabb2 getEffectiveLimits() {
203 | final dataLimits = aabb2FromVectors(sortedColumns) ?? Aabb2();
204 | var minLimit = options.minLimit ?? dataLimits.min.y;
205 |
206 | var maxLimit = options.maxLimit ?? dataLimits.max.y;
207 |
208 | if (minLimit > maxLimit) {
209 | minLimit = 0;
210 | maxLimit = 0;
211 | }
212 |
213 | return Aabb2.minMax(
214 | Vector2(0, minLimit),
215 | Vector2(0, maxLimit),
216 | );
217 | }
218 |
219 | @override
220 | Size getSize(BoxConstraints constraints) {
221 | final width = this.width;
222 | final height = this.height;
223 |
224 | final size = defineTinyChartSize(
225 | constraints: constraints,
226 | width: width,
227 | height: height,
228 | );
229 | definePositiveAndNegativeSpaces(size);
230 | return size;
231 | }
232 |
233 | /// From the actual widget size, define which portion of that is occupied by
234 | /// either psitive and negative columns.
235 | void definePositiveAndNegativeSpaces(Size size) {
236 | final positiveAxisSize = max(0.0, limits.max.y);
237 | final negativeAxisSize = min(limits.min.y, 0.0).abs();
238 |
239 | final dataExtent = positiveAxisSize + negativeAxisSize;
240 |
241 | if (dataExtent == 0) {
242 | positiveSpaceHeight = 0;
243 | negativeSpaceHeight = 0;
244 | return;
245 | }
246 |
247 | final positiveAxisPercentage = positiveAxisSize / dataExtent;
248 | final negativeAxisPercentage = negativeAxisSize / dataExtent;
249 |
250 | positiveSpaceHeight = positiveAxisPercentage * size.height;
251 | negativeSpaceHeight = negativeAxisPercentage * size.height;
252 | }
253 |
254 | /// Define the height of a [column] given the current [positiveSpaceHeight]
255 | /// and [negativeSpaceHeight].
256 | double getColumnHeight(Vector2 column) {
257 | final minLimit = limits.min.y;
258 | final maxLimit = limits.max.y;
259 | if (minLimit == 0 && maxLimit == 0) {
260 | return 0;
261 | }
262 |
263 | final value = column.y;
264 |
265 | if (positiveSpaceHeight > 0 && value > 0) {
266 | if (value >= maxLimit) {
267 | return positiveSpaceHeight;
268 | }
269 | if (value == minLimit) {
270 | return 1;
271 | }
272 | if (value < minLimit) {
273 | return 0;
274 | }
275 |
276 | final positiveMin = max(0.0, minLimit);
277 | final positiveMax = max(0.0, maxLimit);
278 |
279 | return calculatePhysicalPositionFromDataPosition(
280 | dataPoint: value,
281 | dataSpaceStart: positiveMin,
282 | dataSpaceEnd: positiveMax,
283 | physicalExtent: positiveSpaceHeight,
284 | );
285 | }
286 |
287 | if (negativeSpaceHeight > 0 && value < 0) {
288 | if (value <= minLimit) {
289 | return -negativeSpaceHeight;
290 | }
291 | if (value == maxLimit) {
292 | return -1;
293 | }
294 | if (value > maxLimit) {
295 | return 0;
296 | }
297 |
298 | final negativeMin = min(0.0, minLimit);
299 | final negativeMax = min(0.0, maxLimit);
300 |
301 | return -calculatePhysicalPositionFromDataPosition(
302 | dataPoint: value.abs(),
303 | dataSpaceStart: negativeMax.abs(),
304 | dataSpaceEnd: negativeMin.abs(),
305 | physicalExtent: negativeSpaceHeight,
306 | );
307 | }
308 |
309 | return 0;
310 | }
311 |
312 | @override
313 | void performLayout(Size size) {
314 | if (sortedColumns.isEmpty) {
315 | return;
316 | }
317 |
318 | final width = size.width;
319 | final isSingleColumn = sortedColumns.length == 1;
320 | final columnWidth =
321 | isSingleColumn ? width : (width * 0.8) / sortedColumns.length;
322 |
323 | final spacingWidth =
324 | isSingleColumn ? 0 : (width * 0.2) / (sortedColumns.length - 1);
325 |
326 | // Layout and position each column
327 | for (var index = 0; index < sortedColumns.length; index++) {
328 | final column = sortedColumns.elementAt(index);
329 | final columnHeight = getColumnHeight(column);
330 |
331 | layoutChild(
332 | index,
333 | BoxConstraints.tightFor(width: columnWidth, height: columnHeight.abs()),
334 | );
335 |
336 | // Get the vertical position of the column given its height.
337 | final y = column.y <= 0
338 | ? positiveSpaceHeight
339 | : positiveSpaceHeight - columnHeight;
340 |
341 | positionChild(
342 | index,
343 | Offset(index * (columnWidth + spacingWidth), y),
344 | );
345 | }
346 |
347 | // Layout and position the axis line if specified by options
348 | if (options.showAxis == true) {
349 | layoutChild(
350 | _kAxisLayoutId,
351 | BoxConstraints.tightFor(width: size.width, height: 1),
352 | );
353 | positionChild(
354 | _kAxisLayoutId,
355 | Offset(0, positiveSpaceHeight.clamp(0, (size.height - 1).abs())),
356 | );
357 | }
358 | }
359 |
360 | @override
361 | bool shouldRelayout(covariant MultiChildLayoutDelegate oldDelegate) {
362 | return oldDelegate is! _TinyColumnChartLayoutDelegate ||
363 | runtimeType != oldDelegate.runtimeType ||
364 | width != oldDelegate.width ||
365 | height == oldDelegate.height ||
366 | !kIterableVectorEquality.equals(
367 | sortedColumns,
368 | oldDelegate.sortedColumns,
369 | ) ||
370 | options == oldDelegate.options;
371 | }
372 | }
373 |
374 | @immutable
375 | class _TinyColumnChartPaintDelegate extends CustomPainter {
376 | final TinyColumnChartOptions options;
377 |
378 | final Vector2 dataPoint;
379 | final int index;
380 |
381 | final int columnsCount;
382 | final double lowestValue;
383 | final double highestValue;
384 |
385 | const _TinyColumnChartPaintDelegate({
386 | required this.options,
387 | required this.dataPoint,
388 | required this.index,
389 | required this.columnsCount,
390 | required this.lowestValue,
391 | required this.highestValue,
392 | });
393 |
394 | Color get color {
395 | final value = dataPoint.y;
396 |
397 | final lowColor = options.lowestColor;
398 | if (lowColor != null && value <= lowestValue) {
399 | return lowColor;
400 | }
401 |
402 | final highColor = options.highestColor;
403 | if (highColor != null && value >= highestValue) {
404 | return highColor;
405 | }
406 |
407 | final firstColor = options.firstColor;
408 | if (firstColor != null && index == 0) {
409 | return firstColor;
410 | }
411 |
412 | final lastColor = options.lastColor;
413 | if (lastColor != null && index == columnsCount - 1) {
414 | return lastColor;
415 | }
416 |
417 | if (value < 0) {
418 | return options.negativeColor;
419 | }
420 |
421 | return options.positiveColor;
422 | }
423 |
424 | @override
425 | void paint(Canvas canvas, Size size) {
426 | final rect = Rect.fromLTWH(
427 | 0,
428 | 0,
429 | size.width,
430 | size.height,
431 | );
432 |
433 | canvas.drawRect(rect, Paint()..color = color);
434 | }
435 |
436 | @override
437 | bool shouldRepaint(covariant CustomPainter oldDelegate) {
438 | return this != oldDelegate;
439 | }
440 |
441 | @override
442 | bool operator ==(Object other) =>
443 | identical(this, other) ||
444 | other is _TinyColumnChartPaintDelegate &&
445 | runtimeType == other.runtimeType &&
446 | options == other.options &&
447 | dataPoint == other.dataPoint &&
448 | index == other.index &&
449 | columnsCount == other.columnsCount &&
450 | lowestValue == other.lowestValue &&
451 | highestValue == other.highestValue;
452 |
453 | @override
454 | int get hashCode =>
455 | options.hashCode ^
456 | dataPoint.hashCode ^
457 | index.hashCode ^
458 | columnsCount.hashCode ^
459 | lowestValue.hashCode ^
460 | highestValue.hashCode;
461 | }
462 |
463 | /// A set of options to customize a [TinyColumnChart] display.
464 | ///
465 | /// ## Limits
466 | /// Specify [yminLimit], [maxLimit] to customize the data space in which the
467 | /// chart will paint.
468 | ///
469 | /// Any of these parameters, when omitted, will default to the minimum or
470 | /// maximum y value in the coordinates passed to [TinyColumnChart.dataPoints].
471 | ///
472 | /// See also:
473 | /// - [TinyColumnChart.options] the field that receives these options.
474 | @immutable
475 | class TinyColumnChartOptions {
476 | /// Customize the data space in which the chart will paint.
477 | ///
478 | /// This marks the starting point of the data in which the chart paints in
479 | /// the vertical axis.
480 | ///
481 | /// If omitted, defaults to the lowest y found in the data points passed
482 | /// to [TinyColumnChart.dataPoints].
483 | final double? minLimit;
484 |
485 | /// Customize the data space in which the chart will paint.
486 | ///
487 | /// This marks the trailing point of the data in which the chart paints in
488 | /// the vertical axis.
489 | ///
490 | /// If omitted, defaults to the highest y found in the data points passed
491 | /// to [TinyColumnChart.dataPoints].
492 | final double? maxLimit;
493 |
494 | /// The default color of columns with positive values.
495 | ///
496 | /// Fallback to [lowestColor], [highestColor], [firstColor] and [lastColor].
497 | final Color positiveColor;
498 |
499 | /// The default color of columns with negative values.
500 | ///
501 | /// Fallback to [lowestColor], [highestColor], [firstColor] and [lastColor].
502 | final Color negativeColor;
503 |
504 | /// The color of columns with values equals or smaller than [minLimit] or the
505 | /// lowest y value on [TinyColumnChart.dataPoints]
506 | ///
507 | /// Takes precedence over [highestColor], [firstColor], [lastColor],
508 | /// [negativeColor] and [positiveColor].
509 | final Color? lowestColor;
510 |
511 | /// The color of columns with values equals or bigger than [maxLimit] or the
512 | /// highest y value on [TinyColumnChart.dataPoints]
513 | ///
514 | /// Takes precedence over [firstColor], [lastColor], [negativeColor]
515 | /// and [positiveColor].
516 | final Color? highestColor;
517 |
518 | /// The color of the fist column.
519 | ///
520 | /// Takes precedence over [lastColor], [negativeColor] and [positiveColor].
521 | final Color? firstColor;
522 |
523 | /// The color of the last column.
524 | ///
525 | /// Takes precedence over [negativeColor] and [positiveColor].
526 | final Color? lastColor;
527 |
528 | /// Defines if the line representing the x axis should be painted.
529 | ///
530 | /// Defaults to `false`.
531 | final bool showAxis;
532 |
533 | /// The color of the axis line, if visible.
534 | ///
535 | /// Defaults to black.
536 | final Color axisColor;
537 |
538 | const TinyColumnChartOptions({
539 | this.minLimit,
540 | this.maxLimit,
541 | required this.positiveColor,
542 | required this.negativeColor,
543 | this.lowestColor,
544 | this.highestColor,
545 | this.firstColor,
546 | this.lastColor,
547 | this.showAxis = false,
548 | this.axisColor = const Color(0xFF000000),
549 | });
550 |
551 | @override
552 | bool operator ==(Object other) =>
553 | identical(this, other) ||
554 | other is TinyColumnChartOptions &&
555 | runtimeType == other.runtimeType &&
556 | minLimit == other.minLimit &&
557 | maxLimit == other.maxLimit &&
558 | positiveColor == other.positiveColor &&
559 | lowestColor == other.lowestColor &&
560 | highestColor == other.highestColor &&
561 | firstColor == other.firstColor &&
562 | lastColor == other.lastColor &&
563 | negativeColor == other.negativeColor &&
564 | showAxis == other.showAxis &&
565 | axisColor == other.axisColor;
566 |
567 | @override
568 | int get hashCode =>
569 | minLimit.hashCode ^
570 | maxLimit.hashCode ^
571 | positiveColor.hashCode ^
572 | lowestColor.hashCode ^
573 | highestColor.hashCode ^
574 | firstColor.hashCode ^
575 | lastColor.hashCode ^
576 | negativeColor.hashCode ^
577 | showAxis.hashCode ^
578 | axisColor.hashCode;
579 | }
580 |
--------------------------------------------------------------------------------
/lib/src/line.dart:
--------------------------------------------------------------------------------
1 | import 'package:flutter/widgets.dart';
2 | import 'package:vector_math/vector_math.dart';
3 |
4 | import 'utils.dart';
5 |
6 | /// Default [TinyLineChartOptions] for [new TinyLineChart] and
7 | /// [TinyLineChart.fromDataVectors].
8 | const kDefaultLineChartOptions = TinyLineChartOptions(
9 | color: Color(0xFF000000),
10 | lineWidth: 1,
11 | );
12 |
13 | /// A [Widget] that paints a simple line chart.
14 | ///
15 | /// It is ideal for sparkline charts.
16 | ///
17 | /// The data can be provided by a list of coordinates that can be
18 | /// represented by either flutter's [Offset] or by `vector_math`'s [Vector2].
19 | ///
20 | /// The line will be draw using [dataPoints] as vertices. The data space to be
21 | /// painted by the chart can be bounded by passing the limits to [options].
22 | ///
23 | /// For example, if [options.xMaxLimit] is passed, the line chart will be
24 | /// painted in such a way that any data point beyond that limit will not be
25 | /// painted.
26 | ///
27 | /// If both [width] and [height] are passed, the chart will try to keep aspect
28 | /// ratio.
29 | ///
30 | /// See also:
31 | /// - [new TinyLineChart] to build a line chart using [Offset]
32 | /// - [TinyLineChart.fromDataVectors] to build a line chart using [Vector2]
33 | /// - [TinyLineChartOptions] for more details on options.
34 | class TinyLineChart extends StatelessWidget {
35 | /// A set of options to customize the chart display, defaults to
36 | /// [kDefaultLineChartOptions] when null on construction.
37 | final TinyLineChartOptions options;
38 |
39 | /// The set of coordinates that represents the vertices of the line path.
40 | final Iterable dataPoints;
41 |
42 | /// If non-null, require the chart to have this width.
43 | final double? width;
44 |
45 | /// If non-null, require the chart to have this height.
46 | final double? height;
47 |
48 | /// Creates a [TinyLineChart] from a [Iterable] of [Offset].
49 | ///
50 | /// [dataPoints] will be converted and saved into [TinyLineChart.dataPoints]
51 | /// as a [Vector2] list.
52 | factory TinyLineChart({
53 | Key? key,
54 | required Iterable dataPoints,
55 | TinyLineChartOptions? options,
56 | double? width,
57 | double? height,
58 | }) {
59 | return TinyLineChart.fromDataVectors(
60 | key: key,
61 | dataPoints: dataPoints.map((point) => Vector2(point.dx, point.dy)),
62 | options: options,
63 | width: width,
64 | height: height,
65 | );
66 | }
67 |
68 | /// Creates a [TinyLineChart] from a [Iterable] of [Vector2].
69 | const TinyLineChart.fromDataVectors({
70 | Key? key,
71 | required this.dataPoints,
72 | TinyLineChartOptions? options,
73 | this.width,
74 | this.height,
75 | }) : options = options ?? kDefaultLineChartOptions,
76 | super(key: key);
77 |
78 | @override
79 | Widget build(BuildContext context) {
80 | return LayoutBuilder(
81 | builder: (context, constraints) {
82 | return CustomPaint(
83 | painter: _TinyLineChartPaintDelegate(
84 | dataPoints: dataPoints,
85 | options: options,
86 | ),
87 | size: defineTinyChartSize(
88 | constraints: constraints,
89 | width: width,
90 | height: height,
91 | ),
92 | );
93 | },
94 | );
95 | }
96 | }
97 |
98 | /// A [CustomPainter] that paints a [Path] connecting each element of
99 | /// [dataPoints] in a space delimited by the values itself or the limits
100 | /// specified by [TinyLineChartOptions]
101 | @immutable
102 | class _TinyLineChartPaintDelegate extends CustomPainter {
103 | final TinyLineChartOptions options;
104 | final Iterable dataPoints;
105 |
106 | const _TinyLineChartPaintDelegate({
107 | required this.options,
108 | required this.dataPoints,
109 | });
110 |
111 | /// Convert a [Vector2] that represents a data point with data values to an
112 | /// offset that actually represents the relative pixel coordinate in the
113 | /// canvas.
114 | Offset vectorToOffset(
115 | Vector2 value,
116 | Aabb2 limits,
117 | Size size,
118 | ) {
119 | final relative = (value - limits.min)..divide(limits.max - limits.min);
120 |
121 | late double x;
122 | if (limits.min.x == limits.max.x) {
123 | x = size.width / 2;
124 | } else {
125 | x = size.width * relative.x;
126 | }
127 |
128 | late double y;
129 | if (limits.min.y == limits.max.y) {
130 | y = size.height / 2;
131 | } else {
132 | y = size.height - (size.height * relative.y);
133 | }
134 |
135 | return Offset(x, y);
136 | }
137 |
138 | /// Get he effective limits given the limits recovered from the data points
139 | /// passed to [options].
140 | Aabb2 getEffectiveLimits() {
141 | final dataLimits = aabb2FromVectors(dataPoints) ?? Aabb2();
142 |
143 | var xMin = options.xMinLimit ?? dataLimits.min.x;
144 | var yMin = options.yMinLimit ?? dataLimits.min.y;
145 |
146 | var xMax = options.xMaxLimit ?? dataLimits.max.x;
147 | var yMax = options.yMaxLimit ?? dataLimits.max.y;
148 |
149 | // When max and min limits clash between options and data,
150 | // reduce everything from that axis to zero.
151 |
152 | if (xMin > xMax) {
153 | xMin = 0;
154 | xMax = 0;
155 | }
156 |
157 | if (yMin > yMax) {
158 | yMin = 0;
159 | yMax = 0;
160 | }
161 |
162 | return Aabb2.minMax(
163 | Vector2(xMin, yMin),
164 | Vector2(xMax, yMax),
165 | );
166 | }
167 |
168 | @override
169 | void paint(Canvas canvas, Size size) {
170 | if (dataPoints.isEmpty) {
171 | return;
172 | }
173 |
174 | final limits = getEffectiveLimits();
175 |
176 | final dataOffsets = dataPoints
177 | .map((dataPoint) => vectorToOffset(dataPoint, limits, size));
178 |
179 | final initialOffset = dataOffsets.first;
180 | final path = Path()..moveTo(initialOffset.dx, initialOffset.dy);
181 |
182 | for (final dataOffset in dataOffsets) {
183 | path.lineTo(dataOffset.dx, dataOffset.dy);
184 | }
185 |
186 | final paint = Paint()
187 | ..style = PaintingStyle.stroke
188 | ..strokeWidth = options.lineWidth
189 | ..color = options.color;
190 | canvas.drawPath(path, paint);
191 | }
192 |
193 | @override
194 | bool shouldRepaint(covariant CustomPainter oldDelegate) {
195 | return oldDelegate != this;
196 | }
197 |
198 | @override
199 | bool operator ==(Object other) =>
200 | identical(this, other) ||
201 | other is _TinyLineChartPaintDelegate &&
202 | runtimeType == other.runtimeType &&
203 | options == other.options &&
204 | kIterableVectorEquality.equals(dataPoints, other.dataPoints);
205 |
206 | @override
207 | int get hashCode => options.hashCode ^ dataPoints.hashCode;
208 | }
209 |
210 | /// A set of options to customize a [TinyLineChart] display.
211 | ///
212 | /// ## Limits
213 | /// Specify [xMinLimit], [yMinLimit], [xMaxLimit] or [yMaxLimit] to customize
214 | /// the data space in which the chart will paint.
215 | ///
216 | /// Any of these parameters, when omitted, will default to the minimum or
217 | /// maximum value in the coordinates passed to [TinyLineChart.dataPoints].
218 | ///
219 | /// See also:
220 | /// - [TinyLineChart.options] the field that receives these options.
221 | @immutable
222 | class TinyLineChartOptions {
223 | /// Customize the data space in which the chart will paint.
224 | ///
225 | /// This marks the starting point of the data in which the chart paints in
226 | /// the horizontal axis.
227 | ///
228 | /// If omitted, defaults to the lowest x found in the data points passed
229 | /// to [TinyLineChart.dataPoints].
230 | final double? xMinLimit;
231 |
232 | /// Customize the data space in which the chart will paint.
233 | ///
234 | /// This marks the starting point of the data in which the chart paints in
235 | /// the vertical axis.
236 | ///
237 | /// If omitted, defaults to the lowest y found in the data points passed
238 | /// to [TinyLineChart.dataPoints].
239 | final double? yMinLimit;
240 |
241 | /// Customize the data space in which the chart will paint.
242 | ///
243 | /// This marks the trailing point of the data in which the chart paints in
244 | /// the horizontal axis.
245 | ///
246 | /// If omitted, defaults to the highest x found in the data points passed
247 | /// to [TinyLineChart.dataPoints].
248 | final double? xMaxLimit;
249 |
250 | /// Customize the data space in which the chart will paint.
251 | ///
252 | /// This marks the trailing point of the data in which the chart paints in
253 | /// the vertical axis.
254 | ///
255 | /// If omitted, defaults to the highest y found in the data points passed
256 | /// to [TinyLineChart.dataPoints].
257 | final double? yMaxLimit;
258 |
259 | /// Customize the line color.
260 | final Color color;
261 |
262 | /// Customize the width of the line.
263 | final double lineWidth;
264 |
265 | const TinyLineChartOptions({
266 | this.xMinLimit,
267 | this.yMinLimit,
268 | this.xMaxLimit,
269 | this.yMaxLimit,
270 | required this.color,
271 | required this.lineWidth,
272 | }) : assert(
273 | xMinLimit == null || xMaxLimit == null || xMinLimit <= xMaxLimit,
274 | ),
275 | assert(
276 | yMinLimit == null || yMaxLimit == null || yMinLimit <= yMaxLimit,
277 | );
278 |
279 | @override
280 | bool operator ==(Object other) =>
281 | identical(this, other) ||
282 | other is TinyLineChartOptions &&
283 | runtimeType == other.runtimeType &&
284 | xMinLimit == other.xMinLimit &&
285 | xMaxLimit == other.xMaxLimit &&
286 | yMinLimit == other.yMinLimit &&
287 | yMaxLimit == other.yMaxLimit &&
288 | color == other.color &&
289 | lineWidth == other.lineWidth;
290 |
291 | @override
292 | int get hashCode =>
293 | xMinLimit.hashCode ^
294 | xMaxLimit.hashCode ^
295 | yMinLimit.hashCode ^
296 | yMaxLimit.hashCode ^
297 | color.hashCode ^
298 | lineWidth.hashCode;
299 | }
300 |
--------------------------------------------------------------------------------
/lib/src/utils.dart:
--------------------------------------------------------------------------------
1 | import 'dart:math';
2 |
3 | import 'package:collection/collection.dart';
4 | import 'package:flutter/rendering.dart';
5 | import 'package:vector_math/vector_math.dart';
6 |
7 | const kIterableVectorEquality = IterableEquality();
8 | const kIterableColorEquality = IterableEquality();
9 |
10 | /// Position [dataPoint] on [physicalExtent] given its value compared to
11 | /// [dataSpaceStart] and [dataSpaceEnd].
12 | double calculatePhysicalPositionFromDataPosition({
13 | required double dataPoint,
14 | required double dataSpaceStart,
15 | required double dataSpaceEnd,
16 | required double physicalExtent,
17 | }) {
18 | if (dataSpaceEnd == dataSpaceStart) {
19 | return physicalExtent / 2;
20 | }
21 |
22 | final relative =
23 | ((dataPoint - dataSpaceStart) / (dataSpaceEnd - dataSpaceStart))
24 | .clamp(0.0, 1.0);
25 |
26 | return physicalExtent * relative;
27 | }
28 |
29 | /// Define the actual size of a tiny chart widget given the constraints and
30 | /// [width] and [height] passed to the widget.
31 | ///
32 | /// Tries to keep aspect ratio when both [width] and [height] are specified.
33 | Size defineTinyChartSize({
34 | required BoxConstraints constraints,
35 | required double? width,
36 | required double? height,
37 | }) {
38 | final localConstraints = BoxConstraints.tightFor(
39 | width: width,
40 | height: height,
41 | ).enforce(constraints);
42 |
43 | if (width == null || height == null) {
44 | // since localConstraints is tight,
45 | // smallest is the same as biggest.
46 | return localConstraints.smallest;
47 | }
48 |
49 | return localConstraints.constrainSizeAndAttemptToPreserveAspectRatio(
50 | Size(width, height),
51 | );
52 | }
53 |
54 | /// Create an [Aabb2] that represents a rectangle that includes all [vectors]
55 | /// in the most compact way possible.
56 | ///
57 | /// Returns null if [vectors] is empty.
58 | Aabb2? aabb2FromVectors(Iterable vectors) {
59 | if (vectors.isEmpty) {
60 | return null;
61 | }
62 | final firstVector = vectors.first;
63 | return vectors.fold(
64 | Aabb2.minMax(firstVector, firstVector),
65 | (previousValue, nextVector) {
66 | final previousMin = previousValue.min;
67 | final previousMax = previousValue.max;
68 | return Aabb2.minMax(
69 | Vector2(
70 | min(previousMin.x, nextVector.x),
71 | min(previousMin.y, nextVector.y),
72 | ),
73 | Vector2(
74 | max(previousMax.x, nextVector.x),
75 | max(previousMax.y, nextVector.y),
76 | ),
77 | );
78 | },
79 | );
80 | }
81 |
--------------------------------------------------------------------------------
/lib/tiny_charts.dart:
--------------------------------------------------------------------------------
1 | library tiny_charts;
2 |
3 | export 'src/bar.dart';
4 | export 'src/column.dart';
5 | export 'src/line.dart';
6 |
--------------------------------------------------------------------------------
/pubspec.yaml:
--------------------------------------------------------------------------------
1 | name: tiny_charts
2 | description: Render sparkline charts for fast data visualization on Flutter apps.
3 | version: 0.1.0
4 | repository: https://github.com/rows/tiny_charts
5 | issue_tracker: https://github.com/rows/tiny_charts/issues
6 | homepage: https://github.com/rows/tiny_charts
7 |
8 | environment:
9 | sdk: ">=2.12.0 <3.0.0"
10 | flutter: ">=1.17.0"
11 |
12 | dependencies:
13 | vector_math: ^2.1.1
14 | meta: ^1.7.0
15 | collection: ^1.15.0
16 | flutter:
17 | sdk: flutter
18 |
19 | dev_dependencies:
20 | rows_lint: 0.1.1
21 | flutter_test:
22 | sdk: flutter
23 |
24 | flutter:
25 |
--------------------------------------------------------------------------------
/test/bar_test.dart:
--------------------------------------------------------------------------------
1 | import 'dart:ui';
2 |
3 | import 'package:flutter_test/flutter_test.dart';
4 | import 'package:tiny_charts/src/bar.dart';
5 |
6 | import 'package:vector_math/vector_math.dart';
7 |
8 | import 'utils.dart';
9 |
10 | void main() {
11 | group('TinyBarChart', () {
12 | testWidgets('single', (tester) async {
13 | await tester.pumpWidget(
14 | TestStage(
15 | child: TinyBarChart.single(
16 | value: 68.12,
17 | max: 100,
18 | color: const Color(0xFF236536),
19 | width: 120,
20 | height: 28,
21 | ),
22 | ),
23 | );
24 |
25 | await tester.pumpAndSettle();
26 |
27 | await expectLater(
28 | find.byType(TinyBarChart),
29 | matchesGoldenFile('goldens/bar/1.png'),
30 | );
31 | });
32 |
33 | testWidgets('stacked', (tester) async {
34 | await tester.pumpWidget(
35 | TestStage(
36 | child: TinyBarChart.stacked(
37 | data: const [24, 12, 4],
38 | width: 120,
39 | height: 28,
40 | ),
41 | ),
42 | );
43 |
44 | await tester.pumpAndSettle();
45 |
46 | await expectLater(
47 | find.byType(TinyBarChart),
48 | matchesGoldenFile('goldens/bar/2.png'),
49 | );
50 | });
51 |
52 | testWidgets('stacked from vectors', (tester) async {
53 | await tester.pumpWidget(
54 | TestStage(
55 | child: TinyBarChart.stackedFromDataVectors(
56 | dataPoints: [
57 | Vector2(1, 20),
58 | Vector2(2, 15),
59 | Vector2(0, 24),
60 | Vector2(4, 8),
61 | ],
62 | width: 120,
63 | height: 28,
64 | ),
65 | ),
66 | );
67 |
68 | await tester.pumpAndSettle();
69 |
70 | await expectLater(
71 | find.byType(TinyBarChart),
72 | matchesGoldenFile('goldens/bar/3.png'),
73 | );
74 | });
75 |
76 | group('options', () {
77 | testWidgets('custom colors', (tester) async {
78 | await tester.pumpWidget(
79 | TestStage(
80 | child: TinyBarChart.stacked(
81 | data: const [24, 12, 4],
82 | options: const TinyBarChartOptions(
83 | colors: [
84 | Color(0xFFFF0000),
85 | Color(0xBEEE0260),
86 | Color(0x97FF74AD),
87 | ],
88 | ),
89 | width: 120,
90 | height: 28,
91 | ),
92 | ),
93 | );
94 |
95 | await tester.pumpAndSettle();
96 |
97 | await expectLater(
98 | find.byType(TinyBarChart),
99 | matchesGoldenFile('goldens/bar/4.png'),
100 | );
101 | });
102 |
103 | testWidgets('max capping', (tester) async {
104 | await tester.pumpWidget(
105 | TestStage(
106 | child: TinyBarChart.stackedFromDataVectors(
107 | dataPoints: [
108 | Vector2(1, 120),
109 | Vector2(2, 15),
110 | Vector2(0, 24),
111 | Vector2(4, 8),
112 | ],
113 | width: 120,
114 | height: 28,
115 | options: const TinyBarChartOptions(
116 | max: 100,
117 | colors: [
118 | Color(0xFFFF0000),
119 | Color(0xBEEE0260),
120 | ],
121 | ),
122 | ),
123 | ),
124 | );
125 |
126 | await tester.pumpAndSettle();
127 |
128 | await expectLater(
129 | find.byType(TinyBarChart),
130 | matchesGoldenFile('goldens/bar/5.png'),
131 | );
132 | });
133 | });
134 | });
135 | }
136 |
--------------------------------------------------------------------------------
/test/column_test.dart:
--------------------------------------------------------------------------------
1 | import 'dart:ui';
2 |
3 | import 'package:flutter_test/flutter_test.dart';
4 | import 'package:tiny_charts/src/column.dart';
5 |
6 | import 'package:vector_math/vector_math.dart';
7 |
8 | import 'utils.dart';
9 |
10 | void main() {
11 | group('TinyColumnChart', () {
12 | testWidgets('from values', (tester) async {
13 | await tester.pumpWidget(
14 | TestStage(
15 | child: TinyColumnChart(
16 | data: const [20, 22, 14, 12, 19, 28, 1, 11],
17 | width: 120,
18 | height: 28,
19 | ),
20 | ),
21 | );
22 |
23 | await tester.pumpAndSettle();
24 |
25 | await expectLater(
26 | find.byType(TinyColumnChart),
27 | matchesGoldenFile('goldens/column/1.png'),
28 | );
29 | });
30 |
31 | testWidgets('from values', (tester) async {
32 | await tester.pumpWidget(
33 | TestStage(
34 | child: TinyColumnChart.fromDataVectors(
35 | dataPoints: [
36 | Vector2(0, 18),
37 | Vector2(6, 22),
38 | Vector2(2, 12),
39 | Vector2(3, 14),
40 | Vector2(5, 34),
41 | Vector2(4, 5),
42 | Vector2(1, 24),
43 | ],
44 | width: 120,
45 | height: 28,
46 | ),
47 | ),
48 | );
49 |
50 | await tester.pumpAndSettle();
51 |
52 | await expectLater(
53 | find.byType(TinyColumnChart),
54 | matchesGoldenFile('goldens/column/2.png'),
55 | );
56 | });
57 |
58 | testWidgets('negative values', (tester) async {
59 | await tester.pumpWidget(
60 | TestStage(
61 | child: TinyColumnChart(
62 | data: const [20, -22, 14, -12, -19, 28, 1, 11],
63 | width: 120,
64 | height: 28,
65 | ),
66 | ),
67 | );
68 |
69 | await tester.pumpAndSettle();
70 |
71 | await expectLater(
72 | find.byType(TinyColumnChart),
73 | matchesGoldenFile('goldens/column/3.png'),
74 | );
75 | });
76 |
77 | group('options', () {
78 | testWidgets('show axis', (tester) async {
79 | await tester.pumpWidget(
80 | TestStage(
81 | child: TinyColumnChart(
82 | data: const [20, -22, 14, -12, -19, 28, 5, 11],
83 | width: 120,
84 | height: 28,
85 | options: const TinyColumnChartOptions(
86 | positiveColor: Color(0xFF27A083),
87 | negativeColor: Color(0xFFE92F3C),
88 | showAxis: true,
89 | ),
90 | ),
91 | ),
92 | );
93 |
94 | await tester.pumpAndSettle();
95 |
96 | await expectLater(
97 | find.byType(TinyColumnChart),
98 | matchesGoldenFile('goldens/column/4.png'),
99 | );
100 | });
101 |
102 | testWidgets('custom colors', (tester) async {
103 | await tester.pumpWidget(
104 | TestStage(
105 | child: TinyColumnChart(
106 | data: const [18, 22, 28, -12, 32, 12, 9, 14, -34, -25, 24],
107 | width: 120,
108 | height: 28,
109 | options: const TinyColumnChartOptions(
110 | positiveColor: Color(0xFF0023C6),
111 | negativeColor: Color(0xFFBA2500),
112 | showAxis: true,
113 | axisColor: Color(0xFF00FF00),
114 | lowestColor: Color(0xFFFF4A1A),
115 | highestColor: Color(0xFF3083FF),
116 | firstColor: Color(0xFFFFE500),
117 | lastColor: Color(0xFF8000FF),
118 | ),
119 | ),
120 | ),
121 | );
122 |
123 | await tester.pumpAndSettle();
124 |
125 | await expectLater(
126 | find.byType(TinyColumnChart),
127 | matchesGoldenFile('goldens/column/5.png'),
128 | );
129 | });
130 | });
131 | });
132 | }
133 |
--------------------------------------------------------------------------------
/test/goldens/bar/1.png:
--------------------------------------------------------------------------------
https://raw.githubusercontent.com/rows/tiny_charts/10dcaa45965e088005e96bd58e6e88ed31ccb903/test/goldens/bar/1.png
--------------------------------------------------------------------------------
/test/goldens/bar/2.png:
--------------------------------------------------------------------------------
https://raw.githubusercontent.com/rows/tiny_charts/10dcaa45965e088005e96bd58e6e88ed31ccb903/test/goldens/bar/2.png
--------------------------------------------------------------------------------
/test/goldens/bar/3.png:
--------------------------------------------------------------------------------
https://raw.githubusercontent.com/rows/tiny_charts/10dcaa45965e088005e96bd58e6e88ed31ccb903/test/goldens/bar/3.png
--------------------------------------------------------------------------------
/test/goldens/bar/4.png:
--------------------------------------------------------------------------------
https://raw.githubusercontent.com/rows/tiny_charts/10dcaa45965e088005e96bd58e6e88ed31ccb903/test/goldens/bar/4.png
--------------------------------------------------------------------------------
/test/goldens/bar/5.png:
--------------------------------------------------------------------------------
https://raw.githubusercontent.com/rows/tiny_charts/10dcaa45965e088005e96bd58e6e88ed31ccb903/test/goldens/bar/5.png
--------------------------------------------------------------------------------
/test/goldens/column/1.png:
--------------------------------------------------------------------------------
https://raw.githubusercontent.com/rows/tiny_charts/10dcaa45965e088005e96bd58e6e88ed31ccb903/test/goldens/column/1.png
--------------------------------------------------------------------------------
/test/goldens/column/2.png:
--------------------------------------------------------------------------------
https://raw.githubusercontent.com/rows/tiny_charts/10dcaa45965e088005e96bd58e6e88ed31ccb903/test/goldens/column/2.png
--------------------------------------------------------------------------------
/test/goldens/column/3.png:
--------------------------------------------------------------------------------
https://raw.githubusercontent.com/rows/tiny_charts/10dcaa45965e088005e96bd58e6e88ed31ccb903/test/goldens/column/3.png
--------------------------------------------------------------------------------
/test/goldens/column/4.png:
--------------------------------------------------------------------------------
https://raw.githubusercontent.com/rows/tiny_charts/10dcaa45965e088005e96bd58e6e88ed31ccb903/test/goldens/column/4.png
--------------------------------------------------------------------------------
/test/goldens/column/5.png:
--------------------------------------------------------------------------------
https://raw.githubusercontent.com/rows/tiny_charts/10dcaa45965e088005e96bd58e6e88ed31ccb903/test/goldens/column/5.png
--------------------------------------------------------------------------------
/test/goldens/line/1.png:
--------------------------------------------------------------------------------
https://raw.githubusercontent.com/rows/tiny_charts/10dcaa45965e088005e96bd58e6e88ed31ccb903/test/goldens/line/1.png
--------------------------------------------------------------------------------
/test/goldens/line/2.png:
--------------------------------------------------------------------------------
https://raw.githubusercontent.com/rows/tiny_charts/10dcaa45965e088005e96bd58e6e88ed31ccb903/test/goldens/line/2.png
--------------------------------------------------------------------------------
/test/goldens/line/3.png:
--------------------------------------------------------------------------------
https://raw.githubusercontent.com/rows/tiny_charts/10dcaa45965e088005e96bd58e6e88ed31ccb903/test/goldens/line/3.png
--------------------------------------------------------------------------------
/test/line_test.dart:
--------------------------------------------------------------------------------
1 | import 'dart:ui';
2 |
3 | import 'package:flutter_test/flutter_test.dart';
4 | import 'package:tiny_charts/src/line.dart';
5 | import 'package:vector_math/vector_math.dart';
6 |
7 | import 'utils.dart';
8 |
9 | void main() {
10 | group('TinyLineChart', () {
11 | testWidgets('from offset', (tester) async {
12 | await tester.pumpWidget(
13 | TestStage(
14 | child: TinyLineChart(
15 | width: 100,
16 | height: 28,
17 | dataPoints: const [
18 | Offset(0, 2),
19 | Offset(1, 11),
20 | Offset(2, 17),
21 | Offset(2.5, 0),
22 | Offset(3, 10),
23 | Offset(4, 24),
24 | ],
25 | ),
26 | ),
27 | );
28 |
29 | await expectLater(
30 | find.byType(TinyLineChart),
31 | matchesGoldenFile('goldens/line/1.png'),
32 | );
33 | });
34 |
35 | testWidgets('from vectors', (tester) async {
36 | await tester.pumpWidget(
37 | TestStage(
38 | child: TinyLineChart.fromDataVectors(
39 | width: 100,
40 | height: 28,
41 | dataPoints: [
42 | Vector2(0, 14),
43 | Vector2(1, 13.2),
44 | Vector2(2, 2),
45 | Vector2(3, 13),
46 | Vector2(4, 10),
47 | Vector2(5, 4),
48 | ],
49 | ),
50 | ),
51 | );
52 |
53 | await expectLater(
54 | find.byType(TinyLineChart),
55 | matchesGoldenFile('goldens/line/2.png'),
56 | );
57 | });
58 |
59 | testWidgets('with options', (tester) async {
60 | await tester.pumpWidget(
61 | TestStage(
62 | child: TinyLineChart(
63 | width: 100,
64 | height: 28,
65 | dataPoints: const [
66 | Offset(0, 2),
67 | Offset(1, 11),
68 | Offset(2, 17),
69 | Offset(2.5, 0),
70 | Offset(3, 10),
71 | Offset(4, 24),
72 | ],
73 | options: const TinyLineChartOptions(
74 | color: Color(0xFFC93B8C),
75 | lineWidth: 3,
76 | yMinLimit: -2,
77 | yMaxLimit: 27,
78 | ),
79 | ),
80 | ),
81 | );
82 |
83 | await expectLater(
84 | find.byType(TinyLineChart),
85 | matchesGoldenFile('goldens/line/3.png'),
86 | );
87 | });
88 | });
89 | }
90 |
--------------------------------------------------------------------------------
/test/utils.dart:
--------------------------------------------------------------------------------
1 | import 'package:flutter/material.dart';
2 |
3 | class TestStage extends StatelessWidget {
4 | final Widget child;
5 |
6 | const TestStage({
7 | Key? key,
8 | required this.child,
9 | }) : super(key: key);
10 |
11 | @override
12 | Widget build(BuildContext context) {
13 | return MaterialApp(
14 | home: Scaffold(
15 | body: ColoredBox(
16 | color: const Color(0xFFFF00FF),
17 | child: Center(
18 | child: RepaintBoundary(
19 | child: ColoredBox(
20 | color: const Color(0xFFFFFFFF),
21 | child: ClipRect(
22 | child: child,
23 | ),
24 | ),
25 | ),
26 | ),
27 | ),
28 | ),
29 | );
30 | }
31 | }
32 |
--------------------------------------------------------------------------------