├── Network Graph.ipynb
├── README.md
└── data
├── delivery records.xlsx
└── store province.xlsx
/README.md:
--------------------------------------------------------------------------------
1 | ## Transportation Network Analysis with Graph Theory 🚚
2 | *Use the graph theory to optimize the road transportation network of a retail company*
3 |
4 |
5 |  6 |
6 |
7 |
8 | ### Objective
9 | Build graphical representations of a road transportation network to support network optimization studies.
10 |
11 | ### Introduction
12 | For a retailer, road transportation between the distribution centre and stores represents a major part of the logistics costs.
13 | Companies often conduct route planning optimization studies to reduce these costs and improve the efficiency of their network.
14 |
15 | It requires **collaboration** between continuous improvement engineers and the transportation teams that manage operations daily.
16 |
17 | ### 📘 Your complete guide for Supply Chain Analytics
18 | 60+ case studies with source code, dummy data and mathematical concepts here 👉 [Analytics Cheat Sheet](https://bit.ly/supply-chain-cheat)
19 |
20 | ### Article
21 | In this [Article](https://medium.com/towards-data-science/transportation-network-analysis-with-graph-theory-55eceb7e4de4), we will use Graph Theory to design visual representations of a transportation network to support this collaboration and facilitate solution design.
22 |
23 | ### Youtube Video
24 | Click on the image below to access a full tutorial video to understand the concept behind this solution
25 |
26 |

27 |
32 | 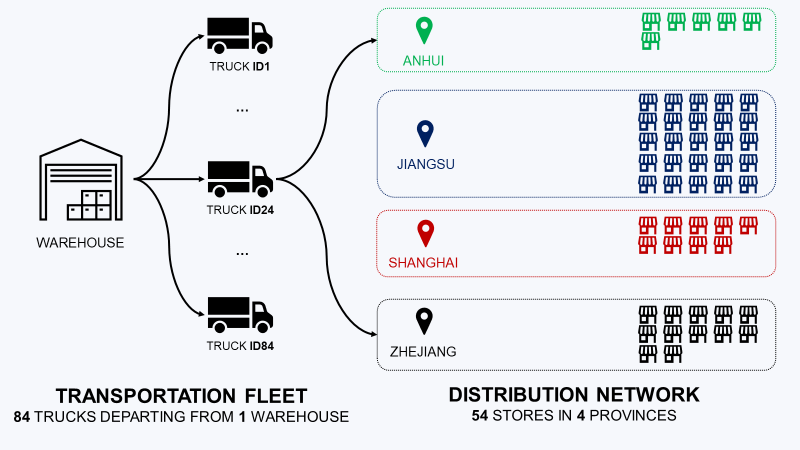 33 |
33 |
34 |
35 | #### Objective
36 | Your objective is to reduce the total cost of transportation.
37 |
38 | #### Insights: Cost per Ton
39 | The objective is to design a new transportation plan to increase the average size of trucks by delivering more stores per route.
40 |
41 | 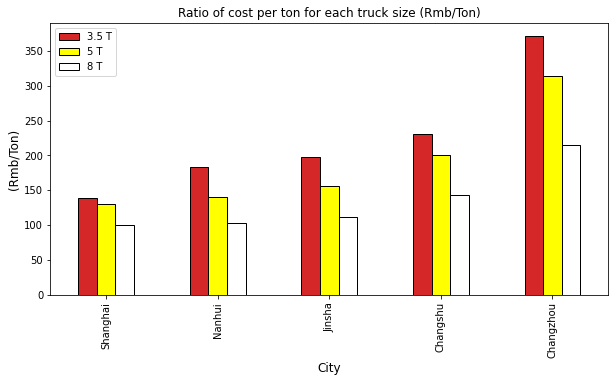 42 |
42 |
43 |
44 | #### Solution: Graph Theory
45 | A graph is a structure that contains nodes (stores), and each related pair of nodes is called an edge.
46 |
47 | 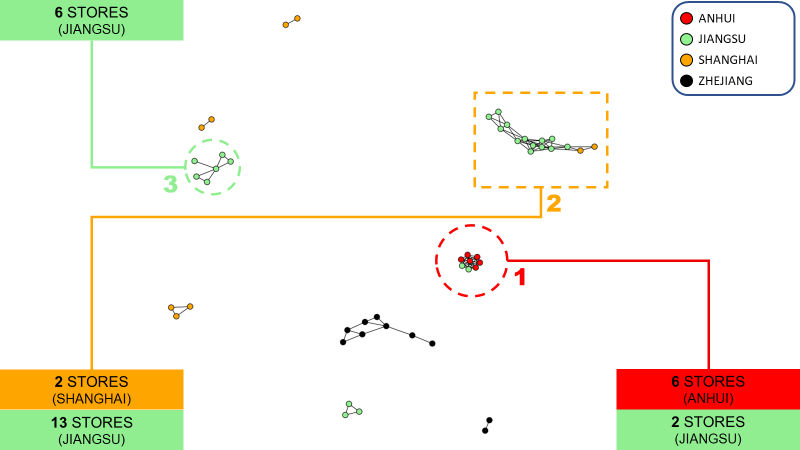 48 |
48 |
49 |
50 | #### Further Analysis
51 | With these graphs, you can challenge the current routing and discuss optimization levers with the transportation teams.
52 |
53 | 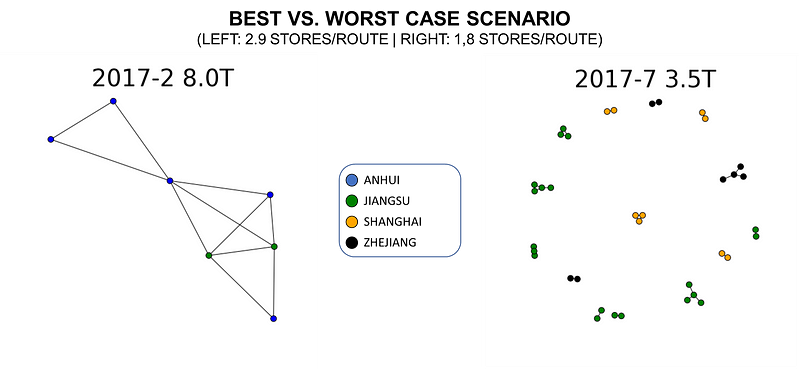 54 |
54 |
55 |
56 |
57 | ## Code
58 | This repository code you will find all the code used to explain the concepts presented in the article.
59 |
60 | ## About me 🤓
61 | Senior Supply Chain and Data Science consultant with international experience working on Logistics and Transportation operations. \
62 | For **consulting or advising** on analytics and sustainable supply chain transformation, feel free to contact me via [Logigreen Consulting](https://www.logi-green.com/). \
63 |
64 | Please have a look at my personal blog: [Personal Website](https://samirsaci.com)
65 |
--------------------------------------------------------------------------------
/data/delivery records.xlsx:
--------------------------------------------------------------------------------
https://raw.githubusercontent.com/samirsaci/graph-theory/01fd5b26625bac82a79f23f1e819e2d32e2aea6a/data/delivery records.xlsx
--------------------------------------------------------------------------------
/data/store province.xlsx:
--------------------------------------------------------------------------------
https://raw.githubusercontent.com/samirsaci/graph-theory/01fd5b26625bac82a79f23f1e819e2d32e2aea6a/data/store province.xlsx
--------------------------------------------------------------------------------