├── .yarnrc.yml
├── src
├── elements
│ ├── index.ts
│ └── GeoFeature.ts
├── scales
│ ├── index.ts
│ ├── SizeScale.ts
│ ├── ProjectionScale.ts
│ ├── ColorScale.ts
│ └── LegendScale.ts
├── controllers
│ ├── __image_snapshots__
│ │ ├── bubble-map-controller-spec-ts-bubble-map-log-1-snap.png
│ │ ├── choropleth-controller-spec-ts-choropleth-log-1-snap.png
│ │ ├── bubble-map-controller-spec-ts-bubble-map-area-1-snap.png
│ │ ├── choropleth-controller-spec-ts-choropleth-earth-1-snap.png
│ │ ├── bubble-map-controller-spec-ts-bubble-map-default-1-snap.png
│ │ ├── bubble-map-controller-spec-ts-bubble-map-radius-1-snap.png
│ │ └── choropleth-controller-spec-ts-choropleth-default-1-snap.png
│ ├── index.ts
│ ├── patchController.ts
│ ├── __tests__
│ │ └── data.ts
│ ├── ChoroplethController.spec.ts
│ ├── BubbleMapController.spec.ts
│ ├── ChoroplethController.ts
│ ├── BubbleMapController.ts
│ └── GeoController.ts
├── index.umd.ts
├── index.ts
└── __tests__
│ └── createChart.ts
├── .github
├── FUNDING.yml
├── ISSUE_TEMPLATE
│ ├── config.yml
│ ├── feature_request.md
│ ├── question.md
│ └── bug_report.md
├── dependabot.yml
├── release-drafter.yml
└── workflows
│ ├── ci.yml
│ ├── deploy_website.yml
│ ├── create_release.yml
│ └── release_helper.yml
├── .prettierrc.cjs
├── docs
├── examples
│ ├── data
│ │ ├── README.md
│ │ └── us-capitals.json
│ ├── earth.md
│ ├── bubbleMap.md
│ ├── area.md
│ ├── custom.md
│ ├── center.md
│ ├── choropleth.md
│ ├── legend.md
│ ├── projection.md
│ ├── legend.ts
│ ├── area.ts
│ ├── custom.ts
│ ├── projection.ts
│ ├── offset.md
│ ├── index.md
│ ├── offset.ts
│ ├── earth.ts
│ ├── albers.ts
│ ├── bubbleMap.ts
│ └── center.ts
├── index.md
├── .vitepress
│ ├── theme
│ │ └── index.ts
│ └── config.ts
├── related.md
└── getting-started.md
├── vitest.config.ts
├── tsconfig.c.json
├── .prettierignore
├── .gitignore
├── typedoc.json
├── .vscode
└── settings.json
├── LICENSE
├── tsconfig.json
├── eslint.config.mjs
├── samples
└── geo.html
├── .gitattributes
├── package.json
├── rollup.config.js
└── README.md
/.yarnrc.yml:
--------------------------------------------------------------------------------
1 | yarnPath: .yarn/releases/yarn-4.10.3.cjs
2 |
--------------------------------------------------------------------------------
/src/elements/index.ts:
--------------------------------------------------------------------------------
1 | export * from './GeoFeature';
2 |
--------------------------------------------------------------------------------
/.github/FUNDING.yml:
--------------------------------------------------------------------------------
1 | # These are supported funding model platforms
2 |
3 | github: [sgratzl]
4 |
--------------------------------------------------------------------------------
/src/scales/index.ts:
--------------------------------------------------------------------------------
1 | export * from './ProjectionScale';
2 | export * from './ColorScale';
3 | export * from './SizeScale';
4 |
--------------------------------------------------------------------------------
/.prettierrc.cjs:
--------------------------------------------------------------------------------
1 | module.exports = {
2 | printWidth: 120,
3 | semi: true,
4 | singleQuote: true,
5 | trailingComma: 'es5',
6 | };
7 |
--------------------------------------------------------------------------------
/docs/examples/data/README.md:
--------------------------------------------------------------------------------
1 | from https://gist.githubusercontent.com/mbostock/9535021/raw/928a5f81f170b767162f8f52dbad05985eae9cac/us-state-capitals.csv
2 |
--------------------------------------------------------------------------------
/.github/ISSUE_TEMPLATE/config.yml:
--------------------------------------------------------------------------------
1 | blank_issues_enabled: true
2 | # contact_links:
3 | # - name: Samuel Gratzl
4 | # url: https://www.sgratzl.com
5 | # about: Please ask and answer questions here.
6 |
--------------------------------------------------------------------------------
/vitest.config.ts:
--------------------------------------------------------------------------------
1 | ///
2 | import { defineConfig } from 'vite';
3 |
4 | export default defineConfig({
5 | test: {
6 | environment: 'jsdom',
7 | root: './src',
8 | },
9 | });
10 |
--------------------------------------------------------------------------------
/src/controllers/__image_snapshots__/bubble-map-controller-spec-ts-bubble-map-log-1-snap.png:
--------------------------------------------------------------------------------
https://raw.githubusercontent.com/sgratzl/chartjs-chart-geo/HEAD/src/controllers/__image_snapshots__/bubble-map-controller-spec-ts-bubble-map-log-1-snap.png
--------------------------------------------------------------------------------
/src/controllers/__image_snapshots__/choropleth-controller-spec-ts-choropleth-log-1-snap.png:
--------------------------------------------------------------------------------
https://raw.githubusercontent.com/sgratzl/chartjs-chart-geo/HEAD/src/controllers/__image_snapshots__/choropleth-controller-spec-ts-choropleth-log-1-snap.png
--------------------------------------------------------------------------------
/src/controllers/__image_snapshots__/bubble-map-controller-spec-ts-bubble-map-area-1-snap.png:
--------------------------------------------------------------------------------
https://raw.githubusercontent.com/sgratzl/chartjs-chart-geo/HEAD/src/controllers/__image_snapshots__/bubble-map-controller-spec-ts-bubble-map-area-1-snap.png
--------------------------------------------------------------------------------
/src/controllers/__image_snapshots__/choropleth-controller-spec-ts-choropleth-earth-1-snap.png:
--------------------------------------------------------------------------------
https://raw.githubusercontent.com/sgratzl/chartjs-chart-geo/HEAD/src/controllers/__image_snapshots__/choropleth-controller-spec-ts-choropleth-earth-1-snap.png
--------------------------------------------------------------------------------
/tsconfig.c.json:
--------------------------------------------------------------------------------
1 | {
2 | "extends": "./tsconfig.json",
3 | "compilerOptions": {
4 | "outDir": "build",
5 | "declaration": true,
6 | "declarationMap": true,
7 | "noEmit": true,
8 | "composite": true
9 | }
10 | }
11 |
--------------------------------------------------------------------------------
/src/controllers/__image_snapshots__/bubble-map-controller-spec-ts-bubble-map-default-1-snap.png:
--------------------------------------------------------------------------------
https://raw.githubusercontent.com/sgratzl/chartjs-chart-geo/HEAD/src/controllers/__image_snapshots__/bubble-map-controller-spec-ts-bubble-map-default-1-snap.png
--------------------------------------------------------------------------------
/src/controllers/__image_snapshots__/bubble-map-controller-spec-ts-bubble-map-radius-1-snap.png:
--------------------------------------------------------------------------------
https://raw.githubusercontent.com/sgratzl/chartjs-chart-geo/HEAD/src/controllers/__image_snapshots__/bubble-map-controller-spec-ts-bubble-map-radius-1-snap.png
--------------------------------------------------------------------------------
/src/controllers/__image_snapshots__/choropleth-controller-spec-ts-choropleth-default-1-snap.png:
--------------------------------------------------------------------------------
https://raw.githubusercontent.com/sgratzl/chartjs-chart-geo/HEAD/src/controllers/__image_snapshots__/choropleth-controller-spec-ts-choropleth-default-1-snap.png
--------------------------------------------------------------------------------
/src/controllers/index.ts:
--------------------------------------------------------------------------------
1 | export {
2 | GeoController,
3 | type IGeoChartOptions,
4 | type IGeoControllerDatasetOptions,
5 | type IGeoDataPoint,
6 | } from './GeoController';
7 | export * from './ChoroplethController';
8 | export * from './BubbleMapController';
9 |
--------------------------------------------------------------------------------
/.prettierignore:
--------------------------------------------------------------------------------
1 | /.pnp*
2 | /.yarnrc.yml
3 | /.yarn
4 | /build
5 | /docs/.vitepress/cache
6 | /docs/.vitepress/dist
7 | /docs/.vitepress/config.ts.timestamp*
8 | /docs/api
9 | /coverage
10 | /.gitattributes
11 | /.gitignore
12 | /.prettierignore
13 | /LICENSE
14 | /yarn.lock
15 | /.vscode
16 | *.png
17 | *.tgz
18 | *.tsbuildinfo
19 | .eslintcache
20 | .nojekyll
21 |
--------------------------------------------------------------------------------
/docs/examples/earth.md:
--------------------------------------------------------------------------------
1 | ---
2 | title: World Atlas
3 | ---
4 |
5 | # World Atlas
6 |
7 |
10 |
11 |
15 |
16 | ### Code
17 |
18 | :::code-group
19 |
20 | <<< ./earth.ts#config [config]
21 |
22 | <<< ./earth.ts#data [data]
23 |
24 | :::
25 |
--------------------------------------------------------------------------------
/docs/examples/bubbleMap.md:
--------------------------------------------------------------------------------
1 | ---
2 | title: Bubble Map
3 | ---
4 |
5 | # Bubble Map
6 |
7 |
10 |
11 |
15 |
16 | ### Code
17 |
18 | :::code-group
19 |
20 | <<< ./bubbleMap.ts#config [config]
21 |
22 | <<< ./bubbleMap.ts#data [data]
23 |
24 | :::
25 |
--------------------------------------------------------------------------------
/docs/examples/area.md:
--------------------------------------------------------------------------------
1 | ---
2 | title: Bubble Map Area Mode
3 | ---
4 |
5 | # Bubble Map Area Mode
6 |
7 |
10 |
11 |
15 |
16 | ### Code
17 |
18 | :::code-group
19 |
20 | <<< ./area.ts#config [config]
21 |
22 | <<< ./bubbleMap.ts#data [data]
23 |
24 | :::
25 |
--------------------------------------------------------------------------------
/docs/examples/custom.md:
--------------------------------------------------------------------------------
1 | ---
2 | title: Custom Color Scale
3 | ---
4 |
5 | # Custom Color Scale
6 |
7 |
10 |
11 |
15 |
16 | ### Code
17 |
18 | :::code-group
19 |
20 | <<< ./custom.ts#config [config]
21 |
22 | <<< ./albers.ts#data [data]
23 |
24 | :::
25 |
--------------------------------------------------------------------------------
/docs/examples/center.md:
--------------------------------------------------------------------------------
1 | ---
2 | title: Custom Tooltip Center
3 | ---
4 |
5 | # Custom Tooltip Center
6 |
7 |
10 |
11 |
15 |
16 | ### Code
17 |
18 | :::code-group
19 |
20 | <<< ./center.ts#config [config]
21 |
22 | <<< ./center.ts#data [data]
23 |
24 | :::
25 |
--------------------------------------------------------------------------------
/docs/examples/choropleth.md:
--------------------------------------------------------------------------------
1 | ---
2 | title: Choropleth US Map
3 | ---
4 |
5 | # Choropleth US Map
6 |
7 |
10 |
11 |
15 |
16 | ### Code
17 |
18 | :::code-group
19 |
20 | <<< ./albers.ts#config [config]
21 |
22 | <<< ./albers.ts#data [data]
23 |
24 | :::
25 |
--------------------------------------------------------------------------------
/docs/examples/legend.md:
--------------------------------------------------------------------------------
1 | ---
2 | title: Legend Customization
3 | ---
4 |
5 | # Legend Customization
6 |
7 |
10 |
11 |
15 |
16 | ### Code
17 |
18 | :::code-group
19 |
20 | <<< ./legend.ts#config [config]
21 |
22 | <<< ./albers.ts#data [data]
23 |
24 | :::
25 |
--------------------------------------------------------------------------------
/docs/examples/projection.md:
--------------------------------------------------------------------------------
1 | ---
2 | title: Equal Earth Projection
3 | ---
4 |
5 | # Equal Earth Projection
6 |
7 |
10 |
11 |
15 |
16 | ### Code
17 |
18 | :::code-group
19 |
20 | <<< ./projection.ts#config [config]
21 |
22 | <<< ./albers.ts#data [data]
23 |
24 | :::
25 |
--------------------------------------------------------------------------------
/.github/dependabot.yml:
--------------------------------------------------------------------------------
1 | version: 2
2 |
3 | updates:
4 | - package-ecosystem: 'github-actions'
5 | directory: '/'
6 | schedule:
7 | interval: 'monthly'
8 | target-branch: 'dev'
9 | labels:
10 | - 'dependencies'
11 | - 'chore'
12 | - package-ecosystem: 'npm'
13 | directory: '/'
14 | schedule:
15 | interval: 'monthly'
16 | target-branch: 'dev'
17 | labels:
18 | - 'dependencies'
19 | - 'chore'
20 |
--------------------------------------------------------------------------------
/.gitignore:
--------------------------------------------------------------------------------
1 | # Logs
2 | logs
3 | *.log
4 | npm-debug.log*
5 |
6 | /coverage
7 | /node_modules
8 | .npm
9 | .yarn/*
10 | !.yarn/patches
11 | !.yarn/releases
12 | !.yarn/plugins
13 | !.yarn/versions
14 | .pnp.*
15 |
16 | # Build files
17 | /.tmp
18 | /build
19 |
20 | *.tgz
21 | /.vscode/extensions.json
22 | *.tsbuildinfo
23 | .eslintcache
24 | __diff_output__
25 |
26 | docs/.vitepress/dist
27 | docs/.vitepress/cache
28 | docs/.vitepress/config.ts.timestamp*
29 | docs/api/
--------------------------------------------------------------------------------
/.github/ISSUE_TEMPLATE/feature_request.md:
--------------------------------------------------------------------------------
1 | ---
2 | name: 🚀 Feature Request
3 | about: Suggest an idea for this project
4 | title: ''
5 | labels: 'enhancement'
6 | assignees: ''
7 | ---
8 |
9 |
10 |
11 | It would be great if ...
12 |
13 | **User story**
14 |
15 |
16 |
17 | **Additional context**
18 |
19 |
20 |
--------------------------------------------------------------------------------
/src/index.umd.ts:
--------------------------------------------------------------------------------
1 | import { registry } from 'chart.js';
2 | import { ColorLogarithmicScale, SizeLogarithmicScale, ProjectionScale, ColorScale, SizeScale } from './scales';
3 | import { GeoFeature } from './elements';
4 | import { ChoroplethController, BubbleMapController } from './controllers';
5 |
6 | export * from '.';
7 |
8 | registry.addScales(ColorLogarithmicScale, SizeLogarithmicScale, ProjectionScale, ColorScale, SizeScale);
9 | registry.addElements(GeoFeature);
10 | registry.addControllers(ChoroplethController, BubbleMapController);
11 |
--------------------------------------------------------------------------------
/src/index.ts:
--------------------------------------------------------------------------------
1 | export * from './scales';
2 | export * from './elements';
3 | export * from './controllers';
4 | export * as topojson from 'topojson-client';
5 |
6 | export {
7 | geoAzimuthalEqualArea,
8 | geoAzimuthalEquidistant,
9 | geoGnomonic,
10 | geoOrthographic,
11 | geoStereographic,
12 | geoEqualEarth,
13 | geoAlbers,
14 | geoAlbersUsa,
15 | geoConicConformal,
16 | geoConicEqualArea,
17 | geoConicEquidistant,
18 | geoEquirectangular,
19 | geoMercator,
20 | geoTransverseMercator,
21 | geoNaturalEarth1,
22 | } from 'd3-geo';
23 |
--------------------------------------------------------------------------------
/.github/release-drafter.yml:
--------------------------------------------------------------------------------
1 | name-template: 'v$RESOLVED_VERSION'
2 | tag-template: 'v$RESOLVED_VERSION'
3 | categories:
4 | - title: '🚀 Features'
5 | labels:
6 | - 'enhancement'
7 | - 'feature'
8 | - title: '🐛 Bugs Fixes'
9 | labels:
10 | - 'bug'
11 | - title: 'Documentation'
12 | labels:
13 | - 'documentation'
14 | - title: '🧰 Development'
15 | labels:
16 | - 'chore'
17 | change-template: '- #$NUMBER $TITLE'
18 | change-title-escapes: '\<*_&`#@'
19 | template: |
20 | $CHANGES
21 |
22 | Thanks to $CONTRIBUTORS
23 |
--------------------------------------------------------------------------------
/typedoc.json:
--------------------------------------------------------------------------------
1 | {
2 | "$schema": "https://typedoc.org/schema.json",
3 | "entryPoints": ["./src"],
4 | "plugin": ["typedoc-plugin-markdown", "typedoc-vitepress-theme"],
5 | "name": "chartjs-chart-geo",
6 | "out": "./docs/api",
7 | "docsRoot": "./docs/",
8 | "readme": "none",
9 | "sidebar": {
10 | "pretty": true
11 | },
12 | "theme": "default",
13 | "excludeExternals": true,
14 | "excludeInternal": true,
15 | "excludePrivate": true,
16 | "includeVersion": true,
17 | "categorizeByGroup": true,
18 | "cleanOutputDir": true,
19 | "hideGenerator": true
20 | }
21 |
--------------------------------------------------------------------------------
/docs/index.md:
--------------------------------------------------------------------------------
1 | ---
2 | # https://vitepress.dev/reference/default-theme-home-page
3 | layout: home
4 |
5 | hero:
6 | name: 'chartjs-chart-geo'
7 | text: 'chart.js plugin'
8 | tagline: Chart.js module for charting maps
9 | actions:
10 | - theme: brand
11 | text: Getting Started
12 | link: /getting-started
13 | - theme: alt
14 | text: Examples
15 | link: /examples/
16 | - theme: alt
17 | text: API
18 | link: /api/
19 | # features:
20 | # - title: Feature A
21 | # details: Lorem ipsum dolor sit amet, consectetur adipiscing elit
22 | ---
23 |
--------------------------------------------------------------------------------
/docs/examples/legend.ts:
--------------------------------------------------------------------------------
1 | import type { ChartConfiguration } from 'chart.js';
2 | import { data } from './albers';
3 |
4 | // #region config
5 | export const config: ChartConfiguration<'choropleth'> = {
6 | type: 'choropleth',
7 | data,
8 | options: {
9 | scales: {
10 | projection: {
11 | axis: 'x',
12 | projection: 'albersUsa',
13 | },
14 | color: {
15 | axis: 'x',
16 | quantize: 5,
17 | legend: {
18 | position: 'bottom-right',
19 | align: 'right',
20 | },
21 | },
22 | },
23 | },
24 | };
25 | // #endregion config
26 |
--------------------------------------------------------------------------------
/docs/examples/area.ts:
--------------------------------------------------------------------------------
1 | import type { ChartConfiguration } from 'chart.js';
2 | import { Feature, topojson } from '../../src';
3 | import { data } from './bubbleMap';
4 |
5 | // #region config
6 | export const config: ChartConfiguration<'bubbleMap'> = {
7 | type: 'bubbleMap',
8 | data,
9 | options: {
10 | scales: {
11 | projection: {
12 | axis: 'x',
13 | projection: 'albersUsa',
14 | },
15 | size: {
16 | axis: 'x',
17 | size: [1, 20],
18 | mode: 'area',
19 | },
20 | },
21 | layout: {
22 | // padding: 20
23 | },
24 | },
25 | };
26 | // #endregion config
27 |
--------------------------------------------------------------------------------
/docs/examples/custom.ts:
--------------------------------------------------------------------------------
1 | import type { ChartConfiguration } from 'chart.js';
2 | import { data } from './albers';
3 |
4 | // #region config
5 | export const config: ChartConfiguration<'choropleth'> = {
6 | type: 'choropleth',
7 | data,
8 | options: {
9 | scales: {
10 | projection: {
11 | axis: 'x',
12 | projection: 'albersUsa',
13 | },
14 | color: {
15 | axis: 'x',
16 | interpolate: (v) => (v < 0.5 ? 'green' : 'red'),
17 | legend: {
18 | position: 'bottom-right',
19 | align: 'right',
20 | },
21 | },
22 | },
23 | },
24 | };
25 | // #endregion config
26 |
--------------------------------------------------------------------------------
/docs/examples/projection.ts:
--------------------------------------------------------------------------------
1 | import type { ChartConfiguration } from 'chart.js';
2 | import { data } from './albers';
3 |
4 | // #region config
5 | export const config: ChartConfiguration<'choropleth'> = {
6 | type: 'choropleth',
7 | data,
8 | options: {
9 | scales: {
10 | projection: {
11 | axis: 'x',
12 | projection: 'equalEarth',
13 | },
14 | color: {
15 | axis: 'x',
16 | interpolate: (v) => (v < 0.5 ? 'green' : 'red'),
17 | legend: {
18 | position: 'bottom-right',
19 | align: 'right',
20 | },
21 | },
22 | },
23 | },
24 | };
25 | // #endregion config
26 |
--------------------------------------------------------------------------------
/.github/ISSUE_TEMPLATE/question.md:
--------------------------------------------------------------------------------
1 | ---
2 | name: 🤗 Question
3 | about: ask question about the library (usage, features,...)
4 | title: ''
5 | labels: 'question'
6 | assignees: ''
7 | ---
8 |
9 |
13 |
14 | I'm having the following question...
15 |
16 | **Screenshots / Sketches**
17 |
18 |
19 |
20 | **Context**
21 |
22 | - Version:
23 | - Browser:
24 |
25 | **Additional context**
26 |
27 |
28 |
--------------------------------------------------------------------------------
/docs/examples/offset.md:
--------------------------------------------------------------------------------
1 | ---
2 | title: Projection Offset
3 | ---
4 |
5 | # Projection Offset and Scale
6 |
7 |
10 |
11 | ## Projection Offset
12 |
13 |
17 |
18 | ### Code
19 |
20 | :::code-group
21 |
22 | <<< ./offset.ts#config [config]
23 |
24 | <<< ./albers.ts#data [data]
25 |
26 | :::
27 |
28 | ## Projection Scale
29 |
30 |
34 |
35 | ### Code
36 |
37 | :::code-group
38 |
39 | <<< ./offset.ts#scale [config]
40 |
41 | <<< ./albers.ts#data [data]
42 |
43 | :::
44 |
--------------------------------------------------------------------------------
/docs/examples/index.md:
--------------------------------------------------------------------------------
1 | ---
2 | title: Examples
3 | ---
4 |
5 | # Examples
6 |
7 |
11 |
12 | ## Choropleth Map
13 |
14 |
18 |
19 | ### Code
20 |
21 | :::code-group
22 |
23 | <<< ./albers.ts#config [config]
24 |
25 | <<< ./albers.ts#data [data]
26 |
27 | :::
28 |
29 | ## Bubble Map
30 |
31 |
35 |
36 | ### Code
37 |
38 | :::code-group
39 |
40 | <<< ./bubbleMap.ts#config [config]
41 |
42 | <<< ./bubbleMap.ts#data [data]
43 |
44 | :::
45 |
--------------------------------------------------------------------------------
/.github/ISSUE_TEMPLATE/bug_report.md:
--------------------------------------------------------------------------------
1 | ---
2 | name: 🐛 Bug report
3 | about: If something isn't working as expected 🤔.
4 | title: ''
5 | labels: 'bug'
6 | assignees: ''
7 | ---
8 |
9 |
10 |
11 | When I...
12 |
13 | **To Reproduce**
14 |
15 |
17 |
18 | 1.
19 |
20 | **Expected behavior**
21 |
22 |
23 |
24 | **Screenshots**
25 |
26 |
27 |
28 | **Context**
29 |
30 | - Version:
31 | - Browser:
32 |
33 | **Additional context**
34 |
35 |
36 |
--------------------------------------------------------------------------------
/src/controllers/patchController.ts:
--------------------------------------------------------------------------------
1 | import { registry, DatasetControllerChartComponent, ChartComponent } from 'chart.js';
2 |
3 | export default function patchController(
4 | type: TYPE,
5 | config: T,
6 | controller: DatasetControllerChartComponent,
7 | elements: ChartComponent | ChartComponent[] = [],
8 | scales: ChartComponent | ChartComponent[] = []
9 | ): T & { type: TYPE } {
10 | registry.addControllers(controller);
11 | if (Array.isArray(elements)) {
12 | registry.addElements(...elements);
13 | } else {
14 | registry.addElements(elements);
15 | }
16 | if (Array.isArray(scales)) {
17 | registry.addScales(...scales);
18 | } else {
19 | registry.addScales(scales);
20 | }
21 | const c = config as any;
22 | c.type = type;
23 | return c;
24 | }
25 |
--------------------------------------------------------------------------------
/docs/examples/offset.ts:
--------------------------------------------------------------------------------
1 | import type { ChartConfiguration } from 'chart.js';
2 | import { data } from './albers';
3 |
4 | // #region config
5 | export const offset: ChartConfiguration<'choropleth'> = {
6 | type: 'choropleth',
7 | data,
8 | options: {
9 | scales: {
10 | projection: {
11 | axis: 'x',
12 | projection: 'albersUsa',
13 | // offset in pixel
14 | projectionOffset: [50, 0],
15 | },
16 | },
17 | },
18 | };
19 | // #endregion config
20 |
21 | // #region scale
22 | export const scale: ChartConfiguration<'choropleth'> = {
23 | type: 'choropleth',
24 | data,
25 | options: {
26 | scales: {
27 | projection: {
28 | axis: 'x',
29 | projection: 'albersUsa',
30 | // custom scale factor,
31 | projectionScale: 1.5,
32 | },
33 | },
34 | },
35 | };
36 | // #endregion scale
37 |
--------------------------------------------------------------------------------
/.vscode/settings.json:
--------------------------------------------------------------------------------
1 | {
2 | "editor.formatOnSave": true,
3 | "editor.formatOnType": true,
4 | "[javascript]": {
5 | "editor.defaultFormatter": "esbenp.prettier-vscode"
6 | },
7 | "[typescript]": {
8 | "editor.defaultFormatter": "esbenp.prettier-vscode"
9 | },
10 | "[json]": {
11 | "editor.defaultFormatter": "esbenp.prettier-vscode"
12 | },
13 | "[yaml]": {
14 | "editor.defaultFormatter": "esbenp.prettier-vscode"
15 | },
16 | "npm.packageManager": "yarn",
17 | "eslint.nodePath": ".yarn/sdks",
18 | "prettier.prettierPath": ".yarn/sdks/prettier/index.cjs",
19 | "files.eol": "\n",
20 | "typescript.tsdk": ".yarn/sdks/typescript/lib",
21 | "typescript.enablePromptUseWorkspaceTsdk": true,
22 | "editor.detectIndentation": false,
23 | "editor.tabSize": 2,
24 | "search.exclude": {
25 | "**/.yarn": true,
26 | "**/.pnp.*": true
27 | }
28 | }
29 |
--------------------------------------------------------------------------------
/.github/workflows/ci.yml:
--------------------------------------------------------------------------------
1 | name: ci
2 |
3 | on:
4 | - push
5 | - pull_request
6 |
7 | jobs:
8 | build:
9 | runs-on: ubuntu-latest
10 | steps:
11 | - uses: actions/checkout@v4
12 | - uses: actions/setup-node@v4
13 | with:
14 | node-version: 20
15 | - run: npm i -g yarn
16 | - run: yarn config set checksumBehavior ignore
17 | - name: Cache Node.js modules
18 | uses: actions/cache@v4
19 | with:
20 | path: |
21 | ./.yarn/cache
22 | ./.yarn/unplugged
23 | key: ${{ runner.os }}-yarn2-v5-${{ hashFiles('**/yarn.lock') }}
24 | restore-keys: |
25 | ${{ runner.os }}-yarn2-v5
26 | - run: yarn install
27 | - run: yarn build
28 | - run: yarn lint
29 | - run: yarn test
30 | - uses: actions/upload-artifact@v4
31 | if: failure()
32 | with:
33 | name: diff outputs
34 | path: src/**/__diff_output__/*.png
35 | - run: yarn docs:build
36 |
--------------------------------------------------------------------------------
/docs/.vitepress/theme/index.ts:
--------------------------------------------------------------------------------
1 | import Theme from 'vitepress/theme';
2 | import { createTypedChart } from 'vue-chartjs';
3 | import { Tooltip, PointElement } from 'chart.js';
4 | import {
5 | BubbleMapController,
6 | ChoroplethController,
7 | ColorScale,
8 | ColorLogarithmicScale,
9 | SizeLogarithmicScale,
10 | SizeScale,
11 | GeoFeature,
12 | ProjectionScale,
13 | } from '../../../src';
14 |
15 | export default {
16 | ...Theme,
17 | enhanceApp({ app }) {
18 | app.component(
19 | 'BubbleMapChart',
20 | createTypedChart('bubbleMap', [
21 | ProjectionScale,
22 | BubbleMapController,
23 | SizeScale,
24 | SizeLogarithmicScale,
25 | PointElement,
26 | GeoFeature,
27 | Tooltip,
28 | ])
29 | );
30 | app.component(
31 | 'ChoroplethChart',
32 | createTypedChart('choropleth', [
33 | ProjectionScale,
34 | ChoroplethController,
35 | ColorScale,
36 | ColorLogarithmicScale,
37 | GeoFeature,
38 | Tooltip,
39 | ])
40 | );
41 | },
42 | };
43 |
--------------------------------------------------------------------------------
/LICENSE:
--------------------------------------------------------------------------------
1 | MIT License
2 |
3 | Copyright (c) 2019-2023 Samuel Gratzl
4 |
5 | Permission is hereby granted, free of charge, to any person obtaining a copy
6 | of this software and associated documentation files (the "Software"), to deal
7 | in the Software without restriction, including without limitation the rights
8 | to use, copy, modify, merge, publish, distribute, sublicense, and/or sell
9 | copies of the Software, and to permit persons to whom the Software is
10 | furnished to do so, subject to the following conditions:
11 |
12 | The above copyright notice and this permission notice shall be included in all
13 | copies or substantial portions of the Software.
14 |
15 | THE SOFTWARE IS PROVIDED "AS IS", WITHOUT WARRANTY OF ANY KIND, EXPRESS OR
16 | IMPLIED, INCLUDING BUT NOT LIMITED TO THE WARRANTIES OF MERCHANTABILITY,
17 | FITNESS FOR A PARTICULAR PURPOSE AND NONINFRINGEMENT. IN NO EVENT SHALL THE
18 | AUTHORS OR COPYRIGHT HOLDERS BE LIABLE FOR ANY CLAIM, DAMAGES OR OTHER
19 | LIABILITY, WHETHER IN AN ACTION OF CONTRACT, TORT OR OTHERWISE, ARISING FROM,
20 | OUT OF OR IN CONNECTION WITH THE SOFTWARE OR THE USE OR OTHER DEALINGS IN THE
21 | SOFTWARE.
22 |
--------------------------------------------------------------------------------
/tsconfig.json:
--------------------------------------------------------------------------------
1 | {
2 | "compilerOptions": {
3 | "target": "ES2018",
4 | "module": "ESNext",
5 | "lib": ["DOM", "ES2020"],
6 | "importHelpers": false,
7 | "declaration": false,
8 | "sourceMap": true,
9 | "strict": true,
10 | "removeComments": true,
11 | "verbatimModuleSyntax": false,
12 | "experimentalDecorators": true,
13 | "forceConsistentCasingInFileNames": true,
14 | "strictBindCallApply": true,
15 | "stripInternal": true,
16 | "resolveJsonModule": true,
17 | "noUnusedLocals": true,
18 | "noUnusedParameters": true,
19 | "noImplicitReturns": true,
20 | "noFallthroughCasesInSwitch": true,
21 | "moduleResolution": "Bundler",
22 | "jsx": "react",
23 | "esModuleInterop": true,
24 | "rootDir": "./src",
25 | "baseUrl": "./",
26 | "noEmit": true,
27 | "paths": {
28 | "@": ["./src"],
29 | "*": ["*", "node_modules/*"],
30 | // workaround for: https://github.com/vitest-dev/vitest/issues/4567
31 | "rollup/parseAst": ["./node_modules/rollup/dist/parseAst"]
32 | }
33 | },
34 | "include": ["src/**/*.ts", "src/**/*.tsx", "docs/**/*.tsx"]
35 | }
36 |
--------------------------------------------------------------------------------
/docs/examples/earth.ts:
--------------------------------------------------------------------------------
1 | import type { ChartConfiguration } from 'chart.js';
2 | import { Feature, topojson } from '../../src';
3 |
4 | // #region data
5 | import countries50m from 'world-atlas/countries-50m.json';
6 |
7 | const countries: Feature = topojson.feature(countries50m as any, countries50m.objects.countries as any).features;
8 |
9 | export const data: ChartConfiguration<'choropleth'>['data'] = {
10 | labels: countries.map((d) => d.properties.name),
11 | datasets: [
12 | {
13 | label: 'Countries',
14 | data: countries.map((d) => ({
15 | feature: d,
16 | value: Math.random(),
17 | })),
18 | },
19 | ],
20 | };
21 | // #endregion data
22 | // #region config
23 | export const config: ChartConfiguration<'choropleth'> = {
24 | type: 'choropleth',
25 | data,
26 | options: {
27 | showOutline: true,
28 | showGraticule: true,
29 | scales: {
30 | projection: {
31 | axis: 'x',
32 | projection: 'equalEarth',
33 | },
34 | },
35 | onClick: (evt, elems) => {
36 | console.log(elems.map((elem) => elem.element.feature.properties.name));
37 | },
38 | },
39 | };
40 | // #endregion config
41 |
--------------------------------------------------------------------------------
/docs/related.md:
--------------------------------------------------------------------------------
1 | ---
2 | title: Related Plugins
3 | ---
4 |
5 | There are several related chart.js plugins providing additional functionality and chart types:
6 |
7 | - [chartjs-chart-boxplot](https://github.com/sgratzl/chartjs-chart-boxplot) for rendering boxplots and violin charts
8 | - [chartjs-chart-error-bars](https://github.com/sgratzl/chartjs-chart-error-bars) for rendering errors bars to bars and line charts
9 | - [chartjs-chart-funnel](https://github.com/sgratzl/chartjs-chart-funnel) for rendering funnel charts
10 | - [chartjs-chart-geo](https://github.com/sgratzl/chartjs-chart-geo) for rendering map, bubble maps, and choropleth charts
11 | - [chartjs-chart-graph](https://github.com/sgratzl/chartjs-chart-graph) for rendering graphs, trees, and networks
12 | - [chartjs-chart-pcp](https://github.com/sgratzl/chartjs-chart-pcp) for rendering parallel coordinate plots
13 | - [chartjs-chart-venn](https://github.com/sgratzl/chartjs-chart-venn) for rendering venn and euler diagrams
14 | - [chartjs-chart-wordcloud](https://github.com/sgratzl/chartjs-chart-wordcloud) for rendering word clouds
15 | - [chartjs-plugin-hierarchical](https://github.com/sgratzl/chartjs-plugin-hierarchical) for rendering hierarchical categorical axes which can be expanded and collapsed
16 |
--------------------------------------------------------------------------------
/docs/examples/albers.ts:
--------------------------------------------------------------------------------
1 | import type { ChartConfiguration } from 'chart.js';
2 | import { Feature, topojson } from '../../src';
3 |
4 | // #region data
5 | import states10m from 'us-atlas/states-10m.json';
6 |
7 | const nation: Feature = topojson.feature(states10m as any, states10m.objects.nation as any).features[0];
8 | const states: Feature = topojson.feature(states10m as any, states10m.objects.states as any).features;
9 |
10 | export const data: ChartConfiguration<'choropleth'>['data'] = {
11 | labels: states.map((d) => d.properties.name),
12 | datasets: [
13 | {
14 | label: 'States',
15 | outline: nation,
16 | data: states.map((d) => ({
17 | feature: d,
18 | value: Math.random() * 11,
19 | })),
20 | },
21 | ],
22 | };
23 | // #endregion data
24 | // #region config
25 | export const config: ChartConfiguration<'choropleth'> = {
26 | type: 'choropleth',
27 | data,
28 | options: {
29 | scales: {
30 | projection: {
31 | axis: 'x',
32 | projection: 'albersUsa',
33 | },
34 | color: {
35 | axis: 'x',
36 | quantize: 5,
37 | legend: {
38 | position: 'bottom-right',
39 | align: 'right',
40 | },
41 | },
42 | },
43 | },
44 | };
45 | // #endregion config
46 |
--------------------------------------------------------------------------------
/.github/workflows/deploy_website.yml:
--------------------------------------------------------------------------------
1 | name: Deploy Website
2 | on:
3 | workflow_dispatch: {}
4 | push:
5 | branches:
6 | - main
7 | jobs:
8 | deploy:
9 | runs-on: ubuntu-latest
10 | permissions:
11 | pages: write
12 | id-token: write
13 | environment:
14 | name: github-pages
15 | url: ${{ steps.deployment.outputs.page_url }}
16 | steps:
17 | - uses: actions/checkout@v4
18 | with:
19 | fetch-depth: 0
20 | - uses: actions/setup-node@v4
21 | with:
22 | node-version: 20
23 | cache: npm
24 | - run: npm i -g yarn
25 | - run: yarn config set checksumBehavior ignore
26 | - name: Cache Node.js modules
27 | uses: actions/cache@v4
28 | with:
29 | path: |
30 | ./.yarn/cache
31 | ./.yarn/unplugged
32 | key: ${{ runner.os }}-yarn2-v5-${{ hashFiles('**/yarn.lock') }}
33 | restore-keys: |
34 | ${{ runner.os }}-yarn2-v5
35 | - run: yarn install
36 | - run: yarn docs:build
37 | - uses: actions/configure-pages@v5
38 | - uses: actions/upload-pages-artifact@v3
39 | with:
40 | path: docs/.vitepress/dist
41 | - name: Deploy
42 | id: deployment
43 | uses: actions/deploy-pages@v4
44 |
--------------------------------------------------------------------------------
/docs/examples/bubbleMap.ts:
--------------------------------------------------------------------------------
1 | import type { ChartConfiguration } from 'chart.js';
2 | import { Feature, topojson } from '../../src';
3 | // #region data
4 | import states10m from 'us-atlas/states-10m.json';
5 | import capitals from './data/us-capitals.json';
6 | import ChartDataLabels from 'chartjs-plugin-datalabels';
7 |
8 | const states: Feature = topojson.feature(states10m as any, states10m.objects.states as any).features;
9 |
10 | export const data: ChartConfiguration<'bubbleMap'>['data'] = {
11 | labels: capitals.map((d) => d.description),
12 | datasets: [
13 | {
14 | outline: states,
15 | showOutline: true,
16 | backgroundColor: 'steelblue',
17 | data: capitals.map((d) => Object.assign(d, { value: Math.round(Math.random() * 10) })),
18 | },
19 | ],
20 | };
21 | // #endregion data
22 | // #region config
23 | export const config: ChartConfiguration<'bubbleMap'> = {
24 | type: 'bubbleMap',
25 | data,
26 | options: {
27 | plugins: {
28 | datalabels: {
29 | align: 'top',
30 | formatter: (v) => {
31 | return v.description;
32 | },
33 | },
34 | },
35 | scales: {
36 | projection: {
37 | axis: 'x',
38 | projection: 'albersUsa',
39 | },
40 | size: {
41 | axis: 'x',
42 | size: [1, 20],
43 | },
44 | },
45 | layout: {
46 | // padding: 20
47 | },
48 | },
49 | plugins: [ChartDataLabels],
50 | };
51 | // #endregion config
52 |
--------------------------------------------------------------------------------
/docs/examples/center.ts:
--------------------------------------------------------------------------------
1 | import type { ChartConfiguration } from 'chart.js';
2 | import { Feature, topojson } from '../../src';
3 |
4 | // #region data
5 | import states10m from 'us-atlas/states-10m.json';
6 | import capitals from './data/us-capitals.json';
7 |
8 | const nation: Feature = topojson.feature(states10m as any, states10m.objects.nation as any).features[0];
9 | const states: Feature = topojson.feature(states10m as any, states10m.objects.states as any).features;
10 |
11 | const lookup = new Map(capitals.map(({ name, latitude, longitude }) => [name, { latitude, longitude }]));
12 |
13 | export const data: ChartConfiguration<'choropleth'>['data'] = {
14 | labels: states.map((d) => d.properties.name),
15 | datasets: [
16 | {
17 | label: 'States',
18 | outline: nation,
19 | data: states.map((d) => ({
20 | feature: d,
21 | center: lookup.get(d.properties.name),
22 | value: Math.random() * 11,
23 | })),
24 | },
25 | ],
26 | };
27 | // #endregion data
28 | // #region config
29 | export const config: ChartConfiguration<'choropleth'> = {
30 | type: 'choropleth',
31 | data,
32 | options: {
33 | scales: {
34 | projection: {
35 | axis: 'x',
36 | projection: 'albersUsa',
37 | },
38 | color: {
39 | axis: 'x',
40 | quantize: 5,
41 | legend: {
42 | position: 'bottom-right',
43 | align: 'right',
44 | },
45 | },
46 | },
47 | },
48 | };
49 | // #endregion config
50 |
--------------------------------------------------------------------------------
/.github/workflows/create_release.yml:
--------------------------------------------------------------------------------
1 | name: Create Release
2 | on:
3 | workflow_dispatch:
4 | inputs:
5 | versionName:
6 | description: 'Semantic Version Number (i.e., 5.5.0 or patch, minor, major, prepatch, preminor, premajor, prerelease)'
7 | required: true
8 | default: patch
9 | preid:
10 | description: 'Pre Release Identifier (i.e., alpha, beta)'
11 | required: true
12 | default: alpha
13 | jobs:
14 | create_release:
15 | runs-on: ubuntu-latest
16 | steps:
17 | - name: Check out code
18 | uses: actions/checkout@v4
19 | with:
20 | ref: main
21 | ssh-key: ${{ secrets.PRIVATE_SSH_KEY }}
22 | - name: Reset main branch
23 | run: |
24 | git fetch origin dev:dev
25 | git reset --hard origin/dev
26 | - name: Change version number
27 | id: version
28 | run: |
29 | echo "next_tag=$(npm version --no-git-tag-version ${{ github.event.inputs.versionName }} --preid ${{ github.event.inputs.preid }})" >> $GITHUB_OUTPUT
30 | - name: Create pull request into main
31 | uses: peter-evans/create-pull-request@v7
32 | with:
33 | branch: release/${{ steps.version.outputs.next_tag }}
34 | commit-message: 'chore: release ${{ steps.version.outputs.next_tag }}'
35 | base: main
36 | title: Release ${{ steps.version.outputs.next_tag }}
37 | labels: chore
38 | assignees: sgratzl
39 | body: |
40 | Releasing ${{ steps.version.outputs.next_tag }}.
41 |
--------------------------------------------------------------------------------
/eslint.config.mjs:
--------------------------------------------------------------------------------
1 | // @ts-check
2 |
3 | import eslint from '@eslint/js';
4 | import tseslint from 'typescript-eslint';
5 | import prettier from 'eslint-plugin-prettier';
6 |
7 | export default tseslint.config(eslint.configs.recommended, ...tseslint.configs.recommended, {
8 | plugins: { prettier },
9 | rules: {
10 | '@typescript-eslint/no-explicit-any': 'off',
11 | 'max-classes-per-file': 'off',
12 | 'no-underscore-dangle': 'off',
13 | 'import/extensions': 'off',
14 | },
15 | });
16 |
17 | // import path from "node:path";
18 | // import { fileURLToPath } from "node:url";
19 | // import js from "@eslint/js";
20 | // import { FlatCompat } from "@eslint/eslintrc";
21 |
22 | // const __filename = fileURLToPath(import.meta.url);
23 | // const __dirname = path.dirname(__filename);
24 | // const compat = new FlatCompat({
25 | // baseDirectory: __dirname,
26 | // recommendedConfig: js.configs.recommended,
27 | // allConfig: js.configs.all
28 | // });
29 |
30 | // export default [...fixupConfigRules(compat.extends(
31 | // "airbnb-typescript",
32 | // "react-app",
33 | // "plugin:prettier/recommended",
34 | // "prettier",
35 | // )), {
36 | // plugins: {
37 | // prettier: fixupPluginRules(prettier),
38 | // },
39 |
40 | // languageOptions: {
41 | // ecmaVersion: 5,
42 | // sourceType: "script",
43 |
44 | // parserOptions: {
45 | // project: "./tsconfig.eslint.json",
46 | // },
47 | // },
48 |
49 | // settings: {
50 | // react: {
51 | // version: "99.99.99",
52 | // },
53 | // },
54 |
55 | // rules: {
56 | // "@typescript-eslint/no-explicit-any": "off",
57 | // "max-classes-per-file": "off",
58 | // "no-underscore-dangle": "off",
59 | // "import/extensions": "off",
60 | // },
61 | // }];
62 |
--------------------------------------------------------------------------------
/samples/geo.html:
--------------------------------------------------------------------------------
1 |
2 |
3 |
4 |
5 |
6 |
7 |
8 |
9 |
10 |
11 |
12 |
53 |
54 |
55 |
--------------------------------------------------------------------------------
/docs/.vitepress/config.ts:
--------------------------------------------------------------------------------
1 | import { defineConfig } from 'vitepress';
2 | import { name, description, repository, license, author } from '../../package.json';
3 | import typedocSidebar from '../api/typedoc-sidebar.json';
4 |
5 | const cleanName = name.replace('@sgratzl/', '');
6 |
7 | // https://vitepress.dev/reference/site-config
8 | export default defineConfig({
9 | title: cleanName,
10 | description,
11 | base: `/${cleanName}/`,
12 | useWebFonts: false,
13 | themeConfig: {
14 | // https://vitepress.dev/reference/default-theme-config
15 | nav: [
16 | { text: 'Home', link: '/' },
17 | { text: 'Getting Started', link: '/getting-started' },
18 | { text: 'Examples', link: '/examples/' },
19 | { text: 'API', link: '/api/' },
20 | { text: 'Related Plugins', link: '/related' },
21 | ],
22 |
23 | sidebar: [
24 | {
25 | text: 'Examples',
26 | items: [
27 | { text: 'Basic', link: '/examples/' },
28 | { text: 'Choropleth US Map', link: '/examples/choropleth' },
29 | { text: 'Bubble Map', link: '/examples/bubbleMap' },
30 | { text: 'Custom Color Scale', link: '/examples/custom' },
31 | { text: 'Legend Customization', link: '/examples/legend' },
32 | { text: 'Tooltip Center', link: '/examples/center' },
33 | { text: 'Projection Offset', link: '/examples/offset' },
34 | { text: 'Equal Earth Projection', link: '/examples/projection' },
35 | { text: 'World Atlas', link: '/examples/earth' },
36 | { text: 'Bubble Map Area Mode', link: '/examples/area' },
37 | ],
38 | },
39 | {
40 | text: 'API',
41 | collapsed: true,
42 | items: typedocSidebar,
43 | },
44 | ],
45 |
46 | socialLinks: [{ icon: 'github', link: repository.url.replace('.git', '') }],
47 |
48 | footer: {
49 | message: `Released under the ${license} license.`,
53 | copyright: `Copyright © 2019-present ${author.name}`,
54 | },
55 |
56 | editLink: {
57 | pattern: `${repository.url.replace('.git', '')}/edit/main/docs/:path`,
58 | },
59 |
60 | search: {
61 | provider: 'local',
62 | },
63 | },
64 | });
65 |
--------------------------------------------------------------------------------
/src/__tests__/createChart.ts:
--------------------------------------------------------------------------------
1 | ///
2 |
3 | import { expect } from 'vitest';
4 | import { Chart, ChartConfiguration, defaults, ChartType, DefaultDataPoint } from 'chart.js';
5 | import { toMatchImageSnapshot, MatchImageSnapshotOptions } from 'jest-image-snapshot';
6 | import 'canvas-5-polyfill';
7 |
8 | expect.extend({ toMatchImageSnapshot });
9 |
10 | function toBuffer(canvas: HTMLCanvasElement) {
11 | return new Promise((resolve) => {
12 | canvas.toBlob((b) => {
13 | const file = new FileReader();
14 | file.onload = () => resolve(Buffer.from(file.result as ArrayBuffer));
15 |
16 | file.readAsArrayBuffer(b!);
17 | });
18 | });
19 | }
20 |
21 | export async function expectMatchSnapshot(canvas: HTMLCanvasElement): Promise {
22 | const image = await toBuffer(canvas);
23 | expect(image).toMatchImageSnapshot();
24 | }
25 |
26 | export interface ChartHelper, LABEL = string> {
27 | chart: Chart;
28 | canvas: HTMLCanvasElement;
29 | ctx: CanvasRenderingContext2D;
30 | toMatchImageSnapshot(options?: MatchImageSnapshotOptions): Promise;
31 | }
32 |
33 | export default function createChart<
34 | TYPE extends ChartType,
35 | DATA extends unknown[] = DefaultDataPoint,
36 | LABEL = string,
37 | >(config: ChartConfiguration, width = 800, height = 600): ChartHelper {
38 | const canvas = document.createElement('canvas');
39 | canvas.width = width;
40 | canvas.height = height;
41 | Object.assign(defaults.font, { family: 'Courier New' });
42 | // defaults.color = 'transparent';
43 |
44 | config.options = {
45 | responsive: false,
46 | animation: {
47 | duration: 1,
48 | },
49 | plugins: {
50 | legend: {
51 | display: false,
52 | },
53 | title: {
54 | display: false,
55 | },
56 | },
57 | ...(config.options || {}),
58 | } as any;
59 |
60 | const ctx = canvas.getContext('2d')!;
61 |
62 | const t = new Chart(ctx, config);
63 |
64 | return {
65 | chart: t,
66 | canvas,
67 | ctx,
68 | async toMatchImageSnapshot(options?: MatchImageSnapshotOptions) {
69 | await new Promise((resolve) => setTimeout(resolve, 100));
70 |
71 | const image = await toBuffer(canvas);
72 | expect(image).toMatchImageSnapshot(options);
73 | },
74 | };
75 | }
76 |
--------------------------------------------------------------------------------
/src/controllers/__tests__/data.ts:
--------------------------------------------------------------------------------
1 | const raw = `Alabama,Montgomery,32.377716,-86.300568
2 | Alaska,Juneau,58.301598,-134.420212
3 | Arizona,Phoenix,33.448143,-112.096962
4 | Arkansas,Little Rock,34.746613,-92.288986
5 | California,Sacramento,38.576668,-121.493629
6 | Colorado,Denver,39.739227,-104.984856
7 | Connecticut,Hartford,41.764046,-72.682198
8 | Delaware,Dover,39.157307,-75.519722
9 | Hawaii,Honolulu,21.307442,-157.857376
10 | Florida,Tallahassee,30.438118,-84.281296
11 | Georgia,Atlanta,33.749027,-84.388229
12 | Idaho,Boise,43.617775,-116.199722
13 | Illinois,Springfield,39.798363,-89.654961
14 | Indiana,Indianapolis,39.768623,-86.162643
15 | Iowa,Des Moines,41.591087,-93.603729
16 | Kansas,Topeka,39.048191,-95.677956
17 | Kentucky,Frankfort,38.186722,-84.875374
18 | Louisiana,Baton Rouge,30.457069,-91.187393
19 | Maine,Augusta,44.307167,-69.781693
20 | Maryland,Annapolis,38.978764,-76.490936
21 | Massachusetts,Boston,42.358162,-71.063698
22 | Michigan,Lansing,42.733635,-84.555328
23 | Minnesota,St. Paul,44.955097,-93.102211
24 | Mississippi,Jackson,32.303848,-90.182106
25 | Missouri,Jefferson City,38.579201,-92.172935
26 | Montana,Helena,46.585709,-112.018417
27 | Nebraska,Lincoln,40.808075,-96.699654
28 | Nevada,Carson City,39.163914,-119.766121
29 | New Hampshire,Concord,43.206898,-71.537994
30 | New Jersey,Trenton,40.220596,-74.769913
31 | New Mexico,Santa Fe,35.68224,-105.939728
32 | North Carolina,Raleigh,35.78043,-78.639099
33 | North Dakota,Bismarck,46.82085,-100.783318
34 | New York,Albany,42.652843,-73.757874
35 | Ohio,Columbus,39.961346,-82.999069
36 | Oklahoma,Oklahoma City,35.492207,-97.503342
37 | Oregon,Salem,44.938461,-123.030403
38 | Pennsylvania,Harrisburg,40.264378,-76.883598
39 | Rhode Island,Providence,41.830914,-71.414963
40 | South Carolina,Columbia,34.000343,-81.033211
41 | South Dakota,Pierre,44.367031,-100.346405
42 | Tennessee,Nashville,36.16581,-86.784241
43 | Texas,Austin,30.27467,-97.740349
44 | Utah,Salt Lake City,40.777477,-111.888237
45 | Vermont,Montpelier,44.262436,-72.580536
46 | Virginia,Richmond,37.538857,-77.43364
47 | Washington,Olympia,47.035805,-122.905014
48 | West Virginia,Charleston,38.336246,-81.612328
49 | Wisconsin,Madison,43.074684,-89.384445
50 | Wyoming,Cheyenne,41.140259,-104.820236`;
51 |
52 | export default raw.split('\n').map((line) => {
53 | const [name, description, latitude, longitude] = line.split(',');
54 | return { name, description, latitude: Number.parseFloat(latitude), longitude: Number.parseFloat(longitude) };
55 | });
56 |
--------------------------------------------------------------------------------
/.gitattributes:
--------------------------------------------------------------------------------
1 | # These settings are for any web project
2 |
3 | # Handle line endings automatically for files detected as text
4 | # and leave all files detected as binary untouched.
5 | * text=auto eol=lf
6 |
7 | #
8 | # The above will handle all files NOT found below
9 | #
10 |
11 | #
12 | ## These files are text and should be normalized (Convert crlf => lf)
13 | #
14 |
15 | # source code
16 | *.php text
17 | *.css text
18 | *.sass text
19 | *.scss text
20 | *.less text
21 | *.styl text
22 | *.js text
23 | *.jsx text
24 | *.ts text
25 | *.tsx text
26 | *.coffee text
27 | *.json text
28 | *.htm text
29 | *.html text
30 | *.xml text
31 | *.txt text
32 | *.ini text
33 | *.inc text
34 | *.pl text
35 | *.rb text
36 | *.py text
37 | *.scm text
38 | *.sql text
39 | *.sh text eof=LF
40 | *.bat text
41 |
42 | # templates
43 | *.hbt text
44 | *.jade text
45 | *.haml text
46 | *.hbs text
47 | *.dot text
48 | *.tmpl text
49 | *.phtml text
50 |
51 | # server config
52 | .htaccess text
53 |
54 | # git config
55 | .gitattributes text
56 | .gitignore text
57 |
58 | # code analysis config
59 | .jshintrc text
60 | .jscsrc text
61 | .jshintignore text
62 | .csslintrc text
63 |
64 | # misc config
65 | *.yaml text
66 | *.yml text
67 | .editorconfig text
68 |
69 | # build config
70 | *.npmignore text
71 | *.bowerrc text
72 | Dockerfile text eof=LF
73 |
74 | # Heroku
75 | Procfile text
76 | .slugignore text
77 |
78 | # Documentation
79 | *.md text
80 | LICENSE text
81 | AUTHORS text
82 |
83 |
84 | #
85 | ## These files are binary and should be left untouched
86 | #
87 |
88 | # (binary is a macro for -text -diff)
89 | *.png binary
90 | *.jpg binary
91 | *.jpeg binary
92 | *.gif binary
93 | *.ico binary
94 | *.mov binary
95 | *.mp4 binary
96 | *.mp3 binary
97 | *.flv binary
98 | *.fla binary
99 | *.swf binary
100 | *.gz binary
101 | *.zip binary
102 | *.7z binary
103 | *.ttf binary
104 | *.pyc binary
105 | *.pdf binary
106 |
107 | # Source files
108 | # ============
109 | *.pxd text
110 | *.py text
111 | *.py3 text
112 | *.pyw text
113 | *.pyx text
114 | *.sh text eol=lf
115 | *.json text
116 |
117 | # Binary files
118 | # ============
119 | *.db binary
120 | *.p binary
121 | *.pkl binary
122 | *.pyc binary
123 | *.pyd binary
124 | *.pyo binary
125 |
126 | # Note: .db, .p, and .pkl files are associated
127 | # with the python modules ``pickle``, ``dbm.*``,
128 | # ``shelve``, ``marshal``, ``anydbm``, & ``bsddb``
129 | # (among others).
130 |
--------------------------------------------------------------------------------
/docs/getting-started.md:
--------------------------------------------------------------------------------
1 | ---
2 | title: Getting Started
3 | ---
4 |
5 | Chart.js module for charting maps with legends. Adding new chart types: `choropleth` and `bubbleMap`.
6 |
7 | 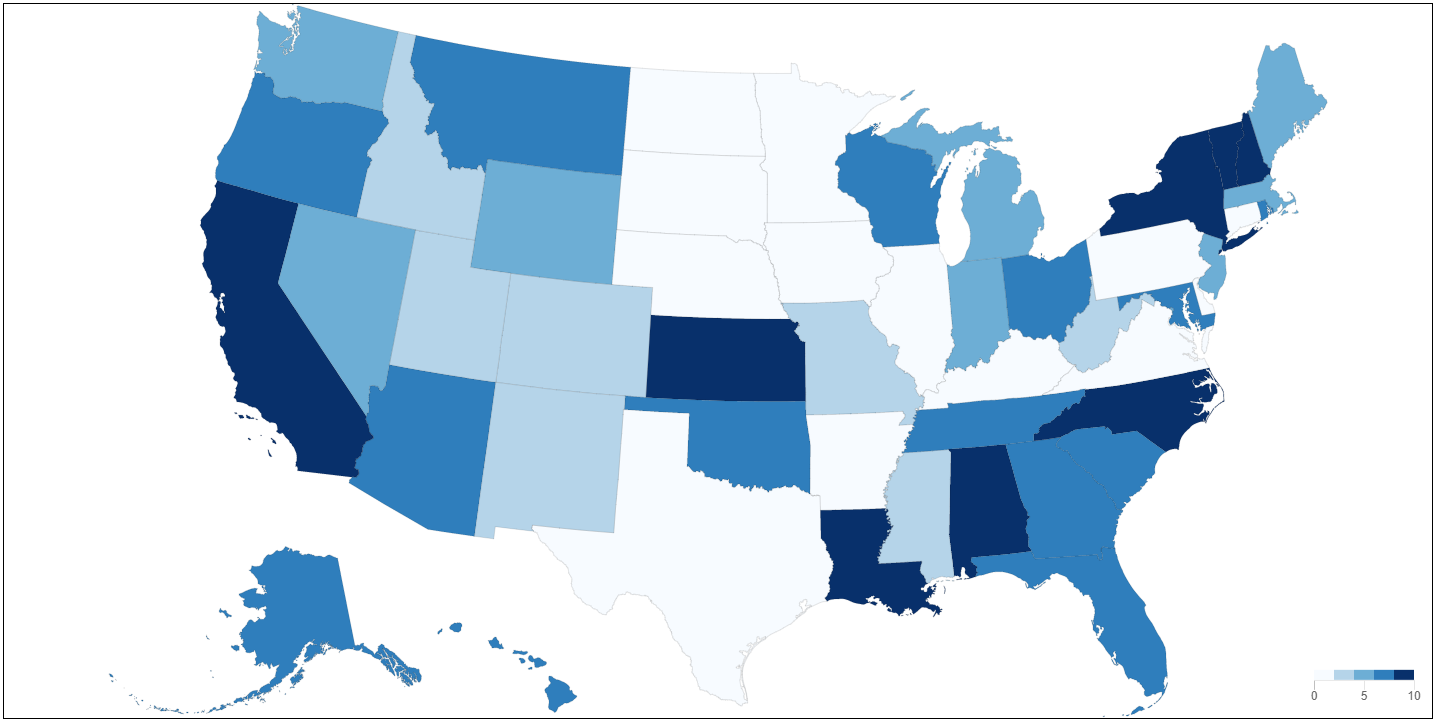
8 |
9 | [CodePen](https://codepen.io/sgratzl/pen/gOaBQep)
10 |
11 | 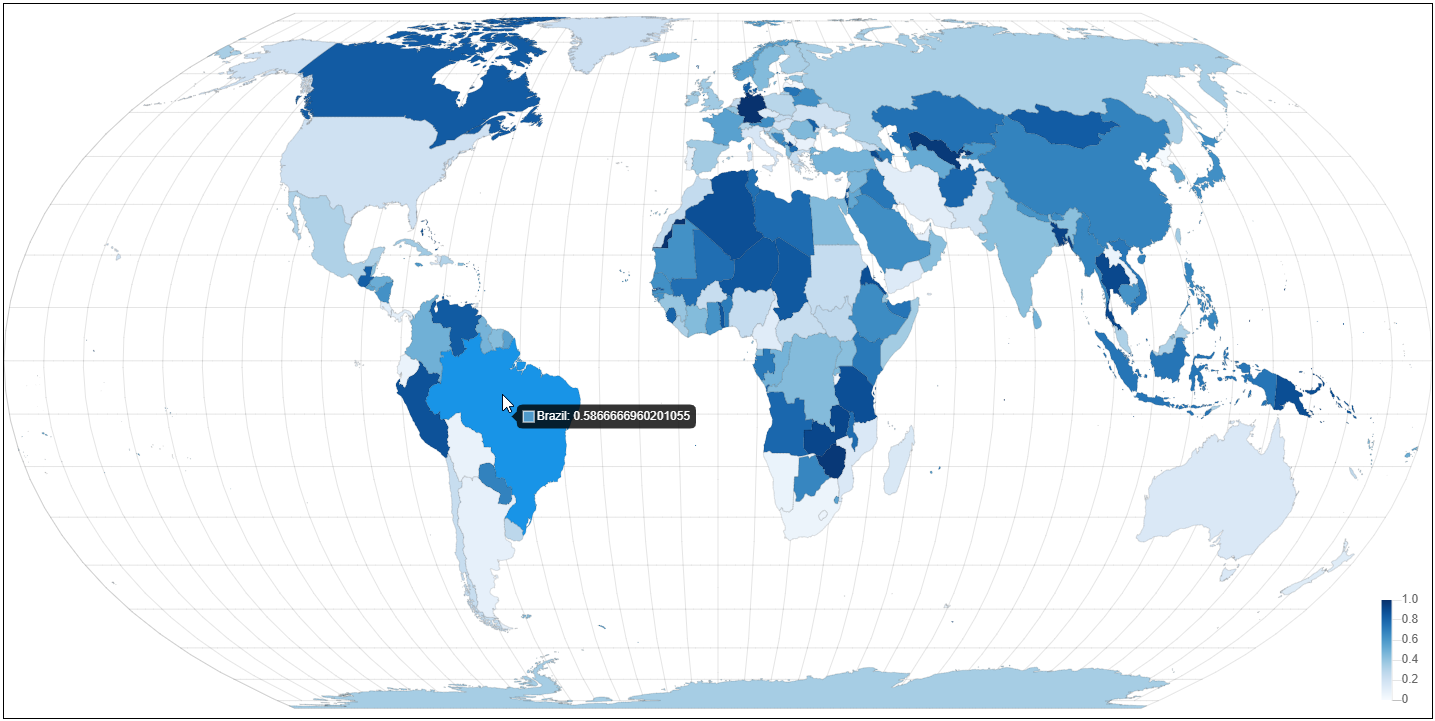
12 |
13 | [CodePen](https://codepen.io/sgratzl/pen/bGVmQKw)
14 |
15 | 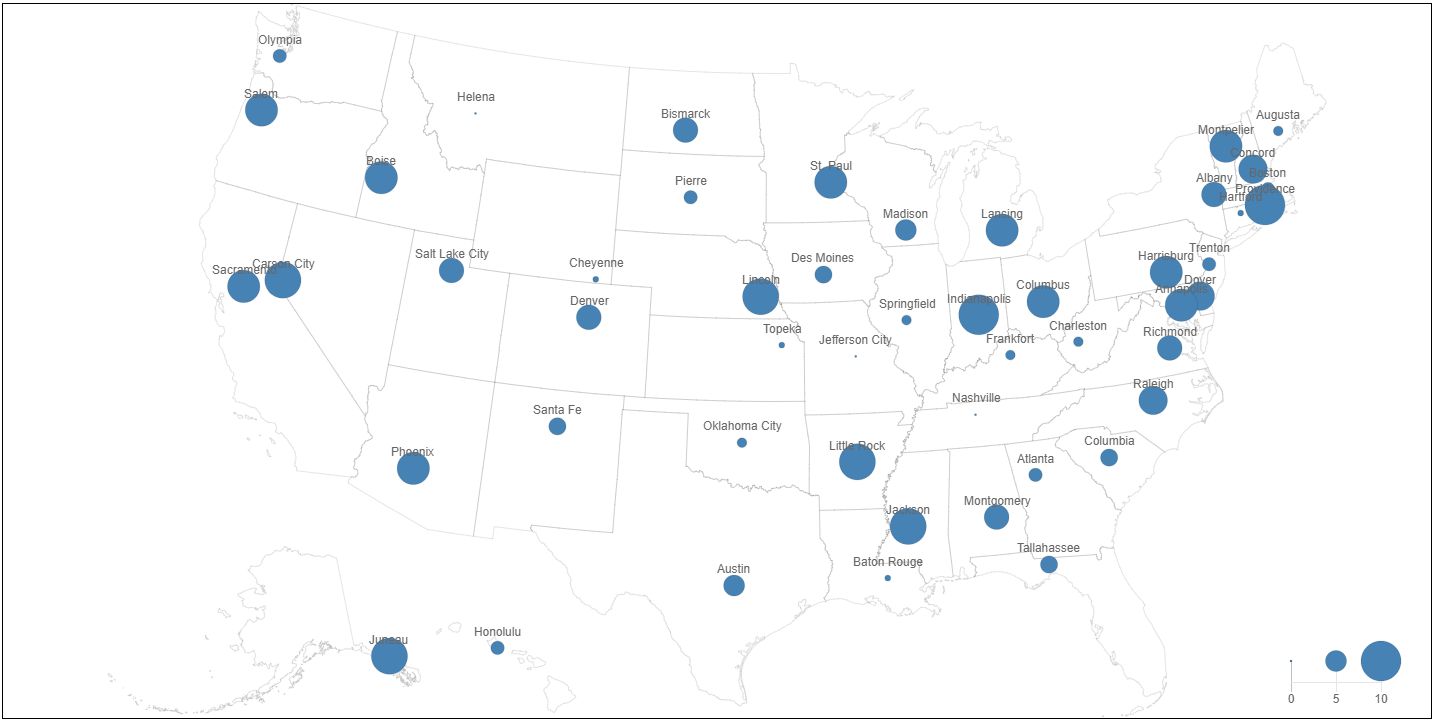
16 |
17 | [CodePen](https://codepen.io/sgratzl/pen/YzyJRvm)
18 |
19 | works great with https://github.com/chartjs/chartjs-plugin-datalabels
20 |
21 | ## Install
22 |
23 | ```sh
24 | npm install chart.js chartjs-chart-geo
25 | ```
26 |
27 | ## Usage
28 |
29 | see [Examples](./examples/)
30 |
31 | CodePens
32 |
33 | - [Choropleth](https://codepen.io/sgratzl/pen/gOaBQep)
34 | - [Earth Choropleth](https://codepen.io/sgratzl/pen/bGVmQKw)
35 | - [Bubble Map](https://codepen.io/sgratzl/pen/YzyJRvm)
36 |
37 | ## Choropleth
38 |
39 | A choropleth map is a geo visualization where the area of a geometric feature encodes a value. For example [Choropleth](./examples/choropleth.md).
40 |
41 | ::: warning
42 | This plugin is _not_ providing the geometric data files (like GeoJson or TopoJson) but they need to manually imported and defined.
43 | :::
44 |
45 | Each data point is an object with a feature and a corresponding value. see also [IChoroplethDataPoint](/api/interfaces/IChoroplethDataPoint.html)
46 |
47 | ### Configuration
48 |
49 | The controller has the following options [IChoroplethControllerDatasetOptions](/api/interfaces/IChoroplethControllerDatasetOptions.html).
50 | In addition, the projection of the geometric feature to the pixel space is defined in the `projection` scale. see [IProjectionScaleOptions](/api/interfaces/IProjectionScaleOptions.html) for available options. The conversion from a value to a color is performed by the `color` scale. see [IColorScaleOptions](/api/interfaces/IColorScaleOptions.html) for available options.
51 |
52 | ## Bubble Map
53 |
54 | A bubble is using the area / radius of a circle to encode a value at a specific latitude / longitude. For example [BubbleMap](./examples/bubbleMap.md). Therefore, a data point has to look like this [IBubbleMapDataPoint](/api/interfaces/IBubbleMapDataPoint.html).
55 |
56 | ### Configuration
57 |
58 | The controller has the following options [IBubbleMapControllerDatasetOptions](/api/interfaces/IBubbleMapControllerDatasetOptions.html).
59 | In addition, the projection of the geometric feature to the pixel space is defined in the `projection` scale. see [IProjectionScaleOptions](/api/interfaces/IProjectionScaleOptions.html) for available options. The conversion from a value to a radius / area is performed by the `size` scale. see [ISizeScaleOptions](/api/interfaces/ISizeScaleOptions.html) for available options.
60 |
--------------------------------------------------------------------------------
/.github/workflows/release_helper.yml:
--------------------------------------------------------------------------------
1 | name: Release Helper
2 | on:
3 | push:
4 | branches:
5 | - main
6 |
7 | jobs:
8 | correct_repository:
9 | runs-on: ubuntu-latest
10 | steps:
11 | - name: fail on fork
12 | if: github.repository_owner != 'sgratzl'
13 | run: exit 1
14 |
15 | create_release:
16 | needs: correct_repository
17 | runs-on: ubuntu-latest
18 | steps:
19 | - name: Check out code
20 | uses: actions/checkout@v4
21 | - uses: actions/setup-node@v4
22 | with:
23 | node-version: 20
24 | - name: Extract version
25 | id: extract_version
26 | run: |
27 | node -pe "'version=' + require('./package.json').version" >> $GITHUB_OUTPUT
28 | node -pe "'npm_tag=' + (require('./package.json').version.includes('-') ? 'next' : 'latest')" >> $GITHUB_OUTPUT
29 | - name: Print version
30 | run: |
31 | echo "releasing ${{ steps.extract_version.outputs.version }} with tag ${{ steps.extract_version.outputs.npm_tag }}"
32 | - name: Create Release
33 | id: create_release
34 | uses: release-drafter/release-drafter@v6
35 | env:
36 | GITHUB_TOKEN: ${{ secrets.GITHUB_TOKEN }}
37 | with:
38 | name: v${{ steps.extract_version.outputs.version }}
39 | tag: v${{ steps.extract_version.outputs.version }}
40 | version: ${{ steps.extract_version.outputs.version }}
41 | prerelease: ${{ needs.create_release.outputs.tag_name == 'next' }}
42 | publish: true
43 | outputs:
44 | version: ${{ steps.extract_version.outputs.version }}
45 | npm_tag: ${{ steps.extract_version.outputs.npm_tag }}
46 | upload_url: ${{ steps.create_release.outputs.upload_url }}
47 | tag_name: ${{ steps.create_release.outputs.tag_name }}
48 |
49 | build_assets:
50 | needs: create_release
51 | runs-on: ubuntu-latest
52 | steps:
53 | - name: Check out code
54 | uses: actions/checkout@v4
55 | - uses: actions/setup-node@v4
56 | with:
57 | node-version: 20
58 | - run: npm i -g yarn
59 | - run: yarn config set checksumBehavior ignore
60 | - name: Cache Node.js modules
61 | uses: actions/cache@v4
62 | with:
63 | path: |
64 | ./.yarn/cache
65 | ./.yarn/unplugged
66 | key: ${{ runner.os }}-yarn2-v5-${{ hashFiles('**/yarn.lock') }}
67 | restore-keys: |
68 | ${{ runner.os }}-yarn2-v5
69 | - run: yarn install
70 | - run: yarn build
71 | - run: yarn pack
72 | - name: Upload Release Asset
73 | uses: AButler/upload-release-assets@v3.0
74 | with:
75 | files: 'package.tgz'
76 | repo-token: ${{ secrets.GITHUB_TOKEN }}
77 | release-tag: ${{ needs.create_release.outputs.tag_name }}
78 | - name: Pack Publish
79 | run: |
80 | yarn config set npmAuthToken "${{ secrets.NPM_TOKEN }}"
81 | yarn pack
82 | yarn npm publish --tag "${{ needs.create_release.outputs.npm_tag }}"
83 |
84 | sync_dev:
85 | needs: correct_repository
86 | runs-on: ubuntu-latest
87 | steps:
88 | - name: Check out code
89 | uses: actions/checkout@v4
90 | with:
91 | ref: dev
92 | ssh-key: ${{ secrets.PRIVATE_SSH_KEY }}
93 | - name: Reset dev branch
94 | run: |
95 | git fetch origin main:main
96 | git merge main
97 | git push
98 |
--------------------------------------------------------------------------------
/package.json:
--------------------------------------------------------------------------------
1 | {
2 | "name": "chartjs-chart-geo",
3 | "description": "Chart.js module for charting maps",
4 | "version": "4.3.6",
5 | "author": {
6 | "name": "Samuel Gratzl",
7 | "email": "sam@sgratzl.com",
8 | "url": "https://www.sgratzl.com"
9 | },
10 | "license": "MIT",
11 | "homepage": "https://github.com/sgratzl/chartjs-chart-geo",
12 | "bugs": {
13 | "url": "https://github.com/sgratzl/chartjs-chart-geo/issues"
14 | },
15 | "keywords": [
16 | "chart.js",
17 | "geo",
18 | "map",
19 | "choropleth",
20 | "bubble-map"
21 | ],
22 | "repository": {
23 | "type": "git",
24 | "url": "https://github.com/sgratzl/chartjs-chart-geo.git"
25 | },
26 | "global": "ChartGeo",
27 | "type": "module",
28 | "main": "build/index.js",
29 | "module": "build/index.js",
30 | "require": "build/index.cjs",
31 | "umd": "build/index.umd.js",
32 | "unpkg": "build/index.umd.min.js",
33 | "jsdelivr": "build/index.umd.min.js",
34 | "types": "build/index.d.ts",
35 | "exports": {
36 | ".": {
37 | "import": "./build/index.js",
38 | "require": "./build/index.cjs",
39 | "scripts": "./build/index.umd.min.js",
40 | "types": "./build/index.d.ts"
41 | }
42 | },
43 | "sideEffects": false,
44 | "files": [
45 | "build",
46 | "src/**/*.ts"
47 | ],
48 | "peerDependencies": {
49 | "chart.js": "^4.1.0"
50 | },
51 | "dependencies": {
52 | "@types/d3-geo": "^3.1.0",
53 | "@types/d3-scale-chromatic": "^3.1.0",
54 | "@types/topojson-client": "^3.1.5",
55 | "d3-array": "^3.2.4",
56 | "d3-color": "^3.1.0",
57 | "d3-geo": "^3.1.1",
58 | "d3-interpolate": "^3.0.1",
59 | "d3-scale-chromatic": "^3.1.0",
60 | "topojson-client": "^3.1.0"
61 | },
62 | "devDependencies": {
63 | "@chiogen/rollup-plugin-terser": "^7.1.3",
64 | "@eslint/js": "^9.37.0",
65 | "@rollup/plugin-commonjs": "^28.0.6",
66 | "@rollup/plugin-node-resolve": "^16.0.2",
67 | "@rollup/plugin-replace": "^6.0.2",
68 | "@rollup/plugin-typescript": "^12.1.4",
69 | "@types/jest-image-snapshot": "^6.4.0",
70 | "@types/node": "^24.6.2",
71 | "@types/seedrandom": "^3",
72 | "@yarnpkg/sdks": "^3.2.3",
73 | "canvas": "^3.2.0",
74 | "canvas-5-polyfill": "^0.1.5",
75 | "chart.js": "^4.5.0",
76 | "chartjs-plugin-datalabels": "^2.2.0",
77 | "eslint": "^9.37.0",
78 | "eslint-plugin-prettier": "^5.5.4",
79 | "jest-image-snapshot": "^6.5.1",
80 | "jsdom": "^27.0.0",
81 | "prettier": "^3.6.2",
82 | "rimraf": "^6.0.1",
83 | "rollup": "^4.52.4",
84 | "rollup-plugin-cleanup": "^3.2.1",
85 | "rollup-plugin-dts": "^6.2.3",
86 | "seedrandom": "^3.0.5",
87 | "ts-jest": "^29.4.4",
88 | "tslib": "^2.8.1",
89 | "typedoc": "^0.28.13",
90 | "typedoc-plugin-markdown": "^4.9.0",
91 | "typedoc-vitepress-theme": "^1.1.2",
92 | "typescript": "^5.9.3",
93 | "typescript-eslint": "^8.45.0",
94 | "us-atlas": "^3.0.1",
95 | "vite": "^7.1.9",
96 | "vitepress": "^1.6.4",
97 | "vitest": "^3.2.4",
98 | "vue": "^3.5.22",
99 | "vue-chartjs": "^5.3.2",
100 | "world-atlas": "^2.0.2"
101 | },
102 | "scripts": {
103 | "clean": "rimraf --glob build node_modules \"*.tgz\" \"*.tsbuildinfo\"",
104 | "compile": "tsc -b tsconfig.c.json",
105 | "start": "yarn run watch",
106 | "watch": "rollup -c -w",
107 | "build": "rollup -c",
108 | "test": "vitest --passWithNoTests",
109 | "test:watch": "yarn run test --watch",
110 | "test:coverage": "yarn run test --coverage",
111 | "lint": "yarn run eslint && yarn run prettier",
112 | "fix": "yarn run eslint:fix && yarn run prettier:write",
113 | "prettier:write": "prettier \"*\" \"*/**\" --write",
114 | "prettier": "prettier \"*\" \"*/**\" --check",
115 | "eslint": "eslint src --cache",
116 | "eslint:fix": "yarn run eslint --fix",
117 | "prepare": "yarn run build",
118 | "docs:api": "typedoc --options typedoc.json",
119 | "docs:dev": "vitepress dev docs",
120 | "docs:build": "yarn run docs:api && vitepress build docs",
121 | "docs:preview": "vitepress preview docs"
122 | },
123 | "packageManager": "yarn@4.10.3"
124 | }
125 |
--------------------------------------------------------------------------------
/rollup.config.js:
--------------------------------------------------------------------------------
1 | import commonjs from '@rollup/plugin-commonjs';
2 | import resolve from '@rollup/plugin-node-resolve';
3 | import cleanup from 'rollup-plugin-cleanup';
4 | import dts from 'rollup-plugin-dts';
5 | import typescript from '@rollup/plugin-typescript';
6 | import { terser } from '@chiogen/rollup-plugin-terser';
7 | import replace from '@rollup/plugin-replace';
8 |
9 | import fs from 'fs';
10 |
11 | const pkg = JSON.parse(fs.readFileSync('./package.json'));
12 |
13 | function resolveYear() {
14 | // Extract copyrights from the LICENSE.
15 | const license = fs.readFileSync('./LICENSE', 'utf-8').toString();
16 | const matches = Array.from(license.matchAll(/\(c\) (\d+-\d+)/gm));
17 | if (!matches || matches.length === 0) {
18 | return 2021;
19 | }
20 | return matches[matches.length - 1][1];
21 | }
22 | const year = resolveYear();
23 |
24 | const banner = `/**
25 | * ${pkg.name}
26 | * ${pkg.homepage}
27 | *
28 | * Copyright (c) ${year} ${pkg.author.name} <${pkg.author.email}>
29 | */
30 | `;
31 |
32 | /**
33 | * defines which formats (umd, esm, cjs, types) should be built when watching
34 | */
35 | const watchOnly = ['umd'];
36 |
37 | const isDependency = (v) => Object.keys(pkg.dependencies || {}).some((e) => e === v || v.startsWith(`${e}/`));
38 | const isPeerDependency = (v) => Object.keys(pkg.peerDependencies || {}).some((e) => e === v || v.startsWith(`${e}/`));
39 |
40 | export default function Config(options) {
41 | const buildFormat = (format) => {
42 | return !options.watch || watchOnly.includes(format);
43 | };
44 | const commonOutput = {
45 | sourcemap: true,
46 | banner,
47 | globals: {
48 | 'chart.js': 'Chart',
49 | 'chart.js/helpers': 'Chart.helpers',
50 | },
51 | };
52 |
53 | const base = {
54 | input: './src/index.ts',
55 | external: (v) => isDependency(v) || isPeerDependency(v),
56 | plugins: [
57 | typescript(),
58 | resolve({
59 | mainFields: ['module', 'main'],
60 | extensions: ['.mjs', '.cjs', '.js', '.jsx', '.json', '.node'],
61 | modulesOnly: true,
62 | }),
63 | commonjs(),
64 | replace({
65 | preventAssignment: true,
66 | values: {
67 | // eslint-disable-next-line no-undef
68 | 'process.env.NODE_ENV': JSON.stringify(process.env.NODE_ENV) || 'production',
69 | __VERSION__: JSON.stringify(pkg.version),
70 | },
71 | }),
72 | cleanup({
73 | comments: ['some', 'ts', 'ts3s'],
74 | extensions: ['ts', 'tsx', 'js', 'jsx'],
75 | include: './src/**/*',
76 | }),
77 | ],
78 | };
79 | return [
80 | buildFormat('esm') && {
81 | ...base,
82 | output: {
83 | ...commonOutput,
84 | file: pkg.module,
85 | format: 'esm',
86 | },
87 | },
88 | buildFormat('cjs') && {
89 | ...base,
90 | output: {
91 | ...commonOutput,
92 | file: pkg.require,
93 | format: 'cjs',
94 | },
95 | external: (v) => (isDependency(v) || isPeerDependency(v)) && ['d3-'].every((di) => !v.includes(di)),
96 | },
97 | (buildFormat('umd') || buildFormat('umd-min')) && {
98 | ...base,
99 | input: './src/index.umd.ts',
100 | output: [
101 | buildFormat('umd') && {
102 | ...commonOutput,
103 | file: pkg.umd,
104 | format: 'umd',
105 | name: pkg.global,
106 | },
107 | buildFormat('umd-min') && {
108 | ...commonOutput,
109 | file: pkg.unpkg,
110 | format: 'umd',
111 | name: pkg.global,
112 | plugins: [terser()],
113 | },
114 | ].filter(Boolean),
115 | external: (v) => isPeerDependency(v),
116 | },
117 | buildFormat('types') && {
118 | ...base,
119 | output: {
120 | ...commonOutput,
121 | file: pkg.types,
122 | format: 'es',
123 | },
124 | plugins: [
125 | dts({
126 | respectExternal: true,
127 | compilerOptions: {
128 | skipLibCheck: true,
129 | skipDefaultLibCheck: true,
130 | },
131 | }),
132 | ],
133 | },
134 | ].filter(Boolean);
135 | }
136 |
--------------------------------------------------------------------------------
/src/controllers/ChoroplethController.spec.ts:
--------------------------------------------------------------------------------
1 | import { feature } from 'topojson-client';
2 | import { createRequire } from 'module';
3 | import rnd from 'seedrandom';
4 | import { registry } from 'chart.js';
5 | import createChart from '../__tests__/createChart';
6 | import {
7 | ColorLogarithmicScale,
8 | ColorScale,
9 | ProjectionScale,
10 | IProjectionScaleOptions,
11 | IColorScaleOptions,
12 | } from '../scales';
13 | import { ChoroplethController } from './ChoroplethController';
14 | import { GeoFeature } from '../elements';
15 | import { describe, beforeAll, test } from 'vitest';
16 | const require = createRequire(import.meta.url); // construct the require method
17 | const states10m = require('us-atlas/states-10m.json');
18 | const countries50m = require('world-atlas/countries-50m.json');
19 |
20 | describe('choropleth', () => {
21 | beforeAll(() => {
22 | registry.addControllers(ChoroplethController);
23 | registry.addScales(ProjectionScale, ColorScale, ColorLogarithmicScale);
24 | registry.addElements(GeoFeature);
25 | });
26 |
27 | test('default', async () => {
28 | const random = rnd('default');
29 | const us = states10m as any;
30 | const nation = (feature(us, us.objects.nation) as any).features[0];
31 | const states = (feature(us, us.objects.states) as any).features as any[];
32 |
33 | const chart = createChart({
34 | type: ChoroplethController.id,
35 | data: {
36 | labels: states.map((d) => d.properties.name),
37 | datasets: [
38 | {
39 | label: 'States',
40 | outline: nation,
41 | data: states.map((d) => ({
42 | feature: d,
43 | value: random() * 10,
44 | })),
45 | },
46 | ],
47 | },
48 | options: {
49 | scales: {
50 | projection: {
51 | axis: 'x',
52 | projection: 'albersUsa',
53 | } as Partial,
54 | color: {
55 | axis: 'x',
56 | quantize: 5,
57 | ticks: {
58 | display: false,
59 | },
60 | legend: {
61 | position: 'bottom-right',
62 | align: 'right',
63 | },
64 | } as Partial,
65 | },
66 | },
67 | });
68 |
69 | return chart.toMatchImageSnapshot();
70 | });
71 |
72 | test('log', async () => {
73 | const random = rnd('log');
74 | const us = states10m as any;
75 | const nation = (feature(us, us.objects.nation) as any).features[0];
76 | const states = (feature(us, us.objects.states) as any).features;
77 |
78 | const chart = createChart({
79 | type: ChoroplethController.id,
80 | data: {
81 | labels: states.map((d: any) => d.properties.name),
82 | datasets: [
83 | {
84 | label: 'States',
85 | outline: nation,
86 | data: states.map((d: any) => ({
87 | feature: d,
88 | value: random() * 10,
89 | })),
90 | },
91 | ],
92 | },
93 | options: {
94 | scales: {
95 | projection: {
96 | axis: 'x',
97 | projection: 'albersUsa',
98 | } as Partial,
99 | color: {
100 | axis: 'x',
101 | type: ColorLogarithmicScale.id,
102 | quantize: 5,
103 | ticks: {
104 | display: false,
105 | },
106 | legend: {
107 | position: 'bottom-right',
108 | align: 'right',
109 | },
110 | },
111 | },
112 | },
113 | });
114 |
115 | return chart.toMatchImageSnapshot();
116 | });
117 |
118 | test('earth', async () => {
119 | const random = rnd('earth');
120 | const data = countries50m as any;
121 | const countries = (feature(data, data.objects.countries) as any).features as any[];
122 |
123 | const chart = createChart({
124 | type: ChoroplethController.id,
125 | data: {
126 | labels: countries.map((d) => d.properties.name),
127 | datasets: [
128 | {
129 | label: 'Countries',
130 | data: countries.map((d) => ({
131 | feature: d,
132 | value: random(),
133 | })),
134 | },
135 | ],
136 | },
137 | options: {
138 | showOutline: true,
139 | showGraticule: true,
140 | scales: {
141 | projection: {
142 | axis: 'x',
143 | projection: 'equalEarth',
144 | } as Partial,
145 | color: {
146 | axis: 'x',
147 | ticks: {
148 | display: false,
149 | },
150 | } as Partial,
151 | },
152 | },
153 | });
154 |
155 | return chart.toMatchImageSnapshot();
156 | });
157 | });
158 |
--------------------------------------------------------------------------------
/src/controllers/BubbleMapController.spec.ts:
--------------------------------------------------------------------------------
1 | import { registry, PointElement } from 'chart.js';
2 | import rnd from 'seedrandom';
3 | import { feature } from 'topojson-client';
4 | import { createRequire } from 'module';
5 |
6 | import { GeoFeature } from '../elements';
7 | import {
8 | ProjectionScale,
9 | SizeLogarithmicScale,
10 | SizeScale,
11 | ISizeScaleOptions,
12 | IProjectionScaleOptions,
13 | } from '../scales';
14 | import createChart from '../__tests__/createChart';
15 | import { BubbleMapController } from './BubbleMapController';
16 | import data from './__tests__/data';
17 | import { describe, beforeAll, test } from 'vitest';
18 | const require = createRequire(import.meta.url); // construct the require method
19 | const states10m = require('us-atlas/states-10m.json');
20 |
21 | describe('bubbleMap', () => {
22 | beforeAll(() => {
23 | registry.addControllers(BubbleMapController);
24 | registry.addScales(ProjectionScale, SizeScale, SizeLogarithmicScale);
25 | registry.addElements(GeoFeature, PointElement);
26 | });
27 |
28 | test('default', async () => {
29 | const random = rnd('default');
30 | const us = states10m as any;
31 | const states = (feature(us, us.objects.states) as any).features;
32 |
33 | const chart = createChart({
34 | type: BubbleMapController.id,
35 | data: {
36 | labels: data.map((d) => d.description),
37 | datasets: [
38 | {
39 | outline: states,
40 | showOutline: true,
41 | backgroundColor: 'steelblue',
42 | data: data.map((d) => Object.assign(d, { value: Math.round(random() * 10) })),
43 | },
44 | ],
45 | },
46 | options: {
47 | scales: {
48 | projection: {
49 | axis: 'x',
50 | projection: 'albersUsa',
51 | } as Partial,
52 | size: {
53 | axis: 'x',
54 | range: [1, 20],
55 | ticks: {
56 | display: false,
57 | },
58 | } as Partial,
59 | },
60 | },
61 | });
62 |
63 | return chart.toMatchImageSnapshot();
64 | });
65 | test('radius', async () => {
66 | const random = rnd('default');
67 | const us = states10m as any;
68 | const states = (feature(us, us.objects.states) as any).features;
69 |
70 | const chart = createChart({
71 | type: BubbleMapController.id,
72 | data: {
73 | labels: data.map((d) => d.description),
74 | datasets: [
75 | {
76 | outline: states,
77 | showOutline: true,
78 | backgroundColor: 'steelblue',
79 | data: data.map((d) => Object.assign(d, { value: Math.round(random() * 10) })),
80 | },
81 | ],
82 | },
83 | options: {
84 | scales: {
85 | projection: {
86 | axis: 'x',
87 | projection: 'albersUsa',
88 | } as Partial,
89 | size: {
90 | axis: 'x',
91 | range: [1, 20],
92 | mode: 'radius',
93 | ticks: {
94 | display: false,
95 | },
96 | } as Partial,
97 | },
98 | },
99 | });
100 |
101 | return chart.toMatchImageSnapshot();
102 | });
103 | test('area', async () => {
104 | const random = rnd('default');
105 | const us = states10m as any;
106 | const states = (feature(us, us.objects.states) as any).features;
107 |
108 | const chart = createChart({
109 | type: BubbleMapController.id,
110 | data: {
111 | labels: data.map((d) => d.description),
112 | datasets: [
113 | {
114 | outline: states,
115 | showOutline: true,
116 | backgroundColor: 'steelblue',
117 | data: data.map((d) => Object.assign(d, { value: Math.round(random() * 10) })),
118 | },
119 | ],
120 | },
121 | options: {
122 | scales: {
123 | projection: {
124 | axis: 'x',
125 | projection: 'albersUsa',
126 | } as Partial,
127 | size: {
128 | axis: 'x',
129 | range: [1, 20],
130 | mode: 'area',
131 | ticks: {
132 | display: false,
133 | },
134 | } as Partial,
135 | },
136 | },
137 | });
138 |
139 | return chart.toMatchImageSnapshot();
140 | });
141 | test('log', async () => {
142 | const random = rnd('default');
143 | const us = states10m as any;
144 | const states = (feature(us, us.objects.states) as any).features;
145 |
146 | const chart = createChart({
147 | type: BubbleMapController.id,
148 | data: {
149 | labels: data.map((d) => d.description),
150 | datasets: [
151 | {
152 | outline: states,
153 | showOutline: true,
154 | backgroundColor: 'steelblue',
155 | data: data.map((d) => Object.assign(d, { value: Math.round(random() * 10) })),
156 | },
157 | ],
158 | },
159 | options: {
160 | scales: {
161 | projection: {
162 | axis: 'x',
163 | projection: 'albersUsa',
164 | } as Partial,
165 | size: {
166 | axis: 'x',
167 | type: SizeLogarithmicScale.id,
168 | range: [1, 20],
169 | ticks: {
170 | display: false,
171 | },
172 | },
173 | },
174 | },
175 | });
176 |
177 | return chart.toMatchImageSnapshot();
178 | });
179 | });
180 |
--------------------------------------------------------------------------------
/src/controllers/ChoroplethController.ts:
--------------------------------------------------------------------------------
1 | import {
2 | Chart,
3 | UpdateMode,
4 | ScriptableContext,
5 | TooltipItem,
6 | CommonHoverOptions,
7 | ScriptableAndArrayOptions,
8 | ControllerDatasetOptions,
9 | ChartConfiguration,
10 | ChartItem,
11 | PointOptions,
12 | Scale,
13 | AnimationOptions,
14 | } from 'chart.js';
15 | import { merge } from 'chart.js/helpers';
16 | import { geoDefaults, GeoController, IGeoChartOptions, IGeoDataPoint, geoOverrides } from './GeoController';
17 | import { GeoFeature, IGeoFeatureOptions, IGeoFeatureProps } from '../elements';
18 | import { ColorScale, ProjectionScale } from '../scales';
19 | import patchController from './patchController';
20 |
21 | export class ChoroplethController extends GeoController<'choropleth', GeoFeature> {
22 | initialize(): void {
23 | super.initialize();
24 | this.enableOptionSharing = true;
25 | }
26 |
27 | linkScales(): void {
28 | super.linkScales();
29 | const dataset = this.getGeoDataset();
30 | const meta = this.getMeta();
31 | meta.vAxisID = 'color';
32 | meta.rAxisID = 'color';
33 | dataset.vAxisID = 'color';
34 | dataset.rAxisID = 'color';
35 | meta.rScale = this.getScaleForId('color');
36 | meta.vScale = meta.rScale;
37 | meta.iScale = meta.xScale;
38 |
39 | meta.iAxisID = meta.xAxisID!;
40 |
41 | dataset.iAxisID = meta.xAxisID!;
42 | }
43 |
44 | _getOtherScale(scale: Scale): Scale {
45 | // for strange get min max with other scale
46 | return scale;
47 | }
48 |
49 | parse(start: number, count: number): void {
50 | const rScale = this.getMeta().rScale!;
51 | const { data } = this.getDataset();
52 | const meta = this._cachedMeta;
53 | for (let i = start; i < start + count; i += 1) {
54 | meta._parsed[i] = {
55 | [rScale.axis]: rScale.parse(data[i], i),
56 | };
57 | }
58 | }
59 |
60 | updateElements(elems: GeoFeature[], start: number, count: number, mode: UpdateMode): void {
61 | const firstOpts = this.resolveDataElementOptions(start, mode);
62 |
63 | const sharedOptions = this.getSharedOptions(firstOpts)!;
64 | const includeOptions = this.includeOptions(mode, sharedOptions);
65 | const scale = this.getProjectionScale();
66 | this.updateSharedOptions(sharedOptions, mode, firstOpts);
67 |
68 | for (let i = start; i < start + count; i += 1) {
69 | const elem = elems[i];
70 | elem.projectionScale = scale;
71 | const center = elem.updateExtras({
72 | scale,
73 | feature: (this as any)._data[i].feature,
74 | center: (this as any)._data[i].center,
75 | pixelRatio: this.chart.currentDevicePixelRatio,
76 | mode,
77 | });
78 |
79 | const properties: IGeoFeatureProps & { options?: PointOptions } = {
80 | x: center.x,
81 | y: center.y,
82 | };
83 | if (includeOptions) {
84 | properties.options = (sharedOptions || this.resolveDataElementOptions(i, mode)) as unknown as PointOptions;
85 | }
86 | this.updateElement(elem, i, properties as unknown as Record, mode);
87 | }
88 | }
89 |
90 | indexToColor(index: number): string {
91 | const rScale = this.getMeta().rScale as unknown as ColorScale;
92 | return rScale.getColorForValue(this.getParsed(index)[rScale.axis as 'r']);
93 | }
94 |
95 | static readonly id = 'choropleth';
96 |
97 | /**
98 | * @hidden
99 | */
100 | static readonly defaults: any = /* #__PURE__ */ merge({}, [
101 | geoDefaults,
102 | {
103 | datasetElementType: GeoFeature.id,
104 | dataElementType: GeoFeature.id,
105 | },
106 | ]);
107 |
108 | /**
109 | * @hidden
110 | */
111 | static readonly overrides: any = /* #__PURE__ */ merge({}, [
112 | geoOverrides,
113 | {
114 | plugins: {
115 | tooltip: {
116 | callbacks: {
117 | title() {
118 | // Title doesn't make sense for scatter since we format the data as a point
119 | return '';
120 | },
121 | label(item: TooltipItem<'choropleth'>) {
122 | if (item.formattedValue == null) {
123 | return item.chart.data?.labels?.[item.dataIndex];
124 | }
125 | return `${item.chart.data?.labels?.[item.dataIndex]}: ${item.formattedValue}`;
126 | },
127 | },
128 | },
129 | colors: {
130 | enabled: false,
131 | },
132 | },
133 | scales: {
134 | color: {
135 | type: ColorScale.id,
136 | axis: 'x',
137 | },
138 | },
139 | elements: {
140 | geoFeature: {
141 | backgroundColor(context: ScriptableContext<'choropleth'>) {
142 | if (context.dataIndex == null) {
143 | return null;
144 | }
145 | const controller = (context.chart as Chart<'choropleth'>).getDatasetMeta(context.datasetIndex)
146 | .controller as ChoroplethController;
147 | return controller.indexToColor(context.dataIndex);
148 | },
149 | },
150 | },
151 | },
152 | ]);
153 | }
154 |
155 | export interface IChoroplethControllerDatasetOptions
156 | extends ControllerDatasetOptions,
157 | IGeoChartOptions,
158 | ScriptableAndArrayOptions>,
159 | ScriptableAndArrayOptions>,
160 | AnimationOptions<'choropleth'> {}
161 |
162 | export interface IChoroplethDataPoint extends IGeoDataPoint {
163 | value: number;
164 | }
165 |
166 | declare module 'chart.js' {
167 | export interface ChartTypeRegistry {
168 | choropleth: {
169 | chartOptions: IGeoChartOptions;
170 | datasetOptions: IChoroplethControllerDatasetOptions;
171 | defaultDataPoint: IChoroplethDataPoint;
172 | scales: keyof (ProjectionScaleTypeRegistry & ColorScaleTypeRegistry);
173 | metaExtensions: Record;
174 | parsedDataType: { r: number };
175 | };
176 | }
177 | }
178 |
179 | export class ChoroplethChart extends Chart<
180 | 'choropleth',
181 | DATA,
182 | LABEL
183 | > {
184 | static id = ChoroplethController.id;
185 |
186 | constructor(item: ChartItem, config: Omit, 'type'>) {
187 | super(item, patchController('choropleth', config, ChoroplethController, GeoFeature, [ColorScale, ProjectionScale]));
188 | }
189 | }
190 |
--------------------------------------------------------------------------------
/src/scales/SizeScale.ts:
--------------------------------------------------------------------------------
1 | import { LinearScale, LogarithmicScale, PointOptions, LinearScaleOptions, LogarithmicScaleOptions } from 'chart.js';
2 | import { merge, drawPoint } from 'chart.js/helpers';
3 | import { baseDefaults, ILegendScaleOptions, LegendScale, LogarithmicLegendScale } from './LegendScale';
4 |
5 | export interface ISizeScaleOptions extends ILegendScaleOptions {
6 | // support all options from linear scale -> https://www.chartjs.org/docs/latest/axes/cartesian/linear.html#linear-cartesian-axis
7 | // e.g. for tick manipulation, ...
8 |
9 | /**
10 | * radius range in pixel, the minimal data value will be mapped to the
11 | * first entry, the maximal one to the second and a linear interpolation
12 | * for all values in between.
13 | *
14 | * @default [2, 20]
15 | */
16 | range: [number, number];
17 |
18 | /**
19 | * operation mode for the scale, area means that the area is linearly increasing whereas radius the radius is.
20 | * The area one is the default since it gives a better visual comparison of values
21 | * @default area
22 | */
23 | mode: 'radius' | 'area';
24 |
25 | /**
26 | * radius to render for missing values
27 | * @default 1
28 | */
29 | missing: number;
30 | }
31 |
32 | const scaleDefaults = {
33 | missing: 1,
34 | mode: 'area', // 'radius'
35 | // mode: 'radius',
36 | range: [2, 20],
37 | legend: {
38 | align: 'bottom',
39 | length: 90,
40 | width: 70,
41 | indicatorWidth: 42,
42 | },
43 | };
44 |
45 | export class SizeScale extends LegendScale {
46 | /**
47 | * @hidden
48 | */
49 | _model: PointOptions | null = null;
50 |
51 | /**
52 | * @hidden
53 | */
54 | getSizeForValue(value: number): number {
55 | const v = this._getNormalizedValue(value);
56 | if (v == null || Number.isNaN(v)) {
57 | return this.options.missing;
58 | }
59 | return this.getSizeImpl(v);
60 | }
61 |
62 | /**
63 | * @hidden
64 | */
65 | getSizeImpl(normalized: number): number {
66 | const [r0, r1] = this.options.range;
67 | if (this.options.mode === 'area') {
68 | const a1 = r1 * r1 * Math.PI;
69 | const a0 = r0 * r0 * Math.PI;
70 | const range = a1 - a0;
71 | const a = normalized * range + a0;
72 | return Math.sqrt(a / Math.PI);
73 | }
74 | const range = r1 - r0;
75 | return normalized * range + r0;
76 | }
77 |
78 | /**
79 | * @hidden
80 | */
81 | _drawIndicator(): void {
82 | /** @type {CanvasRenderingContext2D} */
83 | const { ctx } = this;
84 | const shift = this.options.legend.indicatorWidth / 2;
85 |
86 | const isHor = this.isHorizontal();
87 | const values = this.ticks;
88 | const labelItems = this.getLabelItems();
89 | const positions = labelItems
90 | ? labelItems.map((el: any) => ({ [isHor ? 'x' : 'y']: el.options.translation[isHor ? 0 : 1] }))
91 | : values.map((_, i) => ({ [isHor ? 'x' : 'y']: this.getPixelForTick(i) }));
92 |
93 | ((this as any)._gridLineItems || []).forEach((item: any) => {
94 | ctx.save();
95 | ctx.strokeStyle = item.color;
96 | ctx.lineWidth = item.width;
97 |
98 | if (ctx.setLineDash) {
99 | ctx.setLineDash(item.borderDash);
100 | ctx.lineDashOffset = item.borderDashOffset;
101 | }
102 |
103 | ctx.beginPath();
104 |
105 | if (this.options.grid.drawTicks) {
106 | switch (this.options.legend.align) {
107 | case 'left':
108 | ctx.moveTo(0, item.ty1);
109 | ctx.lineTo(shift, item.ty2);
110 | break;
111 | case 'top':
112 | ctx.moveTo(item.tx1, 0);
113 | ctx.lineTo(item.tx2, shift);
114 | break;
115 | case 'bottom':
116 | ctx.moveTo(item.tx1, shift);
117 | ctx.lineTo(item.tx2, shift * 2);
118 | break;
119 | default:
120 | // right
121 | ctx.moveTo(shift, item.ty1);
122 | ctx.lineTo(shift * 2, item.ty2);
123 | break;
124 | }
125 | }
126 | ctx.stroke();
127 | ctx.restore();
128 | });
129 |
130 | if (this._model) {
131 | const props = this._model;
132 | ctx.strokeStyle = props.borderColor;
133 | ctx.lineWidth = props.borderWidth || 0;
134 | ctx.fillStyle = props.backgroundColor;
135 | } else {
136 | ctx.fillStyle = 'blue';
137 | }
138 |
139 | values.forEach((v, i) => {
140 | const pos = positions[i];
141 | const radius = this.getSizeForValue(v.value);
142 | const x = isHor ? pos.x : shift;
143 | const y = isHor ? shift : pos.y;
144 | const renderOptions = {
145 | pointStyle: 'circle' as const,
146 | borderWidth: 0,
147 | ...(this._model || {}),
148 | radius,
149 | };
150 | drawPoint(ctx, renderOptions, x, y);
151 | });
152 | }
153 |
154 | static readonly id = 'size';
155 |
156 | /**
157 | * @hidden
158 | */
159 | static readonly defaults: any = /* #__PURE__ */ merge({}, [LinearScale.defaults, baseDefaults, scaleDefaults]);
160 |
161 | /**
162 | * @hidden
163 | */
164 | static readonly descriptors = /* #__PURE__ */ {
165 | _scriptable: true,
166 | _indexable: (name: string): boolean => name !== 'range',
167 | };
168 | }
169 |
170 | export class SizeLogarithmicScale extends LogarithmicLegendScale {
171 | /**
172 | * @hidden
173 | */
174 | _model: PointOptions | null = null;
175 |
176 | /**
177 | * @hidden
178 | */
179 | getSizeForValue(value: number): number {
180 | const v = this._getNormalizedValue(value);
181 | if (v == null || Number.isNaN(v)) {
182 | return this.options.missing;
183 | }
184 | return this.getSizeImpl(v);
185 | }
186 |
187 | /**
188 | * @hidden
189 | */
190 | getSizeImpl(normalized: number): number {
191 | return SizeScale.prototype.getSizeImpl.call(this, normalized);
192 | }
193 |
194 | /**
195 | * @hidden
196 | */
197 | _drawIndicator(): void {
198 | SizeScale.prototype._drawIndicator.call(this);
199 | }
200 |
201 | static readonly id = 'sizeLogarithmic';
202 |
203 | /**
204 | * @hidden
205 | */
206 | static readonly defaults: any = /* #__PURE__ */ merge({}, [LogarithmicScale.defaults, baseDefaults, scaleDefaults]);
207 | }
208 |
209 | declare module 'chart.js' {
210 | export interface SizeScaleTypeRegistry {
211 | size: {
212 | options: ISizeScaleOptions & LinearScaleOptions;
213 | };
214 | sizeLogarithmic: {
215 | options: ISizeScaleOptions & LogarithmicScaleOptions;
216 | };
217 | }
218 |
219 | // eslint-disable-next-line @typescript-eslint/no-empty-object-type
220 | export interface ScaleTypeRegistry extends SizeScaleTypeRegistry {}
221 | }
222 |
--------------------------------------------------------------------------------
/src/scales/ProjectionScale.ts:
--------------------------------------------------------------------------------
1 | import { Scale, CoreScaleOptions } from 'chart.js';
2 | import {
3 | geoPath,
4 | geoAzimuthalEqualArea,
5 | geoAzimuthalEquidistant,
6 | geoGnomonic,
7 | geoOrthographic,
8 | geoStereographic,
9 | geoEqualEarth,
10 | geoAlbers,
11 | geoAlbersUsa,
12 | geoConicConformal,
13 | geoConicEqualArea,
14 | geoConicEquidistant,
15 | geoEquirectangular,
16 | geoMercator,
17 | geoTransverseMercator,
18 | geoNaturalEarth1,
19 | GeoProjection,
20 | GeoPath,
21 | GeoPermissibleObjects,
22 | ExtendedFeatureCollection,
23 | ExtendedFeature,
24 | GeoGeometryObjects,
25 | ExtendedGeometryCollection,
26 | } from 'd3-geo';
27 |
28 | const lookup: { [key: string]: () => GeoProjection } = {
29 | geoAzimuthalEqualArea,
30 | geoAzimuthalEquidistant,
31 | geoGnomonic,
32 | geoOrthographic,
33 | geoStereographic,
34 | geoEqualEarth,
35 | geoAlbers,
36 | geoAlbersUsa,
37 | geoConicConformal,
38 | geoConicEqualArea,
39 | geoConicEquidistant,
40 | geoEquirectangular,
41 | geoMercator,
42 | geoTransverseMercator,
43 | geoNaturalEarth1,
44 | };
45 | Object.keys(lookup).forEach((key) => {
46 | lookup[`${key.charAt(3).toLowerCase()}${key.slice(4)}`] = lookup[key];
47 | });
48 |
49 | export interface IProjectionScaleOptions extends CoreScaleOptions {
50 | /**
51 | * projection method used
52 | * @default albersUsa
53 | */
54 | projection:
55 | | GeoProjection
56 | | 'azimuthalEqualArea'
57 | | 'azimuthalEquidistant'
58 | | 'gnomonic'
59 | | 'orthographic'
60 | | 'stereographic'
61 | | 'equalEarth'
62 | | 'albers'
63 | | 'albersUsa'
64 | | 'conicConformal'
65 | | 'conicEqualArea'
66 | | 'conicEquidistant'
67 | | 'equirectangular'
68 | | 'mercator'
69 | | 'transverseMercator'
70 | | 'naturalEarth1';
71 |
72 | /**
73 | * extra scale factor applied to projection
74 | */
75 | projectionScale: number;
76 | /**
77 | * extra offset applied after projection
78 | */
79 | projectionOffset: [number, number];
80 | /**
81 | * padding applied during auto scaling of the map in pixels
82 | * i.e. the chart size is reduce by the padding before fitting the map
83 | */
84 | padding: number | { top: number; left: number; right: number; bottom: number };
85 | }
86 |
87 | export class ProjectionScale extends Scale {
88 | /**
89 | * @hidden
90 | */
91 | readonly geoPath: GeoPath;
92 |
93 | /**
94 | * @hidden
95 | */
96 | projection!: GeoProjection;
97 |
98 | private outlineBounds: {
99 | refX: number;
100 | refY: number;
101 | refScale: number;
102 | width: number;
103 | height: number;
104 | aspectRatio: number;
105 | } | null = null;
106 |
107 | private oldChartBounds: { chartWidth: number; chartHeight: number } | null = null;
108 |
109 | constructor(cfg: any) {
110 | super(cfg);
111 | this.geoPath = geoPath();
112 | }
113 |
114 | /**
115 | * @hidden
116 | */
117 | init(options: IProjectionScaleOptions): void {
118 | (options as any).position = 'chartArea';
119 | super.init(options);
120 | if (typeof options.projection === 'function') {
121 | this.projection = options.projection;
122 | } else {
123 | this.projection = (lookup[options.projection] || lookup.albersUsa)();
124 | }
125 | this.geoPath.projection(this.projection);
126 |
127 | this.outlineBounds = null;
128 | this.oldChartBounds = null;
129 | }
130 |
131 | /**
132 | * @hidden
133 | */
134 | computeBounds(outline: ExtendedFeature): void;
135 | computeBounds(outline: ExtendedFeatureCollection): void;
136 | computeBounds(outline: GeoGeometryObjects): void;
137 | computeBounds(outline: ExtendedGeometryCollection): void;
138 |
139 | computeBounds(outline: any): void {
140 | const bb = geoPath(this.projection.fitWidth(1000, outline)).bounds(outline);
141 | const bHeight = Math.ceil(bb[1][1] - bb[0][1]);
142 | const bWidth = Math.ceil(bb[1][0] - bb[0][0]);
143 | const t = this.projection.translate();
144 |
145 | this.outlineBounds = {
146 | width: bWidth,
147 | height: bHeight,
148 | aspectRatio: bWidth / bHeight,
149 | refScale: this.projection.scale(),
150 | refX: t[0],
151 | refY: t[1],
152 | };
153 | }
154 |
155 | /**
156 | * @hidden
157 | */
158 | updateBounds(): boolean {
159 | const area = this.chart.chartArea;
160 |
161 | const bb = this.outlineBounds;
162 |
163 | if (!bb) {
164 | return false;
165 | }
166 | const padding = this.options.padding;
167 | const paddingTop = typeof padding === 'number' ? padding : padding.top;
168 | const paddingLeft = typeof padding === 'number' ? padding : padding.left;
169 | const paddingBottom = typeof padding === 'number' ? padding : padding.bottom;
170 | const paddingRight = typeof padding === 'number' ? padding : padding.right;
171 |
172 | const chartWidth = area.right - area.left - paddingLeft - paddingRight;
173 | const chartHeight = area.bottom - area.top - paddingTop - paddingBottom;
174 |
175 | const bak = this.oldChartBounds;
176 | this.oldChartBounds = {
177 | chartWidth,
178 | chartHeight,
179 | };
180 |
181 | const scale = Math.min(chartWidth / bb.width, chartHeight / bb.height);
182 | const viewWidth = bb.width * scale;
183 | const viewHeight = bb.height * scale;
184 |
185 | const x = (chartWidth - viewWidth) * 0.5 + area.left + paddingLeft;
186 | const y = (chartHeight - viewHeight) * 0.5 + area.top + paddingTop;
187 |
188 | // this.mapScale = scale;
189 | // this.mapTranslate = {x, y};
190 |
191 | const o = this.options;
192 |
193 | this.projection
194 | .scale(bb.refScale * scale * o.projectionScale)
195 | .translate([scale * bb.refX + x + o.projectionOffset[0], scale * bb.refY + y + o.projectionOffset[1]]);
196 |
197 | return (
198 | !bak || bak.chartWidth !== this.oldChartBounds.chartWidth || bak.chartHeight !== this.oldChartBounds.chartHeight
199 | );
200 | }
201 |
202 | static readonly id = 'projection';
203 |
204 | /**
205 | * @hidden
206 | */
207 | static readonly defaults: Partial = {
208 | projection: 'albersUsa',
209 | projectionScale: 1,
210 | projectionOffset: [0, 0],
211 | padding: 0,
212 | };
213 |
214 | /**
215 | * @hidden
216 | */
217 | static readonly descriptors = /* #__PURE__ */ {
218 | _scriptable: (name: keyof IProjectionScaleOptions): boolean => name !== 'projection',
219 | _indexable: (name: keyof IProjectionScaleOptions): boolean => name !== 'projectionOffset',
220 | };
221 | }
222 |
223 | declare module 'chart.js' {
224 | export interface ProjectionScaleTypeRegistry {
225 | projection: {
226 | options: IProjectionScaleOptions;
227 | };
228 | }
229 |
230 | // eslint-disable-next-line @typescript-eslint/no-empty-object-type
231 | export interface ScaleTypeRegistry extends ProjectionScaleTypeRegistry {}
232 | }
233 |
--------------------------------------------------------------------------------
/docs/examples/data/us-capitals.json:
--------------------------------------------------------------------------------
1 | [
2 | {
3 | "name": "Alabama",
4 | "description": "Montgomery",
5 | "latitude": 32.377716,
6 | "longitude": -86.300568
7 | },
8 | {
9 | "name": "Alaska",
10 | "description": "Juneau",
11 | "latitude": 58.301598,
12 | "longitude": -134.420212
13 | },
14 | {
15 | "name": "Arizona",
16 | "description": "Phoenix",
17 | "latitude": 33.448143,
18 | "longitude": -112.096962
19 | },
20 | {
21 | "name": "Arkansas",
22 | "description": "Little Rock",
23 | "latitude": 34.746613,
24 | "longitude": -92.288986
25 | },
26 | {
27 | "name": "California",
28 | "description": "Sacramento",
29 | "latitude": 38.576668,
30 | "longitude": -121.493629
31 | },
32 | {
33 | "name": "Colorado",
34 | "description": "Denver",
35 | "latitude": 39.739227,
36 | "longitude": -104.984856
37 | },
38 | {
39 | "name": "Connecticut",
40 | "description": "Hartford",
41 | "latitude": 41.764046,
42 | "longitude": -72.682198
43 | },
44 | {
45 | "name": "Delaware",
46 | "description": "Dover",
47 | "latitude": 39.157307,
48 | "longitude": -75.519722
49 | },
50 | {
51 | "name": "Hawaii",
52 | "description": "Honolulu",
53 | "latitude": 21.307442,
54 | "longitude": -157.857376
55 | },
56 | {
57 | "name": "Florida",
58 | "description": "Tallahassee",
59 | "latitude": 30.438118,
60 | "longitude": -84.281296
61 | },
62 | {
63 | "name": "Georgia",
64 | "description": "Atlanta",
65 | "latitude": 33.749027,
66 | "longitude": -84.388229
67 | },
68 | {
69 | "name": "Idaho",
70 | "description": "Boise",
71 | "latitude": 43.617775,
72 | "longitude": -116.199722
73 | },
74 | {
75 | "name": "Illinois",
76 | "description": "Springfield",
77 | "latitude": 39.798363,
78 | "longitude": -89.654961
79 | },
80 | {
81 | "name": "Indiana",
82 | "description": "Indianapolis",
83 | "latitude": 39.768623,
84 | "longitude": -86.162643
85 | },
86 | {
87 | "name": "Iowa",
88 | "description": "Des Moines",
89 | "latitude": 41.591087,
90 | "longitude": -93.603729
91 | },
92 | {
93 | "name": "Kansas",
94 | "description": "Topeka",
95 | "latitude": 39.048191,
96 | "longitude": -95.677956
97 | },
98 | {
99 | "name": "Kentucky",
100 | "description": "Frankfort",
101 | "latitude": 38.186722,
102 | "longitude": -84.875374
103 | },
104 | {
105 | "name": "Louisiana",
106 | "description": "Baton Rouge",
107 | "latitude": 30.457069,
108 | "longitude": -91.187393
109 | },
110 | {
111 | "name": "Maine",
112 | "description": "Augusta",
113 | "latitude": 44.307167,
114 | "longitude": -69.781693
115 | },
116 | {
117 | "name": "Maryland",
118 | "description": "Annapolis",
119 | "latitude": 38.978764,
120 | "longitude": -76.490936
121 | },
122 | {
123 | "name": "Massachusetts",
124 | "description": "Boston",
125 | "latitude": 42.358162,
126 | "longitude": -71.063698
127 | },
128 | {
129 | "name": "Michigan",
130 | "description": "Lansing",
131 | "latitude": 42.733635,
132 | "longitude": -84.555328
133 | },
134 | {
135 | "name": "Minnesota",
136 | "description": "St. Paul",
137 | "latitude": 44.955097,
138 | "longitude": -93.102211
139 | },
140 | {
141 | "name": "Mississippi",
142 | "description": "Jackson",
143 | "latitude": 32.303848,
144 | "longitude": -90.182106
145 | },
146 | {
147 | "name": "Missouri",
148 | "description": "Jefferson City",
149 | "latitude": 38.579201,
150 | "longitude": -92.172935
151 | },
152 | {
153 | "name": "Montana",
154 | "description": "Helena",
155 | "latitude": 46.585709,
156 | "longitude": -112.018417
157 | },
158 | {
159 | "name": "Nebraska",
160 | "description": "Lincoln",
161 | "latitude": 40.808075,
162 | "longitude": -96.699654
163 | },
164 | {
165 | "name": "Nevada",
166 | "description": "Carson City",
167 | "latitude": 39.163914,
168 | "longitude": -119.766121
169 | },
170 | {
171 | "name": "New Hampshire",
172 | "description": "Concord",
173 | "latitude": 43.206898,
174 | "longitude": -71.537994
175 | },
176 | {
177 | "name": "New Jersey",
178 | "description": "Trenton",
179 | "latitude": 40.220596,
180 | "longitude": -74.769913
181 | },
182 | {
183 | "name": "New Mexico",
184 | "description": "Santa Fe",
185 | "latitude": 35.68224,
186 | "longitude": -105.939728
187 | },
188 | {
189 | "name": "North Carolina",
190 | "description": "Raleigh",
191 | "latitude": 35.78043,
192 | "longitude": -78.639099
193 | },
194 | {
195 | "name": "North Dakota",
196 | "description": "Bismarck",
197 | "latitude": 46.82085,
198 | "longitude": -100.783318
199 | },
200 | {
201 | "name": "New York",
202 | "description": "Albany",
203 | "latitude": 42.652843,
204 | "longitude": -73.757874
205 | },
206 | {
207 | "name": "Ohio",
208 | "description": "Columbus",
209 | "latitude": 39.961346,
210 | "longitude": -82.999069
211 | },
212 | {
213 | "name": "Oklahoma",
214 | "description": "Oklahoma City",
215 | "latitude": 35.492207,
216 | "longitude": -97.503342
217 | },
218 | {
219 | "name": "Oregon",
220 | "description": "Salem",
221 | "latitude": 44.938461,
222 | "longitude": -123.030403
223 | },
224 | {
225 | "name": "Pennsylvania",
226 | "description": "Harrisburg",
227 | "latitude": 40.264378,
228 | "longitude": -76.883598
229 | },
230 | {
231 | "name": "Rhode Island",
232 | "description": "Providence",
233 | "latitude": 41.830914,
234 | "longitude": -71.414963
235 | },
236 | {
237 | "name": "South Carolina",
238 | "description": "Columbia",
239 | "latitude": 34.000343,
240 | "longitude": -81.033211
241 | },
242 | {
243 | "name": "South Dakota",
244 | "description": "Pierre",
245 | "latitude": 44.367031,
246 | "longitude": -100.346405
247 | },
248 | {
249 | "name": "Tennessee",
250 | "description": "Nashville",
251 | "latitude": 36.16581,
252 | "longitude": -86.784241
253 | },
254 | {
255 | "name": "Texas",
256 | "description": "Austin",
257 | "latitude": 30.27467,
258 | "longitude": -97.740349
259 | },
260 | {
261 | "name": "Utah",
262 | "description": "Salt Lake City",
263 | "latitude": 40.777477,
264 | "longitude": -111.888237
265 | },
266 | {
267 | "name": "Vermont",
268 | "description": "Montpelier",
269 | "latitude": 44.262436,
270 | "longitude": -72.580536
271 | },
272 | {
273 | "name": "Virginia",
274 | "description": "Richmond",
275 | "latitude": 37.538857,
276 | "longitude": -77.43364
277 | },
278 | {
279 | "name": "Washington",
280 | "description": "Olympia",
281 | "latitude": 47.035805,
282 | "longitude": -122.905014
283 | },
284 | {
285 | "name": "West Virginia",
286 | "description": "Charleston",
287 | "latitude": 38.336246,
288 | "longitude": -81.612328
289 | },
290 | {
291 | "name": "Wisconsin",
292 | "description": "Madison",
293 | "latitude": 43.074684,
294 | "longitude": -89.384445
295 | },
296 | {
297 | "name": "Wyoming",
298 | "description": "Cheyenne",
299 | "latitude": 41.140259,
300 | "longitude": -104.820236
301 | }
302 | ]
303 |
--------------------------------------------------------------------------------
/src/controllers/BubbleMapController.ts:
--------------------------------------------------------------------------------
1 | import {
2 | Chart,
3 | ChartItem,
4 | ChartConfiguration,
5 | CommonHoverOptions,
6 | ControllerDatasetOptions,
7 | PointOptions,
8 | PointProps,
9 | ScriptableContext,
10 | TooltipItem,
11 | PointElement,
12 | PointHoverOptions,
13 | Element,
14 | Scale,
15 | ScriptableAndArrayOptions,
16 | UpdateMode,
17 | AnimationOptions,
18 | } from 'chart.js';
19 | import { merge } from 'chart.js/helpers';
20 | import { GeoFeature, IGeoFeatureOptions } from '../elements';
21 | import { ProjectionScale, SizeScale } from '../scales';
22 | import { GeoController, geoDefaults, geoOverrides, IGeoChartOptions } from './GeoController';
23 | import patchController from './patchController';
24 |
25 | type MyPointElement = PointElement & Element>;
26 |
27 | export class BubbleMapController extends GeoController<'bubbleMap', MyPointElement> {
28 | initialize(): void {
29 | super.initialize();
30 | this.enableOptionSharing = true;
31 | }
32 |
33 | linkScales(): void {
34 | super.linkScales();
35 | const dataset = this.getGeoDataset();
36 | const meta = this.getMeta();
37 | meta.vAxisID = 'size';
38 | meta.rAxisID = 'size';
39 | dataset.vAxisID = 'size';
40 | dataset.rAxisID = 'size';
41 | meta.rScale = this.getScaleForId('size');
42 | meta.vScale = meta.rScale;
43 | meta.iScale = meta.xScale;
44 |
45 | meta.iAxisID = meta.xAxisID!;
46 |
47 | dataset.iAxisID = meta.xAxisID!;
48 | }
49 |
50 | _getOtherScale(scale: Scale): Scale {
51 | // for strange get min max with other scale
52 | return scale;
53 | }
54 |
55 | parse(start: number, count: number): void {
56 | const rScale = this.getMeta().rScale!;
57 | const data = this.getDataset().data as unknown as IBubbleMapDataPoint[];
58 | const meta = this._cachedMeta;
59 | for (let i = start; i < start + count; i += 1) {
60 | const d = data[i];
61 | meta._parsed[i] = {
62 | x: d.longitude == null ? d.x : d.longitude,
63 | y: d.latitude == null ? d.y : d.latitude,
64 | [rScale.axis]: rScale.parse(d, i),
65 | };
66 | }
67 | }
68 |
69 | updateElements(elems: MyPointElement[], start: number, count: number, mode: UpdateMode): void {
70 | const reset = mode === 'reset';
71 | const firstOpts = this.resolveDataElementOptions(start, mode);
72 |
73 | const sharedOptions = this.getSharedOptions(firstOpts)!;
74 | const includeOptions = this.includeOptions(mode, sharedOptions);
75 | const scale = this.getProjectionScale();
76 |
77 | (this.getMeta().rScale as unknown as SizeScale)._model = firstOpts as unknown as PointOptions; // for legend rendering styling
78 |
79 | this.updateSharedOptions(sharedOptions, mode, firstOpts);
80 |
81 | for (let i = start; i < start + count; i += 1) {
82 | const elem = elems[i];
83 | const parsed = this.getParsed(i);
84 | const projection = scale.projection([parsed.x, parsed.y]);
85 | const properties: PointProps & { options?: PointOptions; skip: boolean } = {
86 | x: projection ? projection[0] : 0,
87 | y: projection ? projection[1] : 0,
88 | skip: Number.isNaN(parsed.x) || Number.isNaN(parsed.y),
89 | };
90 | if (includeOptions) {
91 | properties.options = (sharedOptions || this.resolveDataElementOptions(i, mode)) as unknown as PointOptions;
92 | if (reset) {
93 | properties.options.radius = 0;
94 | }
95 | }
96 | this.updateElement(elem, i, properties as unknown as Record, mode);
97 | }
98 | }
99 |
100 | indexToRadius(index: number): number {
101 | const rScale = this.getMeta().rScale as SizeScale;
102 | return rScale.getSizeForValue(this.getParsed(index)[rScale.axis as 'r']);
103 | }
104 |
105 | static readonly id = 'bubbleMap';
106 |
107 | /**
108 | * @hidden
109 | */
110 | static readonly defaults: any = /* #__PURE__ */ merge({}, [
111 | geoDefaults,
112 | {
113 | dataElementType: PointElement.id,
114 | datasetElementType: GeoFeature.id,
115 | showOutline: true,
116 | clipMap: 'outline+graticule',
117 | },
118 | ]);
119 |
120 | /**
121 | * @hidden
122 | */
123 | static readonly overrides: any = /* #__PURE__ */ merge({}, [
124 | geoOverrides,
125 | {
126 | plugins: {
127 | tooltip: {
128 | callbacks: {
129 | title() {
130 | // Title doesn't make sense for scatter since we format the data as a point
131 | return '';
132 | },
133 | label(item: TooltipItem<'bubbleMap'>) {
134 | if (item.formattedValue == null) {
135 | return item.chart.data?.labels?.[item.dataIndex];
136 | }
137 | return `${item.chart.data?.labels?.[item.dataIndex]}: ${item.formattedValue}`;
138 | },
139 | },
140 | },
141 | },
142 | scales: {
143 | size: {
144 | axis: 'x',
145 | type: SizeScale.id,
146 | },
147 | },
148 | elements: {
149 | point: {
150 | radius(context: ScriptableContext<'bubbleMap'>) {
151 | if (context.dataIndex == null) {
152 | return null;
153 | }
154 | const controller = (context.chart as Chart<'bubbleMap'>).getDatasetMeta(context.datasetIndex)
155 | .controller as BubbleMapController;
156 | return controller.indexToRadius(context.dataIndex);
157 | },
158 | hoverRadius(context: ScriptableContext<'bubbleMap'>) {
159 | if (context.dataIndex == null) {
160 | return null;
161 | }
162 | const controller = (context.chart as Chart<'bubbleMap'>).getDatasetMeta(context.datasetIndex)
163 | .controller as BubbleMapController;
164 | return controller.indexToRadius(context.dataIndex) + 1;
165 | },
166 | },
167 | },
168 | },
169 | ]);
170 | }
171 |
172 | export interface IBubbleMapDataPoint {
173 | longitude: number;
174 | latitude: number;
175 | x?: number;
176 | y?: number;
177 | value: number;
178 | }
179 |
180 | export interface IBubbleMapControllerDatasetOptions
181 | extends ControllerDatasetOptions,
182 | IGeoChartOptions,
183 | ScriptableAndArrayOptions>,
184 | ScriptableAndArrayOptions>,
185 | AnimationOptions<'bubbleMap'> {}
186 |
187 | declare module 'chart.js' {
188 | export interface ChartTypeRegistry {
189 | bubbleMap: {
190 | chartOptions: IGeoChartOptions;
191 | datasetOptions: IBubbleMapControllerDatasetOptions;
192 | defaultDataPoint: IBubbleMapDataPoint;
193 | scales: keyof (ProjectionScaleTypeRegistry & SizeScaleTypeRegistry);
194 | metaExtensions: Record;
195 | parsedDataType: { r: number; x: number; y: number };
196 | };
197 | }
198 | }
199 |
200 | export class BubbleMapChart extends Chart<
201 | 'bubbleMap',
202 | DATA,
203 | LABEL
204 | > {
205 | static id = BubbleMapController.id;
206 |
207 | constructor(item: ChartItem, config: Omit, 'type'>) {
208 | super(item, patchController('bubbleMap', config, BubbleMapController, GeoFeature, [SizeScale, ProjectionScale]));
209 | }
210 | }
211 |
--------------------------------------------------------------------------------
/src/controllers/GeoController.ts:
--------------------------------------------------------------------------------
1 | import {
2 | DatasetController,
3 | ChartDataset,
4 | ScriptableAndArrayOptions,
5 | UpdateMode,
6 | Element,
7 | VisualElement,
8 | ScriptableContext,
9 | ChartTypeRegistry,
10 | AnimationOptions,
11 | } from 'chart.js';
12 | import { clipArea, unclipArea, valueOrDefault } from 'chart.js/helpers';
13 | import { geoGraticule, geoGraticule10, ExtendedFeature } from 'd3-geo';
14 | import { ProjectionScale } from '../scales';
15 | import type { GeoFeature, IGeoFeatureOptions } from '../elements';
16 |
17 | export const geoDefaults = {
18 | showOutline: false,
19 | showGraticule: false,
20 | clipMap: true,
21 | };
22 |
23 | export const geoOverrides = {
24 | scales: {
25 | projection: {
26 | axis: 'x',
27 | type: ProjectionScale.id,
28 | position: 'chartArea',
29 | display: false,
30 | },
31 | },
32 | };
33 |
34 | function patchDatasetElementOptions(options: any) {
35 | // patch the options by removing the `outline` or `hoverOutline` option;
36 | // see https://github.com/chartjs/Chart.js/issues/7362
37 | const r: any = { ...options };
38 | Object.keys(options).forEach((key) => {
39 | let targetKey = key;
40 | if (key.startsWith('outline')) {
41 | const sub = key.slice('outline'.length);
42 | targetKey = sub[0].toLowerCase() + sub.slice(1);
43 | } else if (key.startsWith('hoverOutline')) {
44 | targetKey = `hover${key.slice('hoverOutline'.length)}`;
45 | } else {
46 | return;
47 | }
48 | delete r[key];
49 | r[targetKey] = options[key];
50 | });
51 | return r;
52 | }
53 |
54 | export class GeoController<
55 | TYPE extends keyof ChartTypeRegistry,
56 | TElement extends Element & VisualElement,
57 | > extends DatasetController {
58 | getGeoDataset(): ChartDataset<'choropleth' | 'bubbleMap'> & IGeoControllerDatasetOptions {
59 | return super.getDataset() as unknown as ChartDataset<'choropleth' | 'bubbleMap'> & IGeoControllerDatasetOptions;
60 | }
61 |
62 | getGeoOptions(): IGeoChartOptions {
63 | return this.chart.options as unknown as IGeoChartOptions;
64 | }
65 |
66 | getProjectionScale(): ProjectionScale {
67 | return this.getScaleForId('projection') as ProjectionScale;
68 | }
69 |
70 | linkScales(): void {
71 | const dataset = this.getGeoDataset();
72 | const meta = this.getMeta();
73 | meta.xAxisID = 'projection';
74 | dataset.xAxisID = 'projection';
75 | meta.yAxisID = 'projection';
76 | dataset.yAxisID = 'projection';
77 | meta.xScale = this.getScaleForId('projection');
78 | meta.yScale = this.getScaleForId('projection');
79 |
80 | this.getProjectionScale().computeBounds(this.resolveOutline());
81 | }
82 |
83 | showOutline(): IGeoChartOptions['showOutline'] {
84 | return valueOrDefault(this.getGeoDataset().showOutline, this.getGeoOptions().showOutline);
85 | }
86 |
87 | clipMap(): IGeoChartOptions['clipMap'] {
88 | return valueOrDefault(this.getGeoDataset().clipMap, this.getGeoOptions().clipMap);
89 | }
90 |
91 | getGraticule(): IGeoChartOptions['showGraticule'] {
92 | return valueOrDefault(this.getGeoDataset().showGraticule, this.getGeoOptions().showGraticule);
93 | }
94 |
95 | update(mode: UpdateMode): void {
96 | super.update(mode);
97 |
98 | const meta = this.getMeta();
99 |
100 | const scale = this.getProjectionScale();
101 | const dirtyCache = scale.updateBounds() || mode === 'resize' || mode === 'reset';
102 |
103 | if (this.showOutline()) {
104 | const elem = meta.dataset!;
105 | if (dirtyCache) {
106 | delete elem.cache;
107 | }
108 | elem.projectionScale = scale;
109 | elem.pixelRatio = this.chart.currentDevicePixelRatio;
110 | if (mode !== 'resize') {
111 | const options = patchDatasetElementOptions(this.resolveDatasetElementOptions(mode));
112 | const properties = {
113 | feature: this.resolveOutline(),
114 | options,
115 | };
116 | this.updateElement(elem, undefined, properties, mode);
117 | if (this.getGraticule()) {
118 | (meta as any).graticule = options;
119 | }
120 | }
121 | } else if (this.getGraticule() && mode !== 'resize') {
122 | (meta as any).graticule = patchDatasetElementOptions(this.resolveDatasetElementOptions(mode));
123 | }
124 |
125 | if (dirtyCache) {
126 | meta.data.forEach((elem) => delete (elem as any).cache);
127 | }
128 | this.updateElements(meta.data, 0, meta.data.length, mode);
129 | }
130 |
131 | resolveOutline(): any {
132 | const ds = this.getGeoDataset();
133 | const outline = ds.outline || { type: 'Sphere' };
134 | if (Array.isArray(outline)) {
135 | return {
136 | type: 'FeatureCollection',
137 | features: outline,
138 | };
139 | }
140 | return outline;
141 | }
142 |
143 | showGraticule(): void {
144 | const g = this.getGraticule();
145 | const options = (this.getMeta() as any).graticule;
146 | if (!g || !options) {
147 | return;
148 | }
149 | const { ctx } = this.chart;
150 | const scale = this.getProjectionScale();
151 | const path = scale.geoPath.context(ctx);
152 |
153 | ctx.save();
154 | ctx.beginPath();
155 |
156 | if (typeof g === 'boolean') {
157 | if (g) {
158 | path(geoGraticule10());
159 | }
160 | } else {
161 | const geo = geoGraticule();
162 | if (g.stepMajor) {
163 | geo.stepMajor(g.stepMajor as unknown as [number, number]);
164 | }
165 | if (g.stepMinor) {
166 | geo.stepMinor(g.stepMinor as unknown as [number, number]);
167 | }
168 | path(geo());
169 | }
170 |
171 | ctx.strokeStyle = options.graticuleBorderColor;
172 | ctx.lineWidth = options.graticuleBorderWidth;
173 | ctx.stroke();
174 | ctx.restore();
175 | }
176 |
177 | draw(): void {
178 | const { chart } = this;
179 |
180 | const clipMap = this.clipMap();
181 |
182 | // enable clipping based on the option
183 | let enabled = false;
184 | if (clipMap === true || clipMap === 'outline' || clipMap === 'outline+graticule') {
185 | enabled = true;
186 | clipArea(chart.ctx, chart.chartArea);
187 | }
188 |
189 | if (this.showOutline() && this.getMeta().dataset) {
190 | (this.getMeta().dataset!.draw.call as any)(this.getMeta().dataset!, chart.ctx, chart.chartArea);
191 | }
192 |
193 | if (clipMap === true || clipMap === 'graticule' || clipMap === 'outline+graticule') {
194 | if (!enabled) {
195 | clipArea(chart.ctx, chart.chartArea);
196 | }
197 | } else if (enabled) {
198 | enabled = false;
199 | unclipArea(chart.ctx);
200 | }
201 |
202 | this.showGraticule();
203 |
204 | if (clipMap === true || clipMap === 'items') {
205 | if (!enabled) {
206 | clipArea(chart.ctx, chart.chartArea);
207 | }
208 | } else if (enabled) {
209 | enabled = false;
210 | unclipArea(chart.ctx);
211 | }
212 |
213 | this.getMeta().data.forEach((elem) => (elem.draw.call as any)(elem, chart.ctx, chart.chartArea));
214 |
215 | if (enabled) {
216 | enabled = false;
217 | unclipArea(chart.ctx);
218 | }
219 | }
220 | }
221 |
222 | export interface IGeoChartOptions {
223 | /**
224 | * Outline used to scale and centralize the projection in the chart area.
225 | * By default a sphere is used
226 | * @default { type: 'Sphere" }
227 | */
228 | outline: any[];
229 | /**
230 | * option to render the outline in the background, see also the outline... styling option
231 | * @default false
232 | */
233 | showOutline: boolean;
234 |
235 | /**
236 | * option to render a graticule in the background, see also the outline... styling option
237 | * @default false
238 | */
239 | showGraticule:
240 | | boolean
241 | | {
242 | stepMajor: [number, number];
243 | stepMinor: [number, number];
244 | };
245 |
246 | /**
247 | * option whether to clip the rendering to the chartArea of the graph
248 | * @default choropleth: true bubbleMap: 'outline+graticule'
249 | */
250 | clipMap: boolean | 'outline' | 'graticule' | 'outline+graticule' | 'items';
251 | }
252 |
253 | export interface IGeoControllerDatasetOptions
254 | extends IGeoChartOptions,
255 | ScriptableAndArrayOptions>,
256 | AnimationOptions<'choropleth' | 'bubbleMap'> {
257 | xAxisID?: string;
258 | yAxisID?: string;
259 | rAxisID?: string;
260 | iAxisID?: string;
261 | vAxisID?: string;
262 | }
263 |
264 | export interface IGeoDataPoint {
265 | feature: ExtendedFeature;
266 | center?: {
267 | longitude: number;
268 | latitude: number;
269 | };
270 | }
271 |
--------------------------------------------------------------------------------
/README.md:
--------------------------------------------------------------------------------
1 | # Chart.js Geo
2 |
3 | [![NPM Package][npm-image]][npm-url] [![Github Actions][github-actions-image]][github-actions-url]
4 |
5 | Chart.js module for charting maps with legends. Adding new chart types: `choropleth` and `bubbleMap`.
6 |
7 | 
8 |
9 | [![Open in CodePen][codepen]](https://codepen.io/sgratzl/pen/gOaBQep)
10 |
11 | 
12 |
13 | [![Open in CodePen][codepen]](https://codepen.io/sgratzl/pen/bGVmQKw)
14 |
15 | 
16 |
17 | [![Open in CodePen][codepen]](https://codepen.io/sgratzl/pen/YzyJRvm)
18 |
19 | works great with https://github.com/chartjs/chartjs-plugin-datalabels
20 |
21 | ## Related Plugins
22 |
23 | Check out also my other chart.js plugins:
24 |
25 | - [chartjs-chart-boxplot](https://github.com/sgratzl/chartjs-chart-boxplot) for rendering boxplots and violin plots
26 | - [chartjs-chart-error-bars](https://github.com/sgratzl/chartjs-chart-error-bars) for rendering errors bars to bars and line charts
27 | - [chartjs-chart-graph](https://github.com/sgratzl/chartjs-chart-graph) for rendering graphs, trees, and networks
28 | - [chartjs-chart-pcp](https://github.com/sgratzl/chartjs-chart-pcp) for rendering parallel coordinate plots
29 | - [chartjs-chart-venn](https://github.com/sgratzl/chartjs-chart-venn) for rendering venn and euler diagrams
30 | - [chartjs-chart-wordcloud](https://github.com/sgratzl/chartjs-chart-wordcloud) for rendering word clouds
31 | - [chartjs-plugin-hierarchical](https://github.com/sgratzl/chartjs-plugin-hierarchical) for rendering hierarchical categorical axes which can be expanded and collapsed
32 |
33 | ## Install
34 |
35 | ```bash
36 | npm install --save chart.js chartjs-chart-geo
37 | ```
38 |
39 | ## Usage
40 |
41 | see https://www.sgratzl.com/chartjs-chart-geo/ website
42 |
43 | CodePens
44 |
45 | - [Choropleth](https://codepen.io/sgratzl/pen/gOaBQep)
46 | - [Earth Choropleth](https://codepen.io/sgratzl/pen/bGVmQKw)
47 | - [Bubble Map](https://codepen.io/sgratzl/pen/YzyJRvm)
48 |
49 | ## Options
50 |
51 | The option can be set globally or per dataset
52 |
53 | see [https://github.com/sgratzl/chartjs-chart-geo/blob/main/src/controllers/GeoController.ts#L221](https://github.com/sgratzl/chartjs-chart-geo/blob/be3979117f8ae9a249969593c108d9b92b7e07fa/src/controllers/GeoController.ts#L225-L254)
54 |
55 | ## Choropleth
56 |
57 | A Choropleth (chart type: `choropleth`) is used to render maps with the area filled according to some numerical value.
58 |
59 | 
60 |
61 | [![Open in CodePen][codepen]](https://codepen.io/sgratzl/pen/gOaBQep)
62 |
63 | 
64 |
65 | [![Open in CodePen][codepen]](https://codepen.io/sgratzl/pen/bGVmQKw)
66 |
67 | ### Data Structure
68 |
69 | A data point has to have a `.feature` property containing the feature to render and a `.value` property containing the value for the coloring.
70 |
71 | [TopoJson](https://github.com/topojson) is packaged with this plugin to convert data, it is exposed as `ChartGeo.topojson` in the global context. However, this plugin doesn't include any topojson files itself. Some useful resources I found so far:
72 |
73 | - US map: https://www.npmjs.com/package/us-atlas
74 | - World map: https://www.npmjs.com/package/world-atlas
75 | - individual countries: https://github.com/markmarkoh/datamaps/tree/master/src/js/data (untested)
76 | - topojson collection: https://github.com/deldersveld/topojson (untested)
77 |
78 | ```js
79 | const us = await fetch('https://cdn.jsdelivr.net/npm/us-atlas/states-10m.json').then((r) => r.json());
80 |
81 | // whole US for the outline
82 | const nation = ChartGeo.topojson.feature(us, us.objects.nation).features[0];
83 | // individual states
84 | const states = ChartGeo.topojson.feature(us, us.objects.states).features;
85 |
86 | const alaska = states.find((d) => d.properties.name === 'Alaska');
87 | const california = states.find((d) => d.properties.name === 'California');
88 | ...
89 |
90 | const config = {
91 | data: {
92 | labels: ['Alaska', 'California'],
93 | datasets: [{
94 | label: 'States',
95 | outline: nation, // ... outline to compute bounds
96 | showOutline: true,
97 | data: [
98 | {
99 | value: 0.4,
100 | feature: alaska // ... the feature to render
101 | },
102 | {
103 | value: 0.3,
104 | feature: california
105 | }
106 | ]
107 | }]
108 | },
109 | options: {
110 | scales: {
111 | projection: {
112 | projection: 'albersUsa' // ... projection method
113 | }
114 | }
115 | }
116 | };
117 |
118 | ```
119 |
120 | ### Styling
121 |
122 | The styling of the new element `GeoFeature` is based on [Bar Element](https://www.chartjs.org/docs/latest/configuration/elements.html#bar-configuration) with some additional options for the outline and graticule.
123 |
124 | see https://github.com/sgratzl/chartjs-chart-geo/blob/main/src/elements/GeoFeature.ts#L41
125 |
126 | ### Legend and Color Scale
127 |
128 | The coloring of the nodes will be done with a special color scale. The scale itself is based on a linear scale.
129 |
130 | see
131 |
132 | - https://github.com/sgratzl/chartjs-chart-geo/blob/main/src/scales/LegendScale.ts#L148
133 | - https://github.com/sgratzl/chartjs-chart-geo/blob/main/src/scales/ColorScale.ts#L180
134 |
135 | ## Bubble Map
136 |
137 | A Bubble Map (chart type: `bubbleMap`) aka Proportional Symbol is used to render maps with dots that are scaled according to some numerical value. It is based on a regular `bubble` chart where the positioning is done using latitude and longitude with an additional `sizeScale` to create a legend for the different radi.
138 |
139 | 
140 |
141 | [![Open in CodePen][codepen]](https://codepen.io/sgratzl/pen/YzyJRvm)
142 |
143 | ### Data Structure
144 |
145 | see [Bubble Chart](https://www.chartjs.org/docs/latest/charts/bubble.html#data-structure). Alternatively to `x` and `y`, the following structure can be used:
146 |
147 | ```ts
148 | interface IBubbleMapPoint {
149 | longitude: number;
150 | latitude: number;
151 | value: number;
152 | }
153 | ```
154 |
155 | **Note**: instead of using the `r` attribute as in a regular bubble chart, the `value` attribute is used, which is picked up by the `sizeScale` to convert it to an actual pixel radius value.
156 |
157 | ### Styling
158 |
159 | A regular point is used and thus supports the [Point Element](https://www.chartjs.org/docs/latest/configuration/elements.html#point-configuration) styling options. In addition, the `outline*` and `graticule*` are supported.
160 |
161 | ### Legend
162 |
163 | Similar to the choropleth chart a new `sizeScale` is used to map the values to symbol radius size. The scale itself is based on a linear scale.
164 |
165 | see
166 |
167 | - https://github.com/sgratzl/chartjs-chart-geo/blob/main/src/scales/LegendScale.ts#L148
168 | - https://github.com/sgratzl/chartjs-chart-geo/blob/main/src/scales/SizeScale.ts#L52
169 |
170 | ## Scales
171 |
172 | A new scale `projection` is registered and used by default by Choropleth and BubbleMap. The available methods are the one from https://github.com/d3/d3-geo#projections. Just remove the `geo` prefix. Alternatively, the projection method instance can be directly given.
173 |
174 | see https://github.com/sgratzl/chartjs-chart-geo/blob/main/src/scales/ProjectionScale.ts#L76
175 |
176 | ### ESM and Tree Shaking
177 |
178 | The ESM build of the library supports tree shaking thus having no side effects. As a consequence the chart.js library won't be automatically manipulated nor new controllers automatically registered. One has to manually import and register them.
179 |
180 | Variant A:
181 |
182 | ```js
183 | import { Chart } from 'chart.js';
184 | import { ChoroplethController, GeoFeature, ColorScale, ProjectionScale } from 'chartjs-chart-geo';
185 |
186 | // register controller in chart.js and ensure the defaults are set
187 | Chart.register(ChoroplethController, GeoFeature, ColorScale, ProjectionScale);
188 |
189 | const chart = new Chart(document.getElementById('canvas').getContext('2d'), {
190 | type: 'choropleth',
191 | data: {
192 | // ...
193 | },
194 | });
195 | ```
196 |
197 | Variant B:
198 |
199 | ```js
200 | import { ChoroplethChart } from 'chartjs-chart-geo';
201 |
202 | const chart = new ChoroplethChart(document.getElementById('canvas').getContext('2d'), {
203 | data: {
204 | //...
205 | },
206 | });
207 | ```
208 |
209 | ## Development Environment
210 |
211 | ```sh
212 | npm i -g yarn
213 | yarn install
214 | yarn sdks vscode
215 | ```
216 |
217 | ### Common commands
218 |
219 | ```sh
220 | yarn compile
221 | yarn test
222 | yarn lint
223 | yarn fix
224 | yarn build
225 | yarn docs
226 | ```
227 |
228 | [npm-image]: https://badge.fury.io/js/chartjs-chart-geo.svg
229 | [npm-url]: https://npmjs.org/package/chartjs-chart-geo
230 | [github-actions-image]: https://github.com/sgratzl/chartjs-chart-geo/workflows/ci/badge.svg
231 | [github-actions-url]: https://github.com/sgratzl/chartjs-chart-geo/actions
232 | [codepen]: https://img.shields.io/badge/CodePen-open-blue?logo=codepen
233 |
--------------------------------------------------------------------------------
/src/elements/GeoFeature.ts:
--------------------------------------------------------------------------------
1 | import {
2 | Element,
3 | BarElement,
4 | BarOptions,
5 | VisualElement,
6 | Point,
7 | ChartType,
8 | ScriptableAndArrayOptions,
9 | CommonHoverOptions,
10 | ScriptableContext,
11 | UpdateMode,
12 | } from 'chart.js';
13 | import { geoContains, GeoPath, GeoProjection } from 'd3-geo';
14 | import type { ProjectionScale } from '../scales';
15 |
16 | export interface IGeoFeatureOptions extends Omit, Record {
17 | /**
18 | * Width of the border
19 | * @default 0
20 | */
21 | borderWidth: number;
22 |
23 | /**
24 | * background color for the outline
25 | * @default null
26 | */
27 | outlineBackgroundColor: string | null;
28 | /**
29 | * border color for the outline
30 | * @default defaultColor of Chart.js
31 | */
32 | outlineBorderColor: string;
33 | /**
34 | * border width for the outline
35 | * @default 0
36 | */
37 | outlineBorderWidth: number;
38 |
39 | /**
40 | * border color for the graticule
41 | * @default #CCCCCC
42 | */
43 | graticuleBorderColor: string;
44 | /**
45 | * border width for the graticule
46 | * @default 0
47 | */
48 | graticuleBorderWidth: number;
49 | }
50 |
51 | export type Feature = any;
52 |
53 | type GeoBounds = ReturnType;
54 |
55 | function growGeoBounds(bounds: GeoBounds, amount: number): GeoBounds {
56 | return [
57 | [bounds[0][0] - amount, bounds[0][1] - amount],
58 | [bounds[1][0] + amount, bounds[1][1] + amount],
59 | ];
60 | }
61 |
62 | export interface IGeoFeatureProps {
63 | x: number;
64 | y: number;
65 | }
66 |
67 | export class GeoFeature extends Element implements VisualElement {
68 | /**
69 | * @hidden
70 | */
71 | cache?:
72 | | {
73 | center?: Point;
74 | bounds?: {
75 | x: number;
76 | y: number;
77 | width: number;
78 | height: number;
79 | x2: number;
80 | y2: number;
81 | };
82 | canvasKey?: string;
83 | canvas?: HTMLCanvasElement;
84 | }
85 | | undefined = undefined;
86 |
87 | /**
88 | * @hidden
89 | */
90 | projectionScale!: ProjectionScale;
91 |
92 | /**
93 | * @hidden
94 | */
95 | feature!: Feature;
96 |
97 | /**
98 | * @hidden
99 | */
100 | center?: { longitude: number; latitude: number };
101 |
102 | /**
103 | * @hidden
104 | */
105 | pixelRatio?: number;
106 |
107 | updateExtras({
108 | scale,
109 | feature,
110 | center,
111 | pixelRatio,
112 | mode,
113 | }: {
114 | scale: ProjectionScale;
115 | feature: Feature;
116 | center?: { longitude: number; latitude: number };
117 | pixelRatio: number;
118 | mode: UpdateMode;
119 | }): Point {
120 | const changed =
121 | mode === 'resize' ||
122 | mode === 'reset' ||
123 | this.projectionScale !== scale ||
124 | this.feature !== feature ||
125 | this.center?.longitude !== center?.longitude ||
126 | this.center?.latitude !== center?.latitude ||
127 | this.pixelRatio !== pixelRatio;
128 | this.projectionScale = scale;
129 | this.feature = feature;
130 | this.center = center;
131 | this.pixelRatio = pixelRatio;
132 | if (changed) {
133 | this.cache = undefined;
134 | }
135 | return this.getCenterPoint();
136 | }
137 |
138 | /**
139 | * @hidden
140 | */
141 | inRange(mouseX: number, mouseY: number): boolean {
142 | const bb = this.getBounds();
143 | const r =
144 | (Number.isNaN(mouseX) || (mouseX >= bb.x && mouseX <= bb.x2)) &&
145 | (Number.isNaN(mouseY) || (mouseY >= bb.y && mouseY <= bb.y2));
146 |
147 | const projection = this.projectionScale.geoPath.projection() as unknown as GeoProjection;
148 | if (r && !Number.isNaN(mouseX) && !Number.isNaN(mouseY) && typeof projection.invert === 'function') {
149 | // test for real if within the bounds
150 | const longLat = projection.invert([mouseX, mouseY]);
151 | return longLat != null && geoContains(this.feature, longLat);
152 | }
153 |
154 | return r;
155 | }
156 |
157 | /**
158 | * @hidden
159 | */
160 | inXRange(mouseX: number): boolean {
161 | return this.inRange(mouseX, Number.NaN);
162 | }
163 |
164 | /**
165 | * @hidden
166 | */
167 | inYRange(mouseY: number): boolean {
168 | return this.inRange(Number.NaN, mouseY);
169 | }
170 |
171 | /**
172 | * @hidden
173 | */
174 | getCenterPoint(): { x: number; y: number } {
175 | if (this.cache && this.cache.center) {
176 | return this.cache.center;
177 | }
178 | let center: { x: number; y: number };
179 | if (this.center) {
180 | const p = this.projectionScale.projection([this.center.longitude, this.center.latitude])!;
181 | center = {
182 | x: p[0]!,
183 | y: p[1]!,
184 | };
185 | } else {
186 | const centroid = this.projectionScale.geoPath.centroid(this.feature);
187 | center = {
188 | x: centroid[0],
189 | y: centroid[1],
190 | };
191 | }
192 | this.cache = { ...(this.cache || {}), center };
193 | return center;
194 | }
195 |
196 | /**
197 | * @hidden
198 | */
199 | getBounds(): { x: number; y: number; x2: number; y2: number; width: number; height: number } {
200 | if (this.cache && this.cache.bounds) {
201 | return this.cache.bounds;
202 | }
203 | const bb = growGeoBounds(this.projectionScale.geoPath.bounds(this.feature), this.options.borderWidth / 2);
204 | const bounds = {
205 | x: bb[0][0],
206 | x2: bb[1][0],
207 | y: bb[0][1],
208 | y2: bb[1][1],
209 | width: bb[1][0] - bb[0][0],
210 | height: bb[1][1] - bb[0][1],
211 | };
212 | this.cache = { ...(this.cache || {}), bounds };
213 | return bounds;
214 | }
215 |
216 | /**
217 | * @hidden
218 | */
219 | _drawInCache(doc: Document): void {
220 | const bounds = this.getBounds();
221 | if (!Number.isFinite(bounds.x)) {
222 | return;
223 | }
224 | const canvas = this.cache && this.cache.canvas ? this.cache.canvas : doc.createElement('canvas');
225 | const x1 = Math.floor(bounds.x);
226 | const y1 = Math.floor(bounds.y);
227 | const x2 = Math.ceil(bounds.x + bounds.width);
228 | const y2 = Math.ceil(bounds.y + bounds.height);
229 | const pixelRatio = this.pixelRatio || 1;
230 | const width = Math.ceil(Math.max(x2 - x1, 1) * pixelRatio);
231 | const height = Math.ceil(Math.max(y2 - y1, 1) * pixelRatio);
232 | if (width <= 0 || height <= 0) {
233 | return;
234 | }
235 | canvas.width = width;
236 | canvas.height = height;
237 |
238 | const ctx = canvas.getContext('2d');
239 | if (ctx) {
240 | ctx.clearRect(0, 0, canvas.width, canvas.height);
241 | ctx.save();
242 | ctx.scale(pixelRatio, pixelRatio);
243 | ctx.translate(-x1, -y1);
244 | this._drawImpl(ctx);
245 | ctx.restore();
246 |
247 | this.cache = { ...(this.cache || {}), canvas, canvasKey: this._optionsToKey() };
248 | }
249 | }
250 |
251 | /**
252 | * @hidden
253 | */
254 | _optionsToKey(): string {
255 | const { options } = this;
256 | return `${options.backgroundColor};${options.borderColor};${options.borderWidth};${this.pixelRatio}`;
257 | }
258 |
259 | /**
260 | * @hidden
261 | */
262 | _drawImpl(ctx: CanvasRenderingContext2D): void {
263 | const { feature } = this;
264 | const { options } = this;
265 | ctx.beginPath();
266 | this.projectionScale.geoPath.context(ctx)(feature);
267 | if (options.backgroundColor) {
268 | ctx.fillStyle = options.backgroundColor;
269 | ctx.fill();
270 | }
271 | if (options.borderColor) {
272 | ctx.strokeStyle = options.borderColor;
273 | ctx.lineWidth = options.borderWidth as number;
274 | ctx.stroke();
275 | }
276 | }
277 |
278 | /**
279 | * @hidden
280 | */
281 | draw(ctx: CanvasRenderingContext2D): void {
282 | const { feature } = this;
283 | if (!feature) {
284 | return;
285 | }
286 | if ((!this.cache || this.cache.canvasKey !== this._optionsToKey()) && ctx.canvas.ownerDocument != null) {
287 | this._drawInCache(ctx.canvas.ownerDocument);
288 | }
289 | const bounds = this.getBounds();
290 | if (this.cache && this.cache.canvas && this.cache.canvas.width > 0 && this.cache.canvas.height > 0) {
291 | const x1 = Math.floor(bounds.x);
292 | const y1 = Math.floor(bounds.y);
293 | const x2 = Math.ceil(bounds.x + bounds.width);
294 | const y2 = Math.ceil(bounds.y + bounds.height);
295 | const width = x2 - x1;
296 | const height = y2 - y1;
297 | if (width > 0 && height > 0) {
298 | ctx.drawImage(this.cache.canvas, x1, y1, x2 - x1, y2 - y1);
299 | }
300 | } else if (Number.isFinite(bounds.x)) {
301 | ctx.save();
302 | this._drawImpl(ctx);
303 | ctx.restore();
304 | }
305 | }
306 |
307 | static id = 'geoFeature';
308 |
309 | /**
310 | * @hidden
311 | */
312 | static defaults = /* #__PURE__ */ {
313 | ...BarElement.defaults,
314 | outlineBackgroundColor: null,
315 | outlineBorderWidth: 0,
316 |
317 | graticuleBorderColor: '#CCCCCC',
318 | graticuleBorderWidth: 0,
319 | };
320 |
321 | /**
322 | * @hidden
323 | */
324 | static defaultRoutes = /* #__PURE__ */ {
325 | outlineBorderColor: 'borderColor',
326 | ...(BarElement.defaultRoutes || {}),
327 | };
328 | }
329 |
330 | declare module 'chart.js' {
331 | export interface ElementOptionsByType {
332 | geoFeature: ScriptableAndArrayOptions>;
333 | }
334 | }
335 |
--------------------------------------------------------------------------------
/src/scales/ColorScale.ts:
--------------------------------------------------------------------------------
1 | import { LinearScale, LogarithmicScale, LogarithmicScaleOptions, LinearScaleOptions } from 'chart.js';
2 | import { merge } from 'chart.js/helpers';
3 | import {
4 | interpolateBlues,
5 | interpolateBrBG,
6 | interpolateBuGn,
7 | interpolateBuPu,
8 | interpolateCividis,
9 | interpolateCool,
10 | interpolateCubehelixDefault,
11 | interpolateGnBu,
12 | interpolateGreens,
13 | interpolateGreys,
14 | interpolateInferno,
15 | interpolateMagma,
16 | interpolateOrRd,
17 | interpolateOranges,
18 | interpolatePRGn,
19 | interpolatePiYG,
20 | interpolatePlasma,
21 | interpolatePuBu,
22 | interpolatePuBuGn,
23 | interpolatePuOr,
24 | interpolatePuRd,
25 | interpolatePurples,
26 | interpolateRainbow,
27 | interpolateRdBu,
28 | interpolateRdGy,
29 | interpolateRdPu,
30 | interpolateRdYlBu,
31 | interpolateRdYlGn,
32 | interpolateReds,
33 | interpolateSinebow,
34 | interpolateSpectral,
35 | interpolateTurbo,
36 | interpolateViridis,
37 | interpolateWarm,
38 | interpolateYlGn,
39 | interpolateYlGnBu,
40 | interpolateYlOrBr,
41 | interpolateYlOrRd,
42 | } from 'd3-scale-chromatic';
43 | import { baseDefaults, LegendScale, LogarithmicLegendScale, ILegendScaleOptions } from './LegendScale';
44 |
45 | const lookup: { [key: string]: (normalizedValue: number) => string } = {
46 | interpolateBlues,
47 | interpolateBrBG,
48 | interpolateBuGn,
49 | interpolateBuPu,
50 | interpolateCividis,
51 | interpolateCool,
52 | interpolateCubehelixDefault,
53 | interpolateGnBu,
54 | interpolateGreens,
55 | interpolateGreys,
56 | interpolateInferno,
57 | interpolateMagma,
58 | interpolateOrRd,
59 | interpolateOranges,
60 | interpolatePRGn,
61 | interpolatePiYG,
62 | interpolatePlasma,
63 | interpolatePuBu,
64 | interpolatePuBuGn,
65 | interpolatePuOr,
66 | interpolatePuRd,
67 | interpolatePurples,
68 | interpolateRainbow,
69 | interpolateRdBu,
70 | interpolateRdGy,
71 | interpolateRdPu,
72 | interpolateRdYlBu,
73 | interpolateRdYlGn,
74 | interpolateReds,
75 | interpolateSinebow,
76 | interpolateSpectral,
77 | interpolateTurbo,
78 | interpolateViridis,
79 | interpolateWarm,
80 | interpolateYlGn,
81 | interpolateYlGnBu,
82 | interpolateYlOrBr,
83 | interpolateYlOrRd,
84 | };
85 |
86 | Object.keys(lookup).forEach((key) => {
87 | lookup[`${key.charAt(11).toLowerCase()}${key.slice(12)}`] = lookup[key];
88 | lookup[key.slice(11)] = lookup[key];
89 | });
90 |
91 | function quantize(v: number, steps: number) {
92 | const perStep = 1 / steps;
93 | if (v <= perStep) {
94 | return 0;
95 | }
96 | if (v >= 1 - perStep) {
97 | return 1;
98 | }
99 | for (let acc = 0; acc < 1; acc += perStep) {
100 | if (v < acc) {
101 | return acc - perStep / 2; // center
102 | }
103 | }
104 | return v;
105 | }
106 |
107 | export interface IColorScaleOptions extends ILegendScaleOptions {
108 | // support all options from linear scale -> https://www.chartjs.org/docs/latest/axes/cartesian/linear.html#linear-cartesian-axis
109 | // e.g. for tick manipulation, ...
110 |
111 | /**
112 | * color interpolation method which is either a function
113 | * converting a normalized value to string or a
114 | * well defined string of all the interpolation scales
115 | * from https://github.com/d3/d3-scale-chromatic.
116 | * e.g. interpolateBlues -> blues
117 | *
118 | * @default blues
119 | */
120 | interpolate:
121 | | ((normalizedValue: number) => string)
122 | | 'blues'
123 | | 'brBG'
124 | | 'buGn'
125 | | 'buPu'
126 | | 'cividis'
127 | | 'cool'
128 | | 'cubehelixDefault'
129 | | 'gnBu'
130 | | 'greens'
131 | | 'greys'
132 | | 'inferno'
133 | | 'magma'
134 | | 'orRd'
135 | | 'oranges'
136 | | 'pRGn'
137 | | 'piYG'
138 | | 'plasma'
139 | | 'puBu'
140 | | 'puBuGn'
141 | | 'puOr'
142 | | 'puRd'
143 | | 'purples'
144 | | 'rainbow'
145 | | 'rdBu'
146 | | 'rdGy'
147 | | 'rdPu'
148 | | 'rdYlBu'
149 | | 'rdYlGn'
150 | | 'reds'
151 | | 'sinebow'
152 | | 'spectral'
153 | | 'turbo'
154 | | 'viridis'
155 | | 'warm'
156 | | 'ylGn'
157 | | 'ylGnBu'
158 | | 'ylOrBr'
159 | | 'ylOrRd';
160 |
161 | /**
162 | * color value to render for missing values
163 | * @default transparent
164 | */
165 | missing: string;
166 |
167 | /**
168 | * allows to split the color scale in N quantized equal bins.
169 | * @default 0
170 | */
171 | quantize: number;
172 | }
173 |
174 | const colorScaleDefaults = {
175 | interpolate: 'blues',
176 | missing: 'transparent',
177 | quantize: 0,
178 | };
179 |
180 | export class ColorScale extends LegendScale {
181 | /**
182 | * @hidden
183 | */
184 | get interpolate(): (v: number) => string {
185 | const o = this.options as IColorScaleOptions & LinearScaleOptions;
186 | if (!o) {
187 | return (v: number) => `rgb(${v},${v},${v})`;
188 | }
189 | if (typeof o.interpolate === 'function') {
190 | return o.interpolate;
191 | }
192 | return lookup[o.interpolate] || lookup.blues;
193 | }
194 |
195 | /**
196 | * @hidden
197 | */
198 | getColorForValue(value: number): string {
199 | const v = this._getNormalizedValue(value);
200 | if (v == null || Number.isNaN(v)) {
201 | return this.options.missing;
202 | }
203 | return this.getColor(v);
204 | }
205 |
206 | /**
207 | * @hidden
208 | */
209 | getColor(normalized: number): string {
210 | let v = normalized;
211 | if (this.options.quantize > 0) {
212 | v = quantize(v, this.options.quantize);
213 | }
214 | return this.interpolate(v);
215 | }
216 |
217 | /**
218 | * @hidden
219 | */
220 | _drawIndicator(): void {
221 | const { indicatorWidth: indicatorSize } = this.options.legend;
222 | const reverse = (this as any)._reversePixels;
223 |
224 | if (this.isHorizontal()) {
225 | const w = this.width;
226 | if (this.options.quantize > 0) {
227 | const stepWidth = w / this.options.quantize;
228 | const offset = !reverse ? (i: number) => i : (i: number) => w - stepWidth - i;
229 | for (let i = 0; i < w; i += stepWidth) {
230 | const v = (i + stepWidth / 2) / w;
231 | this.ctx.fillStyle = this.getColor(v);
232 | this.ctx.fillRect(offset(i), 0, stepWidth, indicatorSize);
233 | }
234 | } else {
235 | const offset = !reverse ? (i: number) => i : (i: number) => w - 1 - i;
236 | for (let i = 0; i < w; i += 1) {
237 | this.ctx.fillStyle = this.getColor((i + 0.5) / w);
238 | this.ctx.fillRect(offset(i), 0, 1, indicatorSize);
239 | }
240 | }
241 | } else {
242 | const h = this.height;
243 | if (this.options.quantize > 0) {
244 | const stepWidth = h / this.options.quantize;
245 | const offset = !reverse ? (i: number) => i : (i: number) => h - stepWidth - i;
246 | for (let i = 0; i < h; i += stepWidth) {
247 | const v = (i + stepWidth / 2) / h;
248 | this.ctx.fillStyle = this.getColor(v);
249 | this.ctx.fillRect(0, offset(i), indicatorSize, stepWidth);
250 | }
251 | } else {
252 | const offset = !reverse ? (i: number) => i : (i: number) => h - 1 - i;
253 | for (let i = 0; i < h; i += 1) {
254 | this.ctx.fillStyle = this.getColor((i + 0.5) / h);
255 | this.ctx.fillRect(0, offset(i), indicatorSize, 1);
256 | }
257 | }
258 | }
259 | }
260 |
261 | static readonly id = 'color';
262 |
263 | /**
264 | * @hidden
265 | */
266 | static readonly defaults: any = /* #__PURE__ */ merge({}, [LinearScale.defaults, baseDefaults, colorScaleDefaults]);
267 |
268 | /**
269 | * @hidden
270 | */
271 | static readonly descriptors = /* #__PURE__ */ {
272 | _scriptable: (name: string): boolean => name !== 'interpolate',
273 | _indexable: false,
274 | };
275 | }
276 |
277 | export class ColorLogarithmicScale extends LogarithmicLegendScale {
278 | private interpolate = (v: number) => `rgb(${v},${v},${v})`;
279 |
280 | /**
281 | * @hidden
282 | */
283 | init(options: IColorScaleOptions & LinearScaleOptions): void {
284 | super.init(options);
285 | if (typeof options.interpolate === 'function') {
286 | this.interpolate = options.interpolate;
287 | } else {
288 | this.interpolate = lookup[options.interpolate] || lookup.blues;
289 | }
290 | }
291 |
292 | /**
293 | * @hidden
294 | */
295 | getColorForValue(value: number): string {
296 | return ColorScale.prototype.getColorForValue.call(this, value);
297 | }
298 |
299 | /**
300 | * @hidden
301 | */
302 | getColor(normalized: number): string {
303 | let v = normalized;
304 | if (this.options.quantize > 0) {
305 | v = quantize(v, this.options.quantize);
306 | }
307 | return this.interpolate(v);
308 | }
309 |
310 | protected _drawIndicator(): void {
311 | return ColorScale.prototype._drawIndicator.call(this);
312 | }
313 |
314 | static readonly id = 'colorLogarithmic';
315 |
316 | /**
317 | * @hidden
318 | */
319 | static readonly defaults: any = /* #__PURE__ */ merge({}, [
320 | LogarithmicScale.defaults,
321 | baseDefaults,
322 | colorScaleDefaults,
323 | ]);
324 |
325 | /**
326 | * @hidden
327 | */
328 | static readonly descriptors = /* #__PURE__ */ {
329 | _scriptable: (name: string): boolean => name !== 'interpolate',
330 | _indexable: false,
331 | };
332 | }
333 |
334 | declare module 'chart.js' {
335 | export interface ColorScaleTypeRegistry {
336 | color: {
337 | options: IColorScaleOptions & LinearScaleOptions;
338 | };
339 | colorLogarithmic: {
340 | options: IColorScaleOptions & LogarithmicScaleOptions;
341 | };
342 | }
343 |
344 | // eslint-disable-next-line @typescript-eslint/no-empty-object-type
345 | export interface ScaleTypeRegistry extends ColorScaleTypeRegistry {}
346 | }
347 |
--------------------------------------------------------------------------------
/src/scales/LegendScale.ts:
--------------------------------------------------------------------------------
1 | import {
2 | ChartArea,
3 | CartesianScaleOptions,
4 | LinearScale,
5 | LinearScaleOptions,
6 | LogarithmicScale,
7 | LogarithmicScaleOptions,
8 | } from 'chart.js';
9 |
10 | export interface ILegendScaleOptions extends CartesianScaleOptions {
11 | /**
12 | * whether to render a color legend
13 | * @default true
14 | */
15 | display: boolean;
16 |
17 | /**
18 | * the property name that stores the value in the data elements
19 | * @default value
20 | */
21 | property: string;
22 |
23 | legend: {
24 | /**
25 | * location of the legend on the chart area
26 | * @default bottom-right
27 | */
28 | position:
29 | | 'left'
30 | | 'right'
31 | | 'top'
32 | | 'bottom'
33 | | 'top-left'
34 | | 'top-right'
35 | | 'top-right'
36 | | 'bottom-right'
37 | | 'bottom-left'
38 | | { x: number; y: number };
39 | /**
40 | * alignment of the scale, e.g., `right` means that it is a vertical scale
41 | * with the ticks on the right side
42 | * @default right
43 | */
44 | align: 'left' | 'right' | 'top' | 'bottom';
45 | /**
46 | * length of the legend, i.e., for a horizontal scale the width
47 | * if a value < 1 is given, is it assume to be a ratio of the corresponding
48 | * chart area
49 | * @default 100
50 | */
51 | length: number;
52 | /**
53 | * how wide the scale is, i.e., for a horizontal scale the height
54 | * if a value < 1 is given, is it assume to be a ratio of the corresponding
55 | * chart area
56 | * @default 50
57 | */
58 | width: number;
59 | /**
60 | * how many pixels should be used for the color bar
61 | * @default 10
62 | */
63 | indicatorWidth: number;
64 | /**
65 | * margin pixels such that it doesn't stick to the edge of the chart
66 | * @default 8
67 | */
68 | margin: number | ChartArea;
69 | };
70 | }
71 |
72 | export const baseDefaults = {
73 | position: 'chartArea',
74 | property: 'value',
75 | grid: {
76 | z: 1,
77 | drawOnChartArea: false,
78 | },
79 | ticks: {
80 | z: 1,
81 | },
82 | legend: {
83 | align: 'right',
84 | position: 'bottom-right',
85 | length: 100,
86 | width: 50,
87 | margin: 8,
88 | indicatorWidth: 10,
89 | },
90 | };
91 |
92 | interface IPositionOption {
93 | position?: string;
94 | }
95 |
96 | function computeLegendMargin(legend: ILegendScaleOptions['legend']): {
97 | left: number;
98 | top: number;
99 | right: number;
100 | bottom: number;
101 | } {
102 | const { indicatorWidth, align: pos, margin } = legend;
103 |
104 | const left = (typeof margin === 'number' ? margin : margin.left) + (pos === 'right' ? indicatorWidth : 0);
105 | const top = (typeof margin === 'number' ? margin : margin.top) + (pos === 'bottom' ? indicatorWidth : 0);
106 | const right = (typeof margin === 'number' ? margin : margin.right) + (pos === 'left' ? indicatorWidth : 0);
107 | const bottom = (typeof margin === 'number' ? margin : margin.bottom) + (pos === 'top' ? indicatorWidth : 0);
108 | return { left, top, right, bottom };
109 | }
110 |
111 | function computeLegendPosition(
112 | chartArea: ChartArea,
113 | legend: ILegendScaleOptions['legend'],
114 | width: number,
115 | height: number,
116 | legendSize: { w: number; h: number }
117 | ): [number, number] {
118 | const { indicatorWidth, align: axisPos, position: pos } = legend;
119 | const isHor = axisPos === 'top' || axisPos === 'bottom';
120 | const w = (axisPos === 'left' ? legendSize.w : width) + (isHor ? indicatorWidth : 0);
121 | const h = (axisPos === 'top' ? legendSize.h : height) + (!isHor ? indicatorWidth : 0);
122 | const margin = computeLegendMargin(legend);
123 |
124 | if (typeof pos === 'string') {
125 | switch (pos) {
126 | case 'top-left':
127 | return [margin.left, margin.top];
128 | case 'top':
129 | return [(chartArea.right - w) / 2, margin.top];
130 | case 'left':
131 | return [margin.left, (chartArea.bottom - h) / 2];
132 | case 'top-right':
133 | return [chartArea.right - w - margin.right, margin.top];
134 | case 'bottom-right':
135 | return [chartArea.right - w - margin.right, chartArea.bottom - h - margin.bottom];
136 | case 'bottom':
137 | return [(chartArea.right - w) / 2, chartArea.bottom - h - margin.bottom];
138 | case 'bottom-left':
139 | return [margin.left, chartArea.bottom - h - margin.bottom];
140 | default:
141 | // right
142 | return [chartArea.right - w - margin.right, (chartArea.bottom - h) / 2];
143 | }
144 | }
145 | return [pos.x, pos.y];
146 | }
147 |
148 | export class LegendScale extends LinearScale {
149 | /**
150 | * @hidden
151 | */
152 | legendSize: { w: number; h: number } = { w: 0, h: 0 };
153 |
154 | /**
155 | * @hidden
156 | */
157 | init(options: O): void {
158 | (options as unknown as IPositionOption).position = 'chartArea';
159 | super.init(options);
160 | this.axis = 'r';
161 | }
162 |
163 | /**
164 | * @hidden
165 | */
166 |
167 | parse(raw: any, index: number): number {
168 | if (raw && typeof raw[this.options.property] === 'number') {
169 | return raw[this.options.property];
170 | }
171 | return super.parse(raw, index) as number;
172 | }
173 |
174 | /**
175 | * @hidden
176 | */
177 | isHorizontal(): boolean {
178 | return this.options.legend.align === 'top' || this.options.legend.align === 'bottom';
179 | }
180 |
181 | protected _getNormalizedValue(v: number): number | null {
182 | if (v == null || Number.isNaN(v)) {
183 | return null;
184 | }
185 | return (v - (this as any)._startValue) / (this as any)._valueRange;
186 | }
187 |
188 | /**
189 | * @hidden
190 | */
191 | update(maxWidth: number, maxHeight: number, margins: ChartArea): void {
192 | const ch = Math.min(maxHeight, this.bottom == null ? Number.POSITIVE_INFINITY : this.bottom);
193 | const cw = Math.min(maxWidth, this.right == null ? Number.POSITIVE_INFINITY : this.right);
194 |
195 | const l = this.options.legend;
196 | const isHor = this.isHorizontal();
197 | const factor = (v: number, full: number) => (v < 1 ? full * v : v);
198 | const w = Math.min(cw, factor(isHor ? l.length : l.width, cw)) - (!isHor ? l.indicatorWidth : 0);
199 | const h = Math.min(ch, factor(!isHor ? l.length : l.width, ch)) - (isHor ? l.indicatorWidth : 0);
200 | this.legendSize = { w, h };
201 | this.bottom = h;
202 | this.height = h;
203 | this.right = w;
204 | this.width = w;
205 |
206 | const bak = (this.options as IPositionOption).position;
207 | (this.options as IPositionOption).position = this.options.legend.align;
208 | const r = super.update(w, h, margins);
209 | (this.options as IPositionOption).position = bak;
210 | this.height = Math.min(h, this.height);
211 | this.width = Math.min(w, this.width);
212 | return r;
213 | }
214 |
215 | /**
216 | * @hidden
217 | */
218 |
219 | _computeLabelArea(): void {
220 | return undefined;
221 | }
222 |
223 | /**
224 | * @hidden
225 | */
226 | draw(chartArea: ChartArea): void {
227 | if (!(this as any)._isVisible()) {
228 | return;
229 | }
230 | const pos = computeLegendPosition(chartArea, this.options.legend, this.width, this.height, this.legendSize);
231 | /** @type {CanvasRenderingContext2D} */
232 | const { ctx } = this;
233 | ctx.save();
234 | ctx.translate(pos[0], pos[1]);
235 |
236 | const bak = (this.options as IPositionOption).position;
237 | (this.options as IPositionOption).position = this.options.legend.align;
238 | super.draw({ ...chartArea, bottom: this.height + 10, right: this.width });
239 | (this.options as IPositionOption).position = bak;
240 | const { indicatorWidth } = this.options.legend;
241 | switch (this.options.legend.align) {
242 | case 'left':
243 | ctx.translate(this.legendSize.w, 0);
244 | break;
245 | case 'top':
246 | ctx.translate(0, this.legendSize.h);
247 | break;
248 | case 'bottom':
249 | ctx.translate(0, -indicatorWidth);
250 | break;
251 | default:
252 | ctx.translate(-indicatorWidth, 0);
253 | break;
254 | }
255 | this._drawIndicator();
256 | ctx.restore();
257 | }
258 |
259 | /**
260 | * @hidden
261 | */
262 |
263 | protected _drawIndicator(): void {
264 | // hook
265 | }
266 | }
267 |
268 | export class LogarithmicLegendScale<
269 | O extends ILegendScaleOptions & LogarithmicScaleOptions,
270 | > extends LogarithmicScale {
271 | /**
272 | * @hidden
273 | */
274 | legendSize: { w: number; h: number } = { w: 0, h: 0 };
275 |
276 | /**
277 | * @hidden
278 | */
279 | init(options: O): void {
280 | LegendScale.prototype.init.call(this, options);
281 | }
282 |
283 | /**
284 | * @hidden
285 | */
286 |
287 | parse(raw: any, index: number): number {
288 | return LegendScale.prototype.parse.call(this, raw, index);
289 | }
290 |
291 | /**
292 | * @hidden
293 | */
294 | isHorizontal(): boolean {
295 | return this.options.legend.align === 'top' || this.options.legend.align === 'bottom';
296 | }
297 |
298 | protected _getNormalizedValue(v: number): number | null {
299 | if (v == null || Number.isNaN(v)) {
300 | return null;
301 | }
302 | return (Math.log10(v) - (this as any)._startValue) / (this as any)._valueRange;
303 | }
304 |
305 | /**
306 | * @hidden
307 | */
308 | update(maxWidth: number, maxHeight: number, margins: ChartArea): void {
309 | return LegendScale.prototype.update.call(this, maxWidth, maxHeight, margins);
310 | }
311 |
312 | /**
313 | * @hidden
314 | */
315 |
316 | _computeLabelArea(): void {
317 | return undefined;
318 | }
319 |
320 | /**
321 | * @hidden
322 | */
323 | draw(chartArea: ChartArea): void {
324 | return LegendScale.prototype.draw.call(this, chartArea);
325 | }
326 |
327 | protected _drawIndicator(): void {
328 | // hook
329 | }
330 | }
331 |
--------------------------------------------------------------------------------