 8 |
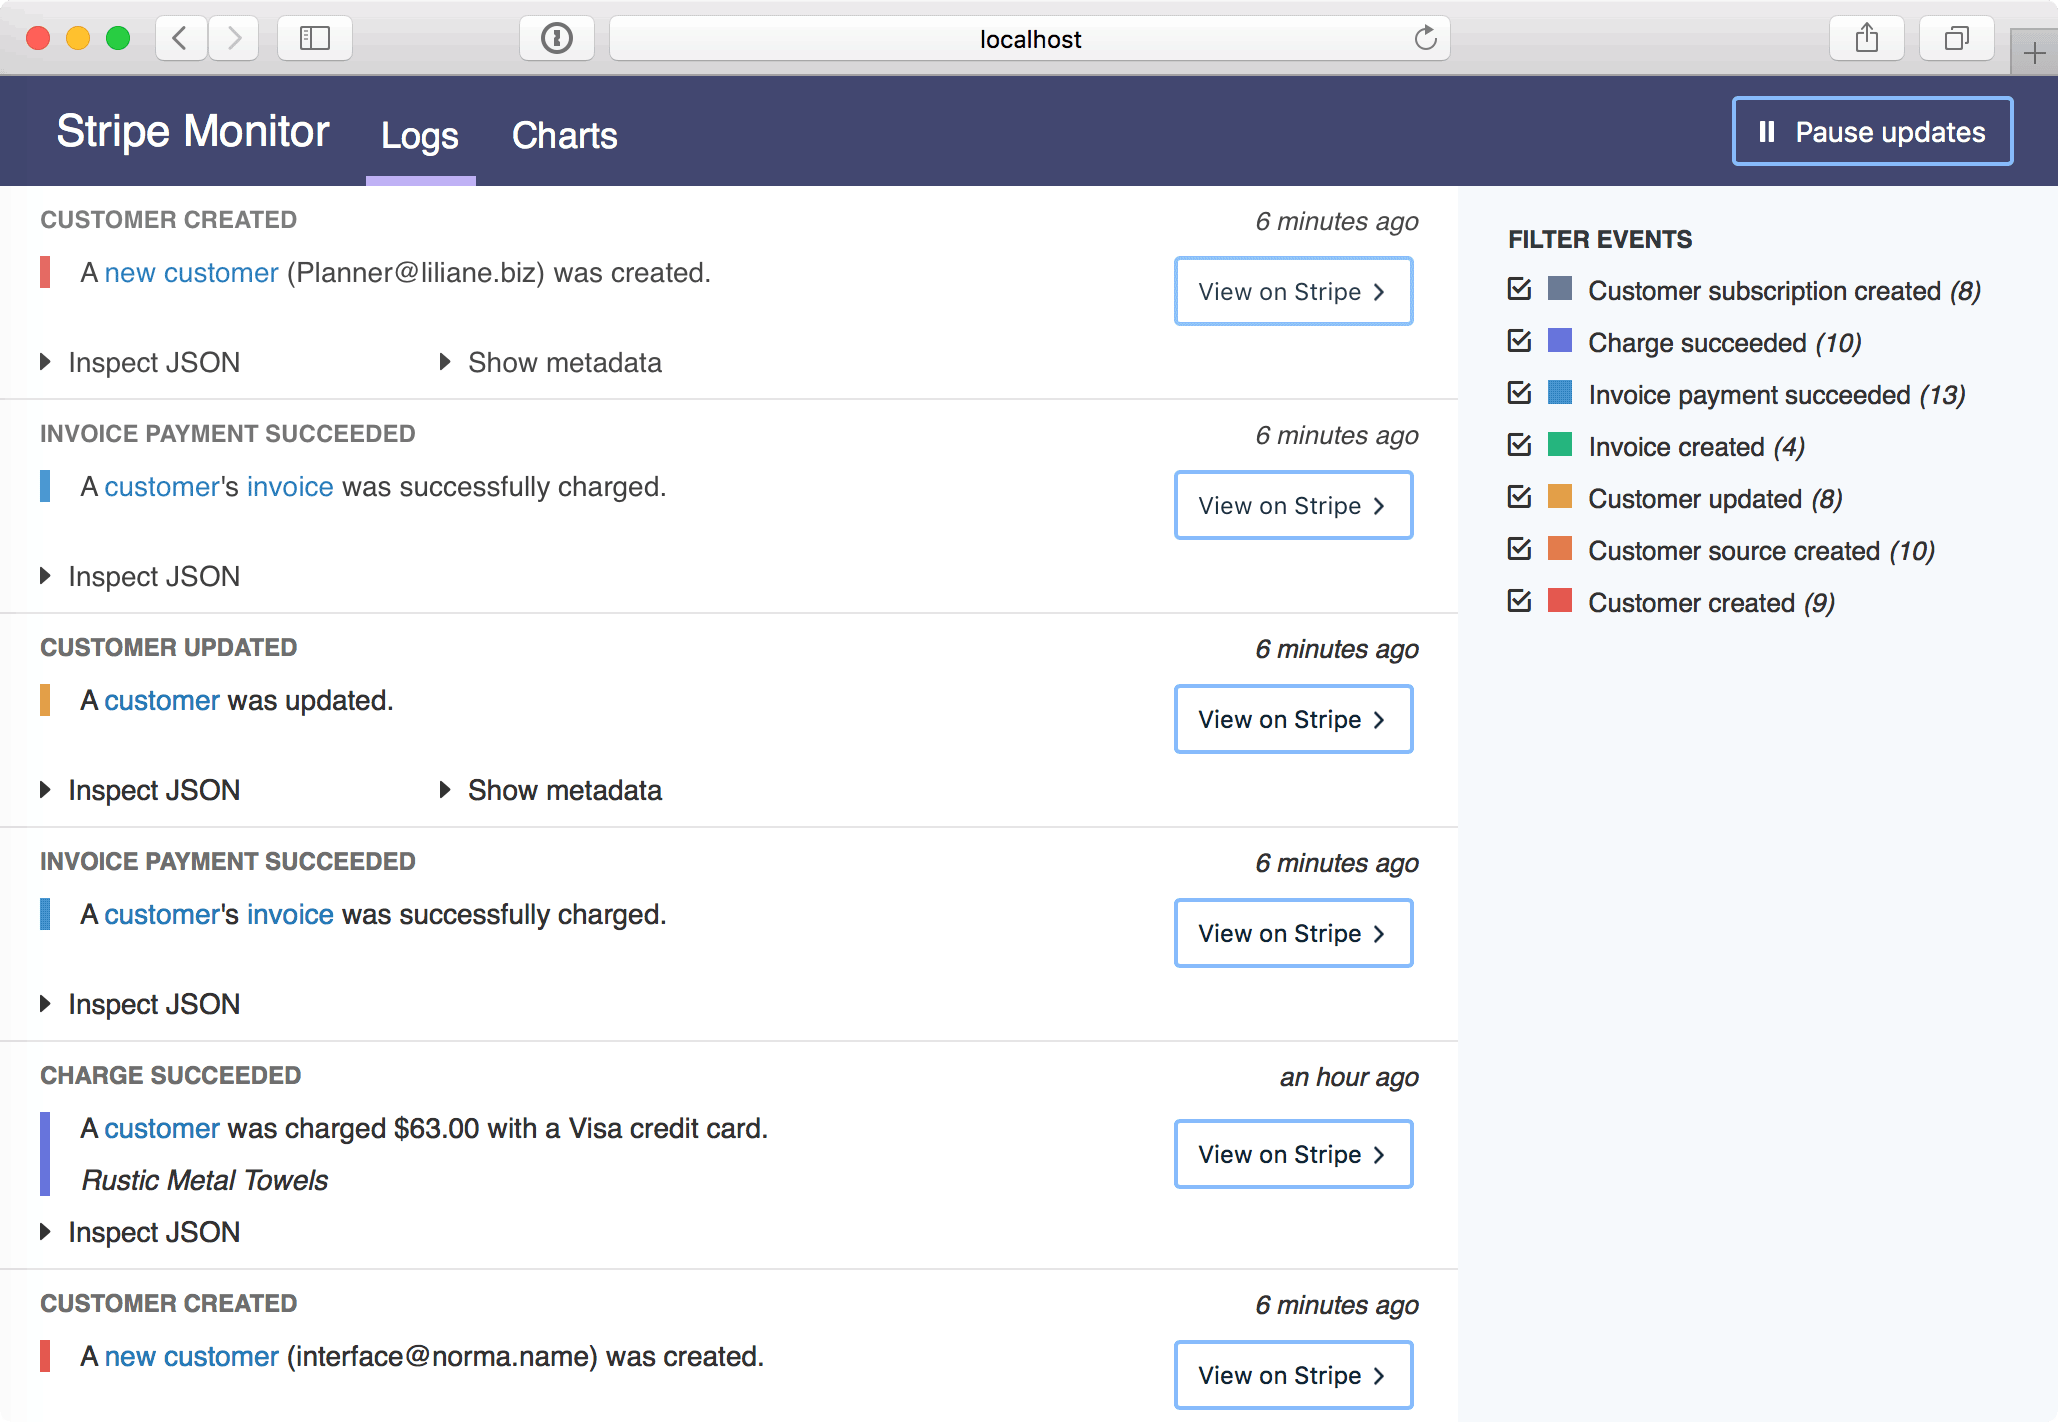
9 | Stripe's platform includes [webhooks](https://stripe.com/docs/webhooks) that will notify you when actions take place on your account. For example, you can be notified when:
10 |
11 | - New charges are created (`charge.created`)
12 | - Customers subscribe to a new plan (`customer.subscription.created`)
13 | - Payouts and transfers are completed (`payout.paid`)
14 | - An invoice payment failed (`invoice.payment_failed`)
15 |
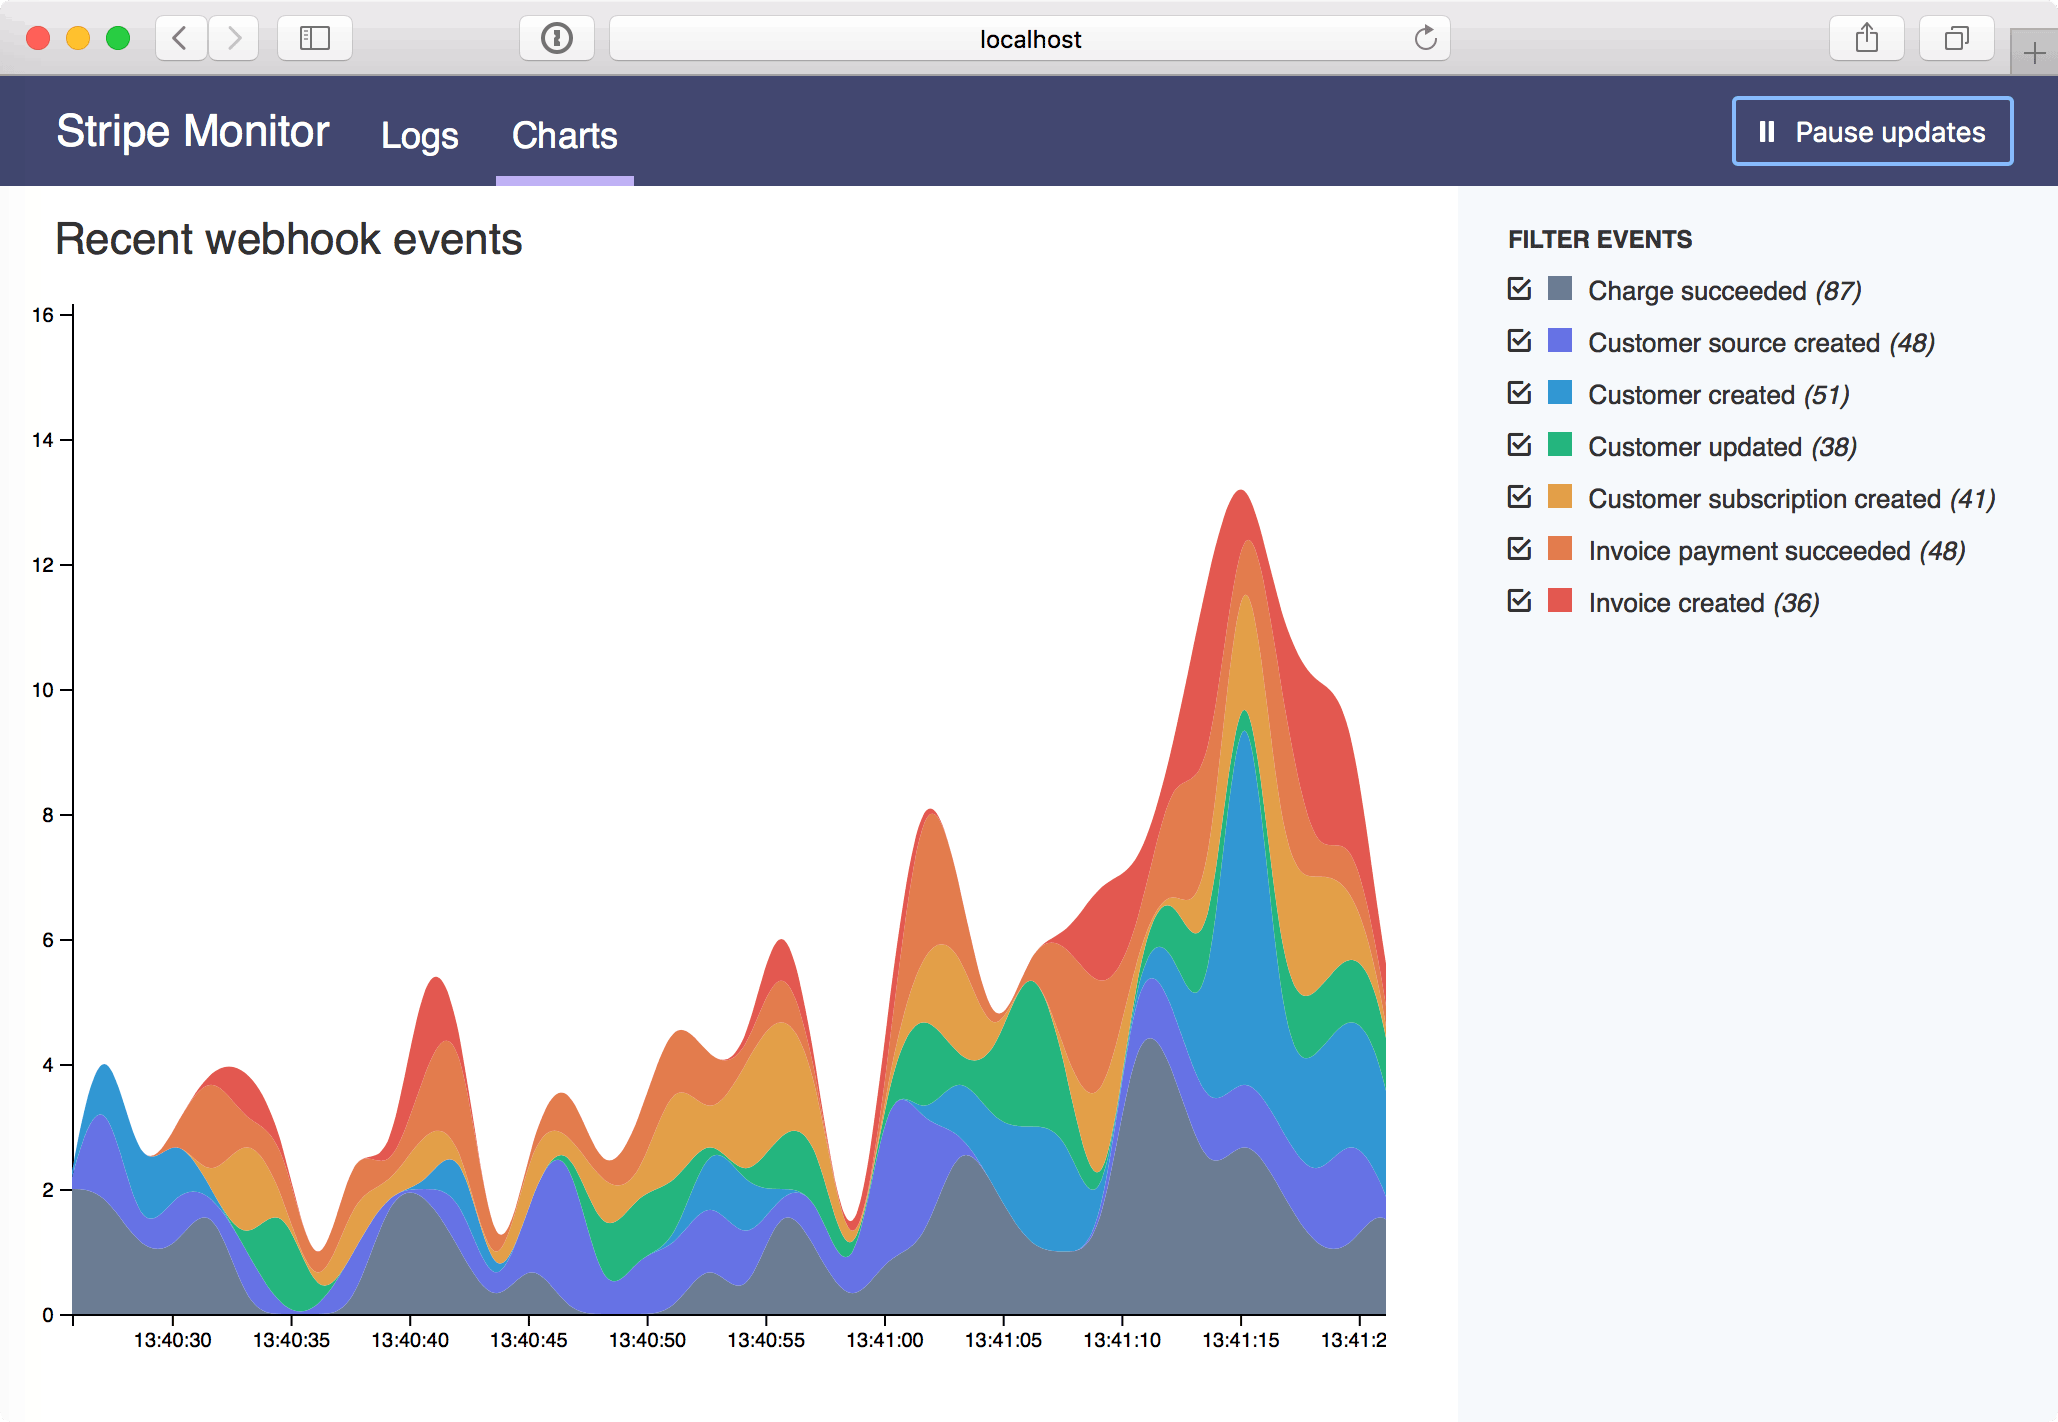
16 | Webhooks are powerful: you can subscribe to these notifications and programmatically react to them in real-time.
17 |
18 | ## Getting started
19 |
20 | ### Requirements
21 | You'll need to have Node v7.6+ installed, which includes support for `async` / `await`.
22 |
23 | ### Set up the monitor
24 | Clone the project repository, and create a configuration for your Stripe account:
25 |
26 | ```
27 | cp config.sample.js config.js
28 | ```
29 |
30 | You'll need to fill in your Stripe secret key.
31 |
32 | Webhooks require a public URL that Stripe will ping to notify the monitor of new events. Support for [ngrok](https://ngrok.com/) is included out of the box: ngrok will create a secure tunnel and provide a public URL to your local machine.
33 |
34 | If you have a [__Basic__](https://ngrok.com/pricing) ngrok subscription, you can specify a custom subdomain that will stay reserved for your account.
35 |
36 | ### Start receiving changes
37 |
38 | To start the monitor:
39 |
40 | ```
41 | npm install
42 | npm start
43 | ```
44 |
45 | Take note of the public URL provided by ngrok: it should be listed when the monitor starts.
46 |
47 | **Don't want to use ngrok?** As long as Stripe can reach the webhooks endpoint via a public URL, you'll receive updates.
48 |
49 | ### Subscribe to webhook notifications
50 |
51 | In your Stripe Dashboard, go to the _API_ section, then click on the _Webhooks_ tab.
52 |
53 | You should add a receiving endpoint by clicking _Add Endpoint_. Fill in the public URL provided by ngrok, or any other public URL that can reach the webhook monitor.
54 |
55 | 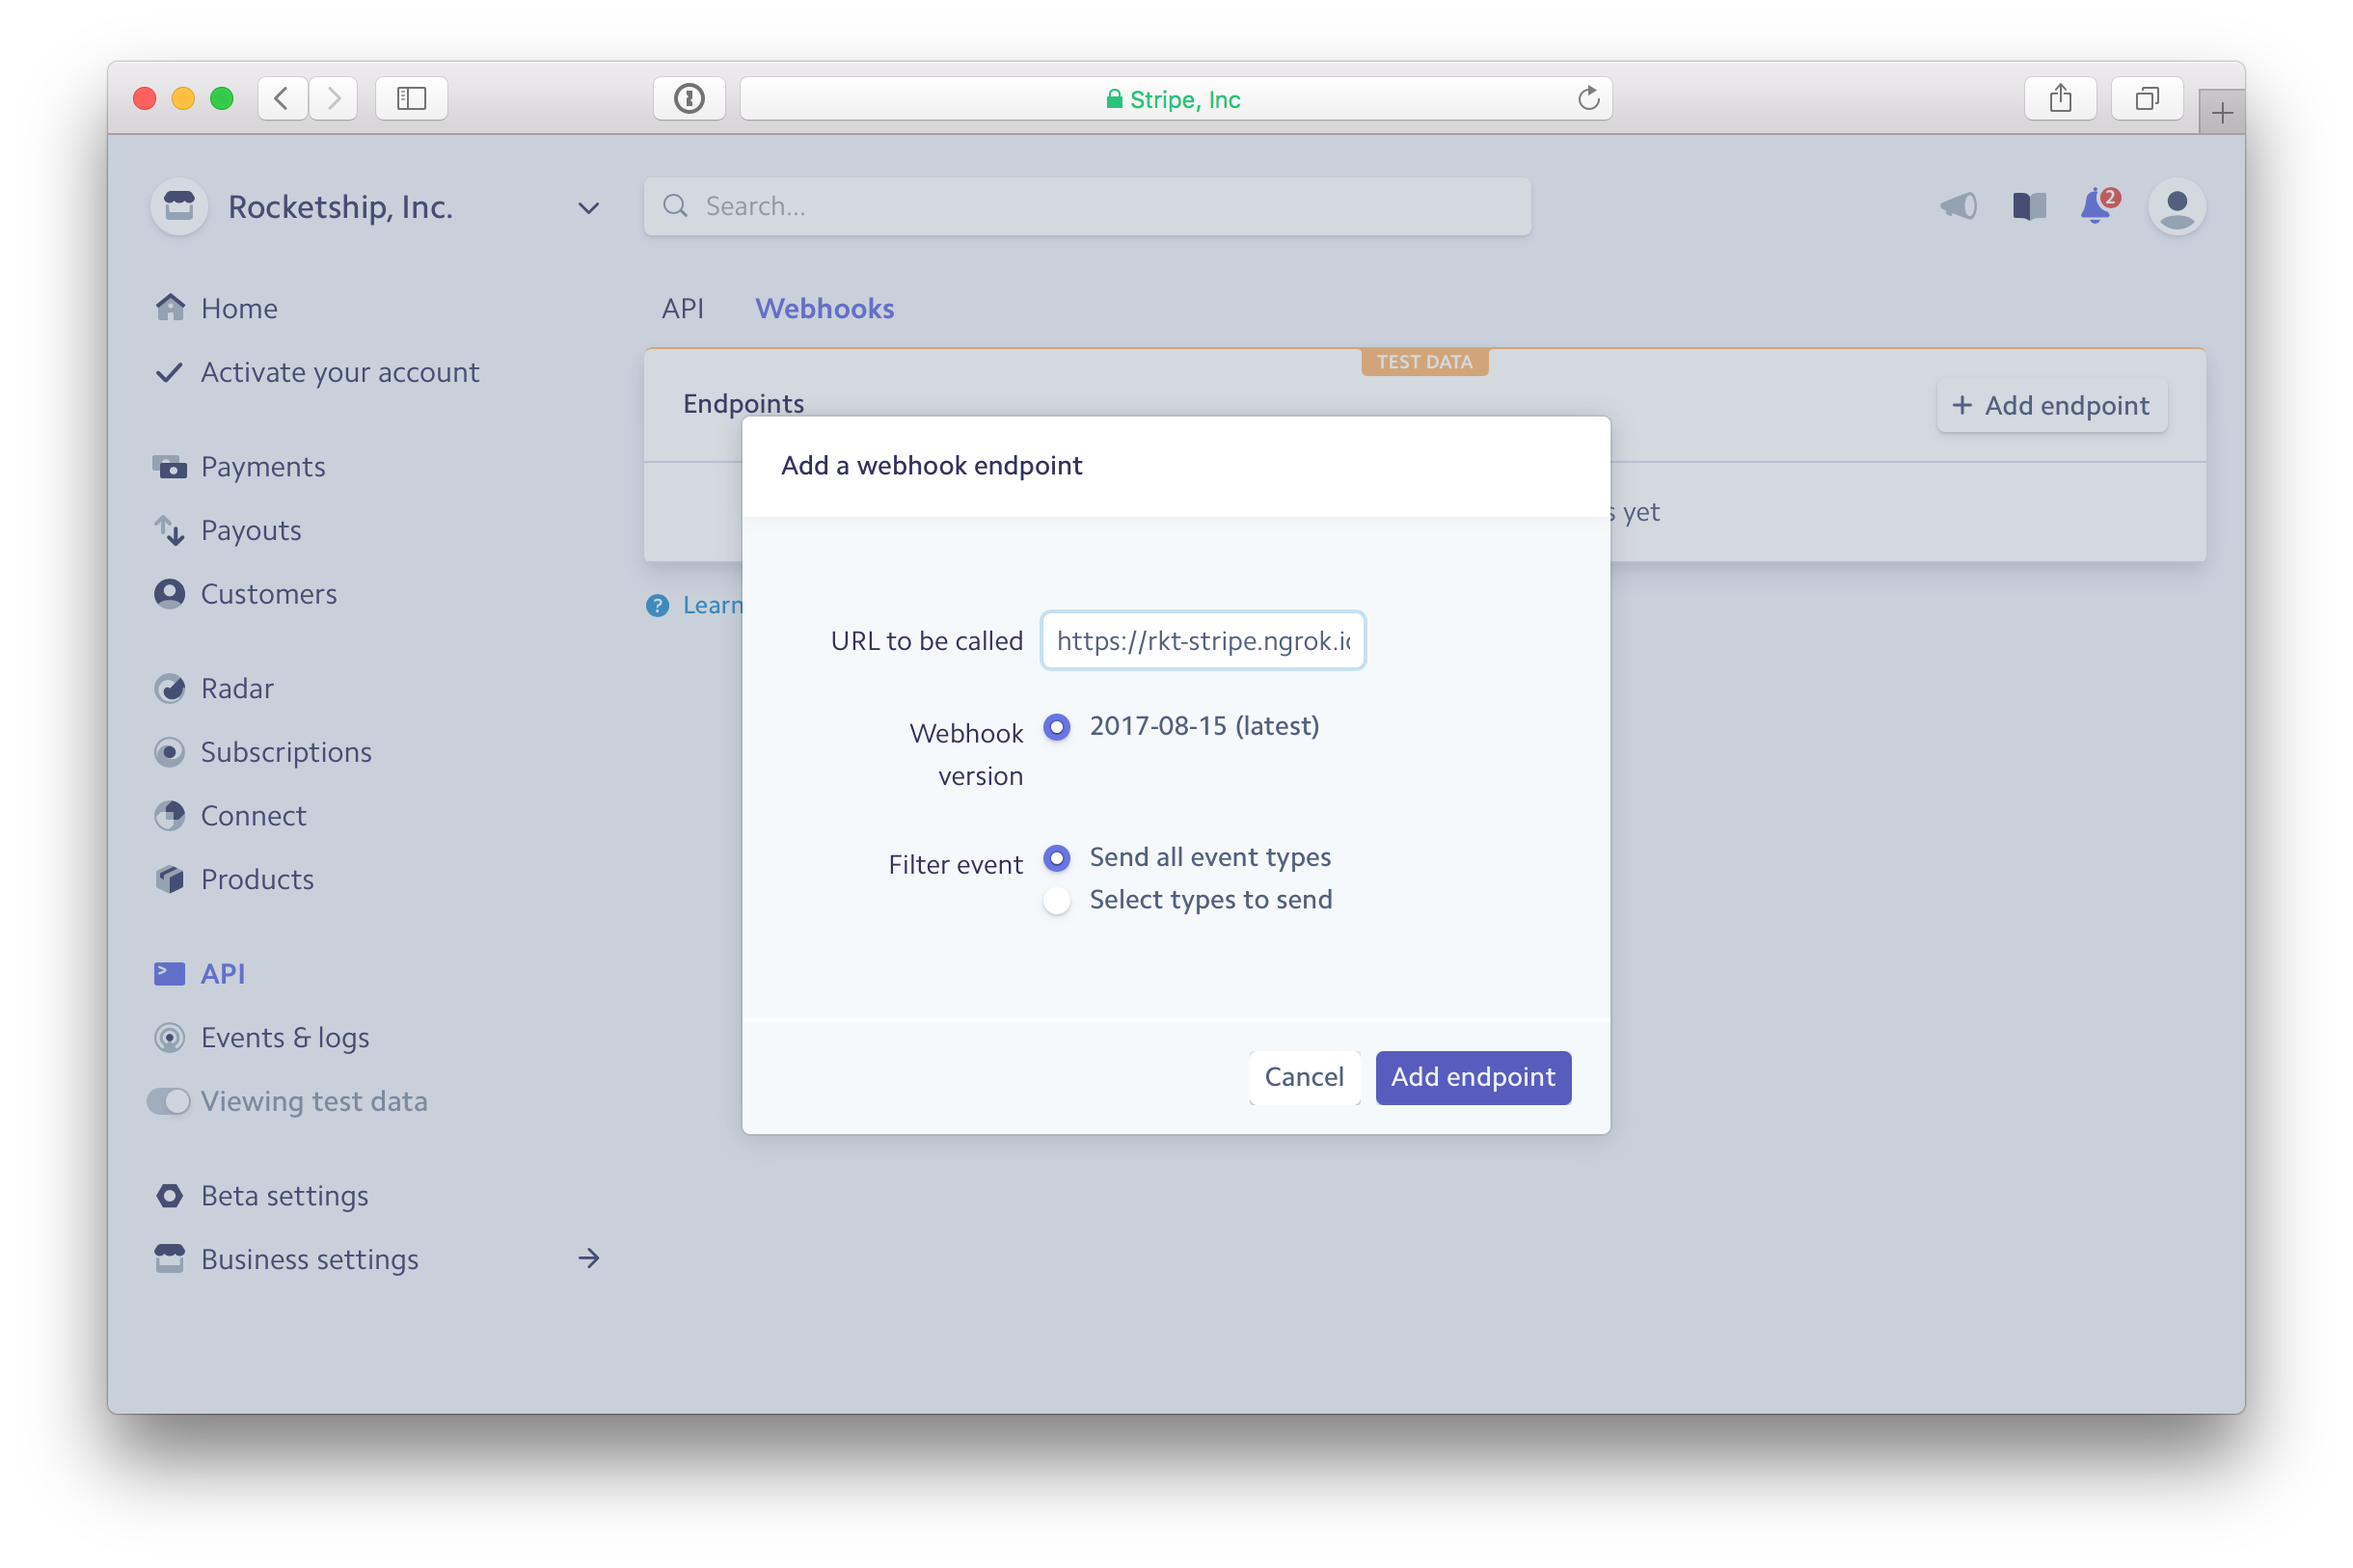
56 |
57 | ## Troubleshooting
58 |
59 | ### I'm not receiving real-time updates
60 |
61 | - Check that the [Stripe Dashboard](https://dashboard.stripe.com/webhooks/) is listing your webhook route as _Enabled_.
62 | - Make sure that the webhook endpoint matches the URL printed in your console.
63 |
64 | ## Credits
65 |
66 | - Code: [Michael Glukhovsky](https://twitter.com/mglukhovsky)
67 | - Icons: [Ionicons](http://ionicons.com/)
68 |
--------------------------------------------------------------------------------
/config.sample.js:
--------------------------------------------------------------------------------
1 | 'use strict';
2 |
3 | module.exports = {
4 | port: 4000,
5 | stripe: {
6 | // Include your Stripe secret key here
7 | secretKey: 'YOUR_STRIPE_SECRET_KEY'
8 | },
9 | /*
10 | Stripe needs a public URL for our server that it can ping with new events.
11 | If ngrok is enabled, this server will create a public endpoint for you.
12 | */
13 | ngrok: {
14 | enabled: true,
15 | /*
16 | Optional: if you have a Pro ngrok account you can provide a custom
17 | subdomain and your authentication token here.
18 | */
19 | subdomain: null,
20 | authtoken: null
21 | }
22 | }
23 |
--------------------------------------------------------------------------------
/package-lock.json:
--------------------------------------------------------------------------------
1 | {
2 | "name": "stripe-webhook-monitor",
3 | "version": "1.0.0",
4 | "lockfileVersion": 1,
5 | "requires": true,
6 | "dependencies": {
7 | "@types/node": {
8 | "version": "8.10.49",
9 | "resolved": "https://registry.npmjs.org/@types/node/-/node-8.10.49.tgz",
10 | "integrity": "sha512-YX30JVx0PvSmJ3Eqr74fYLGeBxD+C7vIL20ek+GGGLJeUbVYRUW3EzyAXpIRA0K8c8o0UWqR/GwEFYiFoz1T8w=="
11 | },
12 | "abbrev": {
13 | "version": "1.1.1",
14 | "resolved": "https://registry.npmjs.org/abbrev/-/abbrev-1.1.1.tgz",
15 | "integrity": "sha512-nne9/IiQ/hzIhY6pdDnbBtz7DjPTKrY00P/zvPSm5pOFkl6xuGrGnXn/VtTNNfNtAfZ9/1RtehkszU9qcTii0Q=="
16 | },
17 | "accepts": {
18 | "version": "1.3.7",
19 | "resolved": "https://registry.npmjs.org/accepts/-/accepts-1.3.7.tgz",
20 | "integrity": "sha512-Il80Qs2WjYlJIBNzNkK6KYqlVMTbZLXgHx2oT0pU/fjRHyEp+PEfEPY0R3WCwAGVOtauxh1hOxNgIf5bv7dQpA==",
21 | "requires": {
22 | "mime-types": "~2.1.24",
23 | "negotiator": "0.6.2"
24 | }
25 | },
26 | "after": {
27 | "version": "0.8.2",
28 | "resolved": "https://registry.npmjs.org/after/-/after-0.8.2.tgz",
29 | "integrity": "sha1-/ts5T58OAqqXaOcCvaI7UF+ufh8="
30 | },
31 | "ajv": {
32 | "version": "6.10.0",
33 | "resolved": "https://registry.npmjs.org/ajv/-/ajv-6.10.0.tgz",
34 | "integrity": "sha512-nffhOpkymDECQyR0mnsUtoCE8RlX38G0rYP+wgLWFyZuUyuuojSSvi/+euOiQBIn63whYwYVIIH1TvE3tu4OEg==",
35 | "requires": {
36 | "fast-deep-equal": "^2.0.1",
37 | "fast-json-stable-stringify": "^2.0.0",
38 | "json-schema-traverse": "^0.4.1",
39 | "uri-js": "^4.2.2"
40 | }
41 | },
42 | "ansi-align": {
43 | "version": "2.0.0",
44 | "resolved": "https://registry.npmjs.org/ansi-align/-/ansi-align-2.0.0.tgz",
45 | "integrity": "sha1-w2rsy6VjuJzrVW82kPCx2eNUf38=",
46 | "requires": {
47 | "string-width": "^2.0.0"
48 | }
49 | },
50 | "ansi-regex": {
51 | "version": "3.0.0",
52 | "resolved": "https://registry.npmjs.org/ansi-regex/-/ansi-regex-3.0.0.tgz",
53 | "integrity": "sha1-7QMXwyIGT3lGbAKWa922Bas32Zg="
54 | },
55 | "ansi-styles": {
56 | "version": "3.2.0",
57 | "resolved": "https://registry.npmjs.org/ansi-styles/-/ansi-styles-3.2.0.tgz",
58 | "integrity": "sha512-NnSOmMEYtVR2JVMIGTzynRkkaxtiq1xnFBcdQD/DnNCYPoEPsVJhM98BDyaoNOQIi7p4okdi3E27eN7GQbsUug==",
59 | "requires": {
60 | "color-convert": "^1.9.0"
61 | }
62 | },
63 | "app-root-path": {
64 | "version": "2.0.1",
65 | "resolved": "https://registry.npmjs.org/app-root-path/-/app-root-path-2.0.1.tgz",
66 | "integrity": "sha1-zWLc+OT9WkF+/GZNLlsQZTxlG0Y=",
67 | "dev": true
68 | },
69 | "argparse": {
70 | "version": "1.0.9",
71 | "resolved": "https://registry.npmjs.org/argparse/-/argparse-1.0.9.tgz",
72 | "integrity": "sha1-c9g7wmP4bpf4zE9rrhsOkKfSLIY=",
73 | "dev": true,
74 | "requires": {
75 | "sprintf-js": "~1.0.2"
76 | }
77 | },
78 | "arraybuffer.slice": {
79 | "version": "0.0.7",
80 | "resolved": "https://registry.npmjs.org/arraybuffer.slice/-/arraybuffer.slice-0.0.7.tgz",
81 | "integrity": "sha512-wGUIVQXuehL5TCqQun8OW81jGzAWycqzFF8lFp+GOM5BXLYj3bKNsYC4daB7n6XjCqxQA/qgTJ+8ANR3acjrog=="
82 | },
83 | "asn1": {
84 | "version": "0.2.4",
85 | "resolved": "https://registry.npmjs.org/asn1/-/asn1-0.2.4.tgz",
86 | "integrity": "sha512-jxwzQpLQjSmWXgwaCZE9Nz+glAG01yF1QnWgbhGwHI5A6FRIEY6IVqtHhIepHqI7/kyEyQEagBC5mBEFlIYvdg==",
87 | "requires": {
88 | "safer-buffer": "~2.1.0"
89 | }
90 | },
91 | "assert-plus": {
92 | "version": "1.0.0",
93 | "resolved": "https://registry.npmjs.org/assert-plus/-/assert-plus-1.0.0.tgz",
94 | "integrity": "sha1-8S4PPF13sLHN2RRpQuTpbB5N1SU="
95 | },
96 | "async-limiter": {
97 | "version": "1.0.0",
98 | "resolved": "https://registry.npmjs.org/async-limiter/-/async-limiter-1.0.0.tgz",
99 | "integrity": "sha512-jp/uFnooOiO+L211eZOoSyzpOITMXx1rBITauYykG3BRYPu8h0UcxsPNB04RR5vo4Tyz3+ay17tR6JVf9qzYWg=="
100 | },
101 | "asynckit": {
102 | "version": "0.4.0",
103 | "resolved": "https://registry.npmjs.org/asynckit/-/asynckit-0.4.0.tgz",
104 | "integrity": "sha1-x57Zf380y48robyXkLzDZkdLS3k="
105 | },
106 | "aws-sign2": {
107 | "version": "0.7.0",
108 | "resolved": "https://registry.npmjs.org/aws-sign2/-/aws-sign2-0.7.0.tgz",
109 | "integrity": "sha1-tG6JCTSpWR8tL2+G1+ap8bP+dqg="
110 | },
111 | "aws4": {
112 | "version": "1.8.0",
113 | "resolved": "https://registry.npmjs.org/aws4/-/aws4-1.8.0.tgz",
114 | "integrity": "sha512-ReZxvNHIOv88FlT7rxcXIIC0fPt4KZqZbOlivyWtXLt8ESx84zd3kMC6iK5jVeS2qt+g7ftS7ye4fi06X5rtRQ=="
115 | },
116 | "backo2": {
117 | "version": "1.0.2",
118 | "resolved": "https://registry.npmjs.org/backo2/-/backo2-1.0.2.tgz",
119 | "integrity": "sha1-MasayLEpNjRj41s+u2n038+6eUc="
120 | },
121 | "balanced-match": {
122 | "version": "1.0.0",
123 | "resolved": "https://registry.npmjs.org/balanced-match/-/balanced-match-1.0.0.tgz",
124 | "integrity": "sha1-ibTRmasr7kneFk6gK4nORi1xt2c=",
125 | "dev": true
126 | },
127 | "base64-arraybuffer": {
128 | "version": "0.1.5",
129 | "resolved": "https://registry.npmjs.org/base64-arraybuffer/-/base64-arraybuffer-0.1.5.tgz",
130 | "integrity": "sha1-c5JncZI7Whl0etZmqlzUv5xunOg="
131 | },
132 | "base64id": {
133 | "version": "1.0.0",
134 | "resolved": "https://registry.npmjs.org/base64id/-/base64id-1.0.0.tgz",
135 | "integrity": "sha1-R2iMuZu2gE8OBtPnY7HDLlfY5rY="
136 | },
137 | "bcrypt-pbkdf": {
138 | "version": "1.0.2",
139 | "resolved": "https://registry.npmjs.org/bcrypt-pbkdf/-/bcrypt-pbkdf-1.0.2.tgz",
140 | "integrity": "sha1-pDAdOJtqQ/m2f/PKEaP2Y342Dp4=",
141 | "requires": {
142 | "tweetnacl": "^0.14.3"
143 | }
144 | },
145 | "better-assert": {
146 | "version": "1.0.2",
147 | "resolved": "https://registry.npmjs.org/better-assert/-/better-assert-1.0.2.tgz",
148 | "integrity": "sha1-QIZrnhueC1W0gYlDEeaPr/rrxSI=",
149 | "requires": {
150 | "callsite": "1.0.0"
151 | }
152 | },
153 | "binary": {
154 | "version": "0.3.0",
155 | "resolved": "https://registry.npmjs.org/binary/-/binary-0.3.0.tgz",
156 | "integrity": "sha1-n2BVO8XOjDOG87VTz/R0Yq3sqnk=",
157 | "requires": {
158 | "buffers": "~0.1.1",
159 | "chainsaw": "~0.1.0"
160 | }
161 | },
162 | "blob": {
163 | "version": "0.0.5",
164 | "resolved": "https://registry.npmjs.org/blob/-/blob-0.0.5.tgz",
165 | "integrity": "sha512-gaqbzQPqOoamawKg0LGVd7SzLgXS+JH61oWprSLH+P+abTczqJbhTR8CmJ2u9/bUYNmHTGJx/UEmn6doAvvuig=="
166 | },
167 | "body-parser": {
168 | "version": "1.18.2",
169 | "resolved": "https://registry.npmjs.org/body-parser/-/body-parser-1.18.2.tgz",
170 | "integrity": "sha1-h2eKGdhLR9hZuDGZvVm84iKxBFQ=",
171 | "requires": {
172 | "bytes": "3.0.0",
173 | "content-type": "~1.0.4",
174 | "debug": "2.6.9",
175 | "depd": "~1.1.1",
176 | "http-errors": "~1.6.2",
177 | "iconv-lite": "0.4.19",
178 | "on-finished": "~2.3.0",
179 | "qs": "6.5.1",
180 | "raw-body": "2.3.2",
181 | "type-is": "~1.6.15"
182 | },
183 | "dependencies": {
184 | "bytes": {
185 | "version": "3.0.0",
186 | "resolved": "https://registry.npmjs.org/bytes/-/bytes-3.0.0.tgz",
187 | "integrity": "sha1-0ygVQE1olpn4Wk6k+odV3ROpYEg="
188 | },
189 | "content-type": {
190 | "version": "1.0.4",
191 | "resolved": "https://registry.npmjs.org/content-type/-/content-type-1.0.4.tgz",
192 | "integrity": "sha512-hIP3EEPs8tB9AT1L+NUqtwOAps4mk2Zob89MWXMHjHWg9milF/j4osnnQLXBCBFBk/tvIG/tUc9mOUJiPBhPXA=="
193 | },
194 | "debug": {
195 | "version": "2.6.9",
196 | "resolved": "https://registry.npmjs.org/debug/-/debug-2.6.9.tgz",
197 | "integrity": "sha512-bC7ElrdJaJnPbAP+1EotYvqZsb3ecl5wi6Bfi6BJTUcNowp6cvspg0jXznRTKDjm/E7AdgFBVeAPVMNcKGsHMA==",
198 | "requires": {
199 | "ms": "2.0.0"
200 | }
201 | },
202 | "depd": {
203 | "version": "1.1.1",
204 | "resolved": "https://registry.npmjs.org/depd/-/depd-1.1.1.tgz",
205 | "integrity": "sha1-V4O04cRZ8G+lyif5kfPQbnoxA1k="
206 | },
207 | "ee-first": {
208 | "version": "1.1.1",
209 | "resolved": "https://registry.npmjs.org/ee-first/-/ee-first-1.1.1.tgz",
210 | "integrity": "sha1-WQxhFWsK4vTwJVcyoViyZrxWsh0="
211 | },
212 | "http-errors": {
213 | "version": "1.6.2",
214 | "resolved": "https://registry.npmjs.org/http-errors/-/http-errors-1.6.2.tgz",
215 | "integrity": "sha1-CgAsyFcHGSp+eUbO7cERVfYOxzY=",
216 | "requires": {
217 | "depd": "1.1.1",
218 | "inherits": "2.0.3",
219 | "setprototypeof": "1.0.3",
220 | "statuses": ">= 1.3.1 < 2"
221 | }
222 | },
223 | "iconv-lite": {
224 | "version": "0.4.19",
225 | "resolved": "https://registry.npmjs.org/iconv-lite/-/iconv-lite-0.4.19.tgz",
226 | "integrity": "sha512-oTZqweIP51xaGPI4uPa56/Pri/480R+mo7SeU+YETByQNhDG55ycFyNLIgta9vXhILrxXDmF7ZGhqZIcuN0gJQ=="
227 | },
228 | "inherits": {
229 | "version": "2.0.3",
230 | "resolved": "https://registry.npmjs.org/inherits/-/inherits-2.0.3.tgz",
231 | "integrity": "sha1-Yzwsg+PaQqUC9SRmAiSA9CCCYd4="
232 | },
233 | "media-typer": {
234 | "version": "0.3.0",
235 | "resolved": "https://registry.npmjs.org/media-typer/-/media-typer-0.3.0.tgz",
236 | "integrity": "sha1-hxDXrwqmJvj/+hzgAWhUUmMlV0g="
237 | },
238 | "mime-db": {
239 | "version": "1.30.0",
240 | "resolved": "https://registry.npmjs.org/mime-db/-/mime-db-1.30.0.tgz",
241 | "integrity": "sha1-dMZD2i3Z1qRTmZY0ZbJtXKfXHwE="
242 | },
243 | "mime-types": {
244 | "version": "2.1.17",
245 | "resolved": "https://registry.npmjs.org/mime-types/-/mime-types-2.1.17.tgz",
246 | "integrity": "sha1-Cdejk/A+mVp5+K+Fe3Cp4KsWVXo=",
247 | "requires": {
248 | "mime-db": "~1.30.0"
249 | }
250 | },
251 | "ms": {
252 | "version": "2.0.0",
253 | "resolved": "https://registry.npmjs.org/ms/-/ms-2.0.0.tgz",
254 | "integrity": "sha1-VgiurfwAvmwpAd9fmGF4jeDVl8g="
255 | },
256 | "on-finished": {
257 | "version": "2.3.0",
258 | "resolved": "https://registry.npmjs.org/on-finished/-/on-finished-2.3.0.tgz",
259 | "integrity": "sha1-IPEzZIGwg811M3mSoWlxqi2QaUc=",
260 | "requires": {
261 | "ee-first": "1.1.1"
262 | }
263 | },
264 | "qs": {
265 | "version": "6.5.1",
266 | "resolved": "https://registry.npmjs.org/qs/-/qs-6.5.1.tgz",
267 | "integrity": "sha512-eRzhrN1WSINYCDCbrz796z37LOe3m5tmW7RQf6oBntukAG1nmovJvhnwHHRMAfeoItc1m2Hk02WER2aQ/iqs+A=="
268 | },
269 | "raw-body": {
270 | "version": "2.3.2",
271 | "resolved": "https://registry.npmjs.org/raw-body/-/raw-body-2.3.2.tgz",
272 | "integrity": "sha1-vNYMd9Prk83gBQKVw/N5OJvIj4k=",
273 | "requires": {
274 | "bytes": "3.0.0",
275 | "http-errors": "1.6.2",
276 | "iconv-lite": "0.4.19",
277 | "unpipe": "1.0.0"
278 | }
279 | },
280 | "setprototypeof": {
281 | "version": "1.0.3",
282 | "resolved": "https://registry.npmjs.org/setprototypeof/-/setprototypeof-1.0.3.tgz",
283 | "integrity": "sha1-ZlZ+NwQ+608E2RvWWMDL77VbjgQ="
284 | },
285 | "statuses": {
286 | "version": "1.3.1",
287 | "resolved": "https://registry.npmjs.org/statuses/-/statuses-1.3.1.tgz",
288 | "integrity": "sha1-+vUbnrdKrvOzrPStX2Gr8ky3uT4="
289 | },
290 | "type-is": {
291 | "version": "1.6.15",
292 | "resolved": "https://registry.npmjs.org/type-is/-/type-is-1.6.15.tgz",
293 | "integrity": "sha1-yrEPtJCeRByChC6v4a1kbIGARBA=",
294 | "requires": {
295 | "media-typer": "0.3.0",
296 | "mime-types": "~2.1.15"
297 | }
298 | },
299 | "unpipe": {
300 | "version": "1.0.0",
301 | "resolved": "https://registry.npmjs.org/unpipe/-/unpipe-1.0.0.tgz",
302 | "integrity": "sha1-sr9O6FFKrmFltIF4KdIbLvSZBOw="
303 | }
304 | }
305 | },
306 | "boxen": {
307 | "version": "1.2.1",
308 | "resolved": "https://registry.npmjs.org/boxen/-/boxen-1.2.1.tgz",
309 | "integrity": "sha1-DxHn/jRO25OXl3/BPt5/ZNlWSB0=",
310 | "requires": {
311 | "ansi-align": "^2.0.0",
312 | "camelcase": "^4.0.0",
313 | "chalk": "^2.0.1",
314 | "cli-boxes": "^1.0.0",
315 | "string-width": "^2.0.0",
316 | "term-size": "^1.2.0",
317 | "widest-line": "^1.0.0"
318 | }
319 | },
320 | "brace-expansion": {
321 | "version": "1.1.8",
322 | "resolved": "https://registry.npmjs.org/brace-expansion/-/brace-expansion-1.1.8.tgz",
323 | "integrity": "sha1-wHshHHyVLsH479Uad+8NHTmQopI=",
324 | "dev": true,
325 | "requires": {
326 | "balanced-match": "^1.0.0",
327 | "concat-map": "0.0.1"
328 | }
329 | },
330 | "buffers": {
331 | "version": "0.1.1",
332 | "resolved": "https://registry.npmjs.org/buffers/-/buffers-0.1.1.tgz",
333 | "integrity": "sha1-skV5w77U1tOWru5tmorn9Ugqt7s="
334 | },
335 | "callsite": {
336 | "version": "1.0.0",
337 | "resolved": "https://registry.npmjs.org/callsite/-/callsite-1.0.0.tgz",
338 | "integrity": "sha1-KAOY5dZkvXQDi28JBRU+borxvCA="
339 | },
340 | "camelcase": {
341 | "version": "4.1.0",
342 | "resolved": "https://registry.npmjs.org/camelcase/-/camelcase-4.1.0.tgz",
343 | "integrity": "sha1-1UVjW+HjPFQmScaRc+Xeas+uNN0="
344 | },
345 | "caseless": {
346 | "version": "0.12.0",
347 | "resolved": "https://registry.npmjs.org/caseless/-/caseless-0.12.0.tgz",
348 | "integrity": "sha1-G2gcIf+EAzyCZUMJBolCDRhxUdw="
349 | },
350 | "chainsaw": {
351 | "version": "0.1.0",
352 | "resolved": "https://registry.npmjs.org/chainsaw/-/chainsaw-0.1.0.tgz",
353 | "integrity": "sha1-XqtQsor+WAdNDVgpE4iCi15fvJg=",
354 | "requires": {
355 | "traverse": ">=0.3.0 <0.4"
356 | }
357 | },
358 | "chalk": {
359 | "version": "2.1.0",
360 | "resolved": "https://registry.npmjs.org/chalk/-/chalk-2.1.0.tgz",
361 | "integrity": "sha512-LUHGS/dge4ujbXMJrnihYMcL4AoOweGnw9Tp3kQuqy1Kx5c1qKjqvMJZ6nVJPMWJtKCTN72ZogH3oeSO9g9rXQ==",
362 | "requires": {
363 | "ansi-styles": "^3.1.0",
364 | "escape-string-regexp": "^1.0.5",
365 | "supports-color": "^4.0.0"
366 | }
367 | },
368 | "ci-info": {
369 | "version": "1.1.1",
370 | "resolved": "https://registry.npmjs.org/ci-info/-/ci-info-1.1.1.tgz",
371 | "integrity": "sha512-vHDDF/bP9RYpTWtUhpJRhCFdvvp3iDWvEbuDbWgvjUrNGV1MXJrE0MPcwGtEled04m61iwdBLUIHZtDgzWS4ZQ==",
372 | "dev": true
373 | },
374 | "cli-boxes": {
375 | "version": "1.0.0",
376 | "resolved": "https://registry.npmjs.org/cli-boxes/-/cli-boxes-1.0.0.tgz",
377 | "integrity": "sha1-T6kXw+WclKAEzWH47lCdplFocUM="
378 | },
379 | "cli-cursor": {
380 | "version": "1.0.2",
381 | "resolved": "https://registry.npmjs.org/cli-cursor/-/cli-cursor-1.0.2.tgz",
382 | "integrity": "sha1-ZNo/fValRBLll5S9Ytw1KV6PKYc=",
383 | "dev": true,
384 | "requires": {
385 | "restore-cursor": "^1.0.1"
386 | }
387 | },
388 | "cli-spinners": {
389 | "version": "0.1.2",
390 | "resolved": "https://registry.npmjs.org/cli-spinners/-/cli-spinners-0.1.2.tgz",
391 | "integrity": "sha1-u3ZNiOGF+54eaiofGXcjGPYF4xw=",
392 | "dev": true
393 | },
394 | "cli-truncate": {
395 | "version": "0.2.1",
396 | "resolved": "https://registry.npmjs.org/cli-truncate/-/cli-truncate-0.2.1.tgz",
397 | "integrity": "sha1-nxXPuwcFAFNpIWxiasfQWrkN1XQ=",
398 | "dev": true,
399 | "requires": {
400 | "slice-ansi": "0.0.4",
401 | "string-width": "^1.0.1"
402 | },
403 | "dependencies": {
404 | "ansi-regex": {
405 | "version": "2.1.1",
406 | "resolved": "https://registry.npmjs.org/ansi-regex/-/ansi-regex-2.1.1.tgz",
407 | "integrity": "sha1-w7M6te42DYbg5ijwRorn7yfWVN8=",
408 | "dev": true
409 | },
410 | "is-fullwidth-code-point": {
411 | "version": "1.0.0",
412 | "resolved": "https://registry.npmjs.org/is-fullwidth-code-point/-/is-fullwidth-code-point-1.0.0.tgz",
413 | "integrity": "sha1-754xOG8DGn8NZDr4L95QxFfvAMs=",
414 | "dev": true,
415 | "requires": {
416 | "number-is-nan": "^1.0.0"
417 | }
418 | },
419 | "string-width": {
420 | "version": "1.0.2",
421 | "resolved": "https://registry.npmjs.org/string-width/-/string-width-1.0.2.tgz",
422 | "integrity": "sha1-EYvfW4zcUaKn5w0hHgfisLmxB9M=",
423 | "dev": true,
424 | "requires": {
425 | "code-point-at": "^1.0.0",
426 | "is-fullwidth-code-point": "^1.0.0",
427 | "strip-ansi": "^3.0.0"
428 | }
429 | },
430 | "strip-ansi": {
431 | "version": "3.0.1",
432 | "resolved": "https://registry.npmjs.org/strip-ansi/-/strip-ansi-3.0.1.tgz",
433 | "integrity": "sha1-ajhfuIU9lS1f8F0Oiq+UJ43GPc8=",
434 | "dev": true,
435 | "requires": {
436 | "ansi-regex": "^2.0.0"
437 | }
438 | }
439 | }
440 | },
441 | "code-point-at": {
442 | "version": "1.1.0",
443 | "resolved": "https://registry.npmjs.org/code-point-at/-/code-point-at-1.1.0.tgz",
444 | "integrity": "sha1-DQcLTQQ6W+ozovGkDi7bPZpMz3c="
445 | },
446 | "color-convert": {
447 | "version": "1.9.0",
448 | "resolved": "https://registry.npmjs.org/color-convert/-/color-convert-1.9.0.tgz",
449 | "integrity": "sha1-Gsz5fdc5uYO/mU1W/sj5WFNkG3o=",
450 | "requires": {
451 | "color-name": "^1.1.1"
452 | }
453 | },
454 | "color-name": {
455 | "version": "1.1.3",
456 | "resolved": "https://registry.npmjs.org/color-name/-/color-name-1.1.3.tgz",
457 | "integrity": "sha1-p9BVi9icQveV3UIyj3QIMcpTvCU="
458 | },
459 | "combined-stream": {
460 | "version": "1.0.8",
461 | "resolved": "https://registry.npmjs.org/combined-stream/-/combined-stream-1.0.8.tgz",
462 | "integrity": "sha512-FQN4MRfuJeHf7cBbBMJFXhKSDq+2kAArBlmRBvcvFE5BB1HZKXtSFASDhdlz9zOYwxh8lDdnvmMOe/+5cdoEdg==",
463 | "requires": {
464 | "delayed-stream": "~1.0.0"
465 | }
466 | },
467 | "commander": {
468 | "version": "2.11.0",
469 | "resolved": "https://registry.npmjs.org/commander/-/commander-2.11.0.tgz",
470 | "integrity": "sha512-b0553uYA5YAEGgyYIGYROzKQ7X5RAqedkfjiZxwi0kL1g3bOaBNNZfYkzt/CL0umgD5wc9Jec2FbB98CjkMRvQ==",
471 | "dev": true
472 | },
473 | "component-bind": {
474 | "version": "1.0.0",
475 | "resolved": "https://registry.npmjs.org/component-bind/-/component-bind-1.0.0.tgz",
476 | "integrity": "sha1-AMYIq33Nk4l8AAllGx06jh5zu9E="
477 | },
478 | "component-emitter": {
479 | "version": "1.2.1",
480 | "resolved": "https://registry.npmjs.org/component-emitter/-/component-emitter-1.2.1.tgz",
481 | "integrity": "sha1-E3kY1teCg/ffemt8WmPhQOaUJeY="
482 | },
483 | "component-inherit": {
484 | "version": "0.0.3",
485 | "resolved": "https://registry.npmjs.org/component-inherit/-/component-inherit-0.0.3.tgz",
486 | "integrity": "sha1-ZF/ErfWLcrZJ1crmUTVhnbJv8UM="
487 | },
488 | "concat-map": {
489 | "version": "0.0.1",
490 | "resolved": "https://registry.npmjs.org/concat-map/-/concat-map-0.0.1.tgz",
491 | "integrity": "sha1-2Klr13/Wjfd5OnMDajug1UBdR3s=",
492 | "dev": true
493 | },
494 | "cookie": {
495 | "version": "0.3.1",
496 | "resolved": "https://registry.npmjs.org/cookie/-/cookie-0.3.1.tgz",
497 | "integrity": "sha1-5+Ch+e9DtMi6klxcWpboBtFoc7s="
498 | },
499 | "core-util-is": {
500 | "version": "1.0.2",
501 | "resolved": "https://registry.npmjs.org/core-util-is/-/core-util-is-1.0.2.tgz",
502 | "integrity": "sha1-tf1UIgqivFq1eqtxQMlAdUUDwac="
503 | },
504 | "cosmiconfig": {
505 | "version": "1.1.0",
506 | "resolved": "https://registry.npmjs.org/cosmiconfig/-/cosmiconfig-1.1.0.tgz",
507 | "integrity": "sha1-DeoPmATv37kp+7GxiOJVU+oFPTc=",
508 | "dev": true,
509 | "requires": {
510 | "graceful-fs": "^4.1.2",
511 | "js-yaml": "^3.4.3",
512 | "minimist": "^1.2.0",
513 | "object-assign": "^4.0.1",
514 | "os-homedir": "^1.0.1",
515 | "parse-json": "^2.2.0",
516 | "pinkie-promise": "^2.0.0",
517 | "require-from-string": "^1.1.0"
518 | },
519 | "dependencies": {
520 | "minimist": {
521 | "version": "1.2.0",
522 | "resolved": "https://registry.npmjs.org/minimist/-/minimist-1.2.0.tgz",
523 | "integrity": "sha1-o1AIsg9BOD7sH7kU9M1d95omQoQ=",
524 | "dev": true
525 | }
526 | }
527 | },
528 | "cross-spawn": {
529 | "version": "5.1.0",
530 | "resolved": "https://registry.npmjs.org/cross-spawn/-/cross-spawn-5.1.0.tgz",
531 | "integrity": "sha1-6L0O/uWPz/b4+UUQoKVUu/ojVEk=",
532 | "requires": {
533 | "lru-cache": "^4.0.1",
534 | "shebang-command": "^1.2.0",
535 | "which": "^1.2.9"
536 | }
537 | },
538 | "dashdash": {
539 | "version": "1.14.1",
540 | "resolved": "https://registry.npmjs.org/dashdash/-/dashdash-1.14.1.tgz",
541 | "integrity": "sha1-hTz6D3y+L+1d4gMmuN1YEDX24vA=",
542 | "requires": {
543 | "assert-plus": "^1.0.0"
544 | }
545 | },
546 | "date-fns": {
547 | "version": "1.29.0",
548 | "resolved": "https://registry.npmjs.org/date-fns/-/date-fns-1.29.0.tgz",
549 | "integrity": "sha512-lbTXWZ6M20cWH8N9S6afb0SBm6tMk+uUg6z3MqHPKE9atmsY3kJkTm8vKe93izJ2B2+q5MV990sM2CHgtAZaOw==",
550 | "dev": true
551 | },
552 | "debug": {
553 | "version": "4.1.1",
554 | "resolved": "https://registry.npmjs.org/debug/-/debug-4.1.1.tgz",
555 | "integrity": "sha512-pYAIzeRo8J6KPEaJ0VWOh5Pzkbw/RetuzehGM7QRRX5he4fPHx2rdKMB256ehJCkX+XRQm16eZLqLNS8RSZXZw==",
556 | "requires": {
557 | "ms": "^2.1.1"
558 | }
559 | },
560 | "decompress-zip": {
561 | "version": "0.3.2",
562 | "resolved": "https://registry.npmjs.org/decompress-zip/-/decompress-zip-0.3.2.tgz",
563 | "integrity": "sha512-Ab1QY4LrWMrUuo53lLnmGOby7v8ryqxJ+bKibKSiPisx+25mhut1dScVBXAYx14i/PqSrFZvR2FRRazhLbvL+g==",
564 | "requires": {
565 | "binary": "^0.3.0",
566 | "graceful-fs": "^4.1.3",
567 | "mkpath": "^0.1.0",
568 | "nopt": "^3.0.1",
569 | "q": "^1.1.2",
570 | "readable-stream": "^1.1.8",
571 | "touch": "0.0.3"
572 | }
573 | },
574 | "delayed-stream": {
575 | "version": "1.0.0",
576 | "resolved": "https://registry.npmjs.org/delayed-stream/-/delayed-stream-1.0.0.tgz",
577 | "integrity": "sha1-3zrhmayt+31ECqrgsp4icrJOxhk="
578 | },
579 | "ecc-jsbn": {
580 | "version": "0.1.2",
581 | "resolved": "https://registry.npmjs.org/ecc-jsbn/-/ecc-jsbn-0.1.2.tgz",
582 | "integrity": "sha1-OoOpBOVDUyh4dMVkt1SThoSamMk=",
583 | "requires": {
584 | "jsbn": "~0.1.0",
585 | "safer-buffer": "^2.1.0"
586 | }
587 | },
588 | "elegant-spinner": {
589 | "version": "1.0.1",
590 | "resolved": "https://registry.npmjs.org/elegant-spinner/-/elegant-spinner-1.0.1.tgz",
591 | "integrity": "sha1-2wQ1IcldfjA/2PNFvtwzSc+wcp4=",
592 | "dev": true
593 | },
594 | "engine.io": {
595 | "version": "3.3.2",
596 | "resolved": "https://registry.npmjs.org/engine.io/-/engine.io-3.3.2.tgz",
597 | "integrity": "sha512-AsaA9KG7cWPXWHp5FvHdDWY3AMWeZ8x+2pUVLcn71qE5AtAzgGbxuclOytygskw8XGmiQafTmnI9Bix3uihu2w==",
598 | "requires": {
599 | "accepts": "~1.3.4",
600 | "base64id": "1.0.0",
601 | "cookie": "0.3.1",
602 | "debug": "~3.1.0",
603 | "engine.io-parser": "~2.1.0",
604 | "ws": "~6.1.0"
605 | },
606 | "dependencies": {
607 | "debug": {
608 | "version": "3.1.0",
609 | "resolved": "https://registry.npmjs.org/debug/-/debug-3.1.0.tgz",
610 | "integrity": "sha512-OX8XqP7/1a9cqkxYw2yXss15f26NKWBpDXQd0/uK/KPqdQhxbPa994hnzjcE2VqQpDslf55723cKPUOGSmMY3g==",
611 | "requires": {
612 | "ms": "2.0.0"
613 | }
614 | },
615 | "ms": {
616 | "version": "2.0.0",
617 | "resolved": "https://registry.npmjs.org/ms/-/ms-2.0.0.tgz",
618 | "integrity": "sha1-VgiurfwAvmwpAd9fmGF4jeDVl8g="
619 | }
620 | }
621 | },
622 | "engine.io-client": {
623 | "version": "3.3.2",
624 | "resolved": "https://registry.npmjs.org/engine.io-client/-/engine.io-client-3.3.2.tgz",
625 | "integrity": "sha512-y0CPINnhMvPuwtqXfsGuWE8BB66+B6wTtCofQDRecMQPYX3MYUZXFNKDhdrSe3EVjgOu4V3rxdeqN/Tr91IgbQ==",
626 | "requires": {
627 | "component-emitter": "1.2.1",
628 | "component-inherit": "0.0.3",
629 | "debug": "~3.1.0",
630 | "engine.io-parser": "~2.1.1",
631 | "has-cors": "1.1.0",
632 | "indexof": "0.0.1",
633 | "parseqs": "0.0.5",
634 | "parseuri": "0.0.5",
635 | "ws": "~6.1.0",
636 | "xmlhttprequest-ssl": "~1.5.4",
637 | "yeast": "0.1.2"
638 | },
639 | "dependencies": {
640 | "debug": {
641 | "version": "3.1.0",
642 | "resolved": "https://registry.npmjs.org/debug/-/debug-3.1.0.tgz",
643 | "integrity": "sha512-OX8XqP7/1a9cqkxYw2yXss15f26NKWBpDXQd0/uK/KPqdQhxbPa994hnzjcE2VqQpDslf55723cKPUOGSmMY3g==",
644 | "requires": {
645 | "ms": "2.0.0"
646 | }
647 | },
648 | "ms": {
649 | "version": "2.0.0",
650 | "resolved": "https://registry.npmjs.org/ms/-/ms-2.0.0.tgz",
651 | "integrity": "sha1-VgiurfwAvmwpAd9fmGF4jeDVl8g="
652 | }
653 | }
654 | },
655 | "engine.io-parser": {
656 | "version": "2.1.3",
657 | "resolved": "https://registry.npmjs.org/engine.io-parser/-/engine.io-parser-2.1.3.tgz",
658 | "integrity": "sha512-6HXPre2O4Houl7c4g7Ic/XzPnHBvaEmN90vtRO9uLmwtRqQmTOw0QMevL1TOfL2Cpu1VzsaTmMotQgMdkzGkVA==",
659 | "requires": {
660 | "after": "0.8.2",
661 | "arraybuffer.slice": "~0.0.7",
662 | "base64-arraybuffer": "0.1.5",
663 | "blob": "0.0.5",
664 | "has-binary2": "~1.0.2"
665 | }
666 | },
667 | "error-ex": {
668 | "version": "1.3.1",
669 | "resolved": "https://registry.npmjs.org/error-ex/-/error-ex-1.3.1.tgz",
670 | "integrity": "sha1-+FWobOYa3E6GIcPNoh56dhLDqNw=",
671 | "dev": true,
672 | "requires": {
673 | "is-arrayish": "^0.2.1"
674 | }
675 | },
676 | "escape-string-regexp": {
677 | "version": "1.0.5",
678 | "resolved": "https://registry.npmjs.org/escape-string-regexp/-/escape-string-regexp-1.0.5.tgz",
679 | "integrity": "sha1-G2HAViGQqN/2rjuyzwIAyhMLhtQ="
680 | },
681 | "esprima": {
682 | "version": "4.0.0",
683 | "resolved": "https://registry.npmjs.org/esprima/-/esprima-4.0.0.tgz",
684 | "integrity": "sha512-oftTcaMu/EGrEIu904mWteKIv8vMuOgGYo7EhVJJN00R/EED9DCua/xxHRdYnKtcECzVg7xOWhflvJMnqcFZjw==",
685 | "dev": true
686 | },
687 | "execa": {
688 | "version": "0.7.0",
689 | "resolved": "https://registry.npmjs.org/execa/-/execa-0.7.0.tgz",
690 | "integrity": "sha1-lEvs00zEHuMqY6n68nrVpl/Fl3c=",
691 | "requires": {
692 | "cross-spawn": "^5.0.1",
693 | "get-stream": "^3.0.0",
694 | "is-stream": "^1.1.0",
695 | "npm-run-path": "^2.0.0",
696 | "p-finally": "^1.0.0",
697 | "signal-exit": "^3.0.0",
698 | "strip-eof": "^1.0.0"
699 | }
700 | },
701 | "exit-hook": {
702 | "version": "1.1.1",
703 | "resolved": "https://registry.npmjs.org/exit-hook/-/exit-hook-1.1.1.tgz",
704 | "integrity": "sha1-8FyiM7SMBdVP/wd2XfhQfpXAL/g=",
705 | "dev": true
706 | },
707 | "express": {
708 | "version": "4.16.2",
709 | "resolved": "https://registry.npmjs.org/express/-/express-4.16.2.tgz",
710 | "integrity": "sha1-41xt/i1kt9ygpc1PIXgb4ymeB2w=",
711 | "requires": {
712 | "accepts": "~1.3.4",
713 | "array-flatten": "1.1.1",
714 | "body-parser": "1.18.2",
715 | "content-disposition": "0.5.2",
716 | "content-type": "~1.0.4",
717 | "cookie": "0.3.1",
718 | "cookie-signature": "1.0.6",
719 | "debug": "2.6.9",
720 | "depd": "~1.1.1",
721 | "encodeurl": "~1.0.1",
722 | "escape-html": "~1.0.3",
723 | "etag": "~1.8.1",
724 | "finalhandler": "1.1.0",
725 | "fresh": "0.5.2",
726 | "merge-descriptors": "1.0.1",
727 | "methods": "~1.1.2",
728 | "on-finished": "~2.3.0",
729 | "parseurl": "~1.3.2",
730 | "path-to-regexp": "0.1.7",
731 | "proxy-addr": "~2.0.2",
732 | "qs": "6.5.1",
733 | "range-parser": "~1.2.0",
734 | "safe-buffer": "5.1.1",
735 | "send": "0.16.1",
736 | "serve-static": "1.13.1",
737 | "setprototypeof": "1.1.0",
738 | "statuses": "~1.3.1",
739 | "type-is": "~1.6.15",
740 | "utils-merge": "1.0.1",
741 | "vary": "~1.1.2"
742 | },
743 | "dependencies": {
744 | "accepts": {
745 | "version": "1.3.4",
746 | "resolved": "https://registry.npmjs.org/accepts/-/accepts-1.3.4.tgz",
747 | "integrity": "sha1-hiRnWMfdbSGmR0/whKR0DsBesh8=",
748 | "requires": {
749 | "mime-types": "~2.1.16",
750 | "negotiator": "0.6.1"
751 | }
752 | },
753 | "array-flatten": {
754 | "version": "1.1.1",
755 | "resolved": "https://registry.npmjs.org/array-flatten/-/array-flatten-1.1.1.tgz",
756 | "integrity": "sha1-ml9pkFGx5wczKPKgCJaLZOopVdI="
757 | },
758 | "content-disposition": {
759 | "version": "0.5.2",
760 | "resolved": "https://registry.npmjs.org/content-disposition/-/content-disposition-0.5.2.tgz",
761 | "integrity": "sha1-DPaLud318r55YcOoUXjLhdunjLQ="
762 | },
763 | "content-type": {
764 | "version": "1.0.4",
765 | "resolved": "https://registry.npmjs.org/content-type/-/content-type-1.0.4.tgz",
766 | "integrity": "sha512-hIP3EEPs8tB9AT1L+NUqtwOAps4mk2Zob89MWXMHjHWg9milF/j4osnnQLXBCBFBk/tvIG/tUc9mOUJiPBhPXA=="
767 | },
768 | "cookie": {
769 | "version": "0.3.1",
770 | "resolved": "https://registry.npmjs.org/cookie/-/cookie-0.3.1.tgz",
771 | "integrity": "sha1-5+Ch+e9DtMi6klxcWpboBtFoc7s="
772 | },
773 | "cookie-signature": {
774 | "version": "1.0.6",
775 | "resolved": "https://registry.npmjs.org/cookie-signature/-/cookie-signature-1.0.6.tgz",
776 | "integrity": "sha1-4wOogrNCzD7oylE6eZmXNNqzriw="
777 | },
778 | "debug": {
779 | "version": "2.6.9",
780 | "resolved": "https://registry.npmjs.org/debug/-/debug-2.6.9.tgz",
781 | "integrity": "sha512-bC7ElrdJaJnPbAP+1EotYvqZsb3ecl5wi6Bfi6BJTUcNowp6cvspg0jXznRTKDjm/E7AdgFBVeAPVMNcKGsHMA==",
782 | "requires": {
783 | "ms": "2.0.0"
784 | }
785 | },
786 | "depd": {
787 | "version": "1.1.1",
788 | "resolved": "https://registry.npmjs.org/depd/-/depd-1.1.1.tgz",
789 | "integrity": "sha1-V4O04cRZ8G+lyif5kfPQbnoxA1k="
790 | },
791 | "destroy": {
792 | "version": "1.0.4",
793 | "resolved": "https://registry.npmjs.org/destroy/-/destroy-1.0.4.tgz",
794 | "integrity": "sha1-l4hXRCxEdJ5CBmE+N5RiBYJqvYA="
795 | },
796 | "ee-first": {
797 | "version": "1.1.1",
798 | "resolved": "https://registry.npmjs.org/ee-first/-/ee-first-1.1.1.tgz",
799 | "integrity": "sha1-WQxhFWsK4vTwJVcyoViyZrxWsh0="
800 | },
801 | "encodeurl": {
802 | "version": "1.0.1",
803 | "resolved": "https://registry.npmjs.org/encodeurl/-/encodeurl-1.0.1.tgz",
804 | "integrity": "sha1-eePVhlU0aQn+bw9Fpd5oEDspTSA="
805 | },
806 | "escape-html": {
807 | "version": "1.0.3",
808 | "resolved": "https://registry.npmjs.org/escape-html/-/escape-html-1.0.3.tgz",
809 | "integrity": "sha1-Aljq5NPQwJdN4cFpGI7wBR0dGYg="
810 | },
811 | "etag": {
812 | "version": "1.8.1",
813 | "resolved": "https://registry.npmjs.org/etag/-/etag-1.8.1.tgz",
814 | "integrity": "sha1-Qa4u62XvpiJorr/qg6x9eSmbCIc="
815 | },
816 | "finalhandler": {
817 | "version": "1.1.0",
818 | "resolved": "https://registry.npmjs.org/finalhandler/-/finalhandler-1.1.0.tgz",
819 | "integrity": "sha1-zgtoVbRYU+eRsvzGgARtiCU91/U=",
820 | "requires": {
821 | "debug": "2.6.9",
822 | "encodeurl": "~1.0.1",
823 | "escape-html": "~1.0.3",
824 | "on-finished": "~2.3.0",
825 | "parseurl": "~1.3.2",
826 | "statuses": "~1.3.1",
827 | "unpipe": "~1.0.0"
828 | }
829 | },
830 | "forwarded": {
831 | "version": "0.1.2",
832 | "resolved": "https://registry.npmjs.org/forwarded/-/forwarded-0.1.2.tgz",
833 | "integrity": "sha1-mMI9qxF1ZXuMBXPozszZGw/xjIQ="
834 | },
835 | "fresh": {
836 | "version": "0.5.2",
837 | "resolved": "https://registry.npmjs.org/fresh/-/fresh-0.5.2.tgz",
838 | "integrity": "sha1-PYyt2Q2XZWn6g1qx+OSyOhBWBac="
839 | },
840 | "http-errors": {
841 | "version": "1.6.2",
842 | "resolved": "https://registry.npmjs.org/http-errors/-/http-errors-1.6.2.tgz",
843 | "integrity": "sha1-CgAsyFcHGSp+eUbO7cERVfYOxzY=",
844 | "requires": {
845 | "depd": "1.1.1",
846 | "inherits": "2.0.3",
847 | "setprototypeof": "1.0.3",
848 | "statuses": ">= 1.3.1 < 2"
849 | },
850 | "dependencies": {
851 | "setprototypeof": {
852 | "version": "1.0.3",
853 | "resolved": "https://registry.npmjs.org/setprototypeof/-/setprototypeof-1.0.3.tgz",
854 | "integrity": "sha1-ZlZ+NwQ+608E2RvWWMDL77VbjgQ="
855 | }
856 | }
857 | },
858 | "inherits": {
859 | "version": "2.0.3",
860 | "resolved": "https://registry.npmjs.org/inherits/-/inherits-2.0.3.tgz",
861 | "integrity": "sha1-Yzwsg+PaQqUC9SRmAiSA9CCCYd4="
862 | },
863 | "ipaddr.js": {
864 | "version": "1.5.2",
865 | "resolved": "https://registry.npmjs.org/ipaddr.js/-/ipaddr.js-1.5.2.tgz",
866 | "integrity": "sha1-1LUFvemUaYfM8PxY2QEP+WB+P6A="
867 | },
868 | "media-typer": {
869 | "version": "0.3.0",
870 | "resolved": "https://registry.npmjs.org/media-typer/-/media-typer-0.3.0.tgz",
871 | "integrity": "sha1-hxDXrwqmJvj/+hzgAWhUUmMlV0g="
872 | },
873 | "merge-descriptors": {
874 | "version": "1.0.1",
875 | "resolved": "https://registry.npmjs.org/merge-descriptors/-/merge-descriptors-1.0.1.tgz",
876 | "integrity": "sha1-sAqqVW3YtEVoFQ7J0blT8/kMu2E="
877 | },
878 | "methods": {
879 | "version": "1.1.2",
880 | "resolved": "https://registry.npmjs.org/methods/-/methods-1.1.2.tgz",
881 | "integrity": "sha1-VSmk1nZUE07cxSZmVoNbD4Ua/O4="
882 | },
883 | "mime": {
884 | "version": "1.4.1",
885 | "resolved": "https://registry.npmjs.org/mime/-/mime-1.4.1.tgz",
886 | "integrity": "sha512-KI1+qOZu5DcW6wayYHSzR/tXKCDC5Om4s1z2QJjDULzLcmf3DvzS7oluY4HCTrc+9FiKmWUgeNLg7W3uIQvxtQ=="
887 | },
888 | "mime-db": {
889 | "version": "1.30.0",
890 | "resolved": "https://registry.npmjs.org/mime-db/-/mime-db-1.30.0.tgz",
891 | "integrity": "sha1-dMZD2i3Z1qRTmZY0ZbJtXKfXHwE="
892 | },
893 | "mime-types": {
894 | "version": "2.1.17",
895 | "resolved": "https://registry.npmjs.org/mime-types/-/mime-types-2.1.17.tgz",
896 | "integrity": "sha1-Cdejk/A+mVp5+K+Fe3Cp4KsWVXo=",
897 | "requires": {
898 | "mime-db": "~1.30.0"
899 | }
900 | },
901 | "ms": {
902 | "version": "2.0.0",
903 | "resolved": "https://registry.npmjs.org/ms/-/ms-2.0.0.tgz",
904 | "integrity": "sha1-VgiurfwAvmwpAd9fmGF4jeDVl8g="
905 | },
906 | "negotiator": {
907 | "version": "0.6.1",
908 | "resolved": "https://registry.npmjs.org/negotiator/-/negotiator-0.6.1.tgz",
909 | "integrity": "sha1-KzJxhOiZIQEXeyhWP7XnECrNDKk="
910 | },
911 | "on-finished": {
912 | "version": "2.3.0",
913 | "resolved": "https://registry.npmjs.org/on-finished/-/on-finished-2.3.0.tgz",
914 | "integrity": "sha1-IPEzZIGwg811M3mSoWlxqi2QaUc=",
915 | "requires": {
916 | "ee-first": "1.1.1"
917 | }
918 | },
919 | "parseurl": {
920 | "version": "1.3.2",
921 | "resolved": "https://registry.npmjs.org/parseurl/-/parseurl-1.3.2.tgz",
922 | "integrity": "sha1-/CidTtiZMRlGDBViUyYs3I3mW/M="
923 | },
924 | "path-to-regexp": {
925 | "version": "0.1.7",
926 | "resolved": "https://registry.npmjs.org/path-to-regexp/-/path-to-regexp-0.1.7.tgz",
927 | "integrity": "sha1-32BBeABfUi8V60SQ5yR6G/qmf4w="
928 | },
929 | "proxy-addr": {
930 | "version": "2.0.2",
931 | "resolved": "https://registry.npmjs.org/proxy-addr/-/proxy-addr-2.0.2.tgz",
932 | "integrity": "sha1-ZXFQT0e7mI7IGAJT+F3X4UlSvew=",
933 | "requires": {
934 | "forwarded": "~0.1.2",
935 | "ipaddr.js": "1.5.2"
936 | }
937 | },
938 | "qs": {
939 | "version": "6.5.1",
940 | "resolved": "https://registry.npmjs.org/qs/-/qs-6.5.1.tgz",
941 | "integrity": "sha512-eRzhrN1WSINYCDCbrz796z37LOe3m5tmW7RQf6oBntukAG1nmovJvhnwHHRMAfeoItc1m2Hk02WER2aQ/iqs+A=="
942 | },
943 | "range-parser": {
944 | "version": "1.2.0",
945 | "resolved": "https://registry.npmjs.org/range-parser/-/range-parser-1.2.0.tgz",
946 | "integrity": "sha1-9JvmtIeJTdxA3MlKMi9hEJLgDV4="
947 | },
948 | "safe-buffer": {
949 | "version": "5.1.1",
950 | "resolved": "https://registry.npmjs.org/safe-buffer/-/safe-buffer-5.1.1.tgz",
951 | "integrity": "sha512-kKvNJn6Mm93gAczWVJg7wH+wGYWNrDHdWvpUmHyEsgCtIwwo3bqPtV4tR5tuPaUhTOo/kvhVwd8XwwOllGYkbg=="
952 | },
953 | "send": {
954 | "version": "0.16.1",
955 | "resolved": "https://registry.npmjs.org/send/-/send-0.16.1.tgz",
956 | "integrity": "sha512-ElCLJdJIKPk6ux/Hocwhk7NFHpI3pVm/IZOYWqUmoxcgeyM+MpxHHKhb8QmlJDX1pU6WrgaHBkVNm73Sv7uc2A==",
957 | "requires": {
958 | "debug": "2.6.9",
959 | "depd": "~1.1.1",
960 | "destroy": "~1.0.4",
961 | "encodeurl": "~1.0.1",
962 | "escape-html": "~1.0.3",
963 | "etag": "~1.8.1",
964 | "fresh": "0.5.2",
965 | "http-errors": "~1.6.2",
966 | "mime": "1.4.1",
967 | "ms": "2.0.0",
968 | "on-finished": "~2.3.0",
969 | "range-parser": "~1.2.0",
970 | "statuses": "~1.3.1"
971 | }
972 | },
973 | "serve-static": {
974 | "version": "1.13.1",
975 | "resolved": "https://registry.npmjs.org/serve-static/-/serve-static-1.13.1.tgz",
976 | "integrity": "sha512-hSMUZrsPa/I09VYFJwa627JJkNs0NrfL1Uzuup+GqHfToR2KcsXFymXSV90hoyw3M+msjFuQly+YzIH/q0MGlQ==",
977 | "requires": {
978 | "encodeurl": "~1.0.1",
979 | "escape-html": "~1.0.3",
980 | "parseurl": "~1.3.2",
981 | "send": "0.16.1"
982 | }
983 | },
984 | "setprototypeof": {
985 | "version": "1.1.0",
986 | "resolved": "https://registry.npmjs.org/setprototypeof/-/setprototypeof-1.1.0.tgz",
987 | "integrity": "sha512-BvE/TwpZX4FXExxOxZyRGQQv651MSwmWKZGqvmPcRIjDqWub67kTKuIMx43cZZrS/cBBzwBcNDWoFxt2XEFIpQ=="
988 | },
989 | "statuses": {
990 | "version": "1.3.1",
991 | "resolved": "https://registry.npmjs.org/statuses/-/statuses-1.3.1.tgz",
992 | "integrity": "sha1-+vUbnrdKrvOzrPStX2Gr8ky3uT4="
993 | },
994 | "type-is": {
995 | "version": "1.6.15",
996 | "resolved": "https://registry.npmjs.org/type-is/-/type-is-1.6.15.tgz",
997 | "integrity": "sha1-yrEPtJCeRByChC6v4a1kbIGARBA=",
998 | "requires": {
999 | "media-typer": "0.3.0",
1000 | "mime-types": "~2.1.15"
1001 | }
1002 | },
1003 | "unpipe": {
1004 | "version": "1.0.0",
1005 | "resolved": "https://registry.npmjs.org/unpipe/-/unpipe-1.0.0.tgz",
1006 | "integrity": "sha1-sr9O6FFKrmFltIF4KdIbLvSZBOw="
1007 | },
1008 | "utils-merge": {
1009 | "version": "1.0.1",
1010 | "resolved": "https://registry.npmjs.org/utils-merge/-/utils-merge-1.0.1.tgz",
1011 | "integrity": "sha1-n5VxD1CiZ5R7LMwSR0HBAoQn5xM="
1012 | },
1013 | "vary": {
1014 | "version": "1.1.2",
1015 | "resolved": "https://registry.npmjs.org/vary/-/vary-1.1.2.tgz",
1016 | "integrity": "sha1-IpnwLG3tMNSllhsLn3RSShj2NPw="
1017 | }
1018 | }
1019 | },
1020 | "extend": {
1021 | "version": "3.0.2",
1022 | "resolved": "https://registry.npmjs.org/extend/-/extend-3.0.2.tgz",
1023 | "integrity": "sha512-fjquC59cD7CyW6urNXK0FBufkZcoiGG80wTuPujX590cB5Ttln20E2UB4S/WARVqhXffZl2LNgS+gQdPIIim/g=="
1024 | },
1025 | "extsprintf": {
1026 | "version": "1.3.0",
1027 | "resolved": "https://registry.npmjs.org/extsprintf/-/extsprintf-1.3.0.tgz",
1028 | "integrity": "sha1-lpGEQOMEGnpBT4xS48V06zw+HgU="
1029 | },
1030 | "fast-deep-equal": {
1031 | "version": "2.0.1",
1032 | "resolved": "https://registry.npmjs.org/fast-deep-equal/-/fast-deep-equal-2.0.1.tgz",
1033 | "integrity": "sha1-ewUhjd+WZ79/Nwv3/bLLFf3Qqkk="
1034 | },
1035 | "fast-json-stable-stringify": {
1036 | "version": "2.0.0",
1037 | "resolved": "https://registry.npmjs.org/fast-json-stable-stringify/-/fast-json-stable-stringify-2.0.0.tgz",
1038 | "integrity": "sha1-1RQsDK7msRifh9OnYREGT4bIu/I="
1039 | },
1040 | "figures": {
1041 | "version": "1.7.0",
1042 | "resolved": "https://registry.npmjs.org/figures/-/figures-1.7.0.tgz",
1043 | "integrity": "sha1-y+Hjr/zxzUS4DK3+0o3Hk6lwHS4=",
1044 | "dev": true,
1045 | "requires": {
1046 | "escape-string-regexp": "^1.0.5",
1047 | "object-assign": "^4.1.0"
1048 | }
1049 | },
1050 | "forever-agent": {
1051 | "version": "0.6.1",
1052 | "resolved": "https://registry.npmjs.org/forever-agent/-/forever-agent-0.6.1.tgz",
1053 | "integrity": "sha1-+8cfDEGt6zf5bFd60e1C2P2sypE="
1054 | },
1055 | "form-data": {
1056 | "version": "2.3.3",
1057 | "resolved": "https://registry.npmjs.org/form-data/-/form-data-2.3.3.tgz",
1058 | "integrity": "sha512-1lLKB2Mu3aGP1Q/2eCOx0fNbRMe7XdwktwOruhfqqd0rIJWwN4Dh+E3hrPSlDCXnSR7UtZ1N38rVXm+6+MEhJQ==",
1059 | "requires": {
1060 | "asynckit": "^0.4.0",
1061 | "combined-stream": "^1.0.6",
1062 | "mime-types": "^2.1.12"
1063 | }
1064 | },
1065 | "get-own-enumerable-property-symbols": {
1066 | "version": "2.0.1",
1067 | "resolved": "https://registry.npmjs.org/get-own-enumerable-property-symbols/-/get-own-enumerable-property-symbols-2.0.1.tgz",
1068 | "integrity": "sha512-TtY/sbOemiMKPRUDDanGCSgBYe7Mf0vbRsWnBZ+9yghpZ1MvcpSpuZFjHdEeY/LZjZy0vdLjS77L6HosisFiug==",
1069 | "dev": true
1070 | },
1071 | "get-stream": {
1072 | "version": "3.0.0",
1073 | "resolved": "https://registry.npmjs.org/get-stream/-/get-stream-3.0.0.tgz",
1074 | "integrity": "sha1-jpQ9E1jcN1VQVOy+LtsFqhdO3hQ="
1075 | },
1076 | "getpass": {
1077 | "version": "0.1.7",
1078 | "resolved": "https://registry.npmjs.org/getpass/-/getpass-0.1.7.tgz",
1079 | "integrity": "sha1-Xv+OPmhNVprkyysSgmBOi6YhSfo=",
1080 | "requires": {
1081 | "assert-plus": "^1.0.0"
1082 | }
1083 | },
1084 | "graceful-fs": {
1085 | "version": "4.1.11",
1086 | "resolved": "https://registry.npmjs.org/graceful-fs/-/graceful-fs-4.1.11.tgz",
1087 | "integrity": "sha1-Dovf5NHduIVNZOBOp8AOKgJuVlg="
1088 | },
1089 | "har-schema": {
1090 | "version": "2.0.0",
1091 | "resolved": "https://registry.npmjs.org/har-schema/-/har-schema-2.0.0.tgz",
1092 | "integrity": "sha1-qUwiJOvKwEeCoNkDVSHyRzW37JI="
1093 | },
1094 | "har-validator": {
1095 | "version": "5.1.3",
1096 | "resolved": "https://registry.npmjs.org/har-validator/-/har-validator-5.1.3.tgz",
1097 | "integrity": "sha512-sNvOCzEQNr/qrvJgc3UG/kD4QtlHycrzwS+6mfTrrSq97BvaYcPZZI1ZSqGSPR73Cxn4LKTD4PttRwfU7jWq5g==",
1098 | "requires": {
1099 | "ajv": "^6.5.5",
1100 | "har-schema": "^2.0.0"
1101 | }
1102 | },
1103 | "has-ansi": {
1104 | "version": "2.0.0",
1105 | "resolved": "https://registry.npmjs.org/has-ansi/-/has-ansi-2.0.0.tgz",
1106 | "integrity": "sha1-NPUEnOHs3ysGSa8+8k5F7TVBbZE=",
1107 | "dev": true,
1108 | "requires": {
1109 | "ansi-regex": "^2.0.0"
1110 | },
1111 | "dependencies": {
1112 | "ansi-regex": {
1113 | "version": "2.1.1",
1114 | "resolved": "https://registry.npmjs.org/ansi-regex/-/ansi-regex-2.1.1.tgz",
1115 | "integrity": "sha1-w7M6te42DYbg5ijwRorn7yfWVN8=",
1116 | "dev": true
1117 | }
1118 | }
1119 | },
1120 | "has-binary2": {
1121 | "version": "1.0.3",
1122 | "resolved": "https://registry.npmjs.org/has-binary2/-/has-binary2-1.0.3.tgz",
1123 | "integrity": "sha512-G1LWKhDSvhGeAQ8mPVQlqNcOB2sJdwATtZKl2pDKKHfpf/rYj24lkinxf69blJbnsvtqqNU+L3SL50vzZhXOnw==",
1124 | "requires": {
1125 | "isarray": "2.0.1"
1126 | }
1127 | },
1128 | "has-cors": {
1129 | "version": "1.1.0",
1130 | "resolved": "https://registry.npmjs.org/has-cors/-/has-cors-1.1.0.tgz",
1131 | "integrity": "sha1-XkdHk/fqmEPRu5nCPu9J/xJv/zk="
1132 | },
1133 | "has-flag": {
1134 | "version": "2.0.0",
1135 | "resolved": "https://registry.npmjs.org/has-flag/-/has-flag-2.0.0.tgz",
1136 | "integrity": "sha1-6CB68cx7MNRGzHC3NLXovhj4jVE="
1137 | },
1138 | "http-signature": {
1139 | "version": "1.2.0",
1140 | "resolved": "https://registry.npmjs.org/http-signature/-/http-signature-1.2.0.tgz",
1141 | "integrity": "sha1-muzZJRFHcvPZW2WmCruPfBj7rOE=",
1142 | "requires": {
1143 | "assert-plus": "^1.0.0",
1144 | "jsprim": "^1.2.2",
1145 | "sshpk": "^1.7.0"
1146 | }
1147 | },
1148 | "husky": {
1149 | "version": "0.14.3",
1150 | "resolved": "https://registry.npmjs.org/husky/-/husky-0.14.3.tgz",
1151 | "integrity": "sha512-e21wivqHpstpoiWA/Yi8eFti8E+sQDSS53cpJsPptPs295QTOQR0ZwnHo2TXy1XOpZFD9rPOd3NpmqTK6uMLJA==",
1152 | "dev": true,
1153 | "requires": {
1154 | "is-ci": "^1.0.10",
1155 | "normalize-path": "^1.0.0",
1156 | "strip-indent": "^2.0.0"
1157 | },
1158 | "dependencies": {
1159 | "normalize-path": {
1160 | "version": "1.0.0",
1161 | "resolved": "https://registry.npmjs.org/normalize-path/-/normalize-path-1.0.0.tgz",
1162 | "integrity": "sha1-MtDkcvkf80VwHBWoMRAY07CpA3k=",
1163 | "dev": true
1164 | }
1165 | }
1166 | },
1167 | "indent-string": {
1168 | "version": "2.1.0",
1169 | "resolved": "https://registry.npmjs.org/indent-string/-/indent-string-2.1.0.tgz",
1170 | "integrity": "sha1-ji1INIdCEhtKghi3oTfppSBJ3IA=",
1171 | "dev": true,
1172 | "requires": {
1173 | "repeating": "^2.0.0"
1174 | }
1175 | },
1176 | "indexof": {
1177 | "version": "0.0.1",
1178 | "resolved": "https://registry.npmjs.org/indexof/-/indexof-0.0.1.tgz",
1179 | "integrity": "sha1-gtwzbSMrkGIXnQWrMpOmYFn9Q10="
1180 | },
1181 | "inherits": {
1182 | "version": "2.0.3",
1183 | "resolved": "https://registry.npmjs.org/inherits/-/inherits-2.0.3.tgz",
1184 | "integrity": "sha1-Yzwsg+PaQqUC9SRmAiSA9CCCYd4="
1185 | },
1186 | "is-arrayish": {
1187 | "version": "0.2.1",
1188 | "resolved": "https://registry.npmjs.org/is-arrayish/-/is-arrayish-0.2.1.tgz",
1189 | "integrity": "sha1-d8mYQFJ6qOyxqLppe4BkWnqSap0=",
1190 | "dev": true
1191 | },
1192 | "is-ci": {
1193 | "version": "1.0.10",
1194 | "resolved": "https://registry.npmjs.org/is-ci/-/is-ci-1.0.10.tgz",
1195 | "integrity": "sha1-9zkzayYyNlBhqdSCcM1WrjNpMY4=",
1196 | "dev": true,
1197 | "requires": {
1198 | "ci-info": "^1.0.0"
1199 | }
1200 | },
1201 | "is-finite": {
1202 | "version": "1.0.2",
1203 | "resolved": "https://registry.npmjs.org/is-finite/-/is-finite-1.0.2.tgz",
1204 | "integrity": "sha1-zGZ3aVYCvlUO8R6LSqYwU0K20Ko=",
1205 | "dev": true,
1206 | "requires": {
1207 | "number-is-nan": "^1.0.0"
1208 | }
1209 | },
1210 | "is-fullwidth-code-point": {
1211 | "version": "2.0.0",
1212 | "resolved": "https://registry.npmjs.org/is-fullwidth-code-point/-/is-fullwidth-code-point-2.0.0.tgz",
1213 | "integrity": "sha1-o7MKXE8ZkYMWeqq5O+764937ZU8="
1214 | },
1215 | "is-obj": {
1216 | "version": "1.0.1",
1217 | "resolved": "https://registry.npmjs.org/is-obj/-/is-obj-1.0.1.tgz",
1218 | "integrity": "sha1-PkcprB9f3gJc19g6iW2rn09n2w8=",
1219 | "dev": true
1220 | },
1221 | "is-promise": {
1222 | "version": "2.1.0",
1223 | "resolved": "https://registry.npmjs.org/is-promise/-/is-promise-2.1.0.tgz",
1224 | "integrity": "sha1-eaKp7OfwlugPNtKy87wWwf9L8/o=",
1225 | "dev": true
1226 | },
1227 | "is-regexp": {
1228 | "version": "1.0.0",
1229 | "resolved": "https://registry.npmjs.org/is-regexp/-/is-regexp-1.0.0.tgz",
1230 | "integrity": "sha1-/S2INUXEa6xaYz57mgnof6LLUGk=",
1231 | "dev": true
1232 | },
1233 | "is-stream": {
1234 | "version": "1.1.0",
1235 | "resolved": "https://registry.npmjs.org/is-stream/-/is-stream-1.1.0.tgz",
1236 | "integrity": "sha1-EtSj3U5o4Lec6428hBc66A2RykQ="
1237 | },
1238 | "is-typedarray": {
1239 | "version": "1.0.0",
1240 | "resolved": "https://registry.npmjs.org/is-typedarray/-/is-typedarray-1.0.0.tgz",
1241 | "integrity": "sha1-5HnICFjfDBsR3dppQPlgEfzaSpo="
1242 | },
1243 | "isarray": {
1244 | "version": "2.0.1",
1245 | "resolved": "https://registry.npmjs.org/isarray/-/isarray-2.0.1.tgz",
1246 | "integrity": "sha1-o32U7ZzaLVmGXJ92/llu4fM4dB4="
1247 | },
1248 | "isexe": {
1249 | "version": "2.0.0",
1250 | "resolved": "https://registry.npmjs.org/isexe/-/isexe-2.0.0.tgz",
1251 | "integrity": "sha1-6PvzdNxVb/iUehDcsFctYz8s+hA="
1252 | },
1253 | "isstream": {
1254 | "version": "0.1.2",
1255 | "resolved": "https://registry.npmjs.org/isstream/-/isstream-0.1.2.tgz",
1256 | "integrity": "sha1-R+Y/evVa+m+S4VAOaQ64uFKcCZo="
1257 | },
1258 | "jest-get-type": {
1259 | "version": "21.2.0",
1260 | "resolved": "https://registry.npmjs.org/jest-get-type/-/jest-get-type-21.2.0.tgz",
1261 | "integrity": "sha512-y2fFw3C+D0yjNSDp7ab1kcd6NUYfy3waPTlD8yWkAtiocJdBRQqNoRqVfMNxgj+IjT0V5cBIHJO0z9vuSSZ43Q==",
1262 | "dev": true
1263 | },
1264 | "jest-validate": {
1265 | "version": "21.2.1",
1266 | "resolved": "https://registry.npmjs.org/jest-validate/-/jest-validate-21.2.1.tgz",
1267 | "integrity": "sha512-k4HLI1rZQjlU+EC682RlQ6oZvLrE5SCh3brseQc24vbZTxzT/k/3urar5QMCVgjadmSO7lECeGdc6YxnM3yEGg==",
1268 | "dev": true,
1269 | "requires": {
1270 | "chalk": "^2.0.1",
1271 | "jest-get-type": "^21.2.0",
1272 | "leven": "^2.1.0",
1273 | "pretty-format": "^21.2.1"
1274 | }
1275 | },
1276 | "js-yaml": {
1277 | "version": "3.13.1",
1278 | "resolved": "https://registry.npmjs.org/js-yaml/-/js-yaml-3.13.1.tgz",
1279 | "integrity": "sha512-YfbcO7jXDdyj0DGxYVSlSeQNHbD7XPWvrVWeVUujrQEoZzWJIRrCPoyk6kL6IAjAG2IolMK4T0hNUe0HOUs5Jw==",
1280 | "dev": true,
1281 | "requires": {
1282 | "argparse": "^1.0.7",
1283 | "esprima": "^4.0.0"
1284 | }
1285 | },
1286 | "jsbn": {
1287 | "version": "0.1.1",
1288 | "resolved": "https://registry.npmjs.org/jsbn/-/jsbn-0.1.1.tgz",
1289 | "integrity": "sha1-peZUwuWi3rXyAdls77yoDA7y9RM="
1290 | },
1291 | "json-schema": {
1292 | "version": "0.2.3",
1293 | "resolved": "https://registry.npmjs.org/json-schema/-/json-schema-0.2.3.tgz",
1294 | "integrity": "sha1-tIDIkuWaLwWVTOcnvT8qTogvnhM="
1295 | },
1296 | "json-schema-traverse": {
1297 | "version": "0.4.1",
1298 | "resolved": "https://registry.npmjs.org/json-schema-traverse/-/json-schema-traverse-0.4.1.tgz",
1299 | "integrity": "sha512-xbbCH5dCYU5T8LcEhhuh7HJ88HXuW3qsI3Y0zOZFKfZEHcpWiHU/Jxzk629Brsab/mMiHQti9wMP+845RPe3Vg=="
1300 | },
1301 | "json-stringify-safe": {
1302 | "version": "5.0.1",
1303 | "resolved": "https://registry.npmjs.org/json-stringify-safe/-/json-stringify-safe-5.0.1.tgz",
1304 | "integrity": "sha1-Epai1Y/UXxmg9s4B1lcB4sc1tus="
1305 | },
1306 | "jsprim": {
1307 | "version": "1.4.1",
1308 | "resolved": "https://registry.npmjs.org/jsprim/-/jsprim-1.4.1.tgz",
1309 | "integrity": "sha1-MT5mvB5cwG5Di8G3SZwuXFastqI=",
1310 | "requires": {
1311 | "assert-plus": "1.0.0",
1312 | "extsprintf": "1.3.0",
1313 | "json-schema": "0.2.3",
1314 | "verror": "1.10.0"
1315 | }
1316 | },
1317 | "leven": {
1318 | "version": "2.1.0",
1319 | "resolved": "https://registry.npmjs.org/leven/-/leven-2.1.0.tgz",
1320 | "integrity": "sha1-wuep93IJTe6dNCAq6KzORoeHVYA=",
1321 | "dev": true
1322 | },
1323 | "lint-staged": {
1324 | "version": "4.2.3",
1325 | "resolved": "https://registry.npmjs.org/lint-staged/-/lint-staged-4.2.3.tgz",
1326 | "integrity": "sha512-Ks1vMyVpp3ldeFDN9sIcHcFDh0v3X6Y6LOdT0Wl86/BSDM2R8PVcuFODkh0Dav7Ni/asUPKONfXRWZM9YO85IQ==",
1327 | "dev": true,
1328 | "requires": {
1329 | "app-root-path": "^2.0.0",
1330 | "chalk": "^2.1.0",
1331 | "cosmiconfig": "^1.1.0",
1332 | "execa": "^0.8.0",
1333 | "is-glob": "^4.0.0",
1334 | "jest-validate": "^21.1.0",
1335 | "listr": "^0.12.0",
1336 | "lodash": "^4.17.4",
1337 | "log-symbols": "^2.0.0",
1338 | "minimatch": "^3.0.0",
1339 | "npm-which": "^3.0.1",
1340 | "p-map": "^1.1.1",
1341 | "staged-git-files": "0.0.4",
1342 | "stringify-object": "^3.2.0"
1343 | },
1344 | "dependencies": {
1345 | "execa": {
1346 | "version": "0.8.0",
1347 | "resolved": "https://registry.npmjs.org/execa/-/execa-0.8.0.tgz",
1348 | "integrity": "sha1-2NdrvBtVIX7RkP1t1J08d07PyNo=",
1349 | "dev": true,
1350 | "requires": {
1351 | "cross-spawn": "^5.0.1",
1352 | "get-stream": "^3.0.0",
1353 | "is-stream": "^1.1.0",
1354 | "npm-run-path": "^2.0.0",
1355 | "p-finally": "^1.0.0",
1356 | "signal-exit": "^3.0.0",
1357 | "strip-eof": "^1.0.0"
1358 | }
1359 | },
1360 | "is-extglob": {
1361 | "version": "2.1.1",
1362 | "resolved": "https://registry.npmjs.org/is-extglob/-/is-extglob-2.1.1.tgz",
1363 | "integrity": "sha1-qIwCU1eR8C7TfHahueqXc8gz+MI=",
1364 | "dev": true
1365 | },
1366 | "is-glob": {
1367 | "version": "4.0.0",
1368 | "resolved": "https://registry.npmjs.org/is-glob/-/is-glob-4.0.0.tgz",
1369 | "integrity": "sha1-lSHHaEXMJhCoUgPd8ICpWML/q8A=",
1370 | "dev": true,
1371 | "requires": {
1372 | "is-extglob": "^2.1.1"
1373 | }
1374 | }
1375 | }
1376 | },
1377 | "listr": {
1378 | "version": "0.12.0",
1379 | "resolved": "https://registry.npmjs.org/listr/-/listr-0.12.0.tgz",
1380 | "integrity": "sha1-a84sD1YD+klYDqF81qAMwOX6RRo=",
1381 | "dev": true,
1382 | "requires": {
1383 | "chalk": "^1.1.3",
1384 | "cli-truncate": "^0.2.1",
1385 | "figures": "^1.7.0",
1386 | "indent-string": "^2.1.0",
1387 | "is-promise": "^2.1.0",
1388 | "is-stream": "^1.1.0",
1389 | "listr-silent-renderer": "^1.1.1",
1390 | "listr-update-renderer": "^0.2.0",
1391 | "listr-verbose-renderer": "^0.4.0",
1392 | "log-symbols": "^1.0.2",
1393 | "log-update": "^1.0.2",
1394 | "ora": "^0.2.3",
1395 | "p-map": "^1.1.1",
1396 | "rxjs": "^5.0.0-beta.11",
1397 | "stream-to-observable": "^0.1.0",
1398 | "strip-ansi": "^3.0.1"
1399 | },
1400 | "dependencies": {
1401 | "ansi-regex": {
1402 | "version": "2.1.1",
1403 | "resolved": "https://registry.npmjs.org/ansi-regex/-/ansi-regex-2.1.1.tgz",
1404 | "integrity": "sha1-w7M6te42DYbg5ijwRorn7yfWVN8=",
1405 | "dev": true
1406 | },
1407 | "ansi-styles": {
1408 | "version": "2.2.1",
1409 | "resolved": "https://registry.npmjs.org/ansi-styles/-/ansi-styles-2.2.1.tgz",
1410 | "integrity": "sha1-tDLdM1i2NM914eRmQ2gkBTPB3b4=",
1411 | "dev": true
1412 | },
1413 | "chalk": {
1414 | "version": "1.1.3",
1415 | "resolved": "https://registry.npmjs.org/chalk/-/chalk-1.1.3.tgz",
1416 | "integrity": "sha1-qBFcVeSnAv5NFQq9OHKCKn4J/Jg=",
1417 | "dev": true,
1418 | "requires": {
1419 | "ansi-styles": "^2.2.1",
1420 | "escape-string-regexp": "^1.0.2",
1421 | "has-ansi": "^2.0.0",
1422 | "strip-ansi": "^3.0.0",
1423 | "supports-color": "^2.0.0"
1424 | }
1425 | },
1426 | "log-symbols": {
1427 | "version": "1.0.2",
1428 | "resolved": "https://registry.npmjs.org/log-symbols/-/log-symbols-1.0.2.tgz",
1429 | "integrity": "sha1-N2/3tY6jCGoPCfrMdGF+ylAeGhg=",
1430 | "dev": true,
1431 | "requires": {
1432 | "chalk": "^1.0.0"
1433 | }
1434 | },
1435 | "strip-ansi": {
1436 | "version": "3.0.1",
1437 | "resolved": "https://registry.npmjs.org/strip-ansi/-/strip-ansi-3.0.1.tgz",
1438 | "integrity": "sha1-ajhfuIU9lS1f8F0Oiq+UJ43GPc8=",
1439 | "dev": true,
1440 | "requires": {
1441 | "ansi-regex": "^2.0.0"
1442 | }
1443 | },
1444 | "supports-color": {
1445 | "version": "2.0.0",
1446 | "resolved": "https://registry.npmjs.org/supports-color/-/supports-color-2.0.0.tgz",
1447 | "integrity": "sha1-U10EXOa2Nj+kARcIRimZXp3zJMc=",
1448 | "dev": true
1449 | }
1450 | }
1451 | },
1452 | "listr-silent-renderer": {
1453 | "version": "1.1.1",
1454 | "resolved": "https://registry.npmjs.org/listr-silent-renderer/-/listr-silent-renderer-1.1.1.tgz",
1455 | "integrity": "sha1-kktaN1cVN3C/Go4/v3S4u/P5JC4=",
1456 | "dev": true
1457 | },
1458 | "listr-update-renderer": {
1459 | "version": "0.2.0",
1460 | "resolved": "https://registry.npmjs.org/listr-update-renderer/-/listr-update-renderer-0.2.0.tgz",
1461 | "integrity": "sha1-yoDhd5tOcCZoB+ju0a1qvjmFUPk=",
1462 | "dev": true,
1463 | "requires": {
1464 | "chalk": "^1.1.3",
1465 | "cli-truncate": "^0.2.1",
1466 | "elegant-spinner": "^1.0.1",
1467 | "figures": "^1.7.0",
1468 | "indent-string": "^3.0.0",
1469 | "log-symbols": "^1.0.2",
1470 | "log-update": "^1.0.2",
1471 | "strip-ansi": "^3.0.1"
1472 | },
1473 | "dependencies": {
1474 | "ansi-regex": {
1475 | "version": "2.1.1",
1476 | "resolved": "https://registry.npmjs.org/ansi-regex/-/ansi-regex-2.1.1.tgz",
1477 | "integrity": "sha1-w7M6te42DYbg5ijwRorn7yfWVN8=",
1478 | "dev": true
1479 | },
1480 | "ansi-styles": {
1481 | "version": "2.2.1",
1482 | "resolved": "https://registry.npmjs.org/ansi-styles/-/ansi-styles-2.2.1.tgz",
1483 | "integrity": "sha1-tDLdM1i2NM914eRmQ2gkBTPB3b4=",
1484 | "dev": true
1485 | },
1486 | "chalk": {
1487 | "version": "1.1.3",
1488 | "resolved": "https://registry.npmjs.org/chalk/-/chalk-1.1.3.tgz",
1489 | "integrity": "sha1-qBFcVeSnAv5NFQq9OHKCKn4J/Jg=",
1490 | "dev": true,
1491 | "requires": {
1492 | "ansi-styles": "^2.2.1",
1493 | "escape-string-regexp": "^1.0.2",
1494 | "has-ansi": "^2.0.0",
1495 | "strip-ansi": "^3.0.0",
1496 | "supports-color": "^2.0.0"
1497 | }
1498 | },
1499 | "indent-string": {
1500 | "version": "3.2.0",
1501 | "resolved": "https://registry.npmjs.org/indent-string/-/indent-string-3.2.0.tgz",
1502 | "integrity": "sha1-Sl/W0nzDMvN+VBmlBNu4NxBckok=",
1503 | "dev": true
1504 | },
1505 | "log-symbols": {
1506 | "version": "1.0.2",
1507 | "resolved": "https://registry.npmjs.org/log-symbols/-/log-symbols-1.0.2.tgz",
1508 | "integrity": "sha1-N2/3tY6jCGoPCfrMdGF+ylAeGhg=",
1509 | "dev": true,
1510 | "requires": {
1511 | "chalk": "^1.0.0"
1512 | }
1513 | },
1514 | "strip-ansi": {
1515 | "version": "3.0.1",
1516 | "resolved": "https://registry.npmjs.org/strip-ansi/-/strip-ansi-3.0.1.tgz",
1517 | "integrity": "sha1-ajhfuIU9lS1f8F0Oiq+UJ43GPc8=",
1518 | "dev": true,
1519 | "requires": {
1520 | "ansi-regex": "^2.0.0"
1521 | }
1522 | },
1523 | "supports-color": {
1524 | "version": "2.0.0",
1525 | "resolved": "https://registry.npmjs.org/supports-color/-/supports-color-2.0.0.tgz",
1526 | "integrity": "sha1-U10EXOa2Nj+kARcIRimZXp3zJMc=",
1527 | "dev": true
1528 | }
1529 | }
1530 | },
1531 | "listr-verbose-renderer": {
1532 | "version": "0.4.0",
1533 | "resolved": "https://registry.npmjs.org/listr-verbose-renderer/-/listr-verbose-renderer-0.4.0.tgz",
1534 | "integrity": "sha1-RNwBuww0oDxXIVTU0Izemx3FYg8=",
1535 | "dev": true,
1536 | "requires": {
1537 | "chalk": "^1.1.3",
1538 | "cli-cursor": "^1.0.2",
1539 | "date-fns": "^1.27.2",
1540 | "figures": "^1.7.0"
1541 | },
1542 | "dependencies": {
1543 | "ansi-regex": {
1544 | "version": "2.1.1",
1545 | "resolved": "https://registry.npmjs.org/ansi-regex/-/ansi-regex-2.1.1.tgz",
1546 | "integrity": "sha1-w7M6te42DYbg5ijwRorn7yfWVN8=",
1547 | "dev": true
1548 | },
1549 | "ansi-styles": {
1550 | "version": "2.2.1",
1551 | "resolved": "https://registry.npmjs.org/ansi-styles/-/ansi-styles-2.2.1.tgz",
1552 | "integrity": "sha1-tDLdM1i2NM914eRmQ2gkBTPB3b4=",
1553 | "dev": true
1554 | },
1555 | "chalk": {
1556 | "version": "1.1.3",
1557 | "resolved": "https://registry.npmjs.org/chalk/-/chalk-1.1.3.tgz",
1558 | "integrity": "sha1-qBFcVeSnAv5NFQq9OHKCKn4J/Jg=",
1559 | "dev": true,
1560 | "requires": {
1561 | "ansi-styles": "^2.2.1",
1562 | "escape-string-regexp": "^1.0.2",
1563 | "has-ansi": "^2.0.0",
1564 | "strip-ansi": "^3.0.0",
1565 | "supports-color": "^2.0.0"
1566 | }
1567 | },
1568 | "strip-ansi": {
1569 | "version": "3.0.1",
1570 | "resolved": "https://registry.npmjs.org/strip-ansi/-/strip-ansi-3.0.1.tgz",
1571 | "integrity": "sha1-ajhfuIU9lS1f8F0Oiq+UJ43GPc8=",
1572 | "dev": true,
1573 | "requires": {
1574 | "ansi-regex": "^2.0.0"
1575 | }
1576 | },
1577 | "supports-color": {
1578 | "version": "2.0.0",
1579 | "resolved": "https://registry.npmjs.org/supports-color/-/supports-color-2.0.0.tgz",
1580 | "integrity": "sha1-U10EXOa2Nj+kARcIRimZXp3zJMc=",
1581 | "dev": true
1582 | }
1583 | }
1584 | },
1585 | "lodash": {
1586 | "version": "4.17.19",
1587 | "resolved": "https://registry.npmjs.org/lodash/-/lodash-4.17.19.tgz",
1588 | "integrity": "sha512-JNvd8XER9GQX0v2qJgsaN/mzFCNA5BRe/j8JN9d+tWyGLSodKQHKFicdwNYzWwI3wjRnaKPsGj1XkBjx/F96DQ=="
1589 | },
1590 | "log-symbols": {
1591 | "version": "2.1.0",
1592 | "resolved": "https://registry.npmjs.org/log-symbols/-/log-symbols-2.1.0.tgz",
1593 | "integrity": "sha512-zLeLrzMA1A2vRF1e/0Mo+LNINzi6jzBylHj5WqvQ/WK/5WCZt8si9SyN4p9llr/HRYvVR1AoXHRHl4WTHyQAzQ==",
1594 | "dev": true,
1595 | "requires": {
1596 | "chalk": "^2.0.1"
1597 | }
1598 | },
1599 | "log-update": {
1600 | "version": "1.0.2",
1601 | "resolved": "https://registry.npmjs.org/log-update/-/log-update-1.0.2.tgz",
1602 | "integrity": "sha1-GZKfZMQJPS0ucHWh2tivWcKWuNE=",
1603 | "dev": true,
1604 | "requires": {
1605 | "ansi-escapes": "^1.0.0",
1606 | "cli-cursor": "^1.0.2"
1607 | },
1608 | "dependencies": {
1609 | "ansi-escapes": {
1610 | "version": "1.4.0",
1611 | "resolved": "https://registry.npmjs.org/ansi-escapes/-/ansi-escapes-1.4.0.tgz",
1612 | "integrity": "sha1-06ioOzGapneTZisT52HHkRQiMG4=",
1613 | "dev": true
1614 | }
1615 | }
1616 | },
1617 | "lru-cache": {
1618 | "version": "4.1.1",
1619 | "resolved": "https://registry.npmjs.org/lru-cache/-/lru-cache-4.1.1.tgz",
1620 | "integrity": "sha1-Yi4y6CSItJJ5EUpPns9F581rulU=",
1621 | "requires": {
1622 | "pseudomap": "^1.0.2",
1623 | "yallist": "^2.1.2"
1624 | }
1625 | },
1626 | "mime-db": {
1627 | "version": "1.40.0",
1628 | "resolved": "https://registry.npmjs.org/mime-db/-/mime-db-1.40.0.tgz",
1629 | "integrity": "sha512-jYdeOMPy9vnxEqFRRo6ZvTZ8d9oPb+k18PKoYNYUe2stVEBPPwsln/qWzdbmaIvnhZ9v2P+CuecK+fpUfsV2mA=="
1630 | },
1631 | "mime-types": {
1632 | "version": "2.1.24",
1633 | "resolved": "https://registry.npmjs.org/mime-types/-/mime-types-2.1.24.tgz",
1634 | "integrity": "sha512-WaFHS3MCl5fapm3oLxU4eYDw77IQM2ACcxQ9RIxfaC3ooc6PFuBMGZZsYpvoXS5D5QTWPieo1jjLdAm3TBP3cQ==",
1635 | "requires": {
1636 | "mime-db": "1.40.0"
1637 | }
1638 | },
1639 | "minimatch": {
1640 | "version": "3.0.4",
1641 | "resolved": "https://registry.npmjs.org/minimatch/-/minimatch-3.0.4.tgz",
1642 | "integrity": "sha1-UWbihkV/AzBgZL5Ul+jbsMPTIIM=",
1643 | "dev": true,
1644 | "requires": {
1645 | "brace-expansion": "^1.1.7"
1646 | }
1647 | },
1648 | "mkpath": {
1649 | "version": "0.1.0",
1650 | "resolved": "https://registry.npmjs.org/mkpath/-/mkpath-0.1.0.tgz",
1651 | "integrity": "sha1-dVSm+Nhxg0zJe1RisSLEwSTW3pE="
1652 | },
1653 | "ms": {
1654 | "version": "2.1.1",
1655 | "resolved": "https://registry.npmjs.org/ms/-/ms-2.1.1.tgz",
1656 | "integrity": "sha512-tgp+dl5cGk28utYktBsrFqA7HKgrhgPsg6Z/EfhWI4gl1Hwq8B/GmY/0oXZ6nF8hDVesS/FpnYaD/kOWhYQvyg=="
1657 | },
1658 | "negotiator": {
1659 | "version": "0.6.2",
1660 | "resolved": "https://registry.npmjs.org/negotiator/-/negotiator-0.6.2.tgz",
1661 | "integrity": "sha512-hZXc7K2e+PgeI1eDBe/10Ard4ekbfrrqG8Ep+8Jmf4JID2bNg7NvCPOZN+kfF574pFQI7mum2AUqDidoKqcTOw=="
1662 | },
1663 | "ngrok": {
1664 | "version": "3.1.1",
1665 | "resolved": "https://registry.npmjs.org/ngrok/-/ngrok-3.1.1.tgz",
1666 | "integrity": "sha512-dCW/Ni12GRBL7XIyiFmilKOfCW7UVFf65I/HpE8FC5rXGJwdhIYLc9Qr05GRb6hNs6fZGwyLpcDLnDhUSgZasQ==",
1667 | "requires": {
1668 | "@types/node": "^8.10.30",
1669 | "decompress-zip": "^0.3.2",
1670 | "request": "^2.88.0",
1671 | "request-promise-native": "^1.0.5",
1672 | "uuid": "^3.3.2"
1673 | }
1674 | },
1675 | "nopt": {
1676 | "version": "3.0.6",
1677 | "resolved": "https://registry.npmjs.org/nopt/-/nopt-3.0.6.tgz",
1678 | "integrity": "sha1-xkZdvwirzU2zWTF/eaxopkayj/k=",
1679 | "requires": {
1680 | "abbrev": "1"
1681 | }
1682 | },
1683 | "npm-path": {
1684 | "version": "2.0.3",
1685 | "resolved": "https://registry.npmjs.org/npm-path/-/npm-path-2.0.3.tgz",
1686 | "integrity": "sha1-Fc/04ciaONp39W9gVbJPl137K74=",
1687 | "dev": true,
1688 | "requires": {
1689 | "which": "^1.2.10"
1690 | }
1691 | },
1692 | "npm-run-path": {
1693 | "version": "2.0.2",
1694 | "resolved": "https://registry.npmjs.org/npm-run-path/-/npm-run-path-2.0.2.tgz",
1695 | "integrity": "sha1-NakjLfo11wZ7TLLd8jV7GHFTbF8=",
1696 | "requires": {
1697 | "path-key": "^2.0.0"
1698 | }
1699 | },
1700 | "npm-which": {
1701 | "version": "3.0.1",
1702 | "resolved": "https://registry.npmjs.org/npm-which/-/npm-which-3.0.1.tgz",
1703 | "integrity": "sha1-kiXybsOihcIJyuZ8OxGmtKtxQKo=",
1704 | "dev": true,
1705 | "requires": {
1706 | "commander": "^2.9.0",
1707 | "npm-path": "^2.0.2",
1708 | "which": "^1.2.10"
1709 | }
1710 | },
1711 | "number-is-nan": {
1712 | "version": "1.0.1",
1713 | "resolved": "https://registry.npmjs.org/number-is-nan/-/number-is-nan-1.0.1.tgz",
1714 | "integrity": "sha1-CXtgK1NCKlIsGvuHkDGDNpQaAR0="
1715 | },
1716 | "oauth-sign": {
1717 | "version": "0.9.0",
1718 | "resolved": "https://registry.npmjs.org/oauth-sign/-/oauth-sign-0.9.0.tgz",
1719 | "integrity": "sha512-fexhUFFPTGV8ybAtSIGbV6gOkSv8UtRbDBnAyLQw4QPKkgNlsH2ByPGtMUqdWkos6YCRmAqViwgZrJc/mRDzZQ=="
1720 | },
1721 | "object-assign": {
1722 | "version": "4.1.1",
1723 | "resolved": "https://registry.npmjs.org/object-assign/-/object-assign-4.1.1.tgz",
1724 | "integrity": "sha1-IQmtx5ZYh8/AXLvUQsrIv7s2CGM=",
1725 | "dev": true
1726 | },
1727 | "object-component": {
1728 | "version": "0.0.3",
1729 | "resolved": "https://registry.npmjs.org/object-component/-/object-component-0.0.3.tgz",
1730 | "integrity": "sha1-8MaapQ78lbhmwYb0AKM3acsvEpE="
1731 | },
1732 | "onetime": {
1733 | "version": "1.1.0",
1734 | "resolved": "https://registry.npmjs.org/onetime/-/onetime-1.1.0.tgz",
1735 | "integrity": "sha1-ofeDj4MUxRbwXs78vEzP4EtO14k=",
1736 | "dev": true
1737 | },
1738 | "ora": {
1739 | "version": "0.2.3",
1740 | "resolved": "https://registry.npmjs.org/ora/-/ora-0.2.3.tgz",
1741 | "integrity": "sha1-N1J9Igrc1Tw5tzVx11QVbV22V6Q=",
1742 | "dev": true,
1743 | "requires": {
1744 | "chalk": "^1.1.1",
1745 | "cli-cursor": "^1.0.2",
1746 | "cli-spinners": "^0.1.2",
1747 | "object-assign": "^4.0.1"
1748 | },
1749 | "dependencies": {
1750 | "ansi-regex": {
1751 | "version": "2.1.1",
1752 | "resolved": "https://registry.npmjs.org/ansi-regex/-/ansi-regex-2.1.1.tgz",
1753 | "integrity": "sha1-w7M6te42DYbg5ijwRorn7yfWVN8=",
1754 | "dev": true
1755 | },
1756 | "ansi-styles": {
1757 | "version": "2.2.1",
1758 | "resolved": "https://registry.npmjs.org/ansi-styles/-/ansi-styles-2.2.1.tgz",
1759 | "integrity": "sha1-tDLdM1i2NM914eRmQ2gkBTPB3b4=",
1760 | "dev": true
1761 | },
1762 | "chalk": {
1763 | "version": "1.1.3",
1764 | "resolved": "https://registry.npmjs.org/chalk/-/chalk-1.1.3.tgz",
1765 | "integrity": "sha1-qBFcVeSnAv5NFQq9OHKCKn4J/Jg=",
1766 | "dev": true,
1767 | "requires": {
1768 | "ansi-styles": "^2.2.1",
1769 | "escape-string-regexp": "^1.0.2",
1770 | "has-ansi": "^2.0.0",
1771 | "strip-ansi": "^3.0.0",
1772 | "supports-color": "^2.0.0"
1773 | }
1774 | },
1775 | "strip-ansi": {
1776 | "version": "3.0.1",
1777 | "resolved": "https://registry.npmjs.org/strip-ansi/-/strip-ansi-3.0.1.tgz",
1778 | "integrity": "sha1-ajhfuIU9lS1f8F0Oiq+UJ43GPc8=",
1779 | "dev": true,
1780 | "requires": {
1781 | "ansi-regex": "^2.0.0"
1782 | }
1783 | },
1784 | "supports-color": {
1785 | "version": "2.0.0",
1786 | "resolved": "https://registry.npmjs.org/supports-color/-/supports-color-2.0.0.tgz",
1787 | "integrity": "sha1-U10EXOa2Nj+kARcIRimZXp3zJMc=",
1788 | "dev": true
1789 | }
1790 | }
1791 | },
1792 | "os-homedir": {
1793 | "version": "1.0.2",
1794 | "resolved": "https://registry.npmjs.org/os-homedir/-/os-homedir-1.0.2.tgz",
1795 | "integrity": "sha1-/7xJiDNuDoM94MFox+8VISGqf7M=",
1796 | "dev": true
1797 | },
1798 | "p-finally": {
1799 | "version": "1.0.0",
1800 | "resolved": "https://registry.npmjs.org/p-finally/-/p-finally-1.0.0.tgz",
1801 | "integrity": "sha1-P7z7FbiZpEEjs0ttzBi3JDNqLK4="
1802 | },
1803 | "p-map": {
1804 | "version": "1.2.0",
1805 | "resolved": "https://registry.npmjs.org/p-map/-/p-map-1.2.0.tgz",
1806 | "integrity": "sha512-r6zKACMNhjPJMTl8KcFH4li//gkrXWfbD6feV8l6doRHlzljFWGJ2AP6iKaCJXyZmAUMOPtvbW7EXkbWO/pLEA==",
1807 | "dev": true
1808 | },
1809 | "parse-json": {
1810 | "version": "2.2.0",
1811 | "resolved": "https://registry.npmjs.org/parse-json/-/parse-json-2.2.0.tgz",
1812 | "integrity": "sha1-9ID0BDTvgHQfhGkJn43qGPVaTck=",
1813 | "dev": true,
1814 | "requires": {
1815 | "error-ex": "^1.2.0"
1816 | }
1817 | },
1818 | "parseqs": {
1819 | "version": "0.0.5",
1820 | "resolved": "https://registry.npmjs.org/parseqs/-/parseqs-0.0.5.tgz",
1821 | "integrity": "sha1-1SCKNzjkZ2bikbouoXNoSSGouJ0=",
1822 | "requires": {
1823 | "better-assert": "~1.0.0"
1824 | }
1825 | },
1826 | "parseuri": {
1827 | "version": "0.0.5",
1828 | "resolved": "https://registry.npmjs.org/parseuri/-/parseuri-0.0.5.tgz",
1829 | "integrity": "sha1-gCBKUNTbt3m/3G6+J3jZDkvOMgo=",
1830 | "requires": {
1831 | "better-assert": "~1.0.0"
1832 | }
1833 | },
1834 | "path-key": {
1835 | "version": "2.0.1",
1836 | "resolved": "https://registry.npmjs.org/path-key/-/path-key-2.0.1.tgz",
1837 | "integrity": "sha1-QRyttXTFoUDTpLGRDUDYDMn0C0A="
1838 | },
1839 | "performance-now": {
1840 | "version": "2.1.0",
1841 | "resolved": "https://registry.npmjs.org/performance-now/-/performance-now-2.1.0.tgz",
1842 | "integrity": "sha1-Ywn04OX6kT7BxpMHrjZLSzd8nns="
1843 | },
1844 | "pinkie": {
1845 | "version": "2.0.4",
1846 | "resolved": "https://registry.npmjs.org/pinkie/-/pinkie-2.0.4.tgz",
1847 | "integrity": "sha1-clVrgM+g1IqXToDnckjoDtT3+HA=",
1848 | "dev": true
1849 | },
1850 | "pinkie-promise": {
1851 | "version": "2.0.1",
1852 | "resolved": "https://registry.npmjs.org/pinkie-promise/-/pinkie-promise-2.0.1.tgz",
1853 | "integrity": "sha1-ITXW36ejWMBprJsXh3YogihFD/o=",
1854 | "dev": true,
1855 | "requires": {
1856 | "pinkie": "^2.0.0"
1857 | }
1858 | },
1859 | "prettier": {
1860 | "version": "1.7.4",
1861 | "resolved": "https://registry.npmjs.org/prettier/-/prettier-1.7.4.tgz",
1862 | "integrity": "sha1-XoYkrpNjyA+V7GRFhOzfVddPk/o=",
1863 | "dev": true
1864 | },
1865 | "pretty-format": {
1866 | "version": "21.2.1",
1867 | "resolved": "https://registry.npmjs.org/pretty-format/-/pretty-format-21.2.1.tgz",
1868 | "integrity": "sha512-ZdWPGYAnYfcVP8yKA3zFjCn8s4/17TeYH28MXuC8vTp0o21eXjbFGcOAXZEaDaOFJjc3h2qa7HQNHNshhvoh2A==",
1869 | "dev": true,
1870 | "requires": {
1871 | "ansi-regex": "^3.0.0",
1872 | "ansi-styles": "^3.2.0"
1873 | }
1874 | },
1875 | "pseudomap": {
1876 | "version": "1.0.2",
1877 | "resolved": "https://registry.npmjs.org/pseudomap/-/pseudomap-1.0.2.tgz",
1878 | "integrity": "sha1-8FKijacOYYkX7wqKw0wa5aaChrM="
1879 | },
1880 | "psl": {
1881 | "version": "1.1.32",
1882 | "resolved": "https://registry.npmjs.org/psl/-/psl-1.1.32.tgz",
1883 | "integrity": "sha512-MHACAkHpihU/REGGPLj4sEfc/XKW2bheigvHO1dUqjaKigMp1C8+WLQYRGgeKFMsw5PMfegZcaN8IDXK/cD0+g=="
1884 | },
1885 | "punycode": {
1886 | "version": "2.1.1",
1887 | "resolved": "https://registry.npmjs.org/punycode/-/punycode-2.1.1.tgz",
1888 | "integrity": "sha512-XRsRjdf+j5ml+y/6GKHPZbrF/8p2Yga0JPtdqTIY2Xe5ohJPD9saDJJLPvp9+NSBprVvevdXZybnj2cv8OEd0A=="
1889 | },
1890 | "q": {
1891 | "version": "1.5.1",
1892 | "resolved": "https://registry.npmjs.org/q/-/q-1.5.1.tgz",
1893 | "integrity": "sha1-fjL3W0E4EpHQRhHxvxQQmsAGUdc="
1894 | },
1895 | "qs": {
1896 | "version": "6.5.2",
1897 | "resolved": "https://registry.npmjs.org/qs/-/qs-6.5.2.tgz",
1898 | "integrity": "sha512-N5ZAX4/LxJmF+7wN74pUD6qAh9/wnvdQcjq9TZjevvXzSUo7bfmw91saqMjzGS2xq91/odN2dW/WOl7qQHNDGA=="
1899 | },
1900 | "readable-stream": {
1901 | "version": "1.1.14",
1902 | "resolved": "https://registry.npmjs.org/readable-stream/-/readable-stream-1.1.14.tgz",
1903 | "integrity": "sha1-fPTFTvZI44EwhMY23SB54WbAgdk=",
1904 | "requires": {
1905 | "core-util-is": "~1.0.0",
1906 | "inherits": "~2.0.1",
1907 | "isarray": "0.0.1",
1908 | "string_decoder": "~0.10.x"
1909 | },
1910 | "dependencies": {
1911 | "isarray": {
1912 | "version": "0.0.1",
1913 | "resolved": "https://registry.npmjs.org/isarray/-/isarray-0.0.1.tgz",
1914 | "integrity": "sha1-ihis/Kmo9Bd+Cav8YDiTmwXR7t8="
1915 | }
1916 | }
1917 | },
1918 | "repeating": {
1919 | "version": "2.0.1",
1920 | "resolved": "https://registry.npmjs.org/repeating/-/repeating-2.0.1.tgz",
1921 | "integrity": "sha1-UhTFOpJtNVJwdSf7q0FdvAjQbdo=",
1922 | "dev": true,
1923 | "requires": {
1924 | "is-finite": "^1.0.0"
1925 | }
1926 | },
1927 | "request": {
1928 | "version": "2.88.0",
1929 | "resolved": "https://registry.npmjs.org/request/-/request-2.88.0.tgz",
1930 | "integrity": "sha512-NAqBSrijGLZdM0WZNsInLJpkJokL72XYjUpnB0iwsRgxh7dB6COrHnTBNwN0E+lHDAJzu7kLAkDeY08z2/A0hg==",
1931 | "requires": {
1932 | "aws-sign2": "~0.7.0",
1933 | "aws4": "^1.8.0",
1934 | "caseless": "~0.12.0",
1935 | "combined-stream": "~1.0.6",
1936 | "extend": "~3.0.2",
1937 | "forever-agent": "~0.6.1",
1938 | "form-data": "~2.3.2",
1939 | "har-validator": "~5.1.0",
1940 | "http-signature": "~1.2.0",
1941 | "is-typedarray": "~1.0.0",
1942 | "isstream": "~0.1.2",
1943 | "json-stringify-safe": "~5.0.1",
1944 | "mime-types": "~2.1.19",
1945 | "oauth-sign": "~0.9.0",
1946 | "performance-now": "^2.1.0",
1947 | "qs": "~6.5.2",
1948 | "safe-buffer": "^5.1.2",
1949 | "tough-cookie": "~2.4.3",
1950 | "tunnel-agent": "^0.6.0",
1951 | "uuid": "^3.3.2"
1952 | }
1953 | },
1954 | "request-promise-core": {
1955 | "version": "1.1.2",
1956 | "resolved": "https://registry.npmjs.org/request-promise-core/-/request-promise-core-1.1.2.tgz",
1957 | "integrity": "sha512-UHYyq1MO8GsefGEt7EprS8UrXsm1TxEvFUX1IMTuSLU2Rh7fTIdFtl8xD7JiEYiWU2dl+NYAjCTksTehQUxPag==",
1958 | "requires": {
1959 | "lodash": "^4.17.11"
1960 | }
1961 | },
1962 | "request-promise-native": {
1963 | "version": "1.0.7",
1964 | "resolved": "https://registry.npmjs.org/request-promise-native/-/request-promise-native-1.0.7.tgz",
1965 | "integrity": "sha512-rIMnbBdgNViL37nZ1b3L/VfPOpSi0TqVDQPAvO6U14lMzOLrt5nilxCQqtDKhZeDiW0/hkCXGoQjhgJd/tCh6w==",
1966 | "requires": {
1967 | "request-promise-core": "1.1.2",
1968 | "stealthy-require": "^1.1.1",
1969 | "tough-cookie": "^2.3.3"
1970 | }
1971 | },
1972 | "require-from-string": {
1973 | "version": "1.2.1",
1974 | "resolved": "https://registry.npmjs.org/require-from-string/-/require-from-string-1.2.1.tgz",
1975 | "integrity": "sha1-UpyczvJzgK3+yaL5ZbZJu+5jZBg=",
1976 | "dev": true
1977 | },
1978 | "restore-cursor": {
1979 | "version": "1.0.1",
1980 | "resolved": "https://registry.npmjs.org/restore-cursor/-/restore-cursor-1.0.1.tgz",
1981 | "integrity": "sha1-NGYfRohjJ/7SmRR5FSJS35LapUE=",
1982 | "dev": true,
1983 | "requires": {
1984 | "exit-hook": "^1.0.0",
1985 | "onetime": "^1.0.0"
1986 | }
1987 | },
1988 | "rxjs": {
1989 | "version": "5.4.3",
1990 | "resolved": "https://registry.npmjs.org/rxjs/-/rxjs-5.4.3.tgz",
1991 | "integrity": "sha512-fSNi+y+P9ss+EZuV0GcIIqPUK07DEaMRUtLJvdcvMyFjc9dizuDjere+A4V7JrLGnm9iCc+nagV/4QdMTkqC4A==",
1992 | "dev": true,
1993 | "requires": {
1994 | "symbol-observable": "^1.0.1"
1995 | }
1996 | },
1997 | "safe-buffer": {
1998 | "version": "5.1.2",
1999 | "resolved": "https://registry.npmjs.org/safe-buffer/-/safe-buffer-5.1.2.tgz",
2000 | "integrity": "sha512-Gd2UZBJDkXlY7GbJxfsE8/nvKkUEU1G38c1siN6QP6a9PT9MmHB8GnpscSmMJSoF8LOIrt8ud/wPtojys4G6+g=="
2001 | },
2002 | "safer-buffer": {
2003 | "version": "2.1.2",
2004 | "resolved": "https://registry.npmjs.org/safer-buffer/-/safer-buffer-2.1.2.tgz",
2005 | "integrity": "sha512-YZo3K82SD7Riyi0E1EQPojLz7kpepnSQI9IyPbHHg1XXXevb5dJI7tpyN2ADxGcQbHG7vcyRHk0cbwqcQriUtg=="
2006 | },
2007 | "shebang-command": {
2008 | "version": "1.2.0",
2009 | "resolved": "https://registry.npmjs.org/shebang-command/-/shebang-command-1.2.0.tgz",
2010 | "integrity": "sha1-RKrGW2lbAzmJaMOfNj/uXer98eo=",
2011 | "requires": {
2012 | "shebang-regex": "^1.0.0"
2013 | }
2014 | },
2015 | "shebang-regex": {
2016 | "version": "1.0.0",
2017 | "resolved": "https://registry.npmjs.org/shebang-regex/-/shebang-regex-1.0.0.tgz",
2018 | "integrity": "sha1-2kL0l0DAtC2yypcoVxyxkMmO/qM="
2019 | },
2020 | "signal-exit": {
2021 | "version": "3.0.2",
2022 | "resolved": "https://registry.npmjs.org/signal-exit/-/signal-exit-3.0.2.tgz",
2023 | "integrity": "sha1-tf3AjxKH6hF4Yo5BXiUTK3NkbG0="
2024 | },
2025 | "slice-ansi": {
2026 | "version": "0.0.4",
2027 | "resolved": "https://registry.npmjs.org/slice-ansi/-/slice-ansi-0.0.4.tgz",
2028 | "integrity": "sha1-7b+JA/ZvfOL46v1s7tZeJkyDGzU=",
2029 | "dev": true
2030 | },
2031 | "socket.io": {
2032 | "version": "2.2.0",
2033 | "resolved": "https://registry.npmjs.org/socket.io/-/socket.io-2.2.0.tgz",
2034 | "integrity": "sha512-wxXrIuZ8AILcn+f1B4ez4hJTPG24iNgxBBDaJfT6MsyOhVYiTXWexGoPkd87ktJG8kQEcL/NBvRi64+9k4Kc0w==",
2035 | "requires": {
2036 | "debug": "~4.1.0",
2037 | "engine.io": "~3.3.1",
2038 | "has-binary2": "~1.0.2",
2039 | "socket.io-adapter": "~1.1.0",
2040 | "socket.io-client": "2.2.0",
2041 | "socket.io-parser": "~3.3.0"
2042 | }
2043 | },
2044 | "socket.io-adapter": {
2045 | "version": "1.1.1",
2046 | "resolved": "https://registry.npmjs.org/socket.io-adapter/-/socket.io-adapter-1.1.1.tgz",
2047 | "integrity": "sha1-KoBeihTWNyEk3ZFZrUUC+MsH8Gs="
2048 | },
2049 | "socket.io-client": {
2050 | "version": "2.2.0",
2051 | "resolved": "https://registry.npmjs.org/socket.io-client/-/socket.io-client-2.2.0.tgz",
2052 | "integrity": "sha512-56ZrkTDbdTLmBIyfFYesgOxsjcLnwAKoN4CiPyTVkMQj3zTUh0QAx3GbvIvLpFEOvQWu92yyWICxB0u7wkVbYA==",
2053 | "requires": {
2054 | "backo2": "1.0.2",
2055 | "base64-arraybuffer": "0.1.5",
2056 | "component-bind": "1.0.0",
2057 | "component-emitter": "1.2.1",
2058 | "debug": "~3.1.0",
2059 | "engine.io-client": "~3.3.1",
2060 | "has-binary2": "~1.0.2",
2061 | "has-cors": "1.1.0",
2062 | "indexof": "0.0.1",
2063 | "object-component": "0.0.3",
2064 | "parseqs": "0.0.5",
2065 | "parseuri": "0.0.5",
2066 | "socket.io-parser": "~3.3.0",
2067 | "to-array": "0.1.4"
2068 | },
2069 | "dependencies": {
2070 | "debug": {
2071 | "version": "3.1.0",
2072 | "resolved": "https://registry.npmjs.org/debug/-/debug-3.1.0.tgz",
2073 | "integrity": "sha512-OX8XqP7/1a9cqkxYw2yXss15f26NKWBpDXQd0/uK/KPqdQhxbPa994hnzjcE2VqQpDslf55723cKPUOGSmMY3g==",
2074 | "requires": {
2075 | "ms": "2.0.0"
2076 | }
2077 | },
2078 | "ms": {
2079 | "version": "2.0.0",
2080 | "resolved": "https://registry.npmjs.org/ms/-/ms-2.0.0.tgz",
2081 | "integrity": "sha1-VgiurfwAvmwpAd9fmGF4jeDVl8g="
2082 | }
2083 | }
2084 | },
2085 | "socket.io-parser": {
2086 | "version": "3.3.0",
2087 | "resolved": "https://registry.npmjs.org/socket.io-parser/-/socket.io-parser-3.3.0.tgz",
2088 | "integrity": "sha512-hczmV6bDgdaEbVqhAeVMM/jfUfzuEZHsQg6eOmLgJht6G3mPKMxYm75w2+qhAQZ+4X+1+ATZ+QFKeOZD5riHng==",
2089 | "requires": {
2090 | "component-emitter": "1.2.1",
2091 | "debug": "~3.1.0",
2092 | "isarray": "2.0.1"
2093 | },
2094 | "dependencies": {
2095 | "debug": {
2096 | "version": "3.1.0",
2097 | "resolved": "https://registry.npmjs.org/debug/-/debug-3.1.0.tgz",
2098 | "integrity": "sha512-OX8XqP7/1a9cqkxYw2yXss15f26NKWBpDXQd0/uK/KPqdQhxbPa994hnzjcE2VqQpDslf55723cKPUOGSmMY3g==",
2099 | "requires": {
2100 | "ms": "2.0.0"
2101 | }
2102 | },
2103 | "ms": {
2104 | "version": "2.0.0",
2105 | "resolved": "https://registry.npmjs.org/ms/-/ms-2.0.0.tgz",
2106 | "integrity": "sha1-VgiurfwAvmwpAd9fmGF4jeDVl8g="
2107 | }
2108 | }
2109 | },
2110 | "sprintf-js": {
2111 | "version": "1.0.3",
2112 | "resolved": "https://registry.npmjs.org/sprintf-js/-/sprintf-js-1.0.3.tgz",
2113 | "integrity": "sha1-BOaSb2YolTVPPdAVIDYzuFcpfiw=",
2114 | "dev": true
2115 | },
2116 | "sshpk": {
2117 | "version": "1.16.1",
2118 | "resolved": "https://registry.npmjs.org/sshpk/-/sshpk-1.16.1.tgz",
2119 | "integrity": "sha512-HXXqVUq7+pcKeLqqZj6mHFUMvXtOJt1uoUx09pFW6011inTMxqI8BA8PM95myrIyyKwdnzjdFjLiE6KBPVtJIg==",
2120 | "requires": {
2121 | "asn1": "~0.2.3",
2122 | "assert-plus": "^1.0.0",
2123 | "bcrypt-pbkdf": "^1.0.0",
2124 | "dashdash": "^1.12.0",
2125 | "ecc-jsbn": "~0.1.1",
2126 | "getpass": "^0.1.1",
2127 | "jsbn": "~0.1.0",
2128 | "safer-buffer": "^2.0.2",
2129 | "tweetnacl": "~0.14.0"
2130 | }
2131 | },
2132 | "staged-git-files": {
2133 | "version": "0.0.4",
2134 | "resolved": "https://registry.npmjs.org/staged-git-files/-/staged-git-files-0.0.4.tgz",
2135 | "integrity": "sha1-15fhtVHKemOd7AI33G60u5vhfTU=",
2136 | "dev": true
2137 | },
2138 | "stealthy-require": {
2139 | "version": "1.1.1",
2140 | "resolved": "https://registry.npmjs.org/stealthy-require/-/stealthy-require-1.1.1.tgz",
2141 | "integrity": "sha1-NbCYdbT/SfJqd35QmzCQoyJr8ks="
2142 | },
2143 | "stream-to-observable": {
2144 | "version": "0.1.0",
2145 | "resolved": "https://registry.npmjs.org/stream-to-observable/-/stream-to-observable-0.1.0.tgz",
2146 | "integrity": "sha1-Rb8dny19wJvtgfHDB8Qw5ouEz/4=",
2147 | "dev": true
2148 | },
2149 | "string-width": {
2150 | "version": "2.1.1",
2151 | "resolved": "https://registry.npmjs.org/string-width/-/string-width-2.1.1.tgz",
2152 | "integrity": "sha512-nOqH59deCq9SRHlxq1Aw85Jnt4w6KvLKqWVik6oA9ZklXLNIOlqg4F2yrT1MVaTjAqvVwdfeZ7w7aCvJD7ugkw==",
2153 | "requires": {
2154 | "is-fullwidth-code-point": "^2.0.0",
2155 | "strip-ansi": "^4.0.0"
2156 | }
2157 | },
2158 | "string_decoder": {
2159 | "version": "0.10.31",
2160 | "resolved": "https://registry.npmjs.org/string_decoder/-/string_decoder-0.10.31.tgz",
2161 | "integrity": "sha1-YuIDvEF2bGwoyfyEMB2rHFMQ+pQ="
2162 | },
2163 | "stringify-object": {
2164 | "version": "3.2.1",
2165 | "resolved": "https://registry.npmjs.org/stringify-object/-/stringify-object-3.2.1.tgz",
2166 | "integrity": "sha512-jPcQYw/52HUPP8uOE4kkjxl5bB9LfHkKCTptIk3qw7ozP5XMIMlHMLjt00GGSwW6DJAf/njY5EU6Vpwl4LlBKQ==",
2167 | "dev": true,
2168 | "requires": {
2169 | "get-own-enumerable-property-symbols": "^2.0.1",
2170 | "is-obj": "^1.0.1",
2171 | "is-regexp": "^1.0.0"
2172 | }
2173 | },
2174 | "strip-ansi": {
2175 | "version": "4.0.0",
2176 | "resolved": "https://registry.npmjs.org/strip-ansi/-/strip-ansi-4.0.0.tgz",
2177 | "integrity": "sha1-qEeQIusaw2iocTibY1JixQXuNo8=",
2178 | "requires": {
2179 | "ansi-regex": "^3.0.0"
2180 | }
2181 | },
2182 | "strip-eof": {
2183 | "version": "1.0.0",
2184 | "resolved": "https://registry.npmjs.org/strip-eof/-/strip-eof-1.0.0.tgz",
2185 | "integrity": "sha1-u0P/VZim6wXYm1n80SnJgzE2Br8="
2186 | },
2187 | "strip-indent": {
2188 | "version": "2.0.0",
2189 | "resolved": "https://registry.npmjs.org/strip-indent/-/strip-indent-2.0.0.tgz",
2190 | "integrity": "sha1-XvjbKV0B5u1sv3qrlpmNeCJSe2g=",
2191 | "dev": true
2192 | },
2193 | "stripe": {
2194 | "version": "4.25.0",
2195 | "resolved": "https://registry.npmjs.org/stripe/-/stripe-4.25.0.tgz",
2196 | "integrity": "sha512-sSRPSQ4BTSbdcevVSrtIJzlOCTIAXm8T38DE4zPL6ysYpIWGfIBdo2XnhouLK12/6cuLvaEInlfCZQgoEVzXpQ==",
2197 | "requires": {
2198 | "bluebird": "^2.10.2",
2199 | "lodash.isplainobject": "^4.0.6",
2200 | "object-assign": "^4.1.0",
2201 | "qs": "~6.0.4"
2202 | },
2203 | "dependencies": {
2204 | "bluebird": {
2205 | "version": "2.11.0",
2206 | "resolved": "https://registry.npmjs.org/bluebird/-/bluebird-2.11.0.tgz",
2207 | "integrity": "sha1-U0uQM8AiyVecVro7Plpcqvu2UOE="
2208 | },
2209 | "lodash.isplainobject": {
2210 | "version": "4.0.6",
2211 | "resolved": "https://registry.npmjs.org/lodash.isplainobject/-/lodash.isplainobject-4.0.6.tgz",
2212 | "integrity": "sha1-fFJqUtibRcRcxpC4gWO+BJf1UMs="
2213 | },
2214 | "object-assign": {
2215 | "version": "4.1.1",
2216 | "resolved": "https://registry.npmjs.org/object-assign/-/object-assign-4.1.1.tgz",
2217 | "integrity": "sha1-IQmtx5ZYh8/AXLvUQsrIv7s2CGM="
2218 | },
2219 | "qs": {
2220 | "version": "6.0.4",
2221 | "resolved": "https://registry.npmjs.org/qs/-/qs-6.0.4.tgz",
2222 | "integrity": "sha1-UQGdhHIMk5uCc36EVWp4Izjs6ns="
2223 | }
2224 | }
2225 | },
2226 | "supports-color": {
2227 | "version": "4.4.0",
2228 | "resolved": "https://registry.npmjs.org/supports-color/-/supports-color-4.4.0.tgz",
2229 | "integrity": "sha512-rKC3+DyXWgK0ZLKwmRsrkyHVZAjNkfzeehuFWdGGcqGDTZFH73+RH6S/RDAAxl9GusSjZSUWYLmT9N5pzXFOXQ==",
2230 | "requires": {
2231 | "has-flag": "^2.0.0"
2232 | }
2233 | },
2234 | "symbol-observable": {
2235 | "version": "1.0.4",
2236 | "resolved": "https://registry.npmjs.org/symbol-observable/-/symbol-observable-1.0.4.tgz",
2237 | "integrity": "sha1-Kb9hXUqnEhvdiYsi1LP5vE4qoD0=",
2238 | "dev": true
2239 | },
2240 | "term-size": {
2241 | "version": "1.2.0",
2242 | "resolved": "https://registry.npmjs.org/term-size/-/term-size-1.2.0.tgz",
2243 | "integrity": "sha1-RYuDiH8oj8Vtb/+/rSYuJmOO+mk=",
2244 | "requires": {
2245 | "execa": "^0.7.0"
2246 | }
2247 | },
2248 | "to-array": {
2249 | "version": "0.1.4",
2250 | "resolved": "https://registry.npmjs.org/to-array/-/to-array-0.1.4.tgz",
2251 | "integrity": "sha1-F+bBH3PdTz10zaek/zI46a2b+JA="
2252 | },
2253 | "touch": {
2254 | "version": "0.0.3",
2255 | "resolved": "https://registry.npmjs.org/touch/-/touch-0.0.3.tgz",
2256 | "integrity": "sha1-Ua7z1ElXHU8oel2Hyci0kYGg2x0=",
2257 | "requires": {
2258 | "nopt": "~1.0.10"
2259 | },
2260 | "dependencies": {
2261 | "nopt": {
2262 | "version": "1.0.10",
2263 | "resolved": "https://registry.npmjs.org/nopt/-/nopt-1.0.10.tgz",
2264 | "integrity": "sha1-bd0hvSoxQXuScn3Vhfim83YI6+4=",
2265 | "requires": {
2266 | "abbrev": "1"
2267 | }
2268 | }
2269 | }
2270 | },
2271 | "tough-cookie": {
2272 | "version": "2.4.3",
2273 | "resolved": "https://registry.npmjs.org/tough-cookie/-/tough-cookie-2.4.3.tgz",
2274 | "integrity": "sha512-Q5srk/4vDM54WJsJio3XNn6K2sCG+CQ8G5Wz6bZhRZoAe/+TxjWB/GlFAnYEbkYVlON9FMk/fE3h2RLpPXo4lQ==",
2275 | "requires": {
2276 | "psl": "^1.1.24",
2277 | "punycode": "^1.4.1"
2278 | },
2279 | "dependencies": {
2280 | "punycode": {
2281 | "version": "1.4.1",
2282 | "resolved": "https://registry.npmjs.org/punycode/-/punycode-1.4.1.tgz",
2283 | "integrity": "sha1-wNWmOycYgArY4esPpSachN1BhF4="
2284 | }
2285 | }
2286 | },
2287 | "traverse": {
2288 | "version": "0.3.9",
2289 | "resolved": "https://registry.npmjs.org/traverse/-/traverse-0.3.9.tgz",
2290 | "integrity": "sha1-cXuPIgzAu3tE5AUUwisui7xw2Lk="
2291 | },
2292 | "tunnel-agent": {
2293 | "version": "0.6.0",
2294 | "resolved": "https://registry.npmjs.org/tunnel-agent/-/tunnel-agent-0.6.0.tgz",
2295 | "integrity": "sha1-J6XeoGs2sEoKmWZ3SykIaPD8QP0=",
2296 | "requires": {
2297 | "safe-buffer": "^5.0.1"
2298 | }
2299 | },
2300 | "tweetnacl": {
2301 | "version": "0.14.5",
2302 | "resolved": "https://registry.npmjs.org/tweetnacl/-/tweetnacl-0.14.5.tgz",
2303 | "integrity": "sha1-WuaBd/GS1EViadEIr6k/+HQ/T2Q="
2304 | },
2305 | "uri-js": {
2306 | "version": "4.2.2",
2307 | "resolved": "https://registry.npmjs.org/uri-js/-/uri-js-4.2.2.tgz",
2308 | "integrity": "sha512-KY9Frmirql91X2Qgjry0Wd4Y+YTdrdZheS8TFwvkbLWf/G5KNJDCh6pKL5OZctEW4+0Baa5idK2ZQuELRwPznQ==",
2309 | "requires": {
2310 | "punycode": "^2.1.0"
2311 | }
2312 | },
2313 | "uuid": {
2314 | "version": "3.3.2",
2315 | "resolved": "https://registry.npmjs.org/uuid/-/uuid-3.3.2.tgz",
2316 | "integrity": "sha512-yXJmeNaw3DnnKAOKJE51sL/ZaYfWJRl1pK9dr19YFCu0ObS231AB1/LbqTKRAQ5kw8A90rA6fr4riOUpTZvQZA=="
2317 | },
2318 | "verror": {
2319 | "version": "1.10.0",
2320 | "resolved": "https://registry.npmjs.org/verror/-/verror-1.10.0.tgz",
2321 | "integrity": "sha1-OhBcoXBTr1XW4nDB+CiGguGNpAA=",
2322 | "requires": {
2323 | "assert-plus": "^1.0.0",
2324 | "core-util-is": "1.0.2",
2325 | "extsprintf": "^1.2.0"
2326 | }
2327 | },
2328 | "which": {
2329 | "version": "1.3.0",
2330 | "resolved": "https://registry.npmjs.org/which/-/which-1.3.0.tgz",
2331 | "integrity": "sha512-xcJpopdamTuY5duC/KnTTNBraPK54YwpenP4lzxU8H91GudWpFv38u0CKjclE1Wi2EH2EDz5LRcHcKbCIzqGyg==",
2332 | "requires": {
2333 | "isexe": "^2.0.0"
2334 | }
2335 | },
2336 | "widest-line": {
2337 | "version": "1.0.0",
2338 | "resolved": "https://registry.npmjs.org/widest-line/-/widest-line-1.0.0.tgz",
2339 | "integrity": "sha1-DAnIXCqUaD0Nfq+O4JfVZL8OEFw=",
2340 | "requires": {
2341 | "string-width": "^1.0.1"
2342 | },
2343 | "dependencies": {
2344 | "ansi-regex": {
2345 | "version": "2.1.1",
2346 | "resolved": "https://registry.npmjs.org/ansi-regex/-/ansi-regex-2.1.1.tgz",
2347 | "integrity": "sha1-w7M6te42DYbg5ijwRorn7yfWVN8="
2348 | },
2349 | "is-fullwidth-code-point": {
2350 | "version": "1.0.0",
2351 | "resolved": "https://registry.npmjs.org/is-fullwidth-code-point/-/is-fullwidth-code-point-1.0.0.tgz",
2352 | "integrity": "sha1-754xOG8DGn8NZDr4L95QxFfvAMs=",
2353 | "requires": {
2354 | "number-is-nan": "^1.0.0"
2355 | }
2356 | },
2357 | "string-width": {
2358 | "version": "1.0.2",
2359 | "resolved": "https://registry.npmjs.org/string-width/-/string-width-1.0.2.tgz",
2360 | "integrity": "sha1-EYvfW4zcUaKn5w0hHgfisLmxB9M=",
2361 | "requires": {
2362 | "code-point-at": "^1.0.0",
2363 | "is-fullwidth-code-point": "^1.0.0",
2364 | "strip-ansi": "^3.0.0"
2365 | }
2366 | },
2367 | "strip-ansi": {
2368 | "version": "3.0.1",
2369 | "resolved": "https://registry.npmjs.org/strip-ansi/-/strip-ansi-3.0.1.tgz",
2370 | "integrity": "sha1-ajhfuIU9lS1f8F0Oiq+UJ43GPc8=",
2371 | "requires": {
2372 | "ansi-regex": "^2.0.0"
2373 | }
2374 | }
2375 | }
2376 | },
2377 | "ws": {
2378 | "version": "6.1.4",
2379 | "resolved": "https://registry.npmjs.org/ws/-/ws-6.1.4.tgz",
2380 | "integrity": "sha512-eqZfL+NE/YQc1/ZynhojeV8q+H050oR8AZ2uIev7RU10svA9ZnJUddHcOUZTJLinZ9yEfdA2kSATS2qZK5fhJA==",
2381 | "requires": {
2382 | "async-limiter": "~1.0.0"
2383 | }
2384 | },
2385 | "xmlhttprequest-ssl": {
2386 | "version": "1.5.5",
2387 | "resolved": "https://registry.npmjs.org/xmlhttprequest-ssl/-/xmlhttprequest-ssl-1.5.5.tgz",
2388 | "integrity": "sha1-wodrBhaKrcQOV9l+gRkayPQ5iz4="
2389 | },
2390 | "yallist": {
2391 | "version": "2.1.2",
2392 | "resolved": "https://registry.npmjs.org/yallist/-/yallist-2.1.2.tgz",
2393 | "integrity": "sha1-HBH5IY8HYImkfdUS+TxmmaaoHVI="
2394 | },
2395 | "yeast": {
2396 | "version": "0.1.2",
2397 | "resolved": "https://registry.npmjs.org/yeast/-/yeast-0.1.2.tgz",
2398 | "integrity": "sha1-AI4G2AlDIMNy28L47XagymyKxBk="
2399 | }
2400 | }
2401 | }
2402 |
--------------------------------------------------------------------------------
/package.json:
--------------------------------------------------------------------------------
1 | {
2 | "name": "stripe-webhook-monitor",
3 | "version": "1.0.0",
4 | "description": "Realtime monitor for Stripe webhooks.",
5 | "author": "Michael Glukhovsky
8 |
9 | Stripe's platform includes [webhooks](https://stripe.com/docs/webhooks) that will notify you when actions take place on your account. For example, you can be notified when:
10 |
11 | - New charges are created (`charge.created`)
12 | - Customers subscribe to a new plan (`customer.subscription.created`)
13 | - Payouts and transfers are completed (`payout.paid`)
14 | - An invoice payment failed (`invoice.payment_failed`)
15 |
16 | Webhooks are powerful: you can subscribe to these notifications and programmatically react to them in real-time.
17 |
18 | ## Getting started
19 |
20 | ### Requirements
21 | You'll need to have Node v7.6+ installed, which includes support for `async` / `await`.
22 |
23 | ### Set up the monitor
24 | Clone the project repository, and create a configuration for your Stripe account:
25 |
26 | ```
27 | cp config.sample.js config.js
28 | ```
29 |
30 | You'll need to fill in your Stripe secret key.
31 |
32 | Webhooks require a public URL that Stripe will ping to notify the monitor of new events. Support for [ngrok](https://ngrok.com/) is included out of the box: ngrok will create a secure tunnel and provide a public URL to your local machine.
33 |
34 | If you have a [__Basic__](https://ngrok.com/pricing) ngrok subscription, you can specify a custom subdomain that will stay reserved for your account.
35 |
36 | ### Start receiving changes
37 |
38 | To start the monitor:
39 |
40 | ```
41 | npm install
42 | npm start
43 | ```
44 |
45 | Take note of the public URL provided by ngrok: it should be listed when the monitor starts.
46 |
47 | **Don't want to use ngrok?** As long as Stripe can reach the webhooks endpoint via a public URL, you'll receive updates.
48 |
49 | ### Subscribe to webhook notifications
50 |
51 | In your Stripe Dashboard, go to the _API_ section, then click on the _Webhooks_ tab.
52 |
53 | You should add a receiving endpoint by clicking _Add Endpoint_. Fill in the public URL provided by ngrok, or any other public URL that can reach the webhook monitor.
54 |
55 | 
56 |
57 | ## Troubleshooting
58 |
59 | ### I'm not receiving real-time updates
60 |
61 | - Check that the [Stripe Dashboard](https://dashboard.stripe.com/webhooks/) is listing your webhook route as _Enabled_.
62 | - Make sure that the webhook endpoint matches the URL printed in your console.
63 |
64 | ## Credits
65 |
66 | - Code: [Michael Glukhovsky](https://twitter.com/mglukhovsky)
67 | - Icons: [Ionicons](http://ionicons.com/)
68 |
--------------------------------------------------------------------------------
/config.sample.js:
--------------------------------------------------------------------------------
1 | 'use strict';
2 |
3 | module.exports = {
4 | port: 4000,
5 | stripe: {
6 | // Include your Stripe secret key here
7 | secretKey: 'YOUR_STRIPE_SECRET_KEY'
8 | },
9 | /*
10 | Stripe needs a public URL for our server that it can ping with new events.
11 | If ngrok is enabled, this server will create a public endpoint for you.
12 | */
13 | ngrok: {
14 | enabled: true,
15 | /*
16 | Optional: if you have a Pro ngrok account you can provide a custom
17 | subdomain and your authentication token here.
18 | */
19 | subdomain: null,
20 | authtoken: null
21 | }
22 | }
23 |
--------------------------------------------------------------------------------
/package-lock.json:
--------------------------------------------------------------------------------
1 | {
2 | "name": "stripe-webhook-monitor",
3 | "version": "1.0.0",
4 | "lockfileVersion": 1,
5 | "requires": true,
6 | "dependencies": {
7 | "@types/node": {
8 | "version": "8.10.49",
9 | "resolved": "https://registry.npmjs.org/@types/node/-/node-8.10.49.tgz",
10 | "integrity": "sha512-YX30JVx0PvSmJ3Eqr74fYLGeBxD+C7vIL20ek+GGGLJeUbVYRUW3EzyAXpIRA0K8c8o0UWqR/GwEFYiFoz1T8w=="
11 | },
12 | "abbrev": {
13 | "version": "1.1.1",
14 | "resolved": "https://registry.npmjs.org/abbrev/-/abbrev-1.1.1.tgz",
15 | "integrity": "sha512-nne9/IiQ/hzIhY6pdDnbBtz7DjPTKrY00P/zvPSm5pOFkl6xuGrGnXn/VtTNNfNtAfZ9/1RtehkszU9qcTii0Q=="
16 | },
17 | "accepts": {
18 | "version": "1.3.7",
19 | "resolved": "https://registry.npmjs.org/accepts/-/accepts-1.3.7.tgz",
20 | "integrity": "sha512-Il80Qs2WjYlJIBNzNkK6KYqlVMTbZLXgHx2oT0pU/fjRHyEp+PEfEPY0R3WCwAGVOtauxh1hOxNgIf5bv7dQpA==",
21 | "requires": {
22 | "mime-types": "~2.1.24",
23 | "negotiator": "0.6.2"
24 | }
25 | },
26 | "after": {
27 | "version": "0.8.2",
28 | "resolved": "https://registry.npmjs.org/after/-/after-0.8.2.tgz",
29 | "integrity": "sha1-/ts5T58OAqqXaOcCvaI7UF+ufh8="
30 | },
31 | "ajv": {
32 | "version": "6.10.0",
33 | "resolved": "https://registry.npmjs.org/ajv/-/ajv-6.10.0.tgz",
34 | "integrity": "sha512-nffhOpkymDECQyR0mnsUtoCE8RlX38G0rYP+wgLWFyZuUyuuojSSvi/+euOiQBIn63whYwYVIIH1TvE3tu4OEg==",
35 | "requires": {
36 | "fast-deep-equal": "^2.0.1",
37 | "fast-json-stable-stringify": "^2.0.0",
38 | "json-schema-traverse": "^0.4.1",
39 | "uri-js": "^4.2.2"
40 | }
41 | },
42 | "ansi-align": {
43 | "version": "2.0.0",
44 | "resolved": "https://registry.npmjs.org/ansi-align/-/ansi-align-2.0.0.tgz",
45 | "integrity": "sha1-w2rsy6VjuJzrVW82kPCx2eNUf38=",
46 | "requires": {
47 | "string-width": "^2.0.0"
48 | }
49 | },
50 | "ansi-regex": {
51 | "version": "3.0.0",
52 | "resolved": "https://registry.npmjs.org/ansi-regex/-/ansi-regex-3.0.0.tgz",
53 | "integrity": "sha1-7QMXwyIGT3lGbAKWa922Bas32Zg="
54 | },
55 | "ansi-styles": {
56 | "version": "3.2.0",
57 | "resolved": "https://registry.npmjs.org/ansi-styles/-/ansi-styles-3.2.0.tgz",
58 | "integrity": "sha512-NnSOmMEYtVR2JVMIGTzynRkkaxtiq1xnFBcdQD/DnNCYPoEPsVJhM98BDyaoNOQIi7p4okdi3E27eN7GQbsUug==",
59 | "requires": {
60 | "color-convert": "^1.9.0"
61 | }
62 | },
63 | "app-root-path": {
64 | "version": "2.0.1",
65 | "resolved": "https://registry.npmjs.org/app-root-path/-/app-root-path-2.0.1.tgz",
66 | "integrity": "sha1-zWLc+OT9WkF+/GZNLlsQZTxlG0Y=",
67 | "dev": true
68 | },
69 | "argparse": {
70 | "version": "1.0.9",
71 | "resolved": "https://registry.npmjs.org/argparse/-/argparse-1.0.9.tgz",
72 | "integrity": "sha1-c9g7wmP4bpf4zE9rrhsOkKfSLIY=",
73 | "dev": true,
74 | "requires": {
75 | "sprintf-js": "~1.0.2"
76 | }
77 | },
78 | "arraybuffer.slice": {
79 | "version": "0.0.7",
80 | "resolved": "https://registry.npmjs.org/arraybuffer.slice/-/arraybuffer.slice-0.0.7.tgz",
81 | "integrity": "sha512-wGUIVQXuehL5TCqQun8OW81jGzAWycqzFF8lFp+GOM5BXLYj3bKNsYC4daB7n6XjCqxQA/qgTJ+8ANR3acjrog=="
82 | },
83 | "asn1": {
84 | "version": "0.2.4",
85 | "resolved": "https://registry.npmjs.org/asn1/-/asn1-0.2.4.tgz",
86 | "integrity": "sha512-jxwzQpLQjSmWXgwaCZE9Nz+glAG01yF1QnWgbhGwHI5A6FRIEY6IVqtHhIepHqI7/kyEyQEagBC5mBEFlIYvdg==",
87 | "requires": {
88 | "safer-buffer": "~2.1.0"
89 | }
90 | },
91 | "assert-plus": {
92 | "version": "1.0.0",
93 | "resolved": "https://registry.npmjs.org/assert-plus/-/assert-plus-1.0.0.tgz",
94 | "integrity": "sha1-8S4PPF13sLHN2RRpQuTpbB5N1SU="
95 | },
96 | "async-limiter": {
97 | "version": "1.0.0",
98 | "resolved": "https://registry.npmjs.org/async-limiter/-/async-limiter-1.0.0.tgz",
99 | "integrity": "sha512-jp/uFnooOiO+L211eZOoSyzpOITMXx1rBITauYykG3BRYPu8h0UcxsPNB04RR5vo4Tyz3+ay17tR6JVf9qzYWg=="
100 | },
101 | "asynckit": {
102 | "version": "0.4.0",
103 | "resolved": "https://registry.npmjs.org/asynckit/-/asynckit-0.4.0.tgz",
104 | "integrity": "sha1-x57Zf380y48robyXkLzDZkdLS3k="
105 | },
106 | "aws-sign2": {
107 | "version": "0.7.0",
108 | "resolved": "https://registry.npmjs.org/aws-sign2/-/aws-sign2-0.7.0.tgz",
109 | "integrity": "sha1-tG6JCTSpWR8tL2+G1+ap8bP+dqg="
110 | },
111 | "aws4": {
112 | "version": "1.8.0",
113 | "resolved": "https://registry.npmjs.org/aws4/-/aws4-1.8.0.tgz",
114 | "integrity": "sha512-ReZxvNHIOv88FlT7rxcXIIC0fPt4KZqZbOlivyWtXLt8ESx84zd3kMC6iK5jVeS2qt+g7ftS7ye4fi06X5rtRQ=="
115 | },
116 | "backo2": {
117 | "version": "1.0.2",
118 | "resolved": "https://registry.npmjs.org/backo2/-/backo2-1.0.2.tgz",
119 | "integrity": "sha1-MasayLEpNjRj41s+u2n038+6eUc="
120 | },
121 | "balanced-match": {
122 | "version": "1.0.0",
123 | "resolved": "https://registry.npmjs.org/balanced-match/-/balanced-match-1.0.0.tgz",
124 | "integrity": "sha1-ibTRmasr7kneFk6gK4nORi1xt2c=",
125 | "dev": true
126 | },
127 | "base64-arraybuffer": {
128 | "version": "0.1.5",
129 | "resolved": "https://registry.npmjs.org/base64-arraybuffer/-/base64-arraybuffer-0.1.5.tgz",
130 | "integrity": "sha1-c5JncZI7Whl0etZmqlzUv5xunOg="
131 | },
132 | "base64id": {
133 | "version": "1.0.0",
134 | "resolved": "https://registry.npmjs.org/base64id/-/base64id-1.0.0.tgz",
135 | "integrity": "sha1-R2iMuZu2gE8OBtPnY7HDLlfY5rY="
136 | },
137 | "bcrypt-pbkdf": {
138 | "version": "1.0.2",
139 | "resolved": "https://registry.npmjs.org/bcrypt-pbkdf/-/bcrypt-pbkdf-1.0.2.tgz",
140 | "integrity": "sha1-pDAdOJtqQ/m2f/PKEaP2Y342Dp4=",
141 | "requires": {
142 | "tweetnacl": "^0.14.3"
143 | }
144 | },
145 | "better-assert": {
146 | "version": "1.0.2",
147 | "resolved": "https://registry.npmjs.org/better-assert/-/better-assert-1.0.2.tgz",
148 | "integrity": "sha1-QIZrnhueC1W0gYlDEeaPr/rrxSI=",
149 | "requires": {
150 | "callsite": "1.0.0"
151 | }
152 | },
153 | "binary": {
154 | "version": "0.3.0",
155 | "resolved": "https://registry.npmjs.org/binary/-/binary-0.3.0.tgz",
156 | "integrity": "sha1-n2BVO8XOjDOG87VTz/R0Yq3sqnk=",
157 | "requires": {
158 | "buffers": "~0.1.1",
159 | "chainsaw": "~0.1.0"
160 | }
161 | },
162 | "blob": {
163 | "version": "0.0.5",
164 | "resolved": "https://registry.npmjs.org/blob/-/blob-0.0.5.tgz",
165 | "integrity": "sha512-gaqbzQPqOoamawKg0LGVd7SzLgXS+JH61oWprSLH+P+abTczqJbhTR8CmJ2u9/bUYNmHTGJx/UEmn6doAvvuig=="
166 | },
167 | "body-parser": {
168 | "version": "1.18.2",
169 | "resolved": "https://registry.npmjs.org/body-parser/-/body-parser-1.18.2.tgz",
170 | "integrity": "sha1-h2eKGdhLR9hZuDGZvVm84iKxBFQ=",
171 | "requires": {
172 | "bytes": "3.0.0",
173 | "content-type": "~1.0.4",
174 | "debug": "2.6.9",
175 | "depd": "~1.1.1",
176 | "http-errors": "~1.6.2",
177 | "iconv-lite": "0.4.19",
178 | "on-finished": "~2.3.0",
179 | "qs": "6.5.1",
180 | "raw-body": "2.3.2",
181 | "type-is": "~1.6.15"
182 | },
183 | "dependencies": {
184 | "bytes": {
185 | "version": "3.0.0",
186 | "resolved": "https://registry.npmjs.org/bytes/-/bytes-3.0.0.tgz",
187 | "integrity": "sha1-0ygVQE1olpn4Wk6k+odV3ROpYEg="
188 | },
189 | "content-type": {
190 | "version": "1.0.4",
191 | "resolved": "https://registry.npmjs.org/content-type/-/content-type-1.0.4.tgz",
192 | "integrity": "sha512-hIP3EEPs8tB9AT1L+NUqtwOAps4mk2Zob89MWXMHjHWg9milF/j4osnnQLXBCBFBk/tvIG/tUc9mOUJiPBhPXA=="
193 | },
194 | "debug": {
195 | "version": "2.6.9",
196 | "resolved": "https://registry.npmjs.org/debug/-/debug-2.6.9.tgz",
197 | "integrity": "sha512-bC7ElrdJaJnPbAP+1EotYvqZsb3ecl5wi6Bfi6BJTUcNowp6cvspg0jXznRTKDjm/E7AdgFBVeAPVMNcKGsHMA==",
198 | "requires": {
199 | "ms": "2.0.0"
200 | }
201 | },
202 | "depd": {
203 | "version": "1.1.1",
204 | "resolved": "https://registry.npmjs.org/depd/-/depd-1.1.1.tgz",
205 | "integrity": "sha1-V4O04cRZ8G+lyif5kfPQbnoxA1k="
206 | },
207 | "ee-first": {
208 | "version": "1.1.1",
209 | "resolved": "https://registry.npmjs.org/ee-first/-/ee-first-1.1.1.tgz",
210 | "integrity": "sha1-WQxhFWsK4vTwJVcyoViyZrxWsh0="
211 | },
212 | "http-errors": {
213 | "version": "1.6.2",
214 | "resolved": "https://registry.npmjs.org/http-errors/-/http-errors-1.6.2.tgz",
215 | "integrity": "sha1-CgAsyFcHGSp+eUbO7cERVfYOxzY=",
216 | "requires": {
217 | "depd": "1.1.1",
218 | "inherits": "2.0.3",
219 | "setprototypeof": "1.0.3",
220 | "statuses": ">= 1.3.1 < 2"
221 | }
222 | },
223 | "iconv-lite": {
224 | "version": "0.4.19",
225 | "resolved": "https://registry.npmjs.org/iconv-lite/-/iconv-lite-0.4.19.tgz",
226 | "integrity": "sha512-oTZqweIP51xaGPI4uPa56/Pri/480R+mo7SeU+YETByQNhDG55ycFyNLIgta9vXhILrxXDmF7ZGhqZIcuN0gJQ=="
227 | },
228 | "inherits": {
229 | "version": "2.0.3",
230 | "resolved": "https://registry.npmjs.org/inherits/-/inherits-2.0.3.tgz",
231 | "integrity": "sha1-Yzwsg+PaQqUC9SRmAiSA9CCCYd4="
232 | },
233 | "media-typer": {
234 | "version": "0.3.0",
235 | "resolved": "https://registry.npmjs.org/media-typer/-/media-typer-0.3.0.tgz",
236 | "integrity": "sha1-hxDXrwqmJvj/+hzgAWhUUmMlV0g="
237 | },
238 | "mime-db": {
239 | "version": "1.30.0",
240 | "resolved": "https://registry.npmjs.org/mime-db/-/mime-db-1.30.0.tgz",
241 | "integrity": "sha1-dMZD2i3Z1qRTmZY0ZbJtXKfXHwE="
242 | },
243 | "mime-types": {
244 | "version": "2.1.17",
245 | "resolved": "https://registry.npmjs.org/mime-types/-/mime-types-2.1.17.tgz",
246 | "integrity": "sha1-Cdejk/A+mVp5+K+Fe3Cp4KsWVXo=",
247 | "requires": {
248 | "mime-db": "~1.30.0"
249 | }
250 | },
251 | "ms": {
252 | "version": "2.0.0",
253 | "resolved": "https://registry.npmjs.org/ms/-/ms-2.0.0.tgz",
254 | "integrity": "sha1-VgiurfwAvmwpAd9fmGF4jeDVl8g="
255 | },
256 | "on-finished": {
257 | "version": "2.3.0",
258 | "resolved": "https://registry.npmjs.org/on-finished/-/on-finished-2.3.0.tgz",
259 | "integrity": "sha1-IPEzZIGwg811M3mSoWlxqi2QaUc=",
260 | "requires": {
261 | "ee-first": "1.1.1"
262 | }
263 | },
264 | "qs": {
265 | "version": "6.5.1",
266 | "resolved": "https://registry.npmjs.org/qs/-/qs-6.5.1.tgz",
267 | "integrity": "sha512-eRzhrN1WSINYCDCbrz796z37LOe3m5tmW7RQf6oBntukAG1nmovJvhnwHHRMAfeoItc1m2Hk02WER2aQ/iqs+A=="
268 | },
269 | "raw-body": {
270 | "version": "2.3.2",
271 | "resolved": "https://registry.npmjs.org/raw-body/-/raw-body-2.3.2.tgz",
272 | "integrity": "sha1-vNYMd9Prk83gBQKVw/N5OJvIj4k=",
273 | "requires": {
274 | "bytes": "3.0.0",
275 | "http-errors": "1.6.2",
276 | "iconv-lite": "0.4.19",
277 | "unpipe": "1.0.0"
278 | }
279 | },
280 | "setprototypeof": {
281 | "version": "1.0.3",
282 | "resolved": "https://registry.npmjs.org/setprototypeof/-/setprototypeof-1.0.3.tgz",
283 | "integrity": "sha1-ZlZ+NwQ+608E2RvWWMDL77VbjgQ="
284 | },
285 | "statuses": {
286 | "version": "1.3.1",
287 | "resolved": "https://registry.npmjs.org/statuses/-/statuses-1.3.1.tgz",
288 | "integrity": "sha1-+vUbnrdKrvOzrPStX2Gr8ky3uT4="
289 | },
290 | "type-is": {
291 | "version": "1.6.15",
292 | "resolved": "https://registry.npmjs.org/type-is/-/type-is-1.6.15.tgz",
293 | "integrity": "sha1-yrEPtJCeRByChC6v4a1kbIGARBA=",
294 | "requires": {
295 | "media-typer": "0.3.0",
296 | "mime-types": "~2.1.15"
297 | }
298 | },
299 | "unpipe": {
300 | "version": "1.0.0",
301 | "resolved": "https://registry.npmjs.org/unpipe/-/unpipe-1.0.0.tgz",
302 | "integrity": "sha1-sr9O6FFKrmFltIF4KdIbLvSZBOw="
303 | }
304 | }
305 | },
306 | "boxen": {
307 | "version": "1.2.1",
308 | "resolved": "https://registry.npmjs.org/boxen/-/boxen-1.2.1.tgz",
309 | "integrity": "sha1-DxHn/jRO25OXl3/BPt5/ZNlWSB0=",
310 | "requires": {
311 | "ansi-align": "^2.0.0",
312 | "camelcase": "^4.0.0",
313 | "chalk": "^2.0.1",
314 | "cli-boxes": "^1.0.0",
315 | "string-width": "^2.0.0",
316 | "term-size": "^1.2.0",
317 | "widest-line": "^1.0.0"
318 | }
319 | },
320 | "brace-expansion": {
321 | "version": "1.1.8",
322 | "resolved": "https://registry.npmjs.org/brace-expansion/-/brace-expansion-1.1.8.tgz",
323 | "integrity": "sha1-wHshHHyVLsH479Uad+8NHTmQopI=",
324 | "dev": true,
325 | "requires": {
326 | "balanced-match": "^1.0.0",
327 | "concat-map": "0.0.1"
328 | }
329 | },
330 | "buffers": {
331 | "version": "0.1.1",
332 | "resolved": "https://registry.npmjs.org/buffers/-/buffers-0.1.1.tgz",
333 | "integrity": "sha1-skV5w77U1tOWru5tmorn9Ugqt7s="
334 | },
335 | "callsite": {
336 | "version": "1.0.0",
337 | "resolved": "https://registry.npmjs.org/callsite/-/callsite-1.0.0.tgz",
338 | "integrity": "sha1-KAOY5dZkvXQDi28JBRU+borxvCA="
339 | },
340 | "camelcase": {
341 | "version": "4.1.0",
342 | "resolved": "https://registry.npmjs.org/camelcase/-/camelcase-4.1.0.tgz",
343 | "integrity": "sha1-1UVjW+HjPFQmScaRc+Xeas+uNN0="
344 | },
345 | "caseless": {
346 | "version": "0.12.0",
347 | "resolved": "https://registry.npmjs.org/caseless/-/caseless-0.12.0.tgz",
348 | "integrity": "sha1-G2gcIf+EAzyCZUMJBolCDRhxUdw="
349 | },
350 | "chainsaw": {
351 | "version": "0.1.0",
352 | "resolved": "https://registry.npmjs.org/chainsaw/-/chainsaw-0.1.0.tgz",
353 | "integrity": "sha1-XqtQsor+WAdNDVgpE4iCi15fvJg=",
354 | "requires": {
355 | "traverse": ">=0.3.0 <0.4"
356 | }
357 | },
358 | "chalk": {
359 | "version": "2.1.0",
360 | "resolved": "https://registry.npmjs.org/chalk/-/chalk-2.1.0.tgz",
361 | "integrity": "sha512-LUHGS/dge4ujbXMJrnihYMcL4AoOweGnw9Tp3kQuqy1Kx5c1qKjqvMJZ6nVJPMWJtKCTN72ZogH3oeSO9g9rXQ==",
362 | "requires": {
363 | "ansi-styles": "^3.1.0",
364 | "escape-string-regexp": "^1.0.5",
365 | "supports-color": "^4.0.0"
366 | }
367 | },
368 | "ci-info": {
369 | "version": "1.1.1",
370 | "resolved": "https://registry.npmjs.org/ci-info/-/ci-info-1.1.1.tgz",
371 | "integrity": "sha512-vHDDF/bP9RYpTWtUhpJRhCFdvvp3iDWvEbuDbWgvjUrNGV1MXJrE0MPcwGtEled04m61iwdBLUIHZtDgzWS4ZQ==",
372 | "dev": true
373 | },
374 | "cli-boxes": {
375 | "version": "1.0.0",
376 | "resolved": "https://registry.npmjs.org/cli-boxes/-/cli-boxes-1.0.0.tgz",
377 | "integrity": "sha1-T6kXw+WclKAEzWH47lCdplFocUM="
378 | },
379 | "cli-cursor": {
380 | "version": "1.0.2",
381 | "resolved": "https://registry.npmjs.org/cli-cursor/-/cli-cursor-1.0.2.tgz",
382 | "integrity": "sha1-ZNo/fValRBLll5S9Ytw1KV6PKYc=",
383 | "dev": true,
384 | "requires": {
385 | "restore-cursor": "^1.0.1"
386 | }
387 | },
388 | "cli-spinners": {
389 | "version": "0.1.2",
390 | "resolved": "https://registry.npmjs.org/cli-spinners/-/cli-spinners-0.1.2.tgz",
391 | "integrity": "sha1-u3ZNiOGF+54eaiofGXcjGPYF4xw=",
392 | "dev": true
393 | },
394 | "cli-truncate": {
395 | "version": "0.2.1",
396 | "resolved": "https://registry.npmjs.org/cli-truncate/-/cli-truncate-0.2.1.tgz",
397 | "integrity": "sha1-nxXPuwcFAFNpIWxiasfQWrkN1XQ=",
398 | "dev": true,
399 | "requires": {
400 | "slice-ansi": "0.0.4",
401 | "string-width": "^1.0.1"
402 | },
403 | "dependencies": {
404 | "ansi-regex": {
405 | "version": "2.1.1",
406 | "resolved": "https://registry.npmjs.org/ansi-regex/-/ansi-regex-2.1.1.tgz",
407 | "integrity": "sha1-w7M6te42DYbg5ijwRorn7yfWVN8=",
408 | "dev": true
409 | },
410 | "is-fullwidth-code-point": {
411 | "version": "1.0.0",
412 | "resolved": "https://registry.npmjs.org/is-fullwidth-code-point/-/is-fullwidth-code-point-1.0.0.tgz",
413 | "integrity": "sha1-754xOG8DGn8NZDr4L95QxFfvAMs=",
414 | "dev": true,
415 | "requires": {
416 | "number-is-nan": "^1.0.0"
417 | }
418 | },
419 | "string-width": {
420 | "version": "1.0.2",
421 | "resolved": "https://registry.npmjs.org/string-width/-/string-width-1.0.2.tgz",
422 | "integrity": "sha1-EYvfW4zcUaKn5w0hHgfisLmxB9M=",
423 | "dev": true,
424 | "requires": {
425 | "code-point-at": "^1.0.0",
426 | "is-fullwidth-code-point": "^1.0.0",
427 | "strip-ansi": "^3.0.0"
428 | }
429 | },
430 | "strip-ansi": {
431 | "version": "3.0.1",
432 | "resolved": "https://registry.npmjs.org/strip-ansi/-/strip-ansi-3.0.1.tgz",
433 | "integrity": "sha1-ajhfuIU9lS1f8F0Oiq+UJ43GPc8=",
434 | "dev": true,
435 | "requires": {
436 | "ansi-regex": "^2.0.0"
437 | }
438 | }
439 | }
440 | },
441 | "code-point-at": {
442 | "version": "1.1.0",
443 | "resolved": "https://registry.npmjs.org/code-point-at/-/code-point-at-1.1.0.tgz",
444 | "integrity": "sha1-DQcLTQQ6W+ozovGkDi7bPZpMz3c="
445 | },
446 | "color-convert": {
447 | "version": "1.9.0",
448 | "resolved": "https://registry.npmjs.org/color-convert/-/color-convert-1.9.0.tgz",
449 | "integrity": "sha1-Gsz5fdc5uYO/mU1W/sj5WFNkG3o=",
450 | "requires": {
451 | "color-name": "^1.1.1"
452 | }
453 | },
454 | "color-name": {
455 | "version": "1.1.3",
456 | "resolved": "https://registry.npmjs.org/color-name/-/color-name-1.1.3.tgz",
457 | "integrity": "sha1-p9BVi9icQveV3UIyj3QIMcpTvCU="
458 | },
459 | "combined-stream": {
460 | "version": "1.0.8",
461 | "resolved": "https://registry.npmjs.org/combined-stream/-/combined-stream-1.0.8.tgz",
462 | "integrity": "sha512-FQN4MRfuJeHf7cBbBMJFXhKSDq+2kAArBlmRBvcvFE5BB1HZKXtSFASDhdlz9zOYwxh8lDdnvmMOe/+5cdoEdg==",
463 | "requires": {
464 | "delayed-stream": "~1.0.0"
465 | }
466 | },
467 | "commander": {
468 | "version": "2.11.0",
469 | "resolved": "https://registry.npmjs.org/commander/-/commander-2.11.0.tgz",
470 | "integrity": "sha512-b0553uYA5YAEGgyYIGYROzKQ7X5RAqedkfjiZxwi0kL1g3bOaBNNZfYkzt/CL0umgD5wc9Jec2FbB98CjkMRvQ==",
471 | "dev": true
472 | },
473 | "component-bind": {
474 | "version": "1.0.0",
475 | "resolved": "https://registry.npmjs.org/component-bind/-/component-bind-1.0.0.tgz",
476 | "integrity": "sha1-AMYIq33Nk4l8AAllGx06jh5zu9E="
477 | },
478 | "component-emitter": {
479 | "version": "1.2.1",
480 | "resolved": "https://registry.npmjs.org/component-emitter/-/component-emitter-1.2.1.tgz",
481 | "integrity": "sha1-E3kY1teCg/ffemt8WmPhQOaUJeY="
482 | },
483 | "component-inherit": {
484 | "version": "0.0.3",
485 | "resolved": "https://registry.npmjs.org/component-inherit/-/component-inherit-0.0.3.tgz",
486 | "integrity": "sha1-ZF/ErfWLcrZJ1crmUTVhnbJv8UM="
487 | },
488 | "concat-map": {
489 | "version": "0.0.1",
490 | "resolved": "https://registry.npmjs.org/concat-map/-/concat-map-0.0.1.tgz",
491 | "integrity": "sha1-2Klr13/Wjfd5OnMDajug1UBdR3s=",
492 | "dev": true
493 | },
494 | "cookie": {
495 | "version": "0.3.1",
496 | "resolved": "https://registry.npmjs.org/cookie/-/cookie-0.3.1.tgz",
497 | "integrity": "sha1-5+Ch+e9DtMi6klxcWpboBtFoc7s="
498 | },
499 | "core-util-is": {
500 | "version": "1.0.2",
501 | "resolved": "https://registry.npmjs.org/core-util-is/-/core-util-is-1.0.2.tgz",
502 | "integrity": "sha1-tf1UIgqivFq1eqtxQMlAdUUDwac="
503 | },
504 | "cosmiconfig": {
505 | "version": "1.1.0",
506 | "resolved": "https://registry.npmjs.org/cosmiconfig/-/cosmiconfig-1.1.0.tgz",
507 | "integrity": "sha1-DeoPmATv37kp+7GxiOJVU+oFPTc=",
508 | "dev": true,
509 | "requires": {
510 | "graceful-fs": "^4.1.2",
511 | "js-yaml": "^3.4.3",
512 | "minimist": "^1.2.0",
513 | "object-assign": "^4.0.1",
514 | "os-homedir": "^1.0.1",
515 | "parse-json": "^2.2.0",
516 | "pinkie-promise": "^2.0.0",
517 | "require-from-string": "^1.1.0"
518 | },
519 | "dependencies": {
520 | "minimist": {
521 | "version": "1.2.0",
522 | "resolved": "https://registry.npmjs.org/minimist/-/minimist-1.2.0.tgz",
523 | "integrity": "sha1-o1AIsg9BOD7sH7kU9M1d95omQoQ=",
524 | "dev": true
525 | }
526 | }
527 | },
528 | "cross-spawn": {
529 | "version": "5.1.0",
530 | "resolved": "https://registry.npmjs.org/cross-spawn/-/cross-spawn-5.1.0.tgz",
531 | "integrity": "sha1-6L0O/uWPz/b4+UUQoKVUu/ojVEk=",
532 | "requires": {
533 | "lru-cache": "^4.0.1",
534 | "shebang-command": "^1.2.0",
535 | "which": "^1.2.9"
536 | }
537 | },
538 | "dashdash": {
539 | "version": "1.14.1",
540 | "resolved": "https://registry.npmjs.org/dashdash/-/dashdash-1.14.1.tgz",
541 | "integrity": "sha1-hTz6D3y+L+1d4gMmuN1YEDX24vA=",
542 | "requires": {
543 | "assert-plus": "^1.0.0"
544 | }
545 | },
546 | "date-fns": {
547 | "version": "1.29.0",
548 | "resolved": "https://registry.npmjs.org/date-fns/-/date-fns-1.29.0.tgz",
549 | "integrity": "sha512-lbTXWZ6M20cWH8N9S6afb0SBm6tMk+uUg6z3MqHPKE9atmsY3kJkTm8vKe93izJ2B2+q5MV990sM2CHgtAZaOw==",
550 | "dev": true
551 | },
552 | "debug": {
553 | "version": "4.1.1",
554 | "resolved": "https://registry.npmjs.org/debug/-/debug-4.1.1.tgz",
555 | "integrity": "sha512-pYAIzeRo8J6KPEaJ0VWOh5Pzkbw/RetuzehGM7QRRX5he4fPHx2rdKMB256ehJCkX+XRQm16eZLqLNS8RSZXZw==",
556 | "requires": {
557 | "ms": "^2.1.1"
558 | }
559 | },
560 | "decompress-zip": {
561 | "version": "0.3.2",
562 | "resolved": "https://registry.npmjs.org/decompress-zip/-/decompress-zip-0.3.2.tgz",
563 | "integrity": "sha512-Ab1QY4LrWMrUuo53lLnmGOby7v8ryqxJ+bKibKSiPisx+25mhut1dScVBXAYx14i/PqSrFZvR2FRRazhLbvL+g==",
564 | "requires": {
565 | "binary": "^0.3.0",
566 | "graceful-fs": "^4.1.3",
567 | "mkpath": "^0.1.0",
568 | "nopt": "^3.0.1",
569 | "q": "^1.1.2",
570 | "readable-stream": "^1.1.8",
571 | "touch": "0.0.3"
572 | }
573 | },
574 | "delayed-stream": {
575 | "version": "1.0.0",
576 | "resolved": "https://registry.npmjs.org/delayed-stream/-/delayed-stream-1.0.0.tgz",
577 | "integrity": "sha1-3zrhmayt+31ECqrgsp4icrJOxhk="
578 | },
579 | "ecc-jsbn": {
580 | "version": "0.1.2",
581 | "resolved": "https://registry.npmjs.org/ecc-jsbn/-/ecc-jsbn-0.1.2.tgz",
582 | "integrity": "sha1-OoOpBOVDUyh4dMVkt1SThoSamMk=",
583 | "requires": {
584 | "jsbn": "~0.1.0",
585 | "safer-buffer": "^2.1.0"
586 | }
587 | },
588 | "elegant-spinner": {
589 | "version": "1.0.1",
590 | "resolved": "https://registry.npmjs.org/elegant-spinner/-/elegant-spinner-1.0.1.tgz",
591 | "integrity": "sha1-2wQ1IcldfjA/2PNFvtwzSc+wcp4=",
592 | "dev": true
593 | },
594 | "engine.io": {
595 | "version": "3.3.2",
596 | "resolved": "https://registry.npmjs.org/engine.io/-/engine.io-3.3.2.tgz",
597 | "integrity": "sha512-AsaA9KG7cWPXWHp5FvHdDWY3AMWeZ8x+2pUVLcn71qE5AtAzgGbxuclOytygskw8XGmiQafTmnI9Bix3uihu2w==",
598 | "requires": {
599 | "accepts": "~1.3.4",
600 | "base64id": "1.0.0",
601 | "cookie": "0.3.1",
602 | "debug": "~3.1.0",
603 | "engine.io-parser": "~2.1.0",
604 | "ws": "~6.1.0"
605 | },
606 | "dependencies": {
607 | "debug": {
608 | "version": "3.1.0",
609 | "resolved": "https://registry.npmjs.org/debug/-/debug-3.1.0.tgz",
610 | "integrity": "sha512-OX8XqP7/1a9cqkxYw2yXss15f26NKWBpDXQd0/uK/KPqdQhxbPa994hnzjcE2VqQpDslf55723cKPUOGSmMY3g==",
611 | "requires": {
612 | "ms": "2.0.0"
613 | }
614 | },
615 | "ms": {
616 | "version": "2.0.0",
617 | "resolved": "https://registry.npmjs.org/ms/-/ms-2.0.0.tgz",
618 | "integrity": "sha1-VgiurfwAvmwpAd9fmGF4jeDVl8g="
619 | }
620 | }
621 | },
622 | "engine.io-client": {
623 | "version": "3.3.2",
624 | "resolved": "https://registry.npmjs.org/engine.io-client/-/engine.io-client-3.3.2.tgz",
625 | "integrity": "sha512-y0CPINnhMvPuwtqXfsGuWE8BB66+B6wTtCofQDRecMQPYX3MYUZXFNKDhdrSe3EVjgOu4V3rxdeqN/Tr91IgbQ==",
626 | "requires": {
627 | "component-emitter": "1.2.1",
628 | "component-inherit": "0.0.3",
629 | "debug": "~3.1.0",
630 | "engine.io-parser": "~2.1.1",
631 | "has-cors": "1.1.0",
632 | "indexof": "0.0.1",
633 | "parseqs": "0.0.5",
634 | "parseuri": "0.0.5",
635 | "ws": "~6.1.0",
636 | "xmlhttprequest-ssl": "~1.5.4",
637 | "yeast": "0.1.2"
638 | },
639 | "dependencies": {
640 | "debug": {
641 | "version": "3.1.0",
642 | "resolved": "https://registry.npmjs.org/debug/-/debug-3.1.0.tgz",
643 | "integrity": "sha512-OX8XqP7/1a9cqkxYw2yXss15f26NKWBpDXQd0/uK/KPqdQhxbPa994hnzjcE2VqQpDslf55723cKPUOGSmMY3g==",
644 | "requires": {
645 | "ms": "2.0.0"
646 | }
647 | },
648 | "ms": {
649 | "version": "2.0.0",
650 | "resolved": "https://registry.npmjs.org/ms/-/ms-2.0.0.tgz",
651 | "integrity": "sha1-VgiurfwAvmwpAd9fmGF4jeDVl8g="
652 | }
653 | }
654 | },
655 | "engine.io-parser": {
656 | "version": "2.1.3",
657 | "resolved": "https://registry.npmjs.org/engine.io-parser/-/engine.io-parser-2.1.3.tgz",
658 | "integrity": "sha512-6HXPre2O4Houl7c4g7Ic/XzPnHBvaEmN90vtRO9uLmwtRqQmTOw0QMevL1TOfL2Cpu1VzsaTmMotQgMdkzGkVA==",
659 | "requires": {
660 | "after": "0.8.2",
661 | "arraybuffer.slice": "~0.0.7",
662 | "base64-arraybuffer": "0.1.5",
663 | "blob": "0.0.5",
664 | "has-binary2": "~1.0.2"
665 | }
666 | },
667 | "error-ex": {
668 | "version": "1.3.1",
669 | "resolved": "https://registry.npmjs.org/error-ex/-/error-ex-1.3.1.tgz",
670 | "integrity": "sha1-+FWobOYa3E6GIcPNoh56dhLDqNw=",
671 | "dev": true,
672 | "requires": {
673 | "is-arrayish": "^0.2.1"
674 | }
675 | },
676 | "escape-string-regexp": {
677 | "version": "1.0.5",
678 | "resolved": "https://registry.npmjs.org/escape-string-regexp/-/escape-string-regexp-1.0.5.tgz",
679 | "integrity": "sha1-G2HAViGQqN/2rjuyzwIAyhMLhtQ="
680 | },
681 | "esprima": {
682 | "version": "4.0.0",
683 | "resolved": "https://registry.npmjs.org/esprima/-/esprima-4.0.0.tgz",
684 | "integrity": "sha512-oftTcaMu/EGrEIu904mWteKIv8vMuOgGYo7EhVJJN00R/EED9DCua/xxHRdYnKtcECzVg7xOWhflvJMnqcFZjw==",
685 | "dev": true
686 | },
687 | "execa": {
688 | "version": "0.7.0",
689 | "resolved": "https://registry.npmjs.org/execa/-/execa-0.7.0.tgz",
690 | "integrity": "sha1-lEvs00zEHuMqY6n68nrVpl/Fl3c=",
691 | "requires": {
692 | "cross-spawn": "^5.0.1",
693 | "get-stream": "^3.0.0",
694 | "is-stream": "^1.1.0",
695 | "npm-run-path": "^2.0.0",
696 | "p-finally": "^1.0.0",
697 | "signal-exit": "^3.0.0",
698 | "strip-eof": "^1.0.0"
699 | }
700 | },
701 | "exit-hook": {
702 | "version": "1.1.1",
703 | "resolved": "https://registry.npmjs.org/exit-hook/-/exit-hook-1.1.1.tgz",
704 | "integrity": "sha1-8FyiM7SMBdVP/wd2XfhQfpXAL/g=",
705 | "dev": true
706 | },
707 | "express": {
708 | "version": "4.16.2",
709 | "resolved": "https://registry.npmjs.org/express/-/express-4.16.2.tgz",
710 | "integrity": "sha1-41xt/i1kt9ygpc1PIXgb4ymeB2w=",
711 | "requires": {
712 | "accepts": "~1.3.4",
713 | "array-flatten": "1.1.1",
714 | "body-parser": "1.18.2",
715 | "content-disposition": "0.5.2",
716 | "content-type": "~1.0.4",
717 | "cookie": "0.3.1",
718 | "cookie-signature": "1.0.6",
719 | "debug": "2.6.9",
720 | "depd": "~1.1.1",
721 | "encodeurl": "~1.0.1",
722 | "escape-html": "~1.0.3",
723 | "etag": "~1.8.1",
724 | "finalhandler": "1.1.0",
725 | "fresh": "0.5.2",
726 | "merge-descriptors": "1.0.1",
727 | "methods": "~1.1.2",
728 | "on-finished": "~2.3.0",
729 | "parseurl": "~1.3.2",
730 | "path-to-regexp": "0.1.7",
731 | "proxy-addr": "~2.0.2",
732 | "qs": "6.5.1",
733 | "range-parser": "~1.2.0",
734 | "safe-buffer": "5.1.1",
735 | "send": "0.16.1",
736 | "serve-static": "1.13.1",
737 | "setprototypeof": "1.1.0",
738 | "statuses": "~1.3.1",
739 | "type-is": "~1.6.15",
740 | "utils-merge": "1.0.1",
741 | "vary": "~1.1.2"
742 | },
743 | "dependencies": {
744 | "accepts": {
745 | "version": "1.3.4",
746 | "resolved": "https://registry.npmjs.org/accepts/-/accepts-1.3.4.tgz",
747 | "integrity": "sha1-hiRnWMfdbSGmR0/whKR0DsBesh8=",
748 | "requires": {
749 | "mime-types": "~2.1.16",
750 | "negotiator": "0.6.1"
751 | }
752 | },
753 | "array-flatten": {
754 | "version": "1.1.1",
755 | "resolved": "https://registry.npmjs.org/array-flatten/-/array-flatten-1.1.1.tgz",
756 | "integrity": "sha1-ml9pkFGx5wczKPKgCJaLZOopVdI="
757 | },
758 | "content-disposition": {
759 | "version": "0.5.2",
760 | "resolved": "https://registry.npmjs.org/content-disposition/-/content-disposition-0.5.2.tgz",
761 | "integrity": "sha1-DPaLud318r55YcOoUXjLhdunjLQ="
762 | },
763 | "content-type": {
764 | "version": "1.0.4",
765 | "resolved": "https://registry.npmjs.org/content-type/-/content-type-1.0.4.tgz",
766 | "integrity": "sha512-hIP3EEPs8tB9AT1L+NUqtwOAps4mk2Zob89MWXMHjHWg9milF/j4osnnQLXBCBFBk/tvIG/tUc9mOUJiPBhPXA=="
767 | },
768 | "cookie": {
769 | "version": "0.3.1",
770 | "resolved": "https://registry.npmjs.org/cookie/-/cookie-0.3.1.tgz",
771 | "integrity": "sha1-5+Ch+e9DtMi6klxcWpboBtFoc7s="
772 | },
773 | "cookie-signature": {
774 | "version": "1.0.6",
775 | "resolved": "https://registry.npmjs.org/cookie-signature/-/cookie-signature-1.0.6.tgz",
776 | "integrity": "sha1-4wOogrNCzD7oylE6eZmXNNqzriw="
777 | },
778 | "debug": {
779 | "version": "2.6.9",
780 | "resolved": "https://registry.npmjs.org/debug/-/debug-2.6.9.tgz",
781 | "integrity": "sha512-bC7ElrdJaJnPbAP+1EotYvqZsb3ecl5wi6Bfi6BJTUcNowp6cvspg0jXznRTKDjm/E7AdgFBVeAPVMNcKGsHMA==",
782 | "requires": {
783 | "ms": "2.0.0"
784 | }
785 | },
786 | "depd": {
787 | "version": "1.1.1",
788 | "resolved": "https://registry.npmjs.org/depd/-/depd-1.1.1.tgz",
789 | "integrity": "sha1-V4O04cRZ8G+lyif5kfPQbnoxA1k="
790 | },
791 | "destroy": {
792 | "version": "1.0.4",
793 | "resolved": "https://registry.npmjs.org/destroy/-/destroy-1.0.4.tgz",
794 | "integrity": "sha1-l4hXRCxEdJ5CBmE+N5RiBYJqvYA="
795 | },
796 | "ee-first": {
797 | "version": "1.1.1",
798 | "resolved": "https://registry.npmjs.org/ee-first/-/ee-first-1.1.1.tgz",
799 | "integrity": "sha1-WQxhFWsK4vTwJVcyoViyZrxWsh0="
800 | },
801 | "encodeurl": {
802 | "version": "1.0.1",
803 | "resolved": "https://registry.npmjs.org/encodeurl/-/encodeurl-1.0.1.tgz",
804 | "integrity": "sha1-eePVhlU0aQn+bw9Fpd5oEDspTSA="
805 | },
806 | "escape-html": {
807 | "version": "1.0.3",
808 | "resolved": "https://registry.npmjs.org/escape-html/-/escape-html-1.0.3.tgz",
809 | "integrity": "sha1-Aljq5NPQwJdN4cFpGI7wBR0dGYg="
810 | },
811 | "etag": {
812 | "version": "1.8.1",
813 | "resolved": "https://registry.npmjs.org/etag/-/etag-1.8.1.tgz",
814 | "integrity": "sha1-Qa4u62XvpiJorr/qg6x9eSmbCIc="
815 | },
816 | "finalhandler": {
817 | "version": "1.1.0",
818 | "resolved": "https://registry.npmjs.org/finalhandler/-/finalhandler-1.1.0.tgz",
819 | "integrity": "sha1-zgtoVbRYU+eRsvzGgARtiCU91/U=",
820 | "requires": {
821 | "debug": "2.6.9",
822 | "encodeurl": "~1.0.1",
823 | "escape-html": "~1.0.3",
824 | "on-finished": "~2.3.0",
825 | "parseurl": "~1.3.2",
826 | "statuses": "~1.3.1",
827 | "unpipe": "~1.0.0"
828 | }
829 | },
830 | "forwarded": {
831 | "version": "0.1.2",
832 | "resolved": "https://registry.npmjs.org/forwarded/-/forwarded-0.1.2.tgz",
833 | "integrity": "sha1-mMI9qxF1ZXuMBXPozszZGw/xjIQ="
834 | },
835 | "fresh": {
836 | "version": "0.5.2",
837 | "resolved": "https://registry.npmjs.org/fresh/-/fresh-0.5.2.tgz",
838 | "integrity": "sha1-PYyt2Q2XZWn6g1qx+OSyOhBWBac="
839 | },
840 | "http-errors": {
841 | "version": "1.6.2",
842 | "resolved": "https://registry.npmjs.org/http-errors/-/http-errors-1.6.2.tgz",
843 | "integrity": "sha1-CgAsyFcHGSp+eUbO7cERVfYOxzY=",
844 | "requires": {
845 | "depd": "1.1.1",
846 | "inherits": "2.0.3",
847 | "setprototypeof": "1.0.3",
848 | "statuses": ">= 1.3.1 < 2"
849 | },
850 | "dependencies": {
851 | "setprototypeof": {
852 | "version": "1.0.3",
853 | "resolved": "https://registry.npmjs.org/setprototypeof/-/setprototypeof-1.0.3.tgz",
854 | "integrity": "sha1-ZlZ+NwQ+608E2RvWWMDL77VbjgQ="
855 | }
856 | }
857 | },
858 | "inherits": {
859 | "version": "2.0.3",
860 | "resolved": "https://registry.npmjs.org/inherits/-/inherits-2.0.3.tgz",
861 | "integrity": "sha1-Yzwsg+PaQqUC9SRmAiSA9CCCYd4="
862 | },
863 | "ipaddr.js": {
864 | "version": "1.5.2",
865 | "resolved": "https://registry.npmjs.org/ipaddr.js/-/ipaddr.js-1.5.2.tgz",
866 | "integrity": "sha1-1LUFvemUaYfM8PxY2QEP+WB+P6A="
867 | },
868 | "media-typer": {
869 | "version": "0.3.0",
870 | "resolved": "https://registry.npmjs.org/media-typer/-/media-typer-0.3.0.tgz",
871 | "integrity": "sha1-hxDXrwqmJvj/+hzgAWhUUmMlV0g="
872 | },
873 | "merge-descriptors": {
874 | "version": "1.0.1",
875 | "resolved": "https://registry.npmjs.org/merge-descriptors/-/merge-descriptors-1.0.1.tgz",
876 | "integrity": "sha1-sAqqVW3YtEVoFQ7J0blT8/kMu2E="
877 | },
878 | "methods": {
879 | "version": "1.1.2",
880 | "resolved": "https://registry.npmjs.org/methods/-/methods-1.1.2.tgz",
881 | "integrity": "sha1-VSmk1nZUE07cxSZmVoNbD4Ua/O4="
882 | },
883 | "mime": {
884 | "version": "1.4.1",
885 | "resolved": "https://registry.npmjs.org/mime/-/mime-1.4.1.tgz",
886 | "integrity": "sha512-KI1+qOZu5DcW6wayYHSzR/tXKCDC5Om4s1z2QJjDULzLcmf3DvzS7oluY4HCTrc+9FiKmWUgeNLg7W3uIQvxtQ=="
887 | },
888 | "mime-db": {
889 | "version": "1.30.0",
890 | "resolved": "https://registry.npmjs.org/mime-db/-/mime-db-1.30.0.tgz",
891 | "integrity": "sha1-dMZD2i3Z1qRTmZY0ZbJtXKfXHwE="
892 | },
893 | "mime-types": {
894 | "version": "2.1.17",
895 | "resolved": "https://registry.npmjs.org/mime-types/-/mime-types-2.1.17.tgz",
896 | "integrity": "sha1-Cdejk/A+mVp5+K+Fe3Cp4KsWVXo=",
897 | "requires": {
898 | "mime-db": "~1.30.0"
899 | }
900 | },
901 | "ms": {
902 | "version": "2.0.0",
903 | "resolved": "https://registry.npmjs.org/ms/-/ms-2.0.0.tgz",
904 | "integrity": "sha1-VgiurfwAvmwpAd9fmGF4jeDVl8g="
905 | },
906 | "negotiator": {
907 | "version": "0.6.1",
908 | "resolved": "https://registry.npmjs.org/negotiator/-/negotiator-0.6.1.tgz",
909 | "integrity": "sha1-KzJxhOiZIQEXeyhWP7XnECrNDKk="
910 | },
911 | "on-finished": {
912 | "version": "2.3.0",
913 | "resolved": "https://registry.npmjs.org/on-finished/-/on-finished-2.3.0.tgz",
914 | "integrity": "sha1-IPEzZIGwg811M3mSoWlxqi2QaUc=",
915 | "requires": {
916 | "ee-first": "1.1.1"
917 | }
918 | },
919 | "parseurl": {
920 | "version": "1.3.2",
921 | "resolved": "https://registry.npmjs.org/parseurl/-/parseurl-1.3.2.tgz",
922 | "integrity": "sha1-/CidTtiZMRlGDBViUyYs3I3mW/M="
923 | },
924 | "path-to-regexp": {
925 | "version": "0.1.7",
926 | "resolved": "https://registry.npmjs.org/path-to-regexp/-/path-to-regexp-0.1.7.tgz",
927 | "integrity": "sha1-32BBeABfUi8V60SQ5yR6G/qmf4w="
928 | },
929 | "proxy-addr": {
930 | "version": "2.0.2",
931 | "resolved": "https://registry.npmjs.org/proxy-addr/-/proxy-addr-2.0.2.tgz",
932 | "integrity": "sha1-ZXFQT0e7mI7IGAJT+F3X4UlSvew=",
933 | "requires": {
934 | "forwarded": "~0.1.2",
935 | "ipaddr.js": "1.5.2"
936 | }
937 | },
938 | "qs": {
939 | "version": "6.5.1",
940 | "resolved": "https://registry.npmjs.org/qs/-/qs-6.5.1.tgz",
941 | "integrity": "sha512-eRzhrN1WSINYCDCbrz796z37LOe3m5tmW7RQf6oBntukAG1nmovJvhnwHHRMAfeoItc1m2Hk02WER2aQ/iqs+A=="
942 | },
943 | "range-parser": {
944 | "version": "1.2.0",
945 | "resolved": "https://registry.npmjs.org/range-parser/-/range-parser-1.2.0.tgz",
946 | "integrity": "sha1-9JvmtIeJTdxA3MlKMi9hEJLgDV4="
947 | },
948 | "safe-buffer": {
949 | "version": "5.1.1",
950 | "resolved": "https://registry.npmjs.org/safe-buffer/-/safe-buffer-5.1.1.tgz",
951 | "integrity": "sha512-kKvNJn6Mm93gAczWVJg7wH+wGYWNrDHdWvpUmHyEsgCtIwwo3bqPtV4tR5tuPaUhTOo/kvhVwd8XwwOllGYkbg=="
952 | },
953 | "send": {
954 | "version": "0.16.1",
955 | "resolved": "https://registry.npmjs.org/send/-/send-0.16.1.tgz",
956 | "integrity": "sha512-ElCLJdJIKPk6ux/Hocwhk7NFHpI3pVm/IZOYWqUmoxcgeyM+MpxHHKhb8QmlJDX1pU6WrgaHBkVNm73Sv7uc2A==",
957 | "requires": {
958 | "debug": "2.6.9",
959 | "depd": "~1.1.1",
960 | "destroy": "~1.0.4",
961 | "encodeurl": "~1.0.1",
962 | "escape-html": "~1.0.3",
963 | "etag": "~1.8.1",
964 | "fresh": "0.5.2",
965 | "http-errors": "~1.6.2",
966 | "mime": "1.4.1",
967 | "ms": "2.0.0",
968 | "on-finished": "~2.3.0",
969 | "range-parser": "~1.2.0",
970 | "statuses": "~1.3.1"
971 | }
972 | },
973 | "serve-static": {
974 | "version": "1.13.1",
975 | "resolved": "https://registry.npmjs.org/serve-static/-/serve-static-1.13.1.tgz",
976 | "integrity": "sha512-hSMUZrsPa/I09VYFJwa627JJkNs0NrfL1Uzuup+GqHfToR2KcsXFymXSV90hoyw3M+msjFuQly+YzIH/q0MGlQ==",
977 | "requires": {
978 | "encodeurl": "~1.0.1",
979 | "escape-html": "~1.0.3",
980 | "parseurl": "~1.3.2",
981 | "send": "0.16.1"
982 | }
983 | },
984 | "setprototypeof": {
985 | "version": "1.1.0",
986 | "resolved": "https://registry.npmjs.org/setprototypeof/-/setprototypeof-1.1.0.tgz",
987 | "integrity": "sha512-BvE/TwpZX4FXExxOxZyRGQQv651MSwmWKZGqvmPcRIjDqWub67kTKuIMx43cZZrS/cBBzwBcNDWoFxt2XEFIpQ=="
988 | },
989 | "statuses": {
990 | "version": "1.3.1",
991 | "resolved": "https://registry.npmjs.org/statuses/-/statuses-1.3.1.tgz",
992 | "integrity": "sha1-+vUbnrdKrvOzrPStX2Gr8ky3uT4="
993 | },
994 | "type-is": {
995 | "version": "1.6.15",
996 | "resolved": "https://registry.npmjs.org/type-is/-/type-is-1.6.15.tgz",
997 | "integrity": "sha1-yrEPtJCeRByChC6v4a1kbIGARBA=",
998 | "requires": {
999 | "media-typer": "0.3.0",
1000 | "mime-types": "~2.1.15"
1001 | }
1002 | },
1003 | "unpipe": {
1004 | "version": "1.0.0",
1005 | "resolved": "https://registry.npmjs.org/unpipe/-/unpipe-1.0.0.tgz",
1006 | "integrity": "sha1-sr9O6FFKrmFltIF4KdIbLvSZBOw="
1007 | },
1008 | "utils-merge": {
1009 | "version": "1.0.1",
1010 | "resolved": "https://registry.npmjs.org/utils-merge/-/utils-merge-1.0.1.tgz",
1011 | "integrity": "sha1-n5VxD1CiZ5R7LMwSR0HBAoQn5xM="
1012 | },
1013 | "vary": {
1014 | "version": "1.1.2",
1015 | "resolved": "https://registry.npmjs.org/vary/-/vary-1.1.2.tgz",
1016 | "integrity": "sha1-IpnwLG3tMNSllhsLn3RSShj2NPw="
1017 | }
1018 | }
1019 | },
1020 | "extend": {
1021 | "version": "3.0.2",
1022 | "resolved": "https://registry.npmjs.org/extend/-/extend-3.0.2.tgz",
1023 | "integrity": "sha512-fjquC59cD7CyW6urNXK0FBufkZcoiGG80wTuPujX590cB5Ttln20E2UB4S/WARVqhXffZl2LNgS+gQdPIIim/g=="
1024 | },
1025 | "extsprintf": {
1026 | "version": "1.3.0",
1027 | "resolved": "https://registry.npmjs.org/extsprintf/-/extsprintf-1.3.0.tgz",
1028 | "integrity": "sha1-lpGEQOMEGnpBT4xS48V06zw+HgU="
1029 | },
1030 | "fast-deep-equal": {
1031 | "version": "2.0.1",
1032 | "resolved": "https://registry.npmjs.org/fast-deep-equal/-/fast-deep-equal-2.0.1.tgz",
1033 | "integrity": "sha1-ewUhjd+WZ79/Nwv3/bLLFf3Qqkk="
1034 | },
1035 | "fast-json-stable-stringify": {
1036 | "version": "2.0.0",
1037 | "resolved": "https://registry.npmjs.org/fast-json-stable-stringify/-/fast-json-stable-stringify-2.0.0.tgz",
1038 | "integrity": "sha1-1RQsDK7msRifh9OnYREGT4bIu/I="
1039 | },
1040 | "figures": {
1041 | "version": "1.7.0",
1042 | "resolved": "https://registry.npmjs.org/figures/-/figures-1.7.0.tgz",
1043 | "integrity": "sha1-y+Hjr/zxzUS4DK3+0o3Hk6lwHS4=",
1044 | "dev": true,
1045 | "requires": {
1046 | "escape-string-regexp": "^1.0.5",
1047 | "object-assign": "^4.1.0"
1048 | }
1049 | },
1050 | "forever-agent": {
1051 | "version": "0.6.1",
1052 | "resolved": "https://registry.npmjs.org/forever-agent/-/forever-agent-0.6.1.tgz",
1053 | "integrity": "sha1-+8cfDEGt6zf5bFd60e1C2P2sypE="
1054 | },
1055 | "form-data": {
1056 | "version": "2.3.3",
1057 | "resolved": "https://registry.npmjs.org/form-data/-/form-data-2.3.3.tgz",
1058 | "integrity": "sha512-1lLKB2Mu3aGP1Q/2eCOx0fNbRMe7XdwktwOruhfqqd0rIJWwN4Dh+E3hrPSlDCXnSR7UtZ1N38rVXm+6+MEhJQ==",
1059 | "requires": {
1060 | "asynckit": "^0.4.0",
1061 | "combined-stream": "^1.0.6",
1062 | "mime-types": "^2.1.12"
1063 | }
1064 | },
1065 | "get-own-enumerable-property-symbols": {
1066 | "version": "2.0.1",
1067 | "resolved": "https://registry.npmjs.org/get-own-enumerable-property-symbols/-/get-own-enumerable-property-symbols-2.0.1.tgz",
1068 | "integrity": "sha512-TtY/sbOemiMKPRUDDanGCSgBYe7Mf0vbRsWnBZ+9yghpZ1MvcpSpuZFjHdEeY/LZjZy0vdLjS77L6HosisFiug==",
1069 | "dev": true
1070 | },
1071 | "get-stream": {
1072 | "version": "3.0.0",
1073 | "resolved": "https://registry.npmjs.org/get-stream/-/get-stream-3.0.0.tgz",
1074 | "integrity": "sha1-jpQ9E1jcN1VQVOy+LtsFqhdO3hQ="
1075 | },
1076 | "getpass": {
1077 | "version": "0.1.7",
1078 | "resolved": "https://registry.npmjs.org/getpass/-/getpass-0.1.7.tgz",
1079 | "integrity": "sha1-Xv+OPmhNVprkyysSgmBOi6YhSfo=",
1080 | "requires": {
1081 | "assert-plus": "^1.0.0"
1082 | }
1083 | },
1084 | "graceful-fs": {
1085 | "version": "4.1.11",
1086 | "resolved": "https://registry.npmjs.org/graceful-fs/-/graceful-fs-4.1.11.tgz",
1087 | "integrity": "sha1-Dovf5NHduIVNZOBOp8AOKgJuVlg="
1088 | },
1089 | "har-schema": {
1090 | "version": "2.0.0",
1091 | "resolved": "https://registry.npmjs.org/har-schema/-/har-schema-2.0.0.tgz",
1092 | "integrity": "sha1-qUwiJOvKwEeCoNkDVSHyRzW37JI="
1093 | },
1094 | "har-validator": {
1095 | "version": "5.1.3",
1096 | "resolved": "https://registry.npmjs.org/har-validator/-/har-validator-5.1.3.tgz",
1097 | "integrity": "sha512-sNvOCzEQNr/qrvJgc3UG/kD4QtlHycrzwS+6mfTrrSq97BvaYcPZZI1ZSqGSPR73Cxn4LKTD4PttRwfU7jWq5g==",
1098 | "requires": {
1099 | "ajv": "^6.5.5",
1100 | "har-schema": "^2.0.0"
1101 | }
1102 | },
1103 | "has-ansi": {
1104 | "version": "2.0.0",
1105 | "resolved": "https://registry.npmjs.org/has-ansi/-/has-ansi-2.0.0.tgz",
1106 | "integrity": "sha1-NPUEnOHs3ysGSa8+8k5F7TVBbZE=",
1107 | "dev": true,
1108 | "requires": {
1109 | "ansi-regex": "^2.0.0"
1110 | },
1111 | "dependencies": {
1112 | "ansi-regex": {
1113 | "version": "2.1.1",
1114 | "resolved": "https://registry.npmjs.org/ansi-regex/-/ansi-regex-2.1.1.tgz",
1115 | "integrity": "sha1-w7M6te42DYbg5ijwRorn7yfWVN8=",
1116 | "dev": true
1117 | }
1118 | }
1119 | },
1120 | "has-binary2": {
1121 | "version": "1.0.3",
1122 | "resolved": "https://registry.npmjs.org/has-binary2/-/has-binary2-1.0.3.tgz",
1123 | "integrity": "sha512-G1LWKhDSvhGeAQ8mPVQlqNcOB2sJdwATtZKl2pDKKHfpf/rYj24lkinxf69blJbnsvtqqNU+L3SL50vzZhXOnw==",
1124 | "requires": {
1125 | "isarray": "2.0.1"
1126 | }
1127 | },
1128 | "has-cors": {
1129 | "version": "1.1.0",
1130 | "resolved": "https://registry.npmjs.org/has-cors/-/has-cors-1.1.0.tgz",
1131 | "integrity": "sha1-XkdHk/fqmEPRu5nCPu9J/xJv/zk="
1132 | },
1133 | "has-flag": {
1134 | "version": "2.0.0",
1135 | "resolved": "https://registry.npmjs.org/has-flag/-/has-flag-2.0.0.tgz",
1136 | "integrity": "sha1-6CB68cx7MNRGzHC3NLXovhj4jVE="
1137 | },
1138 | "http-signature": {
1139 | "version": "1.2.0",
1140 | "resolved": "https://registry.npmjs.org/http-signature/-/http-signature-1.2.0.tgz",
1141 | "integrity": "sha1-muzZJRFHcvPZW2WmCruPfBj7rOE=",
1142 | "requires": {
1143 | "assert-plus": "^1.0.0",
1144 | "jsprim": "^1.2.2",
1145 | "sshpk": "^1.7.0"
1146 | }
1147 | },
1148 | "husky": {
1149 | "version": "0.14.3",
1150 | "resolved": "https://registry.npmjs.org/husky/-/husky-0.14.3.tgz",
1151 | "integrity": "sha512-e21wivqHpstpoiWA/Yi8eFti8E+sQDSS53cpJsPptPs295QTOQR0ZwnHo2TXy1XOpZFD9rPOd3NpmqTK6uMLJA==",
1152 | "dev": true,
1153 | "requires": {
1154 | "is-ci": "^1.0.10",
1155 | "normalize-path": "^1.0.0",
1156 | "strip-indent": "^2.0.0"
1157 | },
1158 | "dependencies": {
1159 | "normalize-path": {
1160 | "version": "1.0.0",
1161 | "resolved": "https://registry.npmjs.org/normalize-path/-/normalize-path-1.0.0.tgz",
1162 | "integrity": "sha1-MtDkcvkf80VwHBWoMRAY07CpA3k=",
1163 | "dev": true
1164 | }
1165 | }
1166 | },
1167 | "indent-string": {
1168 | "version": "2.1.0",
1169 | "resolved": "https://registry.npmjs.org/indent-string/-/indent-string-2.1.0.tgz",
1170 | "integrity": "sha1-ji1INIdCEhtKghi3oTfppSBJ3IA=",
1171 | "dev": true,
1172 | "requires": {
1173 | "repeating": "^2.0.0"
1174 | }
1175 | },
1176 | "indexof": {
1177 | "version": "0.0.1",
1178 | "resolved": "https://registry.npmjs.org/indexof/-/indexof-0.0.1.tgz",
1179 | "integrity": "sha1-gtwzbSMrkGIXnQWrMpOmYFn9Q10="
1180 | },
1181 | "inherits": {
1182 | "version": "2.0.3",
1183 | "resolved": "https://registry.npmjs.org/inherits/-/inherits-2.0.3.tgz",
1184 | "integrity": "sha1-Yzwsg+PaQqUC9SRmAiSA9CCCYd4="
1185 | },
1186 | "is-arrayish": {
1187 | "version": "0.2.1",
1188 | "resolved": "https://registry.npmjs.org/is-arrayish/-/is-arrayish-0.2.1.tgz",
1189 | "integrity": "sha1-d8mYQFJ6qOyxqLppe4BkWnqSap0=",
1190 | "dev": true
1191 | },
1192 | "is-ci": {
1193 | "version": "1.0.10",
1194 | "resolved": "https://registry.npmjs.org/is-ci/-/is-ci-1.0.10.tgz",
1195 | "integrity": "sha1-9zkzayYyNlBhqdSCcM1WrjNpMY4=",
1196 | "dev": true,
1197 | "requires": {
1198 | "ci-info": "^1.0.0"
1199 | }
1200 | },
1201 | "is-finite": {
1202 | "version": "1.0.2",
1203 | "resolved": "https://registry.npmjs.org/is-finite/-/is-finite-1.0.2.tgz",
1204 | "integrity": "sha1-zGZ3aVYCvlUO8R6LSqYwU0K20Ko=",
1205 | "dev": true,
1206 | "requires": {
1207 | "number-is-nan": "^1.0.0"
1208 | }
1209 | },
1210 | "is-fullwidth-code-point": {
1211 | "version": "2.0.0",
1212 | "resolved": "https://registry.npmjs.org/is-fullwidth-code-point/-/is-fullwidth-code-point-2.0.0.tgz",
1213 | "integrity": "sha1-o7MKXE8ZkYMWeqq5O+764937ZU8="
1214 | },
1215 | "is-obj": {
1216 | "version": "1.0.1",
1217 | "resolved": "https://registry.npmjs.org/is-obj/-/is-obj-1.0.1.tgz",
1218 | "integrity": "sha1-PkcprB9f3gJc19g6iW2rn09n2w8=",
1219 | "dev": true
1220 | },
1221 | "is-promise": {
1222 | "version": "2.1.0",
1223 | "resolved": "https://registry.npmjs.org/is-promise/-/is-promise-2.1.0.tgz",
1224 | "integrity": "sha1-eaKp7OfwlugPNtKy87wWwf9L8/o=",
1225 | "dev": true
1226 | },
1227 | "is-regexp": {
1228 | "version": "1.0.0",
1229 | "resolved": "https://registry.npmjs.org/is-regexp/-/is-regexp-1.0.0.tgz",
1230 | "integrity": "sha1-/S2INUXEa6xaYz57mgnof6LLUGk=",
1231 | "dev": true
1232 | },
1233 | "is-stream": {
1234 | "version": "1.1.0",
1235 | "resolved": "https://registry.npmjs.org/is-stream/-/is-stream-1.1.0.tgz",
1236 | "integrity": "sha1-EtSj3U5o4Lec6428hBc66A2RykQ="
1237 | },
1238 | "is-typedarray": {
1239 | "version": "1.0.0",
1240 | "resolved": "https://registry.npmjs.org/is-typedarray/-/is-typedarray-1.0.0.tgz",
1241 | "integrity": "sha1-5HnICFjfDBsR3dppQPlgEfzaSpo="
1242 | },
1243 | "isarray": {
1244 | "version": "2.0.1",
1245 | "resolved": "https://registry.npmjs.org/isarray/-/isarray-2.0.1.tgz",
1246 | "integrity": "sha1-o32U7ZzaLVmGXJ92/llu4fM4dB4="
1247 | },
1248 | "isexe": {
1249 | "version": "2.0.0",
1250 | "resolved": "https://registry.npmjs.org/isexe/-/isexe-2.0.0.tgz",
1251 | "integrity": "sha1-6PvzdNxVb/iUehDcsFctYz8s+hA="
1252 | },
1253 | "isstream": {
1254 | "version": "0.1.2",
1255 | "resolved": "https://registry.npmjs.org/isstream/-/isstream-0.1.2.tgz",
1256 | "integrity": "sha1-R+Y/evVa+m+S4VAOaQ64uFKcCZo="
1257 | },
1258 | "jest-get-type": {
1259 | "version": "21.2.0",
1260 | "resolved": "https://registry.npmjs.org/jest-get-type/-/jest-get-type-21.2.0.tgz",
1261 | "integrity": "sha512-y2fFw3C+D0yjNSDp7ab1kcd6NUYfy3waPTlD8yWkAtiocJdBRQqNoRqVfMNxgj+IjT0V5cBIHJO0z9vuSSZ43Q==",
1262 | "dev": true
1263 | },
1264 | "jest-validate": {
1265 | "version": "21.2.1",
1266 | "resolved": "https://registry.npmjs.org/jest-validate/-/jest-validate-21.2.1.tgz",
1267 | "integrity": "sha512-k4HLI1rZQjlU+EC682RlQ6oZvLrE5SCh3brseQc24vbZTxzT/k/3urar5QMCVgjadmSO7lECeGdc6YxnM3yEGg==",
1268 | "dev": true,
1269 | "requires": {
1270 | "chalk": "^2.0.1",
1271 | "jest-get-type": "^21.2.0",
1272 | "leven": "^2.1.0",
1273 | "pretty-format": "^21.2.1"
1274 | }
1275 | },
1276 | "js-yaml": {
1277 | "version": "3.13.1",
1278 | "resolved": "https://registry.npmjs.org/js-yaml/-/js-yaml-3.13.1.tgz",
1279 | "integrity": "sha512-YfbcO7jXDdyj0DGxYVSlSeQNHbD7XPWvrVWeVUujrQEoZzWJIRrCPoyk6kL6IAjAG2IolMK4T0hNUe0HOUs5Jw==",
1280 | "dev": true,
1281 | "requires": {
1282 | "argparse": "^1.0.7",
1283 | "esprima": "^4.0.0"
1284 | }
1285 | },
1286 | "jsbn": {
1287 | "version": "0.1.1",
1288 | "resolved": "https://registry.npmjs.org/jsbn/-/jsbn-0.1.1.tgz",
1289 | "integrity": "sha1-peZUwuWi3rXyAdls77yoDA7y9RM="
1290 | },
1291 | "json-schema": {
1292 | "version": "0.2.3",
1293 | "resolved": "https://registry.npmjs.org/json-schema/-/json-schema-0.2.3.tgz",
1294 | "integrity": "sha1-tIDIkuWaLwWVTOcnvT8qTogvnhM="
1295 | },
1296 | "json-schema-traverse": {
1297 | "version": "0.4.1",
1298 | "resolved": "https://registry.npmjs.org/json-schema-traverse/-/json-schema-traverse-0.4.1.tgz",
1299 | "integrity": "sha512-xbbCH5dCYU5T8LcEhhuh7HJ88HXuW3qsI3Y0zOZFKfZEHcpWiHU/Jxzk629Brsab/mMiHQti9wMP+845RPe3Vg=="
1300 | },
1301 | "json-stringify-safe": {
1302 | "version": "5.0.1",
1303 | "resolved": "https://registry.npmjs.org/json-stringify-safe/-/json-stringify-safe-5.0.1.tgz",
1304 | "integrity": "sha1-Epai1Y/UXxmg9s4B1lcB4sc1tus="
1305 | },
1306 | "jsprim": {
1307 | "version": "1.4.1",
1308 | "resolved": "https://registry.npmjs.org/jsprim/-/jsprim-1.4.1.tgz",
1309 | "integrity": "sha1-MT5mvB5cwG5Di8G3SZwuXFastqI=",
1310 | "requires": {
1311 | "assert-plus": "1.0.0",
1312 | "extsprintf": "1.3.0",
1313 | "json-schema": "0.2.3",
1314 | "verror": "1.10.0"
1315 | }
1316 | },
1317 | "leven": {
1318 | "version": "2.1.0",
1319 | "resolved": "https://registry.npmjs.org/leven/-/leven-2.1.0.tgz",
1320 | "integrity": "sha1-wuep93IJTe6dNCAq6KzORoeHVYA=",
1321 | "dev": true
1322 | },
1323 | "lint-staged": {
1324 | "version": "4.2.3",
1325 | "resolved": "https://registry.npmjs.org/lint-staged/-/lint-staged-4.2.3.tgz",
1326 | "integrity": "sha512-Ks1vMyVpp3ldeFDN9sIcHcFDh0v3X6Y6LOdT0Wl86/BSDM2R8PVcuFODkh0Dav7Ni/asUPKONfXRWZM9YO85IQ==",
1327 | "dev": true,
1328 | "requires": {
1329 | "app-root-path": "^2.0.0",
1330 | "chalk": "^2.1.0",
1331 | "cosmiconfig": "^1.1.0",
1332 | "execa": "^0.8.0",
1333 | "is-glob": "^4.0.0",
1334 | "jest-validate": "^21.1.0",
1335 | "listr": "^0.12.0",
1336 | "lodash": "^4.17.4",
1337 | "log-symbols": "^2.0.0",
1338 | "minimatch": "^3.0.0",
1339 | "npm-which": "^3.0.1",
1340 | "p-map": "^1.1.1",
1341 | "staged-git-files": "0.0.4",
1342 | "stringify-object": "^3.2.0"
1343 | },
1344 | "dependencies": {
1345 | "execa": {
1346 | "version": "0.8.0",
1347 | "resolved": "https://registry.npmjs.org/execa/-/execa-0.8.0.tgz",
1348 | "integrity": "sha1-2NdrvBtVIX7RkP1t1J08d07PyNo=",
1349 | "dev": true,
1350 | "requires": {
1351 | "cross-spawn": "^5.0.1",
1352 | "get-stream": "^3.0.0",
1353 | "is-stream": "^1.1.0",
1354 | "npm-run-path": "^2.0.0",
1355 | "p-finally": "^1.0.0",
1356 | "signal-exit": "^3.0.0",
1357 | "strip-eof": "^1.0.0"
1358 | }
1359 | },
1360 | "is-extglob": {
1361 | "version": "2.1.1",
1362 | "resolved": "https://registry.npmjs.org/is-extglob/-/is-extglob-2.1.1.tgz",
1363 | "integrity": "sha1-qIwCU1eR8C7TfHahueqXc8gz+MI=",
1364 | "dev": true
1365 | },
1366 | "is-glob": {
1367 | "version": "4.0.0",
1368 | "resolved": "https://registry.npmjs.org/is-glob/-/is-glob-4.0.0.tgz",
1369 | "integrity": "sha1-lSHHaEXMJhCoUgPd8ICpWML/q8A=",
1370 | "dev": true,
1371 | "requires": {
1372 | "is-extglob": "^2.1.1"
1373 | }
1374 | }
1375 | }
1376 | },
1377 | "listr": {
1378 | "version": "0.12.0",
1379 | "resolved": "https://registry.npmjs.org/listr/-/listr-0.12.0.tgz",
1380 | "integrity": "sha1-a84sD1YD+klYDqF81qAMwOX6RRo=",
1381 | "dev": true,
1382 | "requires": {
1383 | "chalk": "^1.1.3",
1384 | "cli-truncate": "^0.2.1",
1385 | "figures": "^1.7.0",
1386 | "indent-string": "^2.1.0",
1387 | "is-promise": "^2.1.0",
1388 | "is-stream": "^1.1.0",
1389 | "listr-silent-renderer": "^1.1.1",
1390 | "listr-update-renderer": "^0.2.0",
1391 | "listr-verbose-renderer": "^0.4.0",
1392 | "log-symbols": "^1.0.2",
1393 | "log-update": "^1.0.2",
1394 | "ora": "^0.2.3",
1395 | "p-map": "^1.1.1",
1396 | "rxjs": "^5.0.0-beta.11",
1397 | "stream-to-observable": "^0.1.0",
1398 | "strip-ansi": "^3.0.1"
1399 | },
1400 | "dependencies": {
1401 | "ansi-regex": {
1402 | "version": "2.1.1",
1403 | "resolved": "https://registry.npmjs.org/ansi-regex/-/ansi-regex-2.1.1.tgz",
1404 | "integrity": "sha1-w7M6te42DYbg5ijwRorn7yfWVN8=",
1405 | "dev": true
1406 | },
1407 | "ansi-styles": {
1408 | "version": "2.2.1",
1409 | "resolved": "https://registry.npmjs.org/ansi-styles/-/ansi-styles-2.2.1.tgz",
1410 | "integrity": "sha1-tDLdM1i2NM914eRmQ2gkBTPB3b4=",
1411 | "dev": true
1412 | },
1413 | "chalk": {
1414 | "version": "1.1.3",
1415 | "resolved": "https://registry.npmjs.org/chalk/-/chalk-1.1.3.tgz",
1416 | "integrity": "sha1-qBFcVeSnAv5NFQq9OHKCKn4J/Jg=",
1417 | "dev": true,
1418 | "requires": {
1419 | "ansi-styles": "^2.2.1",
1420 | "escape-string-regexp": "^1.0.2",
1421 | "has-ansi": "^2.0.0",
1422 | "strip-ansi": "^3.0.0",
1423 | "supports-color": "^2.0.0"
1424 | }
1425 | },
1426 | "log-symbols": {
1427 | "version": "1.0.2",
1428 | "resolved": "https://registry.npmjs.org/log-symbols/-/log-symbols-1.0.2.tgz",
1429 | "integrity": "sha1-N2/3tY6jCGoPCfrMdGF+ylAeGhg=",
1430 | "dev": true,
1431 | "requires": {
1432 | "chalk": "^1.0.0"
1433 | }
1434 | },
1435 | "strip-ansi": {
1436 | "version": "3.0.1",
1437 | "resolved": "https://registry.npmjs.org/strip-ansi/-/strip-ansi-3.0.1.tgz",
1438 | "integrity": "sha1-ajhfuIU9lS1f8F0Oiq+UJ43GPc8=",
1439 | "dev": true,
1440 | "requires": {
1441 | "ansi-regex": "^2.0.0"
1442 | }
1443 | },
1444 | "supports-color": {
1445 | "version": "2.0.0",
1446 | "resolved": "https://registry.npmjs.org/supports-color/-/supports-color-2.0.0.tgz",
1447 | "integrity": "sha1-U10EXOa2Nj+kARcIRimZXp3zJMc=",
1448 | "dev": true
1449 | }
1450 | }
1451 | },
1452 | "listr-silent-renderer": {
1453 | "version": "1.1.1",
1454 | "resolved": "https://registry.npmjs.org/listr-silent-renderer/-/listr-silent-renderer-1.1.1.tgz",
1455 | "integrity": "sha1-kktaN1cVN3C/Go4/v3S4u/P5JC4=",
1456 | "dev": true
1457 | },
1458 | "listr-update-renderer": {
1459 | "version": "0.2.0",
1460 | "resolved": "https://registry.npmjs.org/listr-update-renderer/-/listr-update-renderer-0.2.0.tgz",
1461 | "integrity": "sha1-yoDhd5tOcCZoB+ju0a1qvjmFUPk=",
1462 | "dev": true,
1463 | "requires": {
1464 | "chalk": "^1.1.3",
1465 | "cli-truncate": "^0.2.1",
1466 | "elegant-spinner": "^1.0.1",
1467 | "figures": "^1.7.0",
1468 | "indent-string": "^3.0.0",
1469 | "log-symbols": "^1.0.2",
1470 | "log-update": "^1.0.2",
1471 | "strip-ansi": "^3.0.1"
1472 | },
1473 | "dependencies": {
1474 | "ansi-regex": {
1475 | "version": "2.1.1",
1476 | "resolved": "https://registry.npmjs.org/ansi-regex/-/ansi-regex-2.1.1.tgz",
1477 | "integrity": "sha1-w7M6te42DYbg5ijwRorn7yfWVN8=",
1478 | "dev": true
1479 | },
1480 | "ansi-styles": {
1481 | "version": "2.2.1",
1482 | "resolved": "https://registry.npmjs.org/ansi-styles/-/ansi-styles-2.2.1.tgz",
1483 | "integrity": "sha1-tDLdM1i2NM914eRmQ2gkBTPB3b4=",
1484 | "dev": true
1485 | },
1486 | "chalk": {
1487 | "version": "1.1.3",
1488 | "resolved": "https://registry.npmjs.org/chalk/-/chalk-1.1.3.tgz",
1489 | "integrity": "sha1-qBFcVeSnAv5NFQq9OHKCKn4J/Jg=",
1490 | "dev": true,
1491 | "requires": {
1492 | "ansi-styles": "^2.2.1",
1493 | "escape-string-regexp": "^1.0.2",
1494 | "has-ansi": "^2.0.0",
1495 | "strip-ansi": "^3.0.0",
1496 | "supports-color": "^2.0.0"
1497 | }
1498 | },
1499 | "indent-string": {
1500 | "version": "3.2.0",
1501 | "resolved": "https://registry.npmjs.org/indent-string/-/indent-string-3.2.0.tgz",
1502 | "integrity": "sha1-Sl/W0nzDMvN+VBmlBNu4NxBckok=",
1503 | "dev": true
1504 | },
1505 | "log-symbols": {
1506 | "version": "1.0.2",
1507 | "resolved": "https://registry.npmjs.org/log-symbols/-/log-symbols-1.0.2.tgz",
1508 | "integrity": "sha1-N2/3tY6jCGoPCfrMdGF+ylAeGhg=",
1509 | "dev": true,
1510 | "requires": {
1511 | "chalk": "^1.0.0"
1512 | }
1513 | },
1514 | "strip-ansi": {
1515 | "version": "3.0.1",
1516 | "resolved": "https://registry.npmjs.org/strip-ansi/-/strip-ansi-3.0.1.tgz",
1517 | "integrity": "sha1-ajhfuIU9lS1f8F0Oiq+UJ43GPc8=",
1518 | "dev": true,
1519 | "requires": {
1520 | "ansi-regex": "^2.0.0"
1521 | }
1522 | },
1523 | "supports-color": {
1524 | "version": "2.0.0",
1525 | "resolved": "https://registry.npmjs.org/supports-color/-/supports-color-2.0.0.tgz",
1526 | "integrity": "sha1-U10EXOa2Nj+kARcIRimZXp3zJMc=",
1527 | "dev": true
1528 | }
1529 | }
1530 | },
1531 | "listr-verbose-renderer": {
1532 | "version": "0.4.0",
1533 | "resolved": "https://registry.npmjs.org/listr-verbose-renderer/-/listr-verbose-renderer-0.4.0.tgz",
1534 | "integrity": "sha1-RNwBuww0oDxXIVTU0Izemx3FYg8=",
1535 | "dev": true,
1536 | "requires": {
1537 | "chalk": "^1.1.3",
1538 | "cli-cursor": "^1.0.2",
1539 | "date-fns": "^1.27.2",
1540 | "figures": "^1.7.0"
1541 | },
1542 | "dependencies": {
1543 | "ansi-regex": {
1544 | "version": "2.1.1",
1545 | "resolved": "https://registry.npmjs.org/ansi-regex/-/ansi-regex-2.1.1.tgz",
1546 | "integrity": "sha1-w7M6te42DYbg5ijwRorn7yfWVN8=",
1547 | "dev": true
1548 | },
1549 | "ansi-styles": {
1550 | "version": "2.2.1",
1551 | "resolved": "https://registry.npmjs.org/ansi-styles/-/ansi-styles-2.2.1.tgz",
1552 | "integrity": "sha1-tDLdM1i2NM914eRmQ2gkBTPB3b4=",
1553 | "dev": true
1554 | },
1555 | "chalk": {
1556 | "version": "1.1.3",
1557 | "resolved": "https://registry.npmjs.org/chalk/-/chalk-1.1.3.tgz",
1558 | "integrity": "sha1-qBFcVeSnAv5NFQq9OHKCKn4J/Jg=",
1559 | "dev": true,
1560 | "requires": {
1561 | "ansi-styles": "^2.2.1",
1562 | "escape-string-regexp": "^1.0.2",
1563 | "has-ansi": "^2.0.0",
1564 | "strip-ansi": "^3.0.0",
1565 | "supports-color": "^2.0.0"
1566 | }
1567 | },
1568 | "strip-ansi": {
1569 | "version": "3.0.1",
1570 | "resolved": "https://registry.npmjs.org/strip-ansi/-/strip-ansi-3.0.1.tgz",
1571 | "integrity": "sha1-ajhfuIU9lS1f8F0Oiq+UJ43GPc8=",
1572 | "dev": true,
1573 | "requires": {
1574 | "ansi-regex": "^2.0.0"
1575 | }
1576 | },
1577 | "supports-color": {
1578 | "version": "2.0.0",
1579 | "resolved": "https://registry.npmjs.org/supports-color/-/supports-color-2.0.0.tgz",
1580 | "integrity": "sha1-U10EXOa2Nj+kARcIRimZXp3zJMc=",
1581 | "dev": true
1582 | }
1583 | }
1584 | },
1585 | "lodash": {
1586 | "version": "4.17.19",
1587 | "resolved": "https://registry.npmjs.org/lodash/-/lodash-4.17.19.tgz",
1588 | "integrity": "sha512-JNvd8XER9GQX0v2qJgsaN/mzFCNA5BRe/j8JN9d+tWyGLSodKQHKFicdwNYzWwI3wjRnaKPsGj1XkBjx/F96DQ=="
1589 | },
1590 | "log-symbols": {
1591 | "version": "2.1.0",
1592 | "resolved": "https://registry.npmjs.org/log-symbols/-/log-symbols-2.1.0.tgz",
1593 | "integrity": "sha512-zLeLrzMA1A2vRF1e/0Mo+LNINzi6jzBylHj5WqvQ/WK/5WCZt8si9SyN4p9llr/HRYvVR1AoXHRHl4WTHyQAzQ==",
1594 | "dev": true,
1595 | "requires": {
1596 | "chalk": "^2.0.1"
1597 | }
1598 | },
1599 | "log-update": {
1600 | "version": "1.0.2",
1601 | "resolved": "https://registry.npmjs.org/log-update/-/log-update-1.0.2.tgz",
1602 | "integrity": "sha1-GZKfZMQJPS0ucHWh2tivWcKWuNE=",
1603 | "dev": true,
1604 | "requires": {
1605 | "ansi-escapes": "^1.0.0",
1606 | "cli-cursor": "^1.0.2"
1607 | },
1608 | "dependencies": {
1609 | "ansi-escapes": {
1610 | "version": "1.4.0",
1611 | "resolved": "https://registry.npmjs.org/ansi-escapes/-/ansi-escapes-1.4.0.tgz",
1612 | "integrity": "sha1-06ioOzGapneTZisT52HHkRQiMG4=",
1613 | "dev": true
1614 | }
1615 | }
1616 | },
1617 | "lru-cache": {
1618 | "version": "4.1.1",
1619 | "resolved": "https://registry.npmjs.org/lru-cache/-/lru-cache-4.1.1.tgz",
1620 | "integrity": "sha1-Yi4y6CSItJJ5EUpPns9F581rulU=",
1621 | "requires": {
1622 | "pseudomap": "^1.0.2",
1623 | "yallist": "^2.1.2"
1624 | }
1625 | },
1626 | "mime-db": {
1627 | "version": "1.40.0",
1628 | "resolved": "https://registry.npmjs.org/mime-db/-/mime-db-1.40.0.tgz",
1629 | "integrity": "sha512-jYdeOMPy9vnxEqFRRo6ZvTZ8d9oPb+k18PKoYNYUe2stVEBPPwsln/qWzdbmaIvnhZ9v2P+CuecK+fpUfsV2mA=="
1630 | },
1631 | "mime-types": {
1632 | "version": "2.1.24",
1633 | "resolved": "https://registry.npmjs.org/mime-types/-/mime-types-2.1.24.tgz",
1634 | "integrity": "sha512-WaFHS3MCl5fapm3oLxU4eYDw77IQM2ACcxQ9RIxfaC3ooc6PFuBMGZZsYpvoXS5D5QTWPieo1jjLdAm3TBP3cQ==",
1635 | "requires": {
1636 | "mime-db": "1.40.0"
1637 | }
1638 | },
1639 | "minimatch": {
1640 | "version": "3.0.4",
1641 | "resolved": "https://registry.npmjs.org/minimatch/-/minimatch-3.0.4.tgz",
1642 | "integrity": "sha1-UWbihkV/AzBgZL5Ul+jbsMPTIIM=",
1643 | "dev": true,
1644 | "requires": {
1645 | "brace-expansion": "^1.1.7"
1646 | }
1647 | },
1648 | "mkpath": {
1649 | "version": "0.1.0",
1650 | "resolved": "https://registry.npmjs.org/mkpath/-/mkpath-0.1.0.tgz",
1651 | "integrity": "sha1-dVSm+Nhxg0zJe1RisSLEwSTW3pE="
1652 | },
1653 | "ms": {
1654 | "version": "2.1.1",
1655 | "resolved": "https://registry.npmjs.org/ms/-/ms-2.1.1.tgz",
1656 | "integrity": "sha512-tgp+dl5cGk28utYktBsrFqA7HKgrhgPsg6Z/EfhWI4gl1Hwq8B/GmY/0oXZ6nF8hDVesS/FpnYaD/kOWhYQvyg=="
1657 | },
1658 | "negotiator": {
1659 | "version": "0.6.2",
1660 | "resolved": "https://registry.npmjs.org/negotiator/-/negotiator-0.6.2.tgz",
1661 | "integrity": "sha512-hZXc7K2e+PgeI1eDBe/10Ard4ekbfrrqG8Ep+8Jmf4JID2bNg7NvCPOZN+kfF574pFQI7mum2AUqDidoKqcTOw=="
1662 | },
1663 | "ngrok": {
1664 | "version": "3.1.1",
1665 | "resolved": "https://registry.npmjs.org/ngrok/-/ngrok-3.1.1.tgz",
1666 | "integrity": "sha512-dCW/Ni12GRBL7XIyiFmilKOfCW7UVFf65I/HpE8FC5rXGJwdhIYLc9Qr05GRb6hNs6fZGwyLpcDLnDhUSgZasQ==",
1667 | "requires": {
1668 | "@types/node": "^8.10.30",
1669 | "decompress-zip": "^0.3.2",
1670 | "request": "^2.88.0",
1671 | "request-promise-native": "^1.0.5",
1672 | "uuid": "^3.3.2"
1673 | }
1674 | },
1675 | "nopt": {
1676 | "version": "3.0.6",
1677 | "resolved": "https://registry.npmjs.org/nopt/-/nopt-3.0.6.tgz",
1678 | "integrity": "sha1-xkZdvwirzU2zWTF/eaxopkayj/k=",
1679 | "requires": {
1680 | "abbrev": "1"
1681 | }
1682 | },
1683 | "npm-path": {
1684 | "version": "2.0.3",
1685 | "resolved": "https://registry.npmjs.org/npm-path/-/npm-path-2.0.3.tgz",
1686 | "integrity": "sha1-Fc/04ciaONp39W9gVbJPl137K74=",
1687 | "dev": true,
1688 | "requires": {
1689 | "which": "^1.2.10"
1690 | }
1691 | },
1692 | "npm-run-path": {
1693 | "version": "2.0.2",
1694 | "resolved": "https://registry.npmjs.org/npm-run-path/-/npm-run-path-2.0.2.tgz",
1695 | "integrity": "sha1-NakjLfo11wZ7TLLd8jV7GHFTbF8=",
1696 | "requires": {
1697 | "path-key": "^2.0.0"
1698 | }
1699 | },
1700 | "npm-which": {
1701 | "version": "3.0.1",
1702 | "resolved": "https://registry.npmjs.org/npm-which/-/npm-which-3.0.1.tgz",
1703 | "integrity": "sha1-kiXybsOihcIJyuZ8OxGmtKtxQKo=",
1704 | "dev": true,
1705 | "requires": {
1706 | "commander": "^2.9.0",
1707 | "npm-path": "^2.0.2",
1708 | "which": "^1.2.10"
1709 | }
1710 | },
1711 | "number-is-nan": {
1712 | "version": "1.0.1",
1713 | "resolved": "https://registry.npmjs.org/number-is-nan/-/number-is-nan-1.0.1.tgz",
1714 | "integrity": "sha1-CXtgK1NCKlIsGvuHkDGDNpQaAR0="
1715 | },
1716 | "oauth-sign": {
1717 | "version": "0.9.0",
1718 | "resolved": "https://registry.npmjs.org/oauth-sign/-/oauth-sign-0.9.0.tgz",
1719 | "integrity": "sha512-fexhUFFPTGV8ybAtSIGbV6gOkSv8UtRbDBnAyLQw4QPKkgNlsH2ByPGtMUqdWkos6YCRmAqViwgZrJc/mRDzZQ=="
1720 | },
1721 | "object-assign": {
1722 | "version": "4.1.1",
1723 | "resolved": "https://registry.npmjs.org/object-assign/-/object-assign-4.1.1.tgz",
1724 | "integrity": "sha1-IQmtx5ZYh8/AXLvUQsrIv7s2CGM=",
1725 | "dev": true
1726 | },
1727 | "object-component": {
1728 | "version": "0.0.3",
1729 | "resolved": "https://registry.npmjs.org/object-component/-/object-component-0.0.3.tgz",
1730 | "integrity": "sha1-8MaapQ78lbhmwYb0AKM3acsvEpE="
1731 | },
1732 | "onetime": {
1733 | "version": "1.1.0",
1734 | "resolved": "https://registry.npmjs.org/onetime/-/onetime-1.1.0.tgz",
1735 | "integrity": "sha1-ofeDj4MUxRbwXs78vEzP4EtO14k=",
1736 | "dev": true
1737 | },
1738 | "ora": {
1739 | "version": "0.2.3",
1740 | "resolved": "https://registry.npmjs.org/ora/-/ora-0.2.3.tgz",
1741 | "integrity": "sha1-N1J9Igrc1Tw5tzVx11QVbV22V6Q=",
1742 | "dev": true,
1743 | "requires": {
1744 | "chalk": "^1.1.1",
1745 | "cli-cursor": "^1.0.2",
1746 | "cli-spinners": "^0.1.2",
1747 | "object-assign": "^4.0.1"
1748 | },
1749 | "dependencies": {
1750 | "ansi-regex": {
1751 | "version": "2.1.1",
1752 | "resolved": "https://registry.npmjs.org/ansi-regex/-/ansi-regex-2.1.1.tgz",
1753 | "integrity": "sha1-w7M6te42DYbg5ijwRorn7yfWVN8=",
1754 | "dev": true
1755 | },
1756 | "ansi-styles": {
1757 | "version": "2.2.1",
1758 | "resolved": "https://registry.npmjs.org/ansi-styles/-/ansi-styles-2.2.1.tgz",
1759 | "integrity": "sha1-tDLdM1i2NM914eRmQ2gkBTPB3b4=",
1760 | "dev": true
1761 | },
1762 | "chalk": {
1763 | "version": "1.1.3",
1764 | "resolved": "https://registry.npmjs.org/chalk/-/chalk-1.1.3.tgz",
1765 | "integrity": "sha1-qBFcVeSnAv5NFQq9OHKCKn4J/Jg=",
1766 | "dev": true,
1767 | "requires": {
1768 | "ansi-styles": "^2.2.1",
1769 | "escape-string-regexp": "^1.0.2",
1770 | "has-ansi": "^2.0.0",
1771 | "strip-ansi": "^3.0.0",
1772 | "supports-color": "^2.0.0"
1773 | }
1774 | },
1775 | "strip-ansi": {
1776 | "version": "3.0.1",
1777 | "resolved": "https://registry.npmjs.org/strip-ansi/-/strip-ansi-3.0.1.tgz",
1778 | "integrity": "sha1-ajhfuIU9lS1f8F0Oiq+UJ43GPc8=",
1779 | "dev": true,
1780 | "requires": {
1781 | "ansi-regex": "^2.0.0"
1782 | }
1783 | },
1784 | "supports-color": {
1785 | "version": "2.0.0",
1786 | "resolved": "https://registry.npmjs.org/supports-color/-/supports-color-2.0.0.tgz",
1787 | "integrity": "sha1-U10EXOa2Nj+kARcIRimZXp3zJMc=",
1788 | "dev": true
1789 | }
1790 | }
1791 | },
1792 | "os-homedir": {
1793 | "version": "1.0.2",
1794 | "resolved": "https://registry.npmjs.org/os-homedir/-/os-homedir-1.0.2.tgz",
1795 | "integrity": "sha1-/7xJiDNuDoM94MFox+8VISGqf7M=",
1796 | "dev": true
1797 | },
1798 | "p-finally": {
1799 | "version": "1.0.0",
1800 | "resolved": "https://registry.npmjs.org/p-finally/-/p-finally-1.0.0.tgz",
1801 | "integrity": "sha1-P7z7FbiZpEEjs0ttzBi3JDNqLK4="
1802 | },
1803 | "p-map": {
1804 | "version": "1.2.0",
1805 | "resolved": "https://registry.npmjs.org/p-map/-/p-map-1.2.0.tgz",
1806 | "integrity": "sha512-r6zKACMNhjPJMTl8KcFH4li//gkrXWfbD6feV8l6doRHlzljFWGJ2AP6iKaCJXyZmAUMOPtvbW7EXkbWO/pLEA==",
1807 | "dev": true
1808 | },
1809 | "parse-json": {
1810 | "version": "2.2.0",
1811 | "resolved": "https://registry.npmjs.org/parse-json/-/parse-json-2.2.0.tgz",
1812 | "integrity": "sha1-9ID0BDTvgHQfhGkJn43qGPVaTck=",
1813 | "dev": true,
1814 | "requires": {
1815 | "error-ex": "^1.2.0"
1816 | }
1817 | },
1818 | "parseqs": {
1819 | "version": "0.0.5",
1820 | "resolved": "https://registry.npmjs.org/parseqs/-/parseqs-0.0.5.tgz",
1821 | "integrity": "sha1-1SCKNzjkZ2bikbouoXNoSSGouJ0=",
1822 | "requires": {
1823 | "better-assert": "~1.0.0"
1824 | }
1825 | },
1826 | "parseuri": {
1827 | "version": "0.0.5",
1828 | "resolved": "https://registry.npmjs.org/parseuri/-/parseuri-0.0.5.tgz",
1829 | "integrity": "sha1-gCBKUNTbt3m/3G6+J3jZDkvOMgo=",
1830 | "requires": {
1831 | "better-assert": "~1.0.0"
1832 | }
1833 | },
1834 | "path-key": {
1835 | "version": "2.0.1",
1836 | "resolved": "https://registry.npmjs.org/path-key/-/path-key-2.0.1.tgz",
1837 | "integrity": "sha1-QRyttXTFoUDTpLGRDUDYDMn0C0A="
1838 | },
1839 | "performance-now": {
1840 | "version": "2.1.0",
1841 | "resolved": "https://registry.npmjs.org/performance-now/-/performance-now-2.1.0.tgz",
1842 | "integrity": "sha1-Ywn04OX6kT7BxpMHrjZLSzd8nns="
1843 | },
1844 | "pinkie": {
1845 | "version": "2.0.4",
1846 | "resolved": "https://registry.npmjs.org/pinkie/-/pinkie-2.0.4.tgz",
1847 | "integrity": "sha1-clVrgM+g1IqXToDnckjoDtT3+HA=",
1848 | "dev": true
1849 | },
1850 | "pinkie-promise": {
1851 | "version": "2.0.1",
1852 | "resolved": "https://registry.npmjs.org/pinkie-promise/-/pinkie-promise-2.0.1.tgz",
1853 | "integrity": "sha1-ITXW36ejWMBprJsXh3YogihFD/o=",
1854 | "dev": true,
1855 | "requires": {
1856 | "pinkie": "^2.0.0"
1857 | }
1858 | },
1859 | "prettier": {
1860 | "version": "1.7.4",
1861 | "resolved": "https://registry.npmjs.org/prettier/-/prettier-1.7.4.tgz",
1862 | "integrity": "sha1-XoYkrpNjyA+V7GRFhOzfVddPk/o=",
1863 | "dev": true
1864 | },
1865 | "pretty-format": {
1866 | "version": "21.2.1",
1867 | "resolved": "https://registry.npmjs.org/pretty-format/-/pretty-format-21.2.1.tgz",
1868 | "integrity": "sha512-ZdWPGYAnYfcVP8yKA3zFjCn8s4/17TeYH28MXuC8vTp0o21eXjbFGcOAXZEaDaOFJjc3h2qa7HQNHNshhvoh2A==",
1869 | "dev": true,
1870 | "requires": {
1871 | "ansi-regex": "^3.0.0",
1872 | "ansi-styles": "^3.2.0"
1873 | }
1874 | },
1875 | "pseudomap": {
1876 | "version": "1.0.2",
1877 | "resolved": "https://registry.npmjs.org/pseudomap/-/pseudomap-1.0.2.tgz",
1878 | "integrity": "sha1-8FKijacOYYkX7wqKw0wa5aaChrM="
1879 | },
1880 | "psl": {
1881 | "version": "1.1.32",
1882 | "resolved": "https://registry.npmjs.org/psl/-/psl-1.1.32.tgz",
1883 | "integrity": "sha512-MHACAkHpihU/REGGPLj4sEfc/XKW2bheigvHO1dUqjaKigMp1C8+WLQYRGgeKFMsw5PMfegZcaN8IDXK/cD0+g=="
1884 | },
1885 | "punycode": {
1886 | "version": "2.1.1",
1887 | "resolved": "https://registry.npmjs.org/punycode/-/punycode-2.1.1.tgz",
1888 | "integrity": "sha512-XRsRjdf+j5ml+y/6GKHPZbrF/8p2Yga0JPtdqTIY2Xe5ohJPD9saDJJLPvp9+NSBprVvevdXZybnj2cv8OEd0A=="
1889 | },
1890 | "q": {
1891 | "version": "1.5.1",
1892 | "resolved": "https://registry.npmjs.org/q/-/q-1.5.1.tgz",
1893 | "integrity": "sha1-fjL3W0E4EpHQRhHxvxQQmsAGUdc="
1894 | },
1895 | "qs": {
1896 | "version": "6.5.2",
1897 | "resolved": "https://registry.npmjs.org/qs/-/qs-6.5.2.tgz",
1898 | "integrity": "sha512-N5ZAX4/LxJmF+7wN74pUD6qAh9/wnvdQcjq9TZjevvXzSUo7bfmw91saqMjzGS2xq91/odN2dW/WOl7qQHNDGA=="
1899 | },
1900 | "readable-stream": {
1901 | "version": "1.1.14",
1902 | "resolved": "https://registry.npmjs.org/readable-stream/-/readable-stream-1.1.14.tgz",
1903 | "integrity": "sha1-fPTFTvZI44EwhMY23SB54WbAgdk=",
1904 | "requires": {
1905 | "core-util-is": "~1.0.0",
1906 | "inherits": "~2.0.1",
1907 | "isarray": "0.0.1",
1908 | "string_decoder": "~0.10.x"
1909 | },
1910 | "dependencies": {
1911 | "isarray": {
1912 | "version": "0.0.1",
1913 | "resolved": "https://registry.npmjs.org/isarray/-/isarray-0.0.1.tgz",
1914 | "integrity": "sha1-ihis/Kmo9Bd+Cav8YDiTmwXR7t8="
1915 | }
1916 | }
1917 | },
1918 | "repeating": {
1919 | "version": "2.0.1",
1920 | "resolved": "https://registry.npmjs.org/repeating/-/repeating-2.0.1.tgz",
1921 | "integrity": "sha1-UhTFOpJtNVJwdSf7q0FdvAjQbdo=",
1922 | "dev": true,
1923 | "requires": {
1924 | "is-finite": "^1.0.0"
1925 | }
1926 | },
1927 | "request": {
1928 | "version": "2.88.0",
1929 | "resolved": "https://registry.npmjs.org/request/-/request-2.88.0.tgz",
1930 | "integrity": "sha512-NAqBSrijGLZdM0WZNsInLJpkJokL72XYjUpnB0iwsRgxh7dB6COrHnTBNwN0E+lHDAJzu7kLAkDeY08z2/A0hg==",
1931 | "requires": {
1932 | "aws-sign2": "~0.7.0",
1933 | "aws4": "^1.8.0",
1934 | "caseless": "~0.12.0",
1935 | "combined-stream": "~1.0.6",
1936 | "extend": "~3.0.2",
1937 | "forever-agent": "~0.6.1",
1938 | "form-data": "~2.3.2",
1939 | "har-validator": "~5.1.0",
1940 | "http-signature": "~1.2.0",
1941 | "is-typedarray": "~1.0.0",
1942 | "isstream": "~0.1.2",
1943 | "json-stringify-safe": "~5.0.1",
1944 | "mime-types": "~2.1.19",
1945 | "oauth-sign": "~0.9.0",
1946 | "performance-now": "^2.1.0",
1947 | "qs": "~6.5.2",
1948 | "safe-buffer": "^5.1.2",
1949 | "tough-cookie": "~2.4.3",
1950 | "tunnel-agent": "^0.6.0",
1951 | "uuid": "^3.3.2"
1952 | }
1953 | },
1954 | "request-promise-core": {
1955 | "version": "1.1.2",
1956 | "resolved": "https://registry.npmjs.org/request-promise-core/-/request-promise-core-1.1.2.tgz",
1957 | "integrity": "sha512-UHYyq1MO8GsefGEt7EprS8UrXsm1TxEvFUX1IMTuSLU2Rh7fTIdFtl8xD7JiEYiWU2dl+NYAjCTksTehQUxPag==",
1958 | "requires": {
1959 | "lodash": "^4.17.11"
1960 | }
1961 | },
1962 | "request-promise-native": {
1963 | "version": "1.0.7",
1964 | "resolved": "https://registry.npmjs.org/request-promise-native/-/request-promise-native-1.0.7.tgz",
1965 | "integrity": "sha512-rIMnbBdgNViL37nZ1b3L/VfPOpSi0TqVDQPAvO6U14lMzOLrt5nilxCQqtDKhZeDiW0/hkCXGoQjhgJd/tCh6w==",
1966 | "requires": {
1967 | "request-promise-core": "1.1.2",
1968 | "stealthy-require": "^1.1.1",
1969 | "tough-cookie": "^2.3.3"
1970 | }
1971 | },
1972 | "require-from-string": {
1973 | "version": "1.2.1",
1974 | "resolved": "https://registry.npmjs.org/require-from-string/-/require-from-string-1.2.1.tgz",
1975 | "integrity": "sha1-UpyczvJzgK3+yaL5ZbZJu+5jZBg=",
1976 | "dev": true
1977 | },
1978 | "restore-cursor": {
1979 | "version": "1.0.1",
1980 | "resolved": "https://registry.npmjs.org/restore-cursor/-/restore-cursor-1.0.1.tgz",
1981 | "integrity": "sha1-NGYfRohjJ/7SmRR5FSJS35LapUE=",
1982 | "dev": true,
1983 | "requires": {
1984 | "exit-hook": "^1.0.0",
1985 | "onetime": "^1.0.0"
1986 | }
1987 | },
1988 | "rxjs": {
1989 | "version": "5.4.3",
1990 | "resolved": "https://registry.npmjs.org/rxjs/-/rxjs-5.4.3.tgz",
1991 | "integrity": "sha512-fSNi+y+P9ss+EZuV0GcIIqPUK07DEaMRUtLJvdcvMyFjc9dizuDjere+A4V7JrLGnm9iCc+nagV/4QdMTkqC4A==",
1992 | "dev": true,
1993 | "requires": {
1994 | "symbol-observable": "^1.0.1"
1995 | }
1996 | },
1997 | "safe-buffer": {
1998 | "version": "5.1.2",
1999 | "resolved": "https://registry.npmjs.org/safe-buffer/-/safe-buffer-5.1.2.tgz",
2000 | "integrity": "sha512-Gd2UZBJDkXlY7GbJxfsE8/nvKkUEU1G38c1siN6QP6a9PT9MmHB8GnpscSmMJSoF8LOIrt8ud/wPtojys4G6+g=="
2001 | },
2002 | "safer-buffer": {
2003 | "version": "2.1.2",
2004 | "resolved": "https://registry.npmjs.org/safer-buffer/-/safer-buffer-2.1.2.tgz",
2005 | "integrity": "sha512-YZo3K82SD7Riyi0E1EQPojLz7kpepnSQI9IyPbHHg1XXXevb5dJI7tpyN2ADxGcQbHG7vcyRHk0cbwqcQriUtg=="
2006 | },
2007 | "shebang-command": {
2008 | "version": "1.2.0",
2009 | "resolved": "https://registry.npmjs.org/shebang-command/-/shebang-command-1.2.0.tgz",
2010 | "integrity": "sha1-RKrGW2lbAzmJaMOfNj/uXer98eo=",
2011 | "requires": {
2012 | "shebang-regex": "^1.0.0"
2013 | }
2014 | },
2015 | "shebang-regex": {
2016 | "version": "1.0.0",
2017 | "resolved": "https://registry.npmjs.org/shebang-regex/-/shebang-regex-1.0.0.tgz",
2018 | "integrity": "sha1-2kL0l0DAtC2yypcoVxyxkMmO/qM="
2019 | },
2020 | "signal-exit": {
2021 | "version": "3.0.2",
2022 | "resolved": "https://registry.npmjs.org/signal-exit/-/signal-exit-3.0.2.tgz",
2023 | "integrity": "sha1-tf3AjxKH6hF4Yo5BXiUTK3NkbG0="
2024 | },
2025 | "slice-ansi": {
2026 | "version": "0.0.4",
2027 | "resolved": "https://registry.npmjs.org/slice-ansi/-/slice-ansi-0.0.4.tgz",
2028 | "integrity": "sha1-7b+JA/ZvfOL46v1s7tZeJkyDGzU=",
2029 | "dev": true
2030 | },
2031 | "socket.io": {
2032 | "version": "2.2.0",
2033 | "resolved": "https://registry.npmjs.org/socket.io/-/socket.io-2.2.0.tgz",
2034 | "integrity": "sha512-wxXrIuZ8AILcn+f1B4ez4hJTPG24iNgxBBDaJfT6MsyOhVYiTXWexGoPkd87ktJG8kQEcL/NBvRi64+9k4Kc0w==",
2035 | "requires": {
2036 | "debug": "~4.1.0",
2037 | "engine.io": "~3.3.1",
2038 | "has-binary2": "~1.0.2",
2039 | "socket.io-adapter": "~1.1.0",
2040 | "socket.io-client": "2.2.0",
2041 | "socket.io-parser": "~3.3.0"
2042 | }
2043 | },
2044 | "socket.io-adapter": {
2045 | "version": "1.1.1",
2046 | "resolved": "https://registry.npmjs.org/socket.io-adapter/-/socket.io-adapter-1.1.1.tgz",
2047 | "integrity": "sha1-KoBeihTWNyEk3ZFZrUUC+MsH8Gs="
2048 | },
2049 | "socket.io-client": {
2050 | "version": "2.2.0",
2051 | "resolved": "https://registry.npmjs.org/socket.io-client/-/socket.io-client-2.2.0.tgz",
2052 | "integrity": "sha512-56ZrkTDbdTLmBIyfFYesgOxsjcLnwAKoN4CiPyTVkMQj3zTUh0QAx3GbvIvLpFEOvQWu92yyWICxB0u7wkVbYA==",
2053 | "requires": {
2054 | "backo2": "1.0.2",
2055 | "base64-arraybuffer": "0.1.5",
2056 | "component-bind": "1.0.0",
2057 | "component-emitter": "1.2.1",
2058 | "debug": "~3.1.0",
2059 | "engine.io-client": "~3.3.1",
2060 | "has-binary2": "~1.0.2",
2061 | "has-cors": "1.1.0",
2062 | "indexof": "0.0.1",
2063 | "object-component": "0.0.3",
2064 | "parseqs": "0.0.5",
2065 | "parseuri": "0.0.5",
2066 | "socket.io-parser": "~3.3.0",
2067 | "to-array": "0.1.4"
2068 | },
2069 | "dependencies": {
2070 | "debug": {
2071 | "version": "3.1.0",
2072 | "resolved": "https://registry.npmjs.org/debug/-/debug-3.1.0.tgz",
2073 | "integrity": "sha512-OX8XqP7/1a9cqkxYw2yXss15f26NKWBpDXQd0/uK/KPqdQhxbPa994hnzjcE2VqQpDslf55723cKPUOGSmMY3g==",
2074 | "requires": {
2075 | "ms": "2.0.0"
2076 | }
2077 | },
2078 | "ms": {
2079 | "version": "2.0.0",
2080 | "resolved": "https://registry.npmjs.org/ms/-/ms-2.0.0.tgz",
2081 | "integrity": "sha1-VgiurfwAvmwpAd9fmGF4jeDVl8g="
2082 | }
2083 | }
2084 | },
2085 | "socket.io-parser": {
2086 | "version": "3.3.0",
2087 | "resolved": "https://registry.npmjs.org/socket.io-parser/-/socket.io-parser-3.3.0.tgz",
2088 | "integrity": "sha512-hczmV6bDgdaEbVqhAeVMM/jfUfzuEZHsQg6eOmLgJht6G3mPKMxYm75w2+qhAQZ+4X+1+ATZ+QFKeOZD5riHng==",
2089 | "requires": {
2090 | "component-emitter": "1.2.1",
2091 | "debug": "~3.1.0",
2092 | "isarray": "2.0.1"
2093 | },
2094 | "dependencies": {
2095 | "debug": {
2096 | "version": "3.1.0",
2097 | "resolved": "https://registry.npmjs.org/debug/-/debug-3.1.0.tgz",
2098 | "integrity": "sha512-OX8XqP7/1a9cqkxYw2yXss15f26NKWBpDXQd0/uK/KPqdQhxbPa994hnzjcE2VqQpDslf55723cKPUOGSmMY3g==",
2099 | "requires": {
2100 | "ms": "2.0.0"
2101 | }
2102 | },
2103 | "ms": {
2104 | "version": "2.0.0",
2105 | "resolved": "https://registry.npmjs.org/ms/-/ms-2.0.0.tgz",
2106 | "integrity": "sha1-VgiurfwAvmwpAd9fmGF4jeDVl8g="
2107 | }
2108 | }
2109 | },
2110 | "sprintf-js": {
2111 | "version": "1.0.3",
2112 | "resolved": "https://registry.npmjs.org/sprintf-js/-/sprintf-js-1.0.3.tgz",
2113 | "integrity": "sha1-BOaSb2YolTVPPdAVIDYzuFcpfiw=",
2114 | "dev": true
2115 | },
2116 | "sshpk": {
2117 | "version": "1.16.1",
2118 | "resolved": "https://registry.npmjs.org/sshpk/-/sshpk-1.16.1.tgz",
2119 | "integrity": "sha512-HXXqVUq7+pcKeLqqZj6mHFUMvXtOJt1uoUx09pFW6011inTMxqI8BA8PM95myrIyyKwdnzjdFjLiE6KBPVtJIg==",
2120 | "requires": {
2121 | "asn1": "~0.2.3",
2122 | "assert-plus": "^1.0.0",
2123 | "bcrypt-pbkdf": "^1.0.0",
2124 | "dashdash": "^1.12.0",
2125 | "ecc-jsbn": "~0.1.1",
2126 | "getpass": "^0.1.1",
2127 | "jsbn": "~0.1.0",
2128 | "safer-buffer": "^2.0.2",
2129 | "tweetnacl": "~0.14.0"
2130 | }
2131 | },
2132 | "staged-git-files": {
2133 | "version": "0.0.4",
2134 | "resolved": "https://registry.npmjs.org/staged-git-files/-/staged-git-files-0.0.4.tgz",
2135 | "integrity": "sha1-15fhtVHKemOd7AI33G60u5vhfTU=",
2136 | "dev": true
2137 | },
2138 | "stealthy-require": {
2139 | "version": "1.1.1",
2140 | "resolved": "https://registry.npmjs.org/stealthy-require/-/stealthy-require-1.1.1.tgz",
2141 | "integrity": "sha1-NbCYdbT/SfJqd35QmzCQoyJr8ks="
2142 | },
2143 | "stream-to-observable": {
2144 | "version": "0.1.0",
2145 | "resolved": "https://registry.npmjs.org/stream-to-observable/-/stream-to-observable-0.1.0.tgz",
2146 | "integrity": "sha1-Rb8dny19wJvtgfHDB8Qw5ouEz/4=",
2147 | "dev": true
2148 | },
2149 | "string-width": {
2150 | "version": "2.1.1",
2151 | "resolved": "https://registry.npmjs.org/string-width/-/string-width-2.1.1.tgz",
2152 | "integrity": "sha512-nOqH59deCq9SRHlxq1Aw85Jnt4w6KvLKqWVik6oA9ZklXLNIOlqg4F2yrT1MVaTjAqvVwdfeZ7w7aCvJD7ugkw==",
2153 | "requires": {
2154 | "is-fullwidth-code-point": "^2.0.0",
2155 | "strip-ansi": "^4.0.0"
2156 | }
2157 | },
2158 | "string_decoder": {
2159 | "version": "0.10.31",
2160 | "resolved": "https://registry.npmjs.org/string_decoder/-/string_decoder-0.10.31.tgz",
2161 | "integrity": "sha1-YuIDvEF2bGwoyfyEMB2rHFMQ+pQ="
2162 | },
2163 | "stringify-object": {
2164 | "version": "3.2.1",
2165 | "resolved": "https://registry.npmjs.org/stringify-object/-/stringify-object-3.2.1.tgz",
2166 | "integrity": "sha512-jPcQYw/52HUPP8uOE4kkjxl5bB9LfHkKCTptIk3qw7ozP5XMIMlHMLjt00GGSwW6DJAf/njY5EU6Vpwl4LlBKQ==",
2167 | "dev": true,
2168 | "requires": {
2169 | "get-own-enumerable-property-symbols": "^2.0.1",
2170 | "is-obj": "^1.0.1",
2171 | "is-regexp": "^1.0.0"
2172 | }
2173 | },
2174 | "strip-ansi": {
2175 | "version": "4.0.0",
2176 | "resolved": "https://registry.npmjs.org/strip-ansi/-/strip-ansi-4.0.0.tgz",
2177 | "integrity": "sha1-qEeQIusaw2iocTibY1JixQXuNo8=",
2178 | "requires": {
2179 | "ansi-regex": "^3.0.0"
2180 | }
2181 | },
2182 | "strip-eof": {
2183 | "version": "1.0.0",
2184 | "resolved": "https://registry.npmjs.org/strip-eof/-/strip-eof-1.0.0.tgz",
2185 | "integrity": "sha1-u0P/VZim6wXYm1n80SnJgzE2Br8="
2186 | },
2187 | "strip-indent": {
2188 | "version": "2.0.0",
2189 | "resolved": "https://registry.npmjs.org/strip-indent/-/strip-indent-2.0.0.tgz",
2190 | "integrity": "sha1-XvjbKV0B5u1sv3qrlpmNeCJSe2g=",
2191 | "dev": true
2192 | },
2193 | "stripe": {
2194 | "version": "4.25.0",
2195 | "resolved": "https://registry.npmjs.org/stripe/-/stripe-4.25.0.tgz",
2196 | "integrity": "sha512-sSRPSQ4BTSbdcevVSrtIJzlOCTIAXm8T38DE4zPL6ysYpIWGfIBdo2XnhouLK12/6cuLvaEInlfCZQgoEVzXpQ==",
2197 | "requires": {
2198 | "bluebird": "^2.10.2",
2199 | "lodash.isplainobject": "^4.0.6",
2200 | "object-assign": "^4.1.0",
2201 | "qs": "~6.0.4"
2202 | },
2203 | "dependencies": {
2204 | "bluebird": {
2205 | "version": "2.11.0",
2206 | "resolved": "https://registry.npmjs.org/bluebird/-/bluebird-2.11.0.tgz",
2207 | "integrity": "sha1-U0uQM8AiyVecVro7Plpcqvu2UOE="
2208 | },
2209 | "lodash.isplainobject": {
2210 | "version": "4.0.6",
2211 | "resolved": "https://registry.npmjs.org/lodash.isplainobject/-/lodash.isplainobject-4.0.6.tgz",
2212 | "integrity": "sha1-fFJqUtibRcRcxpC4gWO+BJf1UMs="
2213 | },
2214 | "object-assign": {
2215 | "version": "4.1.1",
2216 | "resolved": "https://registry.npmjs.org/object-assign/-/object-assign-4.1.1.tgz",
2217 | "integrity": "sha1-IQmtx5ZYh8/AXLvUQsrIv7s2CGM="
2218 | },
2219 | "qs": {
2220 | "version": "6.0.4",
2221 | "resolved": "https://registry.npmjs.org/qs/-/qs-6.0.4.tgz",
2222 | "integrity": "sha1-UQGdhHIMk5uCc36EVWp4Izjs6ns="
2223 | }
2224 | }
2225 | },
2226 | "supports-color": {
2227 | "version": "4.4.0",
2228 | "resolved": "https://registry.npmjs.org/supports-color/-/supports-color-4.4.0.tgz",
2229 | "integrity": "sha512-rKC3+DyXWgK0ZLKwmRsrkyHVZAjNkfzeehuFWdGGcqGDTZFH73+RH6S/RDAAxl9GusSjZSUWYLmT9N5pzXFOXQ==",
2230 | "requires": {
2231 | "has-flag": "^2.0.0"
2232 | }
2233 | },
2234 | "symbol-observable": {
2235 | "version": "1.0.4",
2236 | "resolved": "https://registry.npmjs.org/symbol-observable/-/symbol-observable-1.0.4.tgz",
2237 | "integrity": "sha1-Kb9hXUqnEhvdiYsi1LP5vE4qoD0=",
2238 | "dev": true
2239 | },
2240 | "term-size": {
2241 | "version": "1.2.0",
2242 | "resolved": "https://registry.npmjs.org/term-size/-/term-size-1.2.0.tgz",
2243 | "integrity": "sha1-RYuDiH8oj8Vtb/+/rSYuJmOO+mk=",
2244 | "requires": {
2245 | "execa": "^0.7.0"
2246 | }
2247 | },
2248 | "to-array": {
2249 | "version": "0.1.4",
2250 | "resolved": "https://registry.npmjs.org/to-array/-/to-array-0.1.4.tgz",
2251 | "integrity": "sha1-F+bBH3PdTz10zaek/zI46a2b+JA="
2252 | },
2253 | "touch": {
2254 | "version": "0.0.3",
2255 | "resolved": "https://registry.npmjs.org/touch/-/touch-0.0.3.tgz",
2256 | "integrity": "sha1-Ua7z1ElXHU8oel2Hyci0kYGg2x0=",
2257 | "requires": {
2258 | "nopt": "~1.0.10"
2259 | },
2260 | "dependencies": {
2261 | "nopt": {
2262 | "version": "1.0.10",
2263 | "resolved": "https://registry.npmjs.org/nopt/-/nopt-1.0.10.tgz",
2264 | "integrity": "sha1-bd0hvSoxQXuScn3Vhfim83YI6+4=",
2265 | "requires": {
2266 | "abbrev": "1"
2267 | }
2268 | }
2269 | }
2270 | },
2271 | "tough-cookie": {
2272 | "version": "2.4.3",
2273 | "resolved": "https://registry.npmjs.org/tough-cookie/-/tough-cookie-2.4.3.tgz",
2274 | "integrity": "sha512-Q5srk/4vDM54WJsJio3XNn6K2sCG+CQ8G5Wz6bZhRZoAe/+TxjWB/GlFAnYEbkYVlON9FMk/fE3h2RLpPXo4lQ==",
2275 | "requires": {
2276 | "psl": "^1.1.24",
2277 | "punycode": "^1.4.1"
2278 | },
2279 | "dependencies": {
2280 | "punycode": {
2281 | "version": "1.4.1",
2282 | "resolved": "https://registry.npmjs.org/punycode/-/punycode-1.4.1.tgz",
2283 | "integrity": "sha1-wNWmOycYgArY4esPpSachN1BhF4="
2284 | }
2285 | }
2286 | },
2287 | "traverse": {
2288 | "version": "0.3.9",
2289 | "resolved": "https://registry.npmjs.org/traverse/-/traverse-0.3.9.tgz",
2290 | "integrity": "sha1-cXuPIgzAu3tE5AUUwisui7xw2Lk="
2291 | },
2292 | "tunnel-agent": {
2293 | "version": "0.6.0",
2294 | "resolved": "https://registry.npmjs.org/tunnel-agent/-/tunnel-agent-0.6.0.tgz",
2295 | "integrity": "sha1-J6XeoGs2sEoKmWZ3SykIaPD8QP0=",
2296 | "requires": {
2297 | "safe-buffer": "^5.0.1"
2298 | }
2299 | },
2300 | "tweetnacl": {
2301 | "version": "0.14.5",
2302 | "resolved": "https://registry.npmjs.org/tweetnacl/-/tweetnacl-0.14.5.tgz",
2303 | "integrity": "sha1-WuaBd/GS1EViadEIr6k/+HQ/T2Q="
2304 | },
2305 | "uri-js": {
2306 | "version": "4.2.2",
2307 | "resolved": "https://registry.npmjs.org/uri-js/-/uri-js-4.2.2.tgz",
2308 | "integrity": "sha512-KY9Frmirql91X2Qgjry0Wd4Y+YTdrdZheS8TFwvkbLWf/G5KNJDCh6pKL5OZctEW4+0Baa5idK2ZQuELRwPznQ==",
2309 | "requires": {
2310 | "punycode": "^2.1.0"
2311 | }
2312 | },
2313 | "uuid": {
2314 | "version": "3.3.2",
2315 | "resolved": "https://registry.npmjs.org/uuid/-/uuid-3.3.2.tgz",
2316 | "integrity": "sha512-yXJmeNaw3DnnKAOKJE51sL/ZaYfWJRl1pK9dr19YFCu0ObS231AB1/LbqTKRAQ5kw8A90rA6fr4riOUpTZvQZA=="
2317 | },
2318 | "verror": {
2319 | "version": "1.10.0",
2320 | "resolved": "https://registry.npmjs.org/verror/-/verror-1.10.0.tgz",
2321 | "integrity": "sha1-OhBcoXBTr1XW4nDB+CiGguGNpAA=",
2322 | "requires": {
2323 | "assert-plus": "^1.0.0",
2324 | "core-util-is": "1.0.2",
2325 | "extsprintf": "^1.2.0"
2326 | }
2327 | },
2328 | "which": {
2329 | "version": "1.3.0",
2330 | "resolved": "https://registry.npmjs.org/which/-/which-1.3.0.tgz",
2331 | "integrity": "sha512-xcJpopdamTuY5duC/KnTTNBraPK54YwpenP4lzxU8H91GudWpFv38u0CKjclE1Wi2EH2EDz5LRcHcKbCIzqGyg==",
2332 | "requires": {
2333 | "isexe": "^2.0.0"
2334 | }
2335 | },
2336 | "widest-line": {
2337 | "version": "1.0.0",
2338 | "resolved": "https://registry.npmjs.org/widest-line/-/widest-line-1.0.0.tgz",
2339 | "integrity": "sha1-DAnIXCqUaD0Nfq+O4JfVZL8OEFw=",
2340 | "requires": {
2341 | "string-width": "^1.0.1"
2342 | },
2343 | "dependencies": {
2344 | "ansi-regex": {
2345 | "version": "2.1.1",
2346 | "resolved": "https://registry.npmjs.org/ansi-regex/-/ansi-regex-2.1.1.tgz",
2347 | "integrity": "sha1-w7M6te42DYbg5ijwRorn7yfWVN8="
2348 | },
2349 | "is-fullwidth-code-point": {
2350 | "version": "1.0.0",
2351 | "resolved": "https://registry.npmjs.org/is-fullwidth-code-point/-/is-fullwidth-code-point-1.0.0.tgz",
2352 | "integrity": "sha1-754xOG8DGn8NZDr4L95QxFfvAMs=",
2353 | "requires": {
2354 | "number-is-nan": "^1.0.0"
2355 | }
2356 | },
2357 | "string-width": {
2358 | "version": "1.0.2",
2359 | "resolved": "https://registry.npmjs.org/string-width/-/string-width-1.0.2.tgz",
2360 | "integrity": "sha1-EYvfW4zcUaKn5w0hHgfisLmxB9M=",
2361 | "requires": {
2362 | "code-point-at": "^1.0.0",
2363 | "is-fullwidth-code-point": "^1.0.0",
2364 | "strip-ansi": "^3.0.0"
2365 | }
2366 | },
2367 | "strip-ansi": {
2368 | "version": "3.0.1",
2369 | "resolved": "https://registry.npmjs.org/strip-ansi/-/strip-ansi-3.0.1.tgz",
2370 | "integrity": "sha1-ajhfuIU9lS1f8F0Oiq+UJ43GPc8=",
2371 | "requires": {
2372 | "ansi-regex": "^2.0.0"
2373 | }
2374 | }
2375 | }
2376 | },
2377 | "ws": {
2378 | "version": "6.1.4",
2379 | "resolved": "https://registry.npmjs.org/ws/-/ws-6.1.4.tgz",
2380 | "integrity": "sha512-eqZfL+NE/YQc1/ZynhojeV8q+H050oR8AZ2uIev7RU10svA9ZnJUddHcOUZTJLinZ9yEfdA2kSATS2qZK5fhJA==",
2381 | "requires": {
2382 | "async-limiter": "~1.0.0"
2383 | }
2384 | },
2385 | "xmlhttprequest-ssl": {
2386 | "version": "1.5.5",
2387 | "resolved": "https://registry.npmjs.org/xmlhttprequest-ssl/-/xmlhttprequest-ssl-1.5.5.tgz",
2388 | "integrity": "sha1-wodrBhaKrcQOV9l+gRkayPQ5iz4="
2389 | },
2390 | "yallist": {
2391 | "version": "2.1.2",
2392 | "resolved": "https://registry.npmjs.org/yallist/-/yallist-2.1.2.tgz",
2393 | "integrity": "sha1-HBH5IY8HYImkfdUS+TxmmaaoHVI="
2394 | },
2395 | "yeast": {
2396 | "version": "0.1.2",
2397 | "resolved": "https://registry.npmjs.org/yeast/-/yeast-0.1.2.tgz",
2398 | "integrity": "sha1-AI4G2AlDIMNy28L47XagymyKxBk="
2399 | }
2400 | }
2401 | }
2402 |
--------------------------------------------------------------------------------
/package.json:
--------------------------------------------------------------------------------
1 | {
2 | "name": "stripe-webhook-monitor",
3 | "version": "1.0.0",
4 | "description": "Realtime monitor for Stripe webhooks.",
5 | "author": "Michael Glukhovsky {{ eventType }}
506 | 507 |{{ this.event.data.object.description }}
513 |520 | 521 | HideInspect JSON 522 |
523 |527 | 528 | HideShow metadata 529 |
530 |{{ json | prettify }}