├── .gitignore
├── LICENSE
├── README.md
├── leaflet-geotiff-plotty.js
├── leaflet-geotiff-vector-arrows.js
├── leaflet-geotiff.js
└── package.json
/.gitignore:
--------------------------------------------------------------------------------
1 | /node_modules/
2 |
--------------------------------------------------------------------------------
/LICENSE:
--------------------------------------------------------------------------------
1 | MIT License
2 |
3 | Copyright (c) 2017 Stuart Matthews
4 |
5 | Permission is hereby granted, free of charge, to any person obtaining a copy
6 | of this software and associated documentation files (the "Software"), to deal
7 | in the Software without restriction, including without limitation the rights
8 | to use, copy, modify, merge, publish, distribute, sublicense, and/or sell
9 | copies of the Software, and to permit persons to whom the Software is
10 | furnished to do so, subject to the following conditions:
11 |
12 | The above copyright notice and this permission notice shall be included in all
13 | copies or substantial portions of the Software.
14 |
15 | THE SOFTWARE IS PROVIDED "AS IS", WITHOUT WARRANTY OF ANY KIND, EXPRESS OR
16 | IMPLIED, INCLUDING BUT NOT LIMITED TO THE WARRANTIES OF MERCHANTABILITY,
17 | FITNESS FOR A PARTICULAR PURPOSE AND NONINFRINGEMENT. IN NO EVENT SHALL THE
18 | AUTHORS OR COPYRIGHT HOLDERS BE LIABLE FOR ANY CLAIM, DAMAGES OR OTHER
19 | LIABILITY, WHETHER IN AN ACTION OF CONTRACT, TORT OR OTHERWISE, ARISING FROM,
20 | OUT OF OR IN CONNECTION WITH THE SOFTWARE OR THE USE OR OTHER DEALINGS IN THE
21 | SOFTWARE.
22 |
--------------------------------------------------------------------------------
/README.md:
--------------------------------------------------------------------------------
1 | # leaflet-geotiff
2 | A [LeafletJS](http://www.leafletjs.com) plugin for displaying geoTIFF raster data. Data can drawn as colored rasters or directon arrows. The layer can be clipped using a polygon.
3 |
4 | **[DEMO](https://stuartmatthews.github.io/leaflet-geotiff/)**
5 |
6 | 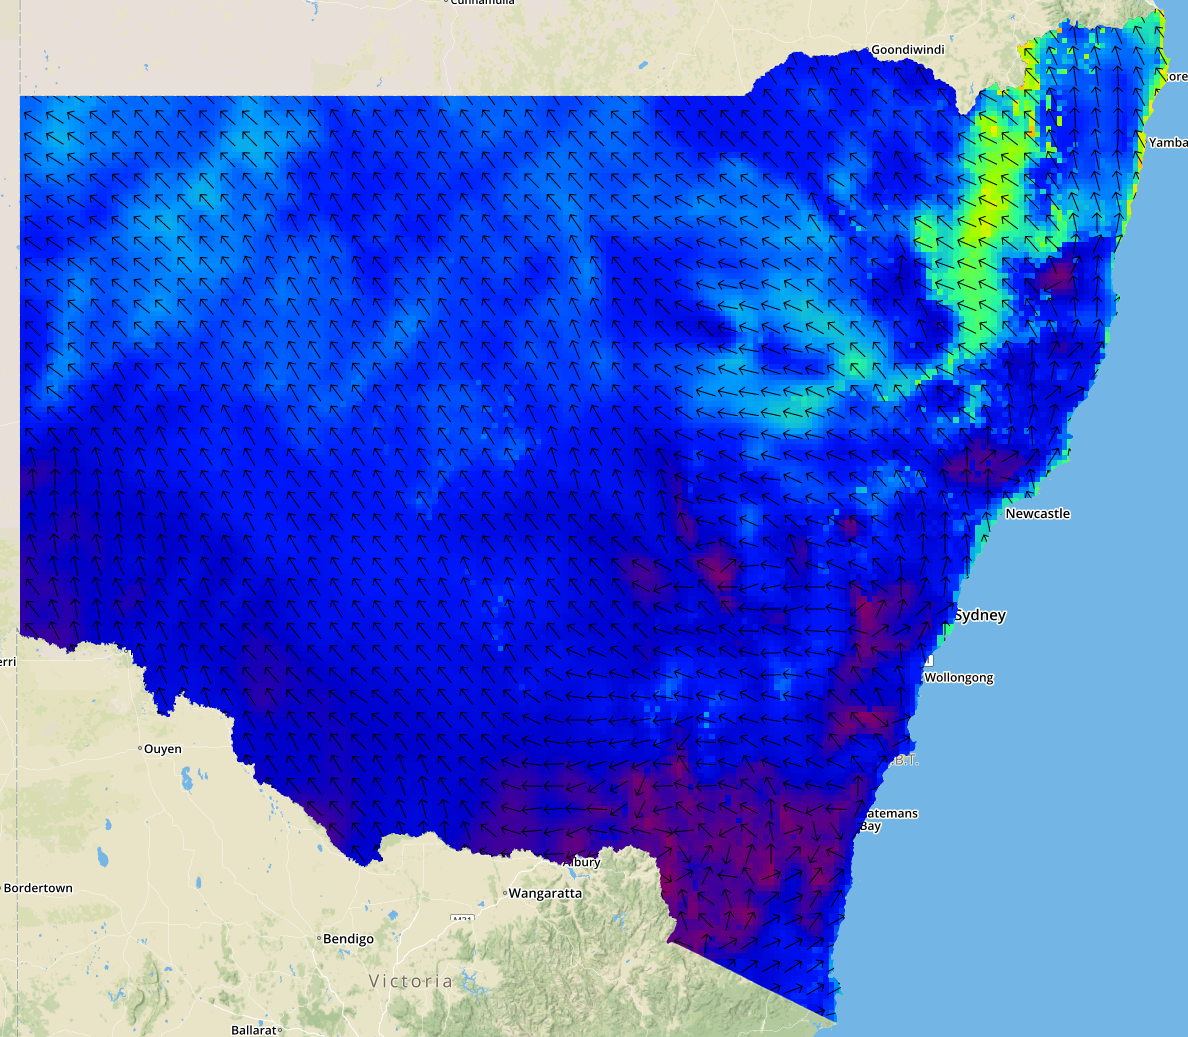
7 |
8 | ## Instructions
9 |
10 | ### 1. Include the JavaScript file and dependencies
11 | ```html
12 |
13 |
14 |
15 |
16 |
17 |
18 |
19 | ```
20 |
21 | ### 2. Add a geoTIFF layer
22 | ```
23 | // Create map
24 | var layer = L.leafletGeotiff(url, options).addTo(map);
25 | ```
26 |
27 | Parameters:
28 | * `url` - GeoTIFF file URL. Currently only EPSG:4326 files are supported.
29 | * `options`:
30 | * `bounds` - (optional) An array specifying the corners of the data, e.g. [[40.712216, -74.22655], [40.773941, -74.12544]]. If omitted the image bounds will be read from the geoTIFF file.
31 | * `band` - (optional, default = 0) geoTIFF band to read.
32 | * `image` - (optional, default = 0) geoTIFF image to read.
33 | * `clip` - (optional, default = undefined) Clipping polygon, provided as an array of [lat,lon] coordinates. Note that this is the Leaflet [lat,lon] convention, not geoJSON [lon,lat].
34 | * `renderer` - Renderer to use (see below).
35 |
36 | #### Renderer
37 |
38 | **Raster data rendered using Plotty**: `L.LeafletGeotiff.plotty(options)`
39 | Options:
40 | - `displayMin` - (optional, default = 0) Minimum values to plot.
41 | - `displayMax` - (optional, default = 1) Maximum values to plot.
42 | - `clampLow`, `clampHigh` - (optional, default = true) If true values outside `displayMin` to `displayMax` will be rendered as if they were valid values.
43 | - `colorScale` - (optional, default = "viridis"). Plotty color scale used to render the image.
44 |
45 | New color scales can be created using plotty's `addColorScale` method.
46 |
47 | **Vector data rendered as arrows**: `L.LeafletGeotiff.vectorArrows(options)`
48 | Options:
49 |
50 | - `arrowSize` - (optional, default = 20) Size in pixels of direction arrows for vector data.
51 |
52 | ### Advanced usage options
53 | 1. Data values can be extracted using the `getValueAtLatLng(lat,lng)` method.
54 | 2. Custom renderer can be implemented by extending `L.LeafletGeotiffRenderer`.
55 |
56 | ## Dependencies
57 |
58 | * [Leaflet >= 0.7.7](http://leafletjs.com)
59 | * [geotiff.js](https://github.com/constantinius/geotiff.js)
60 | * [plotty](https://github.com/santilland/plotty) (optional)
--------------------------------------------------------------------------------
/leaflet-geotiff-plotty.js:
--------------------------------------------------------------------------------
1 | // Depends on:
2 | // https://github.com/santilland/plotty
3 |
4 | if (typeof module !== 'undefined' && typeof module.exports !== 'undefined') {
5 | var L = require('leaflet-geotiff');
6 | var plotty = require('plotty');
7 | }
8 |
9 | L.LeafletGeotiff.Plotty = L.LeafletGeotiffRenderer.extend({
10 |
11 | options: {
12 | colorScale: 'viridis',
13 | clampLow: true,
14 | clampHigh: true,
15 | displayMin: 0,
16 | displayMax: 1
17 | },
18 |
19 | initialize: function(options) {
20 | if (typeof (plotty) === 'undefined') {
21 | throw new Error("plotty not defined");
22 | }
23 | this.name = "Plotty";
24 |
25 | L.setOptions(this, options);
26 |
27 | this._preLoadColorScale();
28 | },
29 |
30 | setColorScale: function (colorScale) {
31 | this.options.colorScale = colorScale;
32 | this.parent._reset();
33 | },
34 |
35 | setDisplayRange: function (min,max) {
36 | this.options.displayMin = min;
37 | this.options.displayMax = max;
38 | this.parent._reset();
39 | },
40 |
41 | _preLoadColorScale: function () {
42 | var canvas = document.createElement('canvas');
43 | var plot = new plotty.plot({
44 | canvas: canvas,
45 | data: [0],
46 | width: 1, height: 1,
47 | domain: [this.options.displayMin, this.options.displayMax],
48 | colorScale: this.options.colorScale,
49 | clampLow: this.options.clampLow,
50 | clampHigh: this.options.clampHigh,
51 | });
52 | this.colorScaleData = plot.colorScaleCanvas.toDataURL();
53 | },
54 |
55 | render: function(raster, canvas, ctx, args) {
56 | var plottyCanvas = document.createElement("canvas");
57 | var plot = new plotty.plot({
58 | data: raster.data,
59 | width: raster.width, height: raster.height,
60 | domain: [this.options.displayMin, this.options.displayMax],
61 | colorScale: this.options.colorScale,
62 | clampLow: this.options.clampLow,
63 | clampHigh: this.options.clampHigh,
64 | canvas: plottyCanvas,
65 | useWebGL: false
66 | });
67 | plot.setNoDataValue(-9999);
68 | plot.render();
69 |
70 | this.colorScaleData = plot.colorScaleCanvas.toDataURL();
71 |
72 | var rasterImageData = plottyCanvas.getContext("2d").getImageData(0, 0, plottyCanvas.width, plottyCanvas.height);
73 | var imageData = this.parent.transform(rasterImageData, args);
74 | ctx.putImageData(imageData, args.xStart, args.yStart);
75 | }
76 |
77 | });
78 |
79 | L.LeafletGeotiff.plotty = function (options) {
80 | return new L.LeafletGeotiff.Plotty(options);
81 | };
82 |
83 | if (typeof module !== 'undefined' && typeof module.exports !== 'undefined') {
84 | module.exports = L.LeafletGeotiff;
85 | }
--------------------------------------------------------------------------------
/leaflet-geotiff-vector-arrows.js:
--------------------------------------------------------------------------------
1 | if (typeof module !== 'undefined' && typeof module.exports !== 'undefined') {
2 | var L = require('leaflet-geotiff');
3 | }
4 |
5 | L.LeafletGeotiff.VectorArrows = L.LeafletGeotiffRenderer.extend({
6 |
7 | options: {
8 | arrowSize: 20
9 | },
10 |
11 | initialize: function(options) {
12 | this.name = "Vector";
13 | L.setOptions(this, options);
14 | },
15 |
16 | setArrowSize: function (colorScale) {
17 | this.options.colorScale = colorScale;
18 | this.parent._reset();
19 | },
20 |
21 | render: function(raster, canvas, ctx, args) {
22 | var arrowSize = this.options.arrowSize;
23 | var gridPxelSize = (args.rasterPixelBounds.max.x - args.rasterPixelBounds.min.x) / raster.width;
24 | var stride = Math.max(1,Math.floor(1.2*arrowSize/gridPxelSize));
25 |
26 | for (var y=0;y=0) { //Ignore missing values
30 | //calculate lat-lon of of this point
31 | var currentLng = this.parent._rasterBounds._southWest.lng + (x+0.5)*args.lngSpan;
32 | var currentLat = this.parent._rasterBounds._northEast.lat - (y+0.5)*args.latSpan;
33 |
34 | //convert lat-lon to pixel cordinates
35 | var projected = this.parent._map.latLngToContainerPoint(L.latLng(currentLat,currentLng)); //If slow could unpack this calculation
36 | var xProjected = projected.x;
37 | var yProjected = projected.y;
38 |
39 | //draw an arrow
40 | ctx.save();
41 | ctx.translate(xProjected, yProjected);
42 | ctx.rotate((90+raster.data[rasterIndex])*Math.PI/180);
43 | ctx.beginPath();
44 | ctx.moveTo(-arrowSize/2, 0);
45 | ctx.lineTo(+arrowSize/2, 0);
46 | ctx.moveTo(arrowSize*0.25, -arrowSize*0.25);
47 | ctx.lineTo(+arrowSize/2, 0);
48 | ctx.lineTo(arrowSize*0.25, arrowSize*0.25);
49 | ctx.stroke();
50 | ctx.restore();
51 | }
52 | }
53 | }
54 | }
55 |
56 | });
57 |
58 | L.LeafletGeotiff.vectorArrows= function (options) {
59 | return new L.LeafletGeotiff.VectorArrows(options);
60 | };
61 |
62 | if (typeof module !== 'undefined' && typeof module.exports !== 'undefined') {
63 | module.exports = L.LeafletGeotiff;
64 | }
--------------------------------------------------------------------------------
/leaflet-geotiff.js:
--------------------------------------------------------------------------------
1 | // Ideas from:
2 | // https://github.com/ScanEx/Leaflet.imageTransform/blob/master/src/L.ImageTransform.js
3 | // https://github.com/BenjaminVadant/leaflet-ugeojson
4 |
5 | // Depends on:
6 | // https://github.com/constantinius/geotiff.js
7 |
8 | // Note this will only work with ESPG:4326 tiffs
9 |
10 | if (typeof module !== 'undefined' && typeof module.exports !== 'undefined') {
11 | var L = require('leaflet');
12 | var GeoTIFF = require('geotiff');
13 | }
14 |
15 | L.LeafletGeotiff = L.ImageOverlay.extend({
16 |
17 | options: {
18 | arrowSize: 20,
19 | band: 0,
20 | image: 0,
21 | renderer: null
22 | },
23 |
24 | initialize: function (url, options) {
25 | if(typeof(GeoTIFF) === 'undefined'){
26 | throw new Error("GeoTIFF not defined");
27 | };
28 |
29 | this._url = url;
30 | this.raster = {};
31 | L.Util.setOptions(this, options);
32 |
33 | if (this.options.bounds) {
34 | this._rasterBounds = L.latLngBounds(options.bounds);
35 | }
36 | if (this.options.renderer) {
37 | this.options.renderer.setParent(this);
38 | }
39 |
40 | this._getData();
41 | },
42 | setURL: function(newURL) {
43 | this._url = newURL;
44 | this._getData();
45 | },
46 | onAdd: function (map) {
47 | this._map = map;
48 | if (!this._image) {
49 | this._initImage();
50 | }
51 |
52 | map._panes.overlayPane.appendChild(this._image);
53 |
54 | map.on('moveend', this._reset, this);
55 |
56 | if (map.options.zoomAnimation && L.Browser.any3d) {
57 | map.on('zoomanim', this._animateZoom, this);
58 | }
59 |
60 | this._reset();
61 | },
62 | onRemove: function (map) {
63 | map.getPanes().overlayPane.removeChild(this._image);
64 |
65 | map.off('moveend', this._reset, this);
66 |
67 | if (map.options.zoomAnimation) {
68 | map.off('zoomanim', this._animateZoom, this);
69 | }
70 | },
71 | _getData: function() {
72 | var self = this;
73 | var request = new XMLHttpRequest();
74 | request.onload = function() {
75 | if (this.status >= 200 && this.status < 400) {
76 | self._parseTIFF(this.response);
77 | } //TODO else handle error
78 | };
79 | request.open("GET", this._url, true);
80 | request.responseType = "arraybuffer";
81 | request.send();
82 | },
83 | _parseTIFF: function (arrayBuffer) {
84 | this.tiff = GeoTIFF.parse(arrayBuffer);
85 | this.setBand(this.options.band);
86 |
87 | if (!this.options.bounds) {
88 | var image = this.tiff.getImage(this.options.image);
89 | var meta = image.getFileDirectory();
90 | var x_min = meta.ModelTiepoint[3];
91 | var x_max = x_min + meta.ModelPixelScale[0]*meta.ImageWidth;
92 | var y_min = meta.ModelTiepoint[4];
93 | var y_max = y_min - meta.ModelPixelScale[1]*meta.ImageLength;
94 | this._rasterBounds = L.latLngBounds([[y_min,x_min],[y_max,x_max]]);
95 | this._reset();
96 | }
97 | },
98 | setBand: function (band) {
99 | this.options.band = band;
100 |
101 | var image = this.tiff.getImage(this.options.image);
102 | this.raster.data = image.readRasters({samples: [band]})[0];
103 | this.raster.width = image.getWidth();
104 | this.raster.height = image.getHeight();
105 |
106 | this._reset()
107 | },
108 | getRasterArray: function () {
109 | return this.raster.data;
110 | },
111 | getRasterCols: function () {
112 | return this.raster.width;
113 | },
114 | getRasterRows: function () {
115 | return this.raster.height;
116 | },
117 | getValueAtLatLng: function (lat, lng) {
118 | try {
119 | var x = Math.floor(this.raster.width*(lng - this._rasterBounds._southWest.lng)/(this._rasterBounds._northEast.lng - this._rasterBounds._southWest.lng));
120 | var y = this.raster.height-Math.ceil(this.raster.height*(lat - this._rasterBounds._southWest.lat)/(this._rasterBounds._northEast.lat - this._rasterBounds._southWest.lat));
121 | var i = y*this.raster.width+x;
122 | return this.raster.data[i];
123 | }
124 | catch(err) {
125 | return undefined;
126 | }
127 | },
128 | _animateZoom: function (e) {
129 | if (L.version >= "1.0") {
130 | var scale = this._map.getZoomScale(e.zoom),
131 | offset = this._map._latLngBoundsToNewLayerBounds(this._map.getBounds(), e.zoom, e.center).min;
132 | L.DomUtil.setTransform(this._image, offset, scale);
133 | } else {
134 | var scale = this._map.getZoomScale(e.zoom),
135 | nw = this._map.getBounds().getNorthWest(),
136 | se = this._map.getBounds().getSouthEast(),
137 | topLeft = this._map._latLngToNewLayerPoint(nw, e.zoom, e.center),
138 | size = this._map._latLngToNewLayerPoint(se, e.zoom, e.center)._subtract(topLeft);
139 | this._image.style[L.DomUtil.TRANSFORM] =
140 | L.DomUtil.getTranslateString(topLeft) + ' scale(' + scale + ') ';
141 | }
142 | },
143 | _reset: function () {
144 | if (this.hasOwnProperty('_map')) {
145 | if (this._rasterBounds) {
146 | topLeft = this._map.latLngToLayerPoint(this._map.getBounds().getNorthWest()),
147 | size = this._map.latLngToLayerPoint(this._map.getBounds().getSouthEast())._subtract(topLeft);
148 |
149 | L.DomUtil.setPosition(this._image, topLeft);
150 | this._image.style.width = size.x + 'px';
151 | this._image.style.height = size.y + 'px';
152 |
153 | this._drawImage();
154 | };
155 | };
156 | },
157 | setClip: function(clipLatLngs) {
158 | this.options.clip = clipLatLngs;
159 | this._reset();
160 | },
161 | _clipMaskToPixelPoints: function() {
162 | if (this.options.clip) {
163 | var topLeft = this._map.latLngToLayerPoint(this._map.getBounds().getNorthWest());
164 | var pixelClipPoints = [];
165 | for (var p = 0; p < this.options.clip.length; p++) {
166 | var mercPoint = this._map.latLngToLayerPoint(this.options.clip[p]),
167 | pixel = L.point(mercPoint.x - topLeft.x, mercPoint.y - topLeft.y);
168 | pixelClipPoints.push(pixel);
169 | }
170 | this._pixelClipPoints = pixelClipPoints;
171 | } else {
172 | this._pixelClipPoints = undefined;
173 | }
174 | },
175 | _drawImage: function () {
176 | if (this.raster.hasOwnProperty('data')) {
177 | var args = {};
178 | topLeft = this._map.latLngToLayerPoint(this._map.getBounds().getNorthWest()),
179 | size = this._map.latLngToLayerPoint(this._map.getBounds().getSouthEast())._subtract(topLeft);
180 | args.rasterPixelBounds = L.bounds(this._map.latLngToContainerPoint(this._rasterBounds.getNorthWest()),this._map.latLngToContainerPoint(this._rasterBounds.getSouthEast()));
181 | args.xStart = (args.rasterPixelBounds.min.x>0 ? args.rasterPixelBounds.min.x : 0);
182 | args.xFinish = (args.rasterPixelBounds.max.x0 ? args.rasterPixelBounds.min.y : 0);
184 | args.yFinish = (args.rasterPixelBounds.max.y= 0; i--) {
220 | var pix = this._pixelClipPoints[i];
221 | ctx['lineTo'](pix.x, pix.y);
222 | }
223 | ctx.closePath();
224 | ctx.fill();
225 | }
226 |
227 | this._image.src = String(plotCanvas.toDataURL());
228 | }
229 | },
230 |
231 | transform: function(rasterImageData, args) {
232 | //Create image data and Uint32 views of data to speed up copying
233 | var imageData = new ImageData(args.plotWidth, args.plotHeight);
234 | var outData = imageData.data;
235 | var outPixelsU32 = new Uint32Array(outData.buffer);
236 | var inData = rasterImageData.data;
237 | var inPixelsU32 = new Uint32Array(inData.buffer);
238 |
239 | var zoom = this._map.getZoom();
240 | var scale = this._map.options.crs.scale(zoom);
241 | var d = 57.29577951308232; //L.LatLng.RAD_TO_DEG;
242 |
243 | var transformationA = this._map.options.crs.transformation._a;
244 | var transformationB = this._map.options.crs.transformation._b;
245 | var transformationC = this._map.options.crs.transformation._c;
246 | var transformationD = this._map.options.crs.transformation._d;
247 | if (L.version >= "1.0") {
248 | transformationA = transformationA*this._map.options.crs.projection.R;
249 | transformationC = transformationC*this._map.options.crs.projection.R;
250 | }
251 |
252 | for (var y=0;y