27 |
28 |
29 |
--------------------------------------------------------------------------------
/README.md:
--------------------------------------------------------------------------------
1 | # swoole-vmstat
2 | 本项目只作为swoole入门示例
3 | > 如果有使用`laravel` 的朋友,推荐另外一个项目[fast-laravel](https://github.com/toxmc/fast-laravel).欢迎使用,喜欢的话给个star鼓励下。谢谢各位
4 |
5 | ## 演示地址
6 | * http://ip:port
7 | > ip=127.0.0.1,port=8888 演示地址 http://127.0.0.1:8888
8 |
9 | ## 依赖
10 |
11 | * PHP 5.3+
12 | * Swoole 1.7.16
13 | * Linux, OS X and basic Windows support (Thanks to cygwin)
14 |
15 | ## 安装 Swoole扩展
16 |
17 | 1. Install via pecl
18 |
19 | ```
20 | pecl install swoole
21 | ```
22 |
23 | 2. Install from source
24 |
25 | ```
26 | sudo apt-get install php5-dev
27 | git clone https://github.com/swoole/swoole-src.git
28 | cd swoole-src
29 | phpize
30 | ./configure
31 | make && make install
32 | ```
33 |
34 | ## 运行
35 |
36 | 1. `cd swoole-vmstat/server`
37 | 2. `php server.php`
38 | 3. 修改`web`目录下`stats.js`代码 `var ws = new ReconnectingWebSocket("ws://192.168.1.10:8888");` 改成服务器的IP
39 | 4. 用浏览器打开`web`目录下的`index.html`或打开地址 `http://ip:port`
40 |
41 | ## 运行结果
42 |
43 | 1. 打开页面如下所示
44 | 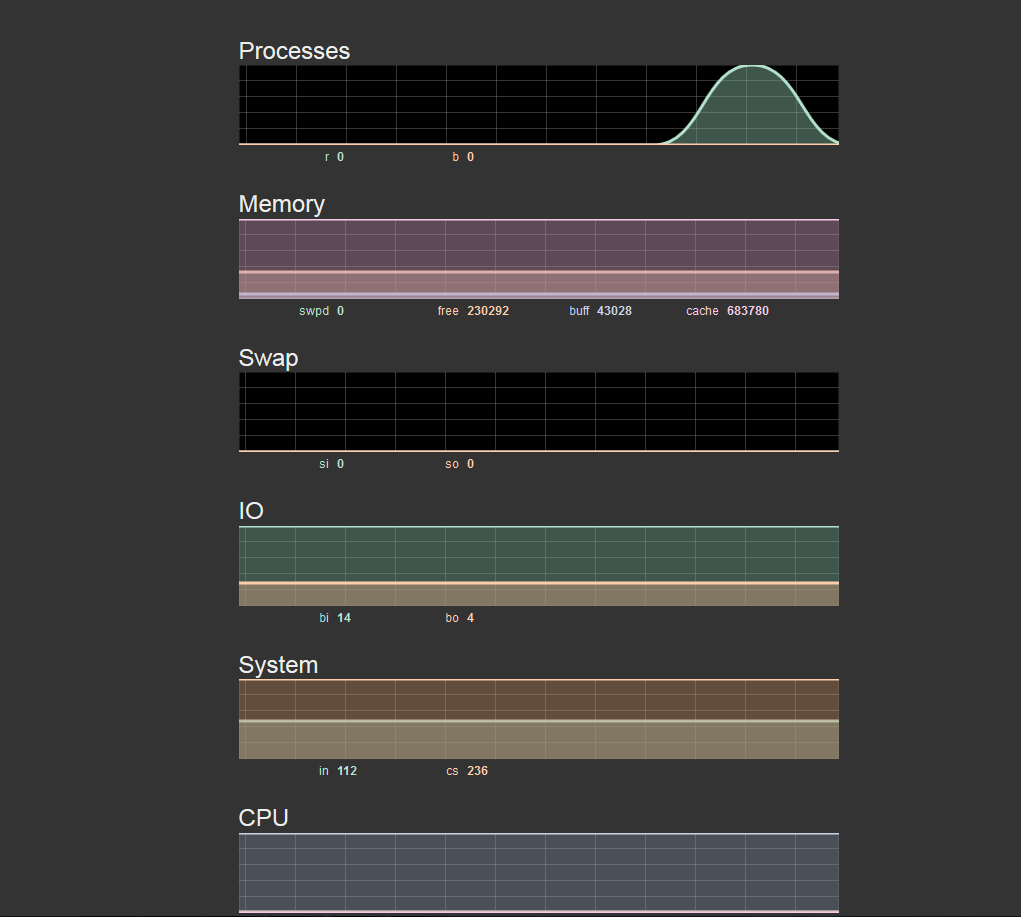
45 | 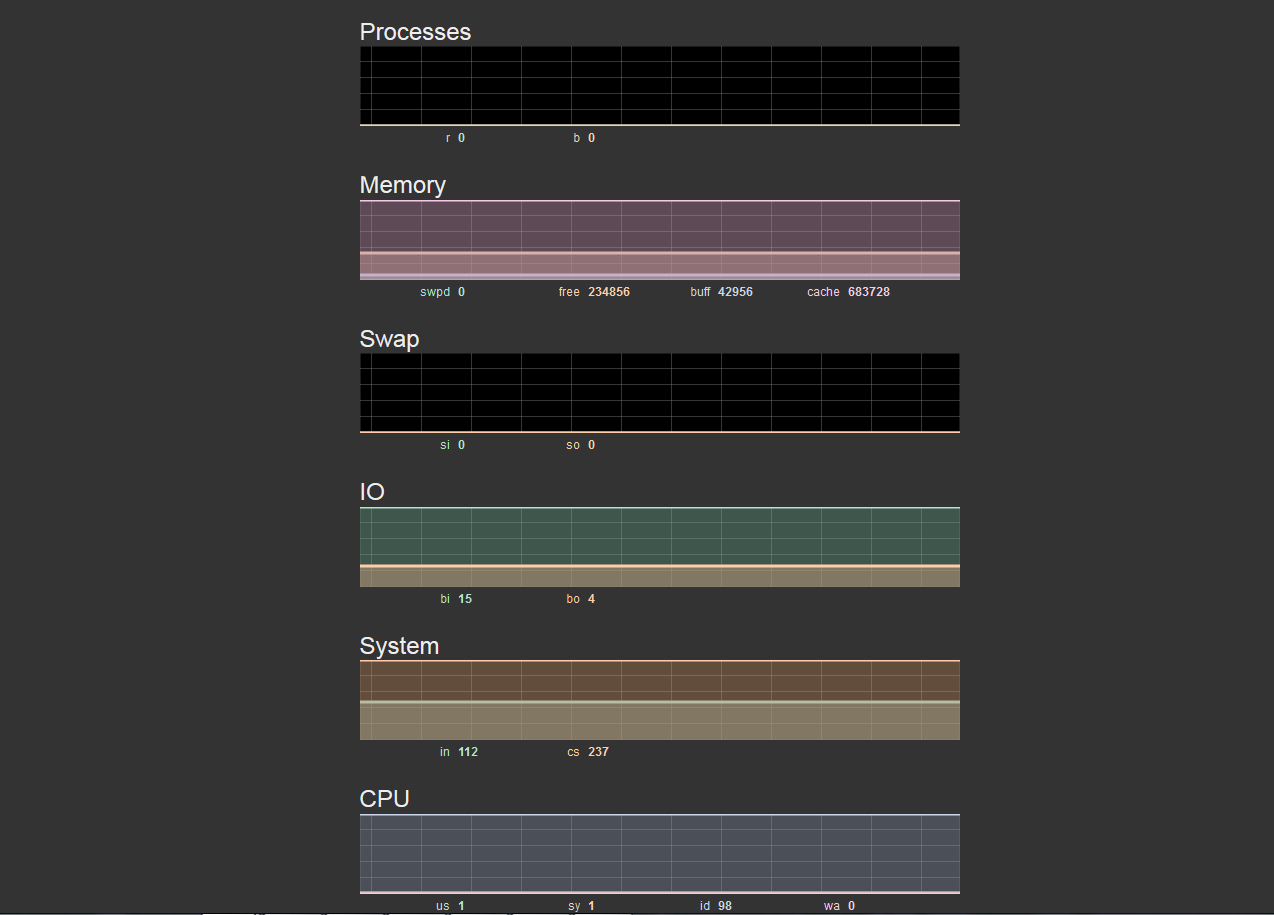
46 |
47 | ## nginx配置文件
48 | 在`doc/swoole-vmstat.conf`
49 | ## workerman实现
50 | [传送门](https://github.com/walkor/workerman-vmstat)
51 |
--------------------------------------------------------------------------------
/web/stats.js:
--------------------------------------------------------------------------------
1 | var allTimeSeries = {};
2 | var allValueLabels = {};
3 | var descriptions = {
4 | 'Processes': {
5 | 'r': 'Number of processes waiting for run time',
6 | 'b': 'Number of processes in uninterruptible sleep'
7 | },
8 | 'Memory': {
9 | 'swpd': 'Amount of virtual memory used',
10 | 'free': 'Amount of idle memory',
11 | 'buff': 'Amount of memory used as buffers',
12 | 'cache': 'Amount of memory used as cache'
13 | },
14 | 'Swap': {
15 | 'si': 'Amount of memory swapped in from disk',
16 | 'so': 'Amount of memory swapped to disk'
17 | },
18 | 'IO': {
19 | 'bi': 'Blocks received from a block device (blocks/s)',
20 | 'bo': 'Blocks sent to a block device (blocks/s)'
21 | },
22 | 'System': {
23 | 'in': 'Number of interrupts per second, including the clock',
24 | 'cs': 'Number of context switches per second'
25 | },
26 | 'CPU': {
27 | 'us': 'Time spent running non-kernel code (user time, including nice time)',
28 | 'sy': 'Time spent running kernel code (system time)',
29 | 'id': 'Time spent idle',
30 | 'wa': 'Time spent waiting for IO'
31 | }
32 | }
33 |
34 | function streamStats() {
35 |
36 | var ws = new ReconnectingWebSocket("ws://127.0.0.1:8888");
37 | var lineCount;
38 | var colHeadings;
39 |
40 | ws.onopen = function() {
41 | console.log('connect');
42 | lineCount = 0;
43 | };
44 |
45 | ws.onclose = function() {
46 | console.log('disconnect');
47 | };
48 |
49 | ws.onmessage = function(e) {
50 | console.log(e.data);
51 | switch (lineCount++) {
52 | case 0: // ignore first line
53 | break;
54 |
55 | case 1: // column headings
56 | colHeadings = e.data.trim().split(/ +/);
57 | break;
58 |
59 | default: // subsequent lines
60 | if (e.data == 'ping') {
61 | ws.send('pong');
62 | } else {
63 | var colValues = e.data.trim().split(/ +/);
64 | var stats = {};
65 | for (var i = 0; i < colHeadings.length; i++) {
66 | stats[colHeadings[i]] = parseInt(colValues[i]);
67 | }
68 | receiveStats(stats);
69 | }
70 | }
71 | };
72 | }
73 |
74 | function initCharts() {
75 | Object.each(descriptions, function(sectionName, values) {
76 | var section = $('.chart.template').clone().removeClass('template').appendTo('#charts');
77 |
78 | section.find('.title').text(sectionName);
79 |
80 | var smoothie = new SmoothieChart({
81 | grid: {
82 | sharpLines: true,
83 | verticalSections: 5,
84 | strokeStyle: 'rgba(119,119,119,0.45)',
85 | millisPerLine: 1000
86 | },
87 | minValue: 0,
88 | labels: {
89 | disabled: true
90 | }
91 | });
92 | smoothie.streamTo(section.find('canvas').get(0), 1000);
93 |
94 | var colors = chroma.brewer['Pastel2'];
95 | var index = 0;
96 | Object.each(values, function(name, valueDescription) {
97 | var color = colors[index++];
98 |
99 | var timeSeries = new TimeSeries();
100 | smoothie.addTimeSeries(timeSeries, {
101 | strokeStyle: color,
102 | fillStyle: chroma(color).darken().alpha(0.5).css(),
103 | lineWidth: 3
104 | });
105 | allTimeSeries[name] = timeSeries;
106 |
107 | var statLine = section.find('.stat.template').clone().removeClass('template').appendTo(section.find('.stats'));
108 | statLine.attr('title', valueDescription).css('color', color);
109 | statLine.find('.stat-name').text(name);
110 | allValueLabels[name] = statLine.find('.stat-value');
111 | });
112 | });
113 | }
114 |
115 | function receiveStats(stats) {
116 | Object.each(stats, function(name, value) {
117 | var timeSeries = allTimeSeries[name];
118 | if (timeSeries) {
119 | timeSeries.append(Date.now(), value);
120 | allValueLabels[name].text(value);
121 | }
122 | });
123 | }
124 |
125 | $(function() {
126 | initCharts();
127 | streamStats();
128 | });
129 |
--------------------------------------------------------------------------------
/web/js/reconnecting-websocket.js:
--------------------------------------------------------------------------------
1 | // MIT License:
2 | //
3 | // Copyright (c) 2010-2012, Joe Walnes
4 | //
5 | // Permission is hereby granted, free of charge, to any person obtaining a copy
6 | // of this software and associated documentation files (the "Software"), to deal
7 | // in the Software without restriction, including without limitation the rights
8 | // to use, copy, modify, merge, publish, distribute, sublicense, and/or sell
9 | // copies of the Software, and to permit persons to whom the Software is
10 | // furnished to do so, subject to the following conditions:
11 | //
12 | // The above copyright notice and this permission notice shall be included in
13 | // all copies or substantial portions of the Software.
14 | //
15 | // THE SOFTWARE IS PROVIDED "AS IS", WITHOUT WARRANTY OF ANY KIND, EXPRESS OR
16 | // IMPLIED, INCLUDING BUT NOT LIMITED TO THE WARRANTIES OF MERCHANTABILITY,
17 | // FITNESS FOR A PARTICULAR PURPOSE AND NONINFRINGEMENT. IN NO EVENT SHALL THE
18 | // AUTHORS OR COPYRIGHT HOLDERS BE LIABLE FOR ANY CLAIM, DAMAGES OR OTHER
19 | // LIABILITY, WHETHER IN AN ACTION OF CONTRACT, TORT OR OTHERWISE, ARISING FROM,
20 | // OUT OF OR IN CONNECTION WITH THE SOFTWARE OR THE USE OR OTHER DEALINGS IN
21 | // THE SOFTWARE.
22 |
23 | /**
24 | * This behaves like a WebSocket in every way, except if it fails to connect,
25 | * or it gets disconnected, it will repeatedly poll until it succesfully connects
26 | * again.
27 | *
28 | * It is API compatible, so when you have:
29 | * ws = new WebSocket('ws://....');
30 | * you can replace with:
31 | * ws = new ReconnectingWebSocket('ws://....');
32 | *
33 | * The event stream will typically look like:
34 | * onconnecting
35 | * onopen
36 | * onmessage
37 | * onmessage
38 | * onclose // lost connection
39 | * onconnecting
40 | * onopen // sometime later...
41 | * onmessage
42 | * onmessage
43 | * etc...
44 | *
45 | * It is API compatible with the standard WebSocket API.
46 | *
47 | * Latest version: https://github.com/joewalnes/reconnecting-websocket/
48 | * - Joe Walnes
49 | */
50 | function ReconnectingWebSocket(url, protocols) {
51 | protocols = protocols || [];
52 |
53 | // These can be altered by calling code.
54 | this.debug = false;
55 | this.reconnectInterval = 1000;
56 | this.timeoutInterval = 2000;
57 |
58 | var self = this;
59 | var ws;
60 | var forcedClose = false;
61 | var timedOut = false;
62 |
63 | this.url = url;
64 | this.protocols = protocols;
65 | this.readyState = WebSocket.CONNECTING;
66 | this.URL = url; // Public API
67 |
68 | this.onopen = function(event) {
69 | };
70 |
71 | this.onclose = function(event) {
72 | };
73 |
74 | this.onconnecting = function(event) {
75 | };
76 |
77 | this.onmessage = function(event) {
78 | };
79 |
80 | this.onerror = function(event) {
81 | };
82 |
83 | function connect(reconnectAttempt) {
84 | ws = new WebSocket(url, protocols);
85 |
86 | self.onconnecting();
87 | if (self.debug || ReconnectingWebSocket.debugAll) {
88 | console.debug('ReconnectingWebSocket', 'attempt-connect', url);
89 | }
90 |
91 | var localWs = ws;
92 | var timeout = setTimeout(function() {
93 | if (self.debug || ReconnectingWebSocket.debugAll) {
94 | console.debug('ReconnectingWebSocket', 'connection-timeout', url);
95 | }
96 | timedOut = true;
97 | localWs.close();
98 | timedOut = false;
99 | }, self.timeoutInterval);
100 |
101 | ws.onopen = function(event) {
102 | clearTimeout(timeout);
103 | if (self.debug || ReconnectingWebSocket.debugAll) {
104 | console.debug('ReconnectingWebSocket', 'onopen', url);
105 | }
106 | self.readyState = WebSocket.OPEN;
107 | reconnectAttempt = false;
108 | self.onopen(event);
109 | };
110 |
111 | ws.onclose = function(event) {
112 | clearTimeout(timeout);
113 | ws = null;
114 | if (forcedClose) {
115 | self.readyState = WebSocket.CLOSED;
116 | self.onclose(event);
117 | } else {
118 | self.readyState = WebSocket.CONNECTING;
119 | self.onconnecting();
120 | if (!reconnectAttempt && !timedOut) {
121 | if (self.debug || ReconnectingWebSocket.debugAll) {
122 | console.debug('ReconnectingWebSocket', 'onclose', url);
123 | }
124 | self.onclose(event);
125 | }
126 | setTimeout(function() {
127 | connect(true);
128 | }, self.reconnectInterval);
129 | }
130 | };
131 | ws.onmessage = function(event) {
132 | if (self.debug || ReconnectingWebSocket.debugAll) {
133 | console.debug('ReconnectingWebSocket', 'onmessage', url, event.data);
134 | }
135 | self.onmessage(event);
136 | };
137 | ws.onerror = function(event) {
138 | if (self.debug || ReconnectingWebSocket.debugAll) {
139 | console.debug('ReconnectingWebSocket', 'onerror', url, event);
140 | }
141 | self.onerror(event);
142 | };
143 | }
144 | connect(url);
145 |
146 | this.send = function(data) {
147 | if (ws) {
148 | if (self.debug || ReconnectingWebSocket.debugAll) {
149 | console.debug('ReconnectingWebSocket', 'send', url, data);
150 | }
151 | return ws.send(data);
152 | } else {
153 | throw 'INVALID_STATE_ERR : Pausing to reconnect websocket';
154 | }
155 | };
156 |
157 | this.close = function() {
158 | if (ws) {
159 | forcedClose = true;
160 | ws.close();
161 | }
162 | };
163 |
164 | /**
165 | * Additional public API method to refresh the connection if still open (close, re-open).
166 | * For example, if the app suspects bad data / missed heart beats, it can try to refresh.
167 | */
168 | this.refresh = function() {
169 | if (ws) {
170 | ws.close();
171 | }
172 | };
173 | }
174 |
175 | /**
176 | * Setting this to true is the equivalent of setting all instances of ReconnectingWebSocket.debug to true.
177 | */
178 | ReconnectingWebSocket.debugAll = false;
179 |
180 |
--------------------------------------------------------------------------------
/server/server.php:
--------------------------------------------------------------------------------
1 | false]);
9 |
10 | $vmstat_path = '/usr/bin/vmstat'; //vmstat命令绝对路径
11 | $interval = 1; //vmstat 命令参数。指定每个报告之间的时间量
12 | $count = 1000000000; //vmstat 命令参数。决定生成的报告数目和相互间隔的秒数
13 | $host = "0.0.0.0"; //代表监听全部地址
14 | $port = 8888; //监听端口号
15 |
16 | /**
17 | * MasterPid命令时格式化输出
18 | * ManagerPid命令时格式化输出
19 | * WorkerId命令时格式化输出
20 | * WorkerPid命令时格式化输出
21 | * @var int
22 | */
23 | $config = array(
24 | 'max_master_pid_length' => 12,
25 | 'max_manager_pid_length' => 12,
26 | 'max_worker_id_length' => 12,
27 | 'max_worker_pid_length' => 12,
28 | );
29 |
30 |
31 | $table = new swoole_table(1024);
32 | $table->column('cmd', swoole_table::TYPE_STRING, 32);
33 | $table->column('interval', swoole_table::TYPE_INT, 2);
34 | $table->column('count', swoole_table::TYPE_STRING, 10);
35 | $table->create();
36 | $table->set('vmstat', array(
37 | 'cmd' => $vmstat_path,
38 | 'interval' => $interval,
39 | 'count' => $count
40 | ));
41 |
42 | /**
43 | * 创建一个子进程
44 | * 子进程创建成功后调用函数callback_vmstat
45 | */
46 | $process = new swoole_process('callback_vmstat', true);
47 | $pid = $process->start();
48 | /**
49 | * swoole_process回调函数
50 | * @param swoole_process $worker
51 | */
52 | function callback_vmstat(swoole_process $worker)
53 | {
54 | global $table;
55 | $vmstat = $table->get('vmstat');
56 | $cmd = $vmstat['cmd'];
57 | $interval = $vmstat['interval'];
58 | $count = $vmstat['count'];
59 | $worker->exec($cmd, array(
60 | $interval,
61 | $count
62 | ));
63 | }
64 |
65 | $try = 3;
66 | while ($try--) {
67 | if ($pid) {
68 | $ret = swoole_process::wait(false);
69 | if ($ret) {
70 | CreateProcess($process);
71 | }
72 | }
73 | usleep(100000);
74 | }
75 |
76 | /**
77 | * wsl1无法使用vmstat命令,模拟命令使用
78 | * @param $process
79 | */
80 | function CreateProcess(&$process)
81 | {
82 | $process = new swoole_process(function (swoole_process $worker) {
83 | swoole_set_process_name(sprintf('php-ps:%s', 'vmstat'));
84 | $data = [
85 | " 1 0 0 7875564 196540 2772784 0 0 0 19 0 0 1 1 98 0 0",
86 | " 0 0 0 7875784 196540 2772804 0 0 0 76 2305 3946 1 0 99 0 0",
87 | " 0 0 0 7875576 196540 2772804 0 0 0 0 2783 4207 1 1 98 0 0",
88 | " 0 0 0 7875756 196540 2772804 0 0 0 0 2833 4189 1 1 98 0 0",
89 | " 0 0 0 7876212 196540 2772804 0 0 0 0 2309 3969 1 0 99 0 0",
90 | " 0 0 0 7875312 196540 2772804 0 0 0 0 2420 4036 1 0 99 0 0",
91 | " 0 0 0 7875296 196540 2772804 0 0 0 0 2632 4095 1 1 98 0 0",
92 | " 0 0 0 7875344 196540 2772804 0 0 0 0 2112 3876 1 0 99 0 0",
93 | " 0 0 0 7874904 196540 2772804 0 0 0 0 2949 4279 1 1 98 0 0",
94 | ];
95 | $len = count($data);
96 | for ($j = 0; $j < 16000; $j++) {
97 | sleep(1);
98 | echo $data[rand(0, $len - 1)];
99 | }
100 | }, true);
101 | $pid = $process->start();
102 | }
103 |
104 | /**
105 | * 创建一个websocket服务器
106 | * 端口8888
107 | */
108 | $server = new swoole_websocket_server($host, $port);
109 | $server->table = $table; //将table保存在serv对象上
110 |
111 | /**
112 | * websocket server配置
113 | */
114 | $server->set(array(
115 | 'worker_num' => 1,
116 | //worker进程数量
117 | 'daemonize' => false,
118 | //守护进程设置成true
119 | 'max_request' => 1000,
120 | //最大请求次数,当请求大于它时,将会自动重启该worker
121 | 'log_file' => 'log/swoole.log',
122 | //指定swoole错误日志文件
123 | 'dispatch_mode' => 2,
124 | // 1 和 3底层会屏蔽onConnect/onClose事件
125 | 'heartbeat_idle_time' => 20,
126 | //超过连接最大时间 自动关闭
127 | 'heartbeat_check_interval' => 10,
128 | //每隔多长时间遍历一次客户端fd
129 | 'document_root' => dirname(__DIR__) . '/web',
130 | // v4.4.0以下版本, 此处必须为绝对路径
131 | 'enable_static_handler' => true,
132 | ));
133 |
134 | //心跳检测
135 | $process_ping = new swoole_process(function ($process_ping) use ($server) {
136 | swoole_timer_tick(10000, function () use ($server) {
137 | foreach ($server->connections as $fd) {
138 | if ($server->isEstablished($fd)) {
139 | if ($server->connection_info($fd)) {
140 | // 发送ping包
141 | $server->push($fd, 'ping');
142 | } else {
143 | $server->close($fd);
144 | }
145 | }
146 | }
147 | });
148 | });
149 |
150 | $server->addprocess($process_ping);
151 |
152 | /**
153 | * websocket server start
154 | * 成功后回调
155 | */
156 | $server->on('start', function ($serv) use ($config, $host, $port) {
157 | echo "\033[1A\n\033[K-----------------------\033[47;30m SWOOLE \033[0m-----------------------------\n\033[0m";
158 | echo 'swoole:' . swoole_version() . "\tphp:" . PHP_VERSION . "\thost:{$host}\tport:{$port}\n";
159 | echo "------------------------\033[47;30m WORKERS \033[0m---------------------------\n";
160 | echo "\033[47;30mMasterPid\033[0m", str_pad('', $config['max_master_pid_length'] + 2 - strlen('MasterPid')),
161 | "\033[47;30mManagerPid\033[0m", str_pad('', $config['max_manager_pid_length'] + 2 - strlen('ManagerPid')),
162 | "\033[47;30mWorkerId\033[0m", str_pad('', $config['max_worker_id_length'] + 2 - strlen('WorkerId')),
163 | "\033[47;30mWorkerPid\033[0m", str_pad('', $config['max_worker_pid_length'] + 2 - strlen('WorkerPid')), "\n";
164 | });
165 |
166 | /**
167 | * 当WebSocket客户端与服务器建立连接并完成握手后会回调此函数。
168 | */
169 | $server->on('open', function (swoole_websocket_server $server, $request) {
170 | echo "server: handshake success with fd{$request->fd}\n";
171 | $server->push($request->fd, "procs -----------memory---------- ---swap-- -----io---- -system-- ----cpu----\n");
172 | $server->push($request->fd, "r b swpd free buff cache si so bi bo in cs us sy id wa\n");
173 | });
174 |
175 | /**
176 | * 当服务器收到来自客户端的数据帧时会回调此函数。
177 | */
178 | $server->on('message', function (swoole_websocket_server $server, $frame) {
179 | // echo "receive from {$frame->fd}:{$frame->data},opcode:{$frame->opcode},fin:{$frame->finish}\n";
180 | // $server->push($frame->fd, "this is server");
181 | if ($frame->data == 'pong') {
182 | echo "接收pong包\n";
183 | }
184 | });
185 |
186 | /**
187 | * websocket server继承于http server所以也可以处理http请求,这里用来处理静态文件
188 | */
189 | $server->on('request', function (swoole_http_request $request, swoole_http_response $response) {
190 | $uri = $request->server['request_uri'] ?? null;
191 | $blackList = ['php', 'htaccess', 'config'];
192 | $extension = substr(strrchr($uri, '.'), 1);
193 | if ($extension && in_array($extension, $blackList)) {
194 | $response->status(403);
195 | $response->end("403 Forbidden");
196 | return;
197 | }
198 |
199 | // 重定向到首页
200 | if (in_array($uri, [null, '/', '/index'])) {
201 | $uri = "/index.html";
202 | }
203 |
204 | $publicPath = dirname(__DIR__)."/web";
205 | $filename = $publicPath . $uri;
206 | if (! is_file($filename) || filesize($filename) === 0) {
207 | $response->status(404);
208 | $response->end("404 Not Found");
209 | return;
210 | }
211 | $response->status(200);
212 | $mime = mime_content_type($filename);
213 | if ($extension === 'js') {
214 | $mime = 'text/javascript';
215 | } elseif ($extension === 'css') {
216 | $mime = 'text/css';
217 | }
218 | $response->header('Content-Type', $mime);
219 | $response->sendfile($filename);
220 | });
221 |
222 | /**
223 | * 当客户端关闭的时候调用
224 | */
225 | $server->on('close', function ($ser, $fd) {
226 | echo "client {$fd} closed\n";
227 | });
228 |
229 | /**
230 | * 当worker 启动的时候调用
231 | */
232 | $server->on('workerStart', function ($serv, $worker_id) use ($process, $config) {
233 | echo str_pad($serv->master_pid, $config['max_master_pid_length'] + 2),
234 | str_pad($serv->manager_pid, $config['max_manager_pid_length'] + 2),
235 | str_pad($serv->worker_id, $config['max_worker_id_length'] + 2),
236 | str_pad($serv->worker_pid, $config['max_worker_pid_length']), "\n";
237 |
238 | //将process->pipe加入到swoole的reactor事件监听中
239 | swoole_event_add($process->pipe, function ($pipe) use ($process, $serv) {
240 | $str = $process->read();
241 | $conn_list = $serv->connection_list();
242 | if (!empty($conn_list)) {
243 | foreach ($conn_list as $fd) {
244 | if ($serv->isEstablished($fd)) {
245 | $info = $serv->connection_info($fd);
246 | if (!empty($info)) {
247 | $serv->push($fd, $str);
248 | } else {
249 | $serv->close($fd);
250 | }
251 | }
252 | }
253 | }
254 | });
255 | });
256 |
257 | $server->start();
--------------------------------------------------------------------------------
/LICENSE:
--------------------------------------------------------------------------------
1 | Apache License
2 | Version 2.0, January 2004
3 | http://www.apache.org/licenses/
4 |
5 | TERMS AND CONDITIONS FOR USE, REPRODUCTION, AND DISTRIBUTION
6 |
7 | 1. Definitions.
8 |
9 | "License" shall mean the terms and conditions for use, reproduction,
10 | and distribution as defined by Sections 1 through 9 of this document.
11 |
12 | "Licensor" shall mean the copyright owner or entity authorized by
13 | the copyright owner that is granting the License.
14 |
15 | "Legal Entity" shall mean the union of the acting entity and all
16 | other entities that control, are controlled by, or are under common
17 | control with that entity. For the purposes of this definition,
18 | "control" means (i) the power, direct or indirect, to cause the
19 | direction or management of such entity, whether by contract or
20 | otherwise, or (ii) ownership of fifty percent (50%) or more of the
21 | outstanding shares, or (iii) beneficial ownership of such entity.
22 |
23 | "You" (or "Your") shall mean an individual or Legal Entity
24 | exercising permissions granted by this License.
25 |
26 | "Source" form shall mean the preferred form for making modifications,
27 | including but not limited to software source code, documentation
28 | source, and configuration files.
29 |
30 | "Object" form shall mean any form resulting from mechanical
31 | transformation or translation of a Source form, including but
32 | not limited to compiled object code, generated documentation,
33 | and conversions to other media types.
34 |
35 | "Work" shall mean the work of authorship, whether in Source or
36 | Object form, made available under the License, as indicated by a
37 | copyright notice that is included in or attached to the work
38 | (an example is provided in the Appendix below).
39 |
40 | "Derivative Works" shall mean any work, whether in Source or Object
41 | form, that is based on (or derived from) the Work and for which the
42 | editorial revisions, annotations, elaborations, or other modifications
43 | represent, as a whole, an original work of authorship. For the purposes
44 | of this License, Derivative Works shall not include works that remain
45 | separable from, or merely link (or bind by name) to the interfaces of,
46 | the Work and Derivative Works thereof.
47 |
48 | "Contribution" shall mean any work of authorship, including
49 | the original version of the Work and any modifications or additions
50 | to that Work or Derivative Works thereof, that is intentionally
51 | submitted to Licensor for inclusion in the Work by the copyright owner
52 | or by an individual or Legal Entity authorized to submit on behalf of
53 | the copyright owner. For the purposes of this definition, "submitted"
54 | means any form of electronic, verbal, or written communication sent
55 | to the Licensor or its representatives, including but not limited to
56 | communication on electronic mailing lists, source code control systems,
57 | and issue tracking systems that are managed by, or on behalf of, the
58 | Licensor for the purpose of discussing and improving the Work, but
59 | excluding communication that is conspicuously marked or otherwise
60 | designated in writing by the copyright owner as "Not a Contribution."
61 |
62 | "Contributor" shall mean Licensor and any individual or Legal Entity
63 | on behalf of whom a Contribution has been received by Licensor and
64 | subsequently incorporated within the Work.
65 |
66 | 2. Grant of Copyright License. Subject to the terms and conditions of
67 | this License, each Contributor hereby grants to You a perpetual,
68 | worldwide, non-exclusive, no-charge, royalty-free, irrevocable
69 | copyright license to reproduce, prepare Derivative Works of,
70 | publicly display, publicly perform, sublicense, and distribute the
71 | Work and such Derivative Works in Source or Object form.
72 |
73 | 3. Grant of Patent License. Subject to the terms and conditions of
74 | this License, each Contributor hereby grants to You a perpetual,
75 | worldwide, non-exclusive, no-charge, royalty-free, irrevocable
76 | (except as stated in this section) patent license to make, have made,
77 | use, offer to sell, sell, import, and otherwise transfer the Work,
78 | where such license applies only to those patent claims licensable
79 | by such Contributor that are necessarily infringed by their
80 | Contribution(s) alone or by combination of their Contribution(s)
81 | with the Work to which such Contribution(s) was submitted. If You
82 | institute patent litigation against any entity (including a
83 | cross-claim or counterclaim in a lawsuit) alleging that the Work
84 | or a Contribution incorporated within the Work constitutes direct
85 | or contributory patent infringement, then any patent licenses
86 | granted to You under this License for that Work shall terminate
87 | as of the date such litigation is filed.
88 |
89 | 4. Redistribution. You may reproduce and distribute copies of the
90 | Work or Derivative Works thereof in any medium, with or without
91 | modifications, and in Source or Object form, provided that You
92 | meet the following conditions:
93 |
94 | (a) You must give any other recipients of the Work or
95 | Derivative Works a copy of this License; and
96 |
97 | (b) You must cause any modified files to carry prominent notices
98 | stating that You changed the files; and
99 |
100 | (c) You must retain, in the Source form of any Derivative Works
101 | that You distribute, all copyright, patent, trademark, and
102 | attribution notices from the Source form of the Work,
103 | excluding those notices that do not pertain to any part of
104 | the Derivative Works; and
105 |
106 | (d) If the Work includes a "NOTICE" text file as part of its
107 | distribution, then any Derivative Works that You distribute must
108 | include a readable copy of the attribution notices contained
109 | within such NOTICE file, excluding those notices that do not
110 | pertain to any part of the Derivative Works, in at least one
111 | of the following places: within a NOTICE text file distributed
112 | as part of the Derivative Works; within the Source form or
113 | documentation, if provided along with the Derivative Works; or,
114 | within a display generated by the Derivative Works, if and
115 | wherever such third-party notices normally appear. The contents
116 | of the NOTICE file are for informational purposes only and
117 | do not modify the License. You may add Your own attribution
118 | notices within Derivative Works that You distribute, alongside
119 | or as an addendum to the NOTICE text from the Work, provided
120 | that such additional attribution notices cannot be construed
121 | as modifying the License.
122 |
123 | You may add Your own copyright statement to Your modifications and
124 | may provide additional or different license terms and conditions
125 | for use, reproduction, or distribution of Your modifications, or
126 | for any such Derivative Works as a whole, provided Your use,
127 | reproduction, and distribution of the Work otherwise complies with
128 | the conditions stated in this License.
129 |
130 | 5. Submission of Contributions. Unless You explicitly state otherwise,
131 | any Contribution intentionally submitted for inclusion in the Work
132 | by You to the Licensor shall be under the terms and conditions of
133 | this License, without any additional terms or conditions.
134 | Notwithstanding the above, nothing herein shall supersede or modify
135 | the terms of any separate license agreement you may have executed
136 | with Licensor regarding such Contributions.
137 |
138 | 6. Trademarks. This License does not grant permission to use the trade
139 | names, trademarks, service marks, or product names of the Licensor,
140 | except as required for reasonable and customary use in describing the
141 | origin of the Work and reproducing the content of the NOTICE file.
142 |
143 | 7. Disclaimer of Warranty. Unless required by applicable law or
144 | agreed to in writing, Licensor provides the Work (and each
145 | Contributor provides its Contributions) on an "AS IS" BASIS,
146 | WITHOUT WARRANTIES OR CONDITIONS OF ANY KIND, either express or
147 | implied, including, without limitation, any warranties or conditions
148 | of TITLE, NON-INFRINGEMENT, MERCHANTABILITY, or FITNESS FOR A
149 | PARTICULAR PURPOSE. You are solely responsible for determining the
150 | appropriateness of using or redistributing the Work and assume any
151 | risks associated with Your exercise of permissions under this License.
152 |
153 | 8. Limitation of Liability. In no event and under no legal theory,
154 | whether in tort (including negligence), contract, or otherwise,
155 | unless required by applicable law (such as deliberate and grossly
156 | negligent acts) or agreed to in writing, shall any Contributor be
157 | liable to You for damages, including any direct, indirect, special,
158 | incidental, or consequential damages of any character arising as a
159 | result of this License or out of the use or inability to use the
160 | Work (including but not limited to damages for loss of goodwill,
161 | work stoppage, computer failure or malfunction, or any and all
162 | other commercial damages or losses), even if such Contributor
163 | has been advised of the possibility of such damages.
164 |
165 | 9. Accepting Warranty or Additional Liability. While redistributing
166 | the Work or Derivative Works thereof, You may choose to offer,
167 | and charge a fee for, acceptance of support, warranty, indemnity,
168 | or other liability obligations and/or rights consistent with this
169 | License. However, in accepting such obligations, You may act only
170 | on Your own behalf and on Your sole responsibility, not on behalf
171 | of any other Contributor, and only if You agree to indemnify,
172 | defend, and hold each Contributor harmless for any liability
173 | incurred by, or claims asserted against, such Contributor by reason
174 | of your accepting any such warranty or additional liability.
175 |
176 | END OF TERMS AND CONDITIONS
177 |
178 | APPENDIX: How to apply the Apache License to your work.
179 |
180 | To apply the Apache License to your work, attach the following
181 | boilerplate notice, with the fields enclosed by brackets "{}"
182 | replaced with your own identifying information. (Don't include
183 | the brackets!) The text should be enclosed in the appropriate
184 | comment syntax for the file format. We also recommend that a
185 | file or class name and description of purpose be included on the
186 | same "printed page" as the copyright notice for easier
187 | identification within third-party archives.
188 |
189 | Copyright {yyyy} {name of copyright owner}
190 |
191 | Licensed under the Apache License, Version 2.0 (the "License");
192 | you may not use this file except in compliance with the License.
193 | You may obtain a copy of the License at
194 |
195 | http://www.apache.org/licenses/LICENSE-2.0
196 |
197 | Unless required by applicable law or agreed to in writing, software
198 | distributed under the License is distributed on an "AS IS" BASIS,
199 | WITHOUT WARRANTIES OR CONDITIONS OF ANY KIND, either express or implied.
200 | See the License for the specific language governing permissions and
201 | limitations under the License.
202 |
203 |
--------------------------------------------------------------------------------
/web/js/smoothie.js:
--------------------------------------------------------------------------------
1 | // MIT License:
2 | //
3 | // Copyright (c) 2010-2013, Joe Walnes
4 | //
5 | // Permission is hereby granted, free of charge, to any person obtaining a copy
6 | // of this software and associated documentation files (the "Software"), to deal
7 | // in the Software without restriction, including without limitation the rights
8 | // to use, copy, modify, merge, publish, distribute, sublicense, and/or sell
9 | // copies of the Software, and to permit persons to whom the Software is
10 | // furnished to do so, subject to the following conditions:
11 | //
12 | // The above copyright notice and this permission notice shall be included in
13 | // all copies or substantial portions of the Software.
14 | //
15 | // THE SOFTWARE IS PROVIDED "AS IS", WITHOUT WARRANTY OF ANY KIND, EXPRESS OR
16 | // IMPLIED, INCLUDING BUT NOT LIMITED TO THE WARRANTIES OF MERCHANTABILITY,
17 | // FITNESS FOR A PARTICULAR PURPOSE AND NONINFRINGEMENT. IN NO EVENT SHALL THE
18 | // AUTHORS OR COPYRIGHT HOLDERS BE LIABLE FOR ANY CLAIM, DAMAGES OR OTHER
19 | // LIABILITY, WHETHER IN AN ACTION OF CONTRACT, TORT OR OTHERWISE, ARISING FROM,
20 | // OUT OF OR IN CONNECTION WITH THE SOFTWARE OR THE USE OR OTHER DEALINGS IN
21 | // THE SOFTWARE.
22 |
23 | /**
24 | * Smoothie Charts - http://smoothiecharts.org/
25 | * (c) 2010-2013, Joe Walnes
26 | * 2013, Drew Noakes
27 | *
28 | * v1.0: Main charting library, by Joe Walnes
29 | * v1.1: Auto scaling of axis, by Neil Dunn
30 | * v1.2: fps (frames per second) option, by Mathias Petterson
31 | * v1.3: Fix for divide by zero, by Paul Nikitochkin
32 | * v1.4: Set minimum, top-scale padding, remove timeseries, add optional timer to reset bounds, by Kelley Reynolds
33 | * v1.5: Set default frames per second to 50... smoother.
34 | * .start(), .stop() methods for conserving CPU, by Dmitry Vyal
35 | * options.interpolation = 'bezier' or 'line', by Dmitry Vyal
36 | * options.maxValue to fix scale, by Dmitry Vyal
37 | * v1.6: minValue/maxValue will always get converted to floats, by Przemek Matylla
38 | * v1.7: options.grid.fillStyle may be a transparent color, by Dmitry A. Shashkin
39 | * Smooth rescaling, by Kostas Michalopoulos
40 | * v1.8: Set max length to customize number of live points in the dataset with options.maxDataSetLength, by Krishna Narni
41 | * v1.9: Display timestamps along the bottom, by Nick and Stev-io
42 | * (https://groups.google.com/forum/?fromgroups#!topic/smoothie-charts/-Ywse8FCpKI%5B1-25%5D)
43 | * Refactored by Krishna Narni, to support timestamp formatting function
44 | * v1.10: Switch to requestAnimationFrame, removed the now obsoleted options.fps, by Gergely Imreh
45 | * v1.11: options.grid.sharpLines option added, by @drewnoakes
46 | * Addressed warning seen in Firefox when seriesOption.fillStyle undefined, by @drewnoakes
47 | * v1.12: Support for horizontalLines added, by @drewnoakes
48 | * Support for yRangeFunction callback added, by @drewnoakes
49 | * v1.13: Fixed typo (#32), by @alnikitich
50 | * v1.14: Timer cleared when last TimeSeries removed (#23), by @davidgaleano
51 | * Fixed diagonal line on chart at start/end of data stream, by @drewnoakes
52 | * v1.15: Support for npm package (#18), by @dominictarr
53 | * Fixed broken removeTimeSeries function (#24) by @davidgaleano
54 | * Minor performance and tidying, by @drewnoakes
55 | * v1.16: Bug fix introduced in v1.14 relating to timer creation/clearance (#23), by @drewnoakes
56 | * TimeSeries.append now deals with out-of-order timestamps, and can merge duplicates, by @zacwitte (#12)
57 | * Documentation and some local variable renaming for clarity, by @drewnoakes
58 | * v1.17: Allow control over font size (#10), by @drewnoakes
59 | * Timestamp text won't overlap, by @drewnoakes
60 | * v1.18: Allow control of max/min label precision, by @drewnoakes
61 | * Added 'borderVisible' chart option, by @drewnoakes
62 | * Allow drawing series with fill but no stroke (line), by @drewnoakes
63 | * v1.19: Avoid unnecessary repaints, and fixed flicker in old browsers having multiple charts in document (#40), by @asbai
64 | */
65 |
66 | ;(function(exports) {
67 |
68 | var Util = {
69 | extend: function() {
70 | arguments[0] = arguments[0] || {};
71 | for (var i = 1; i < arguments.length; i++)
72 | {
73 | for (var key in arguments[i])
74 | {
75 | if (arguments[i].hasOwnProperty(key))
76 | {
77 | if (typeof(arguments[i][key]) === 'object') {
78 | if (arguments[i][key] instanceof Array) {
79 | arguments[0][key] = arguments[i][key];
80 | } else {
81 | arguments[0][key] = Util.extend(arguments[0][key], arguments[i][key]);
82 | }
83 | } else {
84 | arguments[0][key] = arguments[i][key];
85 | }
86 | }
87 | }
88 | }
89 | return arguments[0];
90 | }
91 | };
92 |
93 | /**
94 | * Initialises a new TimeSeries with optional data options.
95 | *
96 | * Options are of the form (defaults shown):
97 | *
98 | *
 99 |    * {
100 |    *   resetBounds: true,        // enables/disables automatic scaling of the y-axis
101 |    *   resetBoundsInterval: 3000 // the period between scaling calculations, in millis
102 |    * }
103 |    *
104 | *
105 | * Presentation options for TimeSeries are specified as an argument to SmoothieChart.addTimeSeries.
106 | *
107 | * @constructor
108 | */
109 | function TimeSeries(options) {
110 | this.options = Util.extend({}, TimeSeries.defaultOptions, options);
111 | this.data = [];
112 | this.maxValue = Number.NaN; // The maximum value ever seen in this TimeSeries.
113 | this.minValue = Number.NaN; // The minimum value ever seen in this TimeSeries.
114 | }
115 |
116 | TimeSeries.defaultOptions = {
117 | resetBoundsInterval: 3000,
118 | resetBounds: true
119 | };
120 |
121 | /**
122 | * Recalculate the min/max values for this TimeSeries object.
123 | *
124 | * This causes the graph to scale itself in the y-axis.
125 | */
126 | TimeSeries.prototype.resetBounds = function() {
127 | if (this.data.length) {
128 | // Walk through all data points, finding the min/max value
129 | this.maxValue = this.data[0][1];
130 | this.minValue = this.data[0][1];
131 | for (var i = 1; i < this.data.length; i++) {
132 | var value = this.data[i][1];
133 | if (value > this.maxValue) {
134 | this.maxValue = value;
135 | }
136 | if (value < this.minValue) {
137 | this.minValue = value;
138 | }
139 | }
140 | } else {
141 | // No data exists, so set min/max to NaN
142 | this.maxValue = Number.NaN;
143 | this.minValue = Number.NaN;
144 | }
145 | };
146 |
147 | /**
148 | * Adds a new data point to the TimeSeries, preserving chronological order.
149 | *
150 | * @param timestamp the position, in time, of this data point
151 | * @param value the value of this data point
152 | * @param sumRepeatedTimeStampValues if timestamp has an exact match in the series, this flag controls
153 | * whether it is replaced, or the values summed (defaults to false.)
154 | */
155 | TimeSeries.prototype.append = function(timestamp, value, sumRepeatedTimeStampValues) {
156 | // Rewind until we hit an older timestamp
157 | var i = this.data.length - 1;
158 | while (i > 0 && this.data[i][0] > timestamp) {
159 | i--;
160 | }
161 |
162 | if (this.data.length > 0 && this.data[i][0] === timestamp) {
163 | // Update existing values in the array
164 | if (sumRepeatedTimeStampValues) {
165 | // Sum this value into the existing 'bucket'
166 | this.data[i][1] += value;
167 | value = this.data[i][1];
168 | } else {
169 | // Replace the previous value
170 | this.data[i][1] = value;
171 | }
172 | } else if (i < this.data.length - 1) {
173 | // Splice into the correct position to keep timestamps in order
174 | this.data.splice(i + 1, 0, [timestamp, value]);
175 | } else {
176 | // Add to the end of the array
177 | this.data.push([timestamp, value]);
178 | }
179 |
180 | this.maxValue = isNaN(this.maxValue) ? value : Math.max(this.maxValue, value);
181 | this.minValue = isNaN(this.minValue) ? value : Math.min(this.minValue, value);
182 | };
183 |
184 | TimeSeries.prototype.dropOldData = function(oldestValidTime, maxDataSetLength) {
185 | // We must always keep one expired data point as we need this to draw the
186 | // line that comes into the chart from the left, but any points prior to that can be removed.
187 | var removeCount = 0;
188 | while (this.data.length - removeCount >= maxDataSetLength && this.data[removeCount + 1][0] < oldestValidTime) {
189 | removeCount++;
190 | }
191 | if (removeCount !== 0) {
192 | this.data.splice(0, removeCount);
193 | }
194 | };
195 |
196 | /**
197 | * Initialises a new SmoothieChart.
198 | *
199 | * Options are optional, and should be of the form below. Just specify the values you
200 | * need and the rest will be given sensible defaults as shown:
201 | *
202 | *
203 |    * {
204 |    *   minValue: undefined,        // specify to clamp the lower y-axis to a given value
205 |    *   maxValue: undefined,        // specify to clamp the upper y-axis to a given value
206 |    *   maxValueScale: 1,           // allows proportional padding to be added above the chart. for 10% padding, specify 1.1.
207 |    *   yRangeFunction: undefined,  // function({min: , max: }) { return {min: , max: }; }
208 |    *   scaleSmoothing: 0.125,      // controls the rate at which y-value zoom animation occurs
209 |    *   millisPerPixel: 20,         // sets the speed at which the chart pans by
210 |    *   maxDataSetLength: 2,
211 |    *   interpolation: 'bezier'     // or 'linear'
212 |    *   timestampFormatter: null,   // Optional function to format time stamps for bottom of chart. You may use SmoothieChart.timeFormatter, or your own: function(date) { return ''; }
213 |    *   horizontalLines: [],        // [ { value: 0, color: '#ffffff', lineWidth: 1 } ],
214 |    *   grid:
215 |    *   {
216 |    *     fillStyle: '#000000',     // the background colour of the chart
217 |    *     lineWidth: 1,             // the pixel width of grid lines
218 |    *     strokeStyle: '#777777',   // colour of grid lines
219 |    *     millisPerLine: 1000,      // distance between vertical grid lines
220 |    *     sharpLines: false,        // controls whether grid lines are 1px sharp, or softened
221 |    *     verticalSections: 2,      // number of vertical sections marked out by horizontal grid lines
222 |    *     borderVisible: true       // whether the grid lines trace the border of the chart or not
223 |    *   },
224 |    *   labels
225 |    *   {
226 |    *     disabled: false,          // enables/disables labels showing the min/max values
227 |    *     fillStyle: '#ffffff',     // colour for text of labels,
228 |    *     fontSize: 15,
229 |    *     fontFamily: 'sans-serif',
230 |    *     precision: 2
231 |    *   },
232 |    * }
233 |    *
 15 |
15 |