├── .gitignore
├── .travis.yml
├── LICENSE
├── README.md
├── __init__.py
├── examples
├── discord_bot.py
├── gradient_fill.py
├── short_url_example.py
├── short_url_example_with_function.py
├── simple_example.py
├── simple_example_with_function.py
├── using_quickchartfunction.py
└── write_file.py
├── poetry.lock
├── pyproject.toml
├── quickchart
└── __init__.py
├── scripts
└── format.sh
└── tests.py
/.gitignore:
--------------------------------------------------------------------------------
1 | venv
2 |
3 | ### Vim ###
4 | [._]*.s[a-w][a-z]
5 | [._]s[a-w][a-z]
6 | *.un~
7 | Session.vim
8 | .netrwhist
9 | *~
10 |
11 |
12 | ### OSX ###
13 | .DS_Store
14 | .AppleDouble
15 | .LSOverride
16 |
17 | # Icon must end with two \r
18 | Icon
19 |
20 |
21 | # Thumbnails
22 | ._*
23 |
24 | # Files that might appear in the root of a volume
25 | .DocumentRevisions-V100
26 | .fseventsd
27 | .Spotlight-V100
28 | .TemporaryItems
29 | .Trashes
30 | .VolumeIcon.icns
31 |
32 | # Directories potentially created on remote AFP share
33 | .AppleDB
34 | .AppleDesktop
35 | Network Trash Folder
36 | Temporary Items
37 | .apdisk
38 |
39 |
40 | ### Python ###
41 | # Byte-compiled / optimized / DLL files
42 | __pycache__/
43 | *.py[cod]
44 | *$py.class
45 |
46 | # C extensions
47 | *.so
48 |
49 | # Distribution / packaging
50 | .Python
51 | env/
52 | build/
53 | develop-eggs/
54 | dist/
55 | downloads/
56 | eggs/
57 | .eggs/
58 | lib/
59 | lib64/
60 | parts/
61 | sdist/
62 | var/
63 | *.egg-info/
64 | .installed.cfg
65 | *.egg
66 |
67 | # PyInstaller
68 | # Usually these files are written by a python script from a template
69 | # before PyInstaller builds the exe, so as to inject date/other infos into it.
70 | *.manifest
71 | *.spec
72 |
73 | # Installer logs
74 | pip-log.txt
75 | pip-delete-this-directory.txt
76 |
77 | # Unit test / coverage reports
78 | htmlcov/
79 | .tox/
80 | .coverage
81 | .coverage.*
82 | .cache
83 | nosetests.xml
84 | coverage.xml
85 | *,cover
86 |
87 | # Translations
88 | *.mo
89 | *.pot
90 |
91 | # Django stuff:
92 | *.log
93 |
94 | # Sphinx documentation
95 | docs/_build/
96 |
97 | # PyBuilder
98 | target/
99 |
100 |
101 | ### Node ###
102 | # Logs
103 | logs
104 | *.log
105 | npm-debug.log*
106 |
107 | # Runtime data
108 | pids
109 | *.pid
110 | *.seed
111 |
112 | # Directory for instrumented libs generated by jscoverage/JSCover
113 | lib-cov
114 |
115 | # Coverage directory used by tools like istanbul
116 | coverage
117 |
118 | # Grunt intermediate storage (http://gruntjs.com/creating-plugins#storing-task-files)
119 | .grunt
120 |
121 | # node-waf configuration
122 | .lock-wscript
123 |
124 | # Compiled binary addons (http://nodejs.org/api/addons.html)
125 | build/Release
126 |
127 | # Dependency directory
128 | # https://docs.npmjs.com/misc/faq#should-i-check-my-node-modules-folder-into-git
129 | node_modules
130 |
131 |
--------------------------------------------------------------------------------
/.travis.yml:
--------------------------------------------------------------------------------
1 | language: python
2 | python:
3 | - 3.9
4 | cache:
5 | pip: true
6 | before_install:
7 | - pip install poetry
8 | install:
9 | - poetry install
10 | script:
11 | - poetry run python tests.py
12 |
13 |
--------------------------------------------------------------------------------
/LICENSE:
--------------------------------------------------------------------------------
1 | MIT License
2 |
3 | Copyright (c) 2020 Ian Webster
4 |
5 | Permission is hereby granted, free of charge, to any person obtaining a copy
6 | of this software and associated documentation files (the "Software"), to deal
7 | in the Software without restriction, including without limitation the rights
8 | to use, copy, modify, merge, publish, distribute, sublicense, and/or sell
9 | copies of the Software, and to permit persons to whom the Software is
10 | furnished to do so, subject to the following conditions:
11 |
12 | The above copyright notice and this permission notice shall be included in all
13 | copies or substantial portions of the Software.
14 |
15 | THE SOFTWARE IS PROVIDED "AS IS", WITHOUT WARRANTY OF ANY KIND, EXPRESS OR
16 | IMPLIED, INCLUDING BUT NOT LIMITED TO THE WARRANTIES OF MERCHANTABILITY,
17 | FITNESS FOR A PARTICULAR PURPOSE AND NONINFRINGEMENT. IN NO EVENT SHALL THE
18 | AUTHORS OR COPYRIGHT HOLDERS BE LIABLE FOR ANY CLAIM, DAMAGES OR OTHER
19 | LIABILITY, WHETHER IN AN ACTION OF CONTRACT, TORT OR OTHERWISE, ARISING FROM,
20 | OUT OF OR IN CONNECTION WITH THE SOFTWARE OR THE USE OR OTHER DEALINGS IN THE
21 | SOFTWARE.
22 |
--------------------------------------------------------------------------------
/README.md:
--------------------------------------------------------------------------------
1 | # quickchart-python
2 | [](https://travis-ci.com/typpo/quickchart-python)
3 | [](https://pypi.org/project/quickchart-io/)
4 | [](https://pypi.org/project/quickchart-io/)
5 |
6 | A Python client for the [quickchart.io](https://quickchart.io/) image charts web service.
7 |
8 | # Installation
9 |
10 | Use the `quickchart` library in this project, or install through [pip](https://pypi.org/project/quickchart.io/):
11 |
12 | ```
13 | pip install quickchart.io
14 | ```
15 |
16 | As of release 2.0, this package requires >= Python 3.7. If you need support for earlier versions of Python, use [version 1.0.1](https://pypi.org/project/quickchart-io/1.0.1/).
17 |
18 | # Usage
19 |
20 | This library provides a `QuickChart` class. Import and instantiate it. Then set properties on it and specify a [Chart.js](https://chartjs.org) config:
21 |
22 | ```python
23 | from quickchart import QuickChart
24 |
25 | qc = QuickChart()
26 | qc.width = 500
27 | qc.height = 300
28 | qc.config = {
29 | "type": "bar",
30 | "data": {
31 | "labels": ["Hello world", "Test"],
32 | "datasets": [{
33 | "label": "Foo",
34 | "data": [1, 2]
35 | }]
36 | }
37 | }
38 | ```
39 |
40 | Use `get_url()` on your quickchart object to get the encoded URL that renders your chart:
41 |
42 | ```python
43 | print(qc.get_url())
44 | # https://quickchart.io/chart?c=%7B%22chart%22%3A+%7B%22type%22%3A+%22bar%22%2C+%22data%22%3A+%7B%22labels%22%3A+%5B%22Hello+world%22%2C+%22Test%22%5D%2C+%22datasets%22%3A+%5B%7B%22label%22%3A+%22Foo%22%2C+%22data%22%3A+%5B1%2C+2%5D%7D%5D%7D%7D%7D&w=600&h=300&bkg=%23ffffff&devicePixelRatio=2.0&f=png
45 | ```
46 |
47 | If you have a long or complicated chart, use `get_short_url()` to get a fixed-length URL using the quickchart.io web service (note that these URLs only persist for a short time unless you have a subscription):
48 |
49 | ```python
50 | print(qc.get_short_url())
51 | # https://quickchart.io/chart/render/f-a1d3e804-dfea-442c-88b0-9801b9808401
52 | ```
53 |
54 | The URLs will render an image of a chart:
55 |
56 | 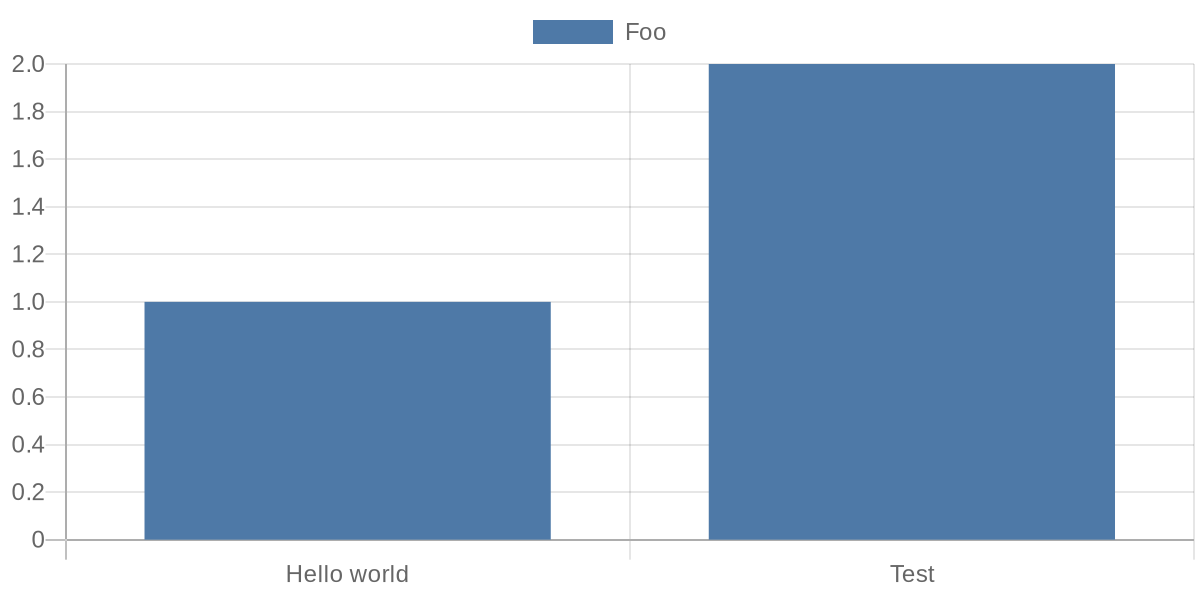 57 |
58 | # Using Javascript functions in your chart
59 |
60 | Chart.js sometimes relies on Javascript functions (e.g. for formatting tick labels). There are a couple approaches:
61 |
62 | - Build chart configuration as a string instead of a Python object. See `examples/simple_example_with_function.py`.
63 | - Build chart configuration as a Python object and include a placeholder string for the Javascript function. Then, find and replace it.
64 | - Use the provided `QuickChartFunction` class. See `examples/using_quickchartfunction.py` for a full example.
65 |
66 | A short example using `QuickChartFunction`:
67 | ```py
68 | qc = QuickChart()
69 | qc.config = {
70 | "type": "bar",
71 | "data": {
72 | "labels": ["A", "B"],
73 | "datasets": [{
74 | "label": "Foo",
75 | "data": [1, 2]
76 | }]
77 | },
78 | "options": {
79 | "scales": {
80 | "yAxes": [{
81 | "ticks": {
82 | "callback": QuickChartFunction('(val) => val + "k"')
83 | }
84 | }],
85 | "xAxes": [{
86 | "ticks": {
87 | "callback": QuickChartFunction('''function(val) {
88 | return val + '???';
89 | }''')
90 | }
91 | }]
92 | }
93 | }
94 | }
95 |
96 | print(qc.get_url())
97 | ```
98 |
99 | # Customizing your chart
100 |
101 | You can set the following properties:
102 |
103 | ### config: dict or str
104 | The actual Chart.js chart configuration.
105 |
106 | If your chart configuration is JSON-compatible, it's usually easiest to pass an object ([example](https://github.com/typpo/quickchart-python/blob/master/examples/simple_example.py)). If your chart configuration contains a Javascript function, you may pass it as a string ([example](https://github.com/typpo/quickchart-python/blob/master/examples/simple_example_with_function.py)) or use `QuickChartFunction` ([example](https://github.com/typpo/quickchart-python/blob/master/examples/using_quickchartfunction.py)).
107 |
108 | ### width: int
109 | Width of the chart image in pixels. Defaults to 500
110 |
111 | ### height: int
112 | Height of the chart image in pixels. Defaults to 300
113 |
114 | ### format: str
115 | Format of the chart. Defaults to png. svg is also valid.
116 |
117 | ### background_color: str
118 | The background color of the chart. Any valid HTML color works. Defaults to #ffffff (white). Also takes rgb, rgba, and hsl values.
119 |
120 | ### device_pixel_ratio: float
121 | The device pixel ratio of the chart. This will multiply the number of pixels by the value. This is usually used for retina displays. Defaults to 1.0.
122 |
123 | ### version: str
124 | The version of Chart.js to use. Acceptable values are documented [here](https://quickchart.io/documentation/#parameters). Usually used to select Chart.js 3+.
125 |
126 | ### scheme: str
127 | The protocol to use. Defaults to `https`.
128 |
129 | ### host: str
130 | Override the host of the chart render server. Defaults to quickchart.io.
131 |
132 | ### key: str
133 | Set an API key that will be included with the request.
134 |
135 | ## Getting URLs
136 |
137 | There are two ways to get a URL for your chart object.
138 |
139 | ### get_url(): str
140 |
141 | Returns a URL that will display the chart image when loaded.
142 |
143 | ### get_short_url(): str
144 |
145 | Uses the quickchart.io web service to create a fixed-length chart URL that displays the chart image. Returns a URL such as `https://quickchart.io/chart/render/f-a1d3e804-dfea-442c-88b0-9801b9808401`.
146 |
147 | Note that short URLs expire after a few days for users of the free service. You can [subscribe](https://quickchart.io/pricing/) to keep them around longer.
148 |
149 | ## Other functionality
150 |
151 | ### get_bytes()
152 |
153 | Returns the bytes representing the chart image.
154 |
155 | ### to_file(path: str)
156 |
157 | Writes the chart image to a file path.
158 |
159 | ## More examples
160 |
161 | Checkout the `examples` directory to see other usage.
162 |
--------------------------------------------------------------------------------
/__init__.py:
--------------------------------------------------------------------------------
1 | from quickchart import *
2 |
--------------------------------------------------------------------------------
/examples/discord_bot.py:
--------------------------------------------------------------------------------
1 | from io import BytesIO
2 |
3 | import discord
4 | from PIL import Image
5 | from discord.ext import commands
6 | from quickchart import QuickChart
7 |
8 | description = '''An example bot to showcase the use of QuickChart with discord.py module.'''
9 |
10 | intents = discord.Intents.default()
11 |
12 | bot = commands.Bot(command_prefix='!', description=description, intents=intents)
13 |
14 |
15 | @bot.event
16 | async def on_ready():
17 | print(f'Logged in as {bot.user.name}')
18 |
19 |
20 | @bot.command()
21 | async def graph(ctx):
22 | qc = QuickChart()
23 | qc.width = 600
24 | qc.height = 300
25 | qc.device_pixel_ratio = 2.0
26 | qc.config = {
27 | "type": "bar",
28 | "data": {
29 | "labels": ["Hello world", "Test"],
30 | "datasets": [{
31 | "label": "Foo",
32 | "data": [1, 2]
33 | }]
34 | }
35 | }
36 | with Image.open(BytesIO(qc.get_bytes())) as chat_sample:
37 | output_buffer = BytesIO() # By using BytesIO we don't have to save the file in our system.
38 | chat_sample.save(output_buffer, "png")
39 | output_buffer.seek(0)
40 | await ctx.send(file=discord.File(fp=output_buffer, filename="chart_sample.png")) # Change the file name accordingly.
41 |
42 |
43 | @graph.before_invoke
44 | async def before_test_invoke(ctx):
45 | await ctx.trigger_typing() # Take time to render and send graph so triggering typing to reflect bot action.
46 |
47 | bot.run('token')
48 |
--------------------------------------------------------------------------------
/examples/gradient_fill.py:
--------------------------------------------------------------------------------
1 | from quickchart import QuickChart, QuickChartFunction
2 |
3 | qc = QuickChart()
4 | qc.width = 600
5 | qc.height = 300
6 | qc.device_pixel_ratio = 2.0
7 | qc.config = {
8 | "type": "bar",
9 | "data": {
10 | "labels": ["Hello world", "Test"],
11 | "datasets": [{
12 | "label": "Foo",
13 | "data": [1, 2],
14 | "backgroundColor": QuickChartFunction("getGradientFillHelper('vertical', ['rgba(63, 100, 249, 0.2)', 'rgba(255, 255, 255, 0.2)'])"),
15 | }]
16 | }
17 | }
18 |
19 | print(qc.get_url())
20 |
--------------------------------------------------------------------------------
/examples/short_url_example.py:
--------------------------------------------------------------------------------
1 | import random
2 |
3 | from quickchart import QuickChart
4 |
5 | qc = QuickChart()
6 | qc.config = {
7 | "type": "line",
8 | "data": {
9 | "labels": list(range(0, 100)),
10 | "datasets": [{
11 | "label": "Foo",
12 | "data": random.sample(range(0, 100), 100),
13 | }]
14 | }
15 | }
16 |
17 | print(qc.get_short_url())
18 | #
19 | # Example output (note that this shortened URL is now expired and will not display a chart):
20 | #
21 | # https://quickchart.io/chart/render/f-b4bf9221-0499-4bc6-b1ae-6f7c78be9d93
22 | #
23 |
--------------------------------------------------------------------------------
/examples/short_url_example_with_function.py:
--------------------------------------------------------------------------------
1 | from quickchart import QuickChart
2 |
3 | qc = QuickChart()
4 | qc.config = '''{
5 | type: 'bar',
6 | data: {
7 | labels: ['Q1', 'Q2', 'Q3', 'Q4'],
8 | datasets: [{
9 | label: 'Users',
10 | data: [50, 60, 70, 180]
11 | }, {
12 | label: 'Revenue',
13 | data: [100, 200, 300, 400]
14 | }]
15 | },
16 | options: {
17 | scales: {
18 | yAxes: [{
19 | ticks: {
20 | callback: (val) => {
21 | return val + 'k';
22 | }
23 | }
24 | }]
25 | }
26 | }
27 | }'''
28 |
29 | print(qc.get_short_url())
30 | #
31 | # Example output (note that this shortened URL is now expired and will not display a chart):
32 | #
33 | # https://quickchart.io/chart/render/f-b4bf9221-0499-4bc6-b1ae-6f7c78be9d93
34 | #
35 |
--------------------------------------------------------------------------------
/examples/simple_example.py:
--------------------------------------------------------------------------------
1 | from quickchart import QuickChart
2 |
3 | qc = QuickChart()
4 | qc.width = 600
5 | qc.height = 300
6 | qc.device_pixel_ratio = 2.0
7 | qc.config = {
8 | "type": "bar",
9 | "data": {
10 | "labels": ["Hello world", "Test"],
11 | "datasets": [{
12 | "label": "Foo",
13 | "data": [1, 2]
14 | }]
15 | }
16 | }
17 |
18 | print(qc.get_url())
19 | # https://quickchart.io/chart?c=%7B%22type%22%3A+%22bar%22%2C+%22data%22%3A+%7B%22labels%22%3A+%5B%22Hello+world%22%2C+%22Test%22%5D%2C+%22datasets%22%3A+%5B%7B%22label%22%3A+%22Foo%22%2C+%22data%22%3A+%5B1%2C+2%5D%7D%5D%7D%7D&w=600&h=300&bkg=%23ffffff&devicePixelRatio=2.0&f=png
20 |
--------------------------------------------------------------------------------
/examples/simple_example_with_function.py:
--------------------------------------------------------------------------------
1 | from quickchart import QuickChart
2 |
3 | qc = QuickChart()
4 | qc.width = 600
5 | qc.height = 300
6 | qc.device_pixel_ratio = 2.0
7 | qc.config = '''{
8 | type: 'bar',
9 | data: {
10 | labels: ['Q1', 'Q2', 'Q3', 'Q4'],
11 | datasets: [{
12 | label: 'Users',
13 | data: [50, 60, 70, 180]
14 | }, {
15 | label: 'Revenue',
16 | data: [100, 200, 300, 400]
17 | }]
18 | },
19 | options: {
20 | scales: {
21 | yAxes: [{
22 | ticks: {
23 | callback: (val) => {
24 | return val + 'k';
25 | }
26 | }
27 | }]
28 | }
29 | }
30 | }'''
31 |
32 | print(qc.get_url())
33 |
--------------------------------------------------------------------------------
/examples/using_quickchartfunction.py:
--------------------------------------------------------------------------------
1 | from datetime import datetime
2 |
3 | from quickchart import QuickChart, QuickChartFunction
4 |
5 | qc = QuickChart()
6 | qc.width = 600
7 | qc.height = 300
8 | qc.device_pixel_ratio = 2.0
9 | qc.config = {
10 | "type": "bar",
11 | "data": {
12 | "labels": [datetime(2020, 1, 15), datetime(2021, 1, 15)],
13 | "datasets": [{
14 | "label": "Foo",
15 | "data": [1, 2]
16 | }]
17 | },
18 | "options": {
19 | "scales": {
20 | "yAxes": [{
21 | "ticks": {
22 | "callback": QuickChartFunction('(val) => val + "k"')
23 | }
24 | }, {
25 | "ticks": {
26 | "callback": QuickChartFunction('''function(val) {
27 | return val + '???';
28 | }''')
29 | }
30 | }],
31 | "xAxes": [{
32 | "ticks": {
33 | "callback": QuickChartFunction('(val) => "$" + val')
34 | }
35 | }]
36 | }
37 | }
38 | }
39 |
40 | print(qc.get_url())
41 |
--------------------------------------------------------------------------------
/examples/write_file.py:
--------------------------------------------------------------------------------
1 | from quickchart import QuickChart
2 |
3 | qc = QuickChart()
4 | qc.width = 600
5 | qc.height = 300
6 | qc.device_pixel_ratio = 2.0
7 | qc.config = {
8 | "type": "bar",
9 | "data": {
10 | "labels": ["Hello world", "Test"],
11 | "datasets": [{
12 | "label": "Foo",
13 | "data": [1, 2]
14 | }]
15 | }
16 | }
17 |
18 | qc.to_file('/tmp/mychart.png')
19 |
20 | print('Done.')
21 |
--------------------------------------------------------------------------------
/poetry.lock:
--------------------------------------------------------------------------------
1 | [[package]]
2 | name = "autopep8"
3 | version = "1.7.0"
4 | description = "A tool that automatically formats Python code to conform to the PEP 8 style guide"
5 | category = "dev"
6 | optional = false
7 | python-versions = "*"
8 |
9 | [package.dependencies]
10 | pycodestyle = ">=2.9.1"
11 | toml = "*"
12 |
13 | [[package]]
14 | name = "certifi"
15 | version = "2022.9.24"
16 | description = "Python package for providing Mozilla's CA Bundle."
17 | category = "main"
18 | optional = false
19 | python-versions = ">=3.6"
20 |
21 | [[package]]
22 | name = "charset-normalizer"
23 | version = "2.1.1"
24 | description = "The Real First Universal Charset Detector. Open, modern and actively maintained alternative to Chardet."
25 | category = "main"
26 | optional = false
27 | python-versions = ">=3.6.0"
28 |
29 | [package.extras]
30 | unicode_backport = ["unicodedata2"]
31 |
32 | [[package]]
33 | name = "idna"
34 | version = "3.4"
35 | description = "Internationalized Domain Names in Applications (IDNA)"
36 | category = "main"
37 | optional = false
38 | python-versions = ">=3.5"
39 |
40 | [[package]]
41 | name = "pycodestyle"
42 | version = "2.9.1"
43 | description = "Python style guide checker"
44 | category = "dev"
45 | optional = false
46 | python-versions = ">=3.6"
47 |
48 | [[package]]
49 | name = "requests"
50 | version = "2.28.1"
51 | description = "Python HTTP for Humans."
52 | category = "main"
53 | optional = false
54 | python-versions = ">=3.7, <4"
55 |
56 | [package.dependencies]
57 | certifi = ">=2017.4.17"
58 | charset-normalizer = ">=2,<3"
59 | idna = ">=2.5,<4"
60 | urllib3 = ">=1.21.1,<1.27"
61 |
62 | [package.extras]
63 | socks = ["PySocks (>=1.5.6,!=1.5.7)"]
64 | use_chardet_on_py3 = ["chardet (>=3.0.2,<6)"]
65 |
66 | [[package]]
67 | name = "toml"
68 | version = "0.10.2"
69 | description = "Python Library for Tom's Obvious, Minimal Language"
70 | category = "dev"
71 | optional = false
72 | python-versions = ">=2.6, !=3.0.*, !=3.1.*, !=3.2.*"
73 |
74 | [[package]]
75 | name = "urllib3"
76 | version = "1.26.12"
77 | description = "HTTP library with thread-safe connection pooling, file post, and more."
78 | category = "main"
79 | optional = false
80 | python-versions = ">=2.7, !=3.0.*, !=3.1.*, !=3.2.*, !=3.3.*, !=3.4.*, !=3.5.*, <4"
81 |
82 | [package.extras]
83 | brotli = ["brotli (>=1.0.9)", "brotlicffi (>=0.8.0)", "brotlipy (>=0.6.0)"]
84 | secure = ["certifi", "cryptography (>=1.3.4)", "idna (>=2.0.0)", "ipaddress", "pyOpenSSL (>=0.14)", "urllib3-secure-extra"]
85 | socks = ["PySocks (>=1.5.6,!=1.5.7,<2.0)"]
86 |
87 | [metadata]
88 | lock-version = "1.1"
89 | python-versions = ">=3.7, <4"
90 | content-hash = "1aa6afcebedfcbf9c7ea21f4045e6b59825b1beaadd670bd71db353aac61f2f7"
91 |
92 | [metadata.files]
93 | autopep8 = [
94 | {file = "autopep8-1.7.0-py2.py3-none-any.whl", hash = "sha256:6f09e90a2be784317e84dc1add17ebfc7abe3924239957a37e5040e27d812087"},
95 | {file = "autopep8-1.7.0.tar.gz", hash = "sha256:ca9b1a83e53a7fad65d731dc7a2a2d50aa48f43850407c59f6a1a306c4201142"},
96 | ]
97 | certifi = [
98 | {file = "certifi-2022.9.24-py3-none-any.whl", hash = "sha256:90c1a32f1d68f940488354e36370f6cca89f0f106db09518524c88d6ed83f382"},
99 | {file = "certifi-2022.9.24.tar.gz", hash = "sha256:0d9c601124e5a6ba9712dbc60d9c53c21e34f5f641fe83002317394311bdce14"},
100 | ]
101 | charset-normalizer = [
102 | {file = "charset-normalizer-2.1.1.tar.gz", hash = "sha256:5a3d016c7c547f69d6f81fb0db9449ce888b418b5b9952cc5e6e66843e9dd845"},
103 | {file = "charset_normalizer-2.1.1-py3-none-any.whl", hash = "sha256:83e9a75d1911279afd89352c68b45348559d1fc0506b054b346651b5e7fee29f"},
104 | ]
105 | idna = [
106 | {file = "idna-3.4-py3-none-any.whl", hash = "sha256:90b77e79eaa3eba6de819a0c442c0b4ceefc341a7a2ab77d7562bf49f425c5c2"},
107 | {file = "idna-3.4.tar.gz", hash = "sha256:814f528e8dead7d329833b91c5faa87d60bf71824cd12a7530b5526063d02cb4"},
108 | ]
109 | pycodestyle = [
110 | {file = "pycodestyle-2.9.1-py2.py3-none-any.whl", hash = "sha256:d1735fc58b418fd7c5f658d28d943854f8a849b01a5d0a1e6f3f3fdd0166804b"},
111 | {file = "pycodestyle-2.9.1.tar.gz", hash = "sha256:2c9607871d58c76354b697b42f5d57e1ada7d261c261efac224b664affdc5785"},
112 | ]
113 | requests = [
114 | {file = "requests-2.28.1-py3-none-any.whl", hash = "sha256:8fefa2a1a1365bf5520aac41836fbee479da67864514bdb821f31ce07ce65349"},
115 | {file = "requests-2.28.1.tar.gz", hash = "sha256:7c5599b102feddaa661c826c56ab4fee28bfd17f5abca1ebbe3e7f19d7c97983"},
116 | ]
117 | toml = [
118 | {file = "toml-0.10.2-py2.py3-none-any.whl", hash = "sha256:806143ae5bfb6a3c6e736a764057db0e6a0e05e338b5630894a5f779cabb4f9b"},
119 | {file = "toml-0.10.2.tar.gz", hash = "sha256:b3bda1d108d5dd99f4a20d24d9c348e91c4db7ab1b749200bded2f839ccbe68f"},
120 | ]
121 | urllib3 = [
122 | {file = "urllib3-1.26.12-py2.py3-none-any.whl", hash = "sha256:b930dd878d5a8afb066a637fbb35144fe7901e3b209d1cd4f524bd0e9deee997"},
123 | {file = "urllib3-1.26.12.tar.gz", hash = "sha256:3fa96cf423e6987997fc326ae8df396db2a8b7c667747d47ddd8ecba91f4a74e"},
124 | ]
125 |
--------------------------------------------------------------------------------
/pyproject.toml:
--------------------------------------------------------------------------------
1 | [tool.poetry]
2 | name = "quickchart.io"
3 | version = "2.0.0"
4 | description = "A client for quickchart.io, a service that generates static chart images"
5 | keywords = ["chart api", "chart image", "charts"]
6 | authors = ["Ian Webster "]
7 | maintainers = ["Ian Webster "]
8 | homepage = "https://quickchart.io/"
9 | readme = "README.md"
10 | repository = "https://github.com/typpo/quickchart-python"
11 | license = "MIT"
12 | packages = [
13 | { include = "quickchart" },
14 | ]
15 |
16 | [tool.poetry.dependencies]
17 | python = ">=3.7, <4"
18 | requests = "^2.28.1"
19 |
20 | [tool.poetry.dev-dependencies]
21 | autopep8 = "^1.5.5"
22 |
23 | [build-system]
24 | requires = ["poetry>=0.12"]
25 | build-backend = "poetry.masonry.api"
26 |
--------------------------------------------------------------------------------
/quickchart/__init__.py:
--------------------------------------------------------------------------------
1 | """A python client for quickchart.io, a web service that generates static
2 | charts."""
3 |
4 | import datetime
5 | import json
6 | import re
7 | try:
8 | from urllib import urlencode
9 | except:
10 | # For Python 3
11 | from urllib.parse import urlencode
12 |
13 | USER_AGENT = 'quickchart-python (2.0.0)'
14 |
15 | FUNCTION_DELIMITER_RE = re.compile('\"__BEGINFUNCTION__(.*?)__ENDFUNCTION__\"')
16 |
17 |
18 | class QuickChartFunction:
19 | def __init__(self, script):
20 | self.script = script
21 |
22 | def __repr__(self):
23 | return self.script
24 |
25 |
26 | def serialize(obj):
27 | if isinstance(obj, QuickChartFunction):
28 | return '__BEGINFUNCTION__' + obj.script + '__ENDFUNCTION__'
29 | if isinstance(obj, (datetime.date, datetime.datetime)):
30 | return obj.isoformat()
31 | return obj.__dict__
32 |
33 |
34 | def dump_json(obj):
35 | ret = json.dumps(obj, default=serialize, separators=(',', ':'))
36 | ret = FUNCTION_DELIMITER_RE.sub(
37 | lambda match: json.loads('"' + match.group(1) + '"'), ret)
38 | return ret
39 |
40 |
41 | class QuickChart:
42 | def __init__(self):
43 | self.config = None
44 | self.width = 500
45 | self.height = 300
46 | self.background_color = '#ffffff'
47 | self.device_pixel_ratio = 1.0
48 | self.format = 'png'
49 | self.version = '2.9.4'
50 | self.key = None
51 | self.scheme = 'https'
52 | self.host = 'quickchart.io'
53 |
54 | def is_valid(self):
55 | return self.config is not None
56 |
57 | def get_url_base(self):
58 | return '%s://%s' % (self.scheme, self.host)
59 |
60 | def get_url(self):
61 | if not self.is_valid():
62 | raise RuntimeError(
63 | 'You must set the `config` attribute before generating a url')
64 | params = {
65 | 'c': dump_json(self.config) if type(self.config) == dict else self.config,
66 | 'w': self.width,
67 | 'h': self.height,
68 | 'bkg': self.background_color,
69 | 'devicePixelRatio': self.device_pixel_ratio,
70 | 'f': self.format,
71 | 'v': self.version,
72 | }
73 | if self.key:
74 | params['key'] = self.key
75 | return '%s/chart?%s' % (self.get_url_base(), urlencode(params))
76 |
77 | def _post(self, url):
78 | try:
79 | import requests
80 | except:
81 | raise RuntimeError('Could not find `requests` dependency')
82 |
83 | postdata = {
84 | 'chart': dump_json(self.config) if type(self.config) == dict else self.config,
85 | 'width': self.width,
86 | 'height': self.height,
87 | 'backgroundColor': self.background_color,
88 | 'devicePixelRatio': self.device_pixel_ratio,
89 | 'format': self.format,
90 | 'version': self.version,
91 | }
92 | if self.key:
93 | postdata['key'] = self.key
94 | headers = {
95 | 'user-agent': USER_AGENT,
96 | }
97 | resp = requests.post(url, json=postdata, headers=headers)
98 | if resp.status_code != 200:
99 | err_description = resp.headers.get('x-quickchart-error')
100 | raise RuntimeError(
101 | 'Invalid response code from chart creation endpoint: %d%s'
102 | % (resp.status_code, '\n%s' % err_description if err_description else '')
103 | )
104 | return resp
105 |
106 |
107 | def get_short_url(self):
108 | resp = self._post('%s/chart/create' % self.get_url_base())
109 | parsed = json.loads(resp.text)
110 | if not parsed['success']:
111 | raise RuntimeError(
112 | 'Chart creation endpoint failed to create chart')
113 | return parsed['url']
114 |
115 | def get_bytes(self):
116 | resp = self._post('%s/chart' % self.get_url_base())
117 | return resp.content
118 |
119 | def to_file(self, path):
120 | content = self.get_bytes()
121 | with open(path, 'wb') as f:
122 | f.write(content)
123 |
--------------------------------------------------------------------------------
/scripts/format.sh:
--------------------------------------------------------------------------------
1 | #!/bin/bash -e
2 |
3 | poetry run autopep8 --in-place examples/*.py quickchart/*.py
4 |
--------------------------------------------------------------------------------
/tests.py:
--------------------------------------------------------------------------------
1 | import unittest
2 | from datetime import datetime
3 |
4 | from quickchart import QuickChart, QuickChartFunction
5 |
6 | class TestQuickChart(unittest.TestCase):
7 | def test_simple(self):
8 | qc = QuickChart()
9 | qc.width = 600
10 | qc.height = 300
11 | qc.device_pixel_ratio = 2.0
12 | qc.config = {
13 | "type": "bar",
14 | "data": {
15 | "labels": ["Hello world", "Test"],
16 | "datasets": [{
17 | "label": "Foo",
18 | "data": [1, 2]
19 | }]
20 | }
21 | }
22 |
23 | url = qc.get_url()
24 | self.assertIn('w=600', url)
25 | self.assertIn('h=300', url)
26 | self.assertIn('devicePixelRatio=2', url)
27 | self.assertIn('Hello+world', url)
28 |
29 | def test_version(self):
30 | qc = QuickChart()
31 | qc.version = '3.4.0'
32 | qc.config = {
33 | "type": "bar",
34 | "data": {
35 | "labels": ["Hello world", "Test"],
36 | "datasets": [{
37 | "label": "Foo",
38 | "data": [1, 2]
39 | }]
40 | }
41 | }
42 |
43 | url = qc.get_url()
44 | self.assertIn('v=3.4.0', url)
45 |
46 | def test_no_chart(self):
47 | qc = QuickChart()
48 | qc.width = 600
49 | qc.height = 300
50 | qc.device_pixel_ratio = 2.0
51 |
52 | self.assertRaises(RuntimeError, qc.get_url)
53 |
54 | def test_get_bytes(self):
55 | qc = QuickChart()
56 | qc.width = 600
57 | qc.height = 300
58 | qc.config = {
59 | "type": "bar",
60 | "data": {
61 | "labels": ["Hello world", "Test"],
62 | "datasets": [{
63 | "label": "Foo",
64 | "data": [1, 2]
65 | }]
66 | }
67 | }
68 | self.assertTrue(len(qc.get_bytes()) > 8000)
69 |
70 | def test_with_function_and_dates(self):
71 | qc = QuickChart()
72 | qc.config = {
73 | "type": "bar",
74 | "data": {
75 | "labels": [datetime(2020, 1, 15), datetime(2021, 1, 15)],
76 | "datasets": [{
77 | "label": "Foo",
78 | "data": [1, 2]
79 | }]
80 | },
81 | "options": {
82 | "scales": {
83 | "yAxes": [{
84 | "ticks": {
85 | "callback": QuickChartFunction('(val) => val + "k"')
86 | }
87 | }],
88 | "xAxes": [{
89 | "ticks": {
90 | "callback": QuickChartFunction('(val) => "$" + val')
91 | }
92 | }]
93 | }
94 | }
95 | }
96 |
97 | url = qc.get_url()
98 | self.assertIn('7B%22ticks%22%3A%7B%22callback%22%3A%28val%29+%3D%3E+%22%24%22+%2B+val%7D%7D%5D%7D%7D%7D', url)
99 | self.assertIn('2020-01-15T00%3A00%3A00', url)
100 |
101 | if __name__ == '__main__':
102 | unittest.main()
103 |
--------------------------------------------------------------------------------
57 |
58 | # Using Javascript functions in your chart
59 |
60 | Chart.js sometimes relies on Javascript functions (e.g. for formatting tick labels). There are a couple approaches:
61 |
62 | - Build chart configuration as a string instead of a Python object. See `examples/simple_example_with_function.py`.
63 | - Build chart configuration as a Python object and include a placeholder string for the Javascript function. Then, find and replace it.
64 | - Use the provided `QuickChartFunction` class. See `examples/using_quickchartfunction.py` for a full example.
65 |
66 | A short example using `QuickChartFunction`:
67 | ```py
68 | qc = QuickChart()
69 | qc.config = {
70 | "type": "bar",
71 | "data": {
72 | "labels": ["A", "B"],
73 | "datasets": [{
74 | "label": "Foo",
75 | "data": [1, 2]
76 | }]
77 | },
78 | "options": {
79 | "scales": {
80 | "yAxes": [{
81 | "ticks": {
82 | "callback": QuickChartFunction('(val) => val + "k"')
83 | }
84 | }],
85 | "xAxes": [{
86 | "ticks": {
87 | "callback": QuickChartFunction('''function(val) {
88 | return val + '???';
89 | }''')
90 | }
91 | }]
92 | }
93 | }
94 | }
95 |
96 | print(qc.get_url())
97 | ```
98 |
99 | # Customizing your chart
100 |
101 | You can set the following properties:
102 |
103 | ### config: dict or str
104 | The actual Chart.js chart configuration.
105 |
106 | If your chart configuration is JSON-compatible, it's usually easiest to pass an object ([example](https://github.com/typpo/quickchart-python/blob/master/examples/simple_example.py)). If your chart configuration contains a Javascript function, you may pass it as a string ([example](https://github.com/typpo/quickchart-python/blob/master/examples/simple_example_with_function.py)) or use `QuickChartFunction` ([example](https://github.com/typpo/quickchart-python/blob/master/examples/using_quickchartfunction.py)).
107 |
108 | ### width: int
109 | Width of the chart image in pixels. Defaults to 500
110 |
111 | ### height: int
112 | Height of the chart image in pixels. Defaults to 300
113 |
114 | ### format: str
115 | Format of the chart. Defaults to png. svg is also valid.
116 |
117 | ### background_color: str
118 | The background color of the chart. Any valid HTML color works. Defaults to #ffffff (white). Also takes rgb, rgba, and hsl values.
119 |
120 | ### device_pixel_ratio: float
121 | The device pixel ratio of the chart. This will multiply the number of pixels by the value. This is usually used for retina displays. Defaults to 1.0.
122 |
123 | ### version: str
124 | The version of Chart.js to use. Acceptable values are documented [here](https://quickchart.io/documentation/#parameters). Usually used to select Chart.js 3+.
125 |
126 | ### scheme: str
127 | The protocol to use. Defaults to `https`.
128 |
129 | ### host: str
130 | Override the host of the chart render server. Defaults to quickchart.io.
131 |
132 | ### key: str
133 | Set an API key that will be included with the request.
134 |
135 | ## Getting URLs
136 |
137 | There are two ways to get a URL for your chart object.
138 |
139 | ### get_url(): str
140 |
141 | Returns a URL that will display the chart image when loaded.
142 |
143 | ### get_short_url(): str
144 |
145 | Uses the quickchart.io web service to create a fixed-length chart URL that displays the chart image. Returns a URL such as `https://quickchart.io/chart/render/f-a1d3e804-dfea-442c-88b0-9801b9808401`.
146 |
147 | Note that short URLs expire after a few days for users of the free service. You can [subscribe](https://quickchart.io/pricing/) to keep them around longer.
148 |
149 | ## Other functionality
150 |
151 | ### get_bytes()
152 |
153 | Returns the bytes representing the chart image.
154 |
155 | ### to_file(path: str)
156 |
157 | Writes the chart image to a file path.
158 |
159 | ## More examples
160 |
161 | Checkout the `examples` directory to see other usage.
162 |
--------------------------------------------------------------------------------
/__init__.py:
--------------------------------------------------------------------------------
1 | from quickchart import *
2 |
--------------------------------------------------------------------------------
/examples/discord_bot.py:
--------------------------------------------------------------------------------
1 | from io import BytesIO
2 |
3 | import discord
4 | from PIL import Image
5 | from discord.ext import commands
6 | from quickchart import QuickChart
7 |
8 | description = '''An example bot to showcase the use of QuickChart with discord.py module.'''
9 |
10 | intents = discord.Intents.default()
11 |
12 | bot = commands.Bot(command_prefix='!', description=description, intents=intents)
13 |
14 |
15 | @bot.event
16 | async def on_ready():
17 | print(f'Logged in as {bot.user.name}')
18 |
19 |
20 | @bot.command()
21 | async def graph(ctx):
22 | qc = QuickChart()
23 | qc.width = 600
24 | qc.height = 300
25 | qc.device_pixel_ratio = 2.0
26 | qc.config = {
27 | "type": "bar",
28 | "data": {
29 | "labels": ["Hello world", "Test"],
30 | "datasets": [{
31 | "label": "Foo",
32 | "data": [1, 2]
33 | }]
34 | }
35 | }
36 | with Image.open(BytesIO(qc.get_bytes())) as chat_sample:
37 | output_buffer = BytesIO() # By using BytesIO we don't have to save the file in our system.
38 | chat_sample.save(output_buffer, "png")
39 | output_buffer.seek(0)
40 | await ctx.send(file=discord.File(fp=output_buffer, filename="chart_sample.png")) # Change the file name accordingly.
41 |
42 |
43 | @graph.before_invoke
44 | async def before_test_invoke(ctx):
45 | await ctx.trigger_typing() # Take time to render and send graph so triggering typing to reflect bot action.
46 |
47 | bot.run('token')
48 |
--------------------------------------------------------------------------------
/examples/gradient_fill.py:
--------------------------------------------------------------------------------
1 | from quickchart import QuickChart, QuickChartFunction
2 |
3 | qc = QuickChart()
4 | qc.width = 600
5 | qc.height = 300
6 | qc.device_pixel_ratio = 2.0
7 | qc.config = {
8 | "type": "bar",
9 | "data": {
10 | "labels": ["Hello world", "Test"],
11 | "datasets": [{
12 | "label": "Foo",
13 | "data": [1, 2],
14 | "backgroundColor": QuickChartFunction("getGradientFillHelper('vertical', ['rgba(63, 100, 249, 0.2)', 'rgba(255, 255, 255, 0.2)'])"),
15 | }]
16 | }
17 | }
18 |
19 | print(qc.get_url())
20 |
--------------------------------------------------------------------------------
/examples/short_url_example.py:
--------------------------------------------------------------------------------
1 | import random
2 |
3 | from quickchart import QuickChart
4 |
5 | qc = QuickChart()
6 | qc.config = {
7 | "type": "line",
8 | "data": {
9 | "labels": list(range(0, 100)),
10 | "datasets": [{
11 | "label": "Foo",
12 | "data": random.sample(range(0, 100), 100),
13 | }]
14 | }
15 | }
16 |
17 | print(qc.get_short_url())
18 | #
19 | # Example output (note that this shortened URL is now expired and will not display a chart):
20 | #
21 | # https://quickchart.io/chart/render/f-b4bf9221-0499-4bc6-b1ae-6f7c78be9d93
22 | #
23 |
--------------------------------------------------------------------------------
/examples/short_url_example_with_function.py:
--------------------------------------------------------------------------------
1 | from quickchart import QuickChart
2 |
3 | qc = QuickChart()
4 | qc.config = '''{
5 | type: 'bar',
6 | data: {
7 | labels: ['Q1', 'Q2', 'Q3', 'Q4'],
8 | datasets: [{
9 | label: 'Users',
10 | data: [50, 60, 70, 180]
11 | }, {
12 | label: 'Revenue',
13 | data: [100, 200, 300, 400]
14 | }]
15 | },
16 | options: {
17 | scales: {
18 | yAxes: [{
19 | ticks: {
20 | callback: (val) => {
21 | return val + 'k';
22 | }
23 | }
24 | }]
25 | }
26 | }
27 | }'''
28 |
29 | print(qc.get_short_url())
30 | #
31 | # Example output (note that this shortened URL is now expired and will not display a chart):
32 | #
33 | # https://quickchart.io/chart/render/f-b4bf9221-0499-4bc6-b1ae-6f7c78be9d93
34 | #
35 |
--------------------------------------------------------------------------------
/examples/simple_example.py:
--------------------------------------------------------------------------------
1 | from quickchart import QuickChart
2 |
3 | qc = QuickChart()
4 | qc.width = 600
5 | qc.height = 300
6 | qc.device_pixel_ratio = 2.0
7 | qc.config = {
8 | "type": "bar",
9 | "data": {
10 | "labels": ["Hello world", "Test"],
11 | "datasets": [{
12 | "label": "Foo",
13 | "data": [1, 2]
14 | }]
15 | }
16 | }
17 |
18 | print(qc.get_url())
19 | # https://quickchart.io/chart?c=%7B%22type%22%3A+%22bar%22%2C+%22data%22%3A+%7B%22labels%22%3A+%5B%22Hello+world%22%2C+%22Test%22%5D%2C+%22datasets%22%3A+%5B%7B%22label%22%3A+%22Foo%22%2C+%22data%22%3A+%5B1%2C+2%5D%7D%5D%7D%7D&w=600&h=300&bkg=%23ffffff&devicePixelRatio=2.0&f=png
20 |
--------------------------------------------------------------------------------
/examples/simple_example_with_function.py:
--------------------------------------------------------------------------------
1 | from quickchart import QuickChart
2 |
3 | qc = QuickChart()
4 | qc.width = 600
5 | qc.height = 300
6 | qc.device_pixel_ratio = 2.0
7 | qc.config = '''{
8 | type: 'bar',
9 | data: {
10 | labels: ['Q1', 'Q2', 'Q3', 'Q4'],
11 | datasets: [{
12 | label: 'Users',
13 | data: [50, 60, 70, 180]
14 | }, {
15 | label: 'Revenue',
16 | data: [100, 200, 300, 400]
17 | }]
18 | },
19 | options: {
20 | scales: {
21 | yAxes: [{
22 | ticks: {
23 | callback: (val) => {
24 | return val + 'k';
25 | }
26 | }
27 | }]
28 | }
29 | }
30 | }'''
31 |
32 | print(qc.get_url())
33 |
--------------------------------------------------------------------------------
/examples/using_quickchartfunction.py:
--------------------------------------------------------------------------------
1 | from datetime import datetime
2 |
3 | from quickchart import QuickChart, QuickChartFunction
4 |
5 | qc = QuickChart()
6 | qc.width = 600
7 | qc.height = 300
8 | qc.device_pixel_ratio = 2.0
9 | qc.config = {
10 | "type": "bar",
11 | "data": {
12 | "labels": [datetime(2020, 1, 15), datetime(2021, 1, 15)],
13 | "datasets": [{
14 | "label": "Foo",
15 | "data": [1, 2]
16 | }]
17 | },
18 | "options": {
19 | "scales": {
20 | "yAxes": [{
21 | "ticks": {
22 | "callback": QuickChartFunction('(val) => val + "k"')
23 | }
24 | }, {
25 | "ticks": {
26 | "callback": QuickChartFunction('''function(val) {
27 | return val + '???';
28 | }''')
29 | }
30 | }],
31 | "xAxes": [{
32 | "ticks": {
33 | "callback": QuickChartFunction('(val) => "$" + val')
34 | }
35 | }]
36 | }
37 | }
38 | }
39 |
40 | print(qc.get_url())
41 |
--------------------------------------------------------------------------------
/examples/write_file.py:
--------------------------------------------------------------------------------
1 | from quickchart import QuickChart
2 |
3 | qc = QuickChart()
4 | qc.width = 600
5 | qc.height = 300
6 | qc.device_pixel_ratio = 2.0
7 | qc.config = {
8 | "type": "bar",
9 | "data": {
10 | "labels": ["Hello world", "Test"],
11 | "datasets": [{
12 | "label": "Foo",
13 | "data": [1, 2]
14 | }]
15 | }
16 | }
17 |
18 | qc.to_file('/tmp/mychart.png')
19 |
20 | print('Done.')
21 |
--------------------------------------------------------------------------------
/poetry.lock:
--------------------------------------------------------------------------------
1 | [[package]]
2 | name = "autopep8"
3 | version = "1.7.0"
4 | description = "A tool that automatically formats Python code to conform to the PEP 8 style guide"
5 | category = "dev"
6 | optional = false
7 | python-versions = "*"
8 |
9 | [package.dependencies]
10 | pycodestyle = ">=2.9.1"
11 | toml = "*"
12 |
13 | [[package]]
14 | name = "certifi"
15 | version = "2022.9.24"
16 | description = "Python package for providing Mozilla's CA Bundle."
17 | category = "main"
18 | optional = false
19 | python-versions = ">=3.6"
20 |
21 | [[package]]
22 | name = "charset-normalizer"
23 | version = "2.1.1"
24 | description = "The Real First Universal Charset Detector. Open, modern and actively maintained alternative to Chardet."
25 | category = "main"
26 | optional = false
27 | python-versions = ">=3.6.0"
28 |
29 | [package.extras]
30 | unicode_backport = ["unicodedata2"]
31 |
32 | [[package]]
33 | name = "idna"
34 | version = "3.4"
35 | description = "Internationalized Domain Names in Applications (IDNA)"
36 | category = "main"
37 | optional = false
38 | python-versions = ">=3.5"
39 |
40 | [[package]]
41 | name = "pycodestyle"
42 | version = "2.9.1"
43 | description = "Python style guide checker"
44 | category = "dev"
45 | optional = false
46 | python-versions = ">=3.6"
47 |
48 | [[package]]
49 | name = "requests"
50 | version = "2.28.1"
51 | description = "Python HTTP for Humans."
52 | category = "main"
53 | optional = false
54 | python-versions = ">=3.7, <4"
55 |
56 | [package.dependencies]
57 | certifi = ">=2017.4.17"
58 | charset-normalizer = ">=2,<3"
59 | idna = ">=2.5,<4"
60 | urllib3 = ">=1.21.1,<1.27"
61 |
62 | [package.extras]
63 | socks = ["PySocks (>=1.5.6,!=1.5.7)"]
64 | use_chardet_on_py3 = ["chardet (>=3.0.2,<6)"]
65 |
66 | [[package]]
67 | name = "toml"
68 | version = "0.10.2"
69 | description = "Python Library for Tom's Obvious, Minimal Language"
70 | category = "dev"
71 | optional = false
72 | python-versions = ">=2.6, !=3.0.*, !=3.1.*, !=3.2.*"
73 |
74 | [[package]]
75 | name = "urllib3"
76 | version = "1.26.12"
77 | description = "HTTP library with thread-safe connection pooling, file post, and more."
78 | category = "main"
79 | optional = false
80 | python-versions = ">=2.7, !=3.0.*, !=3.1.*, !=3.2.*, !=3.3.*, !=3.4.*, !=3.5.*, <4"
81 |
82 | [package.extras]
83 | brotli = ["brotli (>=1.0.9)", "brotlicffi (>=0.8.0)", "brotlipy (>=0.6.0)"]
84 | secure = ["certifi", "cryptography (>=1.3.4)", "idna (>=2.0.0)", "ipaddress", "pyOpenSSL (>=0.14)", "urllib3-secure-extra"]
85 | socks = ["PySocks (>=1.5.6,!=1.5.7,<2.0)"]
86 |
87 | [metadata]
88 | lock-version = "1.1"
89 | python-versions = ">=3.7, <4"
90 | content-hash = "1aa6afcebedfcbf9c7ea21f4045e6b59825b1beaadd670bd71db353aac61f2f7"
91 |
92 | [metadata.files]
93 | autopep8 = [
94 | {file = "autopep8-1.7.0-py2.py3-none-any.whl", hash = "sha256:6f09e90a2be784317e84dc1add17ebfc7abe3924239957a37e5040e27d812087"},
95 | {file = "autopep8-1.7.0.tar.gz", hash = "sha256:ca9b1a83e53a7fad65d731dc7a2a2d50aa48f43850407c59f6a1a306c4201142"},
96 | ]
97 | certifi = [
98 | {file = "certifi-2022.9.24-py3-none-any.whl", hash = "sha256:90c1a32f1d68f940488354e36370f6cca89f0f106db09518524c88d6ed83f382"},
99 | {file = "certifi-2022.9.24.tar.gz", hash = "sha256:0d9c601124e5a6ba9712dbc60d9c53c21e34f5f641fe83002317394311bdce14"},
100 | ]
101 | charset-normalizer = [
102 | {file = "charset-normalizer-2.1.1.tar.gz", hash = "sha256:5a3d016c7c547f69d6f81fb0db9449ce888b418b5b9952cc5e6e66843e9dd845"},
103 | {file = "charset_normalizer-2.1.1-py3-none-any.whl", hash = "sha256:83e9a75d1911279afd89352c68b45348559d1fc0506b054b346651b5e7fee29f"},
104 | ]
105 | idna = [
106 | {file = "idna-3.4-py3-none-any.whl", hash = "sha256:90b77e79eaa3eba6de819a0c442c0b4ceefc341a7a2ab77d7562bf49f425c5c2"},
107 | {file = "idna-3.4.tar.gz", hash = "sha256:814f528e8dead7d329833b91c5faa87d60bf71824cd12a7530b5526063d02cb4"},
108 | ]
109 | pycodestyle = [
110 | {file = "pycodestyle-2.9.1-py2.py3-none-any.whl", hash = "sha256:d1735fc58b418fd7c5f658d28d943854f8a849b01a5d0a1e6f3f3fdd0166804b"},
111 | {file = "pycodestyle-2.9.1.tar.gz", hash = "sha256:2c9607871d58c76354b697b42f5d57e1ada7d261c261efac224b664affdc5785"},
112 | ]
113 | requests = [
114 | {file = "requests-2.28.1-py3-none-any.whl", hash = "sha256:8fefa2a1a1365bf5520aac41836fbee479da67864514bdb821f31ce07ce65349"},
115 | {file = "requests-2.28.1.tar.gz", hash = "sha256:7c5599b102feddaa661c826c56ab4fee28bfd17f5abca1ebbe3e7f19d7c97983"},
116 | ]
117 | toml = [
118 | {file = "toml-0.10.2-py2.py3-none-any.whl", hash = "sha256:806143ae5bfb6a3c6e736a764057db0e6a0e05e338b5630894a5f779cabb4f9b"},
119 | {file = "toml-0.10.2.tar.gz", hash = "sha256:b3bda1d108d5dd99f4a20d24d9c348e91c4db7ab1b749200bded2f839ccbe68f"},
120 | ]
121 | urllib3 = [
122 | {file = "urllib3-1.26.12-py2.py3-none-any.whl", hash = "sha256:b930dd878d5a8afb066a637fbb35144fe7901e3b209d1cd4f524bd0e9deee997"},
123 | {file = "urllib3-1.26.12.tar.gz", hash = "sha256:3fa96cf423e6987997fc326ae8df396db2a8b7c667747d47ddd8ecba91f4a74e"},
124 | ]
125 |
--------------------------------------------------------------------------------
/pyproject.toml:
--------------------------------------------------------------------------------
1 | [tool.poetry]
2 | name = "quickchart.io"
3 | version = "2.0.0"
4 | description = "A client for quickchart.io, a service that generates static chart images"
5 | keywords = ["chart api", "chart image", "charts"]
6 | authors = ["Ian Webster "]
7 | maintainers = ["Ian Webster "]
8 | homepage = "https://quickchart.io/"
9 | readme = "README.md"
10 | repository = "https://github.com/typpo/quickchart-python"
11 | license = "MIT"
12 | packages = [
13 | { include = "quickchart" },
14 | ]
15 |
16 | [tool.poetry.dependencies]
17 | python = ">=3.7, <4"
18 | requests = "^2.28.1"
19 |
20 | [tool.poetry.dev-dependencies]
21 | autopep8 = "^1.5.5"
22 |
23 | [build-system]
24 | requires = ["poetry>=0.12"]
25 | build-backend = "poetry.masonry.api"
26 |
--------------------------------------------------------------------------------
/quickchart/__init__.py:
--------------------------------------------------------------------------------
1 | """A python client for quickchart.io, a web service that generates static
2 | charts."""
3 |
4 | import datetime
5 | import json
6 | import re
7 | try:
8 | from urllib import urlencode
9 | except:
10 | # For Python 3
11 | from urllib.parse import urlencode
12 |
13 | USER_AGENT = 'quickchart-python (2.0.0)'
14 |
15 | FUNCTION_DELIMITER_RE = re.compile('\"__BEGINFUNCTION__(.*?)__ENDFUNCTION__\"')
16 |
17 |
18 | class QuickChartFunction:
19 | def __init__(self, script):
20 | self.script = script
21 |
22 | def __repr__(self):
23 | return self.script
24 |
25 |
26 | def serialize(obj):
27 | if isinstance(obj, QuickChartFunction):
28 | return '__BEGINFUNCTION__' + obj.script + '__ENDFUNCTION__'
29 | if isinstance(obj, (datetime.date, datetime.datetime)):
30 | return obj.isoformat()
31 | return obj.__dict__
32 |
33 |
34 | def dump_json(obj):
35 | ret = json.dumps(obj, default=serialize, separators=(',', ':'))
36 | ret = FUNCTION_DELIMITER_RE.sub(
37 | lambda match: json.loads('"' + match.group(1) + '"'), ret)
38 | return ret
39 |
40 |
41 | class QuickChart:
42 | def __init__(self):
43 | self.config = None
44 | self.width = 500
45 | self.height = 300
46 | self.background_color = '#ffffff'
47 | self.device_pixel_ratio = 1.0
48 | self.format = 'png'
49 | self.version = '2.9.4'
50 | self.key = None
51 | self.scheme = 'https'
52 | self.host = 'quickchart.io'
53 |
54 | def is_valid(self):
55 | return self.config is not None
56 |
57 | def get_url_base(self):
58 | return '%s://%s' % (self.scheme, self.host)
59 |
60 | def get_url(self):
61 | if not self.is_valid():
62 | raise RuntimeError(
63 | 'You must set the `config` attribute before generating a url')
64 | params = {
65 | 'c': dump_json(self.config) if type(self.config) == dict else self.config,
66 | 'w': self.width,
67 | 'h': self.height,
68 | 'bkg': self.background_color,
69 | 'devicePixelRatio': self.device_pixel_ratio,
70 | 'f': self.format,
71 | 'v': self.version,
72 | }
73 | if self.key:
74 | params['key'] = self.key
75 | return '%s/chart?%s' % (self.get_url_base(), urlencode(params))
76 |
77 | def _post(self, url):
78 | try:
79 | import requests
80 | except:
81 | raise RuntimeError('Could not find `requests` dependency')
82 |
83 | postdata = {
84 | 'chart': dump_json(self.config) if type(self.config) == dict else self.config,
85 | 'width': self.width,
86 | 'height': self.height,
87 | 'backgroundColor': self.background_color,
88 | 'devicePixelRatio': self.device_pixel_ratio,
89 | 'format': self.format,
90 | 'version': self.version,
91 | }
92 | if self.key:
93 | postdata['key'] = self.key
94 | headers = {
95 | 'user-agent': USER_AGENT,
96 | }
97 | resp = requests.post(url, json=postdata, headers=headers)
98 | if resp.status_code != 200:
99 | err_description = resp.headers.get('x-quickchart-error')
100 | raise RuntimeError(
101 | 'Invalid response code from chart creation endpoint: %d%s'
102 | % (resp.status_code, '\n%s' % err_description if err_description else '')
103 | )
104 | return resp
105 |
106 |
107 | def get_short_url(self):
108 | resp = self._post('%s/chart/create' % self.get_url_base())
109 | parsed = json.loads(resp.text)
110 | if not parsed['success']:
111 | raise RuntimeError(
112 | 'Chart creation endpoint failed to create chart')
113 | return parsed['url']
114 |
115 | def get_bytes(self):
116 | resp = self._post('%s/chart' % self.get_url_base())
117 | return resp.content
118 |
119 | def to_file(self, path):
120 | content = self.get_bytes()
121 | with open(path, 'wb') as f:
122 | f.write(content)
123 |
--------------------------------------------------------------------------------
/scripts/format.sh:
--------------------------------------------------------------------------------
1 | #!/bin/bash -e
2 |
3 | poetry run autopep8 --in-place examples/*.py quickchart/*.py
4 |
--------------------------------------------------------------------------------
/tests.py:
--------------------------------------------------------------------------------
1 | import unittest
2 | from datetime import datetime
3 |
4 | from quickchart import QuickChart, QuickChartFunction
5 |
6 | class TestQuickChart(unittest.TestCase):
7 | def test_simple(self):
8 | qc = QuickChart()
9 | qc.width = 600
10 | qc.height = 300
11 | qc.device_pixel_ratio = 2.0
12 | qc.config = {
13 | "type": "bar",
14 | "data": {
15 | "labels": ["Hello world", "Test"],
16 | "datasets": [{
17 | "label": "Foo",
18 | "data": [1, 2]
19 | }]
20 | }
21 | }
22 |
23 | url = qc.get_url()
24 | self.assertIn('w=600', url)
25 | self.assertIn('h=300', url)
26 | self.assertIn('devicePixelRatio=2', url)
27 | self.assertIn('Hello+world', url)
28 |
29 | def test_version(self):
30 | qc = QuickChart()
31 | qc.version = '3.4.0'
32 | qc.config = {
33 | "type": "bar",
34 | "data": {
35 | "labels": ["Hello world", "Test"],
36 | "datasets": [{
37 | "label": "Foo",
38 | "data": [1, 2]
39 | }]
40 | }
41 | }
42 |
43 | url = qc.get_url()
44 | self.assertIn('v=3.4.0', url)
45 |
46 | def test_no_chart(self):
47 | qc = QuickChart()
48 | qc.width = 600
49 | qc.height = 300
50 | qc.device_pixel_ratio = 2.0
51 |
52 | self.assertRaises(RuntimeError, qc.get_url)
53 |
54 | def test_get_bytes(self):
55 | qc = QuickChart()
56 | qc.width = 600
57 | qc.height = 300
58 | qc.config = {
59 | "type": "bar",
60 | "data": {
61 | "labels": ["Hello world", "Test"],
62 | "datasets": [{
63 | "label": "Foo",
64 | "data": [1, 2]
65 | }]
66 | }
67 | }
68 | self.assertTrue(len(qc.get_bytes()) > 8000)
69 |
70 | def test_with_function_and_dates(self):
71 | qc = QuickChart()
72 | qc.config = {
73 | "type": "bar",
74 | "data": {
75 | "labels": [datetime(2020, 1, 15), datetime(2021, 1, 15)],
76 | "datasets": [{
77 | "label": "Foo",
78 | "data": [1, 2]
79 | }]
80 | },
81 | "options": {
82 | "scales": {
83 | "yAxes": [{
84 | "ticks": {
85 | "callback": QuickChartFunction('(val) => val + "k"')
86 | }
87 | }],
88 | "xAxes": [{
89 | "ticks": {
90 | "callback": QuickChartFunction('(val) => "$" + val')
91 | }
92 | }]
93 | }
94 | }
95 | }
96 |
97 | url = qc.get_url()
98 | self.assertIn('7B%22ticks%22%3A%7B%22callback%22%3A%28val%29+%3D%3E+%22%24%22+%2B+val%7D%7D%5D%7D%7D%7D', url)
99 | self.assertIn('2020-01-15T00%3A00%3A00', url)
100 |
101 | if __name__ == '__main__':
102 | unittest.main()
103 |
--------------------------------------------------------------------------------