├── .gitignore
├── CHANGES.rst
├── LICENSE
├── README.md
├── bapt
├── __init__.py
├── cli.py
└── plotting.py
├── examples
├── basic.png
├── basic.yaml
├── command-line.png
├── fade.png
├── fade.yaml
├── flat.png
├── flat.yaml
├── gradients.png
├── gradients.yaml
├── offset.png
└── offset.yaml
├── setup.cfg
├── setup.py
└── tasks.py
/.gitignore:
--------------------------------------------------------------------------------
1 | # Byte-compiled / optimized / DLL files
2 | __pycache__/
3 | *.py[cod]
4 | *$py.class
5 |
6 | # C extensions
7 | *.so
8 |
9 | # Distribution / packaging
10 | .Python
11 | env/
12 | build/
13 | develop-eggs/
14 | dist/
15 | downloads/
16 | eggs/
17 | .eggs/
18 | lib/
19 | lib64/
20 | parts/
21 | sdist/
22 | var/
23 | wheels/
24 | *.egg-info/
25 | .installed.cfg
26 | *.egg
27 |
28 | # PyInstaller
29 | # Usually these files are written by a python script from a template
30 | # before PyInstaller builds the exe, so as to inject date/other infos into it.
31 | *.manifest
32 | *.spec
33 |
34 | # Installer logs
35 | pip-log.txt
36 | pip-delete-this-directory.txt
37 |
38 | # Unit test / coverage reports
39 | htmlcov/
40 | .tox/
41 | .coverage
42 | .coverage.*
43 | .cache
44 | nosetests.xml
45 | coverage.xml
46 | *.cover
47 | .hypothesis/
48 |
49 | # Translations
50 | *.mo
51 | *.pot
52 |
53 | # Django stuff:
54 | *.log
55 | local_settings.py
56 |
57 | # Flask stuff:
58 | instance/
59 | .webassets-cache
60 |
61 | # Scrapy stuff:
62 | .scrapy
63 |
64 | # Sphinx documentation
65 | docs/_build/
66 |
67 | # PyBuilder
68 | target/
69 |
70 | # Jupyter Notebook
71 | .ipynb_checkpoints
72 |
73 | # pyenv
74 | .python-version
75 |
76 | # celery beat schedule file
77 | celerybeat-schedule
78 |
79 | # SageMath parsed files
80 | *.sage.py
81 |
82 | # dotenv
83 | .env
84 |
85 | # virtualenv
86 | .venv
87 | venv/
88 | ENV/
89 |
90 | # Spyder project settings
91 | .spyderproject
92 | .spyproject
93 |
94 | # Rope project settings
95 | .ropeproject
96 |
97 | # mkdocs documentation
98 | /site
99 |
100 | # mypy
101 | .mypy_cache/
102 |
--------------------------------------------------------------------------------
/CHANGES.rst:
--------------------------------------------------------------------------------
1 | Change log
2 | ==========
3 |
4 | v1.0.0
5 | -----------
6 | * Initial release of bapt
7 | * Fading, custom gradients, and other options supported
8 |
--------------------------------------------------------------------------------
/LICENSE:
--------------------------------------------------------------------------------
1 | MIT License
2 |
3 | Copyright (c) 2017 Alex Ganose
4 |
5 | Permission is hereby granted, free of charge, to any person obtaining a copy
6 | of this software and associated documentation files (the "Software"), to deal
7 | in the Software without restriction, including without limitation the rights
8 | to use, copy, modify, merge, publish, distribute, sublicense, and/or sell
9 | copies of the Software, and to permit persons to whom the Software is
10 | furnished to do so, subject to the following conditions:
11 |
12 | The above copyright notice and this permission notice shall be included in all
13 | copies or substantial portions of the Software.
14 |
15 | THE SOFTWARE IS PROVIDED "AS IS", WITHOUT WARRANTY OF ANY KIND, EXPRESS OR
16 | IMPLIED, INCLUDING BUT NOT LIMITED TO THE WARRANTIES OF MERCHANTABILITY,
17 | FITNESS FOR A PARTICULAR PURPOSE AND NONINFRINGEMENT. IN NO EVENT SHALL THE
18 | AUTHORS OR COPYRIGHT HOLDERS BE LIABLE FOR ANY CLAIM, DAMAGES OR OTHER
19 | LIABILITY, WHETHER IN AN ACTION OF CONTRACT, TORT OR OTHERWISE, ARISING FROM,
20 | OUT OF OR IN CONNECTION WITH THE SOFTWARE OR THE USE OR OTHER DEALINGS IN THE
21 | SOFTWARE.
22 |
--------------------------------------------------------------------------------
/README.md:
--------------------------------------------------------------------------------
1 | README
2 | ======
3 |
4 | Introduction
5 | ------------
6 |
7 | Bapt is a tool for generating publication-ready band alignment plots.
8 |
9 |
10 | Usage
11 | -----
12 |
13 | Bapt can be used via the command-line or python api. For the full
14 | documentation of the command-line flags, please use the built-in help:
15 |
16 | bapt -h
17 |
18 | The bapt command-line can be controlled through command-line flags or
19 | a settings file. The settings file provides considerably more flexibility
20 | for things like custom gradients and fading effects.
21 |
22 | A basic usage of the command-line interface:
23 |
24 | bapt --name "ZnO,MOF-5,HKUST-1,ZIF-8" --ip 7.7,7.3,6.0,6.4 --ea 4.4,2.7,5.1,1.9
25 |
26 | produces a plot that is ready to go into any publication:
27 |
28 | 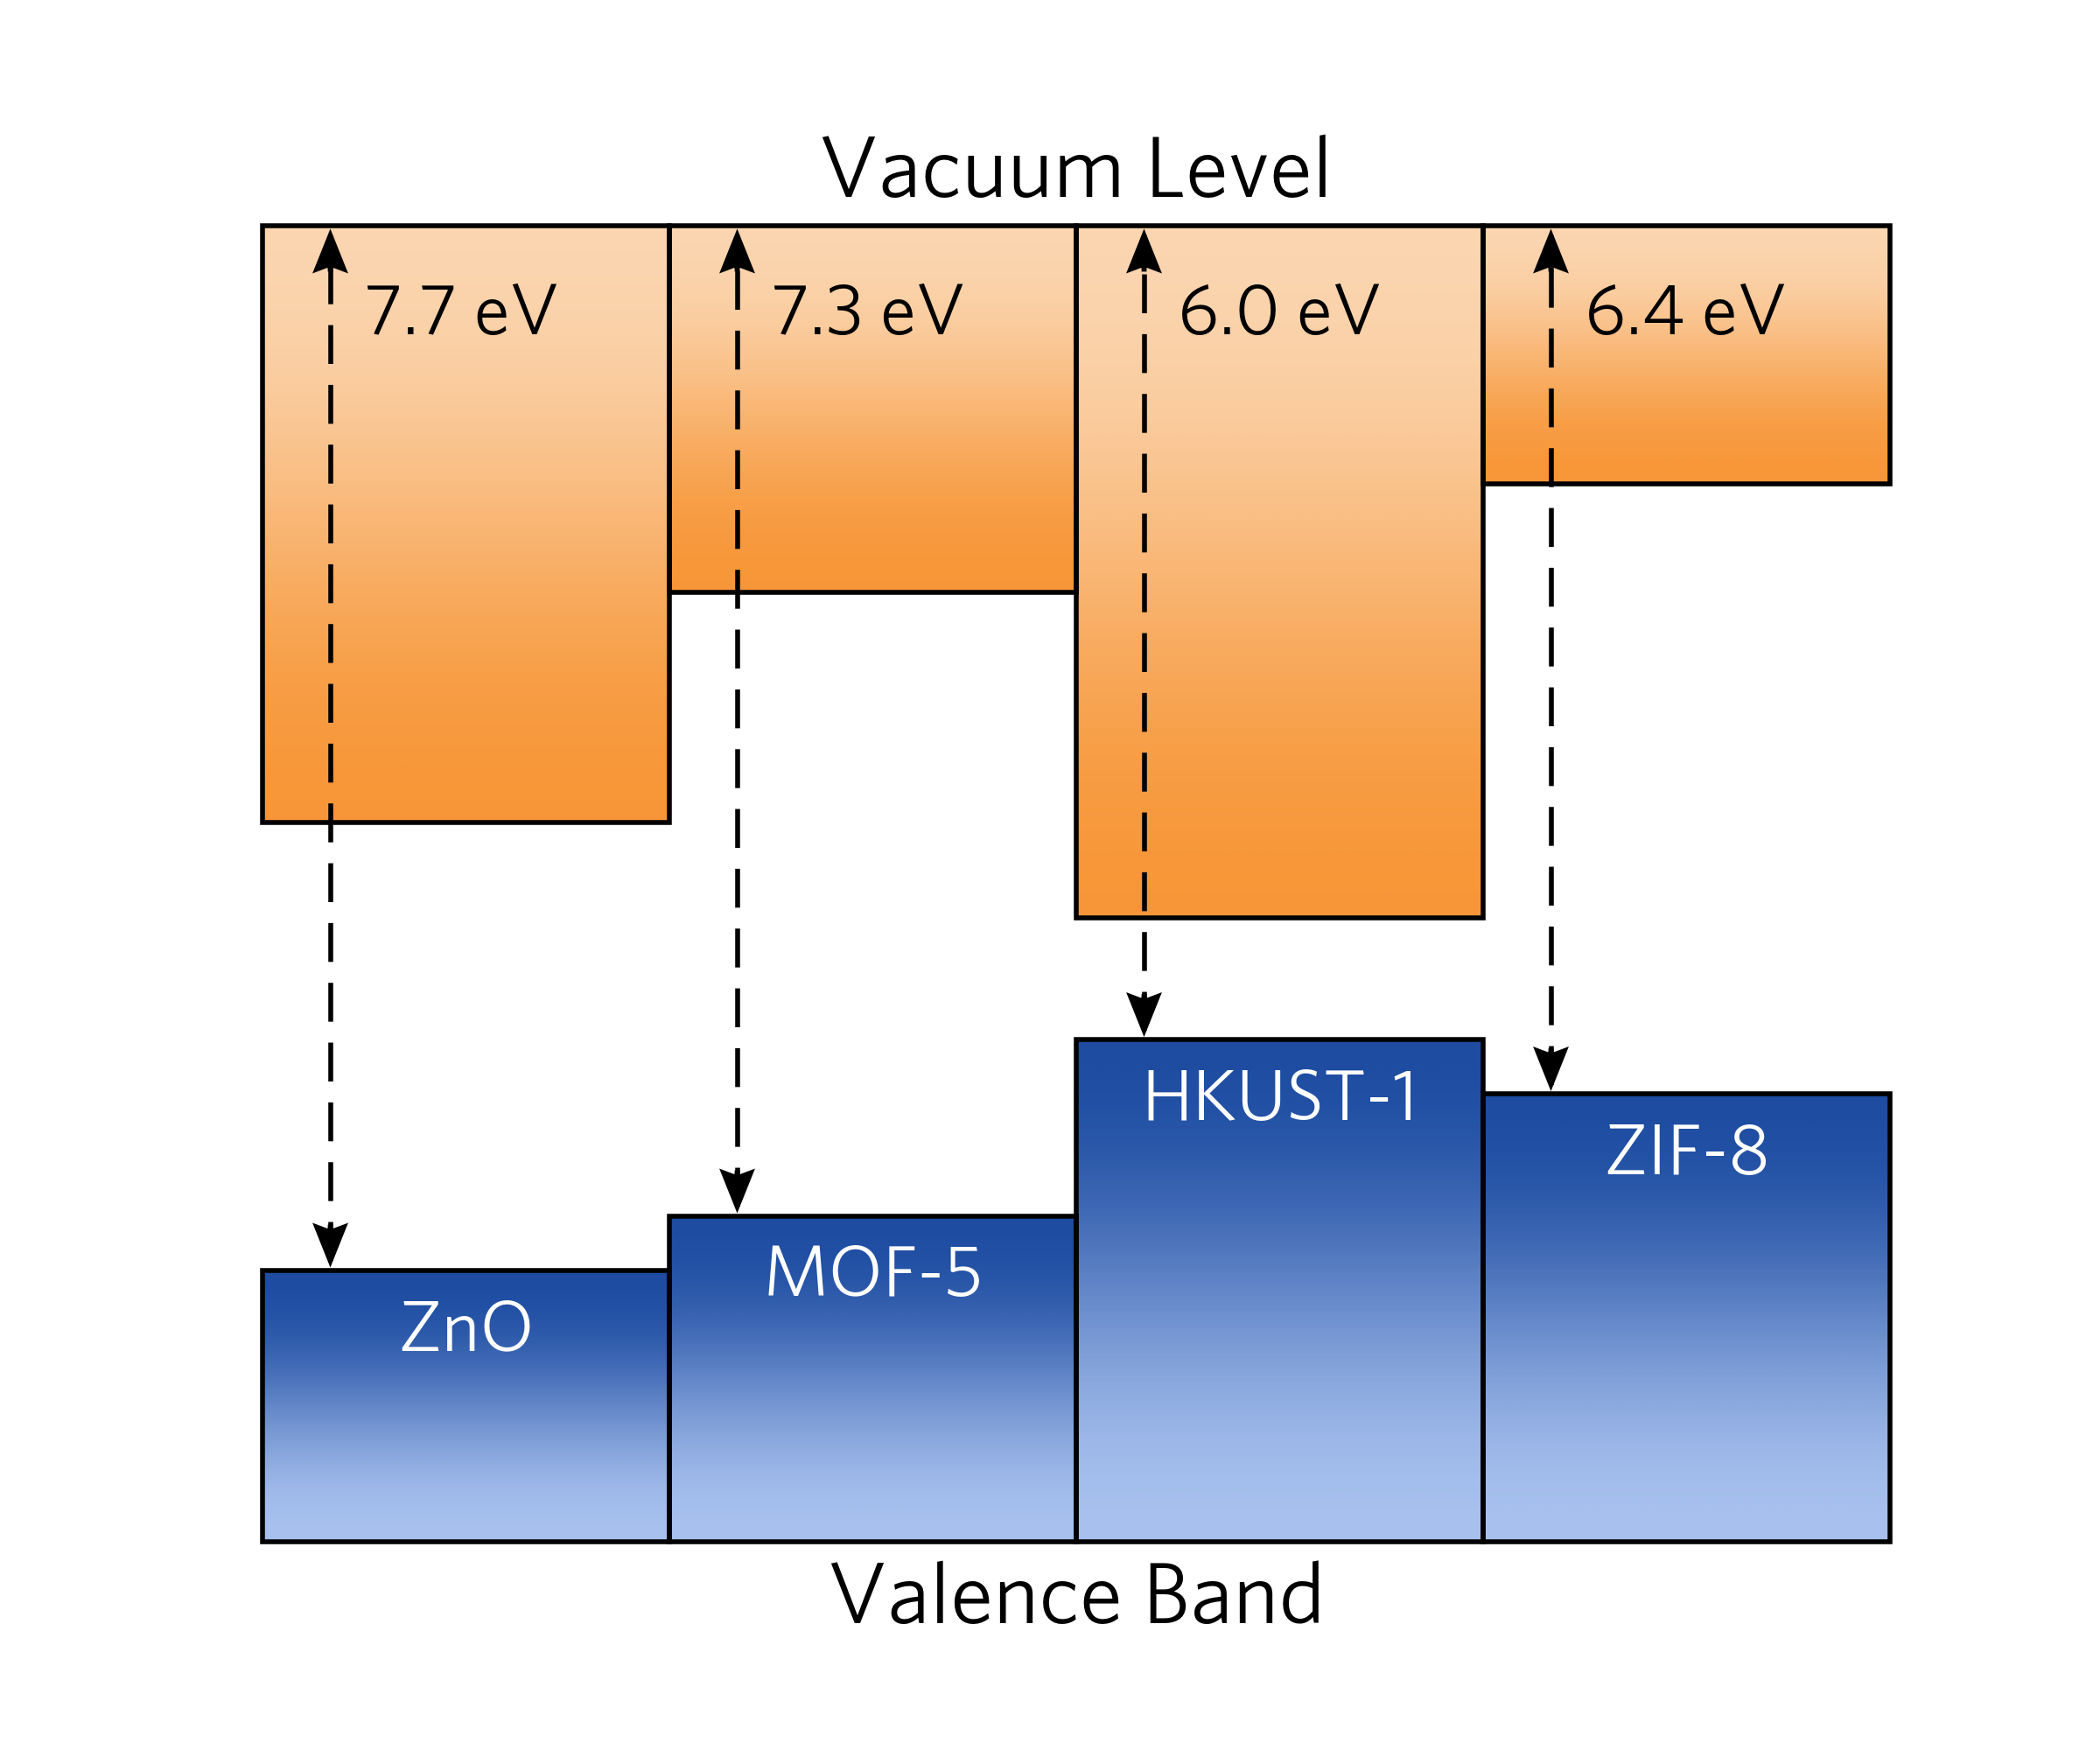 29 |
30 | A more advanced plot, generated using the `examples/gradients.yaml` config
31 | file, allows for additional effects:
32 |
33 | bapt --filename examples/gradients.yaml
34 |
35 |
29 |
30 | A more advanced plot, generated using the `examples/gradients.yaml` config
31 | file, allows for additional effects:
32 |
33 | bapt --filename examples/gradients.yaml
34 |
35 | 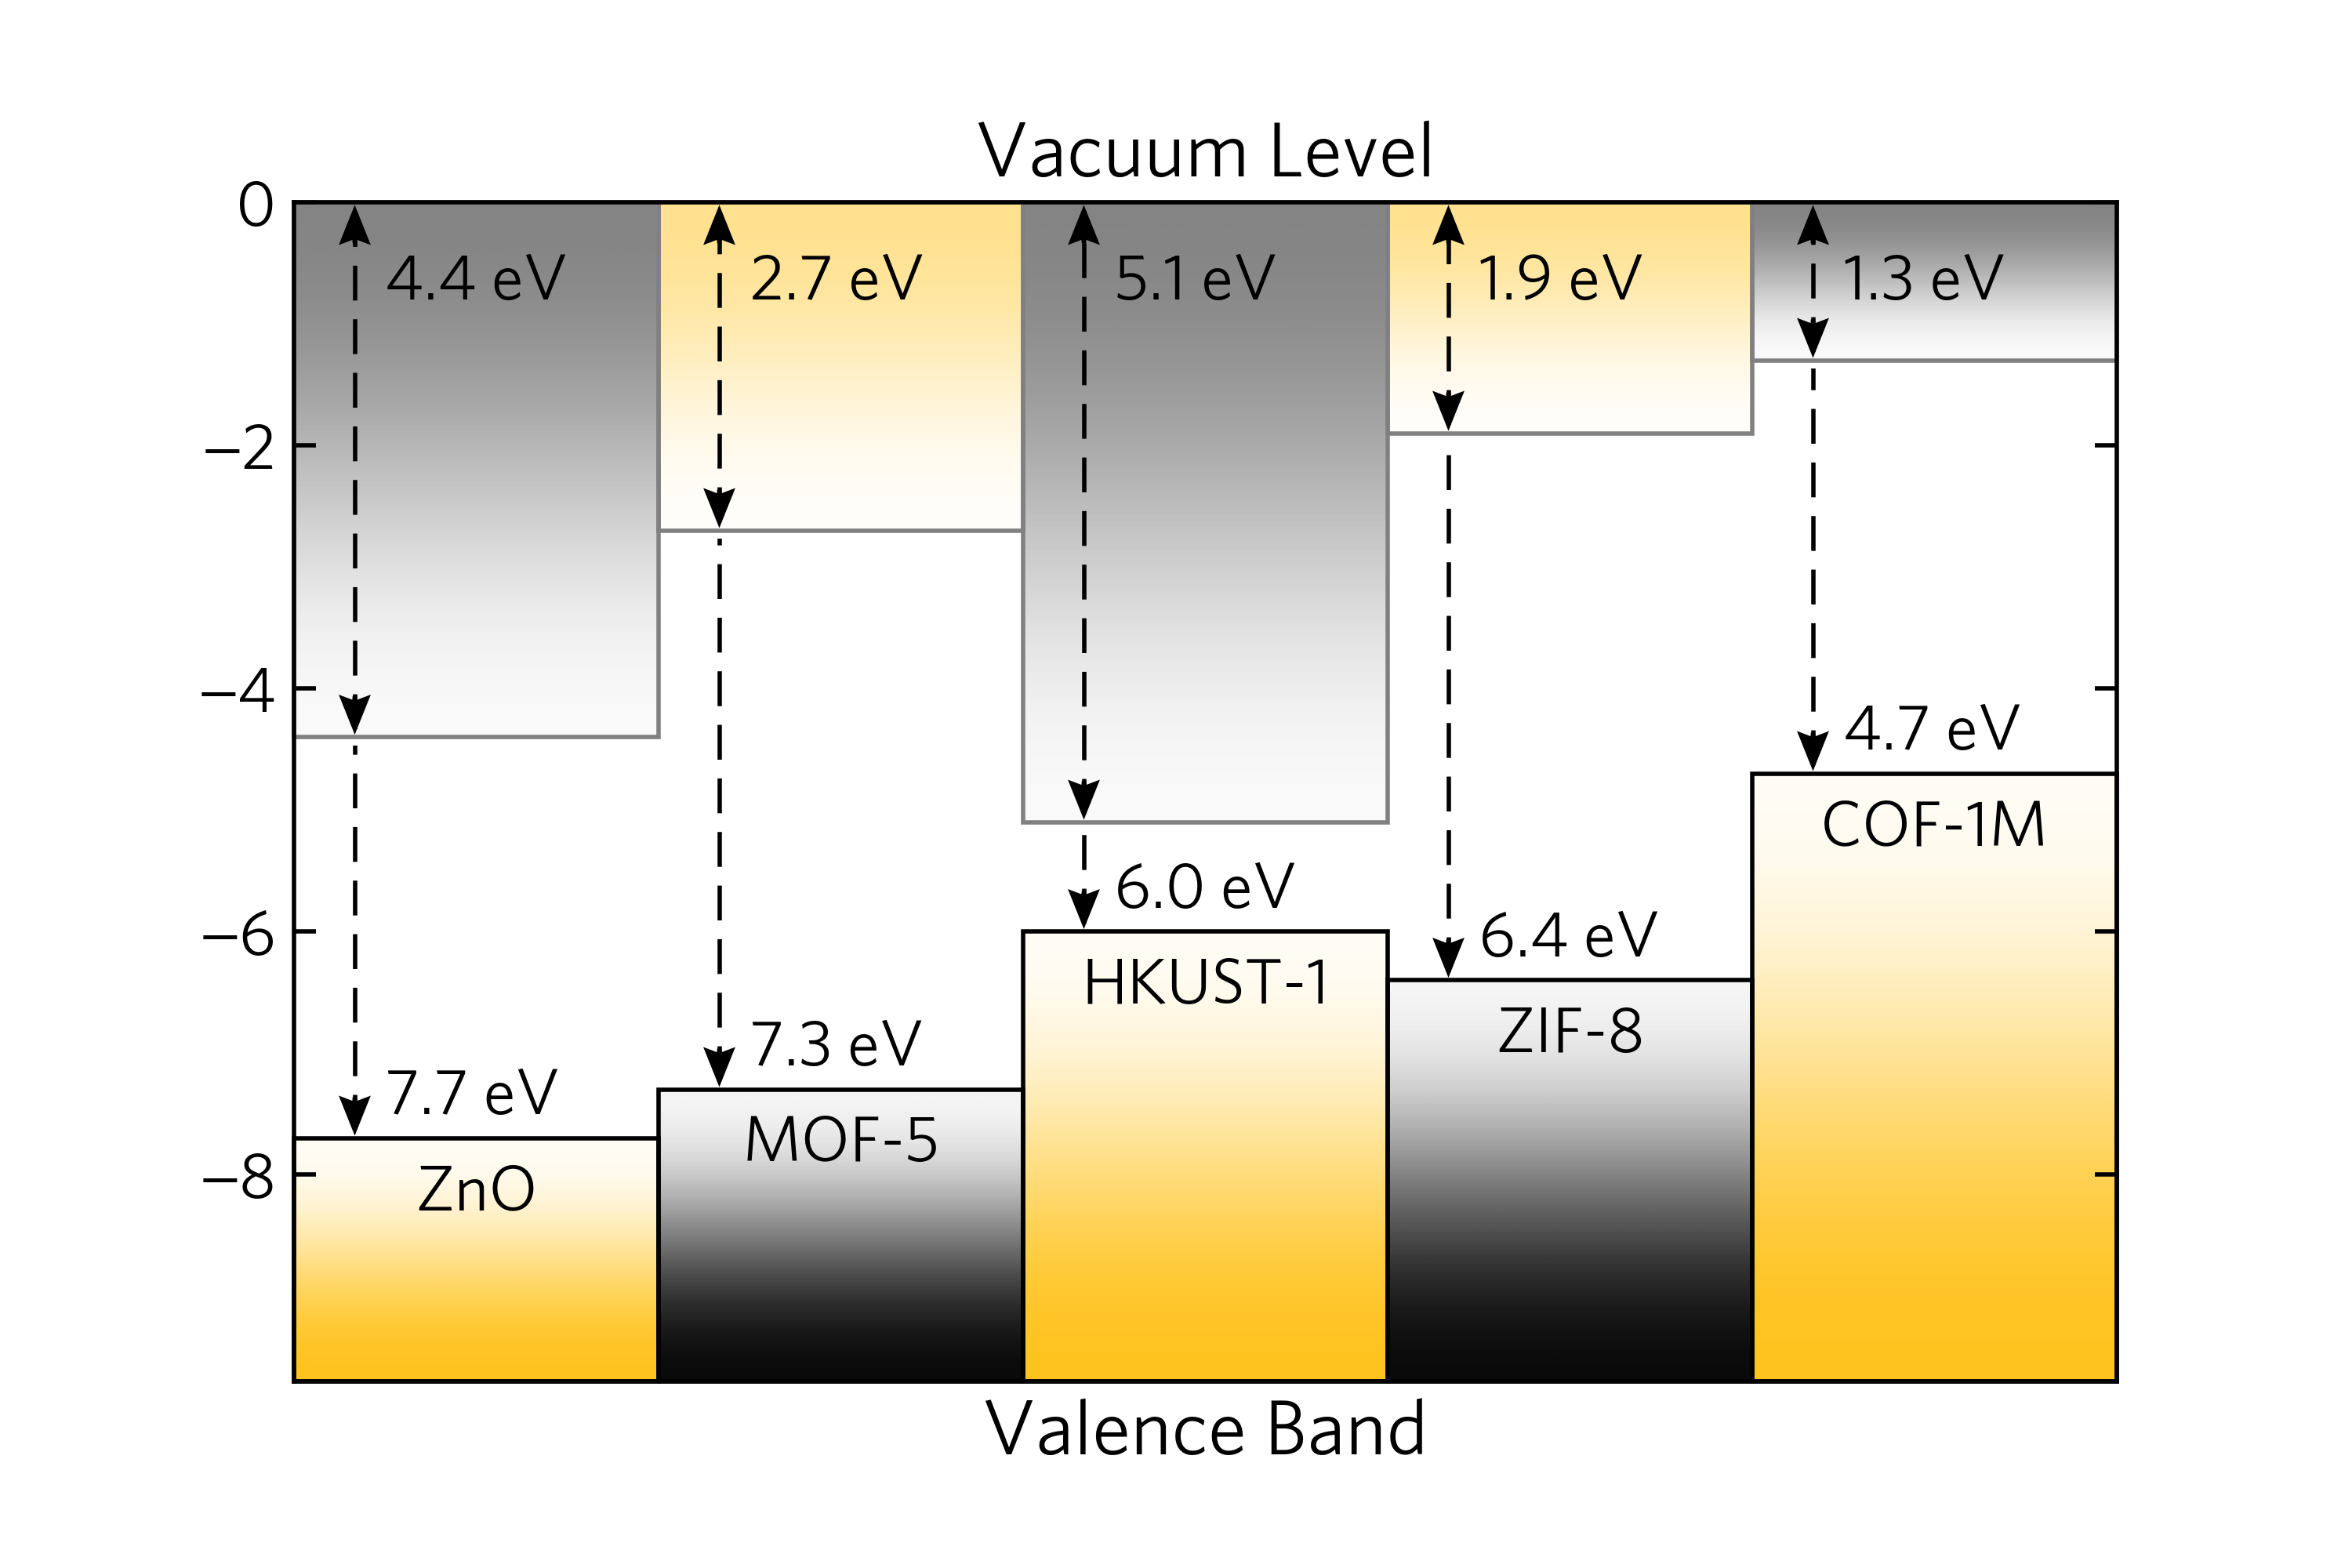 36 |
37 | In the alternative case of the relative alignment of bands, without vacuum alignment,
38 | one can specify the band gap values `--band-gap` alongside the valence band offsets `--vbo`,
39 | or equivalently the conduction band offsets `--cbo`:
40 |
41 | bapt -n ZnO,MOF-5,COF-1M --band-gap 1.774,1.366,1.6 --cbo 0.247,-0.4
42 |
43 |
36 |
37 | In the alternative case of the relative alignment of bands, without vacuum alignment,
38 | one can specify the band gap values `--band-gap` alongside the valence band offsets `--vbo`,
39 | or equivalently the conduction band offsets `--cbo`:
40 |
41 | bapt -n ZnO,MOF-5,COF-1M --band-gap 1.774,1.366,1.6 --cbo 0.247,-0.4
42 |
43 |  44 |
45 | The band offset approach can also be controlled through a yaml config file. For an example,
46 | see `examples/offset.yml`.
47 |
48 |
49 | Requirements
50 | ------------
51 |
52 | Bapt is currently compatible with Python 2.7 and Python 3.4. Matplotlib is required
53 | for plotting and PyYAML is needed for config files.
54 |
55 | Bapt uses Pip and setuptools for installation. You *probably* already
56 | have this; if not, your GNU/Linux package manager will be able to oblige
57 | with a package named something like ``python-setuptools``. On Max OSX
58 | the Python distributed with [Homebrew]() includes
59 | setuptools and Pip.
60 |
61 |
62 | Installation
63 | ------------
64 |
65 | Bapt is available on PyPI making installation easy:
66 |
67 | pip install --user bapt
68 |
69 | Or:
70 |
71 | pip3 install --user bapt
72 |
73 | To install the python 3 version.
74 |
75 |
76 | Contributors
77 | ------------
78 |
79 | `bapt` was developed by Alex Ganose.
80 |
81 | Other contributions are provided by:
82 |
83 | * Seán Kavanagh through the research groups of David Scanlon at University College London and Aron Walsh at Imperial College London.
84 |
85 |
86 | License
87 | -------
88 |
89 | Bapt is made available under the MIT License.
90 |
--------------------------------------------------------------------------------
/bapt/__init__.py:
--------------------------------------------------------------------------------
1 | # coding: utf-8
2 | # Copyright (c) Alex Ganose
3 | # Distributed under the terms of the MIT License.
4 |
5 | from .plotting import (pretty_plot, gbar, cbar, vb_cmap, cb_cmap, dashed_arrow, _linewidth, fadebar)
6 |
7 | from matplotlib.ticker import MaxNLocator, MultipleLocator
8 | from matplotlib.colors import LinearSegmentedColormap
9 |
10 |
11 | def get_plot(data, height=5, width=None, emin=None, colours=None,
12 | bar_width=3, show_axis=False, label_size=15, plt=None, gap=0.5,
13 | font=None, show_ea=False, name_colour='w', fade_cb=False, gradients=True, photocat=False):
14 |
15 | width = (bar_width/2. + gap/2.) * len(data) if not width else width
16 | emin = emin if emin else -max([d['ip'] for d in data]) - 2
17 |
18 | plt = pretty_plot(width=width, height=height, plt=plt, fonts=[font])
19 | ax = plt.gca()
20 |
21 | pad = 2. / emin
22 | for i, compound in enumerate(data):
23 | x = i * (bar_width + gap)
24 | ip = -compound['ip']
25 | ea = -compound['ea']
26 |
27 | fade = 'fade' in compound and compound['fade']
28 | edge_c_cb = '#808080' if fade or fade_cb else 'k'
29 | edge_c_vb = '#808080' if fade else 'k'
30 | edge_z = 4 if fade else 5
31 |
32 | if gradients:
33 | vg = vb_cmap if 'vb_gradient' not in compound else \
34 | compound['vb_gradient']
35 | cg = cb_cmap if 'cb_gradient' not in compound else \
36 | compound['cb_gradient']
37 |
38 | gbar(ax, x, ip, bottom=emin, bar_width=bar_width, show_edge=True,
39 | gradient=vg, edge_colour=edge_c_vb, edge_zorder=edge_z)
40 | gbar(ax, x, ea, bar_width=bar_width, show_edge=True,
41 | gradient=cg, edge_colour=edge_c_cb, edge_zorder=edge_z)
42 |
43 | else:
44 | vc = '#219ebc' if 'vb_colour' not in compound else \
45 | compound['vb_colour']
46 | cc ='#fb8500' if 'cb_colour' not in compound else \
47 | compound['cb_colour']
48 |
49 | cbar(ax, x, ip, vc, bottom=emin, bar_width=bar_width, show_edge=True,
50 | edge_colour=edge_c_vb, edge_zorder=edge_z)
51 | cbar(ax, x, ea, cc, bar_width=bar_width, show_edge=True,
52 | edge_colour=edge_c_vb, edge_zorder=edge_z)
53 |
54 | if show_ea:
55 | dashed_arrow(ax, x + bar_width/6., ea - pad/3, 0,
56 | -ea + 2 * pad/3, colour='k', line_width=_linewidth)
57 | dashed_arrow(ax, x + bar_width/6., ip - pad/3, 0,
58 | ea-ip + 2 * pad/3, colour='k', end_head=False,
59 | line_width=_linewidth)
60 | ax.text(x + bar_width/4., ip - pad/2,
61 | '{:.1f} eV'.format(compound['ip']), ha='left',
62 | va='bottom', size=label_size, color='k', zorder=2)
63 | ax.text(x + bar_width/4., pad * 2,
64 | '{:.1f} eV'.format(compound['ea']), ha='left', va='top',
65 | size=label_size, color='k', zorder=2)
66 | else:
67 | dashed_arrow(ax, x + bar_width/6., ip - pad/3, 0,
68 | -ip + 2 * pad/3, colour='k', line_width=_linewidth)
69 | ax.text(x + bar_width/4., pad * 2,
70 | '{:.1f} eV'.format(compound['ip']), ha='left', va='top',
71 | size=label_size, color='k', zorder=2)
72 |
73 | ax.text(x + bar_width/2., ip + pad, compound['name'], zorder=2,
74 | ha='center', va='top', size=label_size, color=name_colour)
75 |
76 | if fade:
77 | fadebar(ax, x, emin, bar_width=bar_width, bottom=0)
78 | elif fade_cb:
79 | fadebar(ax, x, ea, bar_width=bar_width, bottom=0, zorder=1)
80 |
81 | ax.set_ylim((emin, 0))
82 | ax.set_xlim((0, (len(data) * bar_width) + ((len(data) - 1) * gap)))
83 |
84 | if photocat:
85 | end = (len(data) * bar_width) + ((len(data) - 1) * gap)
86 | ax.hlines([-4.44, -5.67], 0, end, colors=['#808080', '#808080'], zorder=0, linewidths=1, linestyles='dotted', label=['H3O$^+$/H2', 'H$_2$O/O$_2$'])
87 | plt.text(end+0.1, -4.44, '[H$^+$/H$_2$]', va='center', size=label_size)
88 | plt.text(end+0.1, -5.67, '[H$_2$O/O$_2$]', va='center', size=label_size)
89 |
90 | ax.set_xticks([])
91 |
92 | if show_axis:
93 | ax.set_ylabel("Energy (eV)", size=label_size)
94 | ax.yaxis.set_major_locator(MaxNLocator(5))
95 | for spine in ax.spines.values():
96 | spine.set_zorder(5)
97 | else:
98 | for spine in ax.spines.values():
99 | spine.set_visible(False)
100 | ax.yaxis.set_visible(False)
101 |
102 | ax.set_title('Vacuum Level', size=label_size)
103 | ax.set_xlabel('Valence Band', size=label_size)
104 | return plt
105 |
106 |
107 | def read_config(filename):
108 | import yaml
109 |
110 | with open(filename, 'r') as f:
111 | config = yaml.safe_load(f)
112 |
113 | settings = config['settings'] if 'settings' in config else {}
114 | gradient_data = config['gradients'] if 'gradients' in config else []
115 | gradients = {}
116 | for d in gradient_data:
117 | g = LinearSegmentedColormap.from_list(d['id'], [d['start'], d['end']],
118 | N=200)
119 | gradients[d['id']] = g
120 |
121 | band_edge_data = config['compounds']
122 | for compound in band_edge_data:
123 | if 'gradient' in compound:
124 | ids = list(map(int, compound['gradient'].split(',')))
125 | compound.pop('gradient', None)
126 | if len(ids) == 1:
127 | compound['vb_gradient'] = gradients[ids[0]]
128 | compound['cb_gradient'] = gradients[ids[0]]
129 | else:
130 | compound['vb_gradient'] = gradients[ids[0]]
131 | compound['cb_gradient'] = gradients[ids[1]]
132 | return band_edge_data, settings
133 |
134 |
135 | def get_plot_novac(data, height=5, width=None, emin=None, emax=None,
136 | colours=None, bar_width=3, show_axis=False, hide_cbo=False,
137 | hide_vbo=False, label_size=15, plt=None, gap=0.5, font=None,
138 | show_ea=False, name_colour='w', fade_cb=False, gradients=True):
139 |
140 | width = (bar_width/2. + gap/2.) * len(data) if not width else width
141 | emin = emin if emin else min([d['vbo'] for d in data]) - 2
142 | emax = emax if emax else max([d['vbo'] + d['band_gap'] for d in data]) + 2
143 |
144 | plt = pretty_plot(width=width, height=height, plt=plt, fonts=[font])
145 | ax = plt.gca()
146 |
147 | pad = - (emax - emin) / 20
148 | for i, compound in enumerate(data):
149 | x = i * (bar_width + gap)
150 | ip = compound['vbo']
151 | ea = compound['vbo'] + compound['band_gap']
152 |
153 | fade = 'fade' in compound and compound['fade']
154 | edge_c_cb = '#808080' if fade or fade_cb else 'k'
155 | edge_c_vb = '#808080' if fade else 'k'
156 | edge_z = 4 if fade else 5
157 |
158 | if gradients:
159 | vc = vb_cmap if 'vb_gradient' not in compound else \
160 | compound['vb_gradient']
161 | cc = cb_cmap if 'cb_gradient' not in compound else \
162 | compound['cb_gradient']
163 |
164 | gbar(ax, x, ip, bottom=emin, bar_width=bar_width, show_edge=True,
165 | gradient=vc, edge_colour=edge_c_vb, edge_zorder=edge_z)
166 | gbar(ax, x, ea, bottom=emax, bar_width=bar_width, show_edge=True,
167 | gradient=cc, edge_colour=edge_c_cb, edge_zorder=edge_z)
168 | else:
169 | vc = '#219ebc' if 'vb_colour' not in compound else \
170 | compound['vb_colour']
171 | cc ='#fb8500' if 'cb_colour' not in compound else \
172 | compound['cb_colour']
173 |
174 | cbar(ax, x, ip, vc, bottom=emin, bar_width=bar_width, show_edge=True,
175 | edge_colour=edge_c_vb, edge_zorder=edge_z)
176 | cbar(ax, x, ea, cc, bottom=emax, bar_width=bar_width, show_edge=True,
177 | edge_colour=edge_c_vb, edge_zorder=edge_z)
178 |
179 | dashed_arrow(ax, x + bar_width/6., ip - pad/3, 0,
180 | ea-ip + 2 * pad/3, colour='k', line_width=_linewidth)
181 | ax.text(x + bar_width/4., ip + compound['band_gap']/2,
182 | '{:.2f} eV'.format(compound['band_gap']), ha='left',
183 | va='center', size=label_size, color='k', zorder=2)
184 |
185 | t = ax.text(x + bar_width/2., ip + pad / 2, compound['name'], zorder=2,
186 | ha='center', va='top', size=label_size, color=name_colour)
187 |
188 | # use renderer to get position of compound label text
189 | renderer = plt.gcf().canvas.get_renderer()
190 | bb = t.get_window_extent(renderer=renderer)
191 | inv = ax.transData.inverted()
192 | y1 = inv.transform([bb.y0, bb.y1 + 2 * bb.height])[1]
193 | if i > 0:
194 | if not hide_vbo:
195 | vbo = compound['vbo'] - data[i-1]['vbo']
196 | ax.text(x + bar_width/2., y1,
197 | "{:+.2f} eV".format(vbo), zorder=2, ha='center',
198 | va='top', size=label_size, color=name_colour)
199 |
200 | if not hide_cbo:
201 | cbo = compound['cbo'] - data[i-1]['cbo']
202 | ax.text(x + bar_width/2., ea - pad / 4,
203 | "{:+.2f} eV".format(cbo), zorder=2, ha='center',
204 | va='bottom', size=label_size, color=name_colour)
205 |
206 | if fade:
207 | fadebar(ax, x, emin, bar_width=bar_width, bottom=emax)
208 | elif fade_cb:
209 | fadebar(ax, x, ea, bar_width=bar_width, bottom=emax, zorder=1)
210 |
211 | ax.set_ylim((emin, emax))
212 | ax.set_xlim((0, (len(data) * bar_width) + ((len(data) - 1) * gap)))
213 | ax.set_xticks([])
214 |
215 | if show_axis:
216 | ax.set_ylabel("Energy (eV)", size=label_size)
217 | ax.yaxis.set_major_locator(MultipleLocator(1))
218 | for spine in ax.spines.values():
219 | spine.set_zorder(5)
220 | ax.tick_params(which='major', width=_linewidth)
221 | ax.tick_params(which='minor', right='on')
222 | ax.yaxis.set_minor_locator(MultipleLocator(0.5))
223 | else:
224 | for spine in ax.spines.values():
225 | spine.set_visible(False)
226 | ax.yaxis.set_visible(False)
227 |
228 | ax.set_title('Conduction Band', size=label_size)
229 | ax.set_xlabel('Valence Band', size=label_size)
230 | return plt
231 |
--------------------------------------------------------------------------------
/bapt/cli.py:
--------------------------------------------------------------------------------
1 | # coding: utf-8
2 | # Copyright (c) Alex Ganose
3 | # Distributed under the terms of the MIT License.
4 |
5 | import sys
6 | import argparse
7 |
8 | from . import read_config, get_plot, get_plot_novac
9 |
10 | __author__ = "Alex Ganose"
11 | __version__ = "0.1"
12 | __maintainer__ = "Alex Ganose"
13 | __email__ = "alexganose@googlemail.com"
14 | __date__ = "Oct 19, 2017"
15 |
16 |
17 | def main():
18 | parser = argparse.ArgumentParser(description="""
19 | Plotter for electronic band alignment diagrams.""",
20 | epilog="""
21 | Author: {}
22 | Version: {}
23 | Last updated: {}""".format(__author__, __version__, __date__))
24 | parser.add_argument('-f', '--filename', default=None,
25 | help='Path to file containing alignment information.')
26 | parser.add_argument('-n', '--name',
27 | help='List of compound names (comma seperated). ' +
28 | 'Must be used in conguction with --ip and --ea. ' +
29 | 'Use $_x$ and $^y$ for subscript and superscript.')
30 | parser.add_argument('-i', '--ip',
31 | help='List of ionisation potentials (comma separated).')
32 | parser.add_argument('-e', '--ea',
33 | help='List of electron affinities (comma separated).')
34 | parser.add_argument('-c', '--cbo', default=None,
35 | help='List of conduction band offsets (comma separated). ' +
36 | '(Relative to first compound)(-> No vacuum alignment)')
37 | parser.add_argument('-v', '--vbo', default=None,
38 | help='List of valence band offsets (comma separated). ' +
39 | '(Relative to first compound)(-> No vacuum alignment)')
40 | parser.add_argument('-b', '--band-gap', dest='band_gap',
41 | help='List of band gaps (comma separated).')
42 | parser.add_argument('-o', '--output', default='alignment.pdf',
43 | help='Output file name (defaults to alignment.pdf).')
44 | parser.add_argument('--show-ea', action='store_true', dest='show_ea',
45 | help='Display the electron affinity value.')
46 | parser.add_argument('--hide-cbo', action='store_true', dest='hide_cbo',
47 | help='Hide the conduction band offsets.')
48 | parser.add_argument('--hide-vbo', action='store_true', dest='hide_vbo',
49 | help='Hide the valence band offsets.')
50 | parser.add_argument('--show-axis', action='store_true', dest='show_axis',
51 | help='Display the energy yaxis bar and label.')
52 | parser.add_argument('--height', type=float, default=5,
53 | help='Set figure height in inches.')
54 | parser.add_argument('--width', type=float, default=None,
55 | help='Set figure width in inches.')
56 | parser.add_argument('--emin', type=float, default=None,
57 | help='Set energy minium on y axis.')
58 | parser.add_argument('--gap', type=float, default=0,
59 | help='Set gap between bars.')
60 | parser.add_argument('--bar-width', type=float, dest='bar_width', default=3,
61 | help='Set the width per bar for each compound.')
62 | parser.add_argument('--font', default=None, help='Font to use.')
63 | parser.add_argument('--font-size', type=float, dest='label_size',
64 | default=15, help='Set font size all labels.')
65 | parser.add_argument('--name-colour', dest='name_colour', default='w',
66 | help='Set the colour for the compound name.')
67 | parser.add_argument('--fade-cb', action='store_true', dest='fade_cb',
68 | help='Apply a fade to the conduction band segments.')
69 | parser.add_argument('--dpi', default=400,
70 | help='Dots-per-inch for file output.')
71 | parser.add_argument('--no-gradient', action='store_false', dest='gradients',
72 | help='Plot the boxes as solid colours.')
73 | parser.add_argument('--photocat', action='store_true',
74 | help='Plot water redox potentials')
75 | args = parser.parse_args()
76 |
77 | emsg = None
78 | if not args.filename and not (args.name or args.ip or args.ea or args.band_gap or args.cbo or args.vbo):
79 | emsg = "ERROR: no arguments specified."
80 | elif not args.filename and not (args.ip or args.ea) and \
81 | not (args.name and args.band_gap and (args.cbo or args.vbo)):
82 | emsg = "ERROR: --name, --band-gap and --cbo or --vbo flags must specified concurrently."
83 | elif not args.filename and not (args.cbo or args.vbo or args.band_gap) and \
84 | not (args.name and args.ip and args.ea):
85 | emsg = "ERROR: --name, --ip and --ea flags must specified concurrently."
86 | elif not args.filename and (args.cbo and args.vbo):
87 | emsg = "ERROR: cbo and vbo specified simultaneously."
88 | elif args.filename and (args.name or args.ip or args.ea or args.band_gap or args.cbo or args.vbo):
89 | emsg = "ERROR: filename and name/ip/ea/cbo/vbo specified simultaneously."
90 |
91 | if emsg:
92 | print(emsg)
93 | sys.exit()
94 |
95 | output_file = args.output
96 |
97 | if args.filename:
98 | data, settings = read_config(args.filename)
99 | for item in data:
100 | if 'cbo' in item:
101 | item['vbo'] = data[0]['band_gap'] - item['band_gap'] + item['cbo']
102 | if 'vbo' in item:
103 | item['cbo'] = -data[0]['band_gap'] + item['band_gap'] + item['vbo']
104 |
105 | else:
106 | for k, v in {'cbo': args.cbo, 'vbo': args.vbo}.items():
107 | if v:
108 | data = [{'name': name, 'band_gap': band_gap, k: c_or_v_bo} for name, band_gap, c_or_v_bo in
109 | zip(args.name.split(','), map(float, args.band_gap.split(',')),
110 | [0] + list(map(float, v.split(','))))]
111 | for item in data:
112 | if k == 'cbo':
113 | item['vbo'] = data[0]['band_gap'] - item['band_gap'] + item['cbo']
114 | if k == 'vbo':
115 | item['cbo'] = -data[0]['band_gap'] + item['band_gap'] + item['vbo']
116 | if args.ip:
117 | data = [{'name': name, 'ip': ip, 'ea': ea} for name, ip, ea in
118 | zip(args.name.split(','), map(float, args.ip.split(',')),
119 | map(float, args.ea.split(',')))]
120 |
121 | settings = {}
122 |
123 | properties = vars(args)
124 | remove_keys = ('filename', 'ip', 'ea', 'band_gap', 'cbo',
125 | 'vbo', 'name', 'output', 'dpi')
126 | for key in remove_keys:
127 | properties.pop(key, None)
128 | properties.update(settings)
129 |
130 | if 'vbo' in data[0]: # no vacuum alignment
131 | [properties.pop(key, None) for key in ['photocat_hlines', 'photocat']]
132 | plt = get_plot_novac(data, **properties)
133 | else:
134 | [properties.pop(key, None) for key in ['hide_cbo', 'hide_vbo']]
135 | plt = get_plot(data, **properties)
136 | plt.savefig(output_file, dpi=400, bbox_inches='tight')
137 |
138 |
139 | if __name__ == "__main__":
140 | main()
141 |
--------------------------------------------------------------------------------
/bapt/plotting.py:
--------------------------------------------------------------------------------
1 | # coding: utf-8
2 | # Copyright (c) Alex Ganose
3 | # Distributed under the terms of the MIT License.
4 |
5 | from matplotlib.patches import Rectangle
6 | from matplotlib.colors import LinearSegmentedColormap
7 |
8 |
9 | cb_colours = [(247/255., 148/255., 51/255.), (251/255., 216/255., 181/255.)]
10 | vb_colours = [(23/255., 71/255., 158/255.), (174/255., 198/255., 242/255.)]
11 | cb_cmap = LinearSegmentedColormap.from_list('cb', cb_colours, N=200)
12 | vb_cmap = LinearSegmentedColormap.from_list('vb', vb_colours, N=200)
13 |
14 | default_fonts = ['Whitney Pro', 'Helvetica', 'Arial', 'Whitney Book'
15 | 'Liberation Sans', 'Andale Sans']
16 | _ticklabelsize = 15
17 | _labelsize = 18
18 | _ticksize = 5
19 | _linewidth = 1.
20 |
21 |
22 | def pretty_plot(width=5, height=5, plt=None, dpi=400, fonts=None):
23 | """Initialise a matplotlib plot with sensible defaults for publication.
24 |
25 |
26 | Args:
27 | width (float): Width of plot in inches. Defaults to 8 in.
28 | height (float): Height of plot in inches. Defaults to 8 in.
29 | plt (matplotlib.pyplot): If plt is supplied, changes will be made to an
30 | existing plot. Otherwise, a new plot will be created.
31 | dpi (int): Sets dot per inch for figure. Defaults to 400.
32 | fonts (list): A list of preferred fonts. If these are not found the
33 | default fonts will be used.
34 |
35 | Returns:
36 | Matplotlib plot object with properly sized fonts.
37 | """
38 |
39 | from matplotlib import rc
40 |
41 | if plt is None:
42 | import matplotlib.pyplot as plt
43 | plt.figure(figsize=(width, height), facecolor="w", dpi=dpi)
44 | ax = plt.gca()
45 |
46 | ax = plt.gca()
47 |
48 | ax.tick_params(width=_linewidth, size=_ticksize)
49 | ax.tick_params(which='major', size=_ticksize, width=_linewidth,
50 | labelsize=_ticklabelsize, pad=4, direction='in',
51 | top='off', bottom='off', right='on', left='on')
52 | ax.tick_params(which='minor', size=_ticksize/2, width=_linewidth,
53 | direction='in', top='off', bottom='off')
54 |
55 | ax.set_title(ax.get_title(), size=20)
56 | for axis in ['top', 'bottom', 'left', 'right']:
57 | ax.spines[axis].set_linewidth(_linewidth)
58 |
59 | ax.set_xlabel(ax.get_xlabel(), size=_labelsize)
60 | ax.set_ylabel(ax.get_ylabel(), size=_labelsize)
61 |
62 | fonts = default_fonts if fonts is None or fonts == [None] else fonts + default_fonts
63 |
64 | rc('font', **{'family': 'sans-serif', 'sans-serif': fonts})
65 | rc('text', usetex=False)
66 | rc('pdf', fonttype=42)
67 | rc('mathtext', fontset='stixsans')
68 | rc('legend', handlelength=2)
69 | return plt
70 |
71 |
72 | def cbar(ax, left, top, face_colour, bar_width=3, bottom=0,
73 | show_edge=True, edge_colour='k', edge_zorder=5):
74 | X = [[.6, .6], [.7, .7]]
75 | right = left + bar_width
76 | patch = Rectangle((left, top), bar_width, bottom-top, fill=True,
77 | clip_on=False, facecolor=face_colour,
78 | )
79 | ax.add_patch(patch)
80 |
81 | if show_edge:
82 | border = Rectangle((left, top), bar_width, bottom-top, fill=False,
83 | lw=_linewidth, edgecolor=edge_colour, clip_on=False,
84 | zorder=edge_zorder)
85 | ax.add_patch(border)
86 |
87 | def gbar(ax, left, top, bar_width=3, bottom=0, gradient=vb_cmap,
88 | show_edge=True, edge_colour='k', edge_zorder=5):
89 | X = [[.6, .6], [.7, .7]]
90 | right = left + bar_width
91 | ax.imshow(X, interpolation='bicubic', cmap=gradient,
92 | extent=(left, right, bottom, top), alpha=1)
93 |
94 | if show_edge:
95 | border = Rectangle((left, top), bar_width, bottom-top, fill=False,
96 | lw=_linewidth, edgecolor=edge_colour, clip_on=False,
97 | zorder=edge_zorder)
98 | ax.add_patch(border)
99 |
100 |
101 | def fadebar(ax, left, top, bar_width=3, bottom=0, zorder=3):
102 | fade = Rectangle((left, top), bar_width, bottom-top, alpha=0.5, color='w',
103 | clip_on=False, zorder=zorder)
104 | ax.add_patch(fade)
105 |
106 |
107 | def dashed_arrow(ax, x, y, dx, dy, colour='k', line_width=_linewidth,
108 | start_head=True, end_head=True):
109 | length = 0.25
110 | width = 0.2
111 | ax.plot([x, x + dx], [y, y + dy], c=colour, ls='--', lw=line_width,
112 | dashes=(8, 4.3))
113 | if start_head:
114 | ax.arrow(x, y + length, 0, -length, head_width=width,
115 | head_length=length, fc=colour, ec=colour, overhang=0.15,
116 | length_includes_head=True, lw=line_width)
117 | if end_head:
118 | ax.arrow(x + dx, y + dy - length, 0, length, head_width=width,
119 | head_length=length, fc=colour, ec=colour, overhang=0.15,
120 | length_includes_head=True, lw=line_width)
121 |
--------------------------------------------------------------------------------
/examples/basic.png:
--------------------------------------------------------------------------------
https://raw.githubusercontent.com/utf/bapt/c6c94732f56e6a68b4bb26417880ff58ff49b7ce/examples/basic.png
--------------------------------------------------------------------------------
/examples/basic.yaml:
--------------------------------------------------------------------------------
1 | compounds:
2 | - name: 'ZnO'
3 | ea: 4.4
4 | ip: 7.7
5 | - name: 'MOF-5'
6 | ea: 2.7
7 | ip: 9
8 | - name: 'HKUST-1'
9 | ea: 5.1
10 | ip: 6.0
11 | - name: 'ZIF-8'
12 | ea: 1.9
13 | ip: 6.4
14 | - name: 'COF-1M'
15 | ea: 1.3
16 | ip: 4.7
17 |
--------------------------------------------------------------------------------
/examples/command-line.png:
--------------------------------------------------------------------------------
https://raw.githubusercontent.com/utf/bapt/c6c94732f56e6a68b4bb26417880ff58ff49b7ce/examples/command-line.png
--------------------------------------------------------------------------------
/examples/fade.png:
--------------------------------------------------------------------------------
https://raw.githubusercontent.com/utf/bapt/c6c94732f56e6a68b4bb26417880ff58ff49b7ce/examples/fade.png
--------------------------------------------------------------------------------
/examples/fade.yaml:
--------------------------------------------------------------------------------
1 | compounds:
2 | - name: 'ZnO'
3 | ea: 4.4
4 | ip: 7.7
5 | fade: True
6 | - name: 'MOF-5'
7 | ea: 2.7
8 | ip: 7.3
9 | fade: True
10 | - name: 'HKUST-1'
11 | ea: 5.1
12 | ip: 6.0
13 | - name: 'ZIF-8'
14 | ea: 1.9
15 | ip: 6.4
16 | fade: True
17 | - name: 'COF-1M'
18 | ea: 1.3
19 | ip: 4.7
20 | fade: True
21 |
--------------------------------------------------------------------------------
/examples/flat.png:
--------------------------------------------------------------------------------
https://raw.githubusercontent.com/utf/bapt/c6c94732f56e6a68b4bb26417880ff58ff49b7ce/examples/flat.png
--------------------------------------------------------------------------------
/examples/flat.yaml:
--------------------------------------------------------------------------------
1 | compounds:
2 | - name: 'ZnO'
3 | ea: 4.4
4 | ip: 7.7
5 | cb_colour: '#FDD968'
6 | vb_colour: '#B36AAE'
7 | - name: 'MOF-5'
8 | ea: 2.7
9 | ip: 7.3
10 | cb_colour: '#FDD968'
11 | vb_colour: '#B36AAE'
12 | - name: 'HKUST-1'
13 | ea: 5.1
14 | ip: 6.0
15 | cb_colour: '#FDD968'
16 | vb_colour: '#B36AAE'
17 | - name: 'ZIF-8'
18 | ea: 1.9
19 | ip: 6.4
20 | cb_colour: '#FFEEB8'
21 | vb_colour: '#ECCDE9'
22 | - name: 'COF-1M'
23 | ea: 1.3
24 | ip: 4.7
25 | cb_colour: '#FFEEB8'
26 | vb_colour: '#ECCDE9'
27 |
28 | settings:
29 | show_ea : True
30 | photocat: True
31 | gradients: False
32 | show_axis: True
--------------------------------------------------------------------------------
/examples/gradients.png:
--------------------------------------------------------------------------------
https://raw.githubusercontent.com/utf/bapt/c6c94732f56e6a68b4bb26417880ff58ff49b7ce/examples/gradients.png
--------------------------------------------------------------------------------
/examples/gradients.yaml:
--------------------------------------------------------------------------------
1 | compounds:
2 | - name: 'ZnO'
3 | ea: 4.4
4 | ip: 7.7
5 | gradient: 1, 0
6 | - name: 'MOF-5'
7 | ea: 2.7
8 | ip: 7.3
9 | gradient: 0, 1
10 | - name: 'HKUST-1'
11 | ea: 5.1
12 | ip: 6.0
13 | gradient: 1, 0
14 | - name: 'ZIF-8'
15 | ea: 1.9
16 | ip: 6.4
17 | gradient: 0, 1
18 | - name: 'COF-1M'
19 | ea: 1.3
20 | ip: 4.7
21 | gradient: 1, 0
22 |
23 | gradients:
24 | - id: 0
25 | start: '#FFFFFF'
26 | end: '#000000'
27 | - id: 1
28 | start: '#FFFFFF'
29 | end: '#FFC116'
30 |
31 | settings:
32 | name_colour: 'k'
33 | fade_cb: True
34 | show_ea: True
35 | show_axis: True
36 |
--------------------------------------------------------------------------------
/examples/offset.png:
--------------------------------------------------------------------------------
https://raw.githubusercontent.com/utf/bapt/c6c94732f56e6a68b4bb26417880ff58ff49b7ce/examples/offset.png
--------------------------------------------------------------------------------
/examples/offset.yaml:
--------------------------------------------------------------------------------
1 | compounds:
2 | - name: ZnO
3 | band_gap: 1.774
4 | cbo: 0
5 | - name: MOF-5
6 | band_gap: 1.366
7 | cbo: 0.247
8 | - name: COF-1M
9 | band_gap: 1.6
10 | cbo: -0.4
11 |
--------------------------------------------------------------------------------
/setup.cfg:
--------------------------------------------------------------------------------
1 | [metadata]
2 | description-file = README.md
3 |
4 | [bdist_wheel]
5 | universal = 1
6 |
--------------------------------------------------------------------------------
/setup.py:
--------------------------------------------------------------------------------
1 | """
2 | Vaspy: SMTG utils for working with Vasp
3 | """
4 |
5 | from os.path import abspath, dirname
6 | from setuptools import setup, find_packages
7 |
8 | project_dir = abspath(dirname(__file__))
9 |
10 | setup(
11 | name='bapt',
12 | version='1.1.0',
13 | description='Band alignment plotting tool',
14 | long_description="""
15 | Get yourself some nice band alignment diagrams
16 | """,
17 | url="https://github.com/utf/bapt",
18 | author="Alex Ganose",
19 | author_email="alexganose@googlemail.com",
20 | license='MIT',
21 |
22 | classifiers=[
23 | 'Development Status :: 5 - Production/Stable',
24 | 'Intended Audience :: Science/Research',
25 | 'License :: OSI Approved :: MIT License',
26 | 'Natural Language :: English',
27 | 'Programming Language :: Python :: 2.7',
28 | 'Programming Language :: Python :: 3',
29 | 'Programming Language :: Python :: 3.3',
30 | 'Programming Language :: Python :: 3.4',
31 | 'Programming Language :: Python :: 3.5',
32 | 'Topic :: Scientific/Engineering :: Chemistry',
33 | 'Topic :: Scientific/Engineering :: Physics'
34 | ],
35 | keywords='chemistry dft band alignment ionisation potential electron',
36 | packages=find_packages(),
37 | install_requires=['matplotlib', 'PyYAML>=5.1'],
38 | entry_points={'console_scripts': ['bapt = bapt.cli:main']}
39 | )
40 |
--------------------------------------------------------------------------------
/tasks.py:
--------------------------------------------------------------------------------
1 | from invoke import task
2 |
3 | import os
4 | import json
5 | import requests
6 | import re
7 |
8 |
9 | """
10 | Deployment file to facilitate releases of bapt.
11 | Note that this file is meant to be run from the root directory of the repo.
12 | """
13 |
14 | __author__ = "Alex Ganose"
15 | __email__ = "alexganose@googlemail.com"
16 | __date__ = "Oct 20 2017"
17 |
18 |
19 | @task
20 | def publish(ctx):
21 | ctx.run("rm dist/*.*", warn=True)
22 | ctx.run("python setup.py sdist bdist_wheel")
23 | ctx.run("twine upload dist/*")
24 |
25 |
26 | @task
27 | def release(ctx):
28 | with open("CHANGES.rst") as f:
29 | contents = f.read()
30 | toks = re.split("\-+", contents)
31 | new_ver = re.findall('\n(v.*)', contents)[0]
32 | desc = toks[1].strip()
33 | toks = desc.split("\n")
34 | desc = "\n".join(toks[:-1]).strip()
35 | payload = {
36 | "tag_name": new_ver,
37 | "target_commitish": "master",
38 | "name": new_ver,
39 | "body": desc,
40 | "draft": False,
41 | "prerelease": False
42 | }
43 | response = requests.post(
44 | "https://api.github.com/repos/utf/bapt/releases",
45 | data=json.dumps(payload),
46 | headers={"Authorization": "token " + os.environ["GITHUB_TOKEN"]})
47 | print(response.text)
48 |
--------------------------------------------------------------------------------
44 |
45 | The band offset approach can also be controlled through a yaml config file. For an example,
46 | see `examples/offset.yml`.
47 |
48 |
49 | Requirements
50 | ------------
51 |
52 | Bapt is currently compatible with Python 2.7 and Python 3.4. Matplotlib is required
53 | for plotting and PyYAML is needed for config files.
54 |
55 | Bapt uses Pip and setuptools for installation. You *probably* already
56 | have this; if not, your GNU/Linux package manager will be able to oblige
57 | with a package named something like ``python-setuptools``. On Max OSX
58 | the Python distributed with [Homebrew]() includes
59 | setuptools and Pip.
60 |
61 |
62 | Installation
63 | ------------
64 |
65 | Bapt is available on PyPI making installation easy:
66 |
67 | pip install --user bapt
68 |
69 | Or:
70 |
71 | pip3 install --user bapt
72 |
73 | To install the python 3 version.
74 |
75 |
76 | Contributors
77 | ------------
78 |
79 | `bapt` was developed by Alex Ganose.
80 |
81 | Other contributions are provided by:
82 |
83 | * Seán Kavanagh through the research groups of David Scanlon at University College London and Aron Walsh at Imperial College London.
84 |
85 |
86 | License
87 | -------
88 |
89 | Bapt is made available under the MIT License.
90 |
--------------------------------------------------------------------------------
/bapt/__init__.py:
--------------------------------------------------------------------------------
1 | # coding: utf-8
2 | # Copyright (c) Alex Ganose
3 | # Distributed under the terms of the MIT License.
4 |
5 | from .plotting import (pretty_plot, gbar, cbar, vb_cmap, cb_cmap, dashed_arrow, _linewidth, fadebar)
6 |
7 | from matplotlib.ticker import MaxNLocator, MultipleLocator
8 | from matplotlib.colors import LinearSegmentedColormap
9 |
10 |
11 | def get_plot(data, height=5, width=None, emin=None, colours=None,
12 | bar_width=3, show_axis=False, label_size=15, plt=None, gap=0.5,
13 | font=None, show_ea=False, name_colour='w', fade_cb=False, gradients=True, photocat=False):
14 |
15 | width = (bar_width/2. + gap/2.) * len(data) if not width else width
16 | emin = emin if emin else -max([d['ip'] for d in data]) - 2
17 |
18 | plt = pretty_plot(width=width, height=height, plt=plt, fonts=[font])
19 | ax = plt.gca()
20 |
21 | pad = 2. / emin
22 | for i, compound in enumerate(data):
23 | x = i * (bar_width + gap)
24 | ip = -compound['ip']
25 | ea = -compound['ea']
26 |
27 | fade = 'fade' in compound and compound['fade']
28 | edge_c_cb = '#808080' if fade or fade_cb else 'k'
29 | edge_c_vb = '#808080' if fade else 'k'
30 | edge_z = 4 if fade else 5
31 |
32 | if gradients:
33 | vg = vb_cmap if 'vb_gradient' not in compound else \
34 | compound['vb_gradient']
35 | cg = cb_cmap if 'cb_gradient' not in compound else \
36 | compound['cb_gradient']
37 |
38 | gbar(ax, x, ip, bottom=emin, bar_width=bar_width, show_edge=True,
39 | gradient=vg, edge_colour=edge_c_vb, edge_zorder=edge_z)
40 | gbar(ax, x, ea, bar_width=bar_width, show_edge=True,
41 | gradient=cg, edge_colour=edge_c_cb, edge_zorder=edge_z)
42 |
43 | else:
44 | vc = '#219ebc' if 'vb_colour' not in compound else \
45 | compound['vb_colour']
46 | cc ='#fb8500' if 'cb_colour' not in compound else \
47 | compound['cb_colour']
48 |
49 | cbar(ax, x, ip, vc, bottom=emin, bar_width=bar_width, show_edge=True,
50 | edge_colour=edge_c_vb, edge_zorder=edge_z)
51 | cbar(ax, x, ea, cc, bar_width=bar_width, show_edge=True,
52 | edge_colour=edge_c_vb, edge_zorder=edge_z)
53 |
54 | if show_ea:
55 | dashed_arrow(ax, x + bar_width/6., ea - pad/3, 0,
56 | -ea + 2 * pad/3, colour='k', line_width=_linewidth)
57 | dashed_arrow(ax, x + bar_width/6., ip - pad/3, 0,
58 | ea-ip + 2 * pad/3, colour='k', end_head=False,
59 | line_width=_linewidth)
60 | ax.text(x + bar_width/4., ip - pad/2,
61 | '{:.1f} eV'.format(compound['ip']), ha='left',
62 | va='bottom', size=label_size, color='k', zorder=2)
63 | ax.text(x + bar_width/4., pad * 2,
64 | '{:.1f} eV'.format(compound['ea']), ha='left', va='top',
65 | size=label_size, color='k', zorder=2)
66 | else:
67 | dashed_arrow(ax, x + bar_width/6., ip - pad/3, 0,
68 | -ip + 2 * pad/3, colour='k', line_width=_linewidth)
69 | ax.text(x + bar_width/4., pad * 2,
70 | '{:.1f} eV'.format(compound['ip']), ha='left', va='top',
71 | size=label_size, color='k', zorder=2)
72 |
73 | ax.text(x + bar_width/2., ip + pad, compound['name'], zorder=2,
74 | ha='center', va='top', size=label_size, color=name_colour)
75 |
76 | if fade:
77 | fadebar(ax, x, emin, bar_width=bar_width, bottom=0)
78 | elif fade_cb:
79 | fadebar(ax, x, ea, bar_width=bar_width, bottom=0, zorder=1)
80 |
81 | ax.set_ylim((emin, 0))
82 | ax.set_xlim((0, (len(data) * bar_width) + ((len(data) - 1) * gap)))
83 |
84 | if photocat:
85 | end = (len(data) * bar_width) + ((len(data) - 1) * gap)
86 | ax.hlines([-4.44, -5.67], 0, end, colors=['#808080', '#808080'], zorder=0, linewidths=1, linestyles='dotted', label=['H3O$^+$/H2', 'H$_2$O/O$_2$'])
87 | plt.text(end+0.1, -4.44, '[H$^+$/H$_2$]', va='center', size=label_size)
88 | plt.text(end+0.1, -5.67, '[H$_2$O/O$_2$]', va='center', size=label_size)
89 |
90 | ax.set_xticks([])
91 |
92 | if show_axis:
93 | ax.set_ylabel("Energy (eV)", size=label_size)
94 | ax.yaxis.set_major_locator(MaxNLocator(5))
95 | for spine in ax.spines.values():
96 | spine.set_zorder(5)
97 | else:
98 | for spine in ax.spines.values():
99 | spine.set_visible(False)
100 | ax.yaxis.set_visible(False)
101 |
102 | ax.set_title('Vacuum Level', size=label_size)
103 | ax.set_xlabel('Valence Band', size=label_size)
104 | return plt
105 |
106 |
107 | def read_config(filename):
108 | import yaml
109 |
110 | with open(filename, 'r') as f:
111 | config = yaml.safe_load(f)
112 |
113 | settings = config['settings'] if 'settings' in config else {}
114 | gradient_data = config['gradients'] if 'gradients' in config else []
115 | gradients = {}
116 | for d in gradient_data:
117 | g = LinearSegmentedColormap.from_list(d['id'], [d['start'], d['end']],
118 | N=200)
119 | gradients[d['id']] = g
120 |
121 | band_edge_data = config['compounds']
122 | for compound in band_edge_data:
123 | if 'gradient' in compound:
124 | ids = list(map(int, compound['gradient'].split(',')))
125 | compound.pop('gradient', None)
126 | if len(ids) == 1:
127 | compound['vb_gradient'] = gradients[ids[0]]
128 | compound['cb_gradient'] = gradients[ids[0]]
129 | else:
130 | compound['vb_gradient'] = gradients[ids[0]]
131 | compound['cb_gradient'] = gradients[ids[1]]
132 | return band_edge_data, settings
133 |
134 |
135 | def get_plot_novac(data, height=5, width=None, emin=None, emax=None,
136 | colours=None, bar_width=3, show_axis=False, hide_cbo=False,
137 | hide_vbo=False, label_size=15, plt=None, gap=0.5, font=None,
138 | show_ea=False, name_colour='w', fade_cb=False, gradients=True):
139 |
140 | width = (bar_width/2. + gap/2.) * len(data) if not width else width
141 | emin = emin if emin else min([d['vbo'] for d in data]) - 2
142 | emax = emax if emax else max([d['vbo'] + d['band_gap'] for d in data]) + 2
143 |
144 | plt = pretty_plot(width=width, height=height, plt=plt, fonts=[font])
145 | ax = plt.gca()
146 |
147 | pad = - (emax - emin) / 20
148 | for i, compound in enumerate(data):
149 | x = i * (bar_width + gap)
150 | ip = compound['vbo']
151 | ea = compound['vbo'] + compound['band_gap']
152 |
153 | fade = 'fade' in compound and compound['fade']
154 | edge_c_cb = '#808080' if fade or fade_cb else 'k'
155 | edge_c_vb = '#808080' if fade else 'k'
156 | edge_z = 4 if fade else 5
157 |
158 | if gradients:
159 | vc = vb_cmap if 'vb_gradient' not in compound else \
160 | compound['vb_gradient']
161 | cc = cb_cmap if 'cb_gradient' not in compound else \
162 | compound['cb_gradient']
163 |
164 | gbar(ax, x, ip, bottom=emin, bar_width=bar_width, show_edge=True,
165 | gradient=vc, edge_colour=edge_c_vb, edge_zorder=edge_z)
166 | gbar(ax, x, ea, bottom=emax, bar_width=bar_width, show_edge=True,
167 | gradient=cc, edge_colour=edge_c_cb, edge_zorder=edge_z)
168 | else:
169 | vc = '#219ebc' if 'vb_colour' not in compound else \
170 | compound['vb_colour']
171 | cc ='#fb8500' if 'cb_colour' not in compound else \
172 | compound['cb_colour']
173 |
174 | cbar(ax, x, ip, vc, bottom=emin, bar_width=bar_width, show_edge=True,
175 | edge_colour=edge_c_vb, edge_zorder=edge_z)
176 | cbar(ax, x, ea, cc, bottom=emax, bar_width=bar_width, show_edge=True,
177 | edge_colour=edge_c_vb, edge_zorder=edge_z)
178 |
179 | dashed_arrow(ax, x + bar_width/6., ip - pad/3, 0,
180 | ea-ip + 2 * pad/3, colour='k', line_width=_linewidth)
181 | ax.text(x + bar_width/4., ip + compound['band_gap']/2,
182 | '{:.2f} eV'.format(compound['band_gap']), ha='left',
183 | va='center', size=label_size, color='k', zorder=2)
184 |
185 | t = ax.text(x + bar_width/2., ip + pad / 2, compound['name'], zorder=2,
186 | ha='center', va='top', size=label_size, color=name_colour)
187 |
188 | # use renderer to get position of compound label text
189 | renderer = plt.gcf().canvas.get_renderer()
190 | bb = t.get_window_extent(renderer=renderer)
191 | inv = ax.transData.inverted()
192 | y1 = inv.transform([bb.y0, bb.y1 + 2 * bb.height])[1]
193 | if i > 0:
194 | if not hide_vbo:
195 | vbo = compound['vbo'] - data[i-1]['vbo']
196 | ax.text(x + bar_width/2., y1,
197 | "{:+.2f} eV".format(vbo), zorder=2, ha='center',
198 | va='top', size=label_size, color=name_colour)
199 |
200 | if not hide_cbo:
201 | cbo = compound['cbo'] - data[i-1]['cbo']
202 | ax.text(x + bar_width/2., ea - pad / 4,
203 | "{:+.2f} eV".format(cbo), zorder=2, ha='center',
204 | va='bottom', size=label_size, color=name_colour)
205 |
206 | if fade:
207 | fadebar(ax, x, emin, bar_width=bar_width, bottom=emax)
208 | elif fade_cb:
209 | fadebar(ax, x, ea, bar_width=bar_width, bottom=emax, zorder=1)
210 |
211 | ax.set_ylim((emin, emax))
212 | ax.set_xlim((0, (len(data) * bar_width) + ((len(data) - 1) * gap)))
213 | ax.set_xticks([])
214 |
215 | if show_axis:
216 | ax.set_ylabel("Energy (eV)", size=label_size)
217 | ax.yaxis.set_major_locator(MultipleLocator(1))
218 | for spine in ax.spines.values():
219 | spine.set_zorder(5)
220 | ax.tick_params(which='major', width=_linewidth)
221 | ax.tick_params(which='minor', right='on')
222 | ax.yaxis.set_minor_locator(MultipleLocator(0.5))
223 | else:
224 | for spine in ax.spines.values():
225 | spine.set_visible(False)
226 | ax.yaxis.set_visible(False)
227 |
228 | ax.set_title('Conduction Band', size=label_size)
229 | ax.set_xlabel('Valence Band', size=label_size)
230 | return plt
231 |
--------------------------------------------------------------------------------
/bapt/cli.py:
--------------------------------------------------------------------------------
1 | # coding: utf-8
2 | # Copyright (c) Alex Ganose
3 | # Distributed under the terms of the MIT License.
4 |
5 | import sys
6 | import argparse
7 |
8 | from . import read_config, get_plot, get_plot_novac
9 |
10 | __author__ = "Alex Ganose"
11 | __version__ = "0.1"
12 | __maintainer__ = "Alex Ganose"
13 | __email__ = "alexganose@googlemail.com"
14 | __date__ = "Oct 19, 2017"
15 |
16 |
17 | def main():
18 | parser = argparse.ArgumentParser(description="""
19 | Plotter for electronic band alignment diagrams.""",
20 | epilog="""
21 | Author: {}
22 | Version: {}
23 | Last updated: {}""".format(__author__, __version__, __date__))
24 | parser.add_argument('-f', '--filename', default=None,
25 | help='Path to file containing alignment information.')
26 | parser.add_argument('-n', '--name',
27 | help='List of compound names (comma seperated). ' +
28 | 'Must be used in conguction with --ip and --ea. ' +
29 | 'Use $_x$ and $^y$ for subscript and superscript.')
30 | parser.add_argument('-i', '--ip',
31 | help='List of ionisation potentials (comma separated).')
32 | parser.add_argument('-e', '--ea',
33 | help='List of electron affinities (comma separated).')
34 | parser.add_argument('-c', '--cbo', default=None,
35 | help='List of conduction band offsets (comma separated). ' +
36 | '(Relative to first compound)(-> No vacuum alignment)')
37 | parser.add_argument('-v', '--vbo', default=None,
38 | help='List of valence band offsets (comma separated). ' +
39 | '(Relative to first compound)(-> No vacuum alignment)')
40 | parser.add_argument('-b', '--band-gap', dest='band_gap',
41 | help='List of band gaps (comma separated).')
42 | parser.add_argument('-o', '--output', default='alignment.pdf',
43 | help='Output file name (defaults to alignment.pdf).')
44 | parser.add_argument('--show-ea', action='store_true', dest='show_ea',
45 | help='Display the electron affinity value.')
46 | parser.add_argument('--hide-cbo', action='store_true', dest='hide_cbo',
47 | help='Hide the conduction band offsets.')
48 | parser.add_argument('--hide-vbo', action='store_true', dest='hide_vbo',
49 | help='Hide the valence band offsets.')
50 | parser.add_argument('--show-axis', action='store_true', dest='show_axis',
51 | help='Display the energy yaxis bar and label.')
52 | parser.add_argument('--height', type=float, default=5,
53 | help='Set figure height in inches.')
54 | parser.add_argument('--width', type=float, default=None,
55 | help='Set figure width in inches.')
56 | parser.add_argument('--emin', type=float, default=None,
57 | help='Set energy minium on y axis.')
58 | parser.add_argument('--gap', type=float, default=0,
59 | help='Set gap between bars.')
60 | parser.add_argument('--bar-width', type=float, dest='bar_width', default=3,
61 | help='Set the width per bar for each compound.')
62 | parser.add_argument('--font', default=None, help='Font to use.')
63 | parser.add_argument('--font-size', type=float, dest='label_size',
64 | default=15, help='Set font size all labels.')
65 | parser.add_argument('--name-colour', dest='name_colour', default='w',
66 | help='Set the colour for the compound name.')
67 | parser.add_argument('--fade-cb', action='store_true', dest='fade_cb',
68 | help='Apply a fade to the conduction band segments.')
69 | parser.add_argument('--dpi', default=400,
70 | help='Dots-per-inch for file output.')
71 | parser.add_argument('--no-gradient', action='store_false', dest='gradients',
72 | help='Plot the boxes as solid colours.')
73 | parser.add_argument('--photocat', action='store_true',
74 | help='Plot water redox potentials')
75 | args = parser.parse_args()
76 |
77 | emsg = None
78 | if not args.filename and not (args.name or args.ip or args.ea or args.band_gap or args.cbo or args.vbo):
79 | emsg = "ERROR: no arguments specified."
80 | elif not args.filename and not (args.ip or args.ea) and \
81 | not (args.name and args.band_gap and (args.cbo or args.vbo)):
82 | emsg = "ERROR: --name, --band-gap and --cbo or --vbo flags must specified concurrently."
83 | elif not args.filename and not (args.cbo or args.vbo or args.band_gap) and \
84 | not (args.name and args.ip and args.ea):
85 | emsg = "ERROR: --name, --ip and --ea flags must specified concurrently."
86 | elif not args.filename and (args.cbo and args.vbo):
87 | emsg = "ERROR: cbo and vbo specified simultaneously."
88 | elif args.filename and (args.name or args.ip or args.ea or args.band_gap or args.cbo or args.vbo):
89 | emsg = "ERROR: filename and name/ip/ea/cbo/vbo specified simultaneously."
90 |
91 | if emsg:
92 | print(emsg)
93 | sys.exit()
94 |
95 | output_file = args.output
96 |
97 | if args.filename:
98 | data, settings = read_config(args.filename)
99 | for item in data:
100 | if 'cbo' in item:
101 | item['vbo'] = data[0]['band_gap'] - item['band_gap'] + item['cbo']
102 | if 'vbo' in item:
103 | item['cbo'] = -data[0]['band_gap'] + item['band_gap'] + item['vbo']
104 |
105 | else:
106 | for k, v in {'cbo': args.cbo, 'vbo': args.vbo}.items():
107 | if v:
108 | data = [{'name': name, 'band_gap': band_gap, k: c_or_v_bo} for name, band_gap, c_or_v_bo in
109 | zip(args.name.split(','), map(float, args.band_gap.split(',')),
110 | [0] + list(map(float, v.split(','))))]
111 | for item in data:
112 | if k == 'cbo':
113 | item['vbo'] = data[0]['band_gap'] - item['band_gap'] + item['cbo']
114 | if k == 'vbo':
115 | item['cbo'] = -data[0]['band_gap'] + item['band_gap'] + item['vbo']
116 | if args.ip:
117 | data = [{'name': name, 'ip': ip, 'ea': ea} for name, ip, ea in
118 | zip(args.name.split(','), map(float, args.ip.split(',')),
119 | map(float, args.ea.split(',')))]
120 |
121 | settings = {}
122 |
123 | properties = vars(args)
124 | remove_keys = ('filename', 'ip', 'ea', 'band_gap', 'cbo',
125 | 'vbo', 'name', 'output', 'dpi')
126 | for key in remove_keys:
127 | properties.pop(key, None)
128 | properties.update(settings)
129 |
130 | if 'vbo' in data[0]: # no vacuum alignment
131 | [properties.pop(key, None) for key in ['photocat_hlines', 'photocat']]
132 | plt = get_plot_novac(data, **properties)
133 | else:
134 | [properties.pop(key, None) for key in ['hide_cbo', 'hide_vbo']]
135 | plt = get_plot(data, **properties)
136 | plt.savefig(output_file, dpi=400, bbox_inches='tight')
137 |
138 |
139 | if __name__ == "__main__":
140 | main()
141 |
--------------------------------------------------------------------------------
/bapt/plotting.py:
--------------------------------------------------------------------------------
1 | # coding: utf-8
2 | # Copyright (c) Alex Ganose
3 | # Distributed under the terms of the MIT License.
4 |
5 | from matplotlib.patches import Rectangle
6 | from matplotlib.colors import LinearSegmentedColormap
7 |
8 |
9 | cb_colours = [(247/255., 148/255., 51/255.), (251/255., 216/255., 181/255.)]
10 | vb_colours = [(23/255., 71/255., 158/255.), (174/255., 198/255., 242/255.)]
11 | cb_cmap = LinearSegmentedColormap.from_list('cb', cb_colours, N=200)
12 | vb_cmap = LinearSegmentedColormap.from_list('vb', vb_colours, N=200)
13 |
14 | default_fonts = ['Whitney Pro', 'Helvetica', 'Arial', 'Whitney Book'
15 | 'Liberation Sans', 'Andale Sans']
16 | _ticklabelsize = 15
17 | _labelsize = 18
18 | _ticksize = 5
19 | _linewidth = 1.
20 |
21 |
22 | def pretty_plot(width=5, height=5, plt=None, dpi=400, fonts=None):
23 | """Initialise a matplotlib plot with sensible defaults for publication.
24 |
25 |
26 | Args:
27 | width (float): Width of plot in inches. Defaults to 8 in.
28 | height (float): Height of plot in inches. Defaults to 8 in.
29 | plt (matplotlib.pyplot): If plt is supplied, changes will be made to an
30 | existing plot. Otherwise, a new plot will be created.
31 | dpi (int): Sets dot per inch for figure. Defaults to 400.
32 | fonts (list): A list of preferred fonts. If these are not found the
33 | default fonts will be used.
34 |
35 | Returns:
36 | Matplotlib plot object with properly sized fonts.
37 | """
38 |
39 | from matplotlib import rc
40 |
41 | if plt is None:
42 | import matplotlib.pyplot as plt
43 | plt.figure(figsize=(width, height), facecolor="w", dpi=dpi)
44 | ax = plt.gca()
45 |
46 | ax = plt.gca()
47 |
48 | ax.tick_params(width=_linewidth, size=_ticksize)
49 | ax.tick_params(which='major', size=_ticksize, width=_linewidth,
50 | labelsize=_ticklabelsize, pad=4, direction='in',
51 | top='off', bottom='off', right='on', left='on')
52 | ax.tick_params(which='minor', size=_ticksize/2, width=_linewidth,
53 | direction='in', top='off', bottom='off')
54 |
55 | ax.set_title(ax.get_title(), size=20)
56 | for axis in ['top', 'bottom', 'left', 'right']:
57 | ax.spines[axis].set_linewidth(_linewidth)
58 |
59 | ax.set_xlabel(ax.get_xlabel(), size=_labelsize)
60 | ax.set_ylabel(ax.get_ylabel(), size=_labelsize)
61 |
62 | fonts = default_fonts if fonts is None or fonts == [None] else fonts + default_fonts
63 |
64 | rc('font', **{'family': 'sans-serif', 'sans-serif': fonts})
65 | rc('text', usetex=False)
66 | rc('pdf', fonttype=42)
67 | rc('mathtext', fontset='stixsans')
68 | rc('legend', handlelength=2)
69 | return plt
70 |
71 |
72 | def cbar(ax, left, top, face_colour, bar_width=3, bottom=0,
73 | show_edge=True, edge_colour='k', edge_zorder=5):
74 | X = [[.6, .6], [.7, .7]]
75 | right = left + bar_width
76 | patch = Rectangle((left, top), bar_width, bottom-top, fill=True,
77 | clip_on=False, facecolor=face_colour,
78 | )
79 | ax.add_patch(patch)
80 |
81 | if show_edge:
82 | border = Rectangle((left, top), bar_width, bottom-top, fill=False,
83 | lw=_linewidth, edgecolor=edge_colour, clip_on=False,
84 | zorder=edge_zorder)
85 | ax.add_patch(border)
86 |
87 | def gbar(ax, left, top, bar_width=3, bottom=0, gradient=vb_cmap,
88 | show_edge=True, edge_colour='k', edge_zorder=5):
89 | X = [[.6, .6], [.7, .7]]
90 | right = left + bar_width
91 | ax.imshow(X, interpolation='bicubic', cmap=gradient,
92 | extent=(left, right, bottom, top), alpha=1)
93 |
94 | if show_edge:
95 | border = Rectangle((left, top), bar_width, bottom-top, fill=False,
96 | lw=_linewidth, edgecolor=edge_colour, clip_on=False,
97 | zorder=edge_zorder)
98 | ax.add_patch(border)
99 |
100 |
101 | def fadebar(ax, left, top, bar_width=3, bottom=0, zorder=3):
102 | fade = Rectangle((left, top), bar_width, bottom-top, alpha=0.5, color='w',
103 | clip_on=False, zorder=zorder)
104 | ax.add_patch(fade)
105 |
106 |
107 | def dashed_arrow(ax, x, y, dx, dy, colour='k', line_width=_linewidth,
108 | start_head=True, end_head=True):
109 | length = 0.25
110 | width = 0.2
111 | ax.plot([x, x + dx], [y, y + dy], c=colour, ls='--', lw=line_width,
112 | dashes=(8, 4.3))
113 | if start_head:
114 | ax.arrow(x, y + length, 0, -length, head_width=width,
115 | head_length=length, fc=colour, ec=colour, overhang=0.15,
116 | length_includes_head=True, lw=line_width)
117 | if end_head:
118 | ax.arrow(x + dx, y + dy - length, 0, length, head_width=width,
119 | head_length=length, fc=colour, ec=colour, overhang=0.15,
120 | length_includes_head=True, lw=line_width)
121 |
--------------------------------------------------------------------------------
/examples/basic.png:
--------------------------------------------------------------------------------
https://raw.githubusercontent.com/utf/bapt/c6c94732f56e6a68b4bb26417880ff58ff49b7ce/examples/basic.png
--------------------------------------------------------------------------------
/examples/basic.yaml:
--------------------------------------------------------------------------------
1 | compounds:
2 | - name: 'ZnO'
3 | ea: 4.4
4 | ip: 7.7
5 | - name: 'MOF-5'
6 | ea: 2.7
7 | ip: 9
8 | - name: 'HKUST-1'
9 | ea: 5.1
10 | ip: 6.0
11 | - name: 'ZIF-8'
12 | ea: 1.9
13 | ip: 6.4
14 | - name: 'COF-1M'
15 | ea: 1.3
16 | ip: 4.7
17 |
--------------------------------------------------------------------------------
/examples/command-line.png:
--------------------------------------------------------------------------------
https://raw.githubusercontent.com/utf/bapt/c6c94732f56e6a68b4bb26417880ff58ff49b7ce/examples/command-line.png
--------------------------------------------------------------------------------
/examples/fade.png:
--------------------------------------------------------------------------------
https://raw.githubusercontent.com/utf/bapt/c6c94732f56e6a68b4bb26417880ff58ff49b7ce/examples/fade.png
--------------------------------------------------------------------------------
/examples/fade.yaml:
--------------------------------------------------------------------------------
1 | compounds:
2 | - name: 'ZnO'
3 | ea: 4.4
4 | ip: 7.7
5 | fade: True
6 | - name: 'MOF-5'
7 | ea: 2.7
8 | ip: 7.3
9 | fade: True
10 | - name: 'HKUST-1'
11 | ea: 5.1
12 | ip: 6.0
13 | - name: 'ZIF-8'
14 | ea: 1.9
15 | ip: 6.4
16 | fade: True
17 | - name: 'COF-1M'
18 | ea: 1.3
19 | ip: 4.7
20 | fade: True
21 |
--------------------------------------------------------------------------------
/examples/flat.png:
--------------------------------------------------------------------------------
https://raw.githubusercontent.com/utf/bapt/c6c94732f56e6a68b4bb26417880ff58ff49b7ce/examples/flat.png
--------------------------------------------------------------------------------
/examples/flat.yaml:
--------------------------------------------------------------------------------
1 | compounds:
2 | - name: 'ZnO'
3 | ea: 4.4
4 | ip: 7.7
5 | cb_colour: '#FDD968'
6 | vb_colour: '#B36AAE'
7 | - name: 'MOF-5'
8 | ea: 2.7
9 | ip: 7.3
10 | cb_colour: '#FDD968'
11 | vb_colour: '#B36AAE'
12 | - name: 'HKUST-1'
13 | ea: 5.1
14 | ip: 6.0
15 | cb_colour: '#FDD968'
16 | vb_colour: '#B36AAE'
17 | - name: 'ZIF-8'
18 | ea: 1.9
19 | ip: 6.4
20 | cb_colour: '#FFEEB8'
21 | vb_colour: '#ECCDE9'
22 | - name: 'COF-1M'
23 | ea: 1.3
24 | ip: 4.7
25 | cb_colour: '#FFEEB8'
26 | vb_colour: '#ECCDE9'
27 |
28 | settings:
29 | show_ea : True
30 | photocat: True
31 | gradients: False
32 | show_axis: True
--------------------------------------------------------------------------------
/examples/gradients.png:
--------------------------------------------------------------------------------
https://raw.githubusercontent.com/utf/bapt/c6c94732f56e6a68b4bb26417880ff58ff49b7ce/examples/gradients.png
--------------------------------------------------------------------------------
/examples/gradients.yaml:
--------------------------------------------------------------------------------
1 | compounds:
2 | - name: 'ZnO'
3 | ea: 4.4
4 | ip: 7.7
5 | gradient: 1, 0
6 | - name: 'MOF-5'
7 | ea: 2.7
8 | ip: 7.3
9 | gradient: 0, 1
10 | - name: 'HKUST-1'
11 | ea: 5.1
12 | ip: 6.0
13 | gradient: 1, 0
14 | - name: 'ZIF-8'
15 | ea: 1.9
16 | ip: 6.4
17 | gradient: 0, 1
18 | - name: 'COF-1M'
19 | ea: 1.3
20 | ip: 4.7
21 | gradient: 1, 0
22 |
23 | gradients:
24 | - id: 0
25 | start: '#FFFFFF'
26 | end: '#000000'
27 | - id: 1
28 | start: '#FFFFFF'
29 | end: '#FFC116'
30 |
31 | settings:
32 | name_colour: 'k'
33 | fade_cb: True
34 | show_ea: True
35 | show_axis: True
36 |
--------------------------------------------------------------------------------
/examples/offset.png:
--------------------------------------------------------------------------------
https://raw.githubusercontent.com/utf/bapt/c6c94732f56e6a68b4bb26417880ff58ff49b7ce/examples/offset.png
--------------------------------------------------------------------------------
/examples/offset.yaml:
--------------------------------------------------------------------------------
1 | compounds:
2 | - name: ZnO
3 | band_gap: 1.774
4 | cbo: 0
5 | - name: MOF-5
6 | band_gap: 1.366
7 | cbo: 0.247
8 | - name: COF-1M
9 | band_gap: 1.6
10 | cbo: -0.4
11 |
--------------------------------------------------------------------------------
/setup.cfg:
--------------------------------------------------------------------------------
1 | [metadata]
2 | description-file = README.md
3 |
4 | [bdist_wheel]
5 | universal = 1
6 |
--------------------------------------------------------------------------------
/setup.py:
--------------------------------------------------------------------------------
1 | """
2 | Vaspy: SMTG utils for working with Vasp
3 | """
4 |
5 | from os.path import abspath, dirname
6 | from setuptools import setup, find_packages
7 |
8 | project_dir = abspath(dirname(__file__))
9 |
10 | setup(
11 | name='bapt',
12 | version='1.1.0',
13 | description='Band alignment plotting tool',
14 | long_description="""
15 | Get yourself some nice band alignment diagrams
16 | """,
17 | url="https://github.com/utf/bapt",
18 | author="Alex Ganose",
19 | author_email="alexganose@googlemail.com",
20 | license='MIT',
21 |
22 | classifiers=[
23 | 'Development Status :: 5 - Production/Stable',
24 | 'Intended Audience :: Science/Research',
25 | 'License :: OSI Approved :: MIT License',
26 | 'Natural Language :: English',
27 | 'Programming Language :: Python :: 2.7',
28 | 'Programming Language :: Python :: 3',
29 | 'Programming Language :: Python :: 3.3',
30 | 'Programming Language :: Python :: 3.4',
31 | 'Programming Language :: Python :: 3.5',
32 | 'Topic :: Scientific/Engineering :: Chemistry',
33 | 'Topic :: Scientific/Engineering :: Physics'
34 | ],
35 | keywords='chemistry dft band alignment ionisation potential electron',
36 | packages=find_packages(),
37 | install_requires=['matplotlib', 'PyYAML>=5.1'],
38 | entry_points={'console_scripts': ['bapt = bapt.cli:main']}
39 | )
40 |
--------------------------------------------------------------------------------
/tasks.py:
--------------------------------------------------------------------------------
1 | from invoke import task
2 |
3 | import os
4 | import json
5 | import requests
6 | import re
7 |
8 |
9 | """
10 | Deployment file to facilitate releases of bapt.
11 | Note that this file is meant to be run from the root directory of the repo.
12 | """
13 |
14 | __author__ = "Alex Ganose"
15 | __email__ = "alexganose@googlemail.com"
16 | __date__ = "Oct 20 2017"
17 |
18 |
19 | @task
20 | def publish(ctx):
21 | ctx.run("rm dist/*.*", warn=True)
22 | ctx.run("python setup.py sdist bdist_wheel")
23 | ctx.run("twine upload dist/*")
24 |
25 |
26 | @task
27 | def release(ctx):
28 | with open("CHANGES.rst") as f:
29 | contents = f.read()
30 | toks = re.split("\-+", contents)
31 | new_ver = re.findall('\n(v.*)', contents)[0]
32 | desc = toks[1].strip()
33 | toks = desc.split("\n")
34 | desc = "\n".join(toks[:-1]).strip()
35 | payload = {
36 | "tag_name": new_ver,
37 | "target_commitish": "master",
38 | "name": new_ver,
39 | "body": desc,
40 | "draft": False,
41 | "prerelease": False
42 | }
43 | response = requests.post(
44 | "https://api.github.com/repos/utf/bapt/releases",
45 | data=json.dumps(payload),
46 | headers={"Authorization": "token " + os.environ["GITHUB_TOKEN"]})
47 | print(response.text)
48 |
--------------------------------------------------------------------------------