├── .github
└── ISSUE_TEMPLATE
│ ├── config.yml
│ ├── feature.yml
│ └── bug.yml
├── LICENSE.md
└── README.md
/.github/ISSUE_TEMPLATE/config.yml:
--------------------------------------------------------------------------------
1 | blank_issues_enabled: false
2 | contact_links:
3 | - name: Troubleshooting Guide
4 | url: https://github.com/wallabyjs/console-ninja#readme
5 | about: Please check out the README for more information about the project and for troubleshooting steps.
--------------------------------------------------------------------------------
/.github/ISSUE_TEMPLATE/feature.yml:
--------------------------------------------------------------------------------
1 | name: Feature request
2 | description: Suggest an idea for this project
3 | title: "[Feature]: "
4 | labels: ["enhancement", "requires triage"]
5 | body:
6 | - type: markdown
7 | attributes:
8 | value: |
9 | Thanks for taking the time to make a feature request!
10 | - type: textarea
11 | id: feature-request
12 | attributes:
13 | label: Describe the feature you'd like.
14 | description: Please tell us about the feature you would like. If you're requesting integration with another technology, please include links to the technology and if possible, include and a sample project that uses that technology.
15 | validations:
16 | required: true
--------------------------------------------------------------------------------
/.github/ISSUE_TEMPLATE/bug.yml:
--------------------------------------------------------------------------------
1 | name: Bug Report
2 | description: Create a report to help us improve
3 | title: "[Bug]: "
4 | labels: ["bug", "requires triage"]
5 | body:
6 | - type: markdown
7 | attributes:
8 | value: |
9 | Thanks for taking the time to fill out this bug report!
10 |
11 | Before you submit, please make sure to check out our [troubleshooting guide](https://github.com/wallabyjs/console-ninja#troubleshooting).
12 | - type: textarea
13 | id: what-happened
14 | attributes:
15 | label: What happened?
16 | description: Also tell us, what did you expected to happen?
17 | placeholder: Tell us what you see!
18 | value: "I was expecting X to happen but instead Z happened."
19 | validations:
20 | required: true
21 | - type: input
22 | id: version
23 | attributes:
24 | label: Version
25 | description: What version of Console Ninja are you using?
26 | placeholder: Console Ninja extension version
27 | validations:
28 | required: true
29 | - type: textarea
30 | id: dev-tool-CLI-command
31 | attributes:
32 | label: CLI command to start your dev tool
33 | description: Please provide us with the EXACT CLI command you use to start your dev tool.
34 | validations:
35 | required: true
36 | - type: textarea
37 | id: how-to-reproduce
38 | attributes:
39 | label: Steps to reproduce (or sample repo)
40 | description: Please provide us with steps to reproduce your issue or else a sample repo that has your problem.
41 | validations:
42 | required: true
43 | - type: textarea
44 | id: logs
45 | attributes:
46 | label: Log output
47 | description: Please copy and paste your log output from the `~/.console-ninja/trace.log` file in your user home directory. This will be automatically formatted into code, so no need for backticks.
48 | render: shell
49 | validations:
50 | required: true
51 | - type: markdown
52 | attributes:
53 | value: "Thanks for reporting your bug!"
54 |
--------------------------------------------------------------------------------
/LICENSE.md:
--------------------------------------------------------------------------------
1 | This End User License Agreement ("Agreement") is a legal contract between you as an individual or business organization ("you" or "Licensee") and Wallaby Pty Ltd ACN 620 776 794 ("Licensor") for the Console Ninja software (all editions), including any associated media, printed materials and electronic documentation (the "Software").
2 |
3 | By copying, downloading, accessing or otherwise using the Software, you agree to be bound by the terms of this Agreement and you represent that you are authorized to enter into this Agreement on behalf of yourself or your business organization.
4 |
5 | If you do not wish to be bound by the terms of this Agreement, you may not install, access or use the Software.
6 |
7 | # DEFINITIONS
8 |
9 | "Authorized User" means any employee, independent contractor, or other temporary worker authorized by Licensee to use the Software while performing duties within the scope of their employment or assignment.
10 |
11 | "Subscription Period" refers to the duration for which the Software is licensed, either on a monthly or annual basis.
12 |
13 | "User Type" refers to the category of user, either Personal or Organization, for which the Software is licensed.
14 |
15 | "Software" refers to the Console Ninja extension available for download on the VS Code marketplace, including all its components, features, and functionalities that are installed on the user's system. The term "Software" does not include any online documentation or other materials provided by the Licensor, which are accessible without a license and are available for reference on the Licensor's official website or other online platforms. Such online documentation is provided "as is" and is subject to change without notice.
16 |
17 | # OWNERSHIP
18 |
19 | This Agreement does not convey to you any rights of ownership of the Software. All rights, titles, and interest in the Software and in any ideas, know-how, and programs which are developed by Licensor in the course of providing any technical services, including any enhancements or modifications made to the Software, shall at all times remain the property of Licensor. You acknowledge and agree that the Software is licensed, not sold. You shall not permit the Software to be accessed or used by anyone other than your employees whose duties require such access or use. You will not remove, modify or alter any of Licensor's copyright, trademark or proprietary rights from any part of the Software.
20 |
21 | The Software is protected by Australian Copyright Law and International Treaty provisions. Further, the structure, organization, and code embodied in the Software are the valuable and confidential trade secrets of Licensor and its suppliers and are protected by intellectual property laws and treaties. Licensee agrees to abide by the copyright law and all other applicable laws.
22 |
23 | # GRANT OF LICENSE
24 |
25 | Upon your acceptance of this Agreement, Licensor grants you a limited, non-transferable, non-exclusive license to install and use the Software, whether you've chosen the free or paid version. If you've opted for the paid version, the specific terms and conditions of your license will be determined by your selected Subscription Period and User Type at the time of purchase.
26 |
27 | # INTENDED USERS OF THE SOFTWARE
28 |
29 | The Software is licensed to provide a software development productivity tool. It is intended for use by programmers, and all input and output should be reviewed carefully by suitably experienced personnel that are able to review, accept or reject any modifications or recommendations provided by the Software. For the avoidance of doubt you assume responsibility for the selection of the Software to achieve your intended results, and for the installation, use and results obtained from the Software.
30 |
31 | # PRO FEATURES (Applicable for Paid Version)
32 |
33 | The paid edition of the Software provides access to additional features and functionalities, collectively referred to as "PRO Features". These PRO Features enhance the Software's capabilities and are exclusive to users who have opted for the paid edition. The specific details and functionalities of the PRO Features are available on the Licensor's official website or other documentation provided by the Licensor.
34 |
35 | # TERMINATION OF PRO FEATURES ACCESS (Applicable for Paid Version)
36 |
37 | Upon the expiration of your subscription term for the paid edition, if the subscription is not renewed, access to the PRO Features will be terminated immediately. Any functionalities, data, or settings associated with the PRO Features may no longer be accessible or functional. You may switch to the free feature set of the Software at any time. It is the responsibility of the Licensee to ensure timely renewal if continued access to the PRO Features is desired.
38 |
39 | # SUBSCRIPTION DETAILS (Applicable for Paid Version)
40 |
41 | Individual User Subscriptions: Intended for software developers purchasing a Console Ninja subscription for personal or professional use with their own funds. This subscription can be used on multiple computers but not simultaneously. Individual User Subscriptions must not be financed by organizations in any manner.
42 |
43 | Organization Subscriptions: For organizations using Console Ninja for business purposes. Organizations must purchase a subscription for each developer using Console Ninja. The same key cannot be used by multiple developers simultaneously. A subscription can be used on multiple computers for the same developer, but not simultaneously. Licenses can be transferred within the organization.
44 |
45 | Subscriptions are activated via email, requiring online access to activate and update. Offline activation keys are available only for Organization Subscriptions with an annual Subscription Period.
46 |
47 | # RESTRICTED USE DURING EVALUATION PERIOD (Applicable for Paid Version)
48 |
49 | For the paid edition of the Software, subject to the terms of this Agreement, Licensee is granted a right to use the paid edition of the Software for evaluation purposes without charge for a period of fifteen (15) days from the date of the trial request unless otherwise specified ("Evaluation Period").
50 |
51 | Licensee's use of the paid edition of the Software during Evaluation Period shall be limited to the internal evaluation of the paid edition of the Software for the sole purpose of determining whether the paid edition of the Software meets Licensee's requirements and whether Licensee desires to continue using Software.
52 |
53 | Upon expiration of Evaluation Period, Licensee must purchase a Console Ninja subscription for use of the paid edition of the Software, switch to the free edition of the Software, or cease using Software.
54 |
55 | The paid edition of the Software contains a feature that will automatically switch the paid edition of the Software to the 'Community' edition of the Software upon expiration of a short period of time while the paid edition of the Software is used during Evaluation Period. Licensee may not disable, destroy, or remove this feature of the paid edition of the Software, and any attempt to do so will be in violation of this Agreement and will terminate Licensee's rights to use Software.
56 |
57 | # INSTALLATION OF THE SOFTWARE
58 |
59 | You may install and use the Software regardless of the edition you have selected. For those who have chosen the paid edition, your rights and obligations will be determined by your selected Subscription Period and User Type.
60 |
61 | # RESTRICTIONS ON USE OF THE SOFTWARE
62 |
63 | You may not: (a) make the Software available for use by others in any service bureau or similar arrangement, except for certified resellers who have been expressly authorized by Licensor to resell the Software; (b) distribute the Software to any third party, unless you are a certified reseller who has been expressly authorized by Licensor to distribute the Software; (c) sublicense the Software to any third party, unless you are a certified reseller who has been expressly authorized by Licensor to sublicense the Software; (d) disassemble or reverse engineer (except in European Union countries, to the extent allowed by law) the Software; (e) copy the Software except solely for backup/archival purposes, provided that you include all copyright and similar rights notices. The Licensor retains all rights, titles, and interest in all copies of the Software. Unauthorized copying and modification of the Software is not permitted.
64 |
65 | # UPGRADES AND SUPPORT
66 |
67 | While upgrades and support will be made on a best efforts basis, the Licensor has no obligation to provide updates or upgrades to the Software, or otherwise maintain or support the Software.
68 |
69 | # LIMITED WARRANTY AND DISCLAIMER OF WARRANTY
70 |
71 | THE SOFTWARE IS PROVIDED TO LICENSEE "AS IS" AND WITHOUT WARRANTIES. LICENSOR MAKES NO WARRANTY AS TO ITS USE OR PERFORMANCE. TO THE MAXIMUM EXTENT PERMITTED BY APPLICABLE LAW, LICENSOR AND ITS AFFILIATES, SUPPLIERS AND RESELLERS DISCLAIM ALL OTHER WARRANTIES AND CONDITIONS, EITHER EXPRESS OR IMPLIED, INCLUDING, BUT NOT LIMITED TO, IMPLIED WARRANTIES OF MERCHANTABILITY, FITNESS FOR A PARTICULAR PURPOSE, TITLE, AND NON-INFRINGEMENT, WITH REGARD TO SOFTWARE, AND THE PROVISION OF OR FAILURE TO PROVIDE SUPPORT SERVICES.
72 |
73 | # TRANSFER OF SOFTWARE
74 |
75 | You may not transfer or assign this Agreement, any license rights, or other interests in the Software to any third party without the express written consent of the Licensor.
76 |
77 | Notwithstanding the above, if you have purchased a subscription to the Software, you retain the right to continue using the Software for the duration of your subscription term, even in the event of a corporate merger, acquisition, reorganization, or other similar corporate events. Such rights are limited to the original subscription term and do not automatically renew unless explicitly agreed upon by the Licensor.
78 |
79 | # DISCLAIMER OF DAMAGES
80 |
81 | TO THE MAXIMUM EXTENT PERMITTED BY APPLICABLE LAW, IN NO EVENT WILL LICENSOR BE LIABLE TO LICENSEE UNDER ANY THEORY FOR ANY DAMAGES SUFFERED BY LICENSEE OR ANY USER OF SOFTWARE, OR FOR ANY SPECIAL, INCIDENTAL, INDIRECT, CONSEQUENTIAL, OR SIMILAR DAMAGES (INCLUDING, BUT NOT LIMITED TO, DAMAGES FOR LOSS OF PROFITS OR CONFIDENTIAL OR OTHER INFORMATION, FOR BUSINESS INTERRUPTION, FOR PERSONAL INJURY, FOR LOSS OF PRIVACY, FOR FAILURE TO MEET ANY DUTY INCLUDING OF GOOD FAITH OR OF REASONABLE CARE, FOR NEGLIGENCE, AND FOR ANY OTHER PECUNIARY OR OTHER LOSS WHATSOEVER) ARISING OUT OF THE USE OR INABILITY TO USE SOFTWARE, OR THE PROVISION OF OR FAILURE TO PROVIDE SUPPORT SERVICES, EVEN IF LICENSOR HAS BEEN ADVISED OF THE POSSIBILITY OF SUCH DAMAGES, AND REGARDLESS OF THE LEGAL OR EQUITABLE THEORY (CONTRACT, TORT OR OTHERWISE) UPON WHICH THE CLAIM IS BASED.
82 |
83 | IN ANY CASE, LICENSOR'S ENTIRE LIABILITY UNDER ANY PROVISION OF THIS AGREEMENT WILL BE LIMITED TO THE AMOUNT ACTUALLY PAID BY LICENSEE FOR SOFTWARE UNDER THIS AGREEMENT.
84 |
85 | # TERMINATION
86 |
87 | This license can be terminated by you at any time. In the event of termination, you must cease using the Software, destroy all copies of the Software (including copies in storage media) and certify such destruction to Licensor. This requirement applies to all copies in any form, partial or complete. Upon the effective date of any termination, you relinquish all rights granted under this Agreement.
88 |
89 | # RELATIONSHIP OF PARTIES
90 |
91 | You and Licensor are independent parties. Nothing in this Agreement shall be construed as making you an employee, agent or legal representative of Licensor.
92 |
93 | # PAYMENT
94 |
95 | The license fees are payable in accordance with the payment methods stipulated on the Software website (console-ninja.com).
96 |
97 | # CONTROLLING LAW
98 |
99 | This Agreement will be governed by the laws of Australia, and you submit to the jurisdiction of the High Court of Australia.
100 |
101 | # ENTIRE AGREEMENT
102 |
103 | This Agreement and any document expressly referred to in it constitute the whole agreement between you and the Licensor and supersede any previous arrangement, understanding, or agreement between you and the Licensor relating to the licensing of the Software.
104 |
105 | The parties acknowledge that, in entering into this Agreement (and the documents referred to in it), neither of party relies on any statement, representation, assurance, or warranty ("Representation") of any person (whether a party to this Agreement or not) other than as expressly set out in this Agreement or those documents.
106 |
107 | The parties agree that the only rights and remedies available to each party arising out of or in connection with a Representation shall be for breach of contract as provided in this Agreement.
108 |
--------------------------------------------------------------------------------
/README.md:
--------------------------------------------------------------------------------
1 | # Console Ninja
2 |
3 | Console Ninja is a VS Code extension that displays `console.log` output and **runtime errors** directly in your editor from your running browser or node application. It's like your browser dev tools console tab or terminal output from your node app, but instead of having to context switch, values are connected to your code and displayed ergonomically in your editor.
4 |
5 | 
6 |
7 | ---
8 |
9 | ## Table of contents
10 |
11 | - [Current status](#current-status)
12 | - [Supported technologies](#supported-technologies)
13 | - [Get started](#get-started)
14 | - Community Edition Features
15 | - [console.log](#consolelog)
16 | - [console.trace](#consoletrace)
17 | - [console.time](#consoletime)
18 | - [Network logging](#network-logging)
19 | - [Hover tooltip](#hover-tooltip)
20 | - [Log viewer](#log-viewer)
21 | - [Universal node applications](#universal-node-applications)
22 | - [Runtime Log Capture Options](#runtime-log-capture-options)
23 | - [PRO Edition Features](#pro-features)
24 | - [Watchpoints](#watchpoints)
25 | - [Logpoints](#logpoints)
26 | - [Network logging Pro](#network-logging)
27 | - [Function logpoints](#function-logpoints)
28 | - [File Code Coverage](#file-code-coverage)
29 | - [Class logpoints](#class-logpoints)
30 | - [Predictive logging](#predictive-logging)
31 | - [Hover tooltip Pro](#hover-tooltip-pro)
32 | - [Log Viewer Pro](#log-viewer-pro)
33 | - [Filtering Pro](#output-filtering-pro)
34 | - [Quick Search Pro](#quick-search-pro)
35 | - [Tracepoints](#tracepoints)
36 | - [Timepoints](#timepoints)
37 | - [GitHub Copilot integration](#github-copilot-integration)
38 | - [MCP Server](#mcp-server)
39 | - [Interactive Value Graphs](#interactive-value-graphs)
40 | - [Troubleshooting](#troubleshooting)
41 | - [How does it work?](#how-does-it-work)
42 | - [Differences between Console Ninja and other tools](#differences-between-console-ninja-and-other-tools)
43 | - [Quokka.js](#quokkajs)
44 | - [Wallaby.js](#wallabyjs)
45 | - [Error Lens extension](#error-lens-extension)
46 |
47 | ---
48 |
49 | ## Current status
50 |
51 | Console Ninja extension comes with 2 feature sets: **Community** and **PRO**.
52 |
53 | Console Ninja **Community** feature set includes many fundamental features such as displaying `console.log` output and runtime errors [directly in your editor](#get-started), showing all recorded logs and errors in the [log viewer](#log-viewer), etc. Console Ninja Community feature set is **free to use, and will always be free to use**.
54 |
55 | Console Ninja **PRO** (paid) feature set includes everything from the **Community** feature set as well as many additional advanced features that can be explored on [our website Pro page](https://console-ninja.com/pro) and are [documented in a separate doc section](#pro-features). Unless the feature is documented as being available in the **PRO** edition, it will always be available in the **Community** edition for free.
56 |
57 | Console Ninja feature sets are designed and will be extended in future with the goal of providing you the best tool in the world for debugging your applications. Whether you are using the free or paid version - we will do our best to make you as productive as possible. With the **PRO** feature set, we are aiming to 10x your productivity, especially in more advanced debugging scenarios:
58 |
59 | - with larger number of logs,
60 | - medium and large company projects,
61 | - realtime value watching and diff-ing,
62 | - zero config code coverage powered analysis,
63 | - and [much more](https://console-ninja.com/pro).
64 |
65 | You may easily switch between feature sets in the extension settings, request a trial period for Console Ninja **PRO** feature set by using the "Console Ninja: Manage License" command in VS Code, and [unlock](https://account.wallabyjs.com/shop/console-ninja/buy/) the full Console Ninja **PRO** feature set by purchasing a subscription.
66 |
67 | ## Supported technologies
68 |
69 | Console Ninja currently supports the following tools:
70 |
71 | - [Vite](https://vitejs.dev/), including
72 | - web applications that were generated by Vite CLI such the ones using React, Vue, Preact, Lit, Svelte, Vanilla, TypeScript or JavaScript;
73 | - web applications configured to use Vite;
74 | - web applications powered by app frameworks that are [using Vite](https://patak.dev/vite/ecosystem.html), such as [Nuxt](https://nuxtjs.org/) or [SvelteKit](https://kit.svelte.dev/).
75 | - [Webpack](https://webpack.js.org/), including
76 | - [Create React App](https://create-react-app.dev/) generated applications;
77 | - [Angular CLI](https://angular.io/cli) and [Angular Nx](https://nx.dev/packages/angular) generated applications;
78 | - [Gatsby.js](https://www.gatsbyjs.com/);
79 | - any web applications configured to use Webpack node module.
80 | - [Next.js](https://nextjs.org/), including first class support for browser and server side (Node and Edge) logs (Next.js middleware is currently not supported). **Turbopack** (**PRO** feature) is also supported.
81 | - [Nest.js](https://nestjs.com), if using Nest.js 10+ with [SWC](https://swc.rs/) as compiler, follow instructions of [this comment](https://github.com/wallabyjs/console-ninja/issues/220#issuecomment-1774408715).
82 | - [Remix](https://remix.run/), including first class support for client and server side logs (no errors).
83 | - [Nuxt](https://nuxt.com).
84 | - [Astro](https://astro.build), including first class support for client and server side logs (no server side errors).
85 | - [React Native with Expo](https://docs.expo.dev/get-started/set-up-your-environment/), including first class support for logs in iOS and Android emulators (**PRO** feature), and Web simulator.
86 | - [Shopify Hydrogen](https://apps.shopify.com/hydrogen).
87 | - [Qwik](https://qwik.builder.io).
88 | - [Serverless Offline](https://github.com/dherault/serverless-offline).
89 | - [Jest](https://jestjs.io/) test runner (no errors).
90 | - [Cypress.io](https://www.cypress.io/) end-to-end test runner.
91 | - [http-server](https://www.npmjs.com/package/http-server), [live-server](https://www.npmjs.com/package/live-server) and [serve](https://www.npmjs.com/package/serve) static HTTP servers.
92 | - [Live Server](https://marketplace.visualstudio.com/items?itemName=ritwickdey.LiveServer) VS Code extension (`off` by default, can be turned on in the Console Ninja extension VS Code settings).
93 | - [Live Preview](https://marketplace.visualstudio.com/items?itemName=ms-vscode.live-server) VS Code extension (`off` by default, can be turned on in the Console Ninja extension VS Code settings).
94 |
95 | In addition to the technologies above, Console Ninja also supports `node app.js`-like workflows including Express, Hapi, Fastify and other similar frameworks. Custom node applications are also supported. To learn more, please refer to the [Universal Node applications](#universal-node-applications) section.
96 |
97 | We have designed Console Ninja in such a way that adding support for new tools is fast and easy, so please [let us know](https://github.com/wallabyjs/console-ninja/issues) if there's another technology you want to use Console Ninja with.
98 |
99 | ## Get started
100 |
101 | Console Ninja is designed to fit seamlessly into most typical dev workflows. After you have installed the extension in VS Code and opened your project, you may perform the same steps you usually take:
102 |
103 | - run `npm/pnpm/yarn` script or CLI command that starts/opens your app in dev/watch/hot-reload mode **\***;
104 | - start making code changes, such as adding `console.log` to your code **\*\***;
105 | - if required **\*\*\***, perform the actions within your app that trigger the modified code, ie. click a button if you have added `console.log` to the button click handler;
106 |
107 | **\*** _If your app is a custom nodejs application then you need to prefix your CLI command with `console-ninja`, please refer to [Universal Node applications](#universal-node-applications) for more information._
108 |
109 | **\*\*** _Most modern tools run in watch mode with hot reload enabled. If your tool doesn't have such mode, then, the same way as without Console Ninja, you need to refresh your app page to make it run your modified code._
110 |
111 | **\*\*\*** _Sometimes your modified code may be triggered immediately upon the (hot) reload of the app. For example, when code is located in the root of a component, it will be executed when the app (re)starts. If the modified code is not triggered by the app (re)start, then, the same way as without Console Ninja, you will need to perform your app specific actions to trigger the code execution._
112 |
113 | 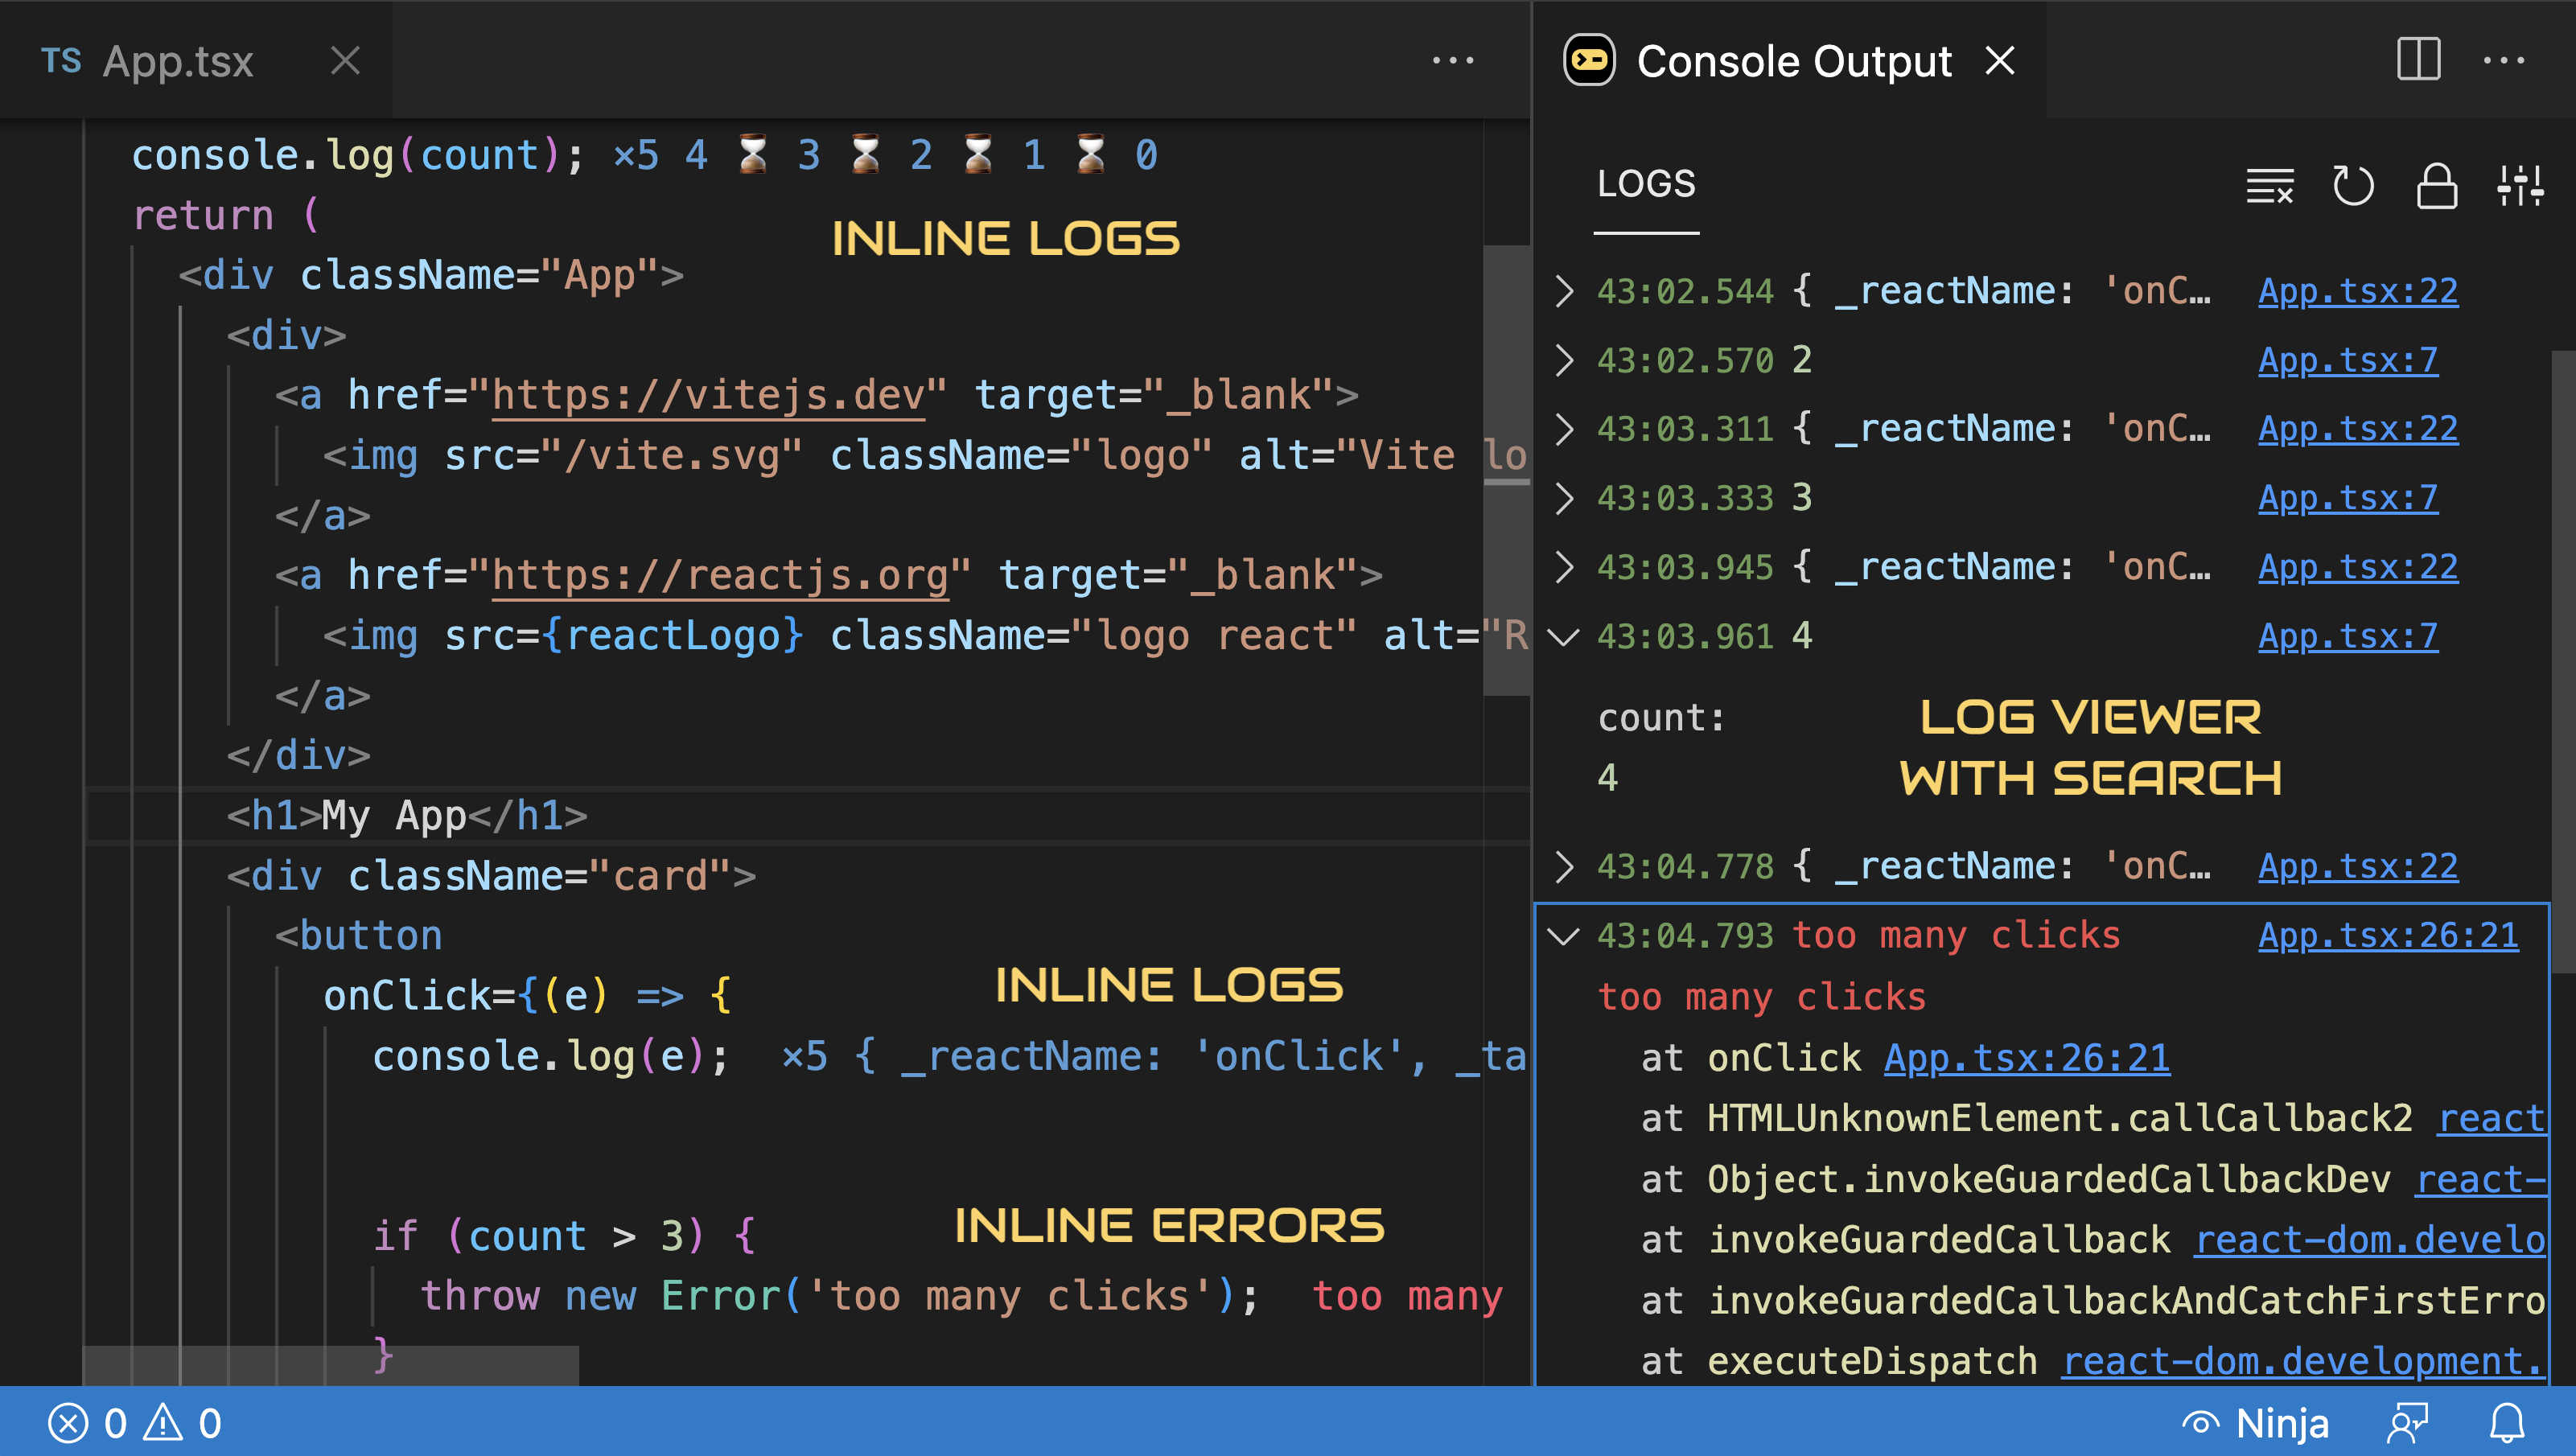
114 |
115 | You should now be able to see logs (and errors, if any) in your editor, next to the relevant line of code. Hovering over the `console.log` or **error** value will display more details. **If you don't see the expected output, please [check Console Ninja's current status](#troubleshooting)**.
116 |
117 | Using the `Show Output` command displays the log viewer, allowing you to explore more details and navigate between logs and code.
118 |
119 | ### console.log
120 |
121 | Adding `console.log` to your code will display the log output in your editor, next to the relevant line of code. Hovering over the `console.log` value will display additional details. The log output is also displayed in the [log viewer](#log-viewer).
122 |
123 | ### console.trace
124 |
125 | Adding [`console.trace`](https://developer.mozilla.org/en-US/docs/Web/API/console/trace) to your code will display the **call stack trace** right in your editor, next to the line of code with `console.trace`. The stack trace output is also displayed in the [log viewer](#log-viewer).
126 |
127 | 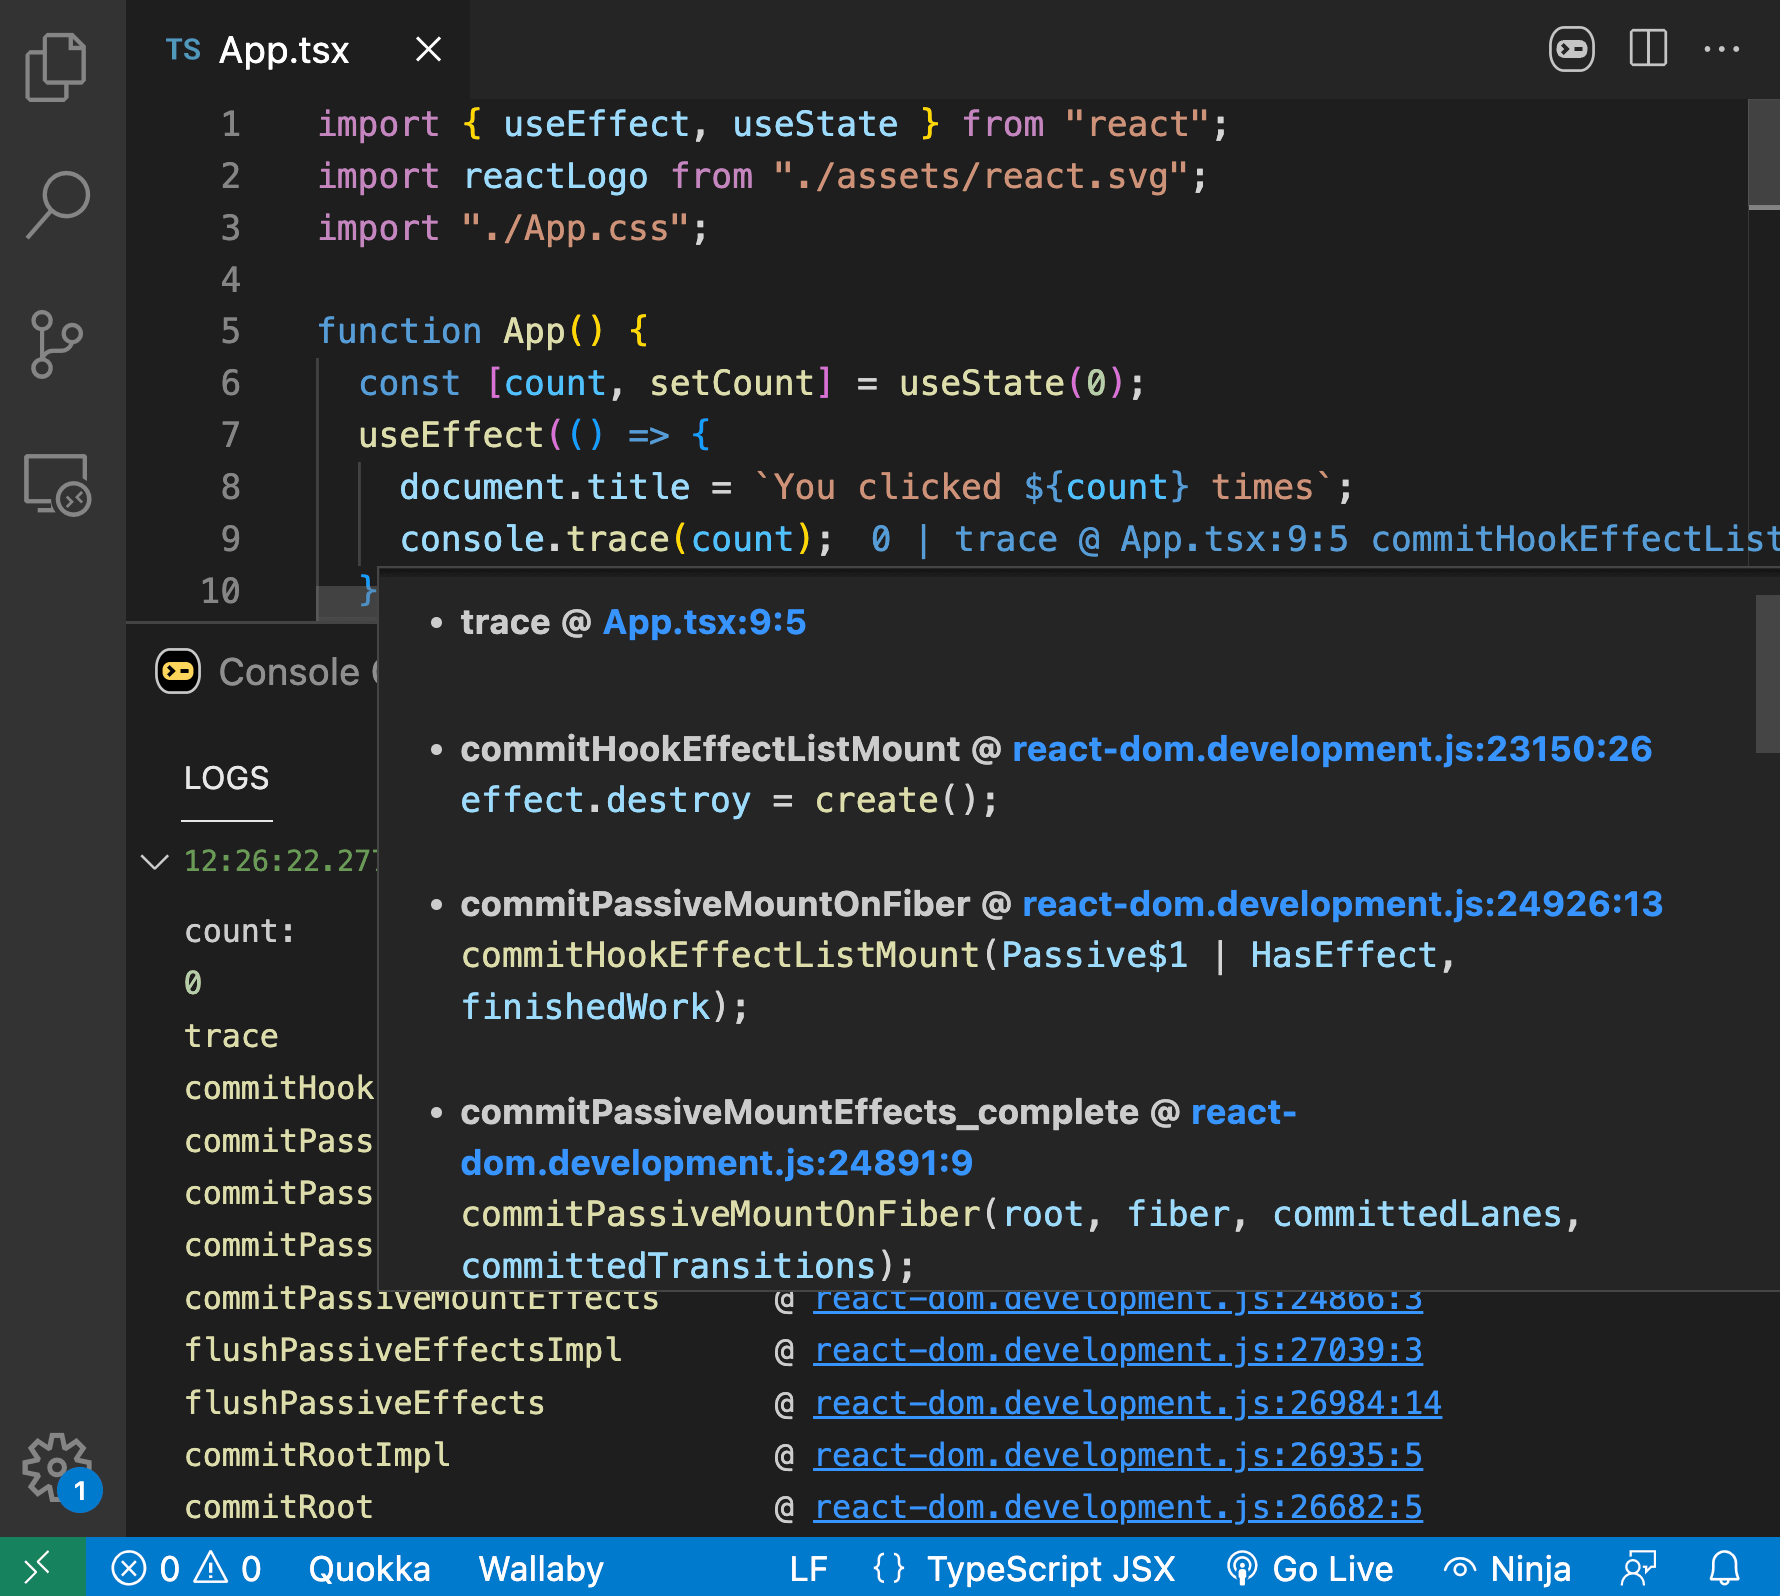
128 |
129 | ### console.time
130 |
131 | Adding [`console.time('some_label')` and `console.timeEnd('some_label')`](https://developer.mozilla.org/en-US/docs/Web/API/console/time) to your code will display the time it took to execute the code between the calls right in your editor, next to the line of code with `console.timeEnd`. The time output is also displayed in the [log viewer](#log-viewer).
132 |
133 | 
134 |
135 | ### Hover tooltip
136 |
137 | Hovering over Console Ninja output, such as logs or errors, will display more details, such as the log value, timestamp, error message, and stack trace.
138 |
139 | 
140 |
141 | The hover tooltip also provides a few actions displayed as icons in the top right corner of the widget, for example:
142 |
143 | - `Show in Console Output` action that opens Console Ninja's [log viewer](#log-viewer) and focuses on the log entry.
144 | - `Open Filtering Settings` action that opens Console Ninja's output filtering settings.
145 |
146 | ### Log viewer
147 |
148 | Using the `Show Output` command displays Console Ninja's log viewer. The log viewer shows all recorded logs and errors from your running application in chronological order, with newer entries at the bottom. When the command is triggered on a line with a `console.log` result, the last recorded log entry is focused in the log viewer.
149 |
150 | 
151 |
152 | Each log entry provides summary details and is collapsed by default, providing a short preview that can be expanded (via mouse or `Arrow Right` keyboard key after it is focused) to inspect its details. Once the details are expanded, the `Enter` keyboard key can be used to enter the details keyboard selection/navigation mode; the `Esc` key can be used to exit the mode.
153 |
154 | Each entry preview and expanded error entry details contain clickable links to the target source code. Links that point to `http` locations are opened in the editor by downloading the file first (a setting allows `http` links to be opened in the browser instead).
155 |
156 | Similar to browser dev tools, sequential entries of a primitive type, such as `string`, `boolean` and `number`, and any errors, that are logged from the same place in the code and have the same value are grouped together and displayed as a single entry. The entry prefix indicates the number of entries in the group.
157 |
158 | The following keyboard shortcuts are supported for faster navigation:
159 |
160 | - `Arrow Up` and `Arrow Down` to navigate to the next/previous displayed entry.
161 | - `Home` and `End` to navigate to the first/last displayed entry.
162 | - `Arrow Left` to collapse focused entry details and `Ctrl/Cmd + Arrow Left` to collapse all expanded entries details.
163 |
164 | Additionally, the following commands (also displayed as icon buttons at the top of the log viewer) are available:
165 |
166 | - `Clear all output` from Console Ninja, including inline output.
167 | - `Add Checkpoint` to add a horizontal separator between currently displayed entries and any new entries added afterwards.
168 | - `Change Date and Time Display Mode` to show/hide date/time part of each displayed log entry.
169 | - `Toggle auto-clearing of the output on any file change`. If auto-clearing is set to `off`, log entries recorded prior to the latest file change are dimmed, and the file links hover icon is changed to indicate that the displayed position may have changed since the entry was recorded.
170 | - `Toggle auto-scrolling to the last log entry` when new log entries are added. If the output is manually scrolled up so that the last entry row is not visible, then auto-scrolling is paused until the output is manually scrolled to make the last entry row visible.
171 |
172 | The log viewer supports search using the `Ctrl/Cmd + F` keyboard shortcut.
173 |
174 | The log viewer can be displayed in two modes, either `Beside File` and `In View`, there is a setting to configure the mode.
175 |
176 | 
177 |
178 | In the `Beside File` mode (default, and recommended), the viewer is displayed in a new separate editor group to the left from your current editor. In this case, the view behaves like other opened editor tabs, i.e. it is visible in the `Opened Editors` in VS Code file explorer view.
179 |
180 | In the `In View` mode, the viewer is displayed as VS Code side view. The view can also be moved to another VS Code panel. The recommended position for the viewer is to the right of the VS Code `Output` view in the bottom pane of your editor.
181 |
182 | ### Universal Node applications
183 |
184 | Console Ninja supports virtually any node application (from Node v16.15.0 onward), including Express, Hapi, Fastify, or your own custom node applications. To get started, simply prefix your `node app.js` command with `console-ninja` and run it in the VS Code integrated terminal.
185 |
186 | 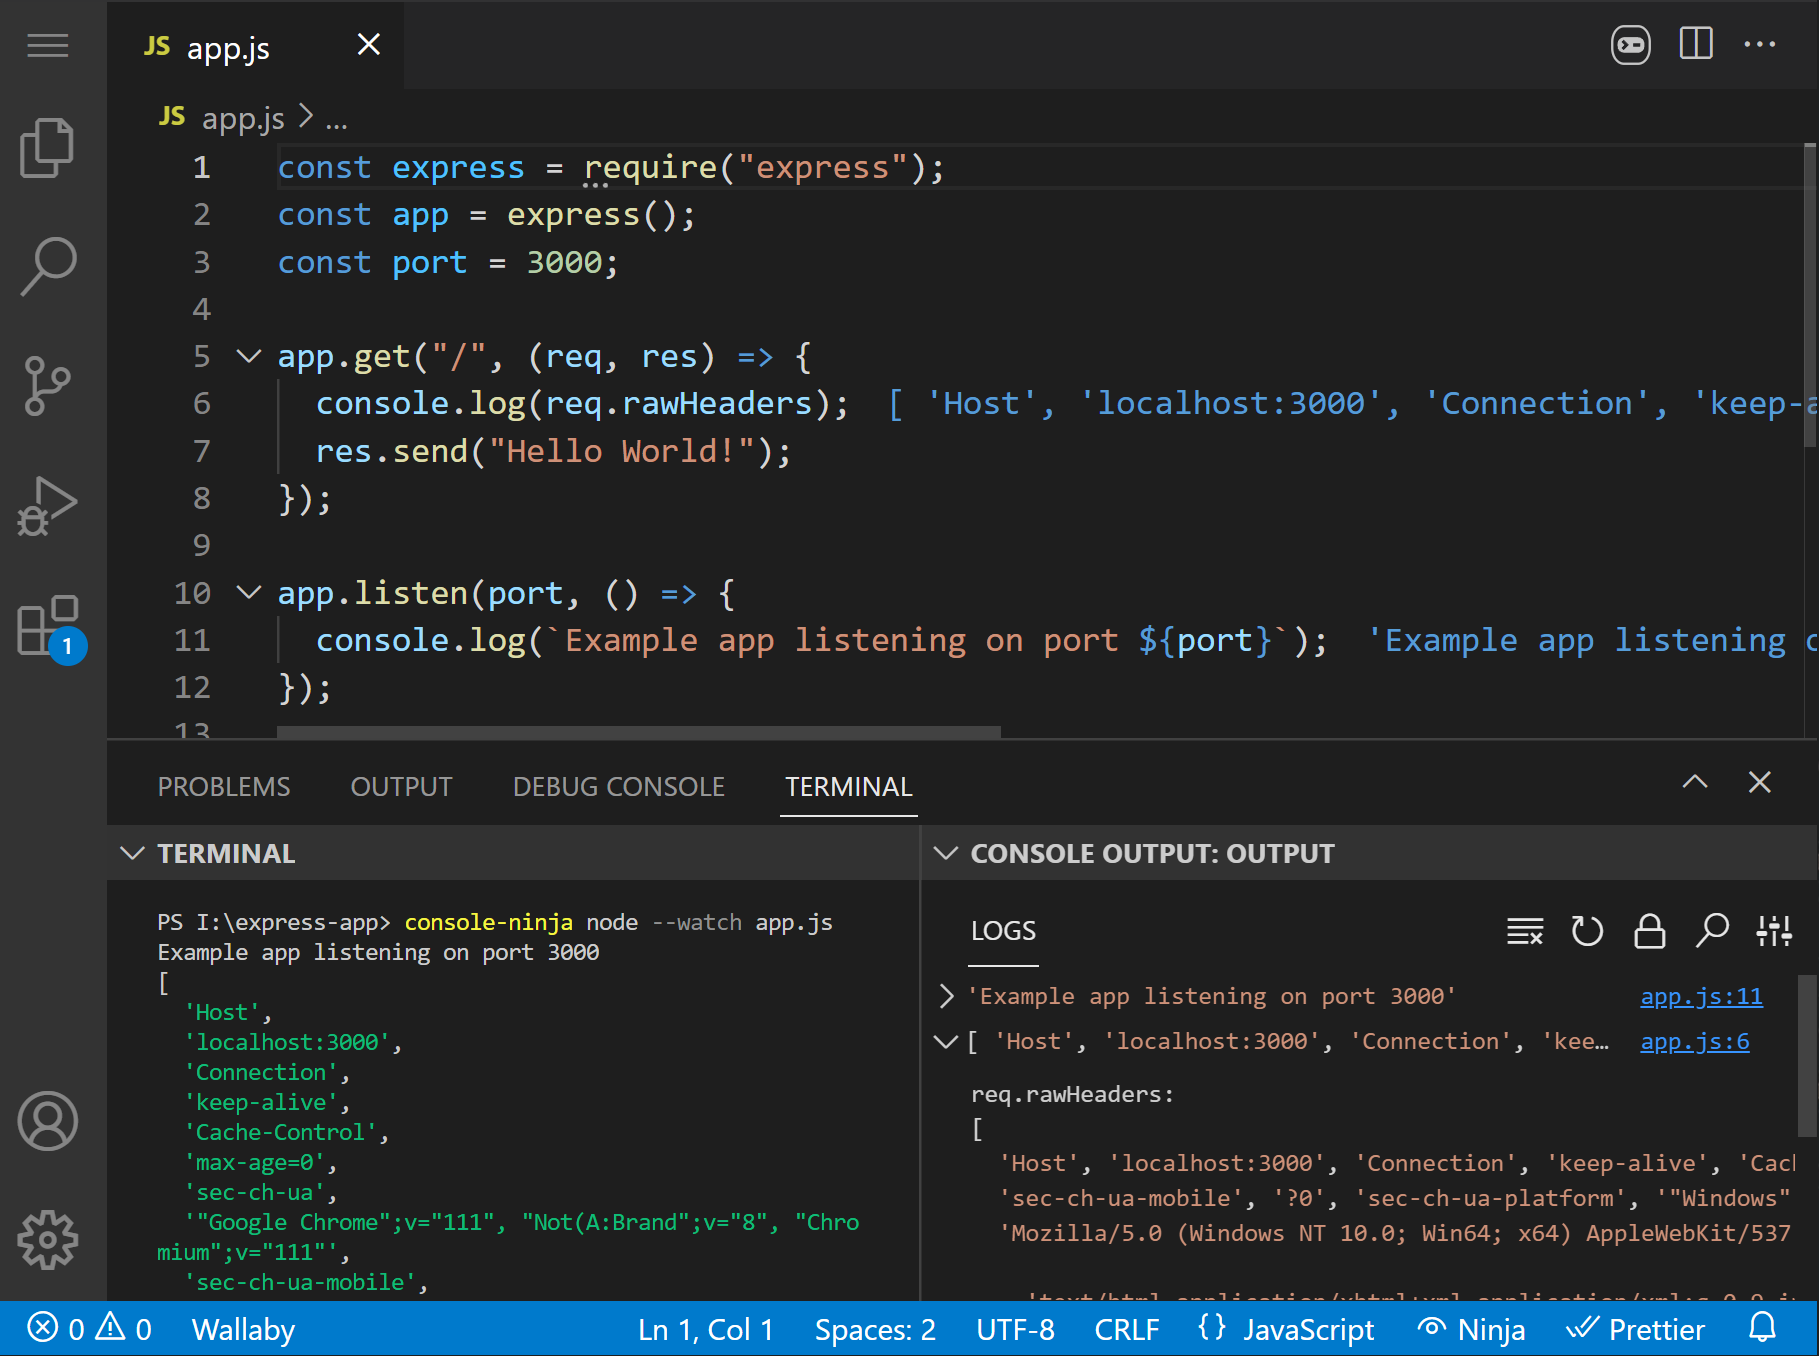
187 |
188 | Here are some more examples of how you may use the command:
189 |
190 | - `console-ninja node --watch app.js`
191 | - `console-ninja npx nodemon app.js`
192 | - `console-ninja npm run dev`
193 | - `console-ninja yarn node app.js`
194 | - `console-ninja npx tsx app.ts`
195 | - `console-ninja npx ts-node app.ts`
196 |
197 |
198 | If you want all subsequent commands in your terminal session to run automatically with `console-ninja`, simply source/run `console-ninja` with no arguments first:
199 |
200 | Linux/macOS (bash/zsh):
201 | ```shell
202 | source console-ninja
203 | node app1.js
204 | node app2.js
205 | ```
206 | Windows (PowerShell/Cmd):
207 | ```pwsh
208 | console-ninja
209 | node app1.js
210 | node app2.js
211 | ```
212 |
213 | If you would like to use `console-ninja` command in an external terminal, add `~/.console-ninja/.bin` to your `PATH` by running the `Console Ninja: Install 'console-ninja' command` from the VS Code command palette, then reload your terminal session. On Windows, depending on how you launch apps, you may need to restart the Explorer process or re-login to the system. Use the `Console Ninja: Uninstall 'console-ninja' command` from the command palette to remove `~/.console-ninja/.bin` to your `PATH`.
214 |
215 | The `console-ninja.installBinToPath` VS Code setting (default: `false`) lets Console Ninja automatically add `~/.console-ninja/.bin` to your `PATH` on first start.
216 |
217 | _Please note: if your project uses a tool that Console Ninja [supports](#supported-technologies) out of the box then you don't need to prefix your CLI commands with `console-ninja` the prefix._
218 |
219 | ### Runtime Log Capture Options
220 |
221 | Console Ninja serializes values efficiently and automatically dials back traversal when logging gets frequent or expensive. Defaults are tuned for typical dev workflows. Customize via the `console-ninja.logCaptureOptions` setting. Requires restarting the editor and your dev tool.
222 |
223 | Configure in VS Code
224 |
225 | - Open the Command Palette → `Preferences: Open Settings (JSON)`.
226 | - Add or update the `"console-ninja.logCaptureOptions"` object (user or workspace scope).
227 | - Save, then restart the editor and your dev tool (e.g., `npm run dev`).
228 |
229 | All options (with defaults)
230 |
231 | - resolveGetters: boolean (default: false)
232 | - Evaluate object getters during serialization. Off to avoid side effects and overhead.
233 |
234 | - defaultLimits: object — normal traversal limits
235 | - props: number (100) — max object properties traversed per node.
236 | - elements: number (100) — max array/iterable elements traversed per node.
237 | - strLength: number (51200) — max captured length of a single string.
238 | - totalStrLength: number (51200) — max total captured string length per entry.
239 | - autoExpandLimit: number (5000) — max auto-expanded properties across the tree.
240 | - autoExpandMaxDepth: number (10) — max auto-expand depth for nested objects.
241 |
242 | - reducedLimits: object — stricter limits used under load
243 | - Same shape as defaultLimits. Applied automatically when reduction is triggered.
244 | - Defaults: props (5), elements (5), strLength (256), totalStrLength (768), autoExpandLimit (30), autoExpandMaxDepth (2).
245 |
246 | - reducePolicy: object — controls when reducedLimits activate and when windows reset
247 | - perLogpoint: object — per logpoint id window
248 | - reduceOnCount: number (50) — switch to reducedLimits for this id after this many hits.
249 | - reduceOnAccumulatedProcessingTimeMs: number (100) — switch after accumulated processing time exceeds this many ms for this id.
250 | - resetWhenQuietMs: number (500) — reset the per-id counters after this period of inactivity.
251 | - resetOnProcessingTimeAverageMs: number (100) — only reset if average per-hit cost is below this threshold.
252 | - global: object — across all logpoints
253 | - reduceOnCount: number (1000) — switch to reducedLimits globally after this many hits.
254 | - reduceOnAccumulatedProcessingTimeMs: number (300) — switch globally after accumulated processing time exceeds this many ms.
255 | - resetWhenQuietMs: number (50) — reset the global counters after this period of inactivity.
256 | - resetOnProcessingTimeAverageMs: number (100) — only reset if average per-hit cost is below this threshold.
257 |
258 | Behavior
259 |
260 | - Reduced limits are used if either the current logpoint or the global window has triggered reduction.
261 | - A per-logpoint quiet reset also clears the global window, so reductions don’t linger after inactivity with low average cost.
262 |
263 | Example configuration
264 |
265 | ```json
266 | {
267 | "console-ninja.logCaptureOptions": {
268 | "resolveGetters": true
269 | }
270 | }
271 | ```
272 |
273 | ## Troubleshooting
274 |
275 | If Console Ninja is not working for you as expected, the first thing to check is the extension status. You may see the status info by hovering over the extension icon in VS Code status bar.
276 |
277 | 
278 |
279 | The status popup information dialog explains the current state of the tool and provides some tips on what to do next.
280 |
281 | Console Ninja uses a local websocket server to communicate with your editor, and **VPNs and firewalls** can interfere with this communication. If you are having connection-related issues and are connected to a VPN, try disconnecting from the VPN. If you are using a firewall, you may try **temporarily** disabling it to see if it is the cause of your problem; if so, refer to your firewall documentation to see how to identify blocked traffic and how to configure it to allow Console Ninja.
282 |
283 | If Console Ninja is not working as expected in a multi-root workspace, use the `Console Ninja: Select Multi-Root Workspace Project` command to ensure the tool runs on your intended project.
284 |
285 | By default, Console Ninja logs to `~/.console-ninja/trace.log`.
286 |
287 | If you encounter issues, check this file for errors or warnings. When contacting support, please include the relevant log content (after removing any sensitive information).
288 |
289 | For more detailed logs, set the `CONSOLE_NINJA_LOG_LEVEL` environment variable to `verbose` and restart your development tool. For example:
290 |
291 | Linux/macOS (bash/zsh):
292 | ```shell
293 | CONSOLE_NINJA_LOG_LEVEL="verbose" npm run dev
294 | ```
295 | Windows (PowerShell):
296 | ```pwsh
297 | $env:CONSOLE_NINJA_LOG_LEVEL="verbose"
298 | npm run dev
299 | ```
300 |
301 |
302 | ## How does it work
303 |
304 | Console Ninja integrates with locally installed tools that are building/preparing your code, and then inspects and adjusts your code (in a way that doesn't change how it executes) before it gets to the runtime (browser or node process that runs the code).
305 |
306 | To integrate with supported tools seamlessly, Console Ninja patches your locally installed node modules. When you stop Console Ninja in the editor with the `Pause` command, all patches are removed.
307 |
308 | If after stopping Console Ninja you observe some runtime issues (such as Console Ninja websocket errors in your browser), try **clearing your build tool's cache**. Depending on your stack, the following commands should help:
309 |
310 | - run `rm -rf node_modules/.cache`,
311 | - run `rm -rf .next`,
312 | - run `rm -rf .angular`,
313 |
314 | If the steps above don't help, and you are not sure how to reset your build tool's cache, try re-installing node modules, this should result in your build tool creating new cache and should resolve the issue.
315 |
316 | Console Ninja detects if you are running your tool in production mode (by checking CLI flags and process environment variables). When production mode is detected, the tool will not modify your application code even if Console Ninja is running. In the (unlikely) case that you are running production builds on your local dev computer **AND** are deploying or sharing local builds outside of your machine, we recommend running the Console Ninja `Pause` command in your editor prior to running your build to guarantee that no instrumented code ends up in your production code.
317 |
318 | Console Ninja instrumentation is limited to sending runtime values for `console.log` and errors to your locally running editor only (`localhost` hosted websocket server). The runtime data from your app is **never** sent outside of your local machine. If the code of your application is somehow instrumented by Console Ninja and then used outside of your local machine for some reason:
319 |
320 | - in browser, it will simply do nothing if the app host is not `127.0.0.1`, `localhost`, or one of your network adapter's IP v4 addresses. To connect from a different host name, use the `console-ninja.allowedHosts` VS Code setting. Note: the **PRO edition** also supports the use of `*` and `?` for wildcard matching (e.g. `*.example.com`), and regular expressions (e.g. `/^.*\\.example\\.com$/`).
321 | - in node, it will fail to connect to `localhost` and will not stop your app from working.
322 |
323 | To disable Console Ninja Welcome message displayed in build tools CLI and browser that has a link to this docs section, you may use the `console-ninja.showWelcomeMessageInTools` setting in VS Code.
324 |
325 | ## Differences between Console Ninja and other tools
326 |
327 | ### Quokka.js
328 |
329 | [Quokka.js](https://quokkajs.com/) is another awesome tool from [our team](https://wallabyjs.com/). Like Console Ninja, Quokka.js allows you to see various execution results without leaving the comfort of your editor.
330 |
331 | The fundamental difference between Console Ninja and Quokka.js is that Quokka runs new scratch files or existing code files as a self-contained program. Quokka allows you to quickly execute and iterate code in an **isolated playground** without unnecessary application execution. Console Ninja on the other hand runs within your application (started by your dev server, or test runner), and allows you to debug any **end to end scenarios within your running app**.
332 |
333 | ### Wallaby.js
334 |
335 | The [Wallaby.js](https://wallabyjs.com/) tool from our team runs your JavaScript and TypeScript tests immediately as you type, highlighting results in your IDE right next to your code.
336 |
337 | While you may use Console Ninja to display logs from supported test runner CLIs, test errors are not handled by Console Ninja; this is because test errors are caught/handled by test runners themselves, and special processing is required to format and display test results.
338 |
339 | Wallaby not only displays logs and test errors inline (and in a separate ergonomically designed view), but is also [packed with features](https://wallabyjs.com/#features), such as inline code coverage and a time travel debugger, that provide superpowers to your current testing framework/stack, such as [Jest, Vitest, Mocha. etc.](https://wallabyjs.com/#tools)
340 |
341 | ### Error Lens extension
342 |
343 | [Error Lens](https://marketplace.visualstudio.com/items?itemName=usernamehw.errorlens) is a VS Code extension that provides inline output for VS Code `Problems` output window, typically **static code analysis errors** from your code linter or language service, such as a linter rule violation or TypeScript types-related error.
344 |
345 | In contrast, Console Ninja runs within your application and displays **runtime logs and errors**.
346 |
347 | ## PRO features
348 |
349 | Console Ninja **PRO** feature set includes everything from the **Community** feature set as well as many additional advanced features that can be explored on [our website Pro page](https://console-ninja.com/pro), and are documented below.
350 |
351 | ### Watchpoints
352 |
353 | The `Watch Value` feature allows you to keep the value of any logged expression displayed. While opened, the value can easily be monitored for any changes made to it as a result of your code modifications or some actions in your app.
354 |
355 | 
356 |
357 | The `Watch Value` feature is available for both `console.log` and [logpoints](#logpoints). The feature is available from the [hover tooltip](#hover-tooltip), as a code action (via the editor line `light-bulb`) and from the editor command palette.
358 |
359 | You can watch multiple values at the same time. Value widgets in the Console Output can be closed individually (close icon or `Ctrl/Cmd + W` keyboard shortcut on a focused value) or all at once. Arrow keys can be used to navigate between displayed values.
360 |
361 | `Copy` is available from the focused widget header and via `Ctrl/Cmd + C` shortcut. Search (`Ctrl/Cmd + F`) can be used to find any specific content inside displayed values. The `Enter` key can be used on a focused value widget to enter the details keyboard selection/navigation mode; and the `Esc` key can be used to exit the mode.
362 |
363 | 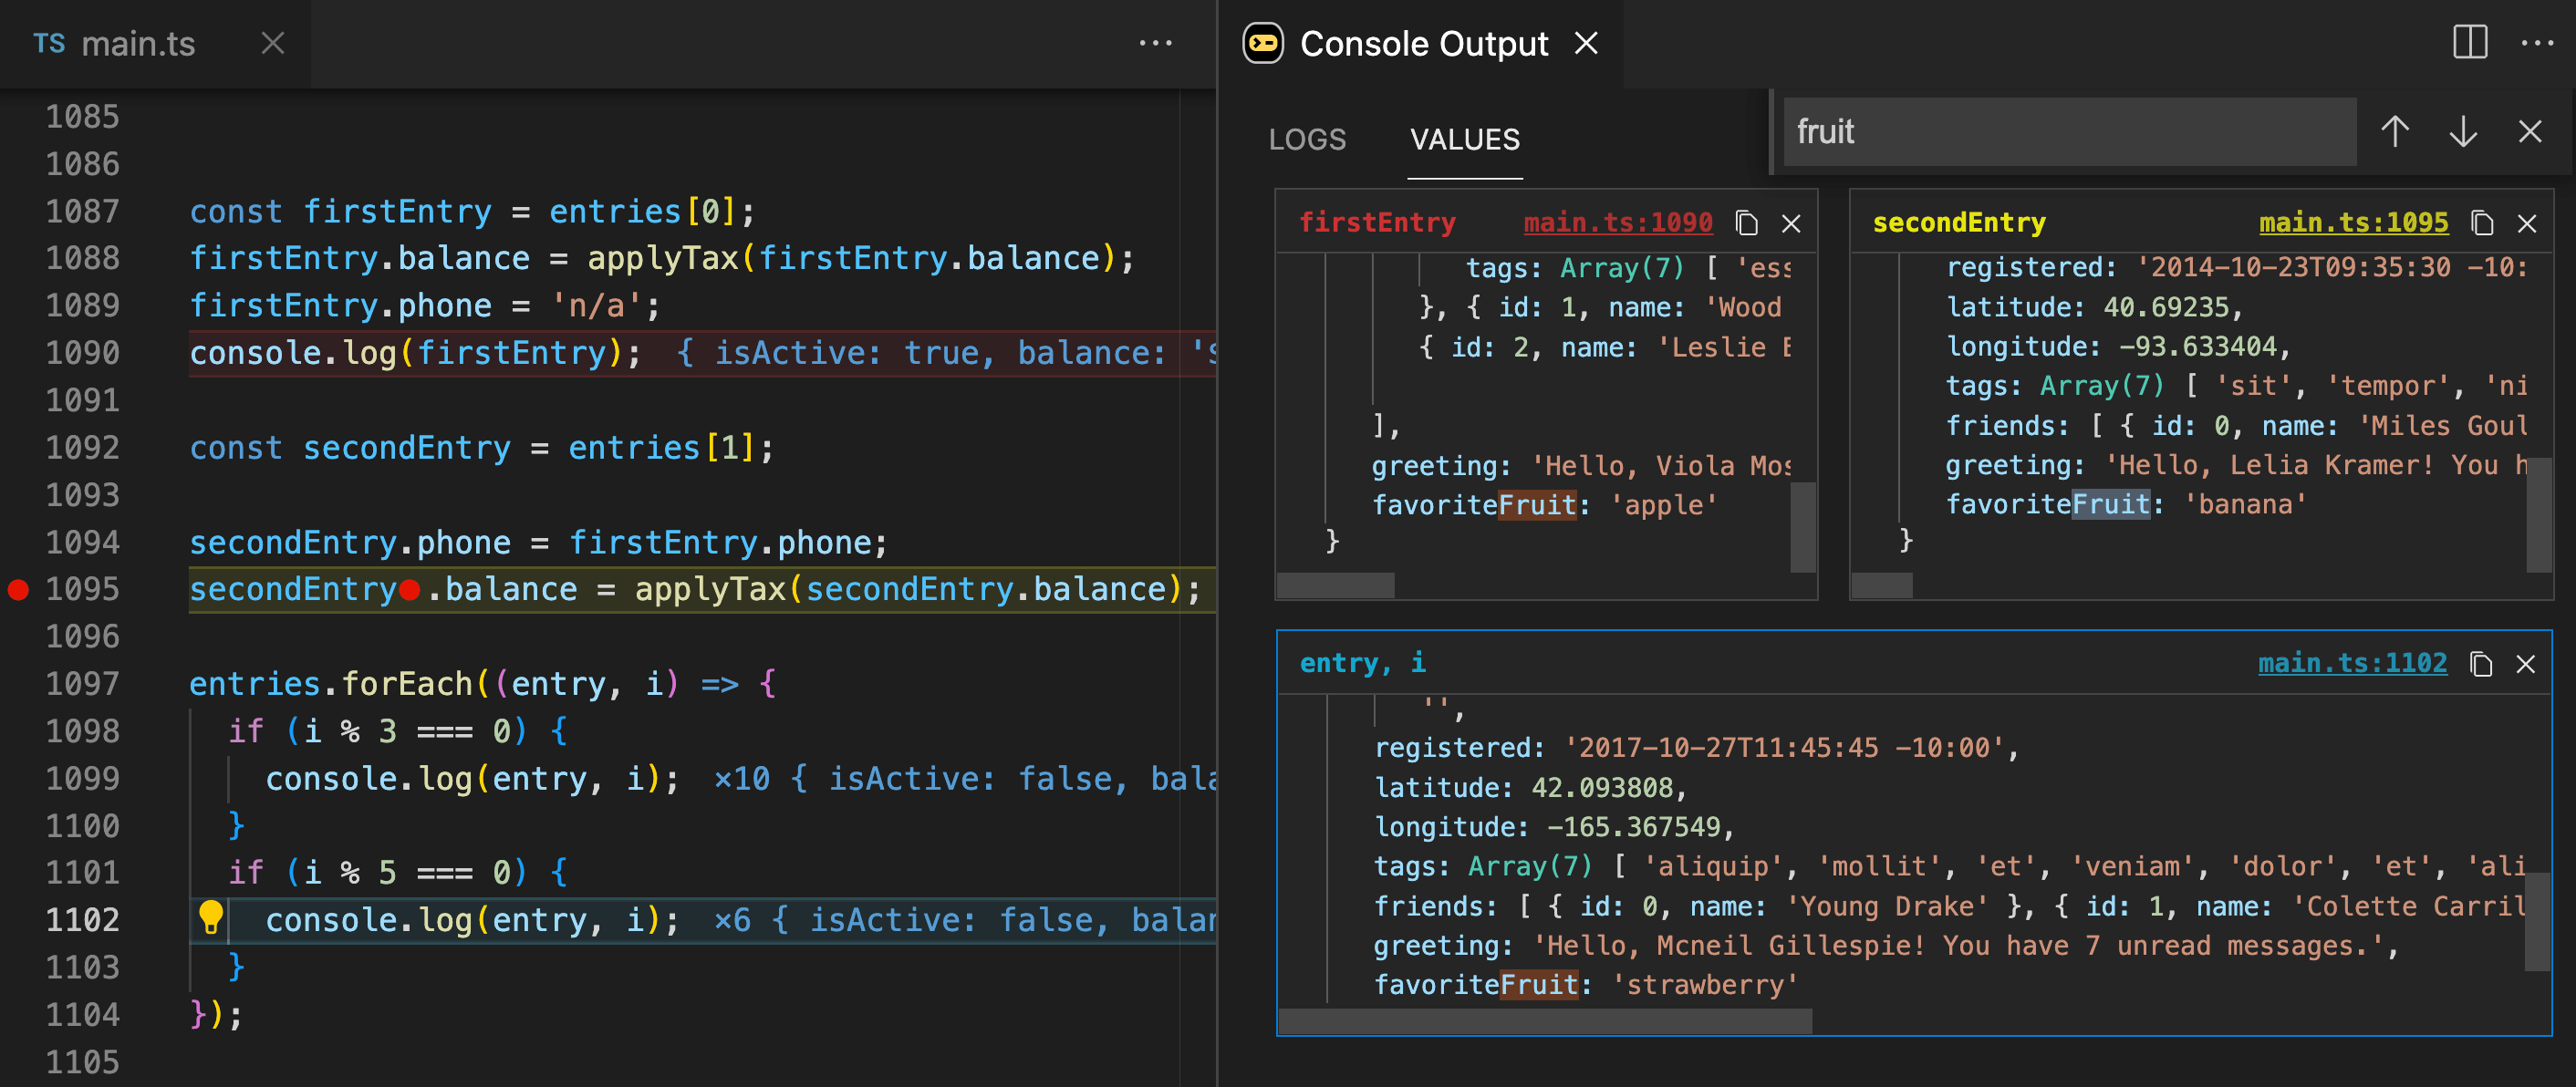
364 |
365 | The Console Output value widgets layout can be changed from `automatic` (default) to `manual` (with drag & drop and resize support) via the `Toggle Value Layout Mode` command (also available as at the top of the watched `Values` view). [Log Highlighting](#log-viewer-pro) is also supported for displayed values via coloring the value widget header with the same highlight color as in the log viewer and editor.
366 |
367 | ### Logpoints
368 |
369 | While using the `console.log` feature provides an excellent way to log expression values, oftentimes you may want to display or capture expression values **without modifying your code**. There are also many times when inserting `console.log` can get tedious, such as:
370 |
371 | - when logging an arrow function expression return value or the function parameter value (i.e. logging `e` or `e.prop` in `a.map(e => e.prop)`);
372 | - or logging a JSX expression value (i.e. logging `count` in `count is {count}`).
373 | - or logging an expression in the middle of another expression (i.e. logging the result of `a.b()` in `a.b().c();` without calling `a.b()` twice).
374 |
375 | Console Ninja Logpoints allow you to log the value of any expression in your code, **without modifying your code**, by simply placing a VS Code breakpoint in your code. When Console Ninja is running (and the VS Code debugger is not), the breakpoint will not stop your code, but will act as a logpoint and will log the value of the expression next to your code and to the Console Ninja log viewer.
376 |
377 | 
378 |
379 | To use the feature, you may simply place a breakpoint (`F9`) on any line. If you want to be more precise about what to log on a line, you may place an **inline breakpoint** (`Shift + F9`) near/inside the expression that you would like to log.
380 |
381 | In the example below:
382 |
383 | - inline breakpoint on the line 8 outputs the value of the `document`;
384 | - inline breakpoint on the line 23 outputs the value of the `e` parameter of the `onClick` button handler;
385 | - inline breakpoints on the line 24 and line 30 outputs the value of the `count` variable.
386 |
387 | 
388 |
389 | Once a breakpoint is placed and Console Ninja is ready to output some values for it, a special ⚡️ indicator is placed at the line with the breakpoint. If a breakpoint is placed and there's no special indicator visible, it means that it is placed in a location where Console Ninja cannot find anything to log (for example, on a line without executable JS/TS code).
390 |
391 | Because logpoints are VS Code breakpoints, you can remove them in bulk using the `Console Ninja: Remove all Breakpoints in File` command or the `Remove All Breakpoints` command. Please note that this second command removes all breakpoints in all files.
392 |
393 | #### React hooks logging
394 |
395 | When a logpoint is placed on a line with a React hook with dependencies, Console Ninja logs the values of the dependencies that triggered the hook's callback function execution. This way you can spot the difference between current and previous hook dependency values with ease.
396 |
397 | 
398 |
399 | ### Network Logging
400 |
401 | Network logging captures the details of network requests made by your browser to your application.
402 | Only requests related to files currently opened in your editor are logged. Both the `fetch` and `XMLHttpRequest` APIs are supported.
403 |
404 | In **community** edition the `URL`, `method` (e.g. get, post), and `status` (e.g. 200, 404, 500) are available. **PRO** edition also logs the request and response content. The `content-type` of payloads is used to determine the best way to display
405 | captured content (e.g. JSON content is displayed as expandable objects). Large values are automatically collapsed.
406 |
407 | 
408 |
409 | Network logging can be paused using the `Toggle Network Request Logging` command or using the toggle icon in Console Output. It can also be disabled entirely in the
410 | Console Ninja extension settings via the `console-ninja.output.showNetworkRequests` setting.
411 |
412 | ### Function logpoints
413 |
414 | Function logpoints are special types of Console Ninja [logpoints](#logpoints) that allow logging **every line of a function** and its argument values, **without modifying your code**. Function logpoints are useful when you want to log the execution of a function, but do not want to insert `console.log` statements in the function body or place a logpoint on every line of the function.
415 |
416 | 
417 |
418 | To use the feature, you may simply place a breakpoint (`F9`) on a line of code where a function/method is defined. If there are multiple expressions or functions defined on a line, you may place an **inline breakpoint** (`Shift + F9`) near/inside the `function` keyword or method name, or at the start of an arrow function expression (`🔴() => ...`).
419 |
420 | To override the value logged for a line within the logged function, **inline breakpoint** (`Shift + F9`) may be used near/inside a specific expression within the line.
421 |
422 | #### Code Coverage
423 |
424 | Function logpoints also collect accumulated **code coverage** for your function calls. The coverage is displayed in the gutter of the editor, and is
425 | updated as you interact with your application or change your source code.
426 |
427 | Here is what the coverage indicators mean:
428 |
429 | - If you see a **gray** square next to a line of code, it means that the line of
430 | code is has not been executed yet.
431 | - If you see a **yellow** square next to a line of code, it means that the line
432 | of code is only partially executed.
433 | - If you see a **green** square next to a line of code, it means that the line
434 | of code has been executed at least once.
435 | - If you see a **red** square next to a line of code, it means that the line of
436 | code is the source of an error, or in the stack of an error.
437 |
438 | The colors of gutter indicators can be changed in Console Ninja settings.
439 |
440 | The `Clear all output` command can be used to reset the accumulated code coverage state. This may be useful if you want to collect and inspect the coverage state for a specific interaction with your application.
441 |
442 | The `Toggle Uncovered Code Regions` command allows you to quickly
443 | highlight regions of your code that have not been executed (on lines with **gray** and **yellow** gutter
444 | indicators).
445 |
446 | ### File code coverage
447 |
448 | To collect and display accumulated **code coverage** for all functions in a source file, you may use the `Toggle File Code Coverage` command. The coverage is displayed in the gutter of the editor, and is updated as you interact with your application or change your source code. The displayed indicators are the same as for [function logpoints](#function-logpoints).
449 |
450 | 
451 |
452 | ### Class logpoints
453 |
454 | Class logpoints are special types of Console Ninja [logpoints](#logpoints) that allow logging **every line of all functions of a class without modifying your code**.
455 |
456 | To use the feature, you may simply place a breakpoint (`F9`) on a line of code where a `class` is defined.
457 |
458 | To override the value logged for a line within the logged function, **inline breakpoint** (`Shift + F9`) may be used near/inside a specific expression within the line.
459 |
460 | ### Predictive Logging
461 |
462 | Predictive logging captures additional values based on [logpoints](#logpoints) and `console.log` usages. Lines with predicted values will display a ⚑ icon; hovering over this icon will show the captured values. Placing a logpoint on a line with a prediction will cause the values to display as if they were from a logpoint, both next to your code and in the Console Output window.
463 |
464 | By default, `console.log` will not trigger predictive logging, but can be configured to do so using the `console-ninja.allowConsoleLogToTriggerPredictions` setting. Predictive logging can also be entirely disabled using the `console-ninja.predictiveLoggingEnabled` setting.
465 |
466 | 
467 |
468 | ### Hover tooltip Pro
469 |
470 | In addition to the [hover tooltip](#hover-tooltip) features available in the **Community** edition, the **PRO** edition includes additional actions:
471 |
472 | - `Copy to Clipboard` action that copies the logged value or the error details to the clipboard. It's also available as a code action (via the editor line light-bulb).
473 | - `Show in Console Output` action that opens Console Ninja's [log viewer](#log-viewer) and focuses on the log entry.
474 | - `Highlight in Console Output` action that highlights the log entry in Console Ninja's [log viewer](#log-viewer). The feature is also available as a code action (via the editor line `light-bulb`) and from the editor command palette.
475 | - `Compare Side by Side With Previous Value` action that allows you to compare the current value with the previous value in the editor diff viewer.
476 | - `Watch Value` action that allows you to keep the value of any logged expression displayed. The feature is available for both `console.log` and [logpoints](#logpoints). The feature is also available as a code action (via the editor line `light-bulb`) and from the editor command palette.
477 | - `Search the Web` action that opens a web browser with the error message as a search query. This action is only available for errors. The search engine can be configured in the Console Ninja extension settings via the `console-ninja.searchUrl` setting.
478 |
479 | 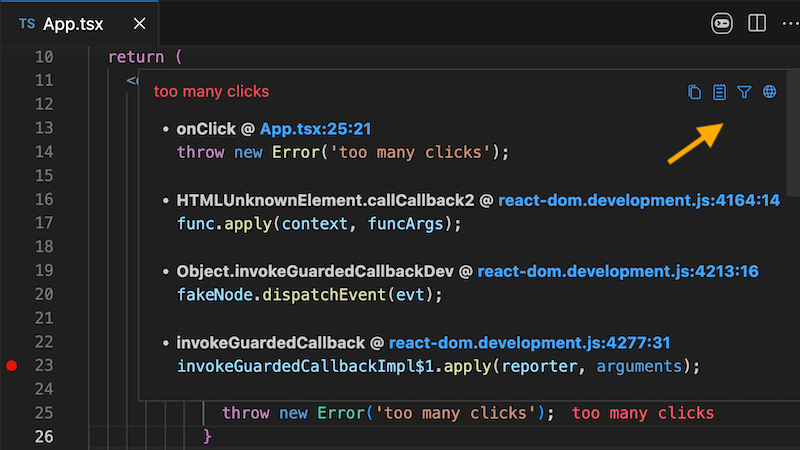
480 |
481 | 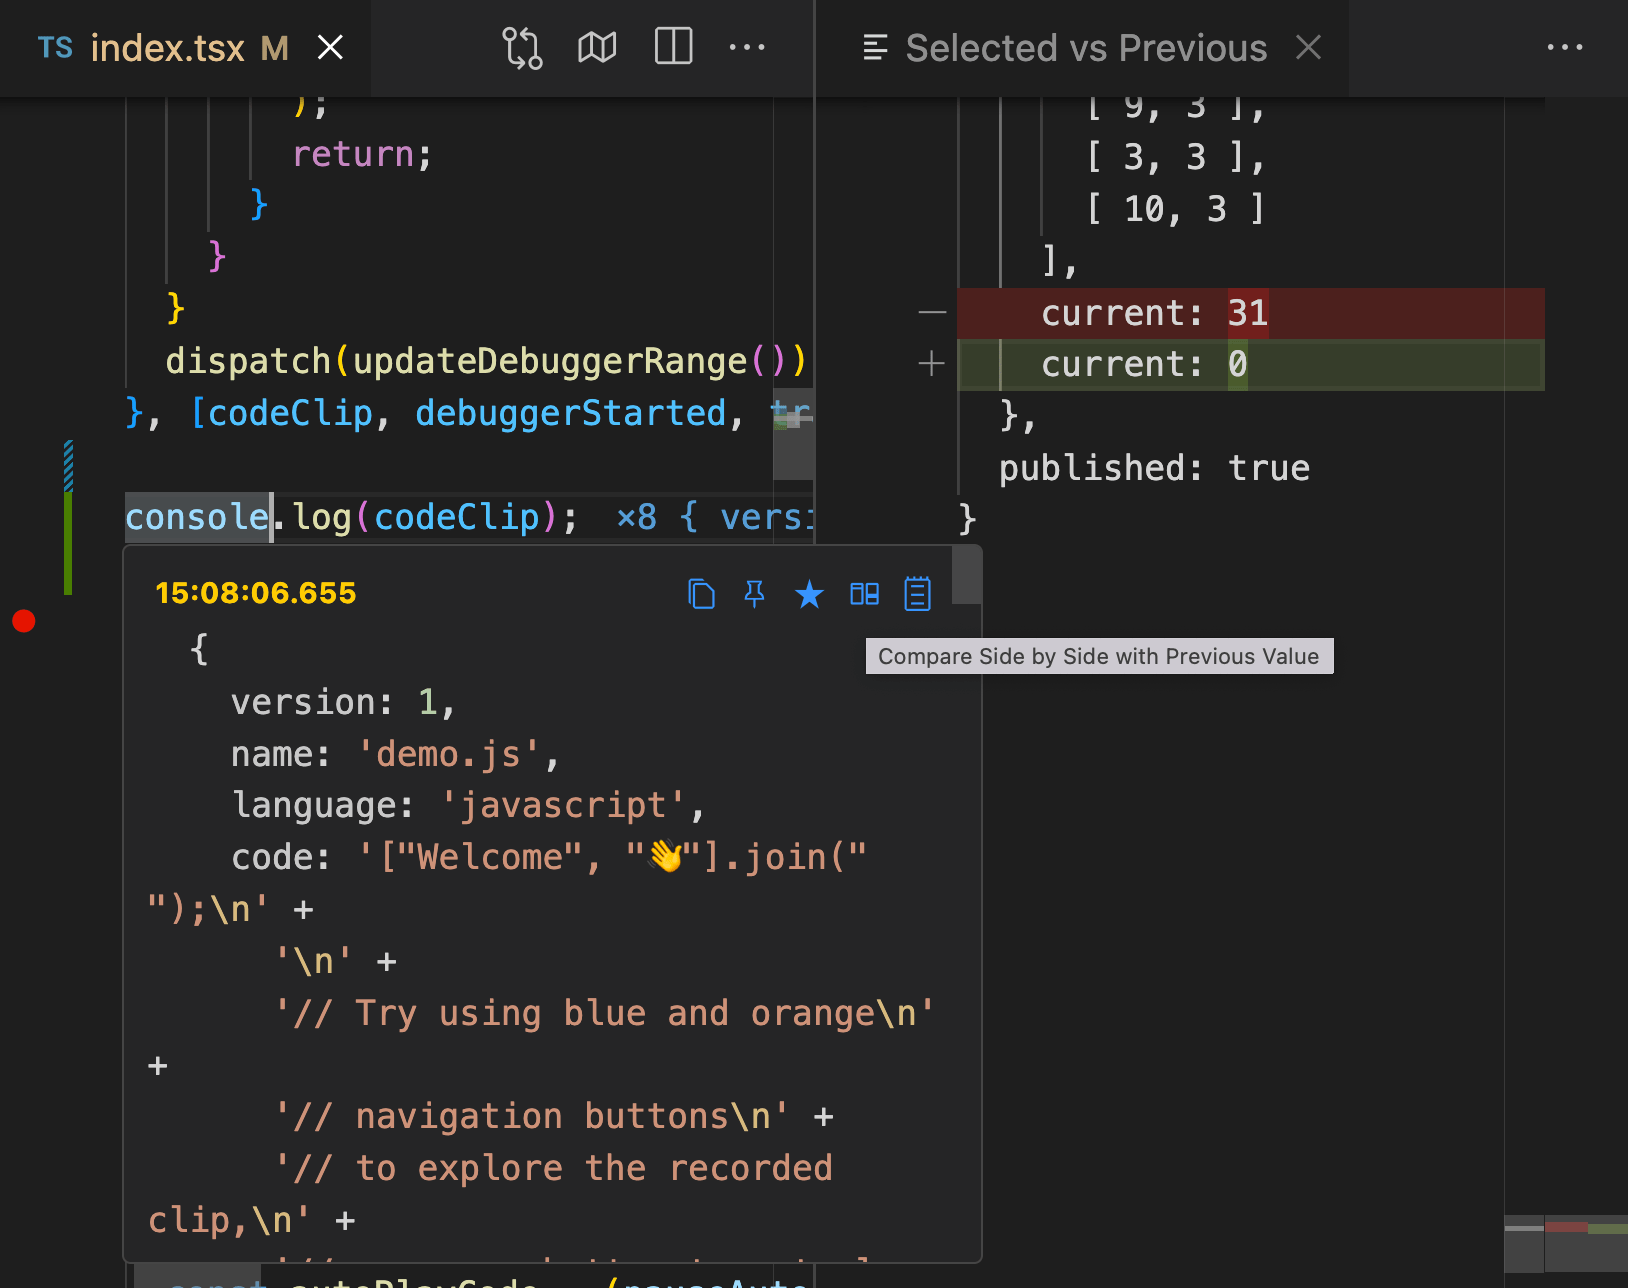
482 |
483 | ### Log Viewer Pro
484 |
485 | In addition to the [log viewer](#log-viewer) features available in the **Community** edition, the **PRO** edition includes additional features to provide an even more powerful way to analyze complex output.
486 |
487 | 
488 |
489 | #### Indentation guides
490 |
491 | **Indentation guides** provide a clear visual representation of the nested structure of
492 | your objects.
493 |
494 | #### Expand/collapse controls
495 |
496 | **Expand/collapse controls** allow you to collapse and expand nodes within nested objects.
497 | These features allow you to focus on specific sections of your logs without being overwhelmed by the
498 | sheer size and complexity of the output.
499 |
500 | #### Log entry highlighting
501 |
502 | This feature allows you to highlight [log viewer](#log-viewer) entries that are logged from the same place in your code. No need to add prefixes like `console.log('!!! HERE', obj)` to your logs any longer - highlighted entries are decorated with a visually distinct colored & numbered indicator. Highlighting makes it easier to quickly identify specific log entries in scenarios with a lot of logs.
503 |
504 | 
505 |
506 | Both `console.log` statements and [logpoints](#logpoints) can be highlighted.
507 |
508 | `Toggle Log Highlight` command allows you to toggle highlighting of the current log location. The command is available from the editor command palette, from the log hover tooltip and as a code action (via the editor line light-bulb).
509 |
510 | `Clear All Log Highlights` command allows you to clear all current log entry highlights.
511 |
512 | #### Breadcrumbs
513 |
514 | **Breadcrumbs** feature provides a quick way of navigating the nested structure of your large logged objects.
515 |
516 | After clicking on a value inside a large object or using `Enter` plus navigation keys to browse the object, you can see the current property path in the breadcrumbs panel at the top of the log viewer. You can click on any of the breadcrumbs to scroll to the corresponding node and highlight it.
517 |
518 | #### Log entry filtering
519 |
520 | Adding multiple `console.log` statements, or even better, some [logpoints](#function-logpoints) may quickly result in large and hard-to-manage output. At the same time, removing log statements to limit output can be distracting and you may still need them for your debugging session.
521 | To address the issue, log entry filtering allows you to filter [log viewer](#log-viewer) entries by their file and/or line. For example, you may display only log entries for a specific line of code or hide entries coming from a specific file. The filtering makes it easier to quickly find and track specific log entries in scenarios with lots of logs.
522 |
523 | 
524 |
525 | To use the filter you need to open the log entry context menu (via the `lightbulb` icon of a selected entry, or via the `Cmd/Ctrl + .` keyboard shortcut) and select one of the available filtering commands:
526 |
527 | - The `Show entries for this file/line only` command allows you to only display entries for the selected file and line.
528 | - The `Show entries for this file only` command allows you to only display entries for the selected file.
529 | - The `Hide entries for this file/line only` command allows you to hide entries for the selected file and line.
530 | - The `Show entries for this file` command allows you to hide entries for the selected file.
531 |
532 | When a filter is applied, existing log entires that do not match the filter will not be visible. Any new log entries that do not match the filter (e.g. logged as a result of your code changes or as a result of interaction with your app) will also not be displayed.
533 |
534 | Once a filter is applied, the log viewer toolbar filter icon indicates that the filter is active. The filter can be cleared by selecting the `Reset Filter` log entry context menu option, or via the log viewer toolbar `Reset Filter` icon, or via the `Shift + Escape` keyboard shortcut.
535 |
536 | Unlike the [output filtering](#output-filtering-pro), that applies to all output (including inline output) at the time of capturing it, the log entry filtering only applies to the displayed log viewer entries. The log entry filtering also does not stop Console Ninja from capturing logs and errors, so you can still see all logged results when the filter is reset.
537 |
538 | #### Log entry grouping
539 |
540 | Sequential entries, including logs and errors, that are logged from the same place in the code and have the same logged value are grouped together and displayed as a single entry. The entry prefix indicates the number of entries in the group. While similar Console Ninja Community edition feature only works for primitive types (just like browser dev tools), this Pro feature **works for any type of entries, including large complex objects**.
541 |
542 | 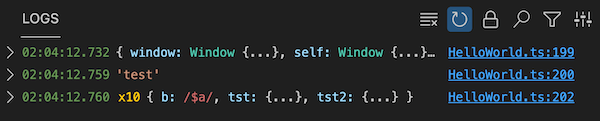
543 |
544 | #### Log entry actions
545 |
546 | - `Copy` action allows to copy selected log entry to clipboard. The action is available from the selected log entry toolbar and via `Ctrl/Cmd + C` shortcut.
547 |
548 | #### Date and time display modes
549 |
550 | - `Change Date and Time Display Mode` command to show/hide date/time part of each displayed log entry, as well as display an entry time **relative to the oldest display entry** time, or **relative to the previous entry** time. The option to instantly switch between the absolute and relative timelines can be tremendously helpful in scenarios where you need to quickly understand the time gap between log entries.
551 |
552 | 
553 |
554 | ### Output Filtering Pro
555 |
556 | Console Ninja **PRO** edition includes output filtering features to make working in large projects or projects with a lot of output easier. Unlike the [log viewer entry filtering](#log-entry-filtering), that only applies to the displayed log viewer entries, the output filtering is applied to all output, including inline output.
557 |
558 | - `Capture and display errors` setting allows configuring whether to capture and display errors in the editor and in the log viewer. This is useful when you are working on a project with a lot of reported errors and you want to focus on logs only.
559 |
560 | - `Capture and display logs only from files opened in editor` setting allows configuring whether to capture and display logs from all files or only the files that are opened in your editor. This is useful when you are working on a project with a lot of files with logs and you want to focus only on output from files that you are currently working on.
561 |
562 | - `Display logs from multiple running tools together in a single list` setting allows to merge output from multiple running project tools, such as next.js server and next.js browser logs, Jest logs, etc., and display the output together in the [log viewer](#log-viewer). The merged output provides a holistic view of your running application, eliminating the need to
563 | switch between multiple output sources. This integrated view of logs from all of your tools
564 | provides an intuitive and efficient way to understand the complete behavior of your application.
565 |
566 | 
567 |
568 | - `Capture and display logs only from logpoints` setting allows configuring whether to capture and display logs from `console.log` and other `console.*` statements. This is useful when you are working on a project with a lot of `console.log` statements and you want to focus on output from your [logpoints](#logpoints) only.
569 |
570 | ### Quick Search Pro
571 |
572 | In addition to the [log viewer search](#log-viewer) features available in the **Community** edition, the **PRO** edition provides an easy way to search
573 | across all of your project logs and errors with minimal distraction.
574 |
575 | 
576 |
577 | The `Search Logs` command allows you to search across all of your project logs and errors.
578 |
579 | Quickly navigate to the specific line of code
580 | associated with a log, as well as view the entire log in the
581 | log viewer. Additionally, you can navigate between matching
582 | log entries within the log viewer itself.
583 |
584 | Separate navigation actions (either to open the code only or open the log viewer only) are available for each search result as side buttons.
585 |
586 | ### Tracepoints
587 |
588 | Console Ninja Tracepoints allow you to trace the execution of any block of code and understand where it is being called from, **without modifying your code**. Similar to [logpoints](#logpoints), you may place a tracepoint (`Add Tracepoint` command) on any line/column, even in the middle of some expression, or next to a function parameter. When the code execution reaches the tracepoint, Console Ninja will log the **current stack trace** and the value of the expression located at the tracepoint position.
589 |
590 | 
591 |
592 | ### Timepoints
593 |
594 | Console Ninja Timepoints allow you to measure the execution time of any block of code, **without modifying your code**, by simply placing a pair of timepoints in your code.
595 |
596 | First, place a timepoint (`Add Timepoint` command) on the line where you want to start measuring the execution time. Then, place another timepoint (`Add Timepoint` command) on the line where you want to stop measuring the execution time. The timepoints will be highlighted by Console Ninja, and the execution time will be displayed next to the end timepoint and in the Console Ninja log viewer.
597 |
598 | 
599 |
600 | ### console.warn, console.info, console.debug, $inspect rune
601 |
602 | `console.warn`, `console.info`, and `console.debug` offer functionality very
603 | similar to [`console trace`](#consoletrace), but also present inline values and
604 | log viewer location links in colors gathered from your active VS Code theme. This can help quickly identify important entries when many values are logged.
605 |
606 | 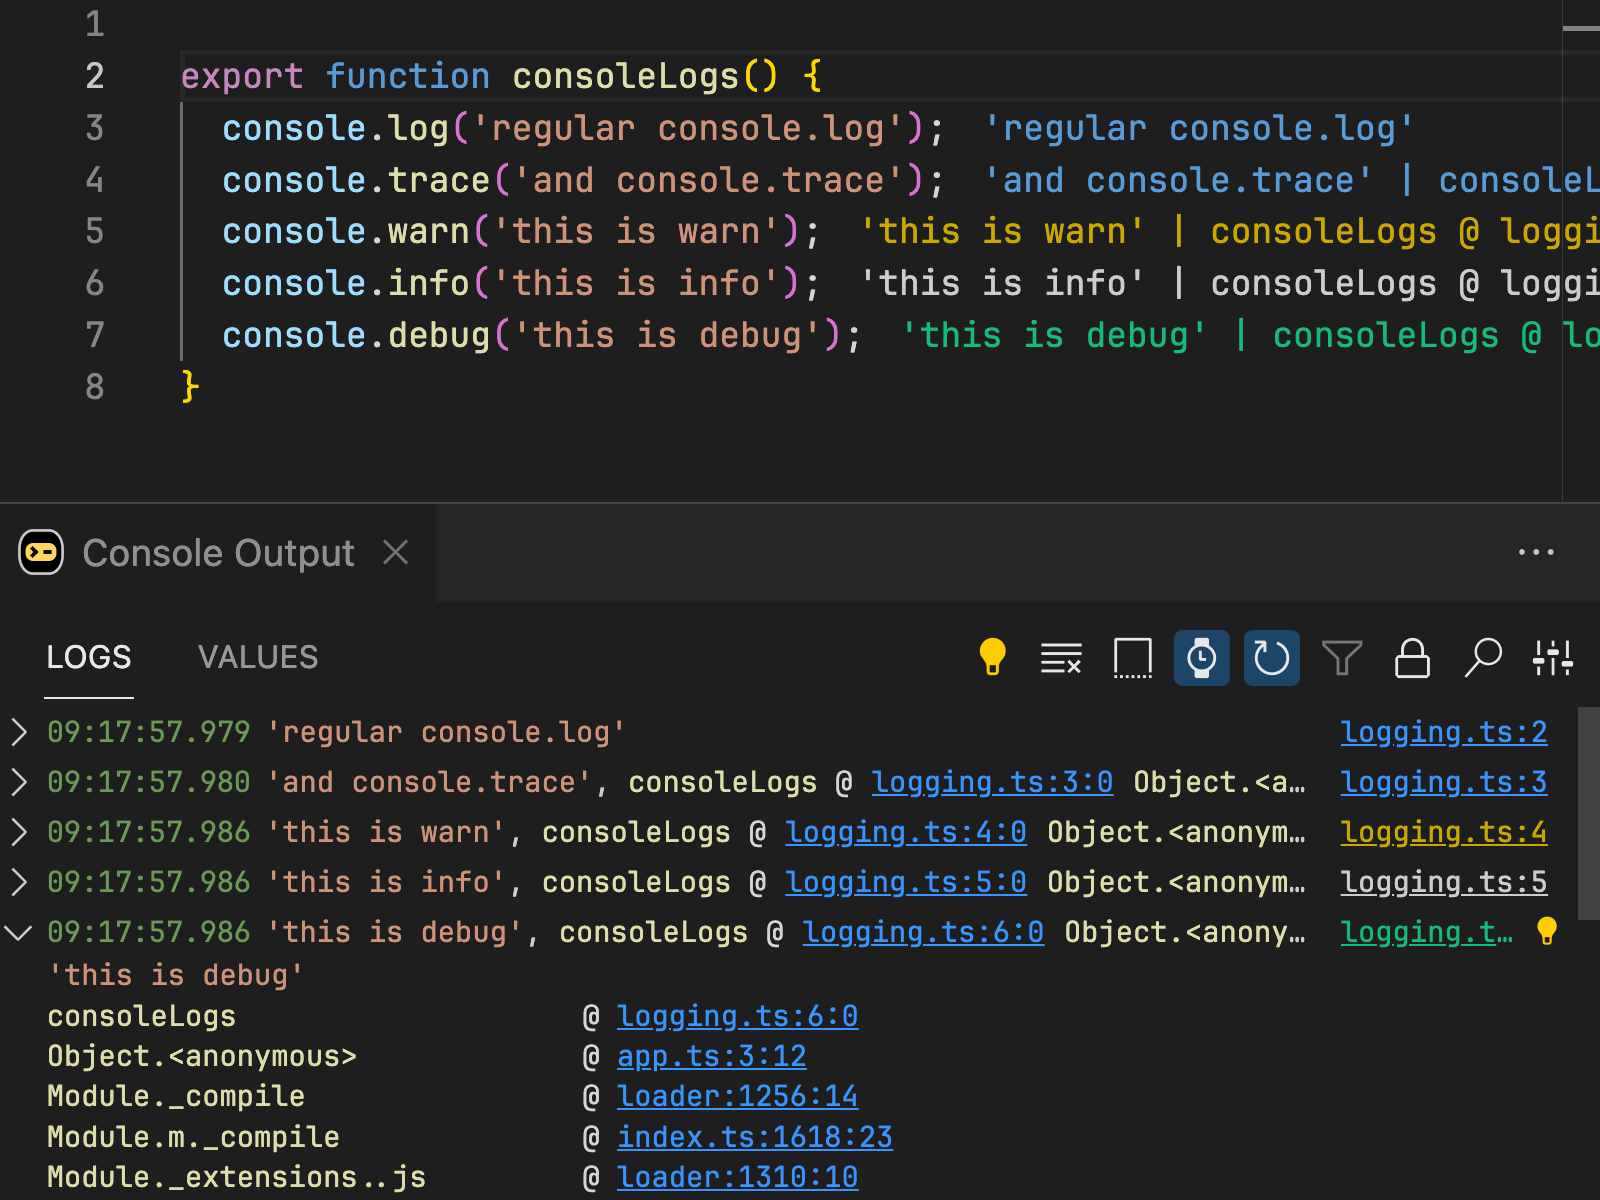
607 |
608 | Svelte [`$inspect`](https://svelte.dev/docs/svelte/$inspect) is a special rune that allows you to log the value of any expression. When Console Ninja is running, the `$inspect(val)` call will log the value of the expression next to your code and to the Console Ninja log viewer.
609 |
610 | ### GitHub Copilot Integration
611 |
612 | The best AI model for investigating application errors is the one with the most context - provided by the user and the right tools. Console Ninja automatically equips AI with everything it needs: detailed error messages, stack traces, contextual insights, and complete log data for smarter debugging.
613 |
614 | #### How to use Console Ninja with GitHub Copilot
615 |
616 | To get started, install the [GitHub Copilot](https://marketplace.visualstudio.com/items?itemName=GitHub.copilot) (which has a **free tier** for everyone) and restart VS Code. Then, click the `Investigate with AI` icon next to an application error.
617 |
618 | 
619 |
620 | Console Ninja will open a new Copilot Chat to ask the AI model to investigate the error. The AI model will analyze the provided error details. The AI will analyze the provided details and may request additional context - such as source code or logs - from Console Ninja as needed.
621 |
622 | Finally, the investigation results will be displayed in the chat.
623 |
624 | In addition to the hover tooltip icon, you can also use:
625 |
626 | - The `Console Ninja: Investigate with AI` command from the command palette
627 | - The `Investigate with AI` context action from the editor lightbulb menu
628 | - The `Investigate with AI` icon in the [Log Viewer](#log-viewer-pro)
629 |
630 | 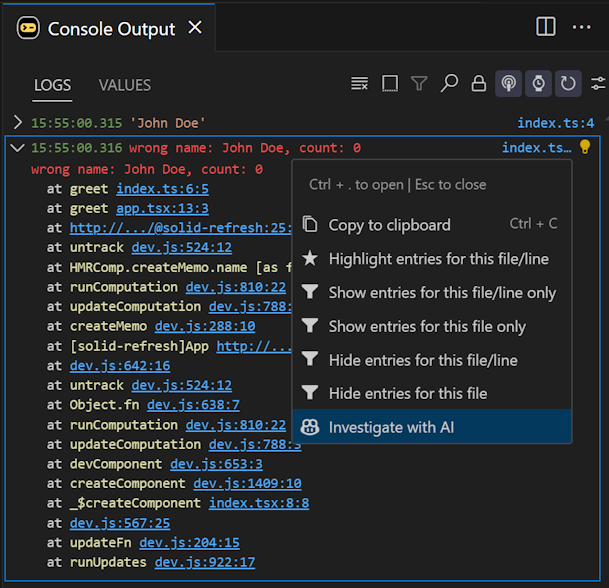
631 |
632 | #### How it works
633 |
634 | The Console Ninja extension registers `@console-ninja` as a Copilot chat participant. When you click the `Investigate with AI` icon, Console Ninja automatically:
635 |
636 | - Opens a new Copilot Chat with `@console-ninja`
637 | - Uses the selected AI model (when possible)
638 | - Provides the model with **necessary context and a description of Console Ninja’s tools** for error investigation
639 |
640 | 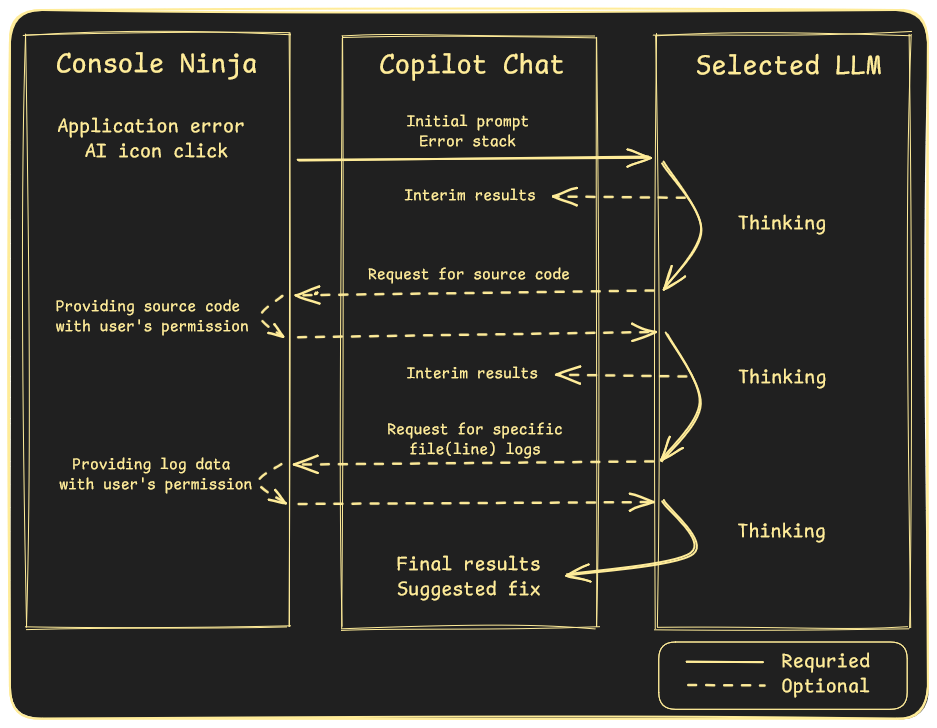
641 |
642 | The initial chat message includes:
643 |
644 | - **Error details** (message and stack trace)
645 | - **Relevant log locations**
646 | - **Instructions for the AI model** on how to process the request, including what additional context it can request from Console Ninja
647 |
648 | The **AI model** can analyze the error details and **request additional context (e.g., source code, logs) from Console Ninja**. By default, Console Ninja prompts you to allow AI access to the requested context, but you can configure it to provide the context automatically.
649 |
650 | Once the model has all necessary information, it delivers the investigation results in the chat.
651 |
652 | #### Security and privacy considerations
653 |
654 | Before first use, VS Code will prompt you to allow Console Ninja to access Copilot models.
655 |
656 | When investigating an error, Console Ninja provides the AI model with necessary context, including:
657 |
658 | - **Error message**
659 | - **Stack trace**, which may contain:
660 | - Absolute file paths or URLs
661 | - Line and column numbers
662 | - Function or variable names
663 | - A single line of code for each stack entry
664 | - **Log locations**, which may include:
665 | - Absolute file paths
666 | - Line numbers
667 | - Variable names
668 |
669 | After the initial request, the AI model may request additional context (e.g., source code, logs) from Console Ninja. By default, Console Ninja prompts you before granting access, showing a detailed description of what is being accessed.
670 |
671 | #### Tips and tricks
672 |
673 | - If you attempt to use a model for the first time with Console Ninja, you may receive an error from Copilot indicating that the model is unavailable. In this case, try using the model in a separate chat first (e.g., send a simple "Hello" message), agree to any prompts from Copilot, and then retry with Console Ninja.
674 |
675 | - The **opened chat can be used after the initial response** to continue to ask the LLM for more investigation, to use Console Ninja tools, explain results, correct the response, etc. For example, if you see that the AI model has not used the application logs for the investigation of the error, you can ask it to do so:
676 |
677 | - `@console-ninja check logs for src/file.ts`
678 | - `@console-ninja check logs for src/file.ts at line 10`
679 |
680 | - If you are using the **Copilot free tier**, please note that because Console Ninja integration sends chat messages, [limits may apply](https://docs.github.com/en/copilot/about-github-copilot/subscription-plans-for-github-copilot). Console Ninja only sends chat messages when you request, and you may review the number of messages sent by Console Ninja on the extension page in VS Code.
681 |
682 | - If you see that the AI model is not using the provided context effectively, or is outputting errors (such as
683 | `Tool multi_tool_use.parallel was not contributed`) or strange results, you may **try to re-run the chat with the same or a different AI model**.
684 |
685 | ### MCP Server
686 |
687 | **NOTE:** ✅ Console Ninja tools are already available in Copilot Agent mode, no additional setup is required.
688 |
689 | You may still add Console Ninja MCP server if you want to use the same tools outside of Copilot Agent mode, for example in other MCP clients.
690 |
691 | Console Ninja comes with a built-in [MCP server](https://modelcontextprotocol.io/introduction) that allows your editor LLM agent (Copilot, Cursor, Windsurf, Cline, Roo Code, etc.) to access your app runtime logs and errors. This includes the ability to access **browser and server logs and errors** for full stack applications.
692 |
693 | 
694 |
695 | You may find instructions on how to add Console Ninja MCP server to your editor LLM agent below. Alternatively, you can **use `Console Ninja: Open MCP settings` command** from the command palette to view the instructions in the editor.
696 |
697 | #### Copilot Agent
698 |
699 | To add Console Ninja MCP server to Copilot for **all projects**, modify your VS Code `settings.json` file to add the following entry:
700 |
701 | **MacOS/Linux:**
702 |
703 | ```json
704 | {
705 | ...
706 | "mcp": {
707 | "servers": {
708 | "console-ninja": {
709 | "command": "npx",
710 | "args": ["-y", "-c", "node ~/.console-ninja/mcp/"]
711 | }
712 | }
713 | }
714 | }
715 | ```
716 |
717 | **Windows**
718 |
719 | ```json
720 | {
721 | ...
722 | "mcp": {
723 | "servers": {
724 | "console-ninja": {
725 | "command": "cmd.exe",
726 | "args": ["/c", "node", "%USERPROFILE%/.console-ninja/mcp/"]
727 | }
728 | }
729 | }
730 | }
731 | ```
732 |
733 | To add Console Ninja MCP server to Copilot for a **specific project**, modify the `.vscode/mcp.json` file in the project's folder to add the following entry:
734 |
735 | **MacOS/Linux:**
736 |
737 | ```json
738 | {
739 | "servers": {
740 | "console-ninja": {
741 | "command": "npx",
742 | "args": ["-y", "-c", "node ~/.console-ninja/mcp/"]
743 | }
744 | }
745 | }
746 | ```
747 |
748 | **Windows**
749 |
750 | ```json
751 | {
752 | "servers": {
753 | "console-ninja": {
754 | "command": "npx",
755 | "args": ["/c", "node", "%USERPROFILE%/.console-ninja/mcp/"]
756 | }
757 | }
758 | }
759 | ```
760 |
761 | #### Cursor
762 |
763 | To add Console Ninja [MCP server to Cursor](https://docs.cursor.com/context/model-context-protocol#adding-an-mcp-server-to-cursor) for **all projects**, modify the `~/.cursor/mcp.json` file in your home directory to add the following entry:
764 |
765 | ```json
766 | {
767 | "mcpServers": {
768 | "console-ninja": {
769 | "command": "node",
770 | "args": ["~/.console-ninja/mcp/"]
771 | }
772 | }
773 | }
774 | ```
775 |
776 | To add Console Ninja MCP server to Cursor for a **specific project**, modify the `.cursor/mcp.json` file in the project to add the following entry:
777 |
778 | ```json
779 | {
780 | "mcpServers": {
781 | "console-ninja": {
782 | "command": "node",
783 | "args": ["~/.console-ninja/mcp/"]
784 | }
785 | }
786 | }
787 | ```
788 |
789 | ###### Troubleshooting Cursor MCP server
790 |
791 | If the Console Ninja MCP server isn’t working with Cursor, please do the following:
792 | 1. Open the `MCP Tools` section in `Cursor Settings` and check if the Console Ninja MCP server is listed and has a green icon next to it.
793 | 2. If the icon isn’t green, open the `Output` → `MCP Logs` output channel in Cursor’s bottom panel, clear the logs, toggle the MCP server, and check for any errors in the output.
794 |
795 | **Note**: If you’re using Cursor with WSL and the MCP server doesn’t start, you may need to set the full path to your WSL Node.js executable in the MCP server configuration, instead of just using `node` command.
796 |
797 | #### Claude Code
798 |
799 | To add Console Ninja MCP server to Claude Code, run the following command in the terminal:
800 |
801 | ```
802 | claude mcp add console-ninja -s project -- npx "-y" "-c" "node ~/.console-ninja/mcp"
803 | ```
804 |
805 | If after adding the MCP server as described above you are getting the `Connection failed: spawn node` error, then it's possible that Claude Code MCP client can not resolve your node version. In this case try replacing node with the full path to node executable in your system, for example:
806 |
807 | ```
808 | claude mcp add console-ninja -s project -- npx "-y" "-c" "/full/path/to/node ~/.console-ninja/mcp"
809 | ```
810 |
811 | #### Windsurf
812 |
813 | To add Console Ninja [MCP server to Windsurf](https://docs.codeium.com/windsurf/mcp#adding-a-new-server) run `Windsurf: MCP Configuration Panel` command from the command palette and click on the `Add custom server` button. Modify the
814 | opened file to add the following entry:
815 |
816 | **MacOS/Linux:**
817 |
818 | ```json
819 | {
820 | "mcpServers": {
821 | "console-ninja": {
822 | "command": "npx",
823 | "args": ["-y", "-c", "node ~/.console-ninja/mcp/"]
824 | }
825 | }
826 | }
827 | ```
828 |
829 | **Windows**
830 |
831 | ```json
832 | {
833 | "mcpServers": {
834 | "console-ninja": {
835 | "command": "cmd.exe",
836 | "args": ["/c", "node", "%USERPROFILE%/.console-ninja/mcp/"]
837 | }
838 | }
839 | }
840 | ```
841 |
842 | After saving the file, click on the MCP icon next to the chat input field and click on the `Refresh` button.
843 |
844 | #### Cline
845 |
846 | To add Console Ninja MCP server to Cline, open Cline view with the `Cline: Focus on View` command, click on the `MCP Servers` icon, switch to the `Installed` tab, and click on the `Configure MCP Servers` button. Modify the opened file to add the following entry:
847 |
848 | **MacOS/Linux:**
849 |
850 | ```json
851 | {
852 | "mcpServers": {
853 | "console-ninja": {
854 | "command": "npx",
855 | "args": ["-y", "-c", "node ~/.console-ninja/mcp/"]
856 | }
857 | }
858 | }
859 | ```
860 |
861 | **Windows**
862 |
863 | ```json
864 | {
865 | "mcpServers": {
866 | "console-ninja": {
867 | "command": "cmd.exe",
868 | "args": ["/c", "node", "%USERPROFILE%/.console-ninja/mcp/"]
869 | }
870 | }
871 | }
872 | ```
873 |
874 | #### Roo Code
875 |
876 | To add Console Ninja MCP server to Roo Code, open Roo Code view, click on the `MCP Servers` icon, and click on the `Edit MCP Settings` button. Modify the opened file to add the following entry:
877 |
878 | **MacOS/Linux:**
879 |
880 | ```json
881 | {
882 | "mcpServers": {
883 | "console-ninja": {
884 | "command": "npx",
885 | "args": ["-y", "-c", "node ~/.console-ninja/mcp/"]
886 | }
887 | }
888 | }
889 | ```
890 |
891 | **Windows**
892 |
893 | ```json
894 | {
895 | "mcpServers": {
896 | "console-ninja": {
897 | "command": "cmd.exe",
898 | "args": ["/c", "node", "%USERPROFILE%/.console-ninja/mcp/"]
899 | }
900 | }
901 | }
902 | ```
903 |
904 | #### Other MCP clients
905 |
906 | To add Console Ninja MCP server to an MCP client that [supports the MCP protocol tools](https://modelcontextprotocol.io/clients), you need to modify the MCP client configuration file to add the following entry:
907 |
908 | **MacOS/Linux:**
909 |
910 | ```json
911 | {
912 | "mcpServers": {
913 | "console-ninja": {
914 | "command": "npx",
915 | "args": ["-y", "-c", "node ~/.console-ninja/mcp/"]
916 | }
917 | }
918 | }
919 | ```
920 |
921 | **Windows**
922 |
923 | ```json
924 | {
925 | "mcpServers": {
926 | "console-ninja": {
927 | "command": "cmd.exe",
928 | "args": ["/c", "node", "%USERPROFILE%/.console-ninja/mcp/"]
929 | }
930 | }
931 | }
932 | ```
933 |
934 | ### Interactive Value Graphs
935 |
936 | The feature lets you visualize runtime data as structured graphs directly in your editor. It’s useful for inspecting deeply nested objects or large data sets that are hard to parse in raw text form. The graph layout adapts well to various data shapes, and you can interactively collapse or expand branches and nodes to focus on the parts that matter.
937 |
938 | 
939 |
940 | #### How to use
941 |
942 | When you run your code, any complex runtime value (such as an object or array) can be visualized as a graph. A small graph icon appears when you hover over the value in the editor or access it via the context menu in the Log Viewer. Click the icon to open the graph view.
943 |
944 | You can zoom in and out of the graph using the mouse wheel or panel icons. You can also pan the graph by clicking and dragging the graph area. Holding the `Ctrl` or `Command` key while using the mouse wheel will also scroll the graph.
945 |
946 | 
947 |
948 | Click the `Fit View` icon to automatically scale and center the entire graph to fit within the visible area. This is helpful after a lot of navigation or expansion, so you can quickly reorient yourself and see the overall shape of the data again.
949 |
950 | #### Nodes and Edges
951 |
952 | Each node of the displayed graph represents a value — an object or array. Properties of the object or elements of the array are displayed as a list inside the node. The name of the property or index of the array is displayed on the left, and the property value on the right. If the property value is an object or array with some properties, it will be represented as a child node in the graph connected by an edge.
953 |
954 | #### Interactivity
955 |
956 | The graph is interactive, allowing you to expand or collapse nodes to explore the structure of the value. You can collapse and expand values of properties by clicking on the property value.
957 |
958 | Each node has a context menu, available via the vertical ellipses icon in the top right corner of a node. The menu displays the full path to the property node and allows you to copy the property path or the property value to the clipboard.
959 |
--------------------------------------------------------------------------------